communication strategies of english-speaking learners...
TRANSCRIPT

DUBLIN CITY UNIVERSITY
SCHOOL OF APPLIED LANGUAGE AND INTERCULTURAL STUDIES
Communication Strategies of English-speaking
Learners of French on a Business Studies Course.
Brigid Delamere
B.A. H.Dip.Ed
Presented in fulfilment of the requirements for the award of Master of Arts
in Applied Languages under the supervision of Dr Bill Richardson
January 1998

I hereby certify that this material, which I now submit for assessment on the programme of study leading to the award of Master of Arts in Applied Languages is entirely my own work and has not been taken from the work of others save and to the extent that such work has been cited and acknowledged in my work
Signed ID No
Date

ACKNOW LEDGEMENTS
I would like to take this opportunity to express my sincere gratitude
to Dr Bill Richardson for his valuable advice, understanding and
encouragement dunng the preparation of this thesis I would also
like to thank Maureen Delamere for her advice on statistical
procedures

1 INTRODUCTION 3
1 1 O r ig in s o f t h e c o n c e p t o f C o m m u n ic a t io n S t r a t e g i e s 3
1 2 D e f in i t i o n s o f C o m m u n ic a t io n S i r a t e g i e s 5
1 3 E m p i r ic a l r e s e a r c h o n c o m m u n ic a t io n s t r a t e g i e s a n d a n o v e r v i e w o f t h e r e s u l t a n t
ta x o n o m ie s 7
13 1 Tarone Taxonomy 9
13 2 Faerch and Kasper Taxonomy jo
13 3 Blum and Levenston Taxonomy j 2
13 4 Corder Taxonomy ¡4
13 5 Biaiystok Taxonomy j 4
13 6 Haastrup and PhiUipson study o f achievement strategies 16
13 7 Chen Taxonomy ¡6
13 8 Nijmegen Taxonomy ¡8
13 9 Dornyei and Scott Taxonomy 23
t 4 N e e d f o r e x t e n s i o n o f t h e r e s e a r c h a r e a 25
1 5 T a x o n o m y o f C o m m u n ic a t io n S t r a t e g ie s u s e d in t h e p r e s e n t r e s e a r c h 26
2 METHODOLOGY 31
2 1 U s e o f E l i c i t a t i o n T a s k s 31
2 2 S u b je c t s 32
2 21 Programme o f study 33
2 3 D e s ig n o f r e s e a r c h p r o j e c t 3 4
2 3 1 Pilot study 35
2 3 2 Elicitation techniques 39
2 3 3 Statistical procedures 4 j
3 DATA ANALYSIS . . 4 3
3 1 T a s k 1 - S t o r y - r e t e l l i n g 4 4
3 1 1 Use o f Communication Strategies 45
3 12 Use o f Ll/L3-based strategies 49
3 12 1 U se o f Literal Translation 5 1
3 12 3 Use o f Foreignising 54
3 1 2 4 Relationship between literal translation and language switch 55
3 12 5 Relationship between literal translation, language and foreignising 58
3 13 Use o f L2-based strategies 58
3 13 1 Use o f Paraphrase 62
3 13 2 Use of Approximation 62
3 13 3 Use o f W ord-Coinage 63
3 13 4 Use of Restructuring 63
3 13 5 Relationship between approximation, word-coinage and restructuring 65
3 14 Use o f Message-Adjustment strategies 67
3 1 4 1 Use o f Topic Avoidance 70
3 1 4 2 Use o f Message Abandonment 71
3 1 4 3 Use of Message Reduction 72
3 1 4 4 Relationship between topic avoidance and message reduction 74
3 1 4 5 Relationship between topic avoidance, message abandonment and message reduction 76
3 2 T a s k 2 P ho to D e s c r ip t io n 77
3 2 1 Use o f Communication Strategies 78
3 2 2 Use o f Ll/L3-based strategies 80
3 2 2 1 Use o f Literal Translation 84
3 2 2 2 Use o f Language Switch 86
3 2 2 3 Use of Foreignising 86
3 2 2 4 Relationship between literal translation and language switch 88
3 2 2 5 Relationship between literal translation, language switch and foreignising 90
3 2 3 Use o f L2-based strategies 91
3 2 3 1 Use o f Paraphrase 95
3 2 3 2 Use of Approximation 95
3 2 3 3 Use o f W ord-Coinage 96
3 2 3 4 Use o f Restructuring 97
3 2 3 5 Relationship between approximation, word-coinage and restructuring 99
3 2 4 Use o f Message-Adjustment strategies 100
3 2 4 1 Use o f Topic Avoidance 103
3 12 2 Use o f Language Switch 53
3 2 4 2 Use o f Message Abandonment 104

3 2 4 4 Relationship between message reduction and topic avoidance IOC
3 2 4 5 Relationship between topic avoidance message abandonment and message reduction 108
3 3 T a s k 3 F r e e E x p r e ss io n 109
3 3 1 Use o f Communication Strategies HO
3 3 2 Use o f LI /L3-based strategies 114
3 3 2 1 Use o f Literal Translation 116
3 3 2 2 Use o f Language Switch 1 \ 7
3 3 2 3 Use o f Foreignising 118
3 3 2 4 Relationship between literal translation and language switch 120
3 3 2 5 Relationship between literal translation, language switch and foreignising 123
3 3 3 Use o f L2-based strategies 124
3 3 3 1 Use o f Paraphrase 127
3 3 3 2 Use o f Approximation 128
3 3 3 3 Use o f Word-Coinage 128
3 3 3 4 Use o f Restructuring 129
3 3 3 5 Relationship between approximation, word-coinage and restructuring 131
3 3 4 Use o f Message-Adjustment strategies 132
3 3 4 1 Use o f Topic Avoidance 136
3 3 4 2 Use o f Message Abandonment 136
3 3 4 3 Use o f Message Reduction 137
3 3 4 4 Relationship between message reduction and topic avoidance 138
3 3 4 5 Relationship between message abandonment, message reduction and topic avoidance 140
3 4 PATTERNS OF STRATEGY USE ACCORDING TO TASK 141
3 4 1 Use o f Ll/L3-based strategies 144
3 4 11 Use o f Literal Translation 146
3 4 12 Use o f Language Switch 147
3 4 13 Use o f Foreignising 148
3 4 2 Use o f L2-based strategies 149
3 4 2 1 Use o f Paraphrase 152
3 4 2 2 Use o f Approximation 152
3 2 4 3 Use o f Message Reduction 104
3 4 2 3 Use o f W ord-Coinage 153

3 4 3 Use o f Message-Adjustment strategies 155
3 4 3 1 Use o f Topic Avoidance 157
3 4 3 2 Use o f Message Abandonment 158
3 4 3 3 Use o f Message Reduction 159
4 DISCUSSION OF RESULTS 160
4 1 U SE OF L2-BASED STRATEGIES ACCORDING TO PROFICIENCY LEVEL 161
4 11 Use o f specific L2-based strategies 162
4 1 1 1 Paraphrase 162
4 1 1 2 Approximation 163
4 1 1 3 Word-coinage 163
4 1 1 4 Restructuring 163
4 2 USE OF L1/L3-BASED STRATEGIES 164
4 2 1 Use o f Specific Ll/L3-based strategies 165
4 2 11 Literal Translation 165
4 2 1 2 Language switch 166
4 2 1 3 Foreignising 166
4 2 2 Use o f LI Strategy Markers 166
4 2 3 Specific linguistic problems due to L1/L3 influence 167
4 3 E f f e c t s o f p r o l o n g e d ex po su r e t o t h e L2 167
4 4 T y p o l o g ic a l d if f e r e n c e b e t w e e n t h e L I a n d t h e L2 168
4 5 In f l u e n c e o f t h e l 1/L3 o n L2 c o m m u n ic a t io n 169
4 6 U s e o f M e s s a g e -A d ju st m e n t s t r a t e g ie s 170
4 6 1 Use o f individual Message-Adjustment strategies 171
4 6 11 Topic Avoidance 171
4 6 1 2 Message Abandonment 172
4 6 13 Message Reduction 172
4 7 R e l a t io n s h ip o f t a s k t o st r a t e g y u s e 173
4 8 P e d a g o g ic a l im p l ic a t io n s 175
4 8 1 Development o f strategic competence 175
4 8 2 Contribution o fL l/L 3 knowledge to L2 communication 179
3 4 2 4 Use o f Restructuring 154

5 CONCLUSION 181
BIBLIOGRAPHY 187
APPENDICES

Communication Strategies of English-speaking learners of French on a
Business Studies course
Bngid Delamere
ABSTRACT
Communication strategies are defined as devices employed by learners of a second language (L2) when confronted with difficulties of communication in the target language This study focuses on the communication strategies used by English-speaking students who are learning French as part of a Business Studies course in a third-level college in Ireland The subjects are divided into two groups according to proficiency level and they are provided with three oral elicitation tasks which they perform in their LI and L2 The data obtained are statistically analysed The effects of task and proficiency level on strategy use are investigated The influence of the LI on L2 communicative performance and the pedagogical implications of communication strategy use are also examined The findings of the study indicate that strategy use does not vary significantly according to proficiency The more advanced learners do not use L2-based strategies to a greater extent than the less advanced learners and both groups remain entrenched in L1/L3-based behaviour The study also establishes that different tasks elicit different patterns of strategy use In the performance of two of the tasks (Tasks 1 and 3), both groups use approximately the same number of communication strategies while m Task 2, the more-advanced learners use more communication strategies than their less advanced counterparts The type of strategy used also vanes according to task The current debate in relation to strategic competence is also discussed when considering the pedagogical implications of the findings of the study
1

ABBREVIATIONS
LI First Language
L2 Second Language
L3 Other Non-Target Language (Third Language)
NL Native Language
SL Second Language
TL Target Language
CSs Communication Strategies
LTA Literal Translation
LS Language Switch
FRN Foreigmsing
PARPH Paraphrase
APP Approximation
WC Word-Coinage
RS Restructuring
TA Topic Avoidance
MA Message Abandonment
MR Message Reduction
SLA Second Language Acquisiton
2

1. Introduction
The notion of strategies of communication was first introduced into Second
Language Acquisition research in the early 1970s and has remained a focus of
interest for researchers ever since When learners are faced with linguistic
difficulties in the L2, they resort to certain strategies in order to avoid
breakdown m communication and to compensate for the deficiencies in their L2
linguistic resources However, there is no one definition of communication
strategies which has been accepted and, consequently, many different taxonomies of
communication strategies have been proposed In this section, it is intended to
outline the research to date on communication strategies focussing particularly
on the definitions provided by the researchers and the subsequent taxonomies
which they have developed Domyei and Lee Scott (1997 175) consider “the
questions of definition and taxonomy as central to any further development in CS
research”
1.1 Origins of the concept of Communication Strategies
Selinker (1972) was responsible for the introduction of two new terms into the
field of Second Language Acquisition research - ‘mterlanguage’ and ‘strategies
of communication’
"Interlanguage" is the term which became widely accepted for the Second
Language (L2) learner's language system A learner, at a particular point in time,
is using a language system which is neither the LI nor the L2 There is a third
3

language involved - that of the learner The "language” part of the term "interianguage"
indicates that it is an independent language system while the "inter" part suggests
that the learner is at an intermediate stage in target language acquisition The
learner "has a language" which continuously develops towards the target
language Interlanguage changes and develops as the language learner becomes
increasingly proficient in the L2
Other researchers have coined different terms for this concept Nemser (1971)
speaks of "approximative systems" James (1980) offers "interlingua" while
Corder (1981) refers to the learners "transitional competence” and an "idiosyncratic
dialect” Nemser (1971 116) states that "learner speech at a given time is the
patterned product of a linguistic system La (approximative language) distinct
from Ls (source language) and Lt (target language) and internally structured"
The approximative system gradually approaches the TL According to Selinker
(1992), the difference between mterianguage and Nemser’s approximative system is that
interianguage does not necessarily converge on the target language
At one stage interianguage was effectively the name for the whole field o f L2
research, as witness the 1970's journal Interianguage Studies Bulletin which
became Second Language Research in the 1980's The term "interianguage"
entered common research parlance partly because it appeared to be a neutral
term given that the other terms connote a TL-centred perspective
Selinker (1972 229) suggests that “strategies of second language communication”
are one of the mam processes responsible for the development of this mterianguage but
does not provide specific details on the characteristics of those strategies
4

1 2 Definitions of Communication Strategies
Several different yet significant definitions of communication strategies have
been proposed at various points in time since they were first identified
Tarone, Cohen and Dumas (1976 76) define communication strategy as "a systematic
attempt by the learner to express or decode meaning in the target language, m
situations where the appropriate systematic target rules have not been formed"
Blum and Levenston (1978 402) define the term "strategy" in more narrow
terms They state that strategies refer to ways in which learners arrive at
particular uses at particular points in time They are an ad hoc response to the
need to communicate m a specific situation
Palmberg (1978 1) refers to “those systematic devices a second-language learner
uses in attempting to express precise meaning in the TL”
Tarone (1980 420) broadens the definition by suggesting that the term
"communication strategy” relates to "mutual attempts of two interlocutors to
agree on a meaning in situations where requisite meaning structures do not seem
to be shared" She views communication strategies from an interactional
perspective They are attempts by the L2 learner to bridge the gap between
his/her knowledge of the TL and the TL knowledge of the interlocutor
Corder (1981 103) provides what he calls a "working definition of communication
strategies" saying that they are "a systematic technique employed by a speaker to
express his meaning when faced with some difficulty" Furthermore, he argues
that "strategies of communication are essentially to do with the relationship
between ends and means" Communication strategies are employed by L2
5

learners when faced with problems in communicating in the TL, these problems
being a result of the incapacity to achieve their communicative ends with the
communicative means at their disposal, at a given point in the process of TL
acquisition
Faerch and Kasper (1983a 36) define communication strategies as "potentially
conscious plans for solving what to an individual presents itself as a problem in
reaching a particular communicative goal" They adopt a psychological
approach, viewing communication strategies as the L2 learner’s individual mental
response to a communication problem rather than as a joint response by the
learner and interlocutor
Refemng to the Tarone (1980) and the Faerch and Kasper (1983a) definitions in
particular, Cook (1993 120) states that "the aim of both camps is to list the
possible strategies available to the L2 learner, the methodology is mostly to
comb through transcripts of learners' language for specimens of strategies"
Ellis (1986 182) refers to strategies of communication as "psycholinguistic plans
which exist as part o f the language user's communicative competence They are
potentially conscious and serve as substitutes for production plans which the
learner is unable to implement"
Poulisse (1987 141) talks about the deficient FL (foreign language) store of the
learner which causes communication problems She defines communication
strategies quite simply as "the strategies which they employ to solve these
linguistic problems"

Bialystok (1990 35) suggests that "communication strategies overcome obstacles to
communication by providing the speaker with an alternative form of expression
for the intended meaning'’
Sharwood Smith (1994 12) suggests that the word "strategy" invokes the general idea
of business executives planning their next move and similarly, learners “adopt
strategies to cope with the business of handling non-native languages”
Domyei (1995 60) refers to communication strategies as a “wide range of
communication-enhancing devices”
Taking into account the aforementioned definitions, one can conclude that
communication strategies are the tools employed by a learner to overcome linguistic
deficiencies m the L2 and serve to maintain communication
1.3 Empirical research on communication strategies and an overview of the
resultant taxonomies
Ellis (1986 183) states that "theoretical discussion of communication strategies
has predominated over empirical research into their use This is a reflection of
the uncertainties of their definition and the consequent problems of
identification"
Varadi (1973) was the first to carry out empirical research on strategies of
communication He focused on the strategies which the learner uses when he
experiences a "hiatus" in his IL (interlanguage) repertoire He has to adjust his
message to the communicative resources at his disposal He either replaces the
meaning or form of his intended message by using items from his IL or reduces
7

his intended message Varadi carried out a pilot study involving two groups of
nine and ten adult Hungarian learners of English at an intermediate level The
experiment consisted of a comparison of learners’ performance on story-telling
tasks in their native language and in the target language
Tarone (1977) conducted a similar experiment in which nine subjects were asked
to descnbe two simple drawings and a complex illustration in both their native
language and English (the L2) The approaches of different learners to the
solution of specific communication problems were compared Tarone provided
one of the earliest taxonomies in which strategies of communication were
assembled in an organised manner Since then, the majority o f the descriptions of
communication strategies are presented as taxonomies, which can be described
as the systematic organising structures for a range of events withm a domain
According to Bialystok (1990 39), "this methodology was an important contnbution to
the field and modifications of it have provided the basis for most of the research
subsequently conducted in this area” She states that “it is easy to decide that
speakers engage in a variety of strategies in order to communicate It is not easy
to identify when strategies have been used, what the strategies are and why it is
that they work (or don't work)" (Bialystok 1990 14)
Cook (1993 133) states that "the basic aim of the strategies paradigm is
taxonomic description and classification Strategies researchers compile an
inventory of the possible strategies that L2 learners may use"
8
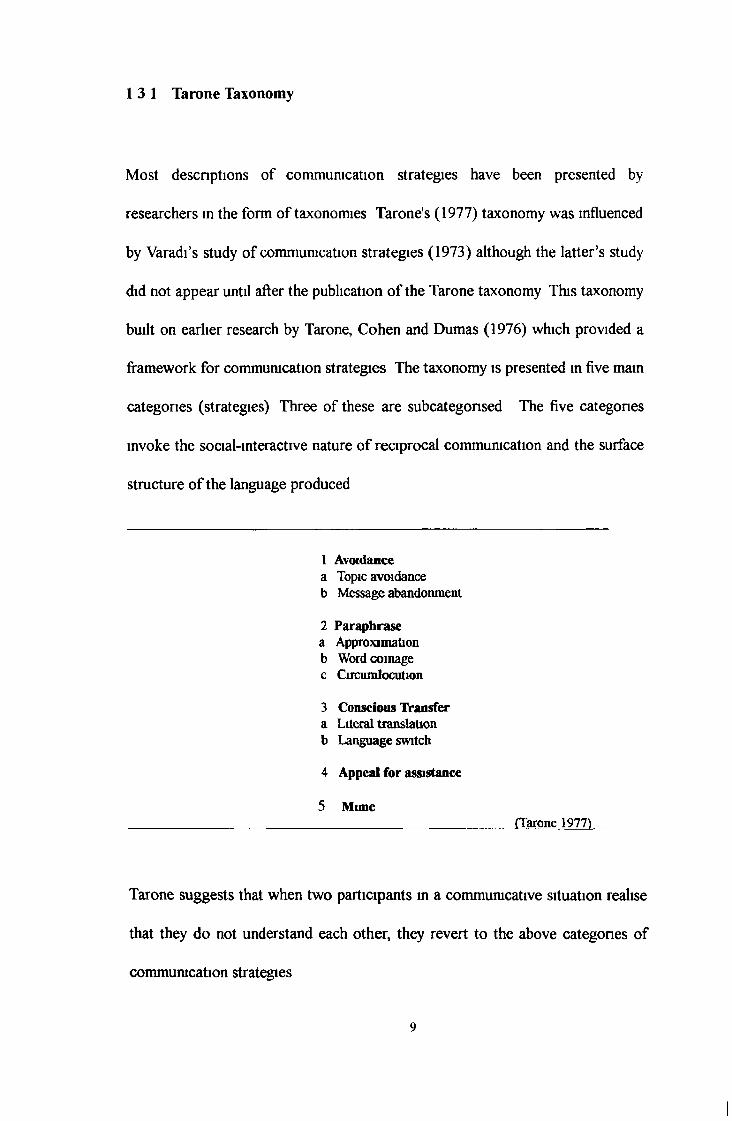
13 1 Tarone Taxonomy
Most descnptions of communication strategies have been presented by
researchers m the form of taxonomies Tarone's (1977) taxonomy was influenced
by Varadi’s study of communication strategies (1973) although the latter’s study
did not appear until after the publication of the Tarone taxonomy This taxonomy
built on earlier research by Tarone, Cohen and Dumas (1976) which provided a
framework for communication strategies The taxonomy is presented in five main
categories (strategies) Three of these are subcategonsed The five categones
invoke the social-interactive nature of reciprocal communication and the surface
structure of the language produced
1 Avoidancea Topic avoidanceb Message abandonment
2 Paraphrasea Approximationb Word coinagec Circumlocution
3 Conscious Transfera Literal translationb Language switch
4 Appeal for assistance
5 Mime(Tarone 1977)
Tarone suggests that when two participants m a communicative situation realise
that they do not understand each other, they revert to the above categones of
communication strategies

Varadi, who initiated the empirical study of communication strategies, presented his
own taxonomy (1980) which was more restricted than Tar one’s He put forward
the notion that communication involves vanous types of message adjustment
Learners either reduce their intended meaning or replace the meaning by
paraphrasing or circumlocution All Varadi's strategies belong to the category of
paraphrase m Tarone's taxonomy
1.3.2 Faerch and Kasper Taxonomy
Faerch and Kasper (1983a) categorise strategies of communication in terms of
reduction strategies and achievement strategies - the learner's attempt to
avoid the problem being a reduction strategy and his attempt to achieve a
solution being an achievement strategy
Reduction strategies can be divided further into two categories a) formal
reduction (reduce system - parts of the linguistic system are avoided) and
b) functional reduction (reduce intended meaning) Achievement strategies are
divided into a) compensatory strategies and b) retrieval strategies
10

A Reduction Strategies 1 formal reduction strategiesavoidance of L2 rules of which the learner is not certain or which cannot be accessed
2 functional reduction strategiesavoidance of certain speech acts, avoidance or abandoning
certain topicsB Achievement Strategies 1 compensatory strategies
3)non-cooperative strategiesI) L1/L3 based
-code-switching-mter/intra-hngualtransfer-interlingual transfer
I I) IL- based-substitution-paraphrase- word-coinage- restructuring
m) Non-hnguistice g mime/gesture
b)cooperative strategies- direct appeal- indirect appeal
2 Retrieval strategiesa waitingb using semantic field c using other languages
___________________________________________________(Faerch&Kasper 1983)
There is much similarity between the two taxonomies set up by Tarone (1977)
and by Faerch and Kasper (1983a) Both provide general categories for
avoidance and cooperative strategies, both refer to word-comage and code
switching According to Cook (1993 124), “Faerch and Kasper have a finer set
of non-cooperative strategies It is not obvious that either of them lives up to
their respective goals of seeing strategies as mutual interaction or as individual
problem-solving respectively”
Cook (1996 90) further comments on the two taxonomies “To some extent
Tarone’s social communicative strategies and Faerch and Kasper’s psychological
strategies are complementary ways of coping with the problems of
communication in a second language” In Faerch and Kasper’s terms, all
Tarone’s categories, with the exception of avoidance, are achievement strategies
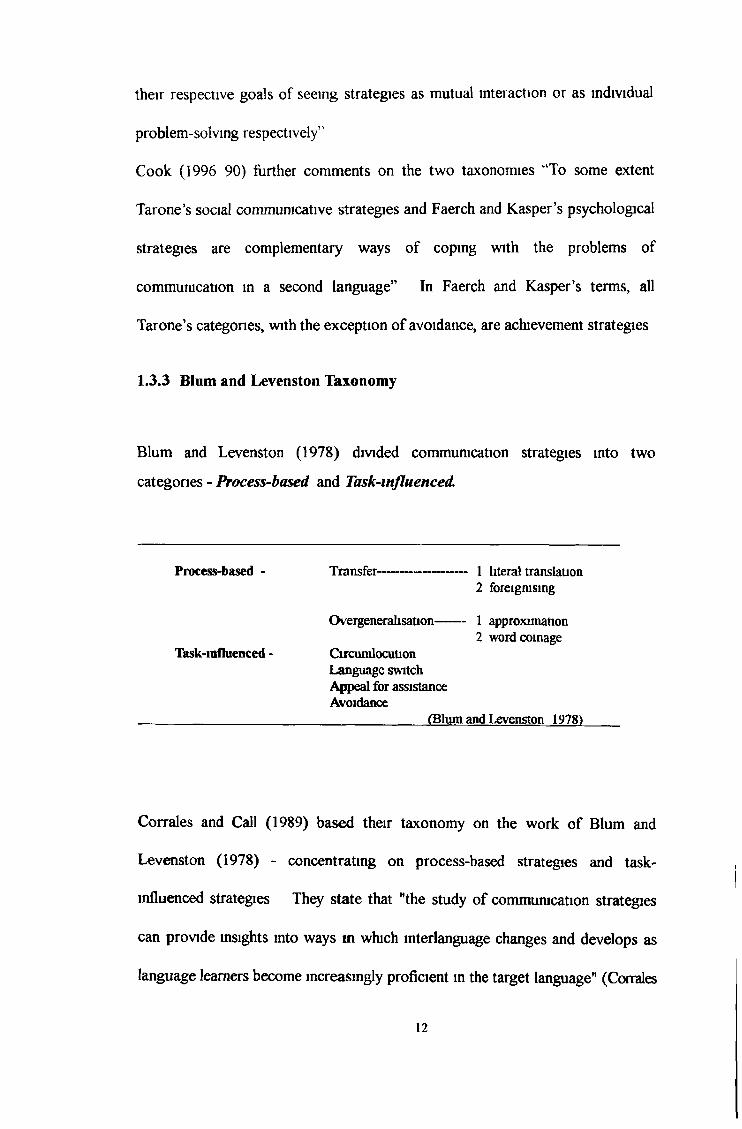
1.3.3 Blum and Levenston Taxonomy
Blum and Levenston (1978) divided communication strategies into
categories - Process-based and Task-influenced
Process-based - Transfer-------------------- 1 literal translation2 foreigmsing
Overgeneralisation-------1 approximation2 word coinage
Task-influenced - CircumlocutionLanguage switchAppeal for assistanceAvoidance
(Blum and Levenston 1978)
Corrales and Call (1989) based their taxonomy on the work of Blum and
Levenston (1978) - concentrating on process-based strategies and task-
influenced strategies They state that ’’the study of communication strategies
can provide insights into ways in which mterlanguage changes and develops as
language learners become increasingly proficient m the target language" (Connies
12

& Call 1989 227) They concentrated on three types of communication strategies -
transfer, overgeneralisation and task-influenced The study focused on the
variation in the use of communication strategies to express lexical meaning as a
function o f the learners’ proficiency in the L2 at two time intervals (at the
beginning o f term and five weeks later) and as a function of the type of
communication required
The subjects comprised two groups of Spanish speakers learning English as their L2 at
intermediate and advanced levels Two tasks were designed to elicit the required
data (1 Structured questions 2 Simulated real-life communicative situation) The
results indicated that there was no significant difference between the intermediate
group and the advanced group in their use of transfer and overgeneralisation
strategies but the intermediate group used more task-influenced strategies at
Time 2 than at Time 1 The reverse proved to be true for the advanced group
The researchers suggest that strategy use may peak and then decline as learners
become more proficient m the L2
In relation to the influence of task on strategy use, it was found that a higher
proportion o f transfer strategies were elicited by the simulated conversation task
but the researchers point out that the technical nature of the target items in this
task may have caused the subjects to rely more on their LI resources in order to
communicate There was no significant evidence to support the hypothesis that
strategy use would change as the proficiency of the learners increased over time
13

1 3.4 Corder Taxonomy
Corder (1978) refers to message adjustment strategies and resource expansion
strategies
Message adjustment strategies encompass topic avoidance, message
abandonment, semantic avoidance and message reduction
Resource expansion strategies include borrowing, switching to another
language, and paraphrase/circumlocution
Corder maintains that message adjustment strategies are essentially nsk-
avoidance - the learner adjusts his ends to the means he has at his disposal On
the other hand, resource expansion strategies are "success-oriented” through
risk-taking The learner increases his resources in order to achieve his
communicative intentions
1.3.5 Bialystok Taxonomy
Bialystok (1983 103) investigated "who uses which strategy when and with what
effect" She focused on the strategies used when learners are faced with a lack
of vocabulary A subject was asked to descnbe a picture so that a native speaker
of the L2 (French) could accurately reconstruct it The learner's LI was English
Strategies used were characterised as LI-based, L2-based or non-linguistic It
was found that L2-based strategies were the most effective in ensuring successful
communication m the L2
14

Ll-BASED STRATEGIESLanguage SwitchForeigiusmgTranslitération
L2-BASED STRATEGIESSemantic contiguity Description Word coinage
NON-LINGUISTIC STRATEGIES
__________________________________________________ (Bialystok 1983)_______
Bialystok (1990) provided a further mtepretation of communication strategies
based on her cognitive theory of language processing This new taxonomy was
divided into two mam classes
1 Analysis-based strategies
2 Control-based strategies
She describes ‘analysis-based strategies’ as attempts to “to convey the structure
of the intended concept by making explicit the relational defining features” (Bialystok,
1990 133) The speaker provides some distinctive information about the intended
concept
‘Control-based strategies’ involve “choosing a representational system that is
possible to convey and that makes explicit information relevant to the identity o f
the intended concept” (Bialystok, 1990 134) The means of reference is
manipulated to convey the required concept
15

1 3.6 Haastrup and Philhpson study of achievement strategies
Haastrup and Philhpson (1983) concentrated specifically on achievement
strategies - defined as attempts by the learner to solve problems in
communication by expanding his communicative resources instead of reducing
his communicative goal The study involved native Danish learners of English
The subjects were asked to converse with native speakers of the L2 about
various topics relatingto their everyday life The conversations were video
taped The findings confirm those of Bialystok (1983) - that LI-based strategies
are less effective and that L2-based strategies are more likely to lead to
understanding They single out paraphrase as the most successful strategy
employed
1.3.7 Chen Taxonomy
Chen (1990) conducted a study of the communication strategies in interlanguage
production by Chinese learners of English This study indicates that "one can
develop learners' communicative competence by building up their strategic
competence, that is, their ability to use communicative strategies that allow them
to cope with various communicative problems that they might encounter" (Chen,
1990 156) The study challenged one o f the hypotheses put forward by
Bialystok and Frohlich (1980), 1 e that high-proficiency learners prefer L2-based
strategies and low-proficiency learners prefer LI-based strategies
16

The communication strategies employed by the subjects in the Chen study were
classified as follows
1 Linguistic-based2 Knowledge-based3 Repetition4 Parahnguistic5 Avoidance
Chen states that this taxonomy is not intended to be a final classification of all
communication strategies They are simply those elicited from the Chinese EFL
learners in the study who were required to perform a particular communication
task in a specific situation
The Bialystok/Frohlich hypothesis was refuted because no obvious LI-based
communication strategies were elicited in this particular study Chen states that
this can be explained by the fact that there is a very significant language distance
between the LI (Chinese) and the L2 (English) "This great distance reduces
Chinese learners' tendency to use Ll-based CSs because they realise that these
strategies will not work for them" (Chen 1990 177 )
The results of the study suggested that the frequency o f communication
strategies used by the subjects in their TL communication varied according to
their proficiency level Linguistic-based strategies were more frequently used by
the more advanced learners while knowledge-based and repetition strategies
were more widely employed by the low-proficiency learners
Chen concludes by remarking that "most Chinese EFL learners manage to
convey their meanings and reach their communicative goals by using CSs, in
spite of their limited knowledge of the target language" (Chen, 1990 185) The
17

study "finds a positive relationship between the learners' target language
proficiency and their strategic competence" (p 185) Chen suggests that language
learners' communicative competence could be developed by increasing their
strategic competence
1.3.8 Nijmegen Taxonomy
One of the most extensive and most comprehensive studies to date has been the
Nijmegen project, conducted at the University of Nijmegen by Bongaerts,
Kellerman and Poulisse The communication strategies employed by Dutch
learners of English were the focus of interest The project was written up at
several stages of development but the most extensive description of it is provided
by Pouhsse (1989, 1990) The researchers put forward the argument that "the
study of communication strategies should reach beyond description to prediction
and explanation" (Kellerman et al,1990 164) They limited their area of
investigation to the compensatory strategies used by the learner to cope with
vocabulary difficulties encountered when expressing himself m the L2 The term
"communication strategy" is therefore limited to lexical "compensatory strategy”
In its methodology, the Nijmegen research differs from other similar projects in
the following ways
1 many of the studies use native language control data,
2 performance on a number of tasks is tested, thus strengthening the
interpretation of the evidence,
18

3 the classification of the utterances are based on a description of the processes
underlying their production
The researchers claim that previous studies put too much emphasis on the
linguistic form that results from a strategy instead of concentrating on the
process that leads up to it The Nijmegen group regards communication
strategies as primarily mental events and its analysis, like that of Bialystok
(1990), is founded on a cognitive-psychological approach
Since the Poulisse study provides a very comprehensive description of the
Nijmegen research project, its principal findings are summarised here One of
the main contributions of this study is the formulation of a simple taxonomy of
communication strategies which the researchers claim indicates the mental
processes involved in the production of these strategies
The taxonomy is based on two main strategies which the researchers refer to as
archistrategies
1 conceptual - the learner decides to compensate for a missing word by
exploiting conceptual knowledge
2 linguistic - the learner attempts to compensate for a missing word through
linguistic knowledge
19

These archistrategies are further broken down as the following table shows
Archistrategies Communication Strategies
Conceptual 1 Analytic (circumlocution, description, paraphrase)2 Holistic (the use of a superordinate, coordinate or subordinate term)
Linguistic 3 Transfer (borrowing, foreigmsing, and literal translation)
4 Morphological creativity
The analytic strategy (no 1) represents "a conceptual analysis of the originally
intended concept" Poulisse (1990 80) e g "talk bird" for "parrot" This is the
equivalent of the strategies o f circumlocution and description indicated m other
taxonomies
The holistic strategy (no 2) is "the selection of a different concept which is
sufficiently similar to the original one to convey the speaker's intended meaning"
e g "chair" for "stool", "animal" for "dog" This approach is reminiscent of
Tarone's approximation
The strategy of transfer (no 3) indicates transfer from the LI
Morphological creativity (no 4) means that the learner creates a new word by
applying his/her knowledge o f L2 morphological rules to an existing L2 word
20

Kellerman (1991) reconsidered the interpretation of the linguistic strategy He
claims that the native speaker also employs this strategy when using words from
another language to render effect to his language Therefore, describing the
strategy in terms of reliance on the LI is too restrictive He also makes a
distinction between types of non-verbal behaviour, saying that they should not be
simply assigned to the category of mime "Ostensive definition" (pointing at an
object) is the non-verbal equivalent of a linguistic strategy "Mimetic
gesture"(mime/modelling of some features) of the required target word is a
conceptual strategy Kellerman thus suggested that the linguistic strategy be
renamed as the code strategy
EUis(1994 125) states "Cleariy the Nijmegen taxonomy is a great improvement on the
earlier taxonomies in that it locates the descriptions of CSs within a
parsimonious cognitive framework"
The Poulisse study aimed to investigate the compensatory strategies employed in
the LI and L2 by 45 Dutch learners of English at three levels of acquisition
which she categorised as follows advanced, intermediate and low The efficiency
of the strategies used was also investigated Subjects were presented with four
tasks
1 Photo description
2 Description of drawings in LI and L2
3 Retelling stones (listened to story in
LI and retold m L2 with the help of
picture prompts)
4 Interview

Tasks 3 and 4 were video-recorded and played back to the subjects so that they
could provide retrospective comments which were in turn audio-taped and
transcribed
The strategies observed were classified as either conceptual or linguistic in
accordance with the taxonomy employed Communication strategies were
defined as the "strategies which a learner employs in order to achieve his
intended meaning on becoming aware of problems during the planning phase of
an utterance due to (his own) linguistic shortcomings" (Poulisse 1990 88)
Identification of the strategies in Tasks 1 and 2 proved to be straightforward
Tasks 3 and 4 caused more difficulty so two independent judges also identified
the strategies The retrospective comments o f the subjects were also referred to
The analysis just included the "clear cases" The effects of proficiency and tasks
on the subjects' use of communication strategies were investigated
The mam findings were as follows
1 The less proficient learner used more communication strategies than the more
proficient
2 There was slight evidence that more proficient learners employed more
holistic strategies involving superordmates
3 The nature o f the task had a distinctive effect on the selection of a strategy In
Task 1, subjects preferred analytic strategies In Tasks 3 and 4, they preferred
short holistic strategies and transfer strategies
Poulisse believes that, if communication in the L2 breaks down due to lack of
appropriate forms in the mental lexicon, the learner compensates by returning to
the conceptual stage or by trying out an alternative linguistic formulation
22

The results of the Nijmegen project also suggest that compensatory strategies
are not specific to second language use L2 learners use more compensatory
strategies rather than different ones
On the contrary, Bialystok (1990 81) refers to the "uniqueness fallacy" relating
to strategies of communication This is the view that the communication
strategies employed by L2 learners are a distinctive second-language
phenomenon
13 9 Dornyei and Scott Taxonomy
Domyei and Scott (1995) provided an extended taxonomy of communication
strategies, classifying them according to the manner o f problem-management 1 e
how communication strategies contnbute to resolving conflicts and lead to mutual
understanding They refer to three principal categones 1 direct strategies, 2
interactional strategies and 3 indirect strategies These three broad areas are
defined in the following terms
“Direct strategies provide an alternative, manageable and self-contained
means of getting the (sometimes modified) meaning across
Indirect strategies, on the other hand are not strictly problem-solving devices
do not provide alternative meaning structures preventing breakdowns
and keeping the commuiucationchannel open
Interactional strategies involve a third approach, whereby participants cany
out trouble-shooting exchanges cooperatively ”
(Domyei and Scott 1997 198)
23

Each o f these three areas is then subcategonsed in the following taxonomy
1 DIRECT STRATEGIES Resource deficit-related strategies• Message abandonment• Message reduction• Message replacement• Circumlocution• Approximation• Use of all-purpose words• Word-comage• Restructuring• Literal translation• Foreigmsmg• Code switchingOwn-performance problem-related strategies• Self-rephrasing• Self-repairOther-performance problem-related strategies• Other-repair
2 INTERACTIONAL STRATEGIES Resource deficit-related strategies• Appeals for helpOwn-performance problem-related strategies• Comprehension check• Own-accuracy check Other-performance problem-related strategies• Asking for repetition• Asking for clarification• Asking for confirmation• Guessing• Expressing nonunderstanding• Interpretive summary• Responses
3 INDIRECT STRATEGIESProcessing time pressure-related strategies• Use of fillers• RepetitionsOwn-performance problem-related strategies• Verbal strategy markers Other-performance problem-related strategies• Feigning understanding
______________________ (Pomvei and Scott 1995)
24
>

The Domyei and Scott taxonomy included many of the strategies which featured
in previous taxonomical descriptions Most traditionally identified communication
strategies belong to the category of direct strategies However, Domyei and
Scott were the first researchers to identify the following three strategies
1 Use of similar sounding-words - when a speaker is unsure of a lexicalitem in the L2, he/she uses a word (existing or non-existing) which sounds like the L2 item
2 Mumbling - when the speaker swallows or muttersa word (or part of a word) because he /she is uncertain about the correct form
3 Omission - Speaker leaves a gap when a word is notknown and carnes on as if it had been said
Furthermore, the communication maintenance strategies such as use of fillers
and repetition are not included in most taxonomies However, Faerch and Kasper
(1983b) state that fillers and hesitation devices are not communication strategies
They also point out that “ the exact functions of the vanous types of pauses are
still far from being well-documented” (Faerch and Kasper 1983b 215)
1.4 Need for extension of the research area
It can be inferred from the existent literature that there is no single definition of
communication strategies which is universally approved by all researchers and
several taxonomies have been used and each of them significantly contnbutes to
our understanding of this phenomenon Communication strategies are clearly a
25

very important aspect of second language acquisition given that language
difficulties are a prominent aspect of L2 communication and the abundance of
research in this area is testimony to this importance
Domyei and Scott (1997 203) sum up the reasons why the investigation of
communication strategies is an important source of acumen for researchers
“Firstly, it is a truly ‘applied’ area The practical implications of understanding problem
-management in L2 communication are enormous After all, L2 speakers spend a lot of
time and effort struggling with language difficulties, yet L2 courses do not generally
prepare students to cope with perfomance problems Second, by relating mterlanguage
analysis to psychohnguistic investigations of speech production, the study of CSs
help refine scientific models of L2 learning and use”
This study aims to extend the research on communication strategies by
investigating the mterlanguage performance of native English-speaking learners
of L2 French in an Irish third-level institution The research area reviewed
requires extension to a specific context wherein the learners are studying the L2
as a peripheral subject on their Business Studies programme and therefore are
not true language students
1.5 Taxonomy of Communication Strategies used m the present research
Based on a synthesis of the taxonomies employed by the researchers referred to in the
preceding literature review, the following taxonomy is proposed for this particular
study
26

A. L1/L3-BASED STRATEGIES
Literal Translation
Language switch
Foreigmsmg
B L2 - BASED STRATEGIES
Paraphrase
Approximation
Word-coinage
Restructuring
€ MESSAGE ADJUSTMENT STRATEGIES
Topic avoidance
Message abandonment
Message reduction
The above categories and sub-categories can be exemplified as follows
A. L1/L3 - BASED STRATEGIES
Literal translation - word for word translation o f an L1/L3 form
e g "maison travail” (homework) " Je prends le" (I take i t )
Language switch - using a form in LI/L3
e g Je suis "tired"
Foreigmsmg - using an L1/L3 form but adapts it to make it appear like an L2 form
e g "accountabilite" (from English "accountancy)

Paraphrase - replacing an L2 item by describing or exemplifying it e g Elle a
donne du pain aux " ils volent et ils ont des ailes” ,
bouilloire —> "la chose pour faire cuire de l'eau1'
vêtements — > chemises et jupes
Approximation - finding a word in the L2 with as close a meaning as possible e g
cheval — > animal, âne — > cheval
Word-coinage - replacing an L2 item with an item made up from L2 forms e g
piscine —> endroit de natation , "heurot " —>"watch"
Restructuring - developing an alternative constituent plan
e g ils ont deux —> ils ont un garçon et une fille
C. MESSAGE ADJUSTMENT STRATEGIES
Topic avoidance - not saying what was originally in mind
Message abandonment - giving up speaking in mid-stream
Message reduction - saying less than or less precisely what was intended It is often
perceived to be vague general talk
STRATEGY MARKERS
Identifying the moment at which strategies of communication are being employed by
learners can often present problems Strategy markers or "signals of uncertainty" can
indicate that the learner is having a linguistic difficulty and is trying to find a way to
complete the intended message Strategy markers are evident in both LI and L2
communication Ridley (1991) refers to these signals as "performance features"
Typical strategy markers include the following
B L2 - BASED STRATEGIES
2 8

(a) Change in the speed of articulation
(b) Repetition of a word or phrase
(c) Self-correction
(d) Pauses
(e) Drawls
(f) False starts
Speed of articulation, based solely on the number of words spoken, is usually slower
in the L2 Pauses refer to interruptions produced by hesitation A false start refers to
the situation where the sentence that was originally intended is interrupted and a
different one is started Drawls in English include automatised fillers such as "em" or
"uh" and the French drawl is a method used to gam valuable planning time Repetition
of a word or phrase is another way of gaining planning time When the learner
becomes aware that there is something incorrect in what is being said, he/she may
stop to correct him/herself (self-correction)
Sindermaim and Horsdla (1989 440) point out that "the complex process of communication,
whether m LI or L2, is viewed by the strategic model as consisting of a planning and
an execution phase The planning phase is difficult to study, even in carefully
conducted "think aloud" experiments When the L2 learner finds no difficulties or
problems in organising a message with the linguistic resources in his L2 repertoire,
we have no chance of observing his strategic behaviour, and that is why almost all
successful strategies remain undetected The analyst has, therefore, to study the
"product" obtained m the execution phase"
i

Conclusion
In this section, we have traced the development of communication strategies research
since strategies were first mentioned in Sehnker’s seminal paper on Interlanguage (1972)
The examination of the various taxonomies o f communication strategies used by the
researchers in the course of their investigations into this linguistic phenomenon has
contributed to the compilation of the taxonomy which will be used to classify the
communication strategies elicited from the subjects m the present study The case is
also made that the research area reviewed is incomplete and the need for further
research is established
30

2. Methodology
This research aims to identify the strategies of communication employed by native
English-speaking learners when confronted with linguistic difficulties in the French
language In this section, the subjects of the study, the tasks and procedures used to
obtain the relevant data and the methods of data analysis are described
2.1 Use of Elicitation Tasks
One could try to obtain naturalistic samples from the learners as they communicate in
the L2 or target language (TL) However, this approach poses a number of problems
Primarily, it can result m different individuals talking about unrelated, general topics,
thus making it impossible to obtain the required comparable data This procedure can
be extremely time-consuming and may not result in the outcomes one desires It is
therefore necessary to exercise control over what the learners will attempt to say
Tarone (1988 119) states "if our studies are to approximate normal communicative
behaviour, and yet allow us to compare the performance of different
speakers/writers, we must control topic Learners need to be provided with tightly-
controlled, narrow topics"
Instruments must be developed and administered to the subjects m order to efficiently
collect comparable data These instruments are referred to in SLA terminology as
‘elicitation techniques’ or devices According to Nunan (1992 156) ’'elicitation is
probably the single most frequently used method in language research In terms of
intervention and control, elicitation resides somewhere between the formal
31

experiment and naturalistic observation While most researchers are aware of the
threats to the validity of their research posed by the use of elicitation devices, in
many instances, these devices are the only practical means whereby relevant data can
be collected"
In order to achieve a high level of validity and reliability when elicitation techniques
are being used, it is necessary to ensure that claims are not based on a single
production task Data must be gathered on a range o f tasks m order to have an
adequate sample of learner performance in communicative situations
Ridley (1991 46) referring to the methodology used in her case-study, suggests that
“useful data could have been elicited m the form of different tasks and text types to
see whether each subject used the same levels of transfer from task to task ”
2.2 Subjects
The subjects of this study are 25 students o f French on a third-level Business Studies
programme m an Irish Regional Technical College All subjects are native speakers
of English and have studied French to Leaving Certificate level before embarking on
their third-level studies They can be considered a specific subset of the larger
population of learners of French on the Business Studies course
They are selected on a random basis from First Year to Fourth Year of the course and
are divided into two groups according to the number of years they have studied
French
Group A
This group comprises students from First Year and Second Year (studied French for
an average of 6-8 years depending on the length of the second-level cycle)
32

Group B
This group is made up of students from Third and Fourth Year (studied French for an
average of 8-10 years) They are evidently at a more advanced level of L2 acquisition
and therefore one would assume that they are the more proficient learners
2.2.1 Programme of study
French is chosen as an elective subject on the Business Studies programme along
with four to six mandatory subjects depending on the year of the course (First Year
students taking more subjects than Fourth Years but at a less in-depth level) The
students study French in the context of a much wider Business Studies programme
and are therefore not mainstream language students Four hours per week is the time
allotted to the study o f the language
The course is initially a two-year National Certificate in Business Studies programme
and students must obtain a merit standard at this level m order to proceed to the
National Diploma in Business Studies programme which constitutes the third year of
study If students achieve the required standard m their National Diploma, they can
then proceed to the Bachelor o f Business Studies (Fourth Year)
The objective of the language teaching is to provide students with the necessary
linguistic skills to effectively use French in a business environment Students acquire
vocabulary which is specific to business situations There is also one hour per week
devoted to the study of French civilisation in the first and fourth years of the
programme
33

SUMMARY OF SYLLABUS CONTENT IN FRENCH
Year
First
Content
a) Business French
Hours per week
2
Second
Third
Fourth
b) French civilisation
c) Oral expression
a) Business correspondence
b) Commercial vocabulary and short essay-wnting
c) Aural and reading comprehension
d) Oral expression
a) Translation and business correspondence
b) Advanced commercial terminology and aural comprehension
c) Essay-wntmg and reading comprehension
d) Oral expression
a) History and politics of France / Reports
b) French literature/ Translation
c) French civilisation/ Translation
2.3 Design of research project
This research is designed on a cross-sectional basis i e data are collected from a
sample of learners at one point in their language development Given that the
subjects are representative of the four years of the Business Studies course, such a
34

design can simulate actual development over time because the learners are at
different stages in their L2 development
As suggested by Larsen-Freeman & Lang (1991 13) "if the subjects represent a range
of language proficiencies, then it can be assumed that their aggregate performance at
a single point in time will reflect a developmental picture similar to that obtained by a
researcher studying the second language development of a single subject over time"
Subjects are not specifically identified and the individual's freedom to participate was
respected Subjects were aware that they were taking part in a study Three native
speakers of French also participated, in order to provide a valid target baseline
2.3.1 Pilot study
However, before elicitation techniques are administered to the research subjects, they
need to be tried out in a pilot study This constitutes a very important aspect of any
research project which uses elicitation as part o f the methodology The pilot study
provides information on the practical aspects of administering the elicitation
techniques e g time required, suitability of environment, clarity of instructions It
also assesses the quality of the techniques which can be modified and improved
before being used with the actual subjects in the research proper
The pilot study for this research involved four subjects There was also one native
speaker of French who provided the necessary baseline data According to Tarone
(1988 119/124 ), it is necessary to obtain baseline data from native speakers of the
TL and NL data from the subjects themselves She suggests that too many studies
35

elicit data only from the L2 learners and analyses them with idealised patterns of
some ideal native speakers o f the TL or the studies simply discuss patterns which
supposedly derive from the NL Native speakers of the TL must perform the same
production tasks as the L2 learners if one wishes to show evidence of L2-based
strategies in the data analysis and similarly, if LI-based strategies are to be inferred,
the L2 learners should perform the production tasks in the NL Bialystok (1990 53)
states that “the most controlled data are those from studies in which learners
provided descriptions in both their NL and L2” Palmberg (1978 2) suggests that “a
basic problem in the study of communication strategies is that learners’ utterances
can be judged only on their own ment As we only know what a learner produces,
we cannot know how close he comes to producing what he actually wants to
produce” This study overcomes this pitfall as learners reveal their intended meaning
by performing the same tasks in their NL This action is supported by Palmberg
(1978 3) when he states that “by reference to the mother tongue version, the
intended meaning can be fairly reliably established m test situations”
The venue chosen for the pilot study was the language laboratory The four subjects
were presented with three elicitation tasks
(1) Picture sequence - subjects retold a story with the visual stimulus of six
sequenced pictures
(2) Free expression - two tasks
(a) Narration of a past event - Qu'est-ce que tu as fa il le
weekend dernier ?
(b) Expression of an opinion - A ton avis, quels sont les
inconvénients de la vie d ’étudiant ?
36

The above questions were always used
The subjects performed these tasks orally in the L2 and also in the NL A native
speaker of the TL also performed the tasks orally The subjects narrated the picture
sequence by speaking into individual tape-recorders using headphones The free
expression tasks were performed with a native speaker of the TL as interlocutor
when performing the tasks in the TL and with a native speaker of the NL as
interlocutor when doing so in the NL All the performances were tape-recorded and
transcribed Subjects were then required to produce written responses to the tasks in
the TL in order to determine whether their strategies of communication in writing
were systematically related to the strategies observed in their oral performance In
other words, learners’ use of communication strategies in written and oral
performances was compared in order to establish whether they were using similar
strategies in both instances
Finally, the subjects were questioned retrospectively on the difficulties which they
encountered when communicating in the TL These interviews were also tape-
recorded
The pilot study indicated that the elicitation techniques needed to be revised and
modified before being used with the actual subjects in the research project proper
The factors requiring modification are listed below
1 The entire procedure was extremely time-consuming - 2 5 hours for four
subjects In the actual research project, it was planned to select 25-30 subjects
and given the added difficulties of the constraints on students' time (an average
of 25 hours lectures per week) and the availability of L2 native speakers, it
37

became clear that the time devoted to the administration of the elicitation
techniques would have to be used more efficiently
2 The actual elicitation techniques needed to be revised in the following ways
(a) The picture sequence proved to be very successful as it allowed for control of
topic and thus provided the comparable data required The visual stimulus also
seemed to work very well It was thus decided to include two picture sequences m
the elicitation techniques for the actual study and to use other tasks which provided
visual stimuli eg photo description
(b) The free expression task was successful as the topics chosen were not too broad
and allowed the elicitation o f comparable data However, it seemed that the use of
just one such task would be sufficient for data-collection purposes
(c) It was evident that the elicitation of written responses, apart from taking up a
considerable length of time, was making the research question too broad and it
would be more feasible to be specific and limit investigation to communication
strategies in oral performance only
(d) Retrospective responses regarding the difficulties encountered by the subjects
when performing the tasks were not overly beneficial to the study as subjects had
difficulty recalling specific linguistic problems For example, when questioned as to
why they employed a particular strategy to cope with a specific communication
difficulty, they were unable to provide adequate reasons
The pilot study indicated the suitability o f the language laboratory as a venue because
the subjects associated it with oral communication in French
With all these considerations in mind, the elicitation techniques to be employed m the
actual project were prepared and the subjects were selected
38

2 3.2 Elicitation techniques
TASKS
It was essential to put together structured communicative tasks which would elicit
data naturally but within a limited time span
Three elicitation tasks were designed to elicit the strategies of communication
employed by the subjects when performing in the L2
All elicitation tasks were administered m the language laboratory
The researcher was present in the language laboratory during task performance
Subjects' performance was recorded on audio-tape and all tape-recordings were later
transcribed in full
1 Story-retelling
This task consisted o f two picture sequences ( See Appendix A)
There were six pictures in each sequence Sequence 1 portrayed two boys going on
a day tnp to the seaside by tram and arriving home late because they missed the train
in the evening Sequence 2 told the story of a young boy who receives a toy train for
Christmas When it breaks, he asks his father to fix it who in turn ends up playing
with it much to the chagrin of the young boy Subjects were required to re-tell the
stones m French and English The native speakers of French also performed the task
in the TL, thus providing the necessary baseline data
39

2 Photograph description
This task comprised two photographs - one portrayed a landscape scene typical of
the West of Ireland while the second showed two men on a fishing trip (See
Appendix B)
Subjects described the photographs in English and French while the native French
speakers described them in French
Subjects performed Tasks 1 and 2 at their own pace in individual booths in the
language laboratory and recorded their communicative performance on audio-tape
3 Free expression
This task required subjects to answer in French and English the question -Qu'est-ce
que tu as fa it le weekend dernier?” As before, the native speakers of French
provided the baseline data by answering the question in French The subjects did not
have the answers prepared m advance
Task 3 was performed in the presence o f a native speaker of the TL who acted as
interlocutor Their responses were recorded on audio-tape
Topic was controlled as all subjects were presented with the same visual stimuli in
Tasks 1 and 2 The question posed m Task 3 was also controlled as subjects were
preparing for examinations and it was assumed that study would constitute a major
part of the weekend activities of all subjects This assumption was borne out in the
elicited data The taxonomy outlined in Chapter 1 was used to classify the strategies
identified m the data
40

2 3.3 Statistical procedures
In this particular study, the population is the total number o f students studying
French on the Business Studies programme (Years 1- 4) in one particular third-level
institution This amounts to approximately 120 students In most research, it is not
possible to collect data from the entire population in which one is interested
Normally, one selects a sample from the population
In order for a sample to be adequate, it must represent 5% or more of the entire
population under investigation A sample of 25 students was selected for this
particular study This represents 20 83% of the population of 120 students, therefore
it can be considered to be an adequate sample
In statistical research, a sample of less than or equal to 30 is referred to as a small
sample When analysing the data from such a sample, it is appropriate to use small
sampling theory Given that the sample m this research falls into this category, the
statistical procedures used m small sampling theory are applied These procedures
include the following
1 Establishment of a frequency distribution which simply produces graphs or tables
from which results can be deduced It also indicates whether a normal distribution
exists
2 Tests for probability
a Two-way frequency distribution - shows how one variable relates to the
other and whether one variable is dependent/independent of the other
b Three-way frequency distribution - shows how two variables relate to one
another when a third variable is kept constant and also how the three
variables relate to one another
41

c Mann-Whitney U Test
The Mann-Whitney U test or rank sum test is a procedure involving an
analysis of two samples of data in order to draw a conclusion about the
corresponding populations
d Kruskal-Walhs H Test
The Kruskat-Walhs test is used in the parametric analysis of variance and is an
extension of the Mann-Whitney U test
The null hypothesis in the Kruskal-Walhs test is that several simple random samples
were drawn from identical populations
Conclusion
In this chapter, the specific methods selected to investigate the research topic and the
precise design of the study have been presented and discussed
The data elicited from the elicitation tasks will be analysed using the methods
described and the results o f this data analysis are reported in the next chapter
42

3. Data Analysis
This chapter presents the analysis of data obtained from the transcripts of the three
elicitation tasks The data are summarised and synthesised in order to amve at the
results and conclusions of the research Each of the elicitation tasks is analysed
separately m three sub-sections Patterns of strategy use according to task are
summarised m a fourth sub-section The sub-sections are as follows
1) Analysis of Task 1 ,
2) Analysis of Task 2 ,
3) Analysis of Task 3 ,
4) Patterns of strategy use according to task
Within each of the first three sub-sections, the data are analysed and synthesised as
follows
1 Use of communication strategies
2 Use of Ll/L3-based strategies
3 Use of L2-based strategies
4 Use of Message-Adjustment strategies
Within each of these areas, data are provided relating to the use of specific
communication strategies and also the extent of the relationship between one particular
strategy and another The extent o f difference or similarity between the two groups of
subjects m their respective usage of the various strategy categories is also tested using
appropriate probability tests (See Section on Statistical Procedures - Chapter 2)
43

Total number of strategies employed by Groups A and B
3 1 Task 1 - Story-retelling
STRATEGIES OF COMMUNICATION
Ll/L3-based strategies Literal translation
Language switch
Foreigmsing
Total
L2-based strategies
Paraphrase
Approximation
Word-coinage
Restructuring
Total
Message-Adiustmentstrategies
Topic Avoidance
Message Abandonment
Message Reduction
Total
TOTAL NUMBER OF STRATEGIES EMPLOYED
GROUP A (n-15)
71 ( 18 88%)
57 (15 16%)
27 ( 7 18%)
155 (41 22%)
1 (0 27%)
85 (22 61%)
46 ( 12 23%)
23 ( 6 12%)
155 (41 22%)
16 (4 26%)
18 (4 79%)
32 (8 51%)
66 (17 56%)
376
Table 1
GROUP B (n=10)
36 ( 14 4%)
12 (4 8%)
15 (6 0%)
63 (25 2%)
0 (0%)
53 (212%)
31 (12 4%)
32 ( 12 8%)
116 (46 4%)
21 ( 8 4%)
19 (7 6%)
31 ( 12 4%)
71 (28 4%)
250
44

Group A Group B
STRATEGIES EMPLOYED 376 250
NO OF SUBJECTS 15 10
AVERAGE NO OF STRATEGIES PER SUBJECT 25 07 25
Table 2
3.1 1 Use of Communication Strategies
Group A employs 376 strategies of communication while performing Task 1
whereas Group B employs 250 strategies As there are 15 subjects in the former
group and 10 subjects in the latter, this gives an average o f 25 07 strategies per
subject m Group A and an average of 25 per subject m Group B Both groups,
therefore, use practically the same average number of communication strategies The
subject who uses the most communication strategies comes from Group B (Subject
3 uses 46 strategies) and the subject who uses the least amount comes from Group
A (Subject 4 only uses a total of 9 strategies)
Group A uses more Ll/L3-based strategies (41 22%) than Group B (25 2%) The
latter group, who would be deemed the more proficient group relies less on the
mother tongue or other non-target languages m the performance of this task when
faced with communication difficulties in the L2 Subjects in Group A use the exact
same number of L2-based strategies as Ll/L3-based strategies (41 22%) This
45

implies that subjects have an equal reliance on both L1/L3-based and L2-based
strategies One would presume that the subjects in Group A would use more
L1/L3-based strategies than L2-based strategies but this is not the case in their
performance of this particular task They employ a much lower percentage of
Message-Adjustment strategies (17 56%) with almost half of these being strategies
of message reduction Group B employs a higher percentage of Message-
Adjustment strategies (28 4%)
USE OF STRATEGIES BY INDIVIDUAL SUBJECTS -TASK 1
GROUP A (N—15)
SUBJECT L1/L3 L2 MA TOTAL
1 2 0 7 3 302 10 9 1 2 0
3 14 13 5 324 5 3 1 95 4 10 2 166 12 11 8 317 3 19 7 298 19 10 2 319 11 14 2 2710 9 13 6 2811 18 5 10 3312 6 15 3 2413 8 7 3 1814 7 9 4 2 0
15 9 10 9 28
Hable 3
46

USE OF STRATEGIES BY INDIVIDUAL SUBJECTS -TASK 1
GROUP B (N=10)
SUBJECT L1/L3 L2 MA TOTAL
1 6 10 3 192 3 6 4 133 14 2 0 12 464 7 12 11 305 5 12 12 296 4 11 7 2 2
7 7 15 8 308 6 12 4 2 2
9 5 12 5 2 2
10 6 6 5 17
Table 4
It is evident from Tables 3 and 4 however, that not all subjects m Group A rely on
Ll/L3-based strategies In fact, seven subjects in the group use less Ll/L3-based
strategies than L2-based In some of these cases, the difference is very marked For
example, Subject 7 uses only three Ll/L3-based strategies but uses nineteen L2-
based strategies Subject 12 employs six L1/L3-based and fifteen L2-based
strategies On the other hand, some subjects in the group employ a much greater
number of Ll/L3-based strategies when communicating in the target language
Subject 1 uses 20 Ll/L3-based strategies out a total number of 30 Subject 8 uses
19 Ll/L3-based strategies out of a total of 31 and m the case of Subject 11, 18 out
of a total of 33 strategies are L1/L3-based
Nine out of the ten subjects in Group B use more L2-based strategies than L1/L3-
based whereas in Group A, nine out of fifteen subjects use more Ll/L3-based than
L2-based strategies
47

No subject in Group B uses more Ll/L3-based than L2-based strategies One
subject (Subject 10) uses these two categories in equal proportions (six instances
each) and uses Message-Adjustment strategies on five occasions Subject 3 in Group
B uses a considerably higher amount of LI/L3-based strategies compared to other
subjects in the group (14) but it must be noted that this subject uses by far the
greater number of overall communication strategies as well as recording the highest
proportion of L2-based strategies (20) and 12 Message-Adjustment strategies
Subject 2 in this group uses the least amount of Ll/L3-based strategies (3) and also
the least number of total communication strategies (13)
It is noteworthy that the subject in Group A (Subject 11) who uses the most
Message-Adjustment strategies (a total of 10) also uses a very high number of
Ll/L3-based strategies (18) compared to L2-based (5) On the contrary, Subjects 3
and 5 in Group B who record the highest number of Message-Adjustment strategies
(12) use more L2-based than Ll/L3-based strategies Two subjects in Group A
(Subjects 2 and 4) use only one Message-Adjustment strategy and Subjects 5, 8 and
9 use only a total of two each The least use of this category in Group B is Subject
1 who uses three such strategies
48

3 12 Use of Ll/L3-based strategies
GROUPA
Ll/L3-based strategies
Literal translation 71 (18 8 8 %)
Language switch 57 (15 16%)
Foreigmsing 27 (7 18%)
Total 155 (41 22%)
Table 5
GROUPS
36 (14 4%)
12 (4 8 %)
15 (6 0%)
63 (25 2%)
As already noted, Group A uses a high percentage of LI/L3-based strategies m their
performance of this elicitation task (41 22%) whereas 25 2% of Group B’s
communication strategies are Ll/L3-based Within this category, both groups use
literal translation to a greater extent However, in the case o f Group A, there is not a
significant difference between the use of literal translation and language switch while
foreigmsing is obviously used to a much lesser extent Foreigmsing is the L1/L3-
based strategy least frequently used by Group A while Group B uses language
switch to a lesser degree than the other two strategies in this category
49

Testine the hypothesis Ho that there is no difference between the groups in their use of Ll/L3-basedstrategies in Task 1
Mann-Whitnev U-test 0 05 significance level 0 0 1 significance levelz-2 05 z > 1 96 - 2 58< z < 2 58
Kruskal-Wallis H-test 0 05 significance level 0 0 1 significance levelH=4 38 H>3 84 H< 6 63
Student t-distnbution 0 05 significance level 0 0 1 significance levelt=2 072 t=2 07 t < 2 81
Table 6
One can conclude that there is a difference between the groups in their use of
Ll/L3-based strategies at the 0 05 significance level but one cannot conclude that
there is a difference at the 0 01 level In other words, one can only be 95%
confident that there is a difference between the groups in their use of this category
of strategies
Use of Individual Ll/L3-based strategies by Groups A and B - Task I
Group A (n-15) Group B (n=10)SUBJECT LTA LS FRN SUBJECT LTA LS FRN1 3 14 3 1 5 1 0
2 3 5 2 2 2 1 0
3 8 3 3 3 4 3 74 3 1 1 4 5 2 0
5 2 2 0 5 4 0 1
6 3 5 4 6 3 0 17 2 0 1 7 5 0 28 1 2 5 2 8 4 1 19 4 3 4 9 2 2 11 0 4 4 1 1 0 2 2 2
11 8 9 1
1 2 5 0 1
13 5 1 2
14 2 4 1 LTA Literal Translation15 7 1 1 LS Language Switch
__________________________________ FRN Foreign is mg
Table 7
50

ONE-WAY FREQUENCY TABLE OF L1/L3 BASED STRATEGIES - TASK 1GROUPA
LTA Freq Percent Cumul Freq Cumul Percent
2 3 20 0 3 20 03 4 26 7 7 4674 2 13 3 9 60 05 2 13 3 11 73 37 1 67 12 80 08 2 13 3 14 93 312 1 67 15 100 0
LS0 2 13 3 2 13 31 3 20 0 5 33 32 1 67 6 40 03 2 13 3 8 53 34 2 13 3 10 66 75 3 20 0 13 86 79 1 67 14 93 314 1 67 15 100 0
FRN0 11 67 1 67I 7 467 8 53 32 3 20 0 11 73 33 2 13 3 13 86 74 2 13 3 15 100 0
Table 8
ONE-WAY FREQUENCY TABLE OF L1/L3-BASED STRATEGIES - TASK 1
GROUPS
LTA Freq Percent Cumul Freq Cumul Percent
2 3 30 0 3 30 03 1 10 0 4 40 04 3 30 0 7 70 05 3 30 0 10 100 0
LS0123
30 0 30 0 30 0 10 0
36910
30 0 600 900 100 0
FRN0127
30 0 400 20 0 10 0
37910
30 0 70 0 90 0 100 0
Table 9
3.1.2.1 Use of Literal TVanslation
As can be seen from Table 5, Group A uses more literal translation than language
switch or foreigmsing Literal translation accounts for 18 88% of the total number
51

of strategies employed Subjects translate L1/L3 forms word for word into the L2
Table 7 indicates that although some subjects m Group A do not make extensive use
of literal translation (seven subjects use it on three or less occasions), it is evident
that every subject in the group resorts to this strategy at some stage in their
communication with a numberof subjects employing it quite frequently (e g Subjects
3, 8 and 11) Subject 8 uses literal translation to the greatest extent with 12
instances of same recorded out of a total of 19 L1/L3-based strategies On the other
hand, it was noted earlier that Subject 1 employs 20 L1/L3-based strategies out o f a
total number of 30 but only three of these strategies are attributed to literal
translation Subjects 5, 7 and 14 use literal translation on just two occasions each
The cumulative percentage in the frequency distribution indicates that 40% of the
group use literal translation on five occasions or more On the other hand, 20% of
subjects m the group record just two instances o f the strategy and 26 7% record
three instances of same
In Group B, literal translation is the most preferred Ll/L3-based strategy accounting
for 14 4% of the total number of strategies However, the data indicate that this
group uses less literal translation than Group A in the completion of Task 1 The
highest instance of usage was five (30% of the group) Every subject uses literal
translation at some stage but three subjects (Subjects 2, 9 and 10) employ the
strategy on only two occasions Like the case of Group A, no subject uses literal
translation on less than two occasions
52

Language switch is also a strategy frequently used by Group A albeit to a lesser
extent than literal translation This strategy accounts for 15 16% of the group’s total
communication strategies and only two subjects do not employ it One particular
subject (Subject 1) resorts to borrowing from the L1/L3 on 14 occasions Half of the
L1/L3-based strategies used by Subject 11 are attributed to language switch (9 out
of 18) These subjects do not attempt to translate the target item into the L2 and
just use the L1/L3 form However, the frequency distribution indicates that 13 3%
of the group do not use language switch and 53 3% of the group employ it on three
occasions or less One-third of the group switch to the L1/L3 on one occasion or
less
In the case of Group B, language switch constitutes a low percentage of
communication strategies (4 8%) This is dissimilar to Group A, which, as already
noted, uses a relatively high percentage of the strategy Three subjects m Group B
(30% of the group) do not use language switch at all (Subjects 5, 6 and 7) while
three subjects ( Subjects 1, 2 and 8) employ the strategy on just one occasion
Subject 3 uses the most language switch (3 instances) 60% of the group use
language switch on one occasion or less These findings indicate that, in the
accomplishment of Task 1, the more advanced group does not tend to switch to LI
or L3 forms when communicating in the L2 whereas the less advanced group is
much more likely to borrow lexical items from a non-target language
3 1.2.2 Use of Language Switch
53

Foreigmsing is the Ll/L3-based strategy least frequently used by Group A (7 18%)
although with the exception of Subject 5, all subjects in the group utilise this
strategy at some stage in their performance However, foreigmsmg is not used on a
wide scale as 46 7% of the group rely on it only once in their communication and its
highest frequency is four (Subjects 6 and 9)
There is not a significant difference between the two groups in their usage of
foreigmsmg It constitutes 6 0% of the communication strategies employed by
Group B It is thus not used very frequently by the group and with the exception of
Subject 3, who uses the strategy on seven occasions, subjects do not employ
foreigmsmg in more than two instances 30% of Group B do not resort to this
strategy and 40% employ it just once
3,12.3 Use of Foreignising
Two-way frequency distribution of LTA by LS - Task 1 Group A
LTAfrequencypercent
LS0
1 2 3 4 5 9 14 Total
2 1 0 1 0 1 0 0 0 36 67 000 6 67 0 00 6 67 000 0 00 000 20 00
3 0 1 0 0 0 2 0 1 40 00 6 67 000 000 000 13 33 0 00 6 67 26 67
4 0 O 0 1 1 0 0 0 2000 000 000 6 67 6 67 000 000 000 13 33
5 1 1 0 0 0 0 0 0 26 67 6 67 000 000 000 000 000 000 13 33
7 0 1 0 0 0 0 0 0 10 00 6 67 000 000 000 000 000 000 6 67
8 0 0 0 1 0 0 1 0 2000 0 00 0 00 6 67 000 000 6 67 000 13 33
12 0 0 0 0 0 1 0 0 10 00 0 00 000 000 000 6 67 0 00 000 6 67
Total 2 3 1 2 2 3 1 1 1513 33 20 00 6 67 13 33 13 33 20 00 6 67 6 67 100 00
Table 10
54

Two-way frequency distribution of LTA by LS - Task 1
Group B
LTAfrequencypercent
LS0
1 2 3 Total
2 0 1 2 0 30 00 1000 20 00 0 00 30 00
3 1 0 0 0 11000 000 0 00 000 10 00
4 1 1 0 1 310 00 10 00 0 00 1000 30 00
5 1 1 1 0 310 00 10 00 10 00 000 30 00
Total 3 3 3 1 1030 00 30 00 30 00 10 00 100 00
Table 11
3.L2.4 Relationship between literal translation and language switch
In Task 1, the two-way frequency distribution for Group A indicates that there is a
high correlation between the variables of literal translation and language switch
When subjects use the strategy of literal translation, it is highly probable that they
will also use language switch The column percentage indicates that the use of LS
increases to 20% up to LS=1, then declines but increases again to 20% at LS=5
The row percentage reveals that literal translation is at its highest level at LTA=3
(26 67%) Beyond this threshold, this variable fluctuates between increases to
13 33% and decreases to 6 67%
The pattern for Group B reflects that of Group A in that the variables o f LTA and
LS are relatively dependent on each other However, there is a slightly greater
probability of LTA use because in 30% of cases, LS=0 There is no occasion where

LTA=0 The lowest frequency of literal translation is LTA=2 However, when there
is a higher frequency of LS, it is probable that LTA will also be used For example,
when LS=3, LTA=4 and when LS=2, LTA=5 The use of LS decreases beyond the
threshold of LS=2 It remains constant from LS=0 to LS=2 (30%) but declines to
10% for LS=3 There is a 30% frequency of LTA at LTA=2 It declines at LTA=3
but regains its previous level for LTA>3 When LTA is at its highest level (LTA=5),
LS still exists As LTA increases to LTA=4, LS also increases When LTA=5, LS
decreases slightly to LS=2 but the ovemding fact is that subjects in Group B are still
using LS alongside LTA
56

Three-way frequency distribution of LS by FR controlling for LTA - Task I Group A
LTA=2 LTA=3Freq (%) Freq (%)LS FRN LS
0 1 Total0 0 (0 00) 1 (33 33) 1 (33 33)1 0(0 00) 0(0 00) 0 (0 00)2 1 (33 33) 0(0 00) 1 (33 33)3 0 (0 00) 0 (0 00) 0 (0 00)4 0 (0 00) 1 (33 33) 1 (33 33) Total
Total 1 (33 33) 2 (66 67) 2(100 00)
LTA=4 LTA=5Freq (%) Freq (%)LS FRN LS
1 4 Total0 0 (0 00) 0(0 00) 0 (0 00)3 0 (0 00) 1 (50 00) 1 (50 00)4 1 (50 00) 0(0 00) 1 (50 00)
Total 1 (50 00) 1 (50 00) 2 (100 00) Total
LTA=7 LTA-8Freq(%) Freq(%)LS FRN LS
0 1 Total0 0 (0 00) 0(0 00) 0(0 00)1 0(0 00) 1(100 00) 1(100 00)
Total 0(0 00) 1(100 00) 1(100 00) Total
LTA«12Freq (%)LS FRN
0 2 Total0 0 (0 00) 0(0 00) 0 (0 00)5 0(000) 1 (100 00) 1 (100 00)
Total 0(0 00) 1(100 00) 1 (100 00)
Group B
LTA-2Freq (%)LS FRN
0 1 2 Total0 0 (0 00) 0(0 00) 0(0 00) 0(0 00)1 1 (33 33) 0(0 00) 0(0 00) I (33 33)2 0 (0 00) 1 (33 33) 1 (33 33) 2(66 67)
Total 1 (33 33) 1 (33 33) 1 (33 33) 3 (100 00)
LTA=4Freq (%)LS FRN
0 1 7 Total0 0 (0 00) 1 (33 33) 0(0 00) 1 (33 33)1 0 (0 00) 1 (33 33) 0 (0 00) 1 (33 33)3 0(000) 0(000) 1 (33 33) 1 (33 33)
Total 0(0 00) 2 (66 67) 1 (33 33) 3(100 00)
Table 12
FRN1
0 0 (0 00)1 1 (25 00) 5 0 (0 00)
14 0 (0 00)I (25 00)
0 (0 00)0 (0 00)1 (25 00) 0(0 00)1 (25 00)
FRN1
0 1 (50 00)1 0(0 00)2 0 (0 00)
1 (50 00)
FRN1
3 0 (0 00)9 1 (50 00)
1 (50 00)
0 (0 00)0 (0 00)0 (0 00)1 (25 00) 1 (25 00)
0(0 00)1 (50 00) 0 (0 00)1 (50 00)
LTA=3 Freq (%) LS
Total
LTA=5 Freq (%) LS
Total
4 Total 0 (0 00) 0 (0 00)0 (0 00) 1 (25 00)1 (25 00) 2(50 00)0 (0 00) 1 (25 00)1(25 00) 4(100 00)
Total 1 (50 00)1 (50 00)0 (0 00)2 (100 00)
3 Total 1(50 00) 1(50 00) 0 (0 00) 1 (50 00)1(50 00) 2(100 00)
FRN
0 0 (0 00) 1 0 (0 00) 0(0 00)
0 1 Total1(100 00) 1(100 00) 0 (0 00) 0 (0 00) 1(100 00) 1(100 00)
FRN
0 0 (0 00)1 1(33 33)2 1 (33 33)
2 (66 67)
1 (33 33) 0(0 00) 0(0 00)1 (33 33)
2 Total 1 (33 33)1 (33 33)1 (33 33) 3(100 00)
57

3.1.2.5 Relationship between literal translation, language and foreignising
The three-way frequency distribution for Group A indicates that for low levels of
LTA usage, there is high usage of LS and low usage of FRN As LTA increases to
LTA=4, LS decreases from its previous high level to become more on par with LTA
and FRN usage FRN maintains its previous level As LTA increases further to
LTA=7, the use of LS and FRN decreases When LTA increases to LTA=8, both LS
and FRN increase In fact, there is a sharp increase in LS (LS=9) while there is a
less marked increase m FRN (FRN=3) When LTA reaches its highest level
(LTA=12), LS decreases to LS=5 and FRN decreases to FRN=2 However, it is
evident that in the performance o f Group A, the LTA vanable never becomes
independent of the other two variables
In the case of Group B, when LTA is at its lowest level, there is equivalent usage of
LS and FRN As LTA increases to LTA=4, both LS and FRN also increase, the
latter vanable revealing the greater increase (FRN=7) Beyond the threshold of
LTA=4, both LS and FRN decrease indicating that as LTA increases, it becomes
independent of the other two vanables
3.1.3 Use of L2-based strategies.
GROUPA GROUP BL2-based strategies
Paraphrase 1 (0 27%) 0 (0%)
Approximation 85 (22 61%) 53 (21 2%)
Word-cotnage 46 ( 12 23%) 31 ( 12 4%)
Restructuring 23 ( 6 12%) 32 ( 12 8 %)
Total 155 (41 22%) 116 (46 4%)

Group B uses much more L2-based than Ll/L3-based strategies - 46 4% of the
former compared to 25 2% of the latter (see Table 1) This seems to be more
appropriate given that the subjects should be more proficient in the L2 and therefore
should be more reliant on the their knowledge of the L2 when faced with
communication difficulties
However, Table 13 indicates that there is not a significant difference between the
two groups m their overall percentage use of L2-based strategies - 41 22% in the
case of Group A and 46 4% in the case of Group B
Testing the hypothesis Ho that there is no difference between the grouos in their use of L2-basedstrategies m Task 1
Mann-Whitnev U-test 0 05 significance level 0 0 1 significance levelz= -0 8 -1 96 < z < 1 % z < - 2 58
Kruskal-Walhs H-test 0 05 significance level 0 0 1 significance levelH=0 81 H< 3 84 H< 6 63
Student t-distnbudon 0 05 significance level 0 0 1 significance levelt= -0 7306 - 2 07< t <2 07 - 2 81 < t < 2 81
Table 14
The tests indicate that there is no difference between the groups m their use o f L2
based strategies and there is a 95% confidence level that this is the case
59

;
USE OF INDIVIDUAL L2-BASED STRATEGIES BY EACH SUBJECT - TASK 1
GROUP A (N= 15)
SUBJECT PARPH APP wc RS1 0 5 1 1
2 0 5 4 0
3 0 7 4 2
4 0 2 1 0
5 0 5 3 2
6 0 8 2 I7 1 8 8 2
8 0 5 3 2
9 0 9 4 1 PARPH Paraphrase10 0 4 6 3 APP Approximation11 0 3 2 0 WC Word-Comage12 0 9 3 3 RS Restructuring13 0 4 3 0
14 0 5 2 2
15 0 6 0 4
Table 15
USE OF INDIVIDUAL L2-BASEP STRATEGIES BY EACH SUBJECT - TASK 1
GROUP B(n=10)
SUBJECT PARPH APP WC RS1 0 6 3 12 0 1 2 33 0 12 3 54 0 5 2 55 0 7 2 36 0 5 2 47 0 4 10 1 PARPH Paraphrase8 0 5 1 6 APP Approximation9 0 5 6 1 WC Word-Comage10 0 3 0 3 RS Restructuring
Table 16
6 0

ONE-WAY FREQUENCY TABLE OF L2-BASED STRATEGIES GROUPA
PARAPH Freq Percent Cumul Freq
0 14 93 3 141 1 6 7 15
APP2 1 67 13 1 67 24 2 13 3 45 5 33 3 96 1 67 107 1 67 118 2 133 139 2 13 3 15
WC0 1 67 I1 2 13 3 32 3 20 0 63 4 26 7 104 3 20 0 136 1 67 148 1 67 15
RS0 4 26 7 41 3 20 0 72 5 33 3 123 2 13 3 144 1 67 15
Tfeble 17
ONE-WAY FREQUENCY TABLE OF L2-BASEP STRATEGIES GROUPB
PARAPH Freq Percent CumuLFreq
0 10 100 0 10
APP1 1 10 0 13 1 10 0 24 1 100 35 400 76 1 100 87 1 10 0 912 1 10 0 10
WC0 1 10 0 11 1 10 0 22 400 63 2 200 86 1 100 910 1 100 10
RS1 3 300 33 3 300 64 1 10 0 75 2 200 96 1 100 10
Table 18
-TASK 1
Cumul Percent
93 3 100 0
67 n 3 26 7 60 0 667 73 3 86 7 100 0
67 20 0 400 667 86 7 93 3 100 0
26 7 467 80 0 93 3 100 0
-TASK 1
Cumul Perçoit
100 0
10 0 20 0 30 0 700 80 0 900 100 0
10 0 20 0 60 0 80 0 900 1000
30 0 60 0 700 90 0 100 0
61

Paraphrase is a notably absent communication strategy in the subjects’ performance
of Task 1 Surprisingly, it is a subject in the less-advanced group who uses the
strategy on the only occasion upon which it is recorded for this task This subject
(Subject 7-Group A) uses the least amount of Ll/L3-based strategies within the
group and is also the one who used the most L2-based strategies (three strategies in
the former category compared with 19 in the latter)
One might presume that the more advanced group would frequently use paraphrase
in their L2 communication, given that the subjects have spent a longer period
studying the target language, but this is not the case Despite a greater percentage
use of L2-based strategies in the completion of this task, subjects in Group B never
attempt to overcome a linguistic difficulty m the L2 by exemplifying or describing
the target item
3.1.3.2 Use of Approximation
For both groups, the most frequently used communication strategy in any category
is that of approximation In fact, the percentage use for the two groups is almost the
same - Group A (22 61%) and Group B (21 2%) It seems that subjects of both
proficiency levels have a similar ability to use an alternative lexical item m the L2
which shares semantic features with the target word or structure The highest
individual usage of the strategy was by Subject 3 in Group B who employs it on
twelve occasions One has already observed that this particular subject also records
the highest number of LI/L3-based strategies for Group B The highest individual
usage in Group A is attributed to Subjects 9 and 12 who each use approximation on
3 1.3 1 Use of Paraphrase
62

nine occasions The frequency distribution indicates that 33 3% of Group A and
40% of Group B use approximation on five occasions The cumulative frequency
reveals that 40% of Group A use approximation on more than five occasions while
30% of Group B do same 20% of Group B use approximation on three occasions
or less whereas only 13 3% of Group A do same
3.L3.3 Use of Word-Coinage
Word-comage is also used in almost equal percentages by both groups - Group A
(12 23%) and Group B (12 4%) In Group A, Subject 7 uses the strategy most
often (eight instances) and in Group B, the highest frequency is also imputed to
Subject 7 (ten instances) In both groups, only one subject does not employ
foreigmsing (Group A-Subject 15 and Group B-Subject 10) As in the case of
approximation usage, it seems that, irrespective o f proficiency level, the subjects
demonstrate similar capability to create a word in the L2 by imposing a presumed L2
rule on an existing L2 word
However, on examination of the frequency distribution, one notes that 33 3% of
Group A use word-coinage on more than three occasions whereas just 20% of
Group B do likewise Therefore, Group A displays a tendency to employ higher
frequencies of word-comage although the overall percentages indicate similar levels
of usage by both groups On the other hand, the frequency distribution indicates
that just 20% of both groups use word-coinage in one instance or less
3.L3.4 Use of Restructuring
Group B makes much greater use than Group A of the strategy of restructuring
Restructuring is used over twice as often by the former group - 12 8% of the total
63

i
number of strategies compared with 6 12% in the case o f Group A This indicates
that the more advanced group is more capable of developing an alternative
constituent plan in the L2 when faced with difficulties in communication Every
subject in Group B uses restructuring at some stage in their communication whereas
four subjects in Group A do not rely on the strategy at all Only 20% of subjects in
Group A use the strategy m more than two instances while 70% of subjects in
Group B do same No subject in Group A uses restructuring on more than four
occasions whereas 30% of Group B use the strategy in excess of this figure
Three-way frequency distribution of WC by RS controlling for APP - Task 1Group AAPP=2Freq(%)WC RS
0 1 Total0 0(000) 0(0 00) 0(0 00)1 1(100 00) 0(0 00) 1(100 00)
Total 1(100 00) 0(0 00) 1(100 00)
APP=3Freq(%)WC RS
0 1 Total0 0(0 00) 0 (0 00) 0(0 00)2 1(100 00) 0 (0 00) 1(100 00)
Total 1(100 00) 0(0 00) 1(100 00)
APP=4Freq(%)WC RS
0 3 Total3 1 (50 00) 0 (0 00) 1 (50 00)6 0(000) 1(50 00) 1(50 00)
Total 1 (50 00) 1 (50 00) 2 (100 00)
APP=5Freq (%)WC RS
0 1 2 Total1 0(0 00) 1(20 00) 0(0 00) 1(20 00)2 0 (0 00) 0 (0 00) 1 (20 00) 1 (20 00)3 0(0 00) 0(0 00) 2(40 00) 2(40 00)4 1 (20 00) 0 (0 00) 0 (0 00) 1 (20 00)
Total 1 (20 00) I (20 00) 3 (60 00) 5 (100 00)
APP=6Freq(%)WC
Total
0 4 Total0 0 (0 00) I (100 00) 1 (100 00)1 0 (000) 0 (000) 0 (0 00)
0 (000) 1(100 00) 1(100 00)
APP=8Freq(%)WC RS
Total
1 2 Total0 0 (000) 0 (000) 0 (0 00)2 1(50 00) 0(0 00) 1(50 00)8 0(000) 1(5000) 1(50 00)
1 (50 00) 1 (50 00) 2 (100 00)
APP=7Freq(%)WC
Total
RS
0 0 (0 00) 4 0 (0 00)
0(000)
2 Total 0(0 00) 0(0 00) 1(100 00) 1(100 00) 1(100 00) 1(100 00)
APP=9Freq (%) WC RS
Total
1 3 Total0 0 (000) 0 (000) 0 (000)3 0 (0 00) 1 (50 00) I (50 00)4 1 (50 00) 0 (0 00) 1 (50 00)
1(5000) 1(50 00) 2(100 00)
Table 19
64

Three-way frequency distribution of WC by RS controlling for APP - Task 1 Group BAPP=1Freq (%) WC
Total
RS
0 0 (0 00) 2 0 (0 00)
0 (0 00)
0 30 (0 00)1 (100 00)1 (100 00)
Total 0 (0 00)1 (100 00) 1 (100 00)
APP=3Freq (%) WC
Total
RS
0 0 (0 00) 1 0 (0 00) 0 (0 00)
0 3 Total1 (100 00) 1 (100 00)0 (0 00) 0 (0 00)1 (100 00) 1 (100 00)
APP=4Freq (%)WC RS
0 1 Total0 0 (0 00) 0 (0 00) 0 (0 00)
10 0 (0 00) 1 (100 00) 1 (100 00)Total 0(0 00) 1(100 00) 1(100 00)
APP=5Freq (%) WC
Total
RS
0 0 (0 00)1 0(0 00) 2 1 (75 00)
1 (25 00)
5 6 Total0 (0 00) 0 (0 00) 0 (0 00)0 (0 00) 2 (50 00) 2 (50 00)1 (25 00) 0 (0 00) 2 (50 00)1(25 00) 2(50 00) 4(100 00)
APP=6Freq(%)WC RS
0 1 Total0 0 (0 00) 0 (0 00) 0 (0 00)3 0(0 00) 1(100 00) 1(100 00)
Total 0(0 00) 1(100 00) 1(100 00)
APP=7 Freq (%)WC RS
0 3 Total0 0 (0 00) 0 (0 00) 0 (0 00)2 0(0 00) 1(100 00) 1(100 00)
Total 0(0 00) 1(100 00) 1(100 00)
APP=12Freq(%)WC RS
0 5 Total0 0 (0 00) 0 (0 00) 0 (0 00)3 0(0 00) 1(100 00) 1(100 00)
Total 0 (0 00) 1 (100 00) 1 (100 00)
Table 20
3.13.5 Relationship between approximation, word-coinage and restructuring
The three-way frequency distribution for Group A indicates that for low levels of
approximation usage (e g APP=2 and APP=3), restructuring is not used and there
are low levels of word-coinage usage As APP increases to APP=4, RS is used
(RS=3) and WC increases to WC=6 As APP increases further to APP=5, both RS
and WC decrease Up to a threshold of APP=4, WC increases but decreases to zero
when APP=6 When WC reaches this low level, RS increases to its highest level
(RS=4) After the threshold o f APP=6, WC increases once again while RS
decreases However, at the highest level of APP use (APP=9), RS increases again
65

while WC decreases A clear pattern emerges in this three-way distribution Above
the threshold o f APP=5, when one of the RS/WC variables decreases, the other
increases There is continual fluctuation between the variables of RS and WC APP
never becomes independent of the other two variables When subjects m Group A
are using approximation, they are also using either restructuring or word-coinage or
both
In the case o f Group B, there is a higher frequency of word-coinage and
restructuring when approximation is at its lowest level (APP=1) At APP=4, WC
increases sharply to WC=10 while RS decreases to RS=1 As APP increases to
APP=5, RS increases to a level of RS=6 while WC decreases from its previously
high level to WC=2 At APP=6, RS decreases and WC increases but beyond this
threshold, RS increases steadily while WC decreases at APP=7 and increases once
again at APP=T2 At the highest level of APP, both RS and WC increase When
RS increases, WC decreases and vice versa except at the lowest and highest levels of
APP (APP=1 and APP=12) As APP increases, it does not become independent of
the other two variables
66

3.1.4 Use of Message-Adjustment strategies
Message-Ad îustment strategies
Topic Avoidance
Message Abandonment
Message Reduction
Total
GROUP \
16 (4 26%)
18 (4 79%)
32 (8 51%)
________ 6 6 (17 56%)
Table 21
GROUP B
21 ( 8 4%)
19 (7 6 %)
31 (12 4%)
71 (28 4%)
Group B employs Message-Adjustment strategies to a greater degree than Group A
- 28 4% of the total number in the case of the former group and 17 56% m the case
of the latter In this task, the more proficient group has a greater facility to tailor the
message to suit its linguistic resources For both groups the most frequently used
strategy in this category is message reduction This strategy accounts for 8 51% of
the total number of strategies in the case of Group A and 12 4% in the case of
Group B Group A uses topic avoidance and message abandonment in almost equal
proportions - 4 26% and 4 79% respectively The same applies to Group B where
topic avoidance accounts for 8 4% of the total number of strategies and message
abandonment accounts for 7 6% of the total
67

Testing the hypothesis Ho that there is no difference between the groups in their use ofMessage-Adiustment strategies in Task 1
Mann-Whitney U-test 0 05 significance level 0 0 1 significance levelz= - 2 0 2 -1 96< z < 196 -2 58< z <2 58
Kiuskal-Walhs H-test 0 05 significance level 0 0 1 significance levelH= 4 27 H >3 84
iH< 6 63
Student t-distnbution 0 05 significance level 0 0 1 significance levelt= -l 99 - 2 07< t < 2 07 - 2 81 <t < 2 81
Table 22
According to the Kruskal-Walhs and Mann-Whitney tests, there is a difference
between the two groups in their use of Message-Adjustment strategies at the 95%
significance level The Student t-distnbution shows a t-value of - 1 99 which is very
nearly outside the range at the 0 05 significance level Therefore, one can be 95%
confident that there exists a difference between the two groups in their use of this
strategy category but one cannot be 99% confident of same
6 8

USE OF INDIVIDUAL MESSAGE-ADJUSTMENT STRATEGIES - TASK 1 GROUP A
SUBJECT TA MA MR
1 0 0 32 0 1 03 1 1 34 1 0 05 0 1 16 0 4 47 1 0 68 0 1 19 0 0 210 0 3 311 6 2 212 0 2 113 1 2 014 2 0 215 4 1 4
MA Message Abandonment MR Message Reduction
Table 23
USE OF INDIVIDUAL MESSAGE-ADJUSTMENT STRATEGIES - TASK 1
GROUPB
SUBJECTTA MA MR
1 0 0 32 2 1 13 2 7 34 3 4 45 7 0 56 4 1 27 0 5 38 0 1 39 2 0 310 1 0 4 TA Topic Avoidance
MA. Message Abandonment MR Message Reduction
Tfeble 24
69

ONE-WAY FREQUENCY TABLE OF MESS AGE-ADJUSTMENT STRATEGIES - TASK 1GROUPA
TA Freq Percent Cumul Freq Cumul Percent
0 8 53 3 8 53 31 4 26 7 12 80 02 1 67 13 86 74 1 67 14 93 36 1 67 15 1000
MA0 5 33 3 5 33 31 5 33 3 10 66 72 3 20 0 13 86 73 1 67 14 93 34 1 67 15 100 0
MR0 3 20 0 3 20 01 3 20 0 6 40 02 3 20 0 9 60 03 3 20 0 12 80 04 2 13 3 14 93 36 1 67 15 100 0
Table 25
ONE-WAY FREQUENCY TABLE OF MESSAGE-ADJUSTMENT STRATEGIES -TASK 1 GROUPS
TA Freq Percent Cumul Freq Cumul Percent
0 3 30 0 3 30 01 1 10 0 4 4002 3 30 0 7 70 03 1 10 0 8 80 04 1 10 0 9 9007 1 10 0 10 100 0
MA0 4 400 4 4001 3 30 0 7 70 04 1 10 0 8 80 05 1 10 0 9 9007 1 10 0 10 1000
MRI 1 10 0 1 10 02 1 10 0 2 20 03 5 50 0 7 70 04 2 20 0 9 9005 1 10 0 10 100 0
Table 26
3.1.4.1 Use o f Topic Avoidance
Eight subjects in Group A do not use topic avoidance as a strategy in their
completion o f this task and a further four subjects use it on just one occasion The
70

frequency distribution indicates that only 20% of the group use this strategy more
than once m their communicative performance Topic avoidance accounts for 4 26%
of their overall communication strategies and is their least frequently used Message-
Adjustment strategy Subjects 11 and 15 are exceptions to the general trend for the
group as they employ topic avoidance in six and four instances respectively
Group B uses topic avoidance just over twice as often as Group A (8 4%) This
group chooses more frequently to adjust the intended message by avoiding certain
language structures or topics which lead to linguistic difficulties or omit parts of the
intended message due to deficient linguistic resources In contrast to Group A’s
performance, 60% of Group B use topic avoidance more than once One particular
subject (Subject 5) uses this strategy on seven occasions On the other hand, it is
also evident that 30% of the group do not employ topic avoidance at any stage in
their L2 communication However, 53 3% of subjects in Group A do not use topic
avoidance which further emphasises the point that Group B employs the strategy on
a more frequent basis than its less-advanced counterpart
3.L4.2 Use of Message Abandonment
Message abandonment constitutes 4 79% of Group A’s total communication
strategies Five subjects do not use the strategy at all and five subjects use it in only
one instance The highest frequency for message abandonment usage is four
(Subject 6) According to these figures, one could not consider message
abandonment to be a common communication strategy m the performance o f Group
A The frequency distribution indicates that 86 7% of subjects in the group employ
the strategy on two occasions or less and 33 3% o f the group do not use it at all
71

Group B uses message abandonment to a greater degree than Group A 7 6% of its
communication strategies are attributed to this particular strategy The subjects in
the higher proficiency group more frequently leave a message unfinished due to a
language difficulty One might assume that the less proficient learners would have a
greater tendency to employ this strategy given their lesser experience of the
language and that the more proficient learners would attempt to find another way of
conveying the message without giving up m mid-stream As the figures indicate,
this is not the case m the completion of this elicitation task On the other hand, it
must be noted that 40% of Group B do not use message abandonment and 30% of
the group use the strategy on just one occasion In fact, the higher percentage of
usage can be attributed to the performance of three subjects in the group - Subjects
3, 4 and 7- who use message abandonment in seven, four and five instances
respectively
3 1.4.3 Use of Message Reduction
Group A uses message reduction m 8 51% of its strategies It is the group’s most
frequently used Message-Adjustment strategy Subject 7 uses the strategy on six
occasions (the highest frequency recorded) 20% of the group do not use message
reduction but 40% use it in more than two instances
Message reduction is the also the most frequently used Message-Adjustment
strategy in the performance of Group B accounting for 12 4% of its total
communication strategies
Every subject in Group B relies on this strategy at some stage m their L2
communication with 80% o f the group employing it on three or more occasions
72

The highest frequency recorded for the group is five (10%) The more proficient
learners display a greater facility to reduce the intended message to suit their L2
linguistic resources and maintain communication
Two-way frequency distribution of MR bv TA - Task 1 Group A __________________________________MRfrequencypercent
TA0
1 2 4 6 Total
0 1 2 0 0 0 36 67 13 33 000 000 000 20 00
1 3 0 0 0 0 320 00 0 00 000 0 00 0 00 20 00
2 1 1 0 0 1 36 67 6 67 000 000 6 67 20 00
3 2 1 0 0 0 313 33 6 67 000 000 0 00 20 00
4 1 0 0 1 0 26 67 000 000 6 67 000 13 33
6 0 1 0 0 0 1000 6 67 000 000 0 00 6 67
Total 853 33
5 33 33 0000
16 67
1667
15 100 00
Table 27
Two-way frequency distribution of MR by TA - Task 1 Group B
MRfrequencypercent
TA0
1 2 3 4 7 Total
1 0 0 1 0 0 0 1000 000 1000 000 000 000 10 00
2 0 0 0 0 1 0 1000 000 000 0 00 10 00 000 10 00
3 3 0 2 0 0 0 530 00 000 2000 000 000 000 50 00
4 0 1 0 1 0 0 2000 10 00 000 10 00 000 000 20 00
5 0 0 0 0 0 1 1000 000 000 0 00 0 00 10 00 10 00
Total 3 1 3 1 1 1 1030 00 10 00 30 00 10 00 10 00 10 00 100 00
Tbble 28
73

3 14 4 Relationship between topic avoidance and message reduction
The two-way frequency distribution for Group A indicates that MR=0 and TA=0 in
just 6 67% of cases The use of MR remains constant up to a threshold of MR=3,
then decreases at MR=4 and further decreases at MR=6 The column percentage
for TA=0 indicates that 53 33% of subjects do not use this strategy whereas the row
percentage indicates that MR=0 in just 20% of cases It is more likely that subjects
in this group will use message reduction rather than topic avoidance With the
exception of one instance where MR=4 and TA=4, it is likely that as MR increases
above the threshold of MR-2, the use o f topic avoidance will remain at a low level
The use of TA declines sharply to a level o f zero at TA=2 but increases very slightly
at TA=4(6 67%) and remains at this level at TA=6 It is noteworthy that the row
and column percentages are equal for TA=6 and MR=6 At the highest level of TA
(=6), MR remains at a low level (MR=2) and at the highest level o f MR (=6), TA
remains at a low level (TA=1)
For Group B, the row and column percentages indicate that subjects use more
message reduction than topic avoidance TA=0 in 30% of cases whereas MR is
never at a level of zero TA < 2 in 70% of cases whereas MR < 2 m just 20% of
cases TA decreases to a level of 10% at TA =3 and remains at this level However,
it is clear that MR never becomes independent of the TA vanable As MR increases
beyond the threshold of MR=3, TA increases and when MR records its highest level
at MR=5, so also does the TA vanable (TA=7) At high levels of MR, there are also
high levels of TA
74

Three-way frequency distribution of MA by MR controlling for TA - Task 1 Group ATA=0Freq (%)MA MR
0 1 2 3 4 Total0 0 (0 00) 0(0 00) 1 (12 *>0) 1 (12 50) 0 (0 00) 2 (25 00)1 1 (12 50) 2 (25 00) 0(0 00) 0 (0 00) 0 (0 00) 3 (37 50)2 0 (0 00) 1 (12 50) 0 (0 00) 0 (0 00) 0 (0 00) 1(12 50)3 0 (0 00) 0(0 00) 0 (0 00) 1 (12 50) 0 (0 00) 1 (12 50)4 0 (0 00) 0 (0 00) 0 (0 00) 0 (0 00) 1 (12 50) 1 (12 50)
1(12 50) 3 (37 50) 1(12 50) 2 (25 00) 1 (12 50) 8(100 00)
TA=1 Freq (%) MA
Total
MR
0 1 (25 00)1 0 (0 00)2 1 (25 00)
2 (50 00)
3 6 Total0 (0 00) I (25 00) 2 (50 00)1 (25 00) 0 (0 00) 1 (25 00)0 (0 00) 0 (0 00) 1 (25 00)1(25 00) 1(25 00) 4(100 00)
TA=2Freq (%)MA MR
0 2 Total0 0(0 00) 1 (100 00) 1 (100 00)1 0 (0 00) 0 (0 00) 0 (0 00)
Total 0(0 00) 1 (100 00) 1 (100 00)
TA=4 Freq (%)MA MR
0 4 Total0 0 (0 00) 0 (0 00) 0 (0 00)1 0(0 00) 1 (100 00) 1 (10000)
Total 0(000) 1 (100 00) 1 (100 00)
TA=6 Freq (%)MA MR
0 2 Total0 0 (0 00) 0 (0 00) 0 (0 00)2 0 (000) 1 (100 00) 1 (100 00)
Total 0(0 00) 1 (10000) 1 (100 00)
Group BTA=0Freq (%)MA MR
0 0 (0 00)1 0(0 00)5 0 (0 00)
Total 0 (0 00)
TA=2Freq(%)MA MR
0 0 (0 00)1 1 (33 33)7 0(0 00)
Total 1 (33 33)
TA=4Freq(%)MA MR
0 0 (0 00)1 0(0 00)
Total 0 (0 00)
0 3 Total1 (3333) 1 (3333)1 (33.33) 1 (3333)1 (33 33) 1 (3333)3(100 00) 3(10000)
1 3 Total1 (3333) 1 (3333)0(000) 1 (33 33)1 (3333) 1 (3333)2(66 67) 3(10000)
0 2 Total0 (0 00) 0 (0 00)1 (10000) 1 (100 00) 1 (10000) 1 (100 00)
TA=1Freq (%)MA MR
0 0 (0 00)1 0 (0 00)
Total 0 (0 00)
TA-3 Freq (%)MA MR
0 0 (0 00) 4 0 (0 00)
Total 0(000)
TA=7 Freq (%)MA MR
0 0 (0 00)1 0 (0 00)
Total 0 (0 00)
4 Total1 (10000) 1 (10000)0(0 00) 0(000)1 (10000) 1 (10000)
4 Total 0 (0 00) 0 (0 00)1 (100 00) 1 (10000) 1 (100 00) 1(100 00)
5 Total 1 (10000) 1(10000) 0(0 00) 0(0 00)1 (10000) 1 (10000)
Table 29
75
3 14 5 Relationship between topic avoidance, message abandonment and
message reduction
For Group A, the three-way frequency distribution shows that when TA=0, MA and
MR are used to a great extent with a slightly greater usage of MR The column and
row percentages indicate that the highest frequency for both MA and MR when TA
=0 is at a level of MA=1 and MR=1 At TA=1, there is more use of MR than MA
and at TA=2, MA is not used at all and MR reduces to MR=1 Beyond the
threshold of TA=2, MA increases while MR increases and then declines again TA
never becomes independent of the other two variables However, at the highest
level of TA (TA=6), there are low levels of MA and MR while at the lowest level of
TA (TA=0), there are high levels of MA and MR Therefore, for Group A, a
correlation is established between the three variables whereby the less topic
avoidance is used, the more message abandonment and message reduction are used
In the case of Group B, there is a similarity with Group A in that there is a high usage
of MA and MR when TA=0 In fact, the highest levels o f MA and MR are recorded
when topic avoidance is not used, MR=3 and MA=5 Beyond the threshold of TA=2,
the use of MA decreases steadily and above TA=4, TA becomes mdependent of the
MA variable TA never becomes independent of the MR variable The highest level of
MR (MR=5) is when TA is also at its highest level (TA=7) The TA and MR variables
are dependent on each other When subjects in Group B use topic avoidance, it is
probable that they will also be using message reduction
76

3.2 Task 2 Photo Description
Total number of strateeies employed by Groups A and B
STRATEGIES OF COMMUNICATION
LI/L3-based strategies
Literal translation
Language switch
Foreigmsing
L2-based strategies
Paraphrase
Approximation
Word-coinage
Restructuring
Message-Admstmentstrategies
Topic Avoidance
Message Abandonment
Message Reduction
TOTAL NUMBER OF STRATEGIES EMPLOYED
GROUP A (n=15)
58 (26%)
28 (12 56%)
14 (6 28%)
100 (44 84%)
0 (0%)
40 (17 94%)
19 (8 52%)
8 (3 59%)
67 (30 05%)
2 (5 38%)
21 (9 42%)
23 (10 31%)
56 (25 11%)
223
Table 30
~ GROUP B (n==10) *
40 (19 32%)
14 ( 6 76%)
27 (13 04%)
81 (39 13%)
5 (2 42%)
41 (19 81%)
21 (10 14%)
11 (5 31%)
78 (37 6 8 %)
28 (13 53%)
7 (3 38%)
13 ( 6 28%)
48 (23 19%)
207
77

Group A Group B
STRATEGIES EMPLOYED 223 207
NO OF SUBJECTS 15 10
AVERAGE NO OF STRATEGIES PER SUBJECT 14 87 20 7
Table 31
3 2 1 Use of Communication Strategies
In the performance of this task, Group A employs 223 strategies of communication
while Group B employs a total of 207 This represents an average of 14 87
strategies per subject in Group A and an average of 20 7 per subject m Group B
The subjects m the more advanced group are usmg more strategies than the less-
advanced group in order to overcome difficulties in communication in the L2
USE OF STRATEGIES BY INDIVIDUAL SUBJECTS- TASK 2
GROUPA (N=15)
SUBJECT L1/L3 L2 MA TOTAL
1 6 2 2 10
2 8 5 2 153 5 8 3 164 4 1 1 65 4 2 0 6
6 7 6 2 157 3 9 4 168 4 5 5 149 4 4 4 12
10 8 5 2 1511 16 2 10 2812 8 6 4 1813 8 5 3 1614 5 3 6 1415 10 4 8 2 2
Table 32
78

USE OF STRATEGIES BY INDIVIDUAL SUBJECTS - TASK 2
GROUP B fN=10)
SUBJECT L1/L3 L2 MA TOTAL
1 14 15 1 302 4 8 2 143 6 9 3 184 9 4 1 0 235 3 5 14 2 2
6 11 11 6 287 9 4 2 158 14 9 1 249 6 4 5 151 0 5 9 4 18
Table 33
Eleven subjects in Group A use more Ll/L3-based than L2-based strategies Eleven
subjects in the group also use more Ll/L3-based than Message-Adjustment
strategies One subject (Subject 9) uses equal amounts of all three categories of
strategy Subject 7 is the one subject who seems to have most reliance on L2-based
strategies compared to the other categories Subject 11 who uses the highest total
number of communication strategies also uses the most Ll/L3-based strategies It is
also interesting to note that Subject 11 also uses the highest number of Message-
Adjustment strategies (10) and only uses two L2-based strategies Subject 7 uses
the least amount o f Ll/L3-based strategies (a total of three) and also uses more L2-
based than Message-Adjustment strategies Subject 9 uses equal numbers of
strategies from the three categories
In Group B, four subjects use more Ll/L3-based than L2-based strategies One
subject (Subject 6) uses both categories m equal proportions -11 instances of each
79

Table 33 indicates that just two subjects (Subjects 4 and 5) m this group use more
Message-Adjustment than L1/L3-based strategies Both of these subjects along
with Subject 9 use more Message-Adjustment than L2-based strategies
In Group B, both Subjects I and 8 use 14 L1/L3-based strategies These subjects
use more L2-based than Message-Adjustment strategies In fact, they are the
subjects who use the least amount of Message-Adjustment strategies (just one such
strategy in each case) On the other hand, as noted above, the subject in Group A
(Subject 11) who uses the most L1/L3-based strategies only uses two L2-based
strategies compared with ten Message-Adjustment strategies Subject 5 in Group B
uses the least amount of Ll/L3-based strategies (three in total) This subject uses
significantly more Message-Adjustment than L2-based strategies - fourteen of the
former and five of the latter On the contrary, it was noted earlier that the subject m
Group A who uses the least amount of Ll/L3-based strategies uses more L2-based
than Message-Adjustment strategies Subject 6 in Group B uses equal amounts of
L1/L3-based and L2-based strategies (11 of each) and in fact, uses the second
highest total of communication strategies (28)
3.2.2 Use ofLl/L3-based strategies
Ll/L3-based strategies
GROUP A (n= 15) GROUP B(n= 10)
Literal translation 58 (26%) 40 (19 32%)
Language switch 28 (12 56%) 14 ( 6 76%)
Foreigmsmg 14 (6 28%) 27 (13 04%)
Total 100 (44 84%) 81 (39 13%)
Table 34
80

In percentage terms, there is not a significant difference between the two groups in
their use of Ll/L3-based strategies In the case of Group A, Ll/L3-based strategies
account for 44 84% of the total number of communication strategies while for
Group B, 39 13% of the total represents Ll/L3-based strategies It is notable that
three subjects in Group B use more than ten Ll/L3-based strategies whereas only
one subject in Group A does same (See Tables 32 and 33) The lowest frequency
of LI/L3-based strategy usage m both groups is three - Subject 7 m Group A and
Subject 5 in Group B
Table 34 indicates that Group A uses more literal translation and language switch
than Group B whereas Group B uses more foreigmsing than Group A 26% of the
total number of communication strategies employed by Group A are of literal
translation while this particular strategy accounts for 19 32% of the total in the case
of Group B However, the difference is more significant in the case of language
switch This strategy is used almost twice as often by subjects in Group A - 12 56%
of the total in the case of Group A and 6 76% of the total in the case of Group B
This implies that, in the completion of this task, the subjects m the less-advanced
group have direct recourse to lexical items from both the native language and from
other non-target languages However, foreigmsing is employed over twice as often
by subjects m Group B - m 13 04% of cases compared with a percentage of 6 28%
for Group A In the performance of this task, the more advanced group uses an
L1/L3 form but adapts it to make it appear like an L2 form
81

Testing the hypothesis HO that there is no difference between the groups in their use of L1/L3-based strategies in Task 2
Mann-Whitney U-test 0 05 significance levelz= - 0 97 -1 96 < z < 1 96
Kruskal-Wallis H-test 0 05 significance levelH=1 11 H < 3 84
Student t-distnbution 0 05 significance levelt = - 0 9401 - 2 07 < t < 2 07
Table 35
The tests indicate that there is no difference between the groups in their use of
L1/L3-based strategies in Task 2 and there is a 95% confidence level that this is the
case
82

SUBJECT LTA LS FRN1 3 2 12 5 0 33 2 3 04 2 1 15 3 1 06 5 2 07 1 0 28 3 1 09 4 0 010 6 2 011 9 5 212 3 4 113 3 2 3 LTA. Literal Translation14 2 3 0 LS Language Switch15 7 2 1 FRN Foreigmsing
T ab le 36
USE OF INDIVIDUAL L1/L3-BASED STRATEGIES BY GROUP A -TASK 2
USE OF INDIVIDUAL L1/L3-BASED STRATEGIES BY GROUP B - TASK 2
SUBJECT LTA LS FR
1 3 2 92 3 1 03 2 0 44 6 1 25 2 0 16 5 2 47 6 1 28 6 6 29 5 0 110 2 1 2
LTA. Literal Translation LS Language Switch FRN Foreigmsing
Table 37
83

ONE-WAY FREQUENCY TABLE OF L1/L3-BASED STRATEGIES - TASK 2 GROUP A
LTA I req Percent Cumul Freq Cumul Percent
1 1 67 1 672 3 20 0 4 26 73 5 33 3 9 6004 1 67 10 66 75 2 13 3 12 80 06 1 67 13 86 77 1 67 14 93 39 1 67 15 1000
LS0 3 20 0 3 2001 3 20 0 6 4002 5 33 3 11 73 33 2 13 3 13 8664 1 67 14 93 35 1 67 15 100 0
FRN0 7 467 7 4671 4 26 7 11 7332 2 13 3 13 8673 2 13 3
Table 38
15 1000
0 1 FREQUENCY TABLE OF L1/L3-BASED STRATEGIES - TASKGROUPB
LTA Freq Percent Cumul Freq Cumul Percent
2 3 30 0 3 3003 2 20 0 5 5005 2 20 0 7 70 06 3 30 0 10 100 0
LS0 3 30 0 3 30 01 4 400 7 7002 2 200 9 9006 1 10 0 10 1000
FRN0 1 10 0 1 1001 2 20 0 3 3002 4 400 7 7004 2 20 0 9 9009 1 10 0 10 100 0
Table 39
3.2.2.1 Use of Literal Translation
As previously stated, Group A uses literal translation to a greater degree than Group
B - 26% in the case of the former as opposed to 19 32% in the case of the latter
84

This is not a very significant difference however and it is clearly evident that
regardless of greater experience of the L2, the more proficient learners are still
entrenched m word for word translation from the L1/L3 when communicating in the
L2
Subject 11 in Group A records the highest frequency of literal translation for the
group (nine instances) As mentioned earlier, this subject also employs the highest
number of Ll/L3-based strategies and records the highest total of overall
communication strategies
Subject 9 who uses equal amounts of strategies from the three categories relies
solely on literal translation as an Ll/L3-based strategy It is interesting to note from
the frequency distribution that nine subjects in this group (60%) use literal
translation on less than four occasions Subject 7 uses literal translation on just one
occasion (the lowest frequency for the group)
On the other hand, in Group B, five subjects (50% of the group) use literal
translation on less than four occasions The highest frequency of usage is six
(Subjects 4, 7 and 8) Subjects 1 and 8 share the highest frequency of Ll/L3-based
strategies (14) but, while Subject 8 uses the highest frequency of literal translation
(6), Subject 1 only records three instances of this strategy This is noteworthy
because it demonstrates that although subjects employ similar degrees of L1/L3-
based strategies, their individual usage of strategies within that category can vary,
indicating the inconsistency of subject performance within the same group
85

Group A records almost twice as much language switch as Group B in this task
12 56% of Group As total number of communication strategies are attributed to
language switch while the percentage for Group B is 6 76% This proves that the
less proficient learners are more likely to use an L1/L3 term without attempting to
translate it into the L2 Nine subjects in Group A use language switch in two
instances or more 30% of Group B and 20% of Group A do not employ language
switch 40% of subjects in Group B use language switch just once compared with
20% of Group A However, the highest frequency of usage is recorded by Subject
8 in Group B (six instances) This result is the exception to the general trend for
Group B as the rest of the group (90%) uses language switch on two occasions or
less
3.2.2.3 Use of Foreignising
Foreigmsmg is used by the more proficient learners in the sample over twice as
frequently as by the less proficient learners This strategy represents 13 04% of
Group B’s total number of communication strategies while it accounts for only
6 28% of the total for Group A Unlike Group A, which more commonly uses
L1/L3 words without translating them, Group B more frequently employs L1/L3
words and adjusts them to L2 phonology and/or morphology This strategy usage
could be attributed to the more proficient learners’ greater experience of the L2
They are displaying their knowledge of L2 rules although they are still using the
L1/L3 m a ‘foreigmsed’ manner
3 2.2 2 Use of Language Switch
86

Seven subjects in Group A do not employ foreigmsing and four subjects employ it
on just one occasion each 86 7% of subjects m Group A and 70% of Group B use
foreigmsing on two occasions or less In Group B, only one subject (Subject 2)
does not use foreigmsing and Subject 1 relies on it on nine occasions during the
completion of this task 30% of Group B resort to foreigmsing in more than three
instances whereas no subject in Group A exceeds this amount of usage
Two-way frequency distribution of LTA by LS - Task 2 Group A ______ _______ ______________ ______LTAfrequencypercent
LS0
1 2 3 4 5 Total
1 1 0 0 0 0 0 16 67 000 000 000 0 00 000 667
2 0 1 0 2 0 0 3000 6 67 000 13 33 000 000 20 00
3 0 2 2 0 1 0 5000 13 33 13 33 000 6 67 000 33 33
4 1 0 0 0 0 0 16 67 000 000 000 0 00 0 00 6 67
5 1 0 1 0 0 0 26 67 000 6 67 000 000 000 13 33
6 0 0 1 0 0 0 1000 0 00 6 67 000 000 0 00 6 67
7 0 0 1 0 0 0 1000 000 6 67 000 000 0 00 6 67
9 0 0 0 0 0 1 1000 0 00 000 000 000 6 67 6 67
Total 3 3 5 2 1 1 1520 00 20 00 33 33 1333 6 67 6 67 100 00
l i a b l e 4 0
Two-way frequency distribution of LTA by LS - Task 2
LTAfrequencypercent
LS0
1 2 6 Total
2 2 1 0 0 320 00 10 00 0 00 000 30 00
3 0 1 1 0 2000 1000 10 00 000 20 00
5 1 0 1 0 210 00 0 00 10 00 0 00 20 00
6 0 2 0 1 3000 20 00 0 00 1000 30 00
Total 3 4 2 1 1030 00 40 00 20 00 1000 100 00
Table 41
87

3 2 2 4 Relationship between literal translation and language switch
In Group A, there is a greater probability that beyond the threshold of LTA=3, subjects
will use more literal translation than language switch As LTA increases to the LTA=3
threshold, LS also increases but as LTA increases further, LS declines with the
exception of the one instance where LTA=9 (highest frequency of LTA) and LS=5
(highest frequency of LS) LTA is never at zero whereas LS=0 in 20% of cases
However, when LTA is at its lowest level (LTA=1), LS is not used When LTA is at its
highest level, LS is also at its highest level
Group B uses more literal translation than language switch LTA is never less than
LTA=2 whereas LS=0 in 30% of cases However, the variables of LTA and LS are not
mdependent of each other When subjects in Group B use LTA, it is also probable that
they will be using LS Indeed, when the highest level of LTA is used (LTA=6), the
highest level of LS is also used (LS-6) There is a high correlation between the two
variables As LTA increases above the threshold o f LTA=2, LS also increases The
one exception to this pattern of concurrent increase is the single instance where LTA=5
and LS=0 Apart from this deviation from the general pattern, there is a definite
correlation between LTA increase and LS increase m Group B’s performance o f this
task
88

Three-way frequency distribution of LS by FR controlling for LTA -Task 2
Group A
LTA=1Freq (%) LS
Total
FRN0 2 Total
0 0(0 00) 1(100 00) 1(100 00)1 0(0 00) 0(0 00) 0(0 00)0(0 00) 1(100 00) 1(100 00)
LTA=*2 Freq (%) LS FRN
0
Total
0 0(0 00)1 0(0 00)2 0 (0 00)3 2 (66 67)
2 (66 67)
0 (0 00)1 (33 33) 0(0 00) 0(0 00)1 (33 33)
1 Total 0 (0 00)1 (33 33) 0(0 00) 2(66 67)3 (100 00)
LTA=3 Freq (%)LS FRN LTA=4
0 1 3 Total Freq (%)0 0 (0 00) 0(0 00) 0(0 00) 0 (0 00) LS FRN1 2 (40 00) 0(0 00) 0(0 00) 2 (40 00) 0 12 0 (0 00) 1 (20 00) 1 (20 00) 2(40 00) 0 1 (100 00) 0(0 00)4 0 (0 00) 1 (20 00) 0(0 00) 1 (20 00) 1 0 (0 00) 0(000)
Total 2(40 00) 2 (40 00) 1 (20 00) 5 (100 00) Total 1 (100 00) 0(0 00)
LTA=5Freq(%) LTA=6LS FRN Freq (%)
0 3 Total LS FRN0 0 (0 00) 1 (50 00) 1 (50 00) 0 12 1 (50 00) 0(0 00) 1 (50 00) 0 0 (0 00) 0(0 00)
Total 1 (50 00) 1 (50 00) 2(100 00) 2 1 (100 00) 0(0 00)Total 1 (100 00) 0(0 00)
LTA=7Freq (%) LTA=9LS FRN Freq(%)
0 1 Total LS FRN0 0 (0 00) 0(0 00) 0(0 00) 0 22 0(000) 1 (100 00) 1 (100 00) 0 0 (0 00) 0(0 00)
Total 0(000) 1(100 00) 1(10000) 5 0 (0 00) 1 (100 00)
1 (100 00) 0(0 00) 1(100 00)
0(0 00)1 (100 00) 1(100 00)
0 (0 00)Total 0(0 00) 1(100 00) 1(100 00)
Group B
LTA=2Freq(%)LS
Total
FRN
0 1 (33 33)1 0(0 00)
1 (33 33)
1 2 4 Total0 (0 00) 1 (33 33) 2 (66 67)1 (33 33) 0 (0 00) 1 (33 33)1(33 33) 1(33_33) 3(100 00)
LTA=3Freq(%)LS
Total
FRN1 1(50 00)2 0 (0 00)
1 (50 00)
9 Total 0(000) 1(50 00)1(50 00) 1(50 00)1(5000) 2(100 00)
LTA=5 Freq (%) LS
Total
FRN
0 1 (50 00) 2 0(000)
1 (50 00)
1 4 Total0 (0 00) 1 (50 00)1 (50 00) 1 (50 00)1(50 00) 2(100 00)
LTA=6Freq(%)LS
Total
FRN0 2 Total
1 0(0 00) 2(6667) 2(66 67)6 0(0 00) 1(33 33) 1(33 33)
0 (0 00) 3 (100 00) 3 (100 00)
Table 42
89
3 2.2 5 Relationship between literal translation, language switch and
foreignising
At the lowest level of usage of literal translation (LTA=1), subjects in Group A use
foreignising (FRN=2) but do not use any language switch Beyond the threshold of
LTA =4, the use of language switch remains constant (at LS=2) up to LTA=9 when
it nses sharply to LS=5 There is greater fluctuation in the use o f foreignising At
low levels of LTA, subjects use FRN As LTA increases to a threshold of LTA=6,
the use o f FRN alternates between increase and decrease Beyond LTA=6, FRN
increases slowly again
In the case of Group B, when LTA increases, LS also increases FRN increases up
to a threshold of LTA=3 where it reaches a very high level (FRN=9) Beyond the
LTA=3 threshold, the use of FRN declines steadily, reaching its lowest level when
both LTA and LS reach their highest levels As previously noted, there is a
correlation between LTA and LS With the exception of LTA=5 where LS remains
constant, one observes a concurrent increase in LTA and LS As LTA increases, it
becomes independent o f the FRN variable whereas it is highly probable that when
subjects in Group B are using literal translation, they will also be using language
switch
90

3.2 3 Use of L2-based strategies
L2-based strategies GROUPA GROUP B
Paraphrase 0 (0%) 5 (2 42%)
Approximation 40 (17 94%) 41 (19 81%)
Word-coinage 19 (8 52%) 21 (10 14%)
Restructuring 8 (3 59%) 11 (5 31%)
Total 67 (30 05%) 78 (37 6 8 %)
Table 43
There is a 7 63% difference between the two groups m the use of L2-based
strategies - in the case of Group A, L2-based strategies account for 30 05% of the
total number of communication strategies whereas for Group B, L2-based strategies
represents 37 68% of the total Within this category, Group B uses a higher
percentage of paraphrase, approximation, word-comage and restructuring From
Tables 32 and 33, one observes that no subject in Group B uses less than four L2-
based strategies while five subjects in Group A do so with one particular subject
(Subject 4) using only one L2-based strategy The highest number o f L2-based
strategies employed by Group A is mne (Subject 7) and the highest number for
Group B is 15 (Subject 1) It is notable that Subject 7 in Group A uses the least
amount of Ll/L3-based strategies
In Group B, the subject who uses the highest number of L2-based strategies
(Subject 1) also records the highest total number of communication strategies for
the group and along with Subject 8, registers the greatest frequency of Ll/L3-based
strategies
91

Testing the hypothesis HO that there is no difference between the croups in their use of L2-based strategies in Task 2
Mann-Whitnev U-test 0 05 significance level 0 0 1 significance levelz— ** 2 16 7 < -1 96 -2 58 < z < 2 58
Kruskal-Wallis H-test 0 05 significance level 0 0 1 significance levelH= 4 85 H >3 84 H< 6 63
Student t-distnbution 0 05 significance level 0 0 1 significance levelt = - 2 72 t < -2 07 - 2 81< t < 2 81
Table 44
One can conclude that there is a difference between the groups in their use of L2-
based strategies at the 0 05 significance level but one cannot conclude that there is a
difference at the 0 01 level In other words, one can be only 95% confident that
there is a difference between the groups m their use of this category of strategies
However, at the 0 01 significance level, the t-value is almost outside the range which
indicates that there could be a difference between the two groups at the 0 01
significance level
92

USE OF INDIVIDUAL L2 -BASED STRATEGIES BY GROUP A - TASK 2
SUBJECT PARPH APP WC RS1 0 2 0 02 0 3 2 03 0 4 3 14 0 0 1 05 0 0 1 06 0 3 2 17 0 6 2 18 0 2 3 09 0 1 0 310 0 3 2 011 0 1 1 012 0 4 1 113 0 4 0 1 PARPH Paraphrase14 0 2 1 0 APP Approximation15 0 4 0 0 WC Word-Co inage
RS Restructuring
Table 45
USE OF INDIVIDUAL L2-BASED STRATEGIES BY GROUP B -TASK 2
SUBJECT PARPH APP WC RS1 3 3 6 32 1 4 3 03 0 7 2 04 0 3 0 15 0 4 1 06 1 4 5 17 0 1 2 18 0 6 1 29 0 3 0 110 0 6 1 2
PARPH Paraphrase APP Approximation WC Word-Coutage RS Restructuring
Table 46
93

ONE-WAY FREQUENCY TABLE OF L2-BASEP STRATEGIES -TASK 2GROUPA
PARPH Freq Percent Cumul Freq
0 15 100 0 15
APP0 2 13 3 21 2 13 3 42 3 20 0 73 3 20 0 104 4 26 7 146 1 67 15
WC0 4 26 7 41 5 33 3 92 4 26 7 133 2 13 3 15
RS0 9 60 0 91 5 33 3 143 1 67 15
Cumul Percent
100 0
13 3 26 7 46 7 66 7 93 3 100 0
26 7 60 0 86 7 100 0
60 0 93 3 100 0
Table 47
ONE-WAY FREQUENCY TABLE OF L2 -BASED STRATEGIES -TASK 2 GROUPB
PARPH Freq Percent Cumul Freq Cumul
0 7 70 0 7 70 01 2 20 0 9 90 03 1 10 0 10 100 0
APP1 1 10 0 1 10 03 3 30 0 4 4004 3 30 0 7 70 06 2 20 0 9 9007 1 10 0 10 100 0
WC0 2 20 0 2 20 01 3 30 0 5 50 02 2 20 0 7 70 03 1 10 0 8 80 05 1 10 0 9 9006 1 10 0 10 100 0
RS0 3 30 0 3 30 01 4 400 7 70 02 2 20 0 9 90 03 1 10 0 10 1000
Table 48
94
Group A does not employ paraphrase whereas there are five instances of this
strategy in the performance of Group B This concurs with the presumption that the
more-advanced group would rely on the language resources of the L2 by describing
or exemplifying the lexical item which poses a problem of communication
However, it must be pointed out that the amount of paraphrase used by Group B is
not very significant and in fact constitutes just 2 42% of the total number of
communication strategies used Furthermore, three out of the five instances of
paraphrase use are attributed to one subject (Subject 1) and one instance each to
Subjects 2 and 6 As already mentioned, Subject 1 uses the greatest amount of L2-
based strategies and indeed uses the highest number of communication strategies for
the group It can be thus inferred that this particular subject is the most adept at
solving L2 communication difficulties through strategy use and is the most reliant on
L2-based strategies This subject has the ability to use paraphrase m the L2 - a
strategy uncommon to the vast majority of other subjects in the sample On the
other hand, it has been previously observed that Subject 1 is joint highest user of
L1/L3-based strategies
3.2.3.2 Use o f Approximation
For both groups, approximation is the L2-based strategy used most often in this
particular task - 17 94% of the total m the case of Group A and 19 81% of the total
in the case o f Group B The percentage difference between the groups is not
significant It seems that when subjects in both groups are faced with a
3 2.3 1 Use of Paraphrase

communication difficulty, they find a single lexical item or structure in the L2 which
shares semantic features with the desired item
Two subjects in Group A do not use approximation (Subjects 4 and 5) The highest
frequency of usage o f the strategy is four and is attributed to four subjects (Subjects
3, 12, 13 and 15)
Every subject in Group B uses approximation Subject 3 records the highest
frequency (seven instances) and Subjects 8 and 10 use the strategy on six occasions
respectively Subject 7 uses the least amount of approximation (one instance) 40%
of Group B use approximation on three occasions or less compared with 66 7% of
Group A These figures indicate that although there is not a significant difference
between the two groups m their use of approximation as a percentage of the total
communication strategies, the more-advanced group uses higher frequencies of the
strategy in its performance of this task
3.2.3.3 Use of Word-Coinage
There is not a significant difference between the two groups in the use of word-
coinage - 8 52% of the total in the case of Group A and 10 14% in the case of
Group B Both groups display an approximately similar facility to mvent a new
word m the L2 in order to communicate a desired concept
No subject in Group A employs this strategy on more than three occasions and four
subjects (26 7% of the group) do not use it at all In Group B, Subject 1 uses word-
coinage on six occasions and Subject 6 uses the strategy on five occasions As
already noted, both o f these subjects also use paraphrase as a strategy Two subjects
96

in Group B (20%) do not utilise word-coinage 70% of Group B use word-coinage
in two instances or less compared with 86 7% of Group A These figures indicate
that the subjects in Group B are using word-coinage to a slightly greater extent than
their less-advanced counterparts although the difference between the two groups is
not particularly significant
3 2.3.4 Use of Restructuring
In this task, subjects m both groups do not rely much on the strategy of
restructuring, being less inclined to deal with communication difficulties by
developing an alternative constituent plan in the L2 This particular strategy
represents 3 59% of Group A s communication strategies while the percentage usage
for Group B is 5 31%
In Group A, nine subjects (60% of the group) do not use restructuring at all and the
remaining subjects with the exception o f Subject 9, use restructuring on just one
occasion Subject 9 employs restructuring three tunes during the performance of the
task In the case of Group B, three subjects (30%) do not use restructuring
whatsoever and the evidence indicates that the subject who uses this strategy most
often (on three occasions) also uses paraphrase most frequently (Subject 1) This
subject proves to be capable of maintaining communication by either describing the
characteristics of the requisite L2 item or by communicating the message according
to an alternative plan In both groups, no subject employs restructuring in excess o f
three occasions
97

Three-way frequency of WC by RS controlling for APP - Task 2 Group A
APP=0 APP=1Freq (%) Freq (%)WC RS WC RS
0 1 Total 0 3 Total0 0 (0 00) 0 (0 00) 0 (0 00) 0 0 (0 00) 1 (50 00) 1 (50 00)1 2(100 00) 0 (0 00) 2(100 00) 1 1 (50 00) 0 (0 00) 1 (50 00)
Total 2 (100 00) 0(0 00) 2(100 00) Total 1 (50 00) 1 (50 00) 2(100 00)
APP=2Freq (%) APP=3WC RS Freq (%)
0 1 Total WC RS0 1 (33 33) 0(0 00) 1 (33 33) 0 1 Total1 1 (33 33) 0 (0 00) 1 (33 33) 0 0 (0 00) 0 (0 00) 0 (0 00)3 1(33 33) 0 (0 00) 1 (33 33) 2 2 (66 67) 1 (33 33) 3(100 00)
Total 3(100 00) 0 (0 00) 3(100 00) Total 2 (66 67) 1 (33 33) 3(100 00)
APP=4 APP=6Freq (%) Freq (%)WC RS WC RS
0 1 Total 0 1 Total0 1 (25 00) 1 (25 00) 2 (50 00) 0 0 (0 00) 0 (0 00) 0 (0 00)1 0(0 00) 1 (25 00) 1 (25 00) 2 0 (0 00) 1 (100 00) 1 (100 00)3 0 (0 00) 1 (25 00) 1 (25 00) Total 0(0 00) I (100 00) 1 (100 00)
Total 1 (25 00) 3 (75 00) 4(100 00)
Group B
APP=I APP=3Freq(%) Freq (%)WC RS WC RS
0 1 Total 0 1 30 0 (0 00) 0(0 00) 0(0 00) 0 0 (0 00) 2 (66 67) 0(0 00)2 0 (0 00) 1 (100 00) 1 (100 00) 6 0 (0 00) 0 (0 00) 1 (33 33)
Total 0(0 00) 1(100 00) 1 (100 00) Total 0(0 00) 2 (66 67) 1 (33 33)
2(66 67)1 (33 33) 3(100 00)
APP=4Freq(%)WC
Total
APP=6Freq(%)
RS0 1 Total
WC RS0
1 1 (33 33) 0(0 00) 1 (33 33) 0 0(0 00) 03 1 (33 33) 0(0 00) 1 (33 33) 1 0 (0 00) 25 0 (0 00) ! (33 33) 1 (33 33) Total 0(0 00) 2
2 Total 0(0 00)
> 2(100 00) ) 2(100 00)
2 (66 67) 1 (33 33) 3 (100 00)
APP=7Frcq(%)WC
Total
RS(
0 0 (0 00)2 1 (100 00)
1(100 00)0(0 00) 0 (0 00) 0(0 00)
I Total 0(000)1 (100 00) 1(100 00)
Table 49
98

3 2.3.5 Relationship between approximation, word-coinage and restructuring
For Group A, RS reaches its highest level when APP is at a low level (APP=1) and as
APP increases beyond the threshold of APP=2, RS remains constant at RS=1 As APP
increases to APP=2, WC also increases Beyond this threshold, WC fluctuates
between increase and decrease but does not fall below the level of WC=2 When
approximation is used, there is a greater tendency for subjects in Group A to use
word-coinage rather than restructuring despite the fluctuations in word-coinage use
beyond the threshold of APP=2 When approximation is employed, word-coinage is
also employed whereas restructuring is not always used When APP increases, the
level of RS is low
Likewise in Group B, when approximation is used, there is a greater tendency to use
word-coinage rather than restructuring As APP increases to APP=3, WC also
increases However, as APP increases beyond APP=4, WC declines sharply, just rising
very slightly at APP=7 Therefore, for Group B, there is less use of word-coinage as
approximation increases above the threshold of APP=4 The use of restructuring
increases up to APP=3, then declines but increases very slightly at APP=6 (the only
instance where it exceeds WC use) As APP increases to APP=7, RS is not used at all
and WC has increased again
99
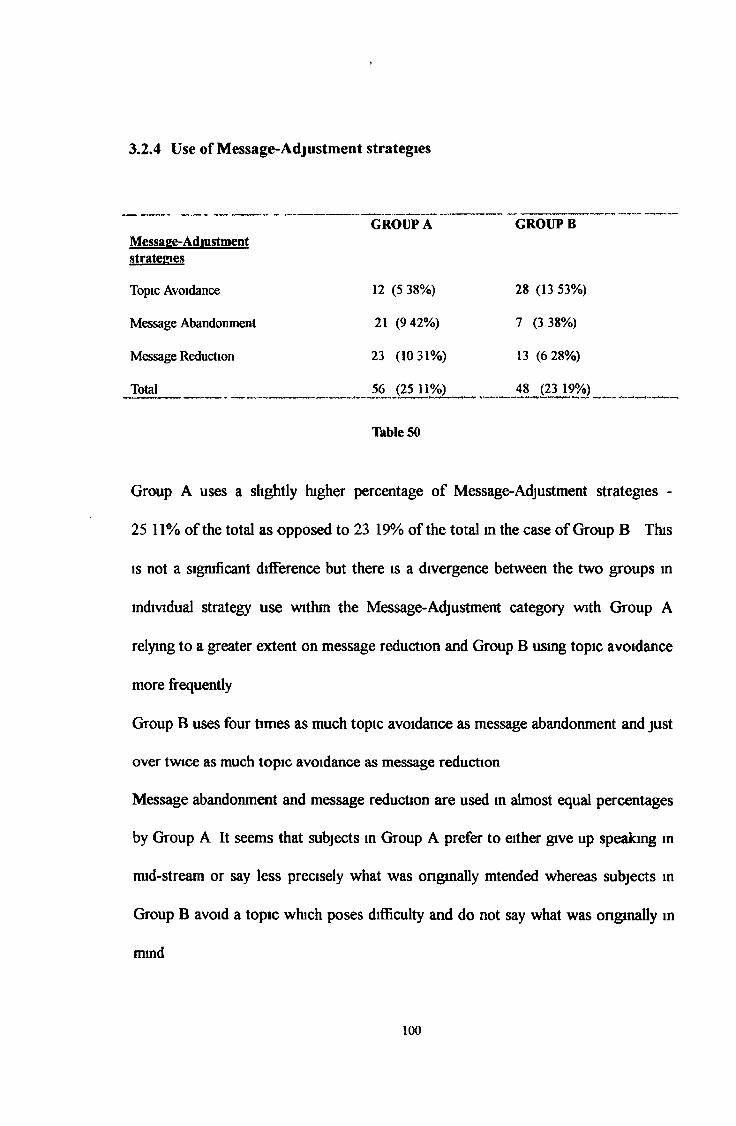
3.2.4 Use of Message-Adjustment strategies
GROUPA GROUPBMessage-Adiustmentstrategies
Topic Avoidance 12 (5 38% ) 28 (13 53% )
Message Abandonment 21 (9 42% ) 7 (3 38%)
Message Reduction 23 (10 31% ) 13 (6 28% )
Total 56 (25 11%) 48 (23 19%)
Table SO
Group A uses a slightly higher percentage o f Message-Adjustment strategies -
25 11% of the total as opposed to 23 19% of the total in the case of Group B This
is not a significant difference but there is a divergence between the two groups in
individual strategy use within the Message-Adjustment category with Group A
relying to a greater extent on message reduction and Group B using topic avoidance
more frequently
Group B uses four times as much topic avoidance as message abandonment and just
over twice as much topic avoidance as message reduction
Message abandonment and message reduction are used in almost equal percentages
by Group A It seems that subjects in Group A prefer to either give up speaking m
mid-stream or say less precisely what was originally mtended whereas subjects in
Group B avoid a topic which poses difficulty and do not say what was originally in
mind
100

Subject 11 in Group A uses the highest total amount of Message-Adjustment
strategies (10) and as already noted in uses the highest amount of Ll/L3-based
strategies in the group (16) but only uses two L2-based strategies (see Table 32)
Subject 5 in Group B employs the highest number of Message-Adjustment strategies
for this group (a total of 14) but uses the least amount o f LI/L3-based strategies (3)
and records only five L2-based strategies (see Table 33)
Testing the hypothesis HO that there is no difference between the croups in their use ofMessase-Adiustment strategies in Task 2
Mann-Whitney U-test 0 05 significance levelz= -0 33 -1 96 < z < 1 96
Kruskal-Wallis H-test 0 05 significance levelH= 0 27 H < 3 84
Student t-distnbuUon 0 05 significance levelt = - 0 74 - 2 07 < t < 2 07
Table 51
The tests indicate that there is no difference between the groups m their use of Message-
Adjustment strategies and there is a 95% confidence level that this is the case
INDIVIDUAL MESSAGE-ADJUSTMENT STRATEGIES USED BY SUBJECTS IN GROUP A - TASK 2
SUBJECT TA MA MR1 0 2 0
2 1 0 1
3 1 2 0
4 0 0 1
5 0 0 1
6 1 0 1
7 0 1 38 0 3 2
9 0 1 310 1 1 0
11 2 2 6
12 0 2 2
13 1 1 1
14 3 1 2
15 2 5 1
TA. Topic Avoidance MA Message Abandonment MR Message Reduction
Table 52
101

INDIVIDUAL MESSAGE-APJUSTMENT STRATEGIES USED BY SUBJECTS IN GROUP B - TASK 2
SUBJECT TA MA MR1 0 1 02 1 0 13 0 3 04 7 0 35 10 0 46 4 1 17 0 1 18 0 0 19 4 1 010 2 0 2
TA Topic Avoidance MA.Message Abandonment MR Message Reduction
Table 53
ONE-WAY FREQUENCY TABLE OF MESSAGE-APJUSTMENT STRATEGIES - TASK 2 GROUPA
TA Freq Percent Cumul Freq Cumul.Percent
0 7 467 7 4671 5 33 3 12 80 02 2 13 3 14 93 33 1 67 15 100 0
MA0 4 26 7 4 26 71 5 33 3 9 60 02 4 26 7 13 86 73 1 67 14 93 35 1 67 15 100 0
MR0 3 20 0 3 20 01 6 400 9 60 02 3 20 0 12 80 03 2 13 3 14 93 36 1 67 15 100 0
Table 54
102

ONE-WAY FREQUENCY TABLE OF MESSAGE-ADJUSTMENT STRATEGIES -TASK 2GROUPB
TA Freq Percent Cumul Freq Cumul Percent
0 4 40 0 4 40 01 1 10 0 5 50 02 I 10 0 6 60 04 2 20 0 8 80 07 I 10 0 9 90 010 1 10 0 10 100 0
MA0 5 50 0 5 50 01 4 40 0 9 90 03 1 100 10 100 0
MR0 3 30 0 3 30 01 4 400 7 70 02 1 100 8 80 01 I 100 9 90 04 1 100 10 100 0
Table 55
3 2.4.1 Use of Topic Avoidance
Topic avoidance is the Message-Adjustment strategy least frequently employed by
Group A, comprising 5 38% of its communication strategies Seven subjects in
Group A do not use topic avoidance and no subject uses it in more than three
instances 93 3% of the group use this strategy on two occasions or less
On the contrary, Group B uses a much higher percentage of topic avoidance than
Group A in its communicative performance - 13 53% of the total number of
strategies
However, it must be emphasised that the high percentage of topic avoidance
recorded for Group B is greatly attributed to the fact that one subject in particular
(Subject 5) uses this strategy on ten occasions and Subject 4 uses it on seven
occasions In fact, four subjects do not use topic avoidance at all and 60% of the
group use it in two instances or less However, it is evident that the more-advanced
103

group is resorting to topic avoidance in greater frequencies than its less-advanced
counterpart
3.2 4.2 Use of Message Abandonment
Group A’s percentage use of message abandonment is 9 42% while that of Group B
is 3 38% Message abandonment is used almost three times as much by Group A
which indicates that the less advanced subjects tend more to give up communicating
in mid-stream and abandon the message they had intended to convey
The four subjects in Group A who do not employ message abandonment (Subjects
2, 4, 5 and 6) also record a very low amount of overall Message-Adjustment
strategies (see Table 52) Subject 15 m Group A uses message abandonment on five
occasions 26 7% of subjects m Group A do not use message abandonment On the
other hand, 50% of the subjects in Group B do not employ message abandonment
including two (Subjects 4 and 5) who actually record the highest number of
Message-Adjustment strategies (see Table 33) 40% of Group A use message
abandonment on more than one occasion whereas the only subject in Group B who
uses message abandonment more than once is Subject 3 in whose communication
three instances o f the strategy occur In fact, message abandonment is the only
Message-Adjustment strategy employed by this particular subject
3 2.4 3 Use of Message Reduction
The most preferred Message-Adjustment strategy of Group A is message reduction
- 10 31% of the total communication strategies Group B use less message
reduction in their performance of this task - 6 28% Three subjects in the latter
104

group (30%) do not use message reduction and four subjects use it in only one
instance In Group A, three subjects (20%) do not use this strategy and six subjects
use it just once In fact, the higher frequency recorded for Group A can be imputed
to one particular subject - Subject 11- who uses message reduction m six instances
This subject uses the highest total number of Message-Adjustment strategies m
Group A The other subjects in the group use message reduction on three or less
occasions
Subject 5 m Group B records the highest frequency of message reduction for the
group, employing it in four instances 40% of Group A use message reduction more
than once compared with 30% of Group B
Two-way frequency distribution of MR by TA -Task 2 Group A
MRfrequencypercent
TA0
1 2 3 Total
0 1 2 0 0 36 67 13 33 000 000 2000
1 2 3 1 0 613 33 20 00 6 67 0 00 40 00
2 2 0 0 1 313 33 000 000 6 67 20 00
3 2 0 0 0 213 33 000 000 000 13 33
6 0 1 0 0 10 00 6 67 000 0 00 6 67
Total 7 6 1 1 1546 67 40 00 6 67 6 67 100 00
Table 56
105

Two-way frequency distribution of MR by TA -Task 2 Group B _________________________________MRfrequencypercent
TA0
I 2 4 7 10 Total
0 2 0 0 1 0 0 320 00 0 00 0 00 10 00 0 00 0 00 30 00
1 2 1 0 1 0 0 420 00 10 00 0 00 10 00 0 00 0 00 40 00
2 0 0 1 0 0 0 1000 0 00 10 00 0 00 0 00 0 00 10 00
3 0 0 0 0 1 0 1000 000 0 00 0 00 10 00 0 00 10 00
4 0 0 o’ 0 0 1 1000 0 00 000 0 00 0 00 10 00 10 00
Total 4 1 1 2 1 1 1040 00 10 00 10 00 20 00 10 00 10 00 100 00
Table 57
3.2.4 4 Relationship between message reduction and topic avoidance
Group A uses more message reduction than topic avoidance TA=0 in 46 7% of cases
whereas MR=0 m 20% of cases The highest frequency of topic avoidance is TA=3
while the highest frequency of message reduction is MR=6 As MR increases to
MR=2, TA also increases As MR increases further, the use o f TA declines and MR
becomes almost independent of the TA variable There is one exception to this pattern
when MR=6 and TA=1 As MR increases, it is less likely that the subjects m Group A
will use TA except at a high level o f MR where there is one instance of TA 86 7% of
TA use is less than TA=2 whereas 60% of MR use is less than MR=2
In Group B, if subjects are using message reduction, it is highly probable that they are
also using topic avoidance There is a high level of TA when MR is at its lowest levels
and as MR increases above the threshold of MR=2, TA usage increases sharply When
Subjects in Group B are using increased message reduction, they record even greater
levels o f TA (they are likely to be using a lot of topic avoidance) The column
percentages indicate that 40% of TA occurs at levels m excess o f TA=2 whereas the
row percentages reveal that just 20% of MR occurs at levels greater than MR=2

Three-way frequency distribution of MA by MR controlling for TA -Task 2
Group ATA—0Freq (%)MA MR
3 Total0 0 (0 00) 2 (28 57) 0 (0 00) 0 (0 00) 2 (28 57)1 0 (0 00) 0 (0 00) 0 (0 00) 2 (28 57) 2 (28 57)2 1 (14 28) 0 (0 00) 1 (14 28) 0 (0 00) 2 (28 57)3 0 (0 00) 0 (0 00) 1 (14 28) 0 (0 00) 1 (14 28)
Total 1 (14 28) 2 (28 57) 2 (28 57) 2 (28 57) 7(100 00)
TA=1 TA=2Frcq(%) Freq(%)MA MR MA MR
0 1 2 Total 10 0 (0 00) 2(40 00) 0 (0 00) 2 (40 00) 0 0 (0 00) 0(0 00)1 1 (20 00) 1 (20 00) 0(0 00) 2 (40 00) 2 0 (0 00) 1 (50 00)2 1 (20 00) 0 (0 00) 0(0 00) 1 (20 00) 5 1 (50 00) 0 (0 00)
Total 2 (40 00) 3 (60 00) 0 (0 00) 5(10000) Total 1 (50 00) 1 (50 00)
6 Total 0(0 00)1 (50 00) 1(50 00) 2(100 00)
TA-3Freq (%) MA
Total
MR
0 0 (0 00) 1 0 (0 00)
0(0 00)
0 2 Total0 (0 00) 0 (0 00)1 (100 00) 1 (100 00) 1 (100 00) 1 (100 00)
Group BTA=0 Freq (%)MA
Total
MR
0 0 (0 00)I 1(25 00) 3 I (25 00)
2 (50 00)
1 (25 00)1 (25 00) 0(0 00)2 (50 00)
0 (0 00) 0(0 00) 0(0 00) 0(0 00)
2 Total1 (25 00)2 (50 00)1 (25 00) 4(10000)
TA=1 Freq (%) MA
Total
MR0 1 Total
0 0(0 00) 1(100 00) 1 (10000)1 0(0 00) 0(0 00) 0(0 00)
0(0 00) 1 (100 00) 1 (10000)
TA=2Freq(%)MA
Total
MR
0 0 (0 00) 1 0 (0 00)
0(0 00)
0 2 Total1 (10000) 1 (100 00) 0 (0 00) 0 (0 00)1 (10000) 1 (100 00)
TA=4Freq (%) MA
Total
MR0 1 Total
0 0(0 00) 0(0 00) 0(0 00)1 1(50 00) 1(50 00) 2(100 00)
1(5000) 1(50 00) 2(100 00)
TA=7Freq(%)MA MR
0 0(0 00) 1 0 (0 00)
Total 0 (0 00)
0 3 Total1 (100 00) 1 (100 00) 0 (0 00) 0 (0 00)1 (100 00) 1 (10000)
TA-10Freq(%)MA
Total
MR
0 0 (0 00) 1 0(0 00)
0 (0 00)
0 4 Total1(100 00) 1 (10000) 0(0 00) 0(0 00) 1 (10000) 1 (10000)
Table 58
107

3 2.4.5 Relationship between topic avoidance, message abandonment and
message reduction.
For subjects m Group A, when topic avoidance is not used, it is probable that both
message abandonment and message reduction are used When topic avoidance is used
on one occasion, usage of both message abandonment and message reduction
decrease, the latter to a greater degree However, as TA further increases to TA=2,
the use of MA and MR also increases but as TA mcreases even further, the other two
variables both decrease This implies that the more topic avoidance is employed by
Group A, the less likely that message abandonment or message reduction will be used
Message reduction is used to a slightly greater extent than message abandonment
In the case of Group B, the row percentages indicate that when subjects
are not using topic avoidance (TA=0), they will have a greater tendency to
use message abandonment as opposed to message reduction However, the
frequency distribution further reveals that when subjects in this group do
use topic avoidance, they will use message reduction instead of message
abandonment The only occasion where topic avoidance and message
abandonment are used together is when TA=4 This is also the one
occasion where there is a slight decrease in message reduction usage
Above the threshold of TA=4, MR increases steadily while MA is not used
at all As TA increases, it becomes independent of MA but there is a high
correlation between TA and MR If subjects m Group B are using topic
avoidance, they are also likely to be using message reduction
108

3.3 Task 3 Free Expression
Total number of strategies employed by Groups A and B
STRATEGIES OF COMMUNICATION
GROUP A (n=15) GROUP B (n=
Ll/L3-bascd strategies
Literal translation 51 (36 42%) 26 (28 26%)
Language switch 10 (7 14%) 5 (5 43%)
Foreigmsing 6 (4 29%) 2 (2 17%)
Total 67 (47 8 6 %) 33 (35 8 6 %)
L2-based strategies
Paraphrase 1 (0 71%) 0 (0 %)
Approximation 29 (20 71%) 18 (19 56%)
Word-comage 7 (5 00%) 2 (2 17%)
Restructuring 10 (7 14%) 11 (11 95%)
Total 47 (33 57%) 31 (33 69%)
Message-Ad lustment strategies
Topic Avoidance 7 (5 00%) 11 (11 95%)
Message Abandonment 7 (5 00%) 5 (5 43%)
Message Reduction 12 ( 8 57%) 12 (13 04%)
Total 26 (18 57%) 28 (30 43%)
TOTAL NUMBER OF STRATEGIES EMPLOYED 140 92
Table 59
109

Group A Group B
STRATEGIES EMPLOYED 140 92
NO OF SUBJECTS 15 10
AVERAGE NO OF STRATEGIES PER SUBJECT 9 33 92
Table 60
3.3.1 Use of Communication Strategies
Group A employs 140 communication strategies while performing Task 3 whereas
Group B employs 92 strategies This represents an average o f 9 33 strategies per
subject in Group A and an average of 9 2 strategies per subject in Group B There is
no marked difference between the two groups in the average number of
communication strategies employed In fact, both groups use almost the same average
number of strategies
Table 59 indicates that the two groups also use more Ll/L3-based strategies than L2-
based or Message-Adjustment strategies Group A uses more L1/L3-based strategies
than Group B - 47 86% in the case of the former group and 35 86% in the case of the
latter Almost half the number o f strategies employed by Group A m this task are
Ll/L3-based
110

Both groups use approximately similar proportions of L2-based strategies - Group A
(33 57%) and Group B (33 69%) There is not a significant difference between Group
B’s use of LI/L3-based and L2-based strategies - the group uses just over 2% more
Ll/L3-based strategies
Group B uses a greater amount of Message-Adjustment strategies - 30 43% compared
with 18 57% recorded for Group A Overall, there is not a significant difference in the
proportionate use of the three categories by Group B
USE OF STRATEGIES BY INDIVIDUAL SUBJECTS -TASK 3
GROUPA (N=15>
SUBJECT L1/L3 L2 MA TOTAL
1 7 2 0 92 6 3 1 10
3 9 4 4 174 3 4 2 95 4 0 0 46 10 5 3 187 5 2 0 78 1 5 1 79 2 3 1 6
1 0 3 3 2 8
11 1 4 4 912 6 5 0 11
13 0 3 2 514 4 2 2 8
15 6 2 4 12
Table 61
111

USE OF STRATEGIES BY INDIVIDUAL SUBJECTS - TASK 3
GROUP B (N=10)
SUBJECT L1/L3 L2 MA TOTAL
1 7 4 1 12
2 2 3 4 93 3 4 1 8
4 1 1 6 8
5 2 2 6 10
6 2 3 0 57 5 4 2 11
8 2 2 0 49 6 3 3 12
10 3 4 5 12
Table 62
It is evident from Table 61 that every subject m Group A does not rely excessively on
Ll/L3-based strategies One subject in the group does not use any L1/L3-based
strategies (Subject 13) Subjects 8 and 11 each use only one Ll/L3-based strategy
These subjects, however, are exceptions to the general trend for Group A Subject 6
uses ten Ll/L3-based strategies out of a total o f 18 and Subject 3 uses nine L1/L3-
based strategies out of a total of 17
Every subject m Group B employs Ll/L3-based strategies with Subject 1 in the group
employing this category on seven occasions and Subject 9 doing so on six occasions
However, five subjects m the more-advanced group use L1/L3-based strategies m two
or less instances
Three subjects in Group A record a higher frequency of L2-based strategies than any
of the subjects in Group B Subjects 6, 8 and 12 from Group A use five L2-based
strategies respectively while the highest frequency recorded for Group B is four
(Subjects 1,3 and 10) Every subject m Group B uses L2-based strategies while one
112

subject in Group A (Subject 4) does not do same This latter subject only uses four
communication strategies m total, all of which are, m fact, Ll/L3-based
Four subjects m Group A do not employ Message-Adjustment strategies in their
performance of this task Seven subjects m the group use this category on two
occasions or less The highest frequency recorded is four (Subjects 3,11 and 15)
In Group B, two subjects do not use any Message-Adjustment strategies (Subjects 6
and 8) Both of these subjects record the least total amount of communication
strategies for the group The highest frequency of Message-Adjustment strategy usage
for Group B is attributed to Subjects 4 and 5 (six instances)
113

3.3.2 Use of Ll/L3-based strategies
GROUP A (n=15) GROUP B (n=10)
Ll/L3-based strategies
Literal translation 51 (36 42%) 26 (28 26%)
Language switch 10 (7 14%) 5 (5 43%)
Foreigmsmg 6 (4 29%) 2 (2 17%)
Total 67 (47 8 6 %) 33 (35 8 6 %)
Table 63
Group A uses more Ll/L3-based strategies (47 86%) than Group B (35 86%) It is
therefore evident that in this task, the more-advanced group relies less on the mother
tongue or any other non-target languages when faced with difficulties of
communication m the L2 The fact that almost half of the strategies employed by the
less-advanced group are L1/L3-based indicates the particular influence of the native
language on its L2 communication
Although the more-advanced group uses less L1/L3-based strategies, it is noteworthy
that the percentage of same is still quite high (35 86%) and in fact exceeds the amount
of L2-based strategies used (33 69%) In spite of more exposure to the L2, the more-
advanced learners remain entrenched in Ll/L3-based linguistic behaviour Given its
greater experience of L2 learning, one would assume that the more proficient group
114

would employ significantly more L2-based than L1/L3-based strategies in its target
language communication
Testing the hypothesis Ho that there is no difference between the groups in their use of LI/L3-basedstrategies in Task 3
Mann-Whitnev U-test 0 05 significance level 0 0 1 significance levelz=0 97 - 1 96 < z < 1 96 - 2 58 < z < 2 58
Kruskal-Walhs H-test 0 05 significance level 0 0 1 significance levelH=1 11 H < 3 84 H< 6 63
Student t-distnbution t=l 0389
0 05 sieruficance level - 2 07 < t < 2 07
0 0 1 significance level -2 81 < t < 2 81
Table 64
The tests indicate that m the performance of Task 3, there is no difference between the
two groups m their use of Ll/L3-based strategies and there is a 95% confidence level
that this is the case
Use of Individual Ll/L3-based strategies bv Groups A and B - Task 3
Group A (n=15) Group B (n=10)SUBJECT LTA LS FRN SUBJECT LTA LS FRN1 3 4 0 1 6 0 1
2 4 1 1 2 1 1 0
3 7 2 0 3 2 0 1
4 2 1 0 4 1 0 0
5 3 0 1 5 2 0 0
6 9 1 0 6 2 0 0
7 5 0 0 7 4 1 0
8 0 0 1 8 2 0 0
9 2 0 0 9 4 2 0
10 3 0 0 10 2 1 0
U 1 0 0
12 6 0 0
13 0 0 0
14 2 0 2
15 4 1 1LTA Literal Translation LS Language Switch fRN Forcigmsmg
Table 65
115

ONE-WAY FREQUENCY TABLE OF L1/L3-BASEP STRATEGIES - TASK 3GROUPA
LTA Fivq Percent Cumul Freq Cumul Percent
0 2 13 3 2 13 3I 1 67 3 20 02 3 20 0 6 4003 3 20 0 9 60 04 2 133 11 73 35 1 67 12 80 06 1 67 13 86 77 1 67 14 93 39 1 67 15 100 0
LS0 9 60 0 9 60 01 4 26 7 13 86 72 1 67 14 93 34 1 67 15 100 0
FRN0 10 667 10 66 71 4 26 7 14 93 32 1 67
Table 66
15 100 0
ONE-WAY FREQUENCY TABLE OF L1/L3-BASED STRATEGIES - TASK 3 GROUP B
LTA Freq Percent Cumul Freq Cumul Percent
1 2 20 0 2 20 02 5 50 0 7 7004 2 20 0 9 9006 1 20 0 10 100 0
LS0 6 60 0 6 6001 3 30 0 9 9002 I 10 0 10 100 0
FRN0 8 800 8 80 01 2 20 0 10 100 0
Table 67
3.3.2.1 Use o f Literal Translation
Literal translation accounts for 33 42% o f the communication strategies employed by
Group A (see Table 63) The subjects therefore translate a phrase word for word into
the L2 Obviously, they are thinking in the LI as they attempt to communicate m the
L2 The percentage use o f literal translation by Group B is also very significant
considering that they are the more-advanced learners Despite more exposure to the
116

L2, these subjects are still thinking in their native language and presuming that there is
an exact word for word translation in the L2 o f the message which they wish to
convey Table 63 indicates that the majority o f LI/L3-based strategies employed by
Group B are strategies of literal translation
According to the one-way frequency distribution for Group A, four subjects use literal
translation five times or more when performing the task and one subject resorts to this
particular strategy in a total of nine instances However, it is also evident that two
subjects do not use the strategy
Each of the subjects m Group B resorts to literal translation as a communication
strategy at some stage in the performance of the task with one particular subject
employing it on six occasions In Tables 66 and 67, the cumulative percentages
indicate that 40% of subjects in Group A use literal translation on two occasions or
less as opposed to 70% of subjects in Group B 50% of subjects in Group B use literal
translation on two occasions
It is, however, obvious that literal translation is by far the most common Ll/L3-based
strategy employed by both groups with 51 strategies out o f a total number of 67
Ll/L3-based strategies recorded for Group A being literal translation and the 26
instances of literal translation out of a total o f 33 Ll/L3-based strategies used by
Group B also displays word for word translation of an L1/L3 form
3.3.2.2 Use of Language Switch
Language switch accounts for 7 14% of the total number o f communication strategies
employed by Group A as opposed to 5 43% for Group B Six subjects in Group A use
language switch, four of whom use it in just one instance The one-way frequency
117

distribution indicates that one subject in Group A uses language switch on four
occasions However, it must be stressed that nine subjects in the group do not employ
this strategy at all
Only four subjects in Group B use language switch, three of whom use it on only one
occasion Subject 9 in this group uses the strategy m two instances It is notable that
60% of subjects in both groups do not use language switch
3 3.2.3 Use of Foreignising
Foreigmsing accounts for 4 29% of the communication strategies of Group A and for
2 17% of Group B’s communication strategies It is therefore not a very common
strategy m either group’s performance of this task 33 3% of Group A use foreigmsing
whereas only 20% of Group B do so The two subjects m Group B who use the
strategy do so on just one occasion
Subject 14 in Group A is the only subject who uses foreigmsing on more than one
occasion It is evident that, in the performance of Task 3, foreigmsing is not a typical
communication strategy for either the less-advanced or the more-advanced learners in
the sample
118

Two-way frequency distribution of LTA by LS -Task 3 Group A __________________ _________ _________ _________LTAfrequencypercent
LS0
1 2 4 Total
0 2 0 0 0 213 33 0 00 0 00 0 00 13 33
1 1 6 67 0 0 0 1000 0 00 0 00 6 67
2 2 I 0 0 313 33 6 67 000 0 00 20 00
3 2 0 0 1 313 33 0 00 0 00 6 67 20 00
4 0 2 0 0 20 00 13 33 000 000 13 33
5 1 0 0 0 16 67 000 0 00 000 6 67
6 1 0 0 0 16 67 000 000 0 00 6 67
7 0 0 1 0 10 00 000 6 67 0 00 6 67
9 0 1 0 0 1000 6 67 000 000 6 67
Total 9 4 1 1 1560 00 2667 6 67 6 67 100 00
Table 6 8
Two-way frequency distribution of LTA by LS -Task 3 Group B
LTAfrequencypercent
LS0
1 2 Total
1 1 10 00 I 10 00 0 2000 20 00
2 4 1 10 00 0 540 00 000 50 00
4 0 1 1000 1 10 00 2000 20 00
6 1 10 00 0 0 1 10 00000 000
Total 6 3 1 10 00 1060 00 30 00 100 00
Table 69
119

The two-way frequency distribution shows that for Group A, the variables of literal
translation and language switch are almost independent of each other If subjects are
going to use literal translation or language switch as communication strategies, it is
more likely that they will use literal translation In 60% of cases, LS=0 whereas
LTA=0 m only 13 33% of cases The highest frequency for use of language switch is
when LS=1 (26 67% of cases) Beyond LS=1, its use decreases with there being just
one instance of LS=2 when LTA=7 and one instance of LS=4 when LTA=3 The latter
is the only occasion when a subject employs more language switch than literal
translation However, where subjects are employing high frequencies of literal
translation e g when LTA=7 and LTA=9, there is also some use of language switch
albeit at a low frequency It is also noteworthy that there is a decrease in instances of
literal translation at LTA>4 However, it is very obvious that subjects m Group A
display a much greater tendency to use the strategy of literal translation as opposed to
that of language switch
In the performance of Group B, LTA is never at a frequency of less than one which
means that each of the subjects use literal translation as a communication strategy
There is a low correlation between the variables of LTA and LS If a subject uses
literal translation, he/she does not necessarily use language switch The highest
frequency for use of language switch is when LS=1 (30% of cases) and m 60% of
cases, LS=0 It is notable that the one subject who employs language switch at its
highest frequency of two also records a frequency o f four for literal translation
However, as their use o f literal translation increases, subjects in Group B are more
likely to be using language switch up to a threshold of LTA=4 When LTA increases
3 3 2.4 Relationship between literal translation and language switch
120

above the frequency of four, language switch does not exist implying that when LTA
increases beyond this threshold, it becomes independent of the LS variable For
LTA=6, there are no instances of LS In the case of Group A, one has seen that for
high frequencies of literal translation, there is still some usage of language switch
although in small frequencies In the performance of Group B, the probability of LTA
being influenced by LS decreases as instances of the former increases The greater the
usage of literal translation, the less likelihood that subjects in this group will use
language switch
121

Three-way frequency distribution of LS by FRN controlling for LTA - Task 3
Group A
LTA=#Freq (%)
LTA=1 Freq (%)
LS FRN LS FRN0 1 2 Total 0
0 1 (50 00) 1 (50 00) 0 (0 00) 2(100 00) 0 1 (100 00) 0 (0 00)1 0 (0 00) 0 (0 00) 0(0 00) 0 (0 00) 1 0 (0 00) 0(0 00)2 0 (0 00) 0 (0 00) 0(0 00) 0 (0 00) 2 0 (0 00) 0(0 00)4 0(0 00) 0(0 00) 0 (0 00) 0(0 00) 4 0 (0 00) 0 (0 00)
Total 1 (50 00) 1 (50 00) 0 (0 00) 2 (100 00) Total 1 (100 00) 0 (0 00)
LTA=2 LTA=3Freq (%) Freq (%)LS FRN LS FRN
0 1 2 Total 00 1 (33 33) 0(0 00) 1 (33 33) 2 (66 67) 0 1 (33 33) 1 (33 33)1 1 (33 33) 0 (0 00) 0(0 00) 1 (33 33) 1 0(0 00) 0(0 00)2 0 (0 00) 0(0 00) 0(0 00) 0 (0 00) 2 0 (0 00) 0 (0 00)4 0 (0 00) 0 (0 00) 0 (0 00) 0(0 00) 4 1 (33 33) 0(0 00)
Total 2 (66 67) 0(0 00) 1 (33 33) 3 (100 00) Total 2 (66 67) 1 (33 33)
LTA=4 LTA=5Freq(%) Freq(%)LS FRN LS FRN
0 1 2 Total 00 0 (0 00) 0(0 00) 0(0 00) 0(0 00) 0 1 (100 00) 0(0 00)1 0 (0 00) 2(100 00) 0(0 00) 2 (100 00) 1 0 (0 00) 0(0 00)2 0 (0 00) 0(0 00) 0(0 00) 0 (0 00) 2 0 (0 00) 0(0 00)4 0 (0 00) 2(100 00) 0(0 00) 0 (0 00) 4 0 (0 00) 0(0 00)
Total 0 (0 00) 2 (100 00) 0(0 00) 2 (100 00) Total 1 (100 00) 0(0 00)
LTA=6 LTA=7Freq(%) Freq(%)LS FRN LS FRN
0 1 2 Total 00 1 (100 00) 0(0 00) 0(0 00) 1 (100 00) 0 0(0 00) 0(0 00)1 0(0 00) 0(0 00) 0(0 00) 0(0 00) 1 0 (0 00) 0(0 00)2 0 (0 00) 0(0 00) 0(0 00) 0(0 00) 2 1 (100 00) 0(0 00)
Total 1(100 00) 0(0 00) 0(000) 1(100 00) Total 1(10000) 0(000)
LTA=9Freq (%)LS FRN
01 1 2 Total1 1(100 00) 0(000) 0(0 00) 1 (100 00)2 0 (0 00) 0(0 00) 0(0 00) 0 (0 00)
Total 1 (100 00) 0(0 00) 0(0 00) 1 (100 00)
Table 70
0 (0 00) 0 (0 00) 0 (0 00) 0 (0 00)
0 (0 00) 0(0 00) 0 (0 00) 0(0 00) 0 (0 00)
0(0 00) 0(0 00) 0(0 00) 0(0 00)
0(0 00) 0(0 00) 0(0 00) 0(000)
2 Total 1 (100 00)
0 (0 00)0 (0 00)0 (0 00)1 (100 00)
2 Total2 (66 67)0 (0 00) 0(0 00)1 (33 33)3 (100 00)
2 Total 1(100 00) 0(0 00) 0(0 00) 0(0 00)1 (100 00)
2 Total 0(0 00)
0 (0 00)1 (100 00) 1 (100 00)
122

Three-way frequency distribution of LS by FRN controlling for LTA - Task 3
Group B
LTA=1 LTA=2Freq (%) Freq (%)LS FRN LS FRN
0 1 Total 0 1 Total
0 I (50 00) 0 (0 00) 1 (50 00) 0 3 (60 00) 1 (20 00) 4 (80 00)
1 1 (50 00) 0 (0 00) 1 (50 00) 1 1(20 00) 0 (0 00) 1 (20 00)2 0 (0 00) 0 (0 00) 0 (0 00) 2 0 (0 00) 0 (0 00) 0 (0 00)
Total 2(100 00) 0 (0 00) 2 (100 00) Total 4 (80 00) 1 (20 00) 5(100 00)
LTA=4 LTA=6Freq (%) Freq (%)LS FRN LS FRN
0 1 Total 0 1 Total0 0 (0 00) 0 (0 00) 0(0 00) 0 0 (0 00) 1 (100 00) 1(100 00)1 1(50 00) 0(0 00) I (50 00) 1 0 (0 00) 0(0 00) 0 (0 00)2 1 (50 00) 0(0 00) 1 (50 00) 2 0 (0 00) 0 (0 00) 0 (0 00)
Total 2 (100 00) 0(0 00) 2 (100 00) Total 0 (0 00) I (100 00) 1 (100 00)
Table 71
3.3.2.5 Relationship between literal translation, language switch and
foreignising
In Tables 70 and 71, the variable of literal translation is kept constant and one sees
how the variables of LS and FR relate to each other when this happens and also how
the three variables relate to one another
When subjects in Group A are using literal translation, they do not have a tendency to
use either language switch or foreignising to any great extent Up to a threshold of
LTA=4, instances of LS and FRN do exist The highest frequency of FRN is two when
LTA=2 but this decreases to a frequency of one when LTA=3 and LTA=4 LS is not
used when the frequency of LTA is less than two Therefore, for low literal translation
usage, language switch is not used When LTA=2, LS=1 and when LTA=3, LS
123

increases to a frequency of four while FRN decreases to a frequency of one When
LTA>4, FRN is no longer used As already stated in the analysis of the two-way
frequency distribution, there is some usage of language switch for LTA>4 but in low
frequencies The ovemdmg factor is that subjects in Group A who use literal
translation are much more likely to employ language switch rather than foreigmsing
In Group B, there is no instance of LTA=0 When LTA=1 (a low frequency), there is a
greater probability that subjects will be using LS rather than FRN When LTA=2, one
finds one instance of FRN When LTA=4, there is one instance where LS=2 and there
are no instances of FRN The use of LS increases as LTA increases up to a threshold
of LTA=4 There is a greater likelihood of subjects in Group B using language switch
rather than foreigmsing up to the level of LTA=4 For the high frequency of LTA=6,
LS does not exist and there is one instance of FRN, thus the latter regains its previous
level
3.3.3 Use of L2-based strategies
L24>ased strategies
Paraphrase
Approximation
Word-coinage
Restructuring
Total
GROUP A
1(0 71%)
29 (20 71%)
7 (5 00%)
10 (7 14%)
47 (33 57%)
Table 72
GROUPB
0 (0%)
18 (19 56%)
2 (2 17%)
11 (11 95%)
31 (33 69%)
124
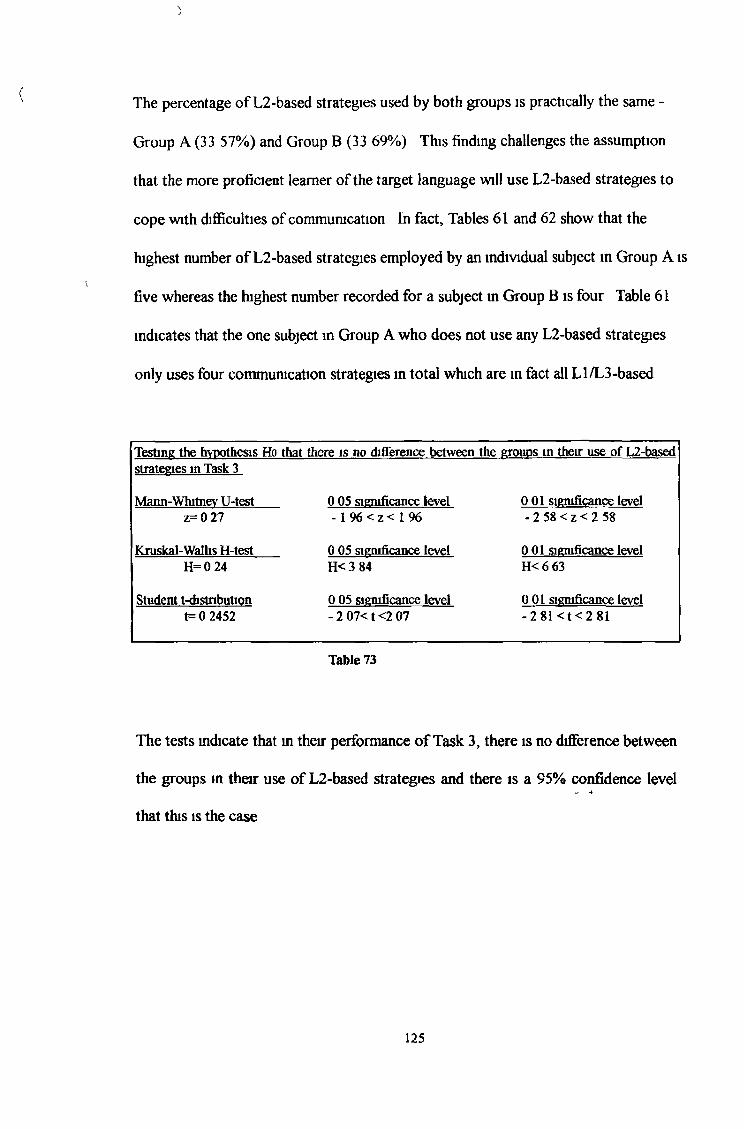
The percentage of L2-based strategies used by both groups is practically the same -
Group A (33 57%) and Group B (33 69%) This finding challenges the assumption
that the more proficient learner of the target language will use L2-based strategies to
cope with difficulties of communication In fact, Tables 61 and 62 show that the
highest number of L2-based strategies employed by an individual subject in Group A is
five whereas the highest number recorded for a subject m Group B is four Table 61
indicates that the one subject in Group A who does not use any L2-based strategies
only uses four communication strategies in total which are in fact all Ll/L3-based
Testing the hypothesis Ho that there is no difference between the groups m their use of L2-basedstrategies in Task 3
Mann-Whitnev U-test 0 05 significance level 0 0 1 significance levelz= 0 27 -1 96 < z < 1 % - 2 58 < z < 2 58
Kruskal-Wallis H-test 0 05 significance level 0 0 1 significance levelH=0 24 H< 3 84 H< 6 63
Student t-distnbution 0 05 significance level 0 0 1 significance levelt= 0 2452 - 2 07< t <2 07 - 2 81 < t< 2 81
Table 73
The tests indicate that in their performance o f Task 3, there is no difference between
the groups in their use of L2-based strategies and there is a 95% confidence level- 4that this is the case
125

USE OF INDIVIDUAL L2-BASEP STRATEGIES BY EACH SUBJECT -TASK 3
GROUPA (n=15)
SUBJECT PARPH1 0
2 0
3 1
4 0
5 0
6 0
7 0
8 0
9 0
10 0
11 0
12 0
13 0
14 0
15 0
APP w c RS1 1 02 0 I1 2 03 1 00 0 04 1 02 0 02 0 33 0 00 2 12 0 24 0 12 0 12 0 01 0 1
PARPH Paraphrase APP Approximation WC Word-Comage RS Restructuring
Table 74
USE OF INDIVIDUAL L2-BASED STRATEGIES BY EACH SUBJECT -TASK 3
GROUP Bfn=10^
SUBJECT PARPH APP WC RS1 0 3 0 12 0 2 0 13 0 2 0 24 0 0 0 15 0 2 0 06 0 2 0 17 0 2 1 1 PARPH Paraphrase8 0 1 0 1 APP Approximation9 0 2 0 1 WC Word-Comage10 0 2 1 2 RS Restructuring
Table 75
126

ONE-WAY FREQUENCY TABLE OF L2-BASEP STRATEGIES -TASK 3 GROUPA
PARAPH Freq Percent Cumul Freq Cumul Percent
0 14 93 3 14 93 31 1 67 15 100 0
APP0 2 13 3 2 13 31 3 20 0 5 33 32 6 40 0 11 73 33 2 13 3 13 86 74 2 13 3 15 100 0
WC0 10 667 10 6671 3 20 0 13 86 72 2 13 3 15 100 0
RS0 8 53 3 8 53 31 5 33 3 13 86 72 I 67 14 93 33 I 67 15 1000
Table 76
ONE-WAY FREQUENCY TABLE OF L2-BASEP STRATEGIES - TASK 3 GROUP B
PARAPH Freq Percent Cumul Freq Cumul Percent
0 10 100 0 10 100 0
APP0 1 10 0 1 10 01 1 10 0 2 2002 7 70 0 9 9003 1 10 0 10 100 0
WC0 8 800 8 8001 2 20 0 10 1000
RS0 1 10 0 1 1001 7 70 0 8 8002 2 20 0 10 100 0
Table 77
3.3.3.1 Use of Paraphrase
The research records only one instance o f paraphrase m Task 3 and provides
evidence that less proficient learners can resort to the use of paraphrase when faced
with communication difficulties in the L2 This is contrary to the commonly held
127

view that subjects with greater language proficiency are more inclined to use the
strategy than those with less competence in the L2 The only use of paraphrase m
this task is recorded by an individual m the less advanced group and perhaps
surprisingly the strategy is not used by any subjects in the advanced group Despite
significantly greater exposure to the L2, the more advanced group does not exhibit a
command of paraphrase in the L2
3.3.3.2 Use of Approximation
Table 72 mdicates that the preferred L2-based strategy of both groups is
approximation In Group As performance of the task, approximation accounts for
20 17% of its total communication strategies and in the case of Group, it represents
19 56% of the total number of strategies used The groups use approximation in
almost equal proportions However the one-way frequency distribution mdicates
that 33 3% of subjects in Group A use approximation in one instance or less,
whereas the figure for Group B is 20% However, more than two examples of
approximation usage is recorded for four subjects in Group A, while in Group B
only one subject exhibits use of the strategy on more than two occasions This
provides additional evidence in support of the argument that more competent
learners do not use significantly more L2-based strategies than their less proficient
counterparts
3.3.3.3 Use of Word-Comage
Word-coinage is used more frequently by Group A (5 00%) whereas Group B’s
performance produces only two instances (2 17%) Table 72 illustrates the greater
reliance o f Group A on word-coinage as a communication strategy It uses word-
128

coinage on more than twice as many occasions as Group B The one-way frequency
distribution provides evidence that this percentage, 5% of the total number of
strategies, is accounted for by only one third of the subjects in Group A Two
subjects use word-comage on two occasions Ten subjects do not use this strategy
at all Only two subjects m Group B use word-coinage and on only one occasion in
each case
3,3.3.4 Use of Restructuring
Restructuring is used by Group B to a greater extent with 11 95% of the
communication strategies employed from this category compared with 7 14% for
Group A Only one subject m Group B does not rely on restructuring as a
communication strategy whereas eight subjects in Group A do not use it The single
exception to this trend m Group A is Subject 8 who employs the strategy of
restructuring on three occasions out of a total number of five L2-based strategies
(see Table 74) One remarked above that this particular subject uses only one
Ll/L3-based strategy However, in general, with the exception of some individuals,
the subjects in Group A do not use restructuring as a strategy as frequently as those
in Group B 53 3% of subjects in Group A do not use restructuring whereas only
10% of subjects in Group B do not use the strategy One can assume in this case
that although the subjects m Group B do not appear to have mastered the use of
paraphrase m the TL, their greater exposure to the language may have resulted m
their ability to develop an alternative constituent plan when faced with a
communicative difficulty

Three-way frequency distribution of WC by RS controlling for APP -Task 3 Group AAPP=0Freq (%)
APP=1Freq (%)
WC RS WC RS0 1 2 Total 0 1 2 Total
0 1 (50 00) 0 (0 00) 0 (0 00) 1 (50 00) 0 0 (0 00) 1 (33 33) 0 (0 00) 1(33 33)1 0 (0 00) 0 (0 00) 0 (0 00) 0 (0 00) 1 I (33 33) 0 (0 00) 0(0 00) 1 (33 33)2 0 (0 00) 1 (50 00) 0(0 00) 1 (50 00) 2 1 (33 33) 0 (0 00) 0 (0 00) 1 (33 33)
Total 1 (50 00) 1 (50 00) 0 (0 00) 2 (100 00) Total 2 (66 67) 1 (33 33) 0 (0 00) 3 (100 00)
APP=2Freq (%) WC
Total
RS
0 2 (33 33)1 0 (0 00)2 0 (0 00)
2(33 33)
1 2 3 Total2(33 33) 1(16 67) 1(16 67) 6(100 00)0 (0 00) 0 (0 00) 0 (0 00) 0 (0 00)0 (0 00) 0 (0 00) 0 (0 00) 0 (0 00)2(33 33) 1(16 67) 1(16 67) 6(100 00)
APP=3Freq(%)WC RS
0 1 (50 00)1 1(50 00)2 0 (0 00)
Total 2(100 00) 0(0 00) 2(100 00)
1 Total 0 (0 00) 1 (50 00)0 (0 00) 1 (50 00)0(0 00) 0(0 00)
APP=4Freq (%)WC RS
0 0 (0 00)1 1(50 00)2 0 (0 00)
1 (50 00) 0(0 00) 0(0 00)
2 Total 0 (0 00) 1 (50 00)0 (0 00) 1 (50 00)0 (0 00) 0 (0 00)
Total 1(50 00) 1(50 00) 0(0 00) 2(100 00)
Group B
APP=0Freq(%)WC RS
0 1 2 Total0 0 (000) 1(100 00) 0 (000) 1(100 00)1 0(0 00) 0 (000 ) 0 (000) 0 (000)
Total 0(0 00) 1(100 00) 0(0 00) 1(100 00)
APP=1Freq(%)WC RS
0 1 2 Total0 0 (000) 1(100 00) 0(0 00) 1(100 00)1 0 (000) 0 (000) 0 (000) 0(0 00)
Total 0(0 00) 1(100 00) 0(0 00) 1(100 00)
APP=2Freq(%)WC RS
0 1 2 Total0 1 (14 29) 3 (42 86) 1 (14 29) 5 (71 43)1 0 (0 00) 1 (14 29) 1 (14 29) 2 (28 57)
Total 1(14 29) 4(57 14) 2(28 57) 7(100 00)
APP=3Freq(%)WC RS
0 1 2 Total0 0(0 00) 1(100 00) 0(0 00) 1(100 00)1 0 (0 00) 0 (0 00) 0 (0 00) 0 (0 00)
Total 0(0 00) 1(100 00) 0(0 00) 1(100 00)
Table 78
130

3.3.3.5 Relationship between approximation, word-coinage and restructuring
The three-way distribution indicates how RS relates to WC while controlling APP
and also how the three vanables relate to one another There is only one instance in
Group A where all three vanables are equal to zero and there is only one instance
where APP=0, RS=1 and WC=2 This indicates that it is unlikely that subjects in
this group will use restructuring and word coinage without also using
approximation When subjects in Group A use restructuring and word coinage as
communication strategies, they also use approximation As APP increases there is no
preference to use either of the other two vanables For example, when APP=1, it is
more likely that subjects will use word-coinage whereas when APP=2, subjects are
more likely to use restructunng and word-coinage is not used whatsoever
However, when APP=3, there is one instance where W O l and there are no
instances of the use of restructunng When APP=4, there is one instance where
RS=0 and WC=1 and there is equally one instance where WC=0 and RS=1 In
Group A’s performance o f this task, when there are high frequencies of
approximation, there are very low frequencies of both restructuring and word
coinage, implying that as approximation increases, it seems to become mdependent
of the other two vanables
The three-way frequency distribution for Group B indicates that in the absence of
approximation (APP=0), the use of word-coinage as a strategy does not exist and
there is a very low frequency of restructunng (RS=1) When approximation does
take place (eg APP=1), this situation is not affected As the use of approximation
131

increases further, the use of restructuring increases substantially Word-coinage is
now employed at a lower frequency (WC=1) A difference can therefore be
observed between these results and those of Group A In the latter case, it was
established that as approximation increases, there is no particular preference for the
variables of WC and RS In Group B, when restructuring increases, the frequency
of word-coinage remains unaffected As approximation increases above the
threshold level of APP=2, word-coinage decreases to zero and restructuring falls to
a frequency of RS=1 At that point, the overall row and column percentages are all
100% m cell (1,0) In summary, as Group B’s use of approximation increases, so
also does its use of restructuring and word-coinage (word coinage to a lesser
extent) High levels of approximation affect the instances o f word-coinage and
restructuring m that word-coinage does not exist and there is a very low frequency
of restructuring Like the case of Group A, as approximation increases, it becomes
independent of the other two variables
3.3.4 Use of Message-Adjustment strategies
GROUPA GROUPBMessage-Adjustmentstrategies
Topic Avoidance 7 (5 00%) 11 (11 95%)
Message Abandonment 7 (5 00%) 5 (5 43%)
Message Reduction 12 ( 8 57%) 12(13 04%)
Total 26 (18 57%) 28 (30 43%)
Table 79
132

Table 79 provides evidence that a greater number of Message-Adjustment strategies
is used by Group B Group A uses 18 57% of the total number while Group B uses
30 43% When subjects in Group B are communicating in the L2 they frequently
avoid expressing or express with less precision what they had intended to
communicate or they abandon the message m mid-stream Analysis o f transcribed
tape-recordings of the exercise in the LI leads to this conclusion With the
exception of just two subjects in the less proficient group, the subjects m the higher
proficiency group provide more comprehensive answers containing greater detail
This accounts for the frequent use of Message-Adjustment strategies It can be
inferred from the length and detail of their messages that they have to adjust them
more often m order to accommodate the L2 knowledge which they have at their
disposal
Table 79 indicates that Group B employs the strategies of topic avoidance and
message reduction to a greater extent than Group A Table 62 shows that the
subjects in Group B who use most Message-Adjustment strategies (frequency of six)
use very few strategies from the other two categories This is not the case with
Group A where one notes from Table 61 that the subjects who use the highest
frequency of Message-Adjustment strategies (i e four) also use an adequate amount
of strategies from the other categories
133

Testing the hvootbesis Ho that there is no difference between the croups in their use ofMessaee-Adiustment strategies in Task 3
Mann-Whitncv U-test 0 05 significance level 0 0 1 significance levelz= - 1 05 - 1 96 < z < 1 96 - 2 58 < z < 2 58
Kruskal-Wallis H-test 0 05 significance level 0 0 1 significance levelH= 1 28
Student t-distnbution
H < 3 84
0 05 significance level
H < 6 63
0 0 1 significance levelt = - 1 3339 - 2 07 < t < 2 07 -281 < t < 2 81
Table 80
The results of the tests indicate that in their performance of Task 3, there is no
difference between the groups in their use of Message-Adjustment strategies and there
is a 95% confidence level that this is the case
USE OF INDIVIDUAL MESSAGE-ADJUSTMENT STRATEGIES -TASK 3
GROUP A (n=15)
SUBJECT TA MA MR
1 0 0 0
2 0 0 1
3 0 2 2
4 0 1 1
5 0 0 0
6 1 2 0
7 0 0 0
8 0 0 1
9 0 0 110 1 0 111 4 0 012 0 0 0
13 0 1 114 0 0 215 1 1 2
TA. Topic Avoidance MA. Message Abandonment MR Message Reduction
Table 81
134

USE OF INDIVIDUAL MESS AGE-ADJUSTMENT STRATEGIES -TASK 3
GROUP B (n=1 0 )
SUBJECT TA MA MR
1 1 0 0
2 2 0 2
3 0 1 0
4 2 3 1
5 3 0 36 0 0 0
7 1 0 1
8 0 0 0
9 1 1 1
1 0 1 0 4 TA Topic Avoidance MA Message Abandonment MR Message Reduction
Table 82
ONE-WAY FREQUENCY TABLE OF MESSAGE-ADJUSTMENT STRATEGIES -TASK 3 GROUPA
TA Freq Percent Cumul.Freq Cumul Percent
0 11 73 3 11 73 31 3 20 0 14 93 34 1 6 7 15 100 0
MA0 10 66 7 10 66 71 3 20 0 13 86 72 2 133 15 1000
MR0 6 40 0 6 40 01 6 40 0 12 80 02 3 20 0 15 100 0
Table 83
135

ONE-WAY FREQUENCY TABLE OF MESSAGE-APJUSTMENT STRATEGIES -TASK 3 GROUPB
TA Freq Pen. enl Cumul Freq Cumul Percent
0 3 30 0 3 30 01 4 400 7 70 02 2 20 0 9 90 03 1 10 0 10 100 0
MA0 7 70 0 7 70 01 2 20 0 9 90 03 1 10 0 8 100 0
MR0 4 400 4 4001 3 30 0 7 70 02 1 10 0 8 80 03 1 10 0 9 90 04 1 10 0
Table 84
10 100 0
3.3.4.1 Use of Topic Avoidance
Topic avoidance is used over twice as often by Group B It constitutes 11 95% of
their communication strategies compared with 5 00% m the case of Group A The
frequency distribution shows that 73 3% of subjects in Group A do not use topic
avoidance whereas only 30% of subjects m Group B do not use the strategy
However, one subject m Group A (Subject 11) uses topic avoidance on four occasions
This particular subject does not employ any other Message-Adjustment strategies The
remaining subjects in Group A who use topic avoidance do so on just one occasion
The majority of subjects m Group B (40%) use topic avoidance on only one occasion
3.3.4.2 Use of Message Abandonment
One notes from Table 79 that message abandonment is employed m almost equal
percentages by both groups This strategy forms 5 00% of Group As total number of
strategies and 5 43% of Group B’s total Tables 83 and 84 indicate that 33 3% of
subjects in Group A and 30% of Group B employ message abandonment Almost
136

stmilar proportions of subjects in both groups start to convey a particular message in
the L2 but are unable to complete it successfully and they just give up without trying to
convey the message in a different way However, only 13 3% of Group A and 10% of
Group B use message abandonment on more than one occasion Therefore, it is not a
frequent strategy for either group in the performance of Task 3
3.3.4.3 Use of Message Reduction
8 57% of Group A’s and 13 04% of Group B’s communication strategies are attributed
to message reduction The more-advanced subjects use the strategy more frequently
than their less-advanced counterparts but this difference results from the fact that two
subjects m Group B use the strategy on more than two occasions whereas no subject in
Group A does so However, the same percentage of subjects in both groups do not
use message reduction (40%) In any case, the strategy o f message reduction is the
preferred Message-Adjustment strategy of the two groups with 20% of subjects in
Group A and 30% of subjects m Group B using it on more than one occasion m the
completion of Task 3
TWo-way frequency distribution of MR by TA - Task 3 Group A
MRfrequencypercent
TA0
1 4 Total
0 4 1 1 626 67 6 67 667 40 00
1 5 33 33 1 0 66 67 000 40 00
2 2 1 0 313 33 6 67 000 20 00
Total 11 3 1 1573 33 20 00 6 67 100 00
Table 85
137

Two-way frequency distribution of MR by TA - Task 3
Group B
MRfrequencypercent
TA0
1 2 3 Total
0 3 1 0 0 430 00 10 00 0 00 0 00 4000
1 0 2 1 0 30 00 20 00 10 00 000 30 00
2 0 0 1 0 10 00 0 00 10 00 000 10 00
3 0 0 0 l 10 00 000 000 10 00 10 00
4 0 1 0 0 10 00 10 00 0 00 000 10 00
Total 3 4 2 1 1030 00 40 00 20 00 10 00 100 00
Table 8 6
3.3.4.4 Relationship between message reduction and topic avoidance
In the two-way frequency distribution of MR by TA for subjects in Group A, it is
evident that when one of the strategies is used, it is unlikely that the other will be used
High instances of either topic avoidance or message reduction do not exist and when
they do, the frequency is very low The column percentage for TA=0 indicates that
73 33% of subjects m Group A do not employ topic avoidance It is evident that
message reduction is used more often but it is never at a frequency greater than two
On the other hand, there is one instance where TA=4 When this happens, MR=0
Therefore, at the highest level of TA, MR is not used As TA increases, it becomes
independent of the MR variable
In the performance o f Group B, the two-way distribution shows that m overall
percentage terms, subjects use slightly more topic avoidance than message reduction
However, there are no instances of TA=4 while there is one instance of MR=4 It is
138

evident that as TA increases, so also does MR, which suggests that use of either one is
dependent on the other There is a high correlation between the two variables
Three-way frequency distribution of MA by MR controlling for TA -Task 3
Group A
TA=0 Freq (%)
TA lFreq (%)
MA MR MA MR0 1 2 Total 0 1
0 4(36 36) 3 (27 27) 1(9 09) 8(72 73 0 0 (0 00) 1 (33 33) 0(0 00)1 0(0 00) 2(18 18) 0(0 00) 2(18 18) 1 0 (0 00) 0 (0 00) 1 (33 33)2 0 (0 00) 0(0 00) 1 (9 09) 1 (9 09) 2 1 (33 33) 0 (0 00) 0 (0 00)
Total 4 (36 36) 5 (45 45) 2(1818) 11(100 00) Total 1 (33 33) 1 (33 33) 1 (33 33)
2 Total I (33 33)1 (33 33)1 (33 33)3 (100 00)
TA=4Freq (%) MA MR
2 Total
0 1 (100 00) ° ( 00°) 0(0 00) 1 (100 00)1 0 (0 00) 0 (0 00) 0(0 00) 0(0 00)2 0 (0 00) 0(0 00) 0(0 00) 0 (0 00)
Total 1(10000) 0(0 00) 0(0 00) 1 (100 00)
Group B
TAM) TA=1Freq(%) Freq(%)MA MR MA MR
0 1 Total 0 1 4 Total0 2(6667) 0(0 00) 2(66 67) 0 1 (25 00) I (25 00) 1(25 00) 3 (75 00)1 1 (3333) 0(0 00) 1(33 33) 1 0(0 00) 1(25 00) 0(0 00) 1 (25 00)3 0(0 00) 0(0 00) 0(0 00) 3 0(0 00) 0(0 00) 0(0 00) 0(0 00)
Total 3(10000) 0(0 00) 3 (100 00) Total 1 (25 00) 2 (50 00) 1 (25 00) 4(100 00)
TA=2 TA=3Freq(%) Freq(%)MA MR MA MR
0 1 2 Total 0 3 Total0 0 (0 00) 0(0 00) 1 (50 00) 1 (50 00) 0 0 (0 00) 1(100 00) 1 (100 00)1 0 (0 00) 0(0 00) 0(0 00) 0(0 00) 1 0 (0 00) 0(0 00) 0(0 00)3 0(000) 1 (50 00) 0(0 00) 1 (50 00) 3 0 (0 00) 0(0 00) 0(0 00)
Total 0 (0 00) 1 (50 00) 1 (50 00) 2(100 00) Total 0 (0 00) 1 (100 00) 1(100 00)
Table 87
139

3.3 4 5 Relationship between message abandonment, message reduction and
topic avoidance
The three-way frequency distribution of MA by MR controlling for TA indicates that
when topic avoidance is not employed by subjects m Group A, message reduction is
used to a greater extent than message abandonment However, when TA increases to
TA=1, MA and MR are used in equal proportions as indicated by the row and column
percentages When TA=4, there are no instances o f either MA or MR Therefore, in
the performance of Group A, when there is a high frequency o f topic avoidance,
message abandonment and message reduction are not used at all Above the
threshold of TA=1, topic avoidance becomes independent of the other two variables
Unlike Group A, when subjects in Group B do not use topic avoidance, message
reduction is not employed either and there is just one instance of message
abandonment At TA=1, there is more usage of message reduction than of message
abandonment When TA increases further to TA=2, there is an increase m the use
of message abandonment (MA=3 m one instance) and message reduction
decreases to a frequency of MR=2 As TA mcreases to its highest frequency of
TA=3, MR mcreases once again and MA is not used at all Therefore, in the case
of Group B, when topic avoidance is employed, message reduction is present also
The variables of TA and MR are dependent on one another On the other hand,
the use of message abandonment mcreases up to a threshold of TA=2 and then
declines as TA mcreases further This suggests that as TA mcreases, it becomes
independent of the MA variable This situation differs from that of Group A where
one has seen that above the TA=1 threshold, TA becomes independent of both MA
and MR
140

3 4 P atte rn s of strategy use accord ing to ta sk
This section examines the patterns of strategy use elicited by the different tasks
and investigates whether these patterns vary as a function of the task or whether
learners use the same types of strategies in similar proportions irrespective of
task
Group A Group BN= 15 N=10
Total no Average no Total no Average noof strategies of strategies of strategies of strategies
per subject per subject
Task 1 376 25 07 250 25Task 2 223 14 87 207 20 7Task 3 140 9 33 92 9 2
Table 8 8
Use of Communication Strategies - Group A
Figure 1
141

Use of Communication Strategies - Group B
Figure 2
Use of Communication Strategies - Groups A and B
Task 1 Task 2 Task 3
Figure 3
142
Subjects employ the greatest number of communication strategies m Task 1-
story-retelhng Group A uses 376 strategies - representing an average of 25 07
per subject and Group B uses 250 strategies, an average of 25 per subject In the
performance of this task, the subjects m both groups employ almost the same
average amount of communication strategies
In their performance o f Task 2 - photograph descnption - subjects use less
communication strategies - 223 in the case of Group A and 207 in the case of
Group B In this particular task, subjects m Group B use a greater average
number of communication strategies (20 7 per subject) compared with an average
of 14 87 strategies per subject m the case of Group A
Task 3 - free expression - is the task which elicits the least number o f
communication strategies In this task, subjects in Group A employ 140
strategies while subjects in Group B employ 92 strategies As is the case in Task
1, the two groups use approximately the same average number of strategies per
subject m their performance of Task 3 - Group A employs an average of 9 33
strategies per subject while Group B employs an average of 9 2 strategies per
subject
In this study, the more proficient group uses a greater number of communication
strategies per subject than the less-proficient group m one of the elicitation tasks
(Task 2) and both groups use communication strategies in roughly similar
proportions in the other two tasks
143

3 4 1 Use of Ll/L3-based strategies
USE OF L1/L3-BASEP STRATEGIESliteral Translation Language Switch Foreignising
71 (18 8 8 %) 57 (15 16%) 27 (7 18%)
36(14 4%) 12(4 8 %) 15(6 0%)
58(26 0%) 28(12 56%) 14(6 28%)
40 (19 32%) 14 (6 76%) 27 (13 04%)
51 (36 42%) 10 (7 14%) 6 (4 29%)
26 (28 26%) 5 (5 43%) 2 (2 17%)
Table 89
Use of Ll/L3-based strategies - Task 1
LTA LS FRN
Figure 4
Task 1
Group A
Group B
Task 2
Group A
Group B
Task 3
Group A
Group B
Total
155 (41 22%)
63 (25 2%)
100 (44 84%)
81 (39 13%)
67 (47 8 6 %)
33 (35 8 6 %)
144

Use of Ll/L3-based strategies - Task 2
30 00%-
25 00%-
2000%
15 00%-
1000%
500%
000%LTA LS FRN
Figure 5
Use o f Ll/L3-based strategies
40 00% ^
3500%
3000%
2500%
2000%1500%
1000%500%
000%LTA LS FRN
Figure 6
■ GROUPA DGROUP B
Task 3
■ GROUPA■ GROUP B
145

Ll/L3-based strategies are used to a lesser extent by both groups in Task 1-
41 22% of the total number of communication strategies in the case of Group A
and just 25 2% of the total in the case of Group B Group A's greatest use of
L1/L3-based strategies is in Task 3 (47 86%) whereas Group B's greatest use is in
Task 2 (39 13%) However, there is not a significant difference m Group A's use
of Ll/L3-based strategies across the three tasks - 41 22% in Task 1, 44 84% in
Task 2 and 47 86% in Task 3 On the contrary, Group B uses significantly less
Ll/L3-based strategies in Task 1 (25 2%) compared with 39 13% m Task 2 and
35 86% in Task 3
3 4.1.1 Use of Literal Translation
i
Use of Literal Translation (%)
GROUPA GROUPB
Task 1 18 8 8 % 14 4%
Task 2 26 0 0 % 19 32%
Task 3 36 42% 28 26%
Table 90
Literal translation is the Ll/L3-based strategy most frequently used by both
groups in all three elicitation tasks However, the tables indicate that task
influences the amount of literal translation employed by the two groups Literal
translation is used m Task 3 by both groups almost twice as much as in Task 1
146

Although there is a much lower total number of communication strategies used by
both groups in Task 3, it seems that there is a much greater tendency to employ
the strategy of literal translation There is also greater use of literal translation in
Task 2 compared with Task 1 but the difference is not as marked as the difference,
between Ta^ks 1 and 3 The difference between the two groups in the use of
literal translation is less significant in Task 1 - it accounts for 18 88% of Group
A's communication strategies and for 14 4% of those employed by Group B In
all three tasks, Group A uses more literal translation than Group B The largest
percentage difference between the groups for use of this strategy is m the
performance of Task 3
3.4.1.2 Use of Language Switch
Use of Language Switch (%)
GROUPA GROUPB
Task 1 15 16% 4 8 %
Task 2 12 56% 6 76%
Task 3 7 14% 5 43%
Table 91
Group A's use of language switch is task dependent The highest instance of use
of this strategy by the group is in the performance of Task 1 (15 16%) This
decreases to 12 56% m Task 2 and the lowest instance is in Task 3 (7 14%) On
the other hand, there is not a significant difference m the pattern of language
switch use by Group B across the three tasks Task 2 records the highest instance
of use of this particular strategy (6 76%) followed by Task 3 with a 5 43% usage
147
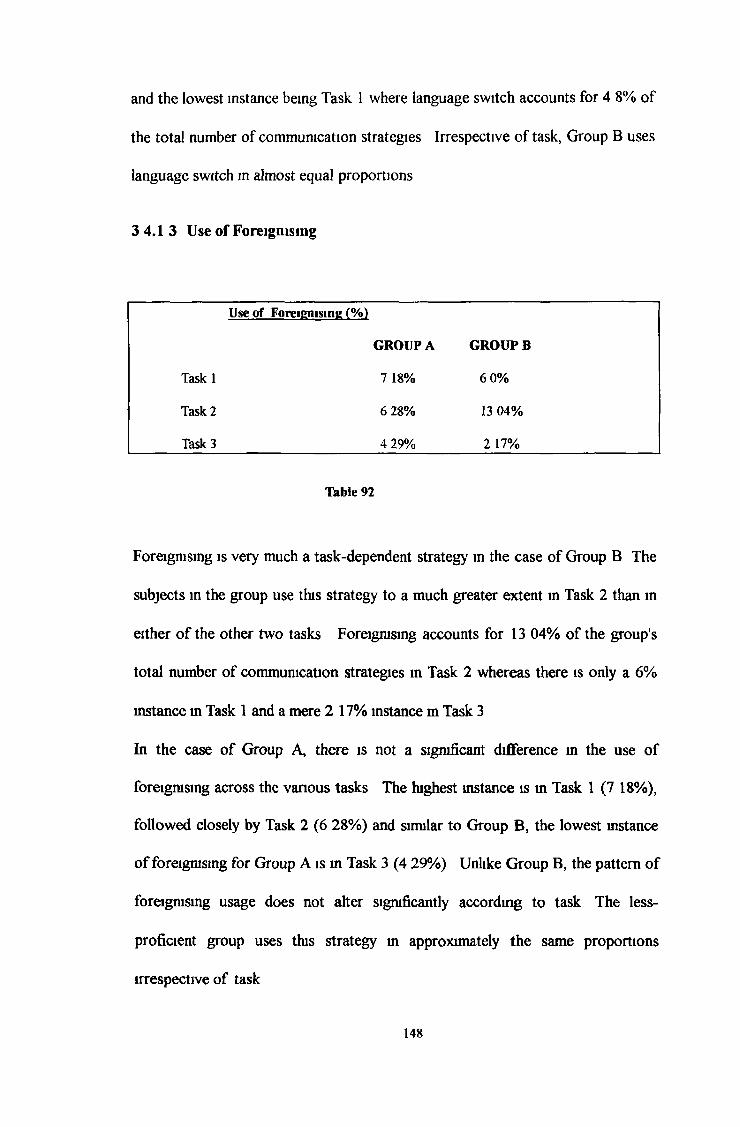
and the lowest instance being Task 1 where language switch accounts for 4 8% of
the total number of communication strategies Irrespective of task, Group B uses
language switch in almost equal proportions
3 4.1 3 Use of Foreignising
Use of Foreienisine (%)
GROUPA GROUP B
Task 1 7 18% 6 0 %
Task 2 6 28% 13 04%
Task 3 4 29% 2 17%
Table 92
Foreignising is very much a task-dependent strategy in the case of Group B The
subjects in the group use this strategy to a much greater extent in Task 2 than in
either of the other two tasks Foreignising accounts for 13 04% of the group's
total number of communication strategies in Task 2 whereas there is only a 6%
instance m Task 1 and a mere 2 17% instance m Task 3
In the case of Group A, there is not a significant difference in the use of
foreignising across the various tasks The highest instance is in Task 1 (7 18%),
followed closely by Task 2 (6 28%) and similar to Group B, the lowest instance
of foreignising for Group A is in Task 3 (4 29%) Unlike Group B, the pattern of
foreignising usage does not alter significantly according to task The less-
proficient group uses this strategy in approximately the same proportions
irrespective of task
148

3 4 2 Use of L2-based strategies
Task 1
USE OF L2-BASED STRATEGIESParaphrase Approximation Word-Coinage Restructuring Total
Group A 1 (0 27%) 85 (22 61%) 46 (12 23%) 23 ( 6 12%) 155 (41 22%)
Group B 0 (0 %) 53 (21 2%) 31 (12 4%) 32 (12 8 %) 116 (46 4%)
Task 2
Group A 0 (0% ) 40 (17 94%) 19 (8 52%) 8 (3 59%) 67 (30 05%)
Group B 5 (2 42%) 41 (19 81%) 21 (10 14%) 11(5 31%) 78 (37 6 8 %)
Task 3
Group A 1 (0 71%) 29 ( 2 0 71%) 7 (5 0%) 10 (7 14%) 47 (33 57%)
Group B 0 (0% ) 18 (19 56%) 2 (2 17%) 11 (11 95%) 31 (33 69%)
Table 93
149

Use of L2-based strategies - Task 1
25 00%
20 00%
1500%
1000%
5 00%
0 00%
I GROUPA iGROUPB
Figure 7
Use of L2-based strategies - Task 2
■ GROUPA □ GROUPB
Figure 8
150

Use of L2-based strategies - Task 3
25 00%i
20 00%
1500%
10 00%
500%
0 00%
Figure 9
■ GROUPA
□ GROUPB
The usage of L2-based strategies by both groups vanes according to task The
two groups use more L2-based strategies in their performance of Task 1-41 22%
in the case of Group A and 46 4% m the case of Group B However, the least
amount of L2-based strategies used by Group A occurs in Task 2 (30 05%) while
Group B uses the least amount of L2-based strategies in Task 3 (33 69%) In
Task 3, both groups use approximately equal proportions of L2-based strategies
151

3 4.2 1 Use of Paraphrase
Use of Paraphrase (%)
GROUPA GROUP B
Task 1 0 27% 0 %
Task 2 0 % 2 42%
Task 3 0 71% 0 %
Table 94
Paraphrase is not a strategy which either of the two groups employ in their target
language communication In fact, Group B who is deemed to be the more
proficient group only uses paraphrase in Task 2 and even then, only five instances
are recorded (2 42%) This group does not use paraphrase in Tasks 1 and 3
On the contrary, Group A's performance records one instance of paraphrase m
both Tasks 1 and 3 (0 27% and 0 71% respectively) but there are no instances of
the strategy m Task 2
3.4.2.2 Use of Approximation
Use of ADoroximatioii (%}
GROUPA GROUPB
Task 1 2 2 61% 2 1 2 %
Task 2 17 94% 19 81%
Task 3 20 71% 19 56%
Table 95
152

Approximation is the L2-based strategy most commonly employed by both
groups in all of the elicitation tasks Irrespective of task, approximation is the
preferred L2-based strategy of all the subjects In fact, there is no significant
percentage difference m the use of this particular strategy by either group across
the various elicitation tasks The highest instance for both groups is in Task 1 -
22 61% for Group A and 21 2% for Group B There is virtually no difference
between Tasks 2 and 3 in Group B's use of approximation -19 81% in the case of
the former task and 19 56% in the case of the latter The percentage use of
approximation by Group A in Task 3 is 20 71% and the lowest instance for this
group is 17 94% in Task 2
3.4 2.3 Use of Word-Coinage
Use of Word-Coinaee(%)
GROUP A GROUP B
Task 1 12 23% 12 4%
Task 2 8 52% 10 14%
Task 3 5 0% 2 17%
Table 96
The use o f word-cotnage is task-dependent as it is used more frequently m Tasks
1 and 2 but is rare in Task 3 Both groups use this strategy in relatively the same
proportions m Task 1 - 12 23% in the case of Group A and 12 4% in the case of
Group B In Task 2, there is not a significant difference between the two groups
m their use of word-coinage - Group A (8 52%) and Group B (10 14%)
153

However, in the performance of Task 3, word-coinage is a very rare strategy for
Group B, with only two instances (2 17%) recorded In the same task, seven
instances of the strategy are recorded for Group A representing just 5% of the
total number of communication strategies employed in the task
3.4 2 4 Use of Restructuring
Use of Restructuring (%)
GROUP A GROUPB
Task 1 6 1 2% 12 8 %
Task 2 3 59% 5 31%
Task 3 7 14% 11 95%
Table 97
Restructuring is used by Group A in almost the same proportions m Tasks 1 and 3
- 6 12% and 7 14% respectively It is used to a lesser extent in Task 2 (3 59%)
However, across the three elicitation tasks, it is not a particularly popular choice
of strategy for subjects m the less-advanced group Like Group A, restructuring is
used m almost similar proportions by Group B in Tasks 1 and 3 (12 8% and
11 95% respectively) - over twice as much as in Task 2 (5 31%) Group B
resorts to restructuring more often than subjects m Group A In its performance
of Task 2, neither group tends to use restructuring as a coping mechanism when
faced with communication difficulties in the target language
154

USE OF MESSAGE-APJUSTMENT STRATEGIES
Topic Avoidance Message Abandonment Message Reduction
Task 1
Group A 16 (4 26%)
Group B 2 1 ( 8 4%)
Task 2
Group A 12 (5 38%)
Group B 28 (13 53%)
Task 3
Group A 7 (5 0%)
Group B 11(1195%)
Table 98
3 4 3 Use of Message-Adjustment strategies
18 (4 79%)
19 (7 6 %)
21 (9 42%)
7 (3 38%)
7 (5 0%)
5 (5 43%)
32(8 51%)
31(12 4%)
23 (10 31%)
13 (6 28%)
12 ( 8 57%)
12 (13 04%)
Use of Message-Adjustment strategies - Task 1
TA MA MR
Figure 10
Total
6 6 (17 56%)
71 (28 4%)
56 (25 11%)
48 (23 19%)
26 (18 57%)
28 (30 43%)
155
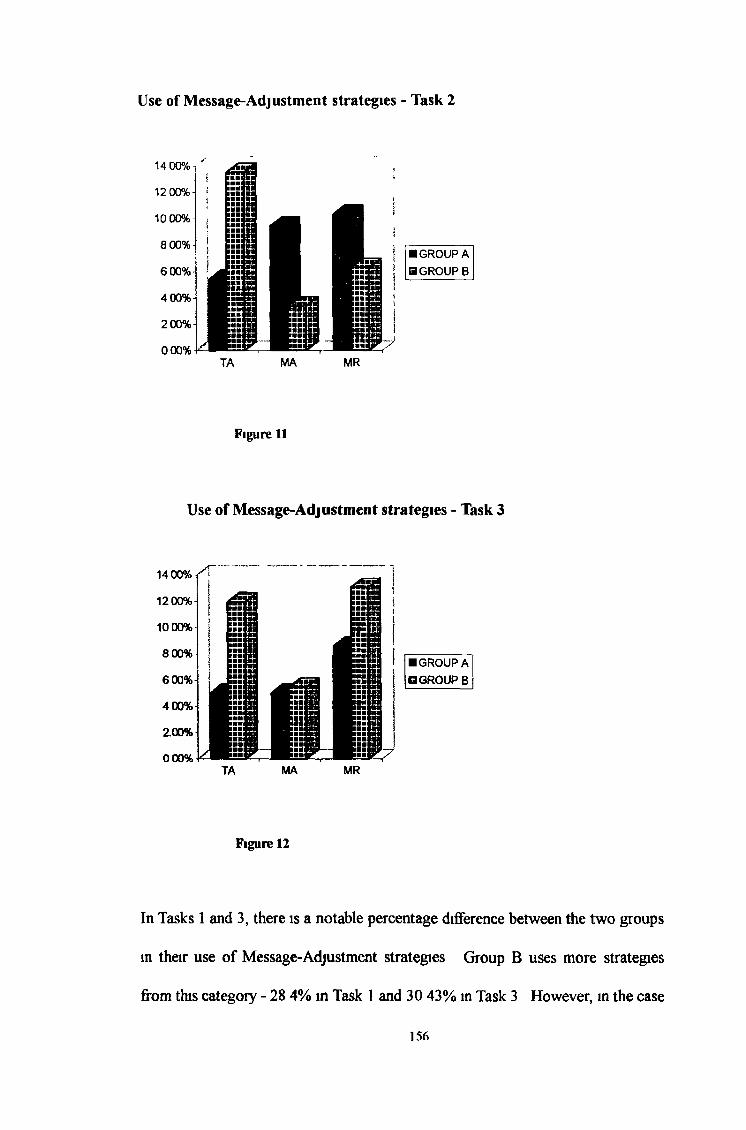
Use of Message-Adjustment strategies - Task 2
Figure 11
Use of Message-Adjustment strategies - Task 3
Figure 12
In Tasks 1 and 3, there is a notable percentage difference between the two groups
in their use of Message-Adjustment strategies Group B uses more strategies
from this category - 28 4% m Task 1 and 30 43% m Task 3 However, m the case
156

of this group, the three tasks do not elicit a significant difference in pattern of
Message-Adjustment strategy use as 23 19% of strategies employed in Task 2
belong to this category
Although employing Message-Adjustment strategies to a lesser extent, Group A's
performance in Tasks 1 and 3 indicates a similar pattern in Message-Adjustment
strategy use - Task 1 (17 56%) and Task 3 (18 57%) Subjects in Group A use
this category of strategy in generally the same proportions in these particular
tasks However, they use Message-adjustment strategies more frequently m Task
2 (25 11%) In fact, both groups use Message-Adjustment strategies in almost
similar proportions m Task 2 whereas there is a significant difference between the
two groups m their use of these strategies m Tasks 1 and 3 with Group B using a
considerably greater percentage of same
3.4.3.1 Use of Topic Avoidance
Use of Tome Avoidance (%)
GROUP A GROUPB
Task 1 4 26% 8 4%
Task 2 5 38% 13 53%
Task 3 5 0% 11 95%
Table 99
Group A uses topic avoidance m almost equal proportions irrespective of task
while Group B uses this strategy in almost similar percentages in Tasks 2 and 3
but to a lesser degree in Task 1 Group B employs topic avoidance more
157

frequently than Group A in all three elicitation tasks The highest usage for both
groups is in Task 2 - 5 38% for Group A and 13 53% for Group B - although, as
already stated, Group A’s proportional usage of the strategy in the other tasks is
quite similar
3 4.3 2 Use of Message Abandonment
Use of Mcssaee-Abandonmcnt (%)
GROUPA GROUPB
Task 1 4 79% 7 6 %
Task 2 9 42% 3 38%
Task 3 5 0% 5 43%
Table 100
Message abandonment is used by Group A m approximately similar proportions
in Tasks 1 and 3 - 4 79% and 5 00% respectively The group uses this strategy
more frequently m Task 2 (9 42%)
On the other hand, Group B uses message abandonment less frequently in Task 2
(3 38%) and usage of this strategy increases to 5 43% in Task 3 with the highest
usage m Task 1 (7 6%) Overall, there is not really a significant task-related
difference in the use of message abandonment by subjects in Group B
158

3 4.3 3 Use of Message Reduction
Use of Message-Rcductionf %)
GROUP A GROUP B
Task 1 8 51% 12 4%
Task 2 10 31% 6 28%
Task 3 8 57% 13 04%Table 101
Message reduction is used by Group A in very similar proportions m Tasks 1 and
3 - 8 51% and 8 57% respectively There is a slight but not particularly
significant increase in the use of this strategy in Task 2(10 31%)
Group B uses message reduction m relatively similar proportions in Tasks 1 and
3 , - 1 2 4% and 13 04% respectively In fact, message reduction is used in these
tasks approximately twice as much as in Task 2 (6 28%)
It is noteworthy that the lowest percentage use of message reduction for Group B (in
Task 2) corresponds to the highest percentage use for Group A It is only in Task 2
that Group B uses less message reduction than Group A whereas the other two tasks
elicit greater use of message reduction on the part of Group B
Conclusion
In this chapter, the analysis o f the data elicited from the elicitation tasks has been
presented and the use o f communication strategies according to proficiency level and
task has been established A discussion of the results obtained in order to arrive at the
conclusions and recommendations of the study will form the basis of the subsequent
chapters
159
4. Discussion of Results
The conclusions arising from this research provide a significant contribution to the
existing debate on the strategies of communication and their place in second-
language acquisition In this section, it is proposed to outline the overall findings
of the study and to relate them to the results obtained by other researchers Some
of the pedagogical implications of the research findings are discussed and
suggestions are made for further research m the area
In the first part of this section, the use of L2-based strategies according to
proficiency level will be discussed This will be followed by an examination of use
of Ll/L3-based strategies according to proficiency level Included m the latter
sub-section will be a discussion of the effects of prolonged exposure to the L2, use
of L1/L3 strategy markers and the typological closeness of the LI and the L2 The
third sub-section will deal with the use of Message-Adjustment strategies
according to proficiency level while the final sub-section will discuss the
relationship o f task to strategy use
The final part of the chapter investigates the pedagogical implications of the
research results emphasising in particular the existing debate relating to the
development of strategic competence among learners and the important
contribution of the L1/L3 in this development
160

The assumption is often made that more proficient learners will use more L2-based
strategies The evidence in the study suggests that higher-proficiency learners do
not use significantly more L2-based strategies than lower-proficiency learners In
Task 1, L2-based strategies account for 41 22% of the strategies of communication
employed by Group A while L2-based strategies represent 46 4% of Group B's
communication strategies In Task 2, L2-based strategies constitute 30 05% of Group
A's communication strategies and 37 68% of Group B's strategies are L2-based
Both groups use approximately the same proportions of L2-based strategies in
Task 3 - Group A (33 57%) and Group B (33 69%)
This finding seems to concur with that of Haastrup and Philipson (1983) who
discovered m their study of achievement strategies in learner/native speaker
interaction (English being the TL in question) that more proficient learners did not
rely on L2-based strategies as had been anticipated "We were quite surprised that
most o f our learners made frequent use of LI-based strategies, as one might expect
that learners, after five years of English teaching, would rely more on IL-based
strategies" (Haastrup and Phillipson 1983 154)
One can only hypothesise about the reasons why there is not a significant
difference between the higher and lower proficiency subjects of the present study in
their use of communication strategies and why the higher proficiency learners do
not demonstrate a greater ability to employ L2-based strategies instead of
remaining fixed in Ll/L3-based linguistic behaviour The subjects are not language
students per se They have undertaken to study a Business Studies course and
have chosen to study French as an elective subject within the general programme
4.1 Use o f L2-based strateg ies accord ing to proficiency level
161

Their motivation for language learning must inevitably be less than that of a student
who is specialising in thestudy of a foreign language
4.1 1 Use of specific L2-based strategies
4.1 11 Paraphrase
Examining specific L2-based strategies, it is generally assumed that more proficient
learners would resort to the use of paraphrase as a strategy when faced with
communication difficulties in the target language Tarone (1977) and Bialystok
(1983), in their respective studies on the use of strategies of communication put
forward the suggestion that more advanced learners use paraphrase more
frequently than less advanced learners This particular finding is contradicted m the
present study The evidence presented m this study indicates that the advanced
learners do not employ the strategy of paraphrase in their L2 communication The
more proficient group uses paraphrase m a total of five instances, all in the
performance o f Task 2 The subjects in the group do not use the strategy in the
other elicitation tasks Group A uses paraphrase on two occasions - once in Tasks
1 and 3 respectively Therefore, the less proficient group is just as likely to use
paraphrase
This finding challenges the assumption that the more proficient learner of the L2
will use L2-based strategies to cope with difficulties when communicating in the
target language Similar findings emerged from a case study of transfer in the L2
production o f an advanced learner of French (Ridley 1991) The subject of her case
study relied on LI-based strategies when speaking the L2 and she did not use any
L2 paraphrase m her oral performance despite having spent six months in France
162

Ridley observes "this finding raises the question whether we can assume that the
more proficient a learner is in terms of knowledge of a language's grammatical
system, the more likely it is that the learner will use L2-based strategies (for
instance L2 paraphrase) as a device to cope with lack of lexical knowledge"
(Ridley 1991 42-43)
4.1 1*2 Approximation
The most frequently employed L2-based strategy of both groups is approximation
As already stated, there is no significant percentage difference m the use of this
strategy by the subjects in each of the elicitation tasks When faced with a gap in
their L2 lexical knowledge, subjects find it easier to find a word in the L2 with as
close a meaning as possible in order to maintain communication. Subjects of both
proficiency levels demonstrate similar ability to use approximation One would
presume that the more proficient learners would use this strategy much more
frequently than their less-advanced counterparts
4.1.1.3 Word-comage
Both groups also demonstrate similar behavioural patterns in relation to the use of
word-coinage They use this strategy in almost similar proportions in Tasks 1 and 2
but for both groups, its use is quite rare in Task 3
4.1.1.4 Restructuring
The only difference between the two groups in their use of L2-based strategies is in
their respective use o f restructuring Group B demonstrates a greater reliance on
restructuring as a means of coping with difficulties of communication in the L2
163

The more advanced subjects seem to be more willing to develop an alternative plan
and can phrase the sentence in another way so as to overcome the hiatus in
communication
4.2 Use of Ll/L3-based strategies
The findings of this study indicate that the more proficient subjects remain
entrenched m L1/L3 linguistic behaviour despite more exposure to the target
language This phenomenon is particularly prevalent in their performance of Tasks
2 and 3 where Ll/L3-based strategies are employed m greater percentages than
L2-based strategies Moreover, one also notes that there is no significant
difference between the two proficiency levels in their use of Ll/L3-based strategies
m Tasks 2 and 3 Group B is just as likely to use Ll/L3-based strategies as Group
A and the statistical procedures confirm this According to the Student t-test, the
Mann-Whitney U-test and the Kruskal-Wallis H-test, there is no difference between
the groups m their use of Ll/L3-based strategies in Tasks 2 and 3 However, one
does note a difference between the groups m their use of this category of strategy
m Task 1 In this particular task, Group B uses significantly less Ll/L3-based
strategies than Group A Despite the fact that performance on this task represents
Group As lowest percentage of Ll/L3-based strategy use (41 22%), there is a
considerable dichotomy with the performance of Group B (25 2%)
In fact, as already noted, Task 1 represents the least utilisation of the L1/L3 for
both groups which is unusual considering that this task required the longest and
most detailed answer One might have presumed that subjects would resort more
frequently to the native or other non-target languages m this task given that there
164

was a requirement to provide a greater amount of L2 structures with the likelihood
being that the more L2 structures to be recalled the more chance of L1/L3
structures being activated
It must also be noted that Group A, while being the lower proficiency group in this
study, have been learners of the L2 for a period of at least five years at second
level In spite of this fact, their linguistic behaviour m the L2 remains very much
rooted m their L1/L3 Not less than 41% of their total communication strategies
are L1/L3 based
4 2 1 Use of Specific Ll/L3-based strategies
4.2 1.1 Literal Translation
Literal translation is the most frequently employed Ll/L3-based strategy of both
groups in all three elicitation tasks This finding concurs with the conclusions of
Blum-Kulka and Levenston (1983 132) which indicate that “all second language
learners begin by assuming that for every word in their mother tongue there is a
single translation equivalent in the second language”
In the present study, it has been observed that literal translation is task-dependent
Both groups use this strategy in significant percentages m Task 3 - Group A
(36 42%) and Group B (28 26%) whereas m Tasks 1 and 2, it is used to a lesser
extent by the two groups In Task 3, literal translation is the most utilised
individual communication strategy of both groups and it is Group As most
preferred individual strategy in its performance o f Task 2 (26%)
165

Group A has a greater tendency than Group B to employ the strategy of language
switch The less proficient learners are more inclined to switch directly to the LI
or L3 by borrowing an item from same The more proficient learners are not
immune to using this strategy in their attempts to overcome communication
difficulties It has been observed that language switch is used by Group B in all
three tasks albeit in lesser percentages than Group A
4.2.1.3 Foreigmsing
Both groups employ foreigmsing in the three tasks with Group A using slightly
more in Tasks 1 and 3 However, there is a significant difference between the two
groups m Task 2 with the more proficient group using foreigmsing over twice as
often as the less proficient group In this task, foreigmsing accounts for 13 04% of
the total number of communication strategies recorded for Group B whereas this
strategy constitutes just 6 28% of Group As communication strategies Although
the more proficient learners are not as inclined as their less proficient counterparts
to switch directly to an L1/L3 form, they tend to use an L1/L3 form and adapt it to
make it appear like an L2 form They are just taking the strategy of language
switch one step further and are nevertheless still relying on the L1/L3 to make up
for their linguistic deficiencies in the L2
4.2.2 Use of LI Strategy Markers
Throughout their performance of the tasks, there is evidence of self-correction,
false starts and repetition among the subjects m both groups Subjects generally
utilise the automated LI fillers MemH or "uh when attempting to gain planning time,
4 2 1.2 Language switch
166

instead of making use of the French drawl in the same way as the native speakers
who also completed the task The French drawl is a strategy used by native
speakers themselves to acquire planning time in oral communication The subject
who has spent one year in France does employ the drawl m her L2 communication
indicating that the greater exposure to the L2 enables her to use the strategy which
could be considered to be L2-based although not specifically referred to in the
taxonomy
4.2.3 Specific linguistic problems due to L1/L3 influence
It was observed that the use of the past tense in French posed problems for
subjects in both groups Subjects in both proficiency groups have difficulties in
manipulating the Passe Compose (one of three forms of past tense in the French
language) More specifically, they continually use the auxiliary verb "avoir" (to
have) with the past participle even though a small minority of verbs require the use
of the verb "être" (to be) This could be overgeneralisation of the L2 rules or
perhaps could be attributed to the fact that in English the auxiliary verb "to have" is
always used with the past participle This constitutes further evidence o f the
subjects’ reliance on LI rules when communicating in the TL
43 Effects of prolonged exposure to the L2
The performance of one particular subject in the elicitation tasks provides evidence
that prolonged exposure to the target language does not always lead the learner to
rely on L2-based strategies when attempting to communicate in the L2 Although
she has spent one year in France, thus being more exposed to the target language
than the other subjects in the group, her performance in Task 2 indicates only four
167

communication strategies which are L2-based and she only uses two L2-based
strategies in Task 3 On the contrary, she uses ten Ll/L3-based strategies in Task
2 and six of same in Task 3 Her performance in Task 1 reveals ten L2-based
strategies as opposed to nine Ll/L3-based strategies The subjunctive mood,
frequently used by native French speakers, represents a difficulty The fact that this
grammatical structure is rarely used in English may be the reason that she has
difficulty in coping with it This particular subject does not use paraphrase as one
of her L2-based strategies
4.4 Typological difference between the LI and the L2
Choi (1990) in his study of communication strategies in the mterlanguage production of
Chinese EFL learners challenges the notion that learners o f high proficiency depend
more on L2-based communication strategies and low-proficiency learners rely
more on the use of LI-based strategies In his study, no obvious LI-based
strategies were observed "because the hypothesis failed to take into consideration
one important condition the language distance between learners’ LI and
L2 Chinese is quite distant from English This great distance reduces
Chinese learners' tendency to use LI-based CSs because they realise that these
strategies will not work for them” (Chen 1990 177) Chen suggests that the great
typological difference between the learners LI and L2 discourages them from using
LI-based communication strategies
English and French (the two languages referred to m the present study) are
considered to be typologically close languages Hammerly (1991 69) refers to the
fact that “both US and British language-teaching institutions have determined that
168

it takes far longer for an English speaker to reach the same level of proficiency in,
say, Korean than in French”
In this study, perhaps the typological closeness between the subjects’ LI and L2
contributes to their extensive use o f LI-based strategies irrespective of proficiency
levels
Singleton (1987) reporting on mother and other tongue influence on learner
French, suggests that psychotypological factors have a role in language transfer In
other words, the learner’s perception of the distance between the LI and the L2
influences use of the native language in target language communication He states
“the results of this study lend support to the notion that psychotypological factors
have a role in language transfer They also provide a certain amount of evidence in
favour of the view of transfer as a process whereby the learner borrows from
linguistic resources other than his or her knowledge of the language through which
communication is taking place in order to make up for deficiencies m that
knowledge”(Singleton 1987 337-338)
4.5 Influence of the L1/L3 on L2 communication
This research provides strong evidence that, irrespective o f language proficiency,
L2 learners are influenced by their native language and other languages of which
they have experience, when communicating in the L2 The evidence has proved
that the more proficient learners m this sample do not use significantly more L2-
based strategies than their less proficient counterparts and are largely unable to use
the strategy of paraphrase m their L2 communication In fact, in two of the
elicitation tasks, the higher-proficiency group uses more L1/L3-based than L2-
169

based strategies Regardless of more exposure to the L2, this group of learners
retain their reliance on their native language and other languages which they have
studied when faced with the task of solving difficulties of communication m the
target language
Hammerly (1991 63 ) poses the question “Is it unreasonable to state that previous
knowledge affects new learning'? Subjective experience, logic and abundant
empirical evidence indicate that it does Transfer - psychologists agree - is a
pervasive phenomenon, not only m language learning but m all learning” He
suggests that “the SL is o f the same basic nature and is used for the same purposes
as the NL Thus, previous knowledge as pervasive and deeply ingrained as that of
the NL is bound to have major effects on the learning of the SL” (p 64)
The present research supports this notion by demonstrating that the subjects rely to3
a considerable extent on their native language and also on other languages with
which they are acquainted when attempting to overcome communicative difficulties
m the target language Even more proficient learners of the L2 depend on L1/L3
resources when faced with an L2 communication lacuna
4.6 Use of Message-Adjustment strategies
This study has also revealed that when subjects attempt to solve L2 communication
difficulties, they often adapt the message to their available linguistic resources In
other words, they have recourse to Message-Adjustment strategies The results
indicate that with the exception of Task 2, the more proficient group employs these
strategies to a greater extent than the lower proficiency group In Task 2, Group
A uses a slightly higher percentage o f Message-Adjustment strategies (25 11%)
170

compared to Group B (23 19%) In Tasks I and 3, Group B relies to a greater
degree on these strategies - Task 1 (28 4%) and Task 3 (30 43%) whereas the
percentages recorded for Group A m Tasks 1 and 3 are 17 56% and 18 57%
respectively These findings indicate that the higher-proficiency learners are more
adept at accommodating the message to suit their linguistic wherewithal in the L2
One could hypothesise that the greater use of Message-Abandonment strategies on
the part of the more proficient learners is attributed to their greater aspiration to
indicate to the interlocutor that they have a good command of the target language
If they adapt the message to suit their linguistic resources, they will not
demonstrate their inadequacies in L2 communication This theory is beyond the
scope of the present research and would need to be investigated in further studies
using personality tests and introspective techniques where subjects could reflect on
their motives and reasoning processes when employing these communication
strategies
One must emphasise that the use of Message-Adjustment strategies does not
necessarily imply that the subjects have failed in their communicative mtent This
usage could also indicate a change m intention rather than a lack of confidence m
their L2 resources
4.6.1 Use of individual Message-Adjustment strategies
4.6.1.1 Topic Avoidance
Investigating the higher-proficiency group’s use of individual strategies withm the
category of Message-Adjustment strategies, one observes that it has a considerable
tendency to employ the strategy of topic avoidance Corder defines this as“ a
171

refusal to enter into or continue a discourse within some field or topic because of a
feeling of total linguistic inadequacy” (Corder, 1981 105) In Task 2, topic
avoidance accounts for 13 53% of Group B’s total number of communication
strategies whereas in the case of Group A, 5 38% of the strategies employed are
attributed to topic avoidance In Tasks 1 and 3, Group B also uses topic avoidance
more frequently In Task 1, it constitutes 8 4% of their strategies compared to
4 26% for Group A and in Task 3, there is a significant difference between the two
groups with topic avoidance accounting for 11 95% of strategies in the case of
Group B and 5 0% m the case of Group A
4.6.1.2 Message Abandonment
Message abandonment is also a strategy used by the two groups Corder
(1981 105) considers this strategy to be “a less extreme form of topic
avoidance trying but giving up” Group B uses message abandonment to a
greater degree than Group A in Tasks 1 and 3 but Group A uses a higher
percentage of the strategy m Task 2
4.6.1.3 Message Reduction
Message reduction is used m Tasks 1 and 3 more frequently by Group B but Group
A uses the strategy a greater amount of the strategy in Task 2 Therefore, in two
of the elicitation tasks, the subjects m the higher proficiency group more readily
opt to reduce their intended meaning rather than risk communication failure This
strategy is the least extreme form of message adjustment

It seems that the linguistic requirements of Task 2 elicit a greater quantity of
message abandonment and message reduction on the part of the lower-proficiency
group whereas the higher-proficiency group tends to utilise these strategies more
frequently in Tasks 1 and 3 This might be explained by the fact that in these latter
tasks, in general, the subjects in the higher-proficiency group provide longer and
more detailed answers than their less-proficient counterparts Given that they have
more information to communicate m the L2, it could be inferred that they would
have to adjust their message more frequently
4.7 Relationship of task to strategy use
This study has also manifested that different tasks elicit different patterns of
strategy use As already noted, both groups use the highest number of strategies of
communication in Task 1 and the least amount in Task 3 In these tasks, the two
groups use approximately the same average number of strategies On the other
hand, Task 2 elicits more communication strategies from the higher proficiency
learners than from their less proficient compeers
These findings seem to be at variance with those reported in the research of Chen
(1990) on the communication strategies m interlanguage production by Chinese
EFL learners It was found that "CSs serve to compensate for the inadequacies in
the target language High-proficiency learners are equipped with more knowledge
of the target language and have relatively richer resources to draw upon in
communication Therefore, they appeal less to CSs Low-proficiency learners ,
however, handicapped by their limited knowledge of the target language, need to
173

compensate more, and therefore resort more frequently to the use of CSs" ( Chen
1990, 171)
It is difficult to state exactly why a significant difference exists between the three
tasks m the amount of strategy use The nature of Task 1 could perhaps explain
why it elicits the greatest amount of strategy use for both groups The task
consisted o f two picture sequences with six pictures in each sequence It is quite
a long task compared with the others and subjects in both groups provide longer
and more detailed answers as they are re-telling two complete stones with the aid
of the visual stimuli provided by the picture sequences In Task 2, subjects are
simply descnbing two photographs and therefore their answers are not as long
and detailed as those relating to Task 1
Task 3 elicits the least amount of communication strategies from both groups and
perhaps this could be explained by the fact that subjects have to answer only one
question descnbing what they did at the weekend They are not obliged to use
any visual stimuli and perhaps are more free to choose the language structures
with which they are more familiar
Corrales and Call (1989) suggest that students of a language may go through a
penod of maximum exploitation of task-influenced strategies which peaks and
then drops off as they become more proficient in the language They state
“because the study of communication strategies provides a means for observing
some of the processes underlying interlanguage production, it can be inferred that
a change m the pattern of strategy use indicates a change m interlanguage”
(Conales& Call 1989 235)
174

The present study is cross-sectional 1 e the data is collected from the subjects at
one point in their language development It cannot be inferred that the subjects
have reached a peak in strategy exploitation which declines as their L2 linguistic
ability develops further This hypothesis could form the basis of a longitudinal
study in which strategy use of similar groups of subjects could be observed over a
period of time
4.8 Pedagogical implications
There are important pedagogical implications ansing from the conclusions of this
study It is evident that all subjects, irrespective of proficiency and task, resort to
strategies of communication when attempting to overcome linguistic difficulties in
the L2 Instead of viewing use of communication strategies negatively whereby
they are seen to demonstrate lack of knowledge of the L2, one should realise that
they contribute to language learning in a very positive way Ellis (1986, 186) states
“of central importance in the study of communication strategies, however, is
their effectiveness in promoting L2 communication“ If the use of
communication strategies allows the learner to maintain interaction with the
interlocutor, it is obvious that they are a fundamental element of L2 communication
and are an important part of the learner’s communicative competence
4.8.1 Development of strategic competence
Improvement of the learner’s communicative competence is a primary objective of
all approaches to language teaching Canale and Swam (1980) presented their
widely-recognised model o f communicative competence which includes three
components grammatical competence, socio-linguistic competence and strategic
175

competence Grammatical competence refers to the learner’s knowledge of the
grammatical rules of the L2 and traditional teaching methods have placed much
emphasis on this particular aspect of learning Socio-linguistic competence implies
a cognisance of the socio-cultural adequacy o f language use Strategic
competence is defined by Canale and Swain (1980 30) as “verbal and non-verbal
communication strategies that may be called into action to compensate for
breakdowns due to performance variables or to insufficient competence” They
make specific reference to the crucial importance of communication strategies in
language teaching arguing that they “must be integrated with the other components
in an adequate theory of communicative competence” (1980 25)
Domyei and Thurell (1991 16) define strategic competence as “the ability to
express oneself m the face of difficulties or limited language knowledge” They
argue that strategic competence is greatly neglected in language teaching
programmes and this contributes to a lack of fluency and conversational skills in
the L2 They advocate the specific instruction of strategic competence i e that
learners should be instructed in the use of communication strategies Other
researchers have also stressed the importance o f strategy teaching in the language
classroom (eg Faerch and Kasper, 1983a, 1986, Panbakht, 1985, Chen, 1990,
Domyei, 1995, Little, 1996)
The validity of communication strategy instruction has been questioned by some
researchers including Bialystok (1990) who argues that strategy training will not
necessarily improve the learner’s communicative ability She states “the more
language the learner knows, the more possibilities exist for the system to be flexible
176

and to adjust itself to meet the demands of the learner What one must teach
students of a language is not strategy, but language” (1990 147)
One must agree that the primary objective of every language syllabus should be the
expansion of the learner’s linguistic repertoire in the target language Increased
knowledge of the L2 will, in turn, increase the possibility of successful
communication The role of the language teacher, in simple terms, is to facilitate
language learning Time spent on language teaching rather than instruction in
communicative strategy use will have greater linguistic advantages for the learner
One should perhaps treat of strategy use in an informal way through the overall
experience which the teacher has gained in his/her own learning of the L2
Panbakht (1985) refers to the fact that learners already have an ability to use
strategies because they use them in native-language communication She states
“strategic competence appears to develop in the speaker’s LI with the individual’s
increasing language experience and to be freely transferable to the L2 learning
situation” (1985 142) This suggestion supports the present argument which
refutes the need for specific strategy instruction as part of the language syllabus
However, one cannot ignore the fact that strategy usage is a very salient feature of
the learners’ communicative competence Furthermore, irrespective of target language
proficiency, learners will inevitably face communicative difficulties in the L2 which
cannot be solved by their available linguistic repertoire For this reason, the
encouragement of strategy use m general by language teachers is very worthwhile
and learners should be aware of their communicative potential One would agree
with Haastrup and Phillipson (1983 157) who suggest that a learner “could learn
from a study of his own strategic competence we do not see strategy teaching as
177

a substitute for vocabulary learning, but as a useful supplement, involving attention
to a different aspect of the learner’s communicative competence”
Exchange of Ll/L3-based strategies for more appropriate L2-based strategies
should be promoted and learners should understand that strategies such as topic
avoidance or message abandonment do not lead to successful communication in
the L2 In L2 French, learners could be advised of the usefulness of the French
drawl which allows the speaker valuable planning time when communicating in the
language
Ridley (1991 46) suggests that “the question is raised whether strategic
competence can be taught, whether it is possible to teach a learner to use effective
native-like performance features and L2-based strategies as a means of coping
it is possible actively to encourage learners to exchange LI-based strategies and
other LI-based performance features for L2 features, but only when the learner has
reached sufficient maturity and ability to talk about his or her oral performance m
an objective way”
One could aim to increase learner autonomy whereby learners take responsibility
for their own learning The use of CALL software and audio-visual material on a
self-access basis is extremely beneficial to language learning as learners can work
at their own pace and also monitor their own progress After having demonstrated
to learners how to use specific communication strategies, language teachers could
design appropriate exercises which would involve learners using these strategies
Learners can test out their hypotheses about the L2 and evaluate the effectiveness
of the communication strategies which they are employing in their communication
178

Leamer-teacher analysis of communicative activity recorded on audio or video
tape, emphasising strategy use strengths and weaknesses, might prove to be a very
effective method of promoting learner awareness of and subsequent improvement
of strategy utilisation
Better discourse management should be implemented and learners should be
encouraged to request assistance in strategy use
4.8 2 Contribution of L1/L3 knowledge to L2 communication
The findings of this study also demonstrate the influence of the LI and L3 on L2
communication For the purposes of the study, one refers to Irish as an L3 This
may be the subject of some debate but it is referred to as such purely for reasons of
technical labelling Irish accounts for most of the L3 influence on subjects’
performance with some input from other languages e g German and Spanish The
influence of Insh may be attributed to the fact that most subjects would have been
exposed to the language throughout their first and second-level education Some
subjects may not have studied it but this was not investigated
Hammerly (1991 71) states that “if we choose to ignore the interrelationships
between the language(s) of the learners and the target language and we decide to
disregard the numerous ways in which the former evidently influence the latter, we
are closing our eyes to much of what is going on, overtly or covertly, in the SL
classroom - a sure way of making instruction less effective” In the course of
language instruction, learners should be made aware of the similarities and
differences which exist between the native and the target languages One must first
understand the similarities which will assist m reproducing with greater facility the
179

equivalent L2 structures Learners should understand when it is appropriate to use
literal translation and when it is impossible to do so One effective way to learn
structures which are peculiar to the L2 is to first thoroughly understand them and
then reproduce them in the form of various assignments
Learners should also be conscious of the fact that it is sometimes admissible to use
an LI structure when the equivalent L2 expression does not exist Faerch and
Kasper (1986, 185/186) state that “Given languages as closely related as Danish,
English, French and German, and given the extensive international exchange of
information and the rapid growth of international words (video, stereo, punk,
disco, software, squash), it would be a waste if learners were not encouraged to
make use of LI transfer, although there is a risk of misunderstanding in the case of
false friends” However, it is very important that learners are made aware that
Ll/L3-based strategies are unreliable and understand that L2-based strategies are
more likely to lead to successful communication
Conclusion
The findings of the study, as reported m this chapter, indicate that there is not a
significant difference in strategy use among subjects of different proficiency levels
The influence of the LI on the L2 communication of both groups has been
confirmed by the results of the data analysis It has also been established that
strategy use vanes according to task The pedagogical implications of these results
have been discussed with particular reference to the debate on strategic
competence
180

S. Conclusion
The findings of this study indicate that all subjects, irrespective of proficiency, are
reliant on communication strategies when they encounter communicative
difficulties in the L2 Communication strategy use is a significant feature of all
subjects’ conversational skills and high-proficiency learners are just as likely as
low-proficiency learners to employ communication strategies
It is, however, the subjects’ specific use of these strategies which provides
important insights mto their mterlanguage It might be expected that the more-
advanced learners would be more reliant on L2-based strategies, given their greater
exposure to the language and equally that the less-advanced learners would use
L1/L3-based strategies to a greater extent
The lesults of the study reveal that the more-advanced learners do not use more
L2-based strategies and are, m fact, entrenched in L1/L3-based behaviour In two
of the three elicitation tasks, the more-advanced group (Group B) uses a greater
percentage of LI/L3-based strategies than L2-based strategies Its performance of
Task 2 represents the only deviation from this pattern In the latter task, Group B
employ a higher proportion of L2-based strategies There is not a significant
dichotomy between the two groups m L2-based strategy usage In Task 3, the
proportionate usage of L2-based strategies is almost equal Contrary to what
181

might have been expected, the more-advanced learners do not exhibit a greater
ability to employ paraphrase as a means of dealing with a communicative hiatus
With the exception of a 2 42% incidence in Task 2, paraphrase is not a feature of
their communication The only difference between the two groups in L2-based
behaviour is in the use of restructuring When faced with a communicative
problem in the L2, the more advanced subjects display a greater capability of
developing an alternative plan and can reorgamse more effectively what they wish
to communicate
Excepting Task 3, both groups use almost similar and not insignificant proportions
of word-comage This is the L2-based strategy which is the least likely to convey
meaning as the learner is inventing a word or phrase using L2 structures and it may
not be comprehensible to the interlocutor
The more-advanced group is just as likely as its less-advanced counterpart to resort
to the L1/L3 when faced with communicative problems With the exception of
Task 2, there is not a significant difference between the two groups m their overall
percentage use of Ll/L3-based strategies
Both groups display a particular tendency to employ literal translation when
attempting to communicate in the L2 Subjects are “thinking in the LI” and
presume that the LI can be translated word for word into the L2 One noteworthy
difference between the two groups is in their use of language switch The less-
advanced group display a greater inclination to switch directly to the L1/L3
without attempting to translate the target item into the L2
These findings support the results of studies conducted by Haastrup and Philhpson
(1983) and Ridley (1991) which reported that despite prolonged exposure to the
L2, the more-proficient learners were still reliant on LI-based strategies
One can speculate on the reasons for these patterns of strategy use among the
subjects of this particular study Although the subjects in the more-advanced
group have been studying French for a longer period of time, the difference
between the respective proficiency levels may not be as significant as one would
expect The subjects of the study choose French as an elective subject within a
wider Business Studies programme The language is not a major element of the
programme Depending on year, students are expected to study five or six
mandatory subjects and therefore might not devote a considerable proportion of
their time to language study It is possible that the perceived notion is that the
language is peripheral to the core business subjects This might explain the
similarities in strategy use between the subjects from Years 1 and 2 and those from
Years 3 and 4 One cannot assume a significant difference in the interlanguage
development of the respective groups because students of Year 4 do not have
increased time availability for language study Of course, students will make
progress because of the increased exposure to the L2 and perhaps because they
have chosen to continue their language learning but it is difficult to gauge the
extent of increased proficiency This introduces motivational factors which
represents an area npe for further investigation whereby one could explore a three-
way relationship between motivation for language learning, linguistic competence
and use of communication strategies
183
Risk-avoidance is a salient feature of the more-advanced group’s communication
Group B uses a considerably greater percentage of Message-Adjustment or nsk-
avoidance strategies than Group A in Tasks 1 and 3 In Task 2, Group A uses just
I 92% more strategies than Group B from this category Subjects in Group B are
inclined to adjust their communicative intent and contrary to expectations are less
willing to take nsks than tliose mGroup A A significantly greater percentage of
topic avoidance, which is the most extreme strategy within the nsk-avoidance
category, is employed by Group B This reveals a sense of linguistic inadequacy on
the part of the more-advanced subjects because they refuse to discuss or attempt
discussion of a topic which they consider too linguistically-challenging One might
interpret this as a fear of failure and would assume that such hesitation would be a
more indicative characteristic of the less-advanced subjects given their more limited
linguistic resources One could also hypothesise that the more-advanced subjects
do not want to portray their language deficiencies because they have a
preconceived notion of what is expected from them by the interlocutor
The study also provides additional evidence of the extent of L1/L3 influence on L2
communication The LI influence may be due to the typological closeness of the
English and French languages but the fact that there is also L3 influence might
indicate that all previous language learning may affect L2 acquisition
One could also speculate that previous language learning experience promotes
particular types of communication strategy use Depending on the previous
learning environment, learners will either be hesitant and unwilling to take nsks and
try out their hypotheses about the L2 or they will be anxious to use whatever
linguistic resources they possess m order to maintain a conversation Personality
184

factors may also contribute to the type of strategies employed by the learner An
introvert character may try to avoid interaction whereas the extrovert will try to
display the L2 communicative skills which he/she has at his/her disposal This
hypothesis could be the subject of further empirical investigation within the field of
communication strategy research
This study could be extended to investigate whether patterns of strategy use
change over time One could undertake a case study of a First Year student and
using a similar methodology, analyse L2 communicative performance during a
particular time-span The pattern o f the subject’s communicative strategy use could
be investigated in order to calculate the influence of Ll/L3-based strategies and to
evaluate the degree of L2-based strategy usage as the subject progresses in
language acquisition
It is suggested that although language teachers should be aware of the advantages
of communication strategy use and should encourage learners to adopt appropnate
strategies when faced with communicative difficulties m the L2, the instruction of
strategic competence should not necessarily form part of the language syllabus It
was beyond the scope of the study to support this theory with empirical data In
fact, very little empirical research has been undertaken m the area of strategy
training This is an area worthy of further investigation in order to facilitate proper
evaluation of the importance of incorporating strategic competence awareness in
language teaching programmes
The objective of this study was to extend the existing communication strategy
research area by investigating the communication strategies employed by native
English-speaking students who are learning L2 French withm a wider Business
185

Studies programme This objective has been fulfilled by the results obtained In
the light of these results, it was appropriate to indicate some areas which might be
useful to language teachers in evaluating their approach to language instruction and
to highlight additional avenues of research m the communication strategy domain
According to Seliger and Shohamy (1989 255), “the research cycle is an on-going
process in which answers to questions may raise new ones This perpetual cycle is
a result of the complexity of the phenomenon of language learning”
The results obtained in this study promote further questions on the use of
communication strategies by learners of L2 French m a specific context and these
results and subsequent new questions contribute to the research cycle in this area
\
186

BIBLIOGRAPHY
Abdesslem, H (1996) Communication strategies or discourse strategies in foreign
language performance? IRAL, 34 (1), 49-61
Bialystok, E (1979) The role of conscious strategies in second language proficiency
The Canadian Modern Language Review, 35 (3), 372-394
Bialystok, E & Frohlich, M (1980) Oral communication strategies for lexical
difficulties Interlanguage Studies Bulletin, 5, 3-30
Bialystok, E (1983) Some factors m the selection and implementation of
communication strategies In Faerch, C & Kasper, G (eds ) Strategies in
Interlanguage Communication (pp 100-118) London Longman
Bialystok, E (1990) Communication Strategies Oxford Blackwell
Blum, S & Levenston, E A (1978) Umversals of lexical simplification Language
Learning, 28, 399-416
Blum-Kulka, S & Levenston, E A (1983) Umversals of lexical simplification In
Faerch, C & Kasper, G (eds ) Strategies in Interlanguage Communication (pp 119-
139) London Longman
Bongaerts, T &Poulisse, N (1989) Communication Strategies m the LI and L2 Same
or Different7 Applied Linguistics, 10 (3), 253-268
Brown, J D (1988) Understanding Research in Second Language Learning
Cambridge Cambridge University Press
Canale, M & Swain, M (1980) Theoretical bases of communicative approaches to
second language teaching and testing Applied Linguistics, 1(1), 1-47
Chaudron, C (1988) Second Language Classrooms New York Cambridge University
Press
Chen, S Q (1990) A Study of communication Strategies in Interlanguage Production
by Chinese EFL learners Language Learning, 40 (2), 155-187
Cook, V (1993) Linguistics and Second Language Acquisition London Macmillan
Cook, V (1996) Second Language Learning and Language Teaching (2nd edition)
London Arnold
Corder, S P, (1981) Error Analysis in Interlanguage Oxford Oxford University Press
187

Corrales, 0 & Call, M (1989) At a loss for words the use of communication
strategies to convey lexical meaning Foreign Language Annals 22 (33), 227-240
Dechert, H & Raupach, M (eds ) (1990) Transfer in Language Production Norwood
Ablex Publishing Corporation
Domyei, Z & Scott, ML (1997) Communication Strategies m a Second Language
Definitions and Taxonomies Language Learning, 47(1), 173-210
Domyei, Z &Thurell, S (1991) Strategic competence and how to teach it ELT
Journal, 45 (1), 16-23
Domyei, Z (1995) On the teachability of communication strategies TESOL
Quarterly,
29 (1), 55-85
Dulay, H Burt, M &Krashen, S (1982) Language Two Oxford Oxford University
Press
Ellis, R (1982) The Origins of Interlanguage Applied Linguistics, 3 (3), 207-223
Ellis, R (1986) Understanding Second Language Acquisition Oxford Oxford
University Press
Ellis, R (1987) Second Language Acquisition in Context Englewood Cliffs, NJ
Prentice Hall
Ellis,R (1994) The Study o f Second Language Acquisition Oxford Oxford University
Press
Eubank, L , Selinker, L & Sharwood Smith, M (eds ), (1995) The Current State of
Interlanguage Amsterdam John Benjamin Publishing
Faerch, C & Kasper, G (1983a) Plans and strategies m foreign language
communication In Faerch, C & Kasper, G (eds ) Strategies in Interlanguage
Communication (pp 20-60) London Longman
Faerch, C & Kasper, G (1983b) On identifying communication strategies in
mterlanguage production In Faerch, C & Kasper, G (eds ) Strategies in Interlanguage
Communication (pp 210-238) London Longman
Faerch, C & Kasper, G (1986) Strategic Competence in Foreign Language Teaching
In Kasper, G (ed ) (1986) Learning, Teaching and Communication in the Foreign
Language Classroom Aarhus Aarhus University Press
188
Faerch, C & Kasper, G (1989) Transfer in Production Some Implications for the
Interlanguage Hypothesis In Dechert, H & Raupach, M (eds ) Transfer in Language
Production (pp 173-193) Norwood Ablex Publishing Corporation
Faerch, C & Kasper, G (eds) (1983) Strategies in Interlanguage Communication
London Longman
Faerch, C & Kasper, G (1987) Perspectives on Language Transfer Applied
Linguistics, 8 (2), 111-136
Fetzer, A (1996) Preference Organization and Interactive Language Teaching
Communicative Strategies in a German-Enghsh context IRAL, 34 (2), 77-93
Fisiak, J (ed) (1981) Contrastive Linguistics and the Language Teacher Oxford
Pergamon Press
Gass, S (1979) Language Transfer and Universal Grammatical Relations Language
Learning, 29 (2), 327-344
Giacobbe, J (1992) A cognitive view of the role of LI m the L2 acquisition process
Second Language Research, 8 (3), 232-250
Guiora, A (1990) The Importance o f Native Language in Light of Second Language
Studies Communication and Cognition, 23 (4), 257-266
Haastrap, K & Phillipson, R (1983) Achievement strategies in learner/native speaker
interaction In Faerch, C & Kasper, G (eds) Strategies in Interlanguage
Communication {pp 140-158) London Longman
Hammerly, H (1991) Fluency and Accuracy Clevedon Multilingual Matters
Hardison, D M (1992) Acquisition of Grammatical Gender in French L2 learner
Accuracy and Strategies The Canadian Modem Language Review, 48 (2), 292-306
Hatch, E & Farhady, H (1982) Research Design and Statistics for Applied
Linguistics New York Newbury House
Heilenman, LK. & McDonald J L (1993) Processing Strategies in L2 learners of
French the role of transfer Studies in Second Language Acquisition, 15 (4), 461-493
James, C (1980) Contrastive Analysis London Longman
Kasper, G (ed)(1986) Learning, Teaching and Communication in the Foreign
Language Classroom Aarhus Aarhus University Press
Kellerman, E , Bongaerts, T & Poulisse, N (1987) Strategy and System in L2
Referential Communication In Ellis, R. (eds.)* Second Language Acquisition m
Context (pp 100-112) Englewood Cliffs NJ Prentice-Hall
189

Kellermann, E (1991) Compensatory strategies in second language research a
critique, a revision and some (non-) implications for the classroom In Philhpson, R ,
Kellermann, E , Selinker, L , Sharwood Smith, M , & Swam, M (eds ) Foreign/Second
Language Pedagogy Research a commemorative volume for Claus Faerch (pp 142-
161) Clevedon Multilingual Matters
Kellermann, E , Ammerlaan, T , Bongaerts, T & Poulisse, N (1990) System and
Hierarchy In L2 Compensatory Strategies In Scarcella, R C , Anderson, E S &
Krashen, S (eds ) Developing communicative competence in a second language
(pp 163-178) New York Newbury House
Kumaravadivelu, B (1988) Communication Strategies and Psychological Processes
Underlying Lexical Simplification IRAL, 26 (4), 309-319
Larsen-Freeman, D & Lang, M (1991) An Introduction to Second Language
Acquisition Research London Longman
Lennon, P (1989) Introspection and Intentionality in Advanced Second Language
Acquisition Language Learning, 39 (3), 375-398
Little, D (1996) Strategic Competence and the learner's strategic control of the
language learning process Language Teaching, 29 (2), 94-97
Martohardjono, G & Flynn, S (1995) Language Transfer What do we really mean?
In Eubank, L , Selmker,L & Sharwood Smith, M (eds ), The Current State of
Interlanguage (pp 205-217) Amsterdam John Benjamin Publishing
McDonough, S (1995) Strategy and Skill in Learning a Foreign Language London
Edward Arnold
McLaughlin, B (1987) Theories of Second Language Learning London Edward
Arnold
Nemser, W (1971) Approximative Systems of Foreign Language Learners IRAL, (9)
2, 115-123
Nunan, D (1992) Research Methods in Language Learning New York Cambndge
University Press
Odlin, T (1989) Language Transfer New York Cambndge University Press
Palmberg, R (1978) Strategies of Second-Language Communication CIEFL Bulletin,
14 (2), 1-8
Panbakht, T (1985) Strategic competence and Language Proficiency Applied
Linguistics, 6 (2), 132-146
190

Phillipson, R , Kellermann, E , Selinker, L , Sharwood Smith, M , & Swam, M (eds)
Foreign/Second Language Pedagogy Research a commemorative volume for Claus
Faerch Clevedon, UK Multilingual Matters
PoulisseN &Schils, E (1989) The Influence of Task-and Proficiency-related factors
on the use of Compensatory Strategies a quantitative analysis Language Learning, 39
(1)Poulisse, N & Bongaerts, T (1994) First Language Use in Second Language
Production Applied Linguistics, 15(1), 36-57
Poulisse, N (1987) Problems and solutions m the classification of compensatory
strategies Second Language Research, 3 (2), 141-153
Poulisse, N (1990) The use of compensatory strategies by Dutch learners o f English
Dordrecht Fons
Richards, J C (1974) Error Analysis Perspectives on Second Language Acquisition
London Longman
Ridley, J (1991) Transfer in L2 Production a case study Teanga, 11,40-47
Ridley, J (1993) Problem-solving strategies m ab initio learning a study of two adult
learners Teanga, 13, 84-91
Ringbom, H (1992) On LI Transfer in L2 Comprehension and L2 Production
Language Learnings 42 (1), 85-112
Royer, JM & Carlo, M S (1991) Transfer of Comprehension Skills from Native to
Second Language Journal of Reading, 34 (6), 450-455
Scarcella, R C , Anderson, E S &Krashen,S (e d s ) (1990) Developing
communicative competence in a second language New York Newbury House
Schuman, J & Stenson,N (1975) New Frontiers in Second Language Learning New
York Newbury House
Scholfield, P (1987). Communication Strategies- the researcher outmanoeuvred?
Applied Linguistics, 8 (3), 219-232
Seliger, HW & Shohamy,E (1987) Second Language Research Methods Oxford
Oxford University Press
Selinker, L (1972) Interlanguage IRAL, 10,219-231
Selinker, L (1992) Rediscovering Interlanguage London Longman
Sharwood Smith, M. (1994) Second Language Learning Theoretical Foundations
London Longman
191

Smdermann, G & Horsella, M (1989) Strategy Markers in Writing Applied
Linguistics, 10 (4), 438-466
Singleton, D (1987) Mother and other tongue influence on Learner French - a case
study Studies in Second Language Acquisition, 9 (3), 327-345
Singleton, D (1994) Alien Intrusions m Learner French a case study Teanga, 3, 87-
129
Tarone, E (1977) Conscious Communication Strategies m Interlanguage In Brown,
H D , Yono,C A & Crymes, R C (eds) On TESOL 77 Washington D C TESOL
Tarone, E & Yule, M (1989) Focus on the Language Learner Oxford Oxford
University Press
Tarone, E (1980) Commumcation Strategies, Foreigner Talk and Repair in
Interlanguage Language Learning, 30 (2), 417-431
Tarone, E (1988) Variation in Inter language London Edward Arnold
Tarone, E , Cohen,A & Dumas, G (1976) A closer look at some mterlanguage
terminology a framework for communication strategies Working Papers on
Bilingualism, 9, 76-90
Taylor, B (1975) The use of Overgeneralization and Transfer Learning Strategies by
Elementary and Intermediate students of ESL Language Learning, 25 (1), 73-107
Varadi, T (1980) Strategies of target language learner communication message
adjustment IRAL, 18, 59-71
Wenden,A & Rubin,J (1987) Learner Strategies and Language Learning Englewood
Cliffs ,NJ Prentice Hall
Yarmohammadi, L & Self, S (1992) More on communication strategies
classification, resources, frequency and underlying processes IRAL, 30 (3), 223-232
192

APPENDIX A
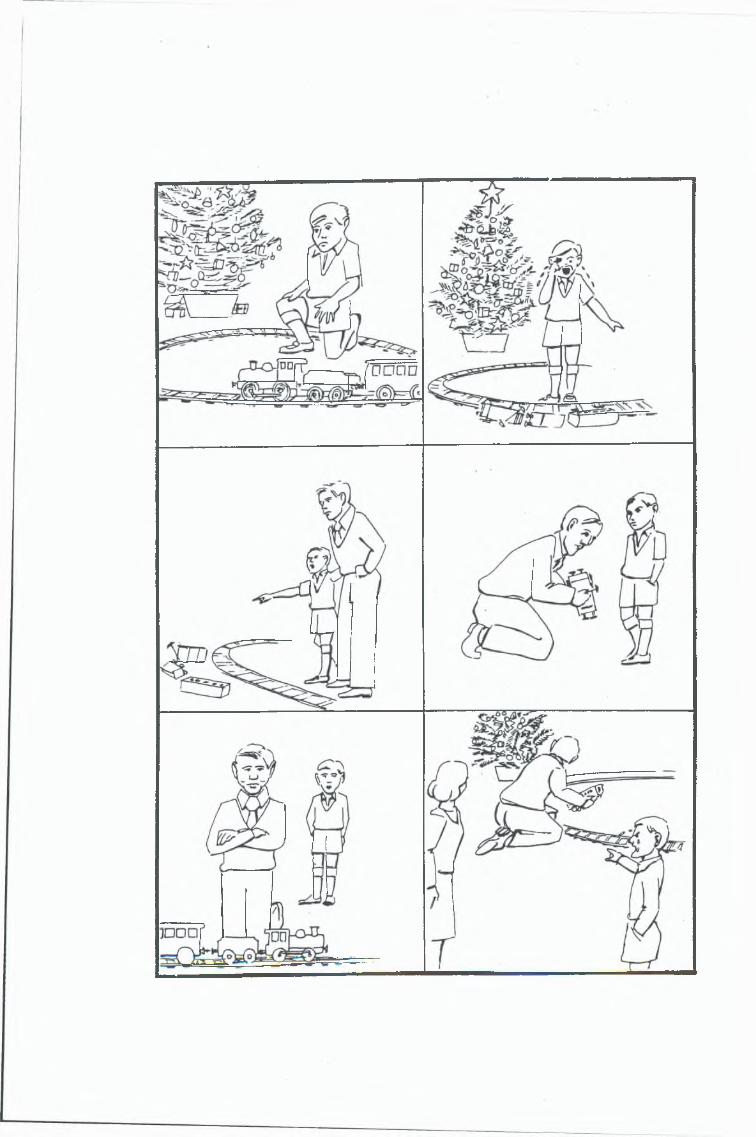


APPENDIXC TRANSCRIPTIONS OF TASK 2 - PHOTO NO 1
SUBJECT FROM GROUP A
Dans la premiere photo, il y a Pause le, le campagne II eh était très beau
Il est très beau avec les Pause les, le campagne très vert avec un maison, un petite maison
Il y a deux personnes dans la photo un homme et une femme eh II y a beaucoup de col
couleurs dans la photo, le vert, le bleu, le blanc, le jaune, le rouge eh II y a une Pause
une rue, une petite rue Pause II y a les arbres em et il a l’air de d’un plage mais je
ne suis pas certain Pause II faisait beau Les deux personnes sont Pause pied dans la rue
SUBJECT FROM GROUP B
Dans la premiere picture ( pronounced as French ), il montre une petit maison Je pense qu’il que
c ’est en Irlande mais je ne sais pas em II fait du soleil et il y a une femme et un homme ( “h”
pronounced) em II y a aussi la mer em c ’est très joli dans le soleil L Pause II y a
Pause aussi Pause des, des petits terrains ou probablement les fermeurs travaillent pour
l ’ete