information quality training requirements analysis...
TRANSCRIPT

Information Quality Training Requirements Analysis Guideline
Demonstrated in a Healthcare Context
(A Design Science Approach)
By: Ms Mary Levis
A dissertation presented in Fulfilment of the
Requirements for PhD
Dublin City University January 2011
Supervisory Committee Dr. Malcolm Brady Dr. Markus Helfert

ii
I hereby certify that this material, which I now submit for assessment on the
programme of study leading to the award of PhD is entirely my own work,
that I have exercised reasonable care to ensure that the work is original,
and does not to the best of my knowledge breach any law of copyright, and
has not been taken from the work of others save and to the extent that such
work has been cited and acknowledged within the text of my work.
Signed: ___________________________ (Candidate) ID No: 51150166
Date: January 2011

iii
Publication List
Peer Reviewed Journals Levis Mary, Malcolm Brady, Markus Helfert (2008), ‘Total Quality Management Underpins Information Quality Management’ The Journal of American Academy of Business, Cambridge (JAABC). Vol. 14, No.1, pp 172-178. Levis Mary, Malcolm Brady, Markus Helfert (2008), ‘Website Design Quality and Form Input Validation: An Empirical Study on Irish Corporate Websites’ Journal of Service Science and Management (JSSM). Vol. 1, No.1, pp 87-96.
Conferences Levis, Mary, Malcolm Brady, Markus Helfert (2008), ‘Form Input Validation on Irish Corporate Websites’ 10th International Conference on Enterprise Information Systems (ICEIS) 12th -16th, June 2008, Barcelona, Spain. Levis, Mary, Malcolm Brady, Markus Helfert (2008), ‘Identifying Information Quality Problems in a healthcare scenario’ International Association for Development of the Information Society (IADIS) - International Conference Information Systems 9th - 11th April, 2008, Algarve, Portugal. Levis, Mary, Malcolm Brady, Markus Helfert (2008), ’Information Quality Issues Highlighted by Deming’s Fourteen Points on Quality Management’ International Conference on Business Innovation and Information Technology (ICBIIT) 24th January 2008, Dublin City University, Ireland. Levis, Mary, Malcolm Brady, Markus Helfert (2008), ‘IQ Management: Review of an Evolving Research Area’ 12th International Conference on Information Quality (ICIQ) 09th - 11th November 2007, Cambridge, Massachusetts, USA. Levis Mary, Malcolm Brady, Markus Helfert (2007), Applying Information Quality Concepts in a practical Healthcare setting 12th annual conference of the UK Academy for Information Systems (UKAIS) 11th– 12th April 2007, Manchester, UK.

iv
Dedication This dissertation is dedicated primarily in gratitude to my mother, Betty, who
has always believed in me and to my late father, Benjamin, for altering the
course of my life, which eventually led me to the world of academia. It is
dedicated also to my immediate and extended family in gratitude for their
ongoing encouragement through this process. Finally and especially dedicated
(to my partner) Josef van Genabith for his unconditional love, unfailing support
and encouragement through my doctoral journey and for encouraging me to
follow my dream to achieve this Ph.D.

v
Acknowledgments
This dissertation could not have been completed without the support and
backing of many individuals. First, I would like to record my gratitude to my
supervisors, Dr Malcolm Brady, (Dublin City University, Business School) and
Dr Markus Helfert, (Dublin City University, School of Computing). I remain
forever grateful for the advice, encouragement and support they both gave me
in various ways from the onset of my academic career as well as giving me
extraordinary experiences through out the work.
In addition, special thanks to Professor David Jacobson, whose familiarity with
the support needs of all Ph.D scholarship students provided a constant oasis of
helpful ideas and inspired and enriched my growth as a Ph.D student. I am
deeply indebted to him.
Particular thanks to Dublin City University Business School, for their
sponsorship through scholarship funding, without, which my Ph.D could not
have been undertaken. I would like to include all staff of Dublin City University,
Business School, for offering such a wide and varied range of help and
guidance during my research.
I gratefully acknowledge Pamela Henry, Mary Kirwan and Mary Mc Grath,
Dublin City University, School of Nursing, for the involvement of their students
and the use of their virtual hospital, to carry out my experiment. Sincere thanks
to all the students who freely gave of their valuable time to participate in the
experiment.
A special gratitude goes to my dear friend, Muireann Ni Dhuigneain and my
cousin Frances Carey, who encouraged me to endure the journey throughout
the trials and hardships of dealing with my illness, Multiple Sclerosis and for

vi
setting my sights on the honour of being called ‘Dr. Mary. This
acknowledgement would be incomplete without also mentioning my family and
friends whose’ dedication, love and persistent confidence in me, has taken a
load off my shoulders. Many thanks also goes to Fred Murphy for his support
throughout my undergraduate degree that underpinned this Ph.D.
Words fail me to express my appreciation to my partner Josef, to whom I owe a
special debt of gratitude for his loyalty, support and persistent confidence in me
that inspired me during my journey.
Collective and individual acknowledgments are also due to my work colleagues
in the Business School, and especially to my colleagues in the Business
Informatics Group, School of Computing, I was extraordinarily fortunate in
having their continual support and encouragement in my pursuit of this degree.
Special acknowledgment must go to Dr John Murphy, who freely offered to
assist me in my thesis writing and expertly guided my style. I am forever
grateful to him for his patience and advice. A special note of thanks also goes
to Lisa Carey, Brigit O Neill, Josie Donovan and Richard Ryan, and Ita Tobin
for their help with the data gathering process. Finally, I would like to thank
everybody who was important to the successful realization of this thesis, as
well as expressing my sincere apology that I could not mention you all
personally one by one. To one and all, I humbly say, ‘Thank you!’

vii
List of Abbreviations
A&E Accident and Emergency
AIMQ Assessment of Information Management Quality
ASQ American Society for Quality
BS Behavioural Science
CIS Clinical Indemnity Scheme
DQ Data Quality
DS Design Science
EFQM European Foundation for Quality Management
EU European Union
FFM Five Factor Model
IOM Institute of Medicine
IQ Information quality
IQA Information Quality Assessment
IQAM Information Quality Assessment Methodology
IQM Information Quality Management
IQTPs Information Quality Training Plans
IQTRA Information Quality Training Requirements Analysis
IQTRAG Information Quality Training Requirements Analysis Guideline
IP Information Product
IS Information System
ISMP Institute of Safe Medication Practices
ISO International Standards Organization
IT Information technology
KM Knowledge Management
KS Kolmogorov-Smirnov (Test)
Non EU Non European Union

viii
OECD Organisation for Economic Co-operation and Development
RAS Results Assessment System
RSCI Royal College of Surgeons Ireland
SCA State Claims Agency
SPC Statistical Process Control
SPSS Statistical Package for Social Science
SQ System Quality
US United States
QM Quality Management
TDQM Total Data Quality Management
TQM Total Quality Management

ix
Table of Contents Publication List ............................................................................................................... iii
Dedication........................................................................................................... iv
Acknowledgments................................................................................................ v
List of Abbreviations .......................................................................................... vii
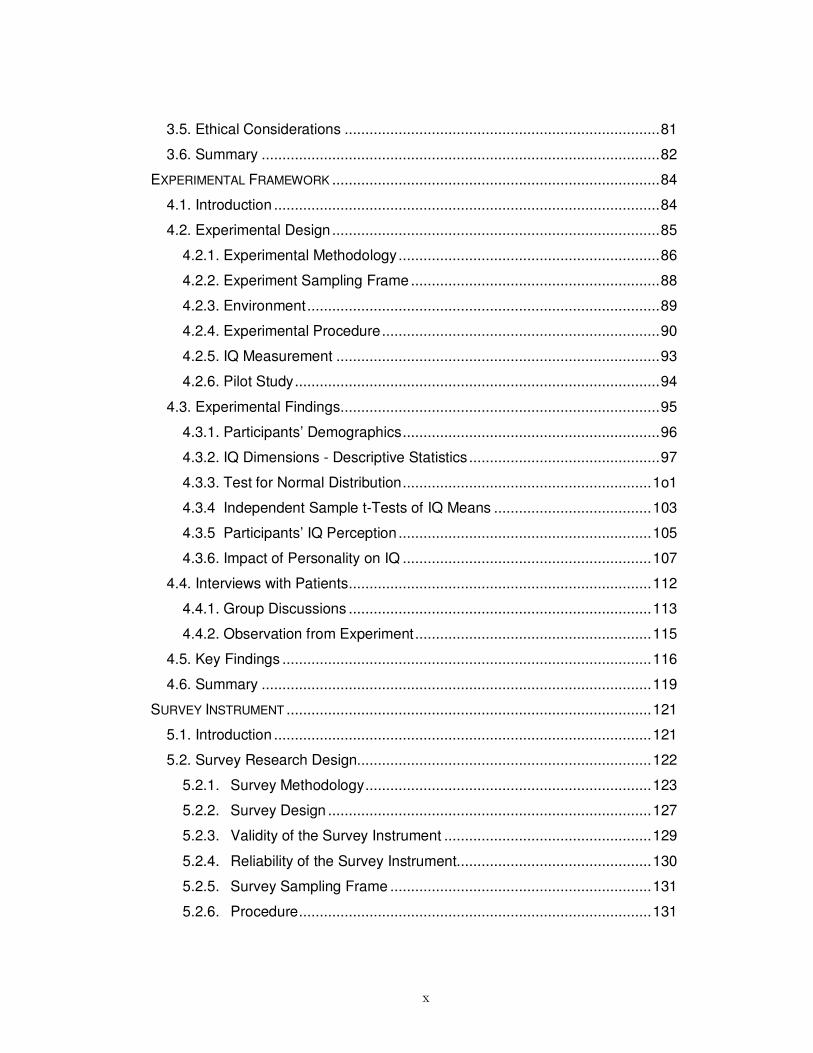
Table of Contents ............................................................................................... ix
List of Figures ....................................................................................................xiii
List of Tables .....................................................................................................xiv
Abstract ............................................................................................................xvii
INTRODUCTION......................................................................................................1
1.1. Introduction and Background to Study.......................................................1
1.2. Motivation for Conducting this Research.................................................13
1.3. Research Proposition..............................................................................17
1.4. Research Approach ................................................................................21
1.5. Thesis Organization ................................................................................24
REVIEW OF RELATED WORK.................................................................................26
2.1. Introduction .............................................................................................26
2.2. Information Quality Management ............................................................29
2.2.1. Quality Definitions...........................................................................38
2.2.2. Information Quality Models and Frameworks..................................42
2.2.3. Measuring Information Quality ........................................................49
2.2.4. Quality Control Initiatives................................................................51
2.3. Training...................................................................................................56
2.4. Influence of Personality...........................................................................63
2.5. Gap in the Literature ...............................................................................65
2.6. Summary ................................................................................................67
METHODOLOGY...................................................................................................69
3.1. Introduction .............................................................................................71
3.2. Research Paradigm for this Study...........................................................72
3.3. Philosophical Stance...............................................................................73
3.4. Research Framework..............................................................................74
x
3.5. Ethical Considerations ............................................................................81
3.6. Summary ................................................................................................82
EXPERIMENTAL FRAMEWORK ...............................................................................84
4.1. Introduction .............................................................................................84
4.2. Experimental Design...............................................................................85
4.2.1. Experimental Methodology...............................................................86
4.2.2. Experiment Sampling Frame ............................................................88
4.2.3. Environment.....................................................................................89
4.2.4. Experimental Procedure...................................................................90
4.2.5. IQ Measurement ..............................................................................93
4.2.6. Pilot Study........................................................................................94
4.3. Experimental Findings.............................................................................95
4.3.1. Participants’ Demographics..............................................................96
4.3.2. IQ Dimensions - Descriptive Statistics ..............................................97
4.3.3. Test for Normal Distribution............................................................1o1
4.3.4 Independent Sample t-Tests of IQ Means ......................................103
4.3.5 Participants’ IQ Perception .............................................................105
4.3.6. Impact of Personality on IQ ............................................................107
4.4. Interviews with Patients.........................................................................112
4.4.1. Group Discussions .........................................................................113
4.4.2. Observation from Experiment.........................................................115
4.5. Key Findings .........................................................................................116
4.6. Summary ..............................................................................................119
SURVEY INSTRUMENT ........................................................................................121
5.1. Introduction ...........................................................................................121
5.2. Survey Research Design.......................................................................122
5.2.1. Survey Methodology.....................................................................123
5.2.2. Survey Design ..............................................................................127
5.2.3. Validity of the Survey Instrument ..................................................129
5.2.4. Reliability of the Survey Instrument...............................................130
5.2.5. Survey Sampling Frame ...............................................................131
5.2.6. Procedure.....................................................................................131

xi
5.2.7. Survey Data Measurements .........................................................132
5.3. Survey Findings ....................................................................................136
5.3.1. Demographics ..............................................................................137
5.3.2. Response Analysis .......................................................................138
5.3.3. Descriptive Statistics ....................................................................138
5.3.4. Test for Normality .........................................................................139
5.3.5. Survey Instrument Construct Analysis ..........................................140
5.3.6. Independent Sample t-tests on IQ ................................................141
5.3.7. Respondents IQ Perception..........................................................144
5.3.8. Hypothesis Testing .......................................................................145
5.4. Key Findings .........................................................................................151
5.5 Summary ...............................................................................................152
INFORMATION QUALITY TRAINING REQUIREMENTS ANALYSIS GUIDELINE...............154
6.1. Introduction ...........................................................................................154
6.2. Construction of the Conceptual Model...................................................156
6.3. Training Plan.........................................................................................157
6.4. Guideline Contents................................................................................157
6.5. Guideline Validation ..............................................................................173
6.6. Summary ..............................................................................................173
CONCLUSION.....................................................................................................176
7.1. Introduction ...........................................................................................176
7.2. Summary and Discussion of the Study..................................................178
7.3. Contribution to the Literature.................................................................185
7.4. Implications for Practitioners .................................................................186
7.5. Limitation of this Study ..........................................................................187
7.6. Recommendations for Further Research...............................................189
7.7. Conclusion ............................................................................................190
References ......................................................................................................192
Appendix A:Medical Error Studies....................................................................209
Appendix B:Experiment Instruction Sheet........................................................210
Appendix C:NEO_PI Personality Test..............................................................211
Appendix D:Patient Record..............................................................................214

xii
Appendix E:Scenario Example.........................................................................220
Appendix F:Plain Language Statement............................................................222
Appendix G:Informed Consent Form................................................................223
Appendix H:Survey Questionnaire ...................................................................224
xiii
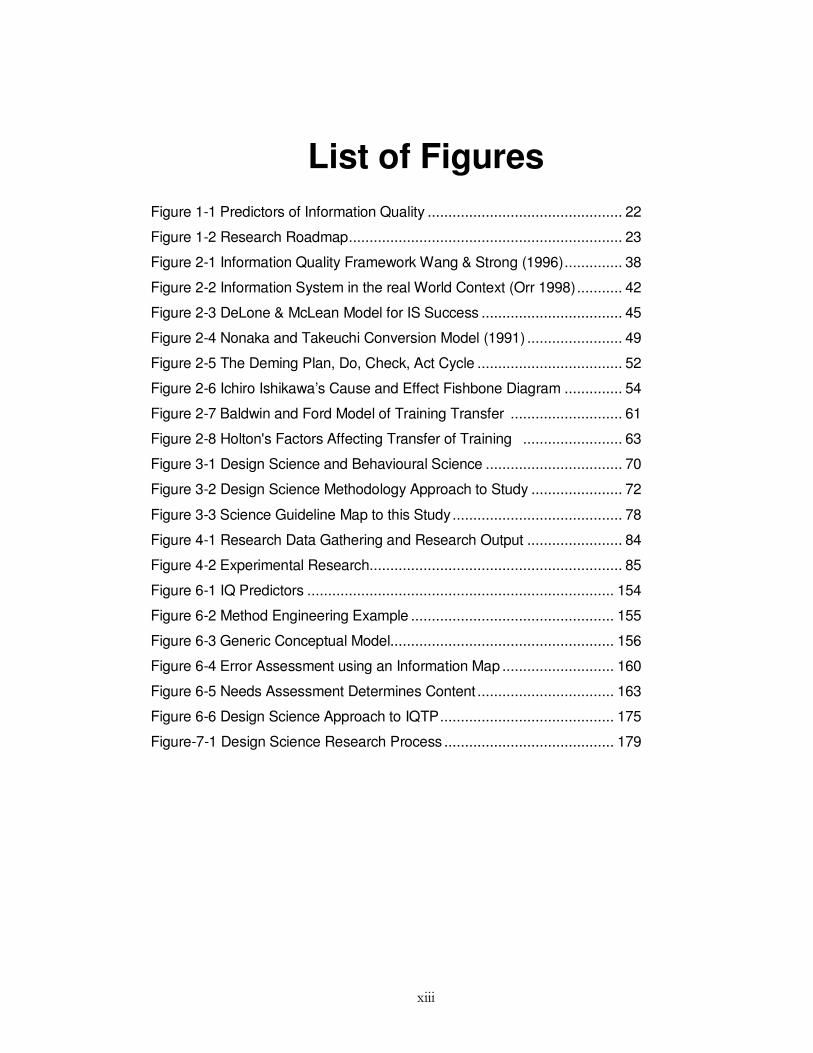
List of Figures
Figure 1-1 Predictors of Information Quality ............................................... 22
Figure 1-2 Research Roadmap.................................................................. 23
Figure 2-1 Information Quality Framework Wang & Strong (1996).............. 38
Figure 2-2 Information System in the real World Context (Orr 1998)........... 42
Figure 2-3 DeLone & McLean Model for IS Success .................................. 45
Figure 2-4 Nonaka and Takeuchi Conversion Model (1991) ....................... 49
Figure 2-5 The Deming Plan, Do, Check, Act Cycle ................................... 52
Figure 2-6 Ichiro Ishikawa’s Cause and Effect Fishbone Diagram .............. 54
Figure 2-7 Baldwin and Ford Model of Training Transfer ........................... 61
Figure 2-8 Holton's Factors Affecting Transfer of Training ........................ 63
Figure 3-1 Design Science and Behavioural Science ................................. 70
Figure 3-2 Design Science Methodology Approach to Study ...................... 72
Figure 3-3 Science Guideline Map to this Study......................................... 78
Figure 4-1 Research Data Gathering and Research Output ....................... 84
Figure 4-2 Experimental Research............................................................. 85
Figure 6-1 IQ Predictors .......................................................................... 154
Figure 6-2 Method Engineering Example ................................................. 155
Figure 6-3 Generic Conceptual Model...................................................... 156
Figure 6-4 Error Assessment using an Information Map ........................... 160
Figure 6-5 Needs Assessment Determines Content ................................. 163
Figure 6-6 Design Science Approach to IQTP.......................................... 175
Figure-7-1 Design Science Research Process ......................................... 179
xiv
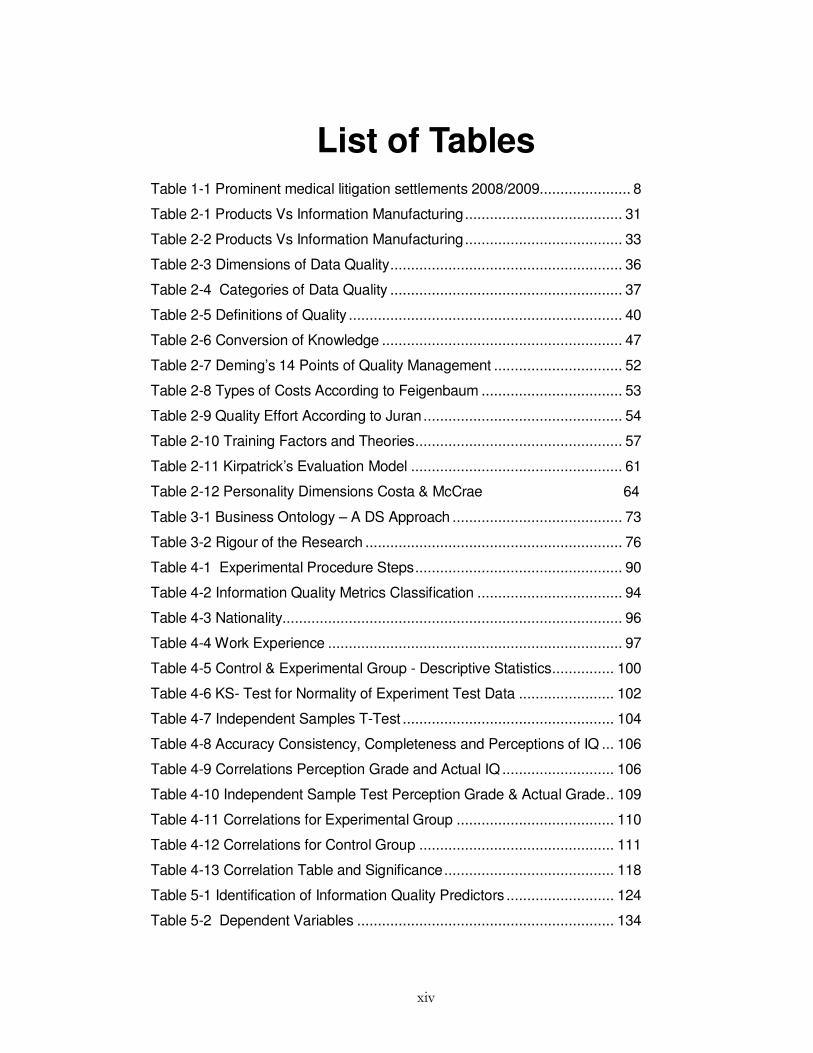
List of Tables Table 1-1 Prominent medical litigation settlements 2008/2009...................... 8
Table 2-1 Products Vs Information Manufacturing...................................... 31
Table 2-2 Products Vs Information Manufacturing...................................... 33
Table 2-3 Dimensions of Data Quality........................................................ 36
Table 2-4 Categories of Data Quality ........................................................ 37
Table 2-5 Definitions of Quality .................................................................. 40
Table 2-6 Conversion of Knowledge .......................................................... 47
Table 2-7 Deming’s 14 Points of Quality Management ............................... 52
Table 2-8 Types of Costs According to Feigenbaum .................................. 53
Table 2-9 Quality Effort According to Juran................................................ 54
Table 2-10 Training Factors and Theories.................................................. 57
Table 2-11 Kirpatrick’s Evaluation Model ................................................... 61
Table 2-12 Personality Dimensions Costa & McCrae 64
Table 3-1 Business Ontology – A DS Approach ......................................... 73
Table 3-2 Rigour of the Research .............................................................. 76
Table 4-1 Experimental Procedure Steps.................................................. 90
Table 4-2 Information Quality Metrics Classification ................................... 94
Table 4-3 Nationality.................................................................................. 96
Table 4-4 Work Experience ....................................................................... 97
Table 4-5 Control & Experimental Group - Descriptive Statistics............... 100
Table 4-6 KS- Test for Normality of Experiment Test Data ....................... 102
Table 4-7 Independent Samples T-Test ................................................... 104
Table 4-8 Accuracy Consistency, Completeness and Perceptions of IQ ... 106
Table 4-9 Correlations Perception Grade and Actual IQ ........................... 106
Table 4-10 Independent Sample Test Perception Grade & Actual Grade.. 109
Table 4-11 Correlations for Experimental Group ...................................... 110
Table 4-12 Correlations for Control Group ............................................... 111
Table 4-13 Correlation Table and Significance......................................... 118
Table 5-1 Identification of Information Quality Predictors .......................... 124
Table 5-2 Dependent Variables .............................................................. 134

xv
Table 5-3 Independent Variables ............................................................ 135
Table 5-4 Training Questionnaire............................................................. 135
Table 5-5 Work-Environment & IQ Perception Questionnaire .................. 136
Table 5-6 Classification Variables............................................................ 136
Table 5-7 Nationality of Survey Participants ............................................. 137
Table 5-8 Work Experience of Survey Participants................................... 138
Table 5-9 Responses by Profession ........................................................ 138
Table 5-10 Frequency Distribution ........................................................... 139
Table 5-11One-Sample Kolmogorov-Smirnov Test for Normality.............. 140
Table 5-12 Cronbach Alpha Accuracy, Consistency & Completeness...... 141
Table 5-13 Descriptive statistics of Survey Participants Nationality........... 142
Table 5-14 Independent Samples Test .................................................... 143
Table 5-15 Group Statistics ..................................................................... 144
Table 5-16 Participants Perception to IQ & Actual IQ ............................... 145
Table 5-17 Hypothesis 2 Model Summary ............................................... 146
Table 5-18 Hypothesis 2 Anova Table ................................................... 147
Table 5-19 Hypothesis 3 Model Summary ............................................... 147
Table 5-20 Hypothesis 3 Anova Table ................................................... 148
Table 5-21 Hypothesis 4 Model Summary ............................................... 148
Table 5-22 Hypothesis 4 Anova Table ................................................... 148
Table 5-23 Hypothesis 5 Model Summary ............................................. 1449
Table 5-24 Hypothesis 5 Anova Table ................................................... 149
Table 5-25 Hypothesis 5b Model Summary ............................................. 150
Table 5-26 Hypothesis 5b Anova Table .................................................. 150
Table 5-27 Hypothesis 6 Model Summary ............................................... 150
Table 5-28 Hypothesis 6 Anova Table ................................................... 151
Table 6-1 Error Log ................................................................................. 159
Table 6-2 Information Map....................................................................... 161
Table 6-3 IQ Documentation Assessment................................................ 161
Table 6-4 Information Quality Metrics Classification ................................. 161
Table 6-5 User Identification .................................................................... 162
Table 6-6 IQ Required Training by Criticality Criteria ................................ 163

xvi
Table 6-7 IQ Needs Assessment ............................................................. 164
Table 6-8 Assessment of the Work Environment...................................... 164
Table 6-9 Training Assessment Form ...................................................... 165
Table 6-10 Information Quality Dimensions............................................. 166
Table 6-11Training Plan Activities............................................................ 167
Table 6-12 Training Topics ...................................................................... 169
Table 6-13 Training Curriculum............................................................... 170
Table 6-14 Trainee Assessment Form ..................................................... 170
Table 6-15 Acceptable Criteria & Measurement ....................................... 171
Table 6-16 Training Course Evaluation Form........................................... 172

xvii
Abstract
In recent years, organizations have realized the critical importance of
Information Quality Management (IQM) as a means to achieve long-term
business success. Yet, many organizations find it difficult to implement an
effective Information Quality Training Plan (IQTP). One reason for this is that
they fail to identify the prime predictors of Information Quality (IQ) and
therefore, the resources and likewise the commitment to develop an effective,
systematically tailored approach to IQTPs is lost.
To systematically address this problem is the primary driver behind this thesis.
To achieve this objective, a practical conceptual model, which allows the
measurement of the anticipated predictors’ impact on IQ, and a Design Science
(DS) problem-based solution; an Information Quality Training Requirements
Analysis Guideline (IQTRAG) is proposed. This model was validated by means
of a controlled laboratory experiment, a Web based survey and interviews and
discussions with practitioners and experimental participants.
Data was gathered through triangulation, evaluated through a combination of t-
tests and correlation and regression analysis. The findings show that
relationships exist between IQ and 1) trainee characteristics, 2) training design,
3) work environment, 4) trainee’ perception of IQ importance, and 5) trainee
work and documentation experience. The results from the analysis supported
the hypotheses and the need for an Information Quality Training Requirements
Analysis Guideline to aid the development of Information Quality Training
Plans. Based on this analysis it can be recommended that organizations use
the Information Quality Training Requirements Analysis Guideline before
implementing Information Quality Training Plans.

1
C h a p t e r 1
INTRODUCTION
1.1. Introduction and Background to Study
Many adverse events and medical errors have been found to be based on poor
information quality (IQ) practices. This study investigates the information quality
of healthcare documentation based on three dimensions of information quality:
accuracy, completeness and consistency. The purpose of the research is to
identify the key attributes of high quality healthcare information and to examine
the relationship between training of healthcare providers and information
quality.
Shared information about medication regimens have been identified as
concerns (Nadkarni 2006). An acceptable healthcare record is a prerequisite
for efficient treatment of patients and has a noticeable impact on the quality of
medical care. Even though we live in the information technology (IT) age,
patient care records continue to be mainly paper-based. Handwritten
documentation tends to be incomplete and thus may be unreliable. Causes of
medical errors include but are not limited to: poor communication among
caregivers; inadequate staffing; transcription errors that lead to poor IQ and
adverse drug effects.
Attention to medical errors escalated with the release of a significant review
concerning safety and quality of healthcare in the United States (US) in two
Institute of Medicine (IOM) reports: ‘To Err Is Human’ (IOM 2001) when they
2
reported that between 44,000 and 98,000 Americans die each year in hospitals
due to preventable medical errors (IOM 1999, IOM 2001; Berwick 2002; Sadler
Blair 2006). Errors involving prescription medications are responsible for up to
7,000 American deaths annually and the financial costs of drug-related
morbidity and mortality may reach $77 billion a year (Institute for Safe
Medication Practices (ISMP)).
A report from the President's Advisory Commission on Consumer Protection
and Quality in the Health Care Industry released in 1998 identified medical
errors as a major challenge in improving healthcare quality (AHRQ 1998). This
is further highlighted given that more than one in five Americans (22 percent)
report that they or a family member have experienced a medical error of some
kind (The Commonwealth Fund 2002). Based on the IOM's lower estimate of
44,000 deaths annually, medical errors rank as the eighth leading cause of
death in the US -- higher than motor vehicle accidents (43,458), breast cancer
(42,297), or AIDS (16,516) as of 1999 (AHRQ 2000; Jacobs et al. 2007).
In 2006 the IOM issued a follow up study in which they estimated that between
380,000 and 450,000 hospital drug errors occur annually and concluded that
there were at least 1.5 million preventable medication errors yearly (IOM 2006).
Since the release of the IOM studies, there has been a greater focus on the
quality of healthcare provided in the US, and an awakening of the healthcare
sector to the challenge of reducing the number of adverse events in hospitals
by inciting a redesign of the healthcare system (Gendon & D’Onofrio 2001).
The IOM define medical errors and adverse events as follows:
“Medical Error: the failure to complete a planned action as intended or the use of a wrong plan to achieve an aim.”

3
“Adverse Event: an injury caused by medical management rather than by the underlying disease or condition of the patient.”
Adverse events occur in 2.9 to 3.7 percent of hospital admissions (IOM 2001;
Berwick 2002). In the US these preventable patient injuries resulting from
medical mistakes cost the economy an extra $17 to $29 billion in annual
healthcare costs (IOM 1999; Connecting for Health Common Framework
2006). However, some adverse events are not preventable as they reflect the
risk often associated with treatment, such as a life-threatening allergic reaction
to a drug when the patient had no known allergy to it. The patient who receives
an antibiotic to which he or she is known to be allergic and dies, represents a
preventable adverse event (AHRQ 2006). Many of these adverse events are
due to poor IQ among caregivers.
A study conducted in 2008 by a team from the School of Pharmacy, Royal
College of Surgeons Ireland (RCSI) focused on the documentation involved in
the transfer of cardiology patients from an Irish training hospital. It found that
10.8 percent of medication prescriptions at discharge featured inconsistencies,
which affected 65.5 percent of patients. The most common inconsistency was
drug omission which accounted for 20.9 percent of the discrepancies (School
of Pharmacy RCSI 2008). This can be identified as a ‘completeness of
information’ problem, one of the many IQ dimensions discussed further in
Chapter 2. It was also revealed that medication errors at the time of hospital
admission are associated with one in five injuries or deaths and it was
estimated that 46 percent of medication errors occur when patient prescriptions
are written (School of Pharmacy RCSI 2008).
Another study carried out at Toronto General Hospital in 2006 consisting of 150
patients showed that 41.3 percent had at least one medication discrepancy at
hospital discharge. The most common discrepancies were incomplete
prescriptions requiring clarification (49.5 percent) and omitting medications
4
(22.9 percent). Of the discrepancies, 29.5 percent had the potential to cause
possible or probable patient discomfort and/or clinical deterioration (Toronto
General Hospital 2006). Here again the problem of 'completeness of
information’ is obvious.
The Department of Pharmacy, Sunnybrook and Women's College Health
Sciences Centre, Toronto, Ontario, Canada, undertook studies of patients
reporting regular prescription medication errors. All discrepancies were rated
for their potential to cause patient harm and at least one discrepancy appeared
in 53.6 percent of the cases studied. The most common error (46.4 percent)
was the omission of a regularly used medication and 38.6 percent of these
discrepancies had the potential to cause moderate to severe discomfort or
clinical deterioration (Department of Pharmacy, Sunnybrook, Toronto, Ontario,
Canada 2010). This study further enforces ‘completeness’ as being a major
area for concern.
The Faculty of Medicine University of Ottawa, undertook a systematic review of
studies describing the frequency, type, and clinical importance of medication
history errors at hospital admission. Errors in prescription medication histories
occurred in up to 67 percent of cases and over a quarter of hospital prescribing
errors are attributable to incomplete medication histories at the time of
admission (Faculty of Medicine University of Ottawa). This is another example
of completeness problems within healthcare documentation.
The quality of medical prescription in the Department of Community Medicine,
University of Ribat, Khartoum (University of Ribat, Khartoum 2010), detected
errors in doctors' prescriptions by randomly selecting one thousand medical
prescriptions and checking them for completeness and legibility. The patient's
full name was written on 18.8 percent of prescriptions, and that of the doctor
6.7 percent. In only 19.5 percent were drugs prescribed by their generic

5
names, 59.7 percent lacked the quantity of the drug, 25.7 percent lacked the
duration of treatment and 15.8 percent were difficult to read (University of
Ribat, Khartoum 2010). Another study presented findings from a small pilot
study conducted to identify medication documentation problems at the point of
hospital discharge among older adults. A review of 104 medical records
revealed several problems in documenting patient medication including
legibility, use of medical abbreviations and incomplete and missing entries.
Patients reported taking more drugs than were listed in the medical record
(University of Ribat, Khartoum 2010). Yet again, completeness is posed as
being among the most common occurring problems within documentation
followed by ‘consistency of information’. From these studies the problem most
often highlighted is lack of completeness. A table of studies on medical errors is
given in Appendix A.
In Ireland too, medical errors are often highlighted in the media because they
are considered to be extraordinary cases. Healy (2010) reports on a 62 year
old woman who was awarded 90,000 euro in High Court damages after a
surgical wire was left in her body during an operation. O’ Regan (2007)
reported ‘one in 10 patients is a victim of hospital blunders’; Donnellan (2007)
declared that ‘60 percent of Accident and Emergency (A&E) patients had errors
in their prescriptions’; Keogh (2006) reported an incident where a ‘mother died
after the ambulance went to the wrong address’; Donnellan (2010) reports
where an inquiry told of a kidney removal error on an 8-year-old boy at Our
Lady's Hospital for Sick Children in 2008, and in yet another case Donnellan
and Smyth (2010) reports that a woman was wrongly told she had miscarried
her baby when in fact she was still pregnant.
Hospitals in Ireland have reported nearly 300,000 incidents involving mistakes
or near misses in the last five-and-a-half years resulting in €133m in
compensation payouts. Of the overall number, 3,522 incidents had gone on to

6
result in compensation claims (http://www.hospitalmanagement.net/press/).
Moreover, according to the Clinical Indemnity Scheme (CIS), which provides
state insurance for hospitals and other health agencies, there were 55,058
events in 2007. A total of 431 claims were submitted to it arising from adverse
incidents (www. irishhealth.com 2009). The following year witnessed a rise of
more than 50 percent, bringing the number to 83,661 reported adverse
incidents. During the same period, medication errors rose from 5,436 to 6,785
cases. According to information gathered by the State Claims Agency (SCA),
almost 84,000 clinical errors or adverse events affecting patients were
recorded in Irish hospitals in 2008. Although the majority related to slips and
falls, thousands involved more serious medication and treatment errors, These
include: (8,250) medication incidents such as incorrect doses or the wrong
medicine administered to patients; treatment incidents, which included
incorrectly leaving surgical swabs or devices in patients’ bodies following
operations (5,559) and incorrect records or documented events (5,650), which
led to 'near misses' or, in rare cases, catastrophic incidents (O'Brien 2010).
The average cost of an award was €63,000. Patient safety and the reduction
of medication errors have now become widespread topics of discussion.
There are estimates quoted in various international studies of between 4 and
11 percent of total hospital admissions that highlight medical accidents as
being a leading cause of premature death. A study of 30,000 hospital records
in New York, Brennan et al. (1991), found that injuries from care occur in 3.7
percent of hospital admissions and 13.6 percent of these led to death. There
are in excess of 4 million patient cases admitted to or treated by Irish hospitals
per annum and making the assumption that 4 percent are injured due to
medical accidents, this would equate to 160,000 patients injured per annum in
Ireland in hospitals due to medical accidents (Boylan 2010).

7
Even though the actual figure is unknown (because no studies have been
carried out), this number is consistent with the most recent figures from the
SCA. Based on international figures, as many as 8,000 patients may die each
year in Ireland as a result of preventable clinical errors (O'Brien 2010).
According to Boylan (2010), claims submitted through the CIS show that the
highest number of claims by specialty was surgery with 119 claims up to
December 2009, followed by Medicine 110; Obstetrics 102; Emergency
Medicine 62; and Gynaecology 24. In addition, figures obtained by the Medical
Independent (Kelly 2010) show that in the period of 1 July 2009 to 31
December 2009 the HSE paid €14.851 million to the SCA to deal with medical
litigation settlements.
In Ireland more than €60 million was paid out in 2009 to patients who suffered
from serious medical errors in the health service. This figure is €13m lower than
the total paid out by the State in total for the previous five years between 2003
and 2008, and according to SCA this sum was provided as compensation for
thousands of medical claims taken by patients (O Cionnaith 2009), see table 1-
1.

8
Table 1-1 Prominent Medical Litigation Settlements 2008/2009
PROMINENT MEDICAL LITIGATION SETTLEMENTS 2008/2009
Myers v
St James's Hospital
Brain injury as an alleged result of misdiagnosis €6.5 million
+ legal costs
Leo Conroy v
Rotunda Hospital
Severe hypoxia, cerebral palsy as a result of alleged undue delay in
recognising foetal distress and delay in performing Caesarean section:
€5.25 million
+ legal costs
CB v
CLIH
Severe spastic quadriplegic cerebral palsy resulting from alleged failure to
respond to abnormal CTG trace:
€2 million
+ legal costs
MK v
CNOH
Negligent perforation of elderly plaintiff's bowel during routine hip
replacement:
€80,000
+ legal costs
AD v
CLIH
Death of infant boy, physical/psychological injury to parent, resulting from
alleged negligent management of labour:
€115,000
+ legal costs
DK v
CLIH & NG
Permanent injury to brachial plexus, resulting from alleged excessive
amounts of oxytocin and excessive force/traction during labour
€190,000
+ legal costs
SM v
HSE & MM
End-stage renal failure, resulting from alleged negligence by GP and
hospital in failing to diagnose and act upon impending renal failure
€350,000
+ legal costs
IH & DH v
HSE & KH
Death of infant girl, physical/psychological injury to parents, resulting from
alleged sub-standard care by obstetrician and midwifery staff
€80,000
+ legal costs
SM
v RR
Brachial plexus injury causing disability, resulting from alleged negligence €800,000
SK
v RH
Alleged hospital negligence resulting in perineal trauma during labour €270,000
+ legal costs
CT & KT v
HSE
Emotional/psychiatric damage to parents alleged from labour complications €100,000
MMCD
v MH
Scrotal orchiectomy due to alleged failure to manage post-operative
infection
€125,000
+ legal costs
One case involved the Rotunda Hospital, Dublin versus Leo Conroy who was
born on the 20 March 2003 in very poor condition. He suffered severe injury to
his brain leading to cerebral palsy. The case made on his behalf was that in
the hours prior to his birth the monitor, which was recording his heart rate,
indicated that he was suffering from ever increasing and severe fetal distress,
which was not acted upon by the attending midwives or doctors. Unfortunately
the undue delay in recognising these signs led to an undue delay in performing
an emergency Caesarean Section. The case was settled for a sum of
€5,250,000 plus costs (Boylan 2010).

9
Another case in 2009, Myres v St James’ Hospital (Boylan 2010) obtained
€6.5 million to a catastrophically injured 50 year old woman with an
undiagnosed subarachnoid hemorrhage. Myers attended St James’ A&E
Department and was wrongly discharged from hospital without the benefit of a
CAT scan investigation. She collapsed at home 24 hours later and was taken
by ambulance to Beaumont Hospital where she underwent emergency surgery
to evacuate the large haematoma which had formed as a result of bleeding.
Unfortunately although her life was saved by the neurosurgery performed at
Beaumont, she was left with permanent brain damage and cognitive deficits as
a consequence of the uncontrolled bleeding which had occurred following her
discharge 24 hours previously from A&E in St James’ Hospital.
The CB v CLIH case was that of a minor suffering from severe spastic
quadriplegic Cerebral Palsy. Substandard care on the part of hospital and
obstetric staff in failing to respond to an abnormal CTG trace (which monitors
the baby’s heart rate) and to signs that the unborn baby was in distress
suggested that the hospital and staff were negligent in failing to expedite
delivery of the baby which would have prevented the baby’s severe brain
injury. The case settled for a damages amount of €2 million plus legal costs.
MK v CNOH: involved the negligent perforation of the elderly womans’ bowel
during a routine hip replacement procedure in April of 2005. The woman was
in her mid 80’s at the time of surgery. Her solicitor alleged negligence on the
part of the Hospital as there were numerous delays. The case settled for
damages of €80,000 plus costs.
AD v CLIH: a pregnant lady had a significantly increased risk of uterine
rupture during labour that required a caesarean section. The Hospital gave
her increasing amounts of syntocinon (a synthetic equivalent of the body’s
own hormone, oxytocin, which is used to induce labour and increases

10
strength and frequency of contractions). This caused unduly frequent uterine
contractions which are known to cause foetal distress and to put more stress
on the uterus itself. Ultimately the Plaintiff’s uterus ruptured and her baby son
was deprived of oxygen resulting in catastrophic brain injuries from which he
died a day later. The damages offer was €115,000 plus costs.
DK v CLIH & NG: is a case involving a young boy. He was a large baby at the
time of his birth and during the delivery a shoulder dystocia occurred. It was
alleged that there was negligence on the part of the Hospital and the
obstetrician in negligently using excessive amounts of oxytocin and that the
obstetrician in charge of the labour used excessive force when pulling on the
baby’s head in an effort to release the trapped shoulder. As a result the baby
suffered a permanent injury to his brachial plexus (the network of nerves
running from the spine, proceeding through the neck, through the armpit
region and in to the arm). Damage to this network of nerves caused
permanent disability and significantly limited his use of his left arm and hand
for everyday tasks such as dressing. The settlement for damages was
€190,000 plus legal costs.
SM v HSE & MM: the plaintiff in this case was a young man in his late teens
who attended the hospital in the late 2000 and due to the failure of the
hospital to carry out appropriate tests, his impending renal failure was not
diagnosed. A few months later, the plaintiff attended his GP at which time
blood tests were carried out. Despite the fact that his blood results were
abnormal and indicated a renal problem, these results were not acted upon.
As a result, the plaintiff later collapsed with end-stage renal failure, lost
consciousness and suffered from seizures. He suffered a number of cerebral
haemorrhages, which caused permanent cognitive deficits. He required
dialysis three times a week and had to undergo a renal transplant many years

11
earlier than he otherwise would have done. The case settled for a damages
amount of €350,000 pus legal costs.
In the case of IH & DH v HSE & KH: the plaintiffs were a married couple. As
the wife had a complex obstetric and gynaecological history and had
undergone a previous classical caesarean section there was a greater risk of
uterine rupture in subsequent pregnancies. During her 37th week of
pregnancy, the plaintiff contacted the Hospital complaining of pain and
tenderness around the site of the previous classical caesarean section scar.
She was admitted to the labour ward of the Hospital and suffered a uterine
rupture, which caused the death of her baby daughter. A delay in expediting
delivery of the baby once a decision had been made to deliver by emergency
caesarean section resulted in the uterine rupture. The case settled on for the
amount of €80,000 plus legal costs.
In the case of SM (a minor) v RR: the plaintiff’s mother was admitted to
Hospital under the defendant’s care and the plaintiff claimed that by reason of
the negligence of the defendant during labour and delivery, the plaintiff was
caused to suffer a brachial plexus injury as a result of shoulder dystocia
resulting in a permanent and significant disability. The case settled for the
sum of €800,000.
In the SK v RH case it was alleged that failure to identify the extent of the
perineal trauma suffered during delivery resulted in debilitating symptoms of
incontinence. Expert opinion was received outlining the extensive
reconstructive surgery the plaintiff would require in order to correct the defect
in her anal sphincter muscle and to close the recto-vaginal fistula. It is
established medical opinion that secondary repairs are far less satisfactory
than primary repairs made immediately following delivery and carry a greater

12
chance of failure. The matter was settled for a sum of €270,000 plus legal
costs.
CT & KT v HSE: CT underwent a traumatic delivery of her child in late March
2004. AT was born in very poor condition and required resuscitation and
intubation and was taken to the Special Care Baby Unit. The plaintiffs held
leading expert psychiatric evidence to show the severe mental trauma they
suffered due to the defendant’s negligence in the delivery of their son. The
plaintiffs’ case concluded after their child’s cerebral palsy action in late 2008
for €100,000. The settlement was without an admission of obstetric fault
causing psychiatric injuries to the plaintiffs.
MMCD v MH: in this case the plaintiff attended the hospital where he was
diagnosed with a tense large hydrocele (a swelling of the scrotum caused by
excessive fluid caused by inflammation or trauma). He underwent surgery
some months later for drainage and plication of the hydrocele and was
discharge two days later. Shortly after the plaintiff was discharged he
complained of scrotal swelling, pain and a discharge from the surgical wound.
His General Practitioner referred him to the hospital A&E Department. Here
he was reviewed by the Urological Registrar who reassured him that there
was no infection. He returned in 11 days for outpatient review by his
Consultant Urologist who examined him and noted a major infection in his
scrotum requiring admission for further investigation and intravenous
antibiotics. The plaintiff later underwent the insertion of a testicular prosthesis.
The allegations of negligence made on behalf of the plaintiff were; that there
was a failure to provide adequate antibiotic cover in the immediate
postoperative period when only 1 to 2 days of cover were provided following
an operation that routinely requires 7 to 10 days of antibiotic cover; there was
a failure to diagnose the post operative infection when the plaintiff was
referred back to the surgical team by his General Practitioner when he first

13
complained of swelling, pain and a discharge; a failure to diagnose the extent
of the infection when the plaintiff attended for the second time at the
defendant Hospital and a failure to prescribed adequate antibiotic treatment
as was required at that stage. It was also unfortunately the case that the
plaintiff’s testis could have been saved had the extent of the infection been
appreciated on either of his earlier attendances at the hospital. The matter
settled for a damages sum of €125,000 plus legal costs.
Therefore, improving quality of healthcare and healthcare information is not just
an academic exercise; it is of utmost importance to healthcare providers. One
observable problem has been over-reliance on the quality of healthcare
records. Complex care is typically uncoordinated, information is often not
available to those who need it when it is needed, and as a result patients often
do not get care they need.
1.2. Motivation for Conducting this Research
As the previous section outlined, many adverse events in healthcare can be
attributed to IQ problems. Recent findings regarding the cost of medical errors
highlight the importance of seeking ways to improve patient safety and
reducing costs. As IQ problems are often associated with high costs, improving
IQ is fast becoming a significant issue for healthcare providers, managers and
government departments. In this section we highlight the importance of IQ and
its effect in both the public and private sectors, which provided the motivation
for conducting this research. Current evidence shows that poor IQ is pervasive
and has a significant negative effect on healthcare and business success
(Mathieu & Khalil 1998). Evidence in the literature supports the notion that
poor healthcare information leads to substantial loss in human life,
compromised quality of life and also economic losses (Redmond 1996;
Eckerson 2002; Fisher et al. 2006). Quality improvement in healthcare today is
14
occurring at many levels, but is generally poorly coordinated. Further research
is needed to elicit the theoretical underpinnings on which to understand the
needs of healthcare in managing IQ.
Many of the IQ issues found in healthcare are also found in other industries.
The impact of poor IQ on business performance is widely studied. A common
perception is that good IQ improves decision quality and in turn business
performance. One prime example is the eyewear company that failed to
recognize that data errors were the root cause of their fifteen percent lens-
grinding rework rate, costing the company at least $1 million yearly (Wang et
al.1998). Another typical example is the healthcare organization that
consistently overpaid $4 million in claims annually for patients who were no
longer eligible for benefits (Katz-Haas & Lee 2005). It is further highlighted by
the hospital staff who misplaced a decimal point, failed to notice the error, and
then allowed a fatal overdose to be administered to a paediatric patient (Belkin
2004). Despite the pervasiveness of poor IQ, many users appear to be
ineffective in detecting errors. More than 60 percent of surveyed firms had
problems with IQ (Wand & Wang 1996). This suggests that information users
are not always aware of the poor quality of information on which they rely.
In other industries, it is estimated that 1 percent to 10 percent of data in
organisational databases is inaccurate (Klein et al. 1997; Klein 1998) and many
organisations have experienced the adverse effects of decisions based on poor
IQ (Huang et al. 1999). Redmond (1996) report that poor IQ costs the typical
company from 10 percent to 20 percent of revenue. English (1996/2004) infers
that wrong price data in retail databases may cost American consumers as
much as $2.5 billion in overcharges yearly. Fisher et al. (2006) report that IQ
problems cost US businesses more that $600 billion per year. Moreover,
leadership and management depend on the quality of decisions (Redmond
1996), the quality of the data used to make them (Ballou & Tayi 1999) and the

15
quality of information service in general (Mathieu & Khalil 1998). As in all
organizations, healthcare managers rely on data to direct and lead them and
the complexity of healthcare needs an extensive range of decisions, both
administrative and health-related. When doctors make decisions using poor IQ
there is a greater risk that their conclusions may be wrong.
As the health sector is increasingly an information driven service, IQ is often
linked to the use of the Information Systems (IS). Health information is made
up of varying types of information that include administrative information
needed to manage the complex business of healthcare, and clinical information
based on patient related data found in patient records. This information
describes the characteristics of the patient, their illness, and their healthcare
plans. Healthcare professionals need to share and exchange information
about the care of their patients. However handover between shifts which are
aimed at preserving the flow of activities (Patterson & Woods 2001) have
caused preventable adverse patient reactions (Perry 2004; Van Eaton et al.
2004). AHRQ (2006) explains how failed handovers contributed to a patient’s
death. Patient heart rates, blood pressure, temperature or drug administration
may be recorded incorrectly and not sufficiently. Thus, IQ problems arise when
there is incomplete, inaccurate and inconsistent information (Wand & Wang
1996). Information of high quality enables the healthcare team to respond to
sudden changes in the patient’s condition, (Hall et al. 2005).
Yet, until the IOM 1999 report, medical errors did not receive the attention or
awareness of the significant financial burden that make an impact on the
healthcare system. The IOM report estimates that medical errors cost the US
roughly $37.6 billion each year and about $17 to 29 billion of these costs are
associated with preventable errors (IOM 1999). The Centres for Medicare and
Medicaid Services project that US spending on healthcare will rise to $2.82
trillion in 2011 and the cost of poor quality care will likely exceed $1 trillion. The
16
study found that 30 percent of direct healthcare spending was the result of poor
quality care much of which is rooted in poor quality IQ (Charatan 2002). Outlay
in healthcare has increased dramatically in the past ten years. In Ireland,
according to the Irish Medical News (2006), there was a significant increase in
health spending from 3 billion in 1995 to a gross current spending of €15 billion
in 2009.
The Organisation for Economic Co-operation and Development (OECD) Health
Data (2008), which compares health systems and government spending for 30
countries over the last decade, reports that the percentage of Ireland’s GDP
assigned to health is below the European average. It was found that total
health spending accounted for 7.5 percent of Ireland’s GDP in 2007. This is
almost 1.5 percent lower than the 8.9 percent average for other OECD
countries in Europe. Looking at the trend during this decade, the US spent the
most on healthcare as a share of its economy, with 16 percent of its GDP
assigned to health in 2007, followed by France at 11 percent and Switzerland
at 10.8 percent. Several EU countries, Germany, Belgium and Austria also
devoted more than 10 percent of their GDP to health in 2007. These figures
suggest that healthcare issues are not solely due to lack of funding, but
suggestive of other causes including poor IQ. Management decisions that
designate tasks to improperly trained personnel make errors more likely, such
as emergency room physicians or nurses not checking administered drugs or
dosages. The financial downside to medical errors is a significant issue facing
hospital executives.
Many authors have tried to optimize training through development of theoretical
models and by examining the impact of training variables such as trainee
characteristics, training design, and work environment factors on the transfer
process (Baldwin & Ford 1988; Thayer & Teachout 1995; Holton 1996). This
study considers that training is an important aspect in order to improve IQ and

17
thus healthcare. Due to the lack of detailed studies, the impact of training on
IQ is relatively unknown. However, analysis from this study shows that training,
trainee characteristics, work environment factors, perception of IQ, and work
experience, are high predictors of IQ. The results suggest the need to design
an Information Quality Training Requirements Analysis Guideline (IQTRAG) to
support development of Information Quality Training Plans (IQTPs).
1.3. Research Proposition
This research aims to investigate the relationship between training and IQ.
Therefore, the objective of this study is to present and test a model of the
relationship between training design, trainee characteristics and the work
environment and IQ. This study will also evaluate the potential impact of each
of these predictors on IQ in three IQ dimensions: accuracy, completeness and
consistency. The identification of types of error and classification into
dimensions of IQ are helpful in their prevention and reduction.
The impact of these elements on IQ outcomes using subjective and objective
measurement was investigated via a mixed method approach. Accuracy,
completeness and consistency were used as the measure of IQ performance.
By analysing the relationship between training and other predictors of IQ on IQ
output, an Information Quality Training Requirements Analysis Guideline was
developed as a problem based solution to improve IQ.
As a society we are part of many different social systems and dependant on
information shared with others. Thousands of research reports have been
produced on user information needs (Dervin & Nilan 1986; Wilson & Walsh
1996). Hospital professionals such as nurses and doctors contribute to
recording information in patient charts, and problems occur when information is
not recorded in a quality fashion. Inaccurate and incomplete information may
18
lead to severe operational outcomes that lead to life-and-death issues. As
discussed above, poor healthcare documentation is a fundamental issue that
needs to be addressed.
As the aim of this research is to analyse the relationship and impact of three
important categories of predictors of IQ: training, the work environment and
trainee characteristics the general research proposition is as follows: ‘If
systematic training is applied, information quality will increase in a way that will
ultimately decrease medical errors in documentation’. This led to six sets of
hypotheses.
The first of hypothesis focused on the effects of training on IQ (accuracy
consistency and completeness measured by comparing the error logs for µ
accuracy, µ consistency and µ completeness of information filled in manual
filled patient records before and after training), so as to put in place a
systematic processes that identify predictors of Information quality and to
develop an Information Quality Training Requirements Analysis Guideline as
means to improve IQ.
H1: ‘If systematic training is applied training will be associated with improved
IQ.
The general expectation that training will produce more accurate, consistent
and complete information that led to three sub-hypotheses:
H1a: ‘If systematic training is applied consistency will be associated with
improved IQ.
H1b: ‘If systematic training is applied accuracy will be associated with improved
IQ.

19
H1c: ‘If systematic training is applied completeness will be associated with
improved IQ.
Another aspect of good IQ outcomes is trainee characteristics. While medical
incidences are instructive in highlighting the importance of IQ, it should be
noted that not all errors are attributable to lack of training. Noticeable research
in the training literature, Chapter 2, supports the relationship between
personality traits and job performance (Barrick & Mount 1991; Costa & McCrae
1995; Colquitt & Simmering 1998; Barrick et al. 1998). Among those traits,
conscientiousness (Costa & McCrae 1992) is considered to be especially
promising in predicting training proficiency (Hogan & Ones 1997). Therefore,
the second hypothesis is to examine the possible effect of the trainee
characteristic (conscientiousness) on IQ (accuracy, consistency and
completeness).
H2: Conscientiousness will be associated with improved IQ.
The expectation is that trainee characteristics will be a high predictor of IQ. In
order to investigate how trainee characteristics have an impact on IQ, we
investigate 4 further sub-hypotheses.
H2a: Self discipline will be associated with improved IQ.
H2b: Achievement striving will be associated with improved IQ.
H2c: Dutifulness will be associated with improved IQ.
H2d: Self-efficacy will be associated with improved IQ.
A third aspect worthy of investigation was training duration and sequencing.
Martocchio & Judge (1997) noted a negative correlation between
conscientiousness and learning on a study carried out after a short training

20
program, while Colquitt & Simmering (1998) reported a positive correlation
between conscientiousness and learning when they adopted a longer training
program. Consideration of time in training may account for discrepancies in
findings between these two studies. Therefore, the third hypothesis examines
the impact of training programs on IQ.
H3: ‘If systematic training design is applied training design will be associated
with improved IQ. The expectation is that training duration and sequencing will
be predictors of IQ.
H3a: ‘If systematic training design is applied training duration will be associated
with improved IQ.
H3b: ‘If systematic training design is applied training sequencing will be
associated with improved IQ.
Many frameworks outline factors that may promote the transfer of skills after
training. Kozlowski & Salas (1997) discuss the importance of characterizing
the factors and processes by which training interventions are carried out in
organizations. If significant progress is to be made in improving IQ then quality
managers must develop an understanding of how and why training works or
does not work. Such an understanding must bring together laws governing
human characteristics with laws governing the environments in which they
operate. Therefore, another influencing factor on IQ is the work environment
which suggests the fourth hypothesis.
H4: Work environment will be associated with improved IQ. The expectation is
that the work environment plays a role in predicting IQ.
H4a: IS (Information Systems both IT based (electronic) and paper based
(manual)) will be associated with improved IQ.

21
H4b: Support factors will be associated with improved IQ.
H4c: Form layout will be associated with improved IQ.
Errors can be classified as skill-based, knowledge-based and other errors such
as judgment based on experience. Therefore the fifth hypothesis is:
H5: Experience will be associated with improved IQ
H5a: Experience on documentation recording will be associated with improved
IQ.
H5b: Work Experience will be associated with improved IQ.
According to (Olson 2003) accurate information is ‘the most important
dimension’ of good quality IS, yet many IS contain errors and most
organisations lack the basic understanding of the concepts of IQ. Therefore the
sixth hypothesis is as follows:
H6. Perception of the importance of IQ will be associated with improved IQ.
1.4. Research Approach
This section outlines the research approach and highlights its significance and
contribution to the knowledge base. To build a robust healthcare system,
researchers need to understand factors that contribute to better IQ. It is noted
from the literature review in Chapter 2, that there has been little theoretical,
practical or empirical research on IQ predictors. As a result, this study was
positioned to fill this gap. Therefore, a conceptual model to empirically explore
IQ predictors was developed by adjusting the 'transfer of training' model
designed by Baldwin & Ford (1988) to fill similar gaps in the training literature.
The IQ predictor model consists of three primary lenses: Firstly, trainee

22
characteristics (self-discipline, self-efficacy, dutifulness and achievement
striving under the construct of conscientiousness): secondly, training design
(frequency, duration, perception of IQ importance and trainee experience), and
thirdly, the work environment (peer support, information system, and form
layout). The model also incorporates an IQ outcomes element assessed on
three main IQ dimensions, namely accuracy, completeness and consistency.
Elements investigated within this study are represented by the � symbol within
this model (see figure 1-1).
Figure 1-1 Predictors of Information Quality
The research methodology followed in this study is guided by principles of
Design Science (DS) discussed in detail in Chapter 3. Data for this study was
collected by a mixed method approach which was comprised of 1) a controlled
experiment, 2) a Web-based survey and 3) group interviews and discussions.
This study employed multiple regression to test the theory and model. Multiple
regressions were used because this method allows prediction of the criterion
variable (IQ) based on scores obtained from the predictor variables (trainee

23
characteristics, training design and the work environment) and accounts for
variance in the scores of the predictor variables. According to Mertler &
Vannatta (2005) multiple regression is most appropriate for predicting a single
criterion variable in the presence of multiple predictor variables when all
variables are of the interval type. In relation to this research a roadmap is
provided (see figure 1-2).
ResearchProposition
Results
Hypothesis
Experiment
Survey
Interviews
IQ Predictors
ObjectiveMeasures
SubjectiveMeasures
IQTRAG
Investigated by
Validates
Identified
DSSolution
Evaluatedby
Providedby
Providedby
Provides
Figure 1-2 Research Roadmap
The results of the analysis led to the development of an Information Quality
Training Requirements Analysis Guideline (IQTRAG) to aid in the development
of individualised, tailored, Information Quality Training Plans (IQTPs). The
contribution to the body of knowledge is threefold: 1) it identifies important
influencing factors (training, trainee characteristics and the work environment)
of IQ and combines them in a conceptual model: 2) It provides objective and

24
subjective IQ indicators and measurement instruments within a particular
context or task, which allows quantitative assessment of the impact of these
constructs on IQ, and 3) it provides an IQTRAG to aid the design of individually
tailored, IQTPs.
This contribution is expected to benefit both researcher and practitioner. The
model presented is applicable to researchers interested in examining various
aspects of relationships between trainee characteristics, training design, the
work environment and IQ. Researchers are therefore encouraged to use this
model and continue testing its capabilities. They may also benefit from
considering the empirical findings of this research when developing research
models to examine similar phenomena.
Practitioners can benefit from applying the results of the analysis to their own
IQ performance measures and using the IQTRAG in the development of
IQTPs. In particular, this research shows that trainee characteristics, training
design, documentation recording experience, perception of IQ importance and
the work environment are associated with improved IQ.
1.5. Thesis Organization
This thesis is presented in seven chapters. Chapter 1 has outlined the
background, motivation, research propositions, research approach and its
contribution of the research to the body of knowledge. Chapter 2 presents a
review of related work in the IQ and training literature, and gives an overview of
the most commonly used IQ frameworks and training models. It reveals a gap
in the literature, which highlights the significance of our chosen research area,
conceptualises the research model leading to the development of suitable
hypotheses and sets this research in its academic context. Chapter 3 presents
a research methodology suitable to investigate the research proposition which
25
is guided by principles of Design Science (DS). Chapter 4 provides an account
of the experiment data collection method used in this study and provides the
results of the data analysis. Chapter 5 presents an outline of the survey
analysis of the data and gives an insight into the relationships between
selected IQ predictors and how they impact on IQ. Chapter 6 presents a
problem based solution, IQTRAG. Chapter 7 concludes with a summary and a
discussion of the main findings, limitations of the study and recommendations
for future research.

26
C h a p t e r 2
REVIEW OF RELATED WORK
2.1. Introduction
Chapter1 introduced the background to the study, the research proposition,
and a contribution to the body of knowledge. This chapter presents a review of
the related literature relevant to this study. In section 2-1 the Quality
Management (QM) literature was explored with a view to tracing the evolution
of Information Quality Management (IQM). Total Quality Management (TQM)
approaches were also reviewed. TQM literature revealed that IQM was seen to
have embedded its theoretical roots in TQM. An overview of Information
Quality (IQ) is provided in section 2-2 and a rigorous attempt to find a
universally accepted definition of quality section 2-2-1. IQ models,
measurements and control initiatives are outlined in section 2-2-2, 2-2-3, and 2-
2-4 respectively which led to the research proposition under investigation
section 1.3. The importance of training, which is widely recognised as an
important factor in organizational performance and training evaluation models,
is given in section 2-3. The influence of personality is discussed in section 2-4.
Section 2-5 reveals a gap in the literatures which supports the research
proposition under investigation and highlighted the need to develop an
Information Quality Training Analysis Guideline (IQTRAG) as a practical
solution to the identified problem. Section 2-6 gives a brief summary of the
chapter.

27
Every few decades a new management philosophy emerged, which captured
the attention of many strategic thinkers in organisations. In the 1960's and
1970's, the focus was on process automation. In the 1980's the leading edge
was TQM and in the mid 1990's, the emphasis was on IQM in an attempt to
improve quality by performing continuous improvement strategies and
thereby, reducing unnecessary costs.
The evolution of quality concepts can be categorised in several phases: quality
control, quality management approach and quality processes (Levis et al.
2007). Quality control can be traced to the pre-industrial revolution era, when
inspection committees enforced rules for marking goods with a special quality
mark to represent a crafts-worker’s good reputation (ASQ 2006). Late in the
19th century the United States (US) adopted the scientific management
approach developed by Frederick Taylor. Taylor’s goal was to increase
productivity by assigning inspectors, which led to remarkable rises in
productivity but had a negative effect on quality (Fox & Frakes 1997; Stephens
& Juran 2005). To correct the quality decline, factory managers created
inspection departments to keep defective products from reaching customers
and quality was understood as conformance to some standard (Fox & Frakes
1997; Stephens & Juran 2005). In the early 20th century, manufacturers began
to include quality processes in practice (ASQ 2006). After the US entered
World War II, quality became a critical ingredient of the war effort as bullets
made in one state had to work consistently in rifles made in another state
(Crosby 1995).
In the 1950’s Japanese businesses welcomed the input of ‘Quality
Management pioneer’, Edwards Deming who advised them on quality (Deming
1995; Wheeler & Duggins 1998; Madu 2003). Rather than concentrating on
inspection they focused on improving all organizational processes (Beckford
2005). Improvements in quality were seen as a means to increase productivity,

28
lower costs, and provide the customer with the desired product (Fox & Frakes
1997; Wheeler & Duggins 1998). In 1954, Juran arrived in Japan with his new
insights into management’s responsibility for improving quality in production
(Deming 1995) and with the help of Ishikawa, Japanese quality improved
dramatically and captured markets the world over.
By the 1970’s, many organisations embraced TQM approaches that involved
the entire organization (ASQ 2006). TQM incorporates the ideas of product
quality, quality control, quality planning, quality assurance and quality
improvement. Thus, TQM is the control of all transformation processes of an
organisation, to better satisfy customer needs in the most economical way
(Juran 1979; Deming 1982). In essence, the three basic principles of TQM
are: 1) focus on customer satisfaction; 2) seek continuous and long-term
improvement in all organizations’ processes and outputs, and 3) ensure full
involvement of the entire workforce in improving quality. An effective TQM effort
will need the participation of everybody in the organisation (Omachonu et al.
2004) and good communication between departments is important (Soin 1998).
However, the entire total quality effort must be planned and managed by the
company’s management team (Soin 1998). Most quality management leaders
agree that the biggest ingredient, and most critical issue in quality, is the
management commitment to support employees who in turn support the
customer (Blades 1995; Beckford 2005).
Critical factors identified in QM studies focus on performance measurement
(Mann & Kehoe 1994; Oakland 2003), and quality training (Snell & Dean 1992;
Blackburn & Rosen 1993). Many constructs can be assigned to human related
causes: for example, employee training (Anderson et al. 1995; Black & Porter
1996). Mandal et al. (1998), notes that companies committed to TQM invests
in training. Bacdayan (2001), agrees that: ‘Training costs may be justified as a
long-term investment in TQM skills at the grass-roots level’

29
Quality pioneer Deming declared that Japanese firms regard their employees
as their most significant competitive asset and therefore provide them with
good training in specific skills (Deming 1982) and he highlighted that ‘the
customer is the most important part of the production line’. Bowen (1996)
states that organizations should also recognize information as a business
asset, and many authors suggest that organisations should define direct
management responsibilities for it (Redmond 1995; Pierce 2004; Helfert &
Herrmann 2005; Bertoletti 2005). Customers, suppliers, and employees may be
adversely affected through poor service, billing errors, and inconvenience and
such negative effects are often revealed in the direct and indirect costs of
correcting data errors (US Dept of Defence 1997).
2.2. Information Quality Management
This section examines the literature addressing Information Quality
Management (IQM). The goal of IQM is to increase business effectiveness by
removing the costs of poor IQ and increasing the value of high-IQ assets
(English 2002b). Many researchers and academics give elaborate definitions of
the differences between data, and information. Data is a collection of discrete
objects, facts or events that is out of context. It is also known as unprocessed
information. Inside the spread sheet of excel in each cell we store data, on its
own it does not give any information. For example when we store the accuracy
level of the patient care document in a spread sheet we call it data. We may do
some categorization on the data to get a meaningful output from it. The
processed data is known as information. From a collection of data we can
derive meaningful information (conclusion). The accuracy figure stored in a
spread sheet on its own can't give any conclusion but on observation or by
statistical tools we may see that the accuracy levels of trained employees are
better than the accuracy levels of untrained employees. This is the information
we can get out of the accuracy data. Another example is the recorded blood

30
pressure of a patient is known as Data. By the process of checking the blood
pressure of the patient we can say that the patient is having high blood
pressure. This is information as we are able to get a meaningful conclusion
from the blood pressure readings.
However some researchers do not distinguish between Data quality (DQ) and
IQ and the use of the terms IQ and DQ is considered by many researchers to
be synonymous (Bovee 2004), In business practice such distinctions, while
intellectually interesting, are peripheral to the main information quality focus.
Information managers have a much clearer idea which people are crucial to
their firm's success more than they do about distinctions between information
and data.I In this thesis the terms data and information is used interchangagly.
The concern for better IQ is reflected by efforts to model, improve, measure
and define it (Dillard 1992; Jang et al. 1992; Wang & Kon 1993; Wang &
Reedy 1993; Wand & Wang 1996) see table 2-1. Several researchers have
developed quantitative models to help IS developers evaluate, improve, and
manage data accuracy (Morey 1982; Ballou & Pazer 1985; Paradice & Fuerst
1991; Bowen 1992). Wang et al. (1995), provides an overview of data quality
methodology. Some researchers promote Total Data Quality Management
(TDQM), to improve IQ (Wang & Kon 1993). Huh et al. (1990), Wang & Kon
(1993), Huh et al. (1994) recommend using statistical process control (SPC)
to measure, control, and improve IQ.

31
Table 2-1 Products Vs Information Manufacturing Wang (1998)
Methodology Description Main Reference
TDQM Total Data Quality Management Wang 1998
TIQM Total Information Quality Management English 1999
AIMQ A methodology for information quality assessment Lee et al. 2002
DQA Data Quality Assessment Pipino et al. 2002
High-IQ is a result of IQM and serves as a lever to quality success. However,
there are many reasons why an IQM effort fails. Chiefly, senior managers are
sometimes looking for immediate solutions rather than long-term quality
improvement and fail to understand that IQ must be embedded in the culture
and environment of the organization. Research suggests that IQ problems
have a significant economic impact that can cause serious financial problems
for organizations. Wang et al. (2001) declared that 70 percent of
manufacturing orders are assessed as being of poor IQ. According to Olson
(2003), in 599 surveyed companies, poor IQM costs more than $1.4 billion
yearly.
To address the challenges related to quality, notable research attention has
focused on the need for a rigorous definition of quality. One of the most
problematic issues confronting researchers today in QM is that there is no
universal definition. However, there are many attempts to define IQ (Wand &
Wang 1996; Tayi & Ballou 1998; Huang et al. 1999). Early work focused on
identifying the important characteristics that define IQ (Redmond 1996; Wand
& Wang 1996; Wang & Strong 1996). Defining IQ has proved to be a complex
issue (Ballou & Pazer 1985; Wand & Wang 1996; Wang & Strong 1996;
Redmond 1996; Ballou et al. 1998; Huang et al. 1999; Klein 2001). However,
most commonly, the term IQ is described as that which is ‘fit for use’ (Wang &

32
Strong 1996; Ballou & Tayi 1999). Other common definitions are outlined in
section 2.2.1.
In another respect Wang (1998) proposed a TDQM framework that adapts the
widely used Deming quality cycle to encompass a continual cycle: 1) define:
what IQ means to the user; 2) measure: to provide IQ information through
measuring data collections; 3) analyse: what IQ do we need and where should
our priorities lie and 4) improve: carry out improvement initiatives (Kovac et al.
1997; English 1999; Wang et al. 2001). Fundamental to the TDQM process is
that information is treated as an Information Product (IP), a valuable asset that
should be produced as part of a well-defined production process, rather than
the traditional view of data as a by-product (Ballou et al. 1998; Wang et al.
1998). A process is ‘a structured, measured set of activities designed to
produce a specified output for a particular customer’, such as a bank statement
or a hospital discharge summary. Many authors highlighted the importance of
paying attention to the process (Wang et al. 1998; Helfert & Herrmann 2005;
Scannapieco et al. 2005; Katz-Haas & Lee 2005). The objective of TDQM is to
deliver high-quality IPs to information consumers.
The multidimensional nature of information and therefore, IQ requirements
means that TDQM encompasses the existing practices of ‘find and fix’ and
adds the dimension of prevention. To meet this need the MIT IQ research
group developed data production maps (Ballou et al. 1998) that use data flow
diagram (Wang et al. 1998). The flow of information is important in
understanding the nature of the information. In IQ studies, four roles within the
information manufacturing life cycle have been identified namely producers,
custodians, consumers, and managers (Strong et al. 1997; Wang 1998).
Producers are those who produce or collect the information: custodians are
those who handle and manage the storage of information: consumers are
those who use the information in their work activities and managers are those
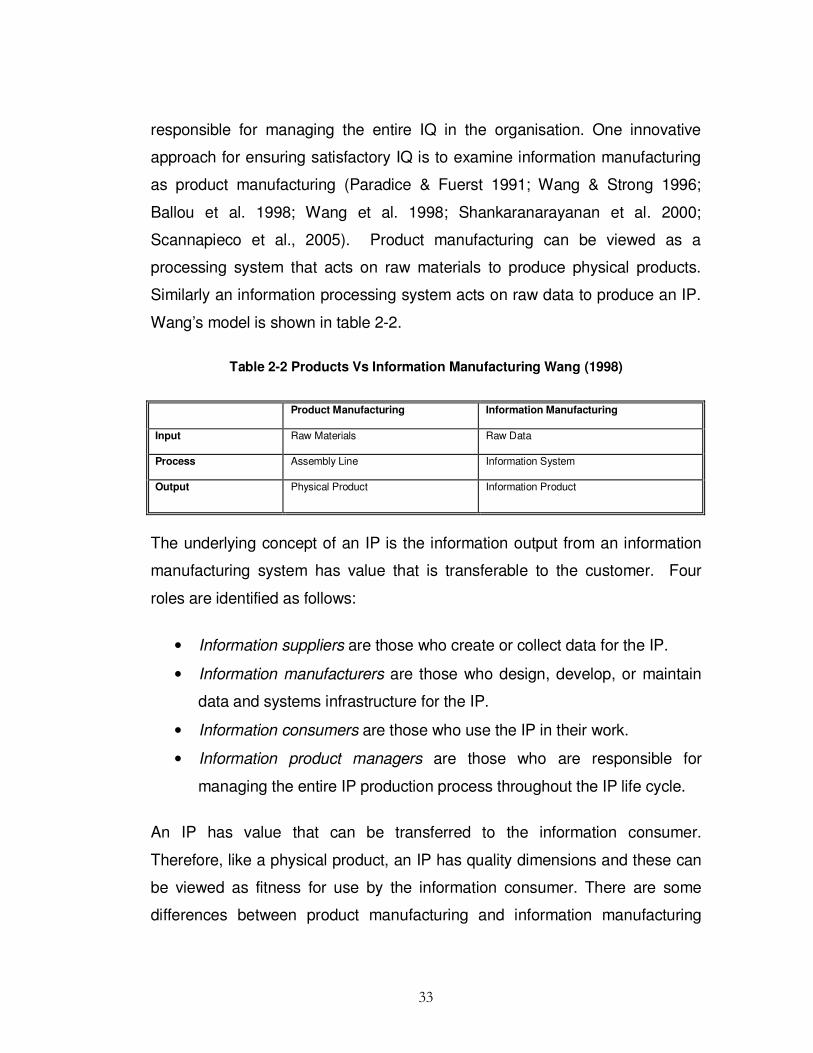
33
responsible for managing the entire IQ in the organisation. One innovative
approach for ensuring satisfactory IQ is to examine information manufacturing
as product manufacturing (Paradice & Fuerst 1991; Wang & Strong 1996;
Ballou et al. 1998; Wang et al. 1998; Shankaranarayanan et al. 2000;
Scannapieco et al., 2005). Product manufacturing can be viewed as a
processing system that acts on raw materials to produce physical products.
Similarly an information processing system acts on raw data to produce an IP.
Wang’s model is shown in table 2-2.
Table 2-2 Products Vs Information Manufacturing Wang (1998)
Product Manufacturing Information Manufacturing
Input Raw Materials Raw Data
Process Assembly Line Information System
Output Physical Product Information Product
The underlying concept of an IP is the information output from an information
manufacturing system has value that is transferable to the customer. Four
roles are identified as follows:
• Information suppliers are those who create or collect data for the IP.
• Information manufacturers are those who design, develop, or maintain
data and systems infrastructure for the IP.
• Information consumers are those who use the IP in their work.
• Information product managers are those who are responsible for
managing the entire IP production process throughout the IP life cycle.
An IP has value that can be transferred to the information consumer.
Therefore, like a physical product, an IP has quality dimensions and these can
be viewed as fitness for use by the information consumer. There are some
differences between product manufacturing and information manufacturing
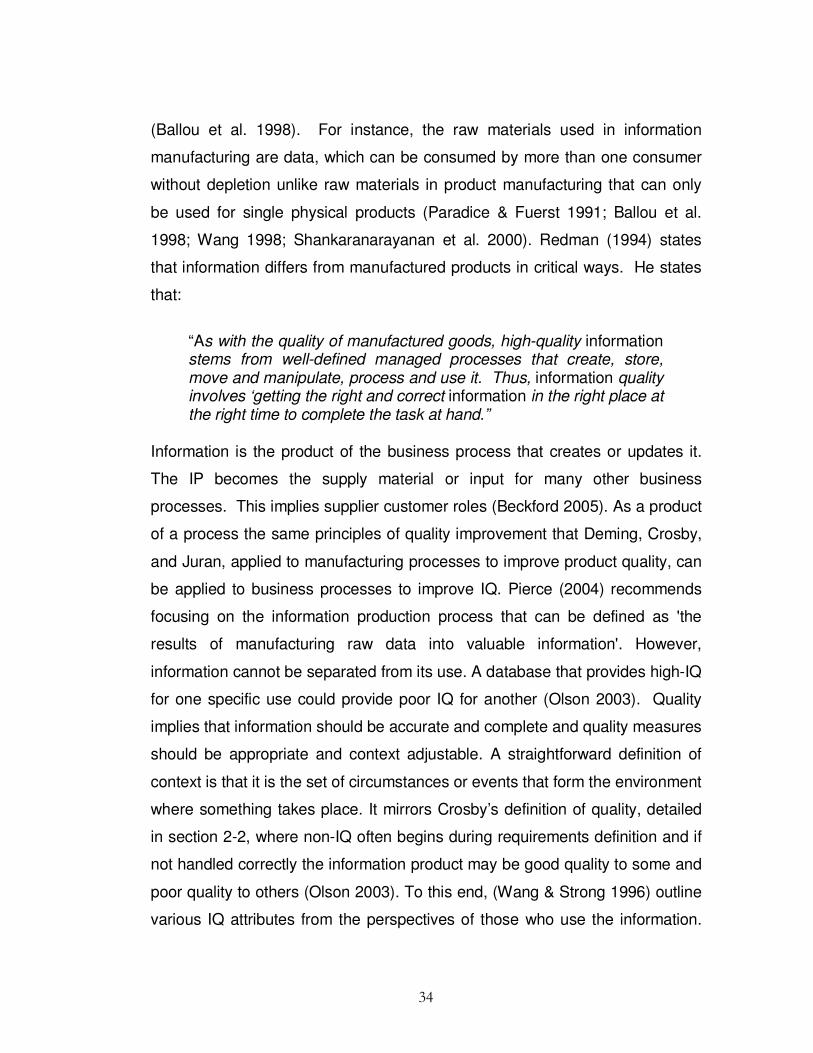
34
(Ballou et al. 1998). For instance, the raw materials used in information
manufacturing are data, which can be consumed by more than one consumer
without depletion unlike raw materials in product manufacturing that can only
be used for single physical products (Paradice & Fuerst 1991; Ballou et al.
1998; Wang 1998; Shankaranarayanan et al. 2000). Redman (1994) states
that information differs from manufactured products in critical ways. He states
that:
“As with the quality of manufactured goods, high-quality information stems from well-defined managed processes that create, store, move and manipulate, process and use it. Thus, information quality involves ‘getting the right and correct information in the right place at the right time to complete the task at hand.”
Information is the product of the business process that creates or updates it.
The IP becomes the supply material or input for many other business
processes. This implies supplier customer roles (Beckford 2005). As a product
of a process the same principles of quality improvement that Deming, Crosby,
and Juran, applied to manufacturing processes to improve product quality, can
be applied to business processes to improve IQ. Pierce (2004) recommends
focusing on the information production process that can be defined as 'the
results of manufacturing raw data into valuable information'. However,
information cannot be separated from its use. A database that provides high-IQ
for one specific use could provide poor IQ for another (Olson 2003). Quality
implies that information should be accurate and complete and quality measures
should be appropriate and context adjustable. A straightforward definition of
context is that it is the set of circumstances or events that form the environment
where something takes place. It mirrors Crosby’s definition of quality, detailed
in section 2-2, where non-IQ often begins during requirements definition and if
not handled correctly the information product may be good quality to some and
poor quality to others (Olson 2003). To this end, (Wang & Strong 1996) outline
various IQ attributes from the perspectives of those who use the information.

35
Information is of high-quality ‘if it is fit for its intended use’ (Kumar & Tayi 1998;
Olson 2003; Bugajski et al. 2005).
For a few decades, researchers have also looked at various ways to
conceptualize and define IQ dimensions such as usefulness, desirability, and
meaningfulness (Gallagher 1974), accuracy, relevance, completeness,
recoverability, access security, and timeliness, precision, currency (Bailey &
Pearson 1983). Ballou & Pazer (1985) expanded the definition of IQ beyond
accuracy, stating that IQ also ‘includes timeliness, consistency, completeness,
relevance, and reliability’. The most important classifications of quality
dimensions are provided by Wand & Wang (1996); Wang & Strong (1996)
Redman (1996); and Bovee et al. (2004). By analyzing these classifications, it
is possible to define a basic set of data quality dimensions, including 1)
accuracy, which means the recorded value conforms to the real world value, 2)
completeness, the degree to which values are present (Ballou & Pazer 1985),
and focuses on whether all values for a certain variable are recorded, 3)
timeliness, which means the recorded value are up-to-date ( Ballou & Pazer
1995; Wang et al.1994; Klein, et al. 1997), and 4) consistency, which means
representing the values in the same format at all times (Wang & Strong 1996;
Redmond 1996; Ballou & Pazer 1985).
Wang & Strong (1996), state that quality of information depends on IQ
dimensions. Table 2-3 shows the dimensions with a brief description of each.
They proposed an IQ framework that included categories of intrinsic,
accessible, contextual and representational information quality (table 2-4).
Contextual IQ contains 5 dimensions: value-added, relevancy, timeliness,
completeness and an appropriate amount of data, and it highlights the
requirement that data must be considered within the context of the task in
hand. It must be relevant, timely, complete, and appropriate in terms of

36
amount, to add value. Representational IQ includes 4 dimensions:
interpretability, ease of understanding, representational consistency and
concise representation, and requires that information be consistently
represented. Information is of little value if it is not accurate which falls in the
intrinsic IQ category. Intrinsic quality comprises 4 dimensions: believability,
accuracy, objectivity and reputation. Accessibility IQ consists of 2 IQ
dimensions: accessibility and access security. In a study by Strong et al.(1997)
projects from a hospital, to examine information quality in context found that
missing and inconsistent information were the root of many IQ problems.
Table 2-3 Dimensions of Information Quality (Wang et. al 1996)
Dimension Description
Access Security Access to data must be restricted, and hence, kept secure.
Accessibility Data must be available or easily and quickly retrievable.
Accuracy Data must be correct, reliable, and certified free of error.
Appropriate Amount of
Data
The quantity or volume of available data must be appropriate.
Believability Data must be accepted or regarded as true, real, and credible.
Completeness Data must be of sufficient breadth, depth, and scope for the task at hand.
Concise Representation Data must be compactly represented without being overwhelming.
Ease of Understanding Data must be clear, without ambiguity, and easily understood
Interpretability Data must be in appropriate language. Units and definitions must be clear
Objectivity Data must be unbiased (unprejudiced) and impartial
Relevancy Data must be applicable and helpful for the task at hand
Representational
Consistency
Data must be presented in the same format as previous data
Reputation Data must be trusted and highly regarded by source and content
Timeliness The age of the data must be appropriate for the task at hand.
Value-Added Data must be useful and provide advantages from their use.

37
Table 2-4 Categories of Information Quality Wang et. al. (2006)
Categories of Information Quality Dimensions
Category Dimensions Deficiencies May Indicate
Intrinsic Accuracy
Objectivity
Believability
Reputation
A lack of process or weakness in the current
process for creating data values that correspond
to the actual or true values.
Contextual Value-Added
Relevancy
Timeliness
Completeness
Appropriate Amount of Data
A lack of process or weakness in the current
process for producing data relevant to the tasks
of the user.
Representational Interpretability
Ease of Understanding
Representational Consistency
Concise Representation
A lack of process or weakness in the current
process for supplying data that is
understandable and clear.
Accessible Accessibility
Access Security
A lack of process or weakness in the current
process for providing readily available and
obtainable data.
Wang et al. (1998), presents an IQ assessment methodology called AIMQ.
The AIMQ consists of three components: 1) Product-Service-Performance
model which divides a fixed set of IQ criteria into four classes 2) a resulting
questionnaire of 65 assessment items is developed, and 3) two analysis
techniques comparing the questionnaire results of different stakeholders of an
information manufacturing system. Both techniques are executed on each of
the IQ categories separately (figure 2-1).

38
Figure 2-1 Information Quality Framework Wang & Strong (1996)
Lee et al. (2002) carried out a correlation analysis of the 15, IQ dimensions
with 261 subjects based on the works of (Wang & Strong 1996) and their
results found high correlations between the dimensions which would suggest
that IQ dimensions are not innately independent. Therefore, to gain further
insight into IQ, the literature was searched, which predominately focused on
determination of rigorous definitions of quality, discussed next.
2.2.1. Quality Definitions
The existing literature suggests that the quality of information is a vaguely
defined concept (Eppler 2006). Various definitions of quality are to be found in
a wide range of literatures. However, precisely defining such a multi-facetted
construct as ‘quality’ has proved to be complicated and to the present-day
there is no single established definition for it and a unanimously accepted
definition of quality has not been agreed. However, there are many definitions
widely discussed in the literature. Smith (1993) defines quality in this way:
Information Quality
Intrinsic IQ Contextual IQ Representational IQ
Believability Accuracy Objectivity Reputation
Value-added Relevancy Timeliness Completeness
Appropriate amount of data
Interpretability Ease of understanding
Representational consistency Concise representation
Accessibility IQ
Accessibility Access Security

39
“Quality is the goodness or excellence of any product, process, structure or other thing that an organization consists of or creates. It is assessed against accepted standards of merit for such things and against the needs of producers, consumers and other stakeholders.”
An important aspect of Smith’s definition is that quality means different things to
different people and organizations. There is consensus that quality is
contextual and dynamic. The decisive factor that defines better or worse
quality can vary from one context to another (Strong et al.1997). Although
definitions may vary from organization to organization, many researchers agree
that effective quality initiatives involve every employee in the organization and
that training and communication are important factors in organizational efforts
to improve quality (Goodden 2001; Hansson 2001).
Juran (1989), an important contributor to the quality movement, highlighted the
importance of the ‘customer’ in defining and measuring quality. He defined
customers as ‘all people who are impacted by processes and products’. He
described internal and external customers as everyone involved in the
processing or handling of a product until it reached the end user. Juran
proposed a definition of quality as ‘fitness for use’', which measure the extent to
which a product successfully serves its proposed role.
Deming (1982), one of the earliest pioneers of QM, also highlighted that the
customer was the most important part of the production line and Crosby
mirrored both Deming and Juran, by stressing the role of the customer as being
an important element in quality (Crosby 1996). Crosby defined quality as
‘conformance to requirements’ and this definition has been widely accepted as
’the standard’ for many years.
Quality as ‘conformance to specifications’ is a position that people in the
manufacturing industry often promote. Manufacturers can decide the quality of
their products by measuring how well the product conforms to a defined

40
specification. However, it fails to capture the customer’s expectations of the
product. Others uphold the idea that the product or service being delivered: a)
meets customer standards: b) meets and fulfils customer needs, and c) meets
customer expectations (Kahn et al. 2002). This definition is common in
marketing research and the service industries. An acceptable level of quality is
achieved if the information conforms to a defined specification and the
specification correctly reflects the intended use (Huang et al. 1999: 34). This
fits well with all the traditional references that describe quality as ‘fitness for
use’, ‘fitness for purpose’, ‘customer satisfaction’ and ‘conformance to
requirements’ (Crosby 1980; Juran 1989).
Crosby is credited with the concept of 'zero defects', which is based on the view
that it is cheaper to prevent defects than to correct them. Table 2-5 shows five
different ideas of quality types and their definitions. The customer based
definition states that consumers have different wants and products that best
satisfy user preferences are regarded as high-quality. The manufacturing
based definition focuses on supply side and is primarily concerned with the
production processes. The product based view defines quality as a measurable
variable. The user-based definition states that quality is determined by the user.
The value-based definition considers cost and price and a quality product is
one that provides performance at an acceptable price and the transcendent
view defines quality as ‘excellence’ or high standards.
Table 2-5 Definitions of Quality
Type Definition of Quality
Customer Based Fitness for use, meeting customer expectations as stated by the customer.
Manufacturing Based Conforming to design, specifications, or requirements related to production process.
Product Based Product has something other similar products do not and it is measurable.
Value Based Product is the best combination of price, costs and features.
Transcendent It is not clear but it is something beyond excellence.

41
The International Organization for Standardization (ISO) also supplies an
acceptable definition of quality by using accepted terminology from the quality
field. Their documented agreements contain technical specifications and other
criteria to be used as guidelines to ensure that materials, products, processes
and services are fit for their purpose. ISO presents a formal definition of quality
as:
“The totality of characteristics of an entity that bear on its ability to satisfy stated and implied needs (ISO 9000 Bureau of Business Practice 1992). “
In 2001, the Institute Of Medicine’s Committee on the Quality of Health Care in
America issued a report where they defined quality as:
“The degree to which health services for individuals and populations increase the likelihood of desired health outcomes and are consistent with current professional knowledge (Institute of Medicine 2001). “
American Society for Quality (ASQ) defines quality as follows:
“Quality denotes an excellence in goods and services, especially to the degree that they conform to requirements and satisfy customers (American Society for Quality 2006).”
Regardless of the differences in IQ definitions, researchers in the management,
communication and information technology (IT) literatures have built a
surprising consensus around conceptual frameworks and lists of IQ criteria that
can be used to describe the characteristics that make information useful for its
users (Khan et al. 2002).
The definition of the quality, dimensions, and metrics to assess information
quality is a critical activity. Some researchers have stated that IQ is a measure
of the information views in a database against the same information in the real
world (Orr 1998). Traditionally, IQ has only been described from the

42
perspective of accuracy. Research and practice signal that IQ should be
defined beyond accuracy. The criterion is identified as encompassing multiple
dimensions. The information quality literature provides a thorough classification
of information quality dimensions; nevertheless, there are a number of
discrepancies in the definition of most dimensions due to the contextual nature
of quality. From the perspective of defining the gap between the quality of
service provided and the quality of service expected, quality is perceived and
evaluated as the extent to which a service meets or exceeds the expectations
of customers. This can be both one of the most complex and most accurate
ways to define quality. In view of this, organizations now assess their
management systems and performance against business excellence models,
as they provide a recognized approach for evaluating organizational quality
performance and comparing their performance with the quality performance of
other organizations discussed in section 2-4.
2.2.2. Information Quality Models and Frameworks
Some frameworks are suitable for evaluating the quality of information
provided. The perspective of an information producer on the quality of
information may differ from that of an information consumer, so it is ultimately
the information consumers who assess whether the information is fit for their
uses. Therefore, the quality of the information cannot be assessed
independently of those using the information (Strong et al. 1997).
Since the information revolution, information is being considered more and
more as a resource to be produced, transformed and used in the same way as
industrial material resources. Information on its own has no value, but only has
value in the way that it is communicated, exchanged and interpreted. According
to Pierce (2004) the Information Products approach to quality is of more
importance than the system that produces it. Several root causes of IQ

43
problems exist: untrained information producers: defective information and
application design: redundant databases, and ill-defined, broken or out of
control processes (English 2003).
Redman (1998) and Orr (1998) present a cybernetic model of IQ that views
organizations as made up of closely interacting feedback systems linking IQ to
its use in a feedback cycle (figure 2-2) where the actions of each system are
continuously changed by the actions, changes and outputs of other systems
(Orr 1998; Redmond 1998; Beckford 2005). Information is deemed of high-
quality if it ‘correctly represent the real-world construct to which it refers, so that
products or decisions can be made’ (Orr 1998). IQ thus would refer to the
degree of match: a 100 percent would mean there is a perfect match between
the real world and the Information System (IS) whereas 0 percent would
suggest there is no match.
Figure 2-2 Information System in the real World Context (Orr 1998)
As IQ defects are identified by comparing the IS with the represented part of
the real world (Helfert et al. 2002), it is important to have a clear picture of what
the real world is. A good IS should be a ‘proper representation’ of a real-world
system (Wand & Wang 1996). According to (Wand & Wang 1996) both the
real world and IS are systems described in terms of states and laws where
there is an exhaustive mapping from the real-world system to that of the IS,

44
which allows unique inference of the state of the real world from the state of the
information system (IS). In general the success of an IS can be evaluated
through the IQ provided to the users and the impact of IS on users’ thinking,
decisions and actions. The response obtained from the Information System is
evaluated in terms of appropriateness with the users' needs and expectations,
relevance of IQ, and reliability of information.
Much influential IQ research originated from IS research. IS researchers
initially identify and employ a set of dimensions and models to address IQ
problems within IS. One typical model to explain this is the DeLone & Mclean
(1992) Information System Success Model, which defined six major success
categories and dimensions: system quality, IQ, IS use, user satisfaction,
individual impact, and organization impact for IS success. System quality and
IQ singularly or jointly affect both use and user satisfaction. The amount of use
can positively or negatively affect user satisfaction. Similarly, user satisfaction
can positively or negatively affect use. Both of these aspects impact the
individual or users' behaviour. Attributes can include information recall of
information entry. Collective individual impact will affect the organizational
performance (Seddon et al. 1999).
The relations between the dimensions are presented in the model as follows:
system quality (SQ) is assessed with SQ attributes (usability, accessibility,
portability, ease of use) and IQ is assessed with IQ attributes (accuracy,
completeness, timeliness etc.) leading to system use. System use refers to
system usage and information usage. Attributes of usage are the number of
entries, or total data entry time. User satisfaction is concerned with the system
design or its information. These two are interdependent. Use and user
satisfaction have an individual impact that leads to organizational impact (figure
2-3). In a follow-up study, DeLone & McLean (2003) proposed an adjusted
45
taxonomy adding service quality as a dimension, and combining individual and
organizational impacts into a single dimension.
Figure 2-3 DeLone & McLean Model for IS Success
Many authors believe that information should be treated as both a product and
a service. The literature draws distinctions between product quality and service
quality (SQ) of information (Zeithaml et al. 1990). Product quality includes
product features that involve the tangible measures of IQ, such as accuracy
and completeness. SQ includes dimensions related to the service delivery
process and intangible measures such as ease of manipulation, security and
added value of the information to consumers (Khan,et al. 2002).
Defining SQ and its components in a way that is usable in an organisation is an
important endeavour for many organisations. However, an all embracing
definition of SQ is difficult to produce. Parasuraman et al. (1985) describe
Service Quality as the ability of the organisation to meet or exceed the
customers’ expectations. Parasuraman et al. (1985) also advocate five
dimensions to determine SQ assurance (knowledge and courtesy of
employees and their ability to inspire trust and confidence); empathy (caring,

46
individual attention the organisation provides to its customers); reliability (ability
to perform the promised service dependably and accurately); responsiveness
(willingness to help customers and provide prompt service), and tangibles
(appearance of physical facilities, equipment, personnel and communication
materials).
Some authors believe while 'information' can be captured, stored, accessed
and processed, the human experience underpinning it and making sense of it
cannot. Incidentally, Miller (2002) states we must realise that 1 = 0. This
implies that information has no intrinsic meaning. He also believes that
knowledge is a means by which we make meaning from information, usually in
a face-to-face meeting with other people. Often the intended meaning of the
message relayed to others can be misinterpreted resulting in undesired
outcomes.
“I know you believe you understand what you think I said –but I’m not sure you realise that what you heard is not what I meant!” (Ashleigh Brilliant).
From the KM literature, Nonaka & Takeuchi (1991) provided a framework for
distinguishing between explicit and implicit knowledge and the conversion
processes between them. According to Nonaka and Takeuchi, tacit knowledge
embodies beliefs and values and is actionable. In contrast, explicit knowledge
is codifiable into artefacts such as documents. Transmitting knowledge from
one individual to another can take the forms shown in table 2-6.

47
Table 2-6 Conversion of Knowledge (Nonaka & Takeuchi (1995)
CONVERSION PROCESS FACILITATING TECHNOLOGIES
Tacit to Tacit Socialization Sharing knowledge through social interactions (Chat) face-to-
face communication
Tacit to Explicit Externalization Takes the shapes of metaphors, analogies, concepts,
hypotheses, or models (Chat) articulate the knowledge and
know-how
Explicit to Explicit Combination Recombining discrete pieces of explicit knowledge into a new
form.(Visualization of data)
Explicit to Tacit Internalization Diffusing and embedding newly acquired and consolidated
knowledge (Text search, document categorization)
Internalization is strongly linked to "learning by doing".
Nonaka identifies four basic patterns for creating knowledge in any
organization. The four conversion processes they describe are:
� Tacit-to-tacit (socialisation) where individuals acquire new knowledge
directly from others communicated through mechanisms like observations,
conversation and on-the-job learning. The tacit aspects of knowledge are
those that cannot be codified, but can only be transmitted via training or
gained through personal experience. As apprentices learn the craft of their
masters through observation, imitation, and practice, so do employees of a
firm learn new skills through on-the-job training.
� Tacit-to-explicit (externalisation) articulating knowledge into tangible form
through dialogue. Tacit knowledge is not easily shared. The process of
transforming tacit knowledge into explicit or specifiable knowledge is
known as codification, articulation, or specification. Effective transfer of
tacit knowledge generally requires extensive personal contact and trust.
According to Nonaka & Takeuchi (1995), externalization of tacit
knowledge is induced by dialog and collective reflection. Groupware helps
this process by permitting collaboration and exchange of non-structured
messages. Discussion groups and chats are common groupware

48
applications that make possible the gradual articulation of tacit
knowledge..
� Explicit-to-explicit (combination) combining different forms of explicit
knowledge such as that in documents or databases. Documents are an
efficient way to exchange explicit knowledge that, when organized and
combined, can lead to new knowledge. In organizations, members
combine their explicit knowledge by exchanging reports and a variety of
other documents.
� Explicit-to-tacit (internalisation) such as learning by doing where individuals
internalise knowledge from documents into their own body of experience.
Training is an appropriate tool to systematize and add quality to information
that is dispersed through departments. Organizations provide training
programs for its employees at different stages of their working with the
company. By reading training manuals and documents employees
internalize the tacit knowledge.
The socialisation mode starts with building a field of interaction facilitating
shared experience and mental models. This triggers the externalisation mode
by meaningful dialogue and collective reflection where the use of analogy helps
articulate tacit knowledge which is otherwise hard to communicate. The
combination mode is triggered by networking newly created knowledge with
existing knowledge and finally learning by doing triggers internalisation. These
modes of knowledge interact with each other (figure 2-4).
From the IQ literature, (Huang et al. 1999) connected IQM and KM through the
relationship between information and knowledge. They proposed a three
process framework: improve IQ: make tacit knowledge explicit and create
organisational knowledge. However, one cannot manage IQ without having
measured it effectively and meaningfully (Stvilia et al. 2007). The next section
presents a brief discussion of IQ measurement.

49
Figure 2-4 Nonaka & Takeuchi (1991) Conversion Model
2.2.3. Measuring Information Quality
Improving the ability to measure quality has been an object of significant
interest for the public and private sectors for the past decade, reflecting the
notion that measurement can serve as a tool for improvement. Valid quality
measures are integral to an organisations’ efforts to improve performance. The
field of IQ evaluation has been extensively researched (Wang et al.1995; Lee
et al. 2002; Eppler 2006). While notable advances have been made in the
quality measurement field, in recent years efforts still fall short of meeting the
users' IQ needs. Several definitions are provided for the term accuracy. Wang
& Strong (1996) define accuracy as 'the extent to which information are correct,
and reliable'. Ballou & Pazer (1985) specify that information is accurate when
the information values stored in the database correspond to real-world values.
Completeness is defined as the degree to which a given information collection
includes information describing the corresponding set of real-world objects. The
consistency dimension refers to the violation of semantic rules defined over a
set of information items.
Tacit
Explic
it
Explici
t
Tacit
Socialisation
Inte
rnalisati
on
Combination
Exte
rnalis
atio
n
50
There is great difficulty in measuring IQ. ‘More often than not, the information
available is not like the real world that it is meant to represent’ (Redmond 1995;
Wand & Wang 1996). Currently, there are a number of different approaches
for measuring IQ. On the one hand IQ can be measured with subjective
perceptions from information users, and on the other hand it can be measured
based on the intrinsic quality characteristics of completeness and accuracy.
Most IQ assessments fall into either objective or subjective methodology
(Pipino,et al. 2002).
Subjective assessment methodologies typically use surveys or interviews with
information consumers to measure IQ. Lee et al. (2002) developed a
measurement instrument known as the Information Quality Assessment (IQA)
which measures perceptions of each dimension of (Wang & Strong 1996)
model. This instrument has been used as the basis of several studies requiring
IQ measurement (Khan et al. 2002; Pipino et al. 2002; Pipino et al. 2005).
Despite the quantitative nature of the measurements, these are subjective as
they are based on human perceptions and subject to human interpretation of
the state of IQ and the meaning of the questions asked.
There is much difficulty associated with measuring IQ objectively. According to
the New Zealand Health Sector, IQ dimension 'accuracy' is defined within the
framework as ‘how well information reflects the reality they are supposed to
represent’. Yet, from the literature reviewed not one definition can be found for
even these most commonly used IQ dimensions (Wand & Wang 1996).
Therefore it is important to explicitly define each dimension.
Wand & Wang (1996), used an ontological perspective to develop rigorous
definitions of the dimensions. For example, an IS, is inaccurate if it ‘represents
a real world state different from the one that should have been represented’.
51
Redman (2005), proposed a set of accuracy metrics: the ratio of the number of
items judged correct to the number of items tested. A more generic set of
metrics is proposed by Pipino et al. (2002), who specified three basic functional
forms: simple ratio: minimum or maximum operator, and weighted average and
all metrics are normalised to a value of between zero and one, with one being
seen as the ideal. The simple ratio proposes measuring the error-free rate by
dividing the number of units in error by the number of units tested. The simple
ratio is considered useful for measuring completeness, consistency, accuracy
and conciseness (Pipino et al. 2002).
With measuring IQ either subjectively or objectively, both these approaches fall
short of Wang & Strong (1996) suggestion for ‘an overall IQ metric’. Pipino et
al., (2002), proposed a simple two-by-two grid with high-low subjective
assessments on one axis and objective assessments on the other. Mapping
onto one of the four quadrants can be used as an overall gauge of IQ (Pipino et
al. 2005). Some IQ objective measures can be checked against original
information. This is an accepted ‘metric’ in IQ, where the user of the
information makes a subjective decision about the fitness of use for the user’s
current purpose (Pipino 2002). Many quality control efforts have been
described in the literature. The following section gives an understanding of
some quality improvement initiatives.
2.2.4. Quality Control Initiatives
For many years, statistical quality techniques have been used to improve
product quality in manufacturing and by applying these techniques,
organisations can provide continuous improvements to all organizational
processes (Redman 1994). The Deming approach used data analysis tools
such as control charts as a device to estimate process parameters such as
the mean and standard deviation of nonconforming item lines (Montgomery

52
1991; Leitnaker 1996). Cause and effect diagrams display sources of data
errors and simplify the discovery of problems. Pareto charts show the
frequencies of events and help compare causes of quality problems
(Leitnaker 1996). Deming's plan-do-check-act cycle is a four-step process for
quality improvement (figure 2-5). Step 1: develop a plan to effect
improvement; Step 2: carry out the plan; Step 3: observe and check effects of
the plan and Step 4: study results to discover what was learned.
Figure 2-5 The Deming Plan, Do, Check, Act Cycle
Deming also created fourteen major points that are widely used in business
(table 2-7). These include such items as to create constancy of purpose,
institute training, drive out fear, and break down barriers.
Table 2-7 Deming’s 14 Points of Quality Management
DEMING’S 14 POINTS ON QUALITY
1. Constancy of purpose for improvement of quality
2. Adopt new management philosophy
3. Understand the purpose of inspection
4. Relationship between organization and supplier
5. Continuous improvement of every process
6. Training and education
7. Leadership
8. Job satisfaction
9. Barriers between departments
10. Slogans and targets
11. Goals for management
12. Pride in workmanship
13. Training and education
14. Management transformation
Crosby's key idea - ‘do it right first time’ highlighted culture change and
identified areas in which quality can be improved: improving awareness;

53
establishing teams; setting goals; giving recognition; and continuously
repeating the quality improvement cycle (Crosby 1995; Beckford 2005).
Crosby (1992) stated that ‘the only absolutely essential management
characteristic is for an organization to deliberately give customers exactly what
they want’ thus stressing the important role of the customer.
Feigenbaum (1991) divided quality costs into four categories: 1) internal failure
costs associated with defects found before the customer receives the product
or service; 2) external failure costs representing costs associated with defects
found after the customer receives the product or service; 3) appraisal costs
representing costs incurred to find out the degree of conformance to quality
requirements, and 4) prevention costs representing costs of all activities
specifically incurred to keep failure costs to a minimum (Crosby 1995) (table 2-
8).
Table 2-8 Types of Costs According to Feigenbaum
Types of Costs Description
Internal failure costs Costs associated with defects found before customer receives product/ service
External failure costs Costs associated with defects found after customer receives product or service
Appraisal costs Costs incurred to determine degree of conformance to quality requirements
Prevention costs Costs incurred to keep failure and appraisal costs to a minimum
To manage quality, Juran divided the quality effort into what he called a ‘trilogy’,
which is a three-legged approach of quality management processes: quality
planning (developing products and processes to meet the customer’s needs by
discovering who the customers are and what their needs are); quality control
(improving quality levels by lowering defects thus reducing costs, improving
customer satisfaction and meeting goals), and quality improvement
(continuously improving the quality process) (Crosby 1995; Stephens & Juran
2005) (table 2-9).

54
Table 2-9 Quality Effort According to Juran
Processes Description According to Juran
Planning Process Discover who the customers are and their needs
Control Process Improving quality levels by lowering defects, reducing costs, and improving customer
satisfaction
Improvement Process Continuously improve the process quality
Ishikawa believed a culture of continuous improvement is born from
management responsibility (cited in Crosby 1995) and in 1943 developed the
cause and effect (fishbone) diagram to aid in improving quality (Stephens &
Juran 2005; Bauer 2006), figure 2-6.
Figure 2-6 Ichiro Ishikawa’s Cause and Effect Fishbone Diagram
Ballou and colleagues conducted extensive research on effect of information
errors on IS outputs (Ballou et al. 1987; Ballou & Pazer 1995; Ballou et al.
1998; Ballou & Tayi 1999). Ballou & Pazer (1985), presented a model for
analysing the effect of information errors. IS and the quality of the information
they contain affect customers' perceptions of the quality of purchased products
and services (Wang et al. 1995; Wang & Strong 1996).
In 1987, to encourage and improve international competitiveness the late US
Secretary of Commerce, Malcolm Baldrige, set up the National Quality Award,
which evaluates businesses on certain criteria. The award stresses customer
satisfaction and a proactive rather than reactive approach to Quality
Management (Mahoney & Thor 1994; National Institute of Standards and
55
Technology 2005). This quality award program helps stimulate companies to
improve quality and productivity while gaining a competitive edge through
increased profits. Other formal evaluation models of QM developed are the
Deming Prize in Japan and the European foundation for Quality Management
(EFQM) model in Europe.
The criteria of the annual Deming Prize(s) set up in 1950 and managed by the
Union of Japanese Scientists and Engineers (JUSE) include policies,
organization, information, standardization, human resources, quality
assurance, maintenance, improvement, effects and future plans. The
philosophy of Deming is the key feature to the prize.
In recent times, many organizations assess their management approaches, IS
and performance against business excellence models. The European
Foundation for Quality Management (EFQM) is a non-profit organisation
created in 1988 by fourteen leading European businesses with the mission to
'be the driving force for sustainable excellence in Europe'. The EFQM is a
framework comprised of nine criteria used to access an organisation’s progress
towards excellence about performance, people and society. This is achieved
through leadership policy and strategy, people, partnership, resources and
processes. The mission of EFQM is to stimulate organizations throughout
Europe to engage in improvement activities that should eventually lead to
excellence in customer and employee satisfaction and impact on society and
business results.
There has also been widespread interest in the practical value of achieving the
‘International Standards Organization’ (ISO) levels of quality. This is a set of
five international standards for quality assurance that have commercial and
economic significance for organizations. These standard guidelines help
56
companies organize their processes by achieving cost effective quality
assurance methods.
Six Sigma developed by Motorola in the 1980s and with its roots in Statistical
Process Control (SPC), is fast becoming a proven approach for businesses
and organizations to improve their quality. In statistical terms, the purpose of
Six Sigma is to lessen process variation so that virtually all products or services
are provided to meet or exceed customer expectations. The three basic
elements to Six Sigma are process improvement; process design/redesign and
process management.
These models provide a recognized approach for evaluating organizational
performance and comparing them to other organizations. However self-
assessment does not lead to the adoption of best practices nor ultimately
create significant quality improvement. To achieve notable performance
improvements as assessed against these models, it is necessary for
organizations to have an external focus and a committed attitude, to continually
search for better practices with the objective of adopting them.
2.3. Training
One of the basic principles of quality is accountability by the person performing
the work. IS professionals are typically charged with managing the enterprise's
information resources, yet few receive formal training for improving IQ.
However, to hold information producers accountable they must be trained (Lee
& Gharajedaghi 1998; Beckford 2005). Increased reliance on teamwork
highlights the importance of training in adapting to changing work
environments. During the last decade there has been tremendous growth in
training research with many theories, theoretical frameworks, ideas and
constructs on training than ever before (table 2-10). Although training is critical
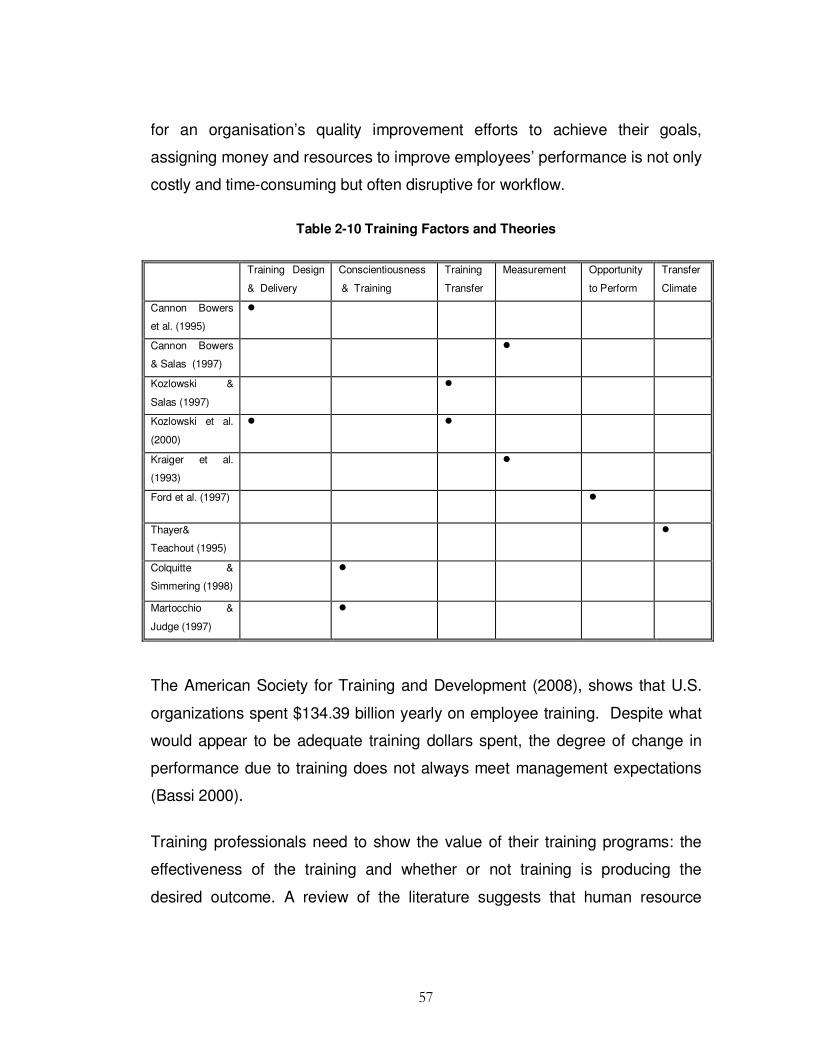
57
for an organisation’s quality improvement efforts to achieve their goals,
assigning money and resources to improve employees’ performance is not only
costly and time-consuming but often disruptive for workflow.
Table 2-10 Training Factors and Theories
Training Design
& Delivery
Conscientiousness
& Training
Training
Transfer
Measurement Opportunity
to Perform
Transfer
Climate
Cannon Bowers
et al. (1995)
�
Cannon Bowers
& Salas (1997)
�
Kozlowski &
Salas (1997)
�
Kozlowski et al.
(2000)
� �
Kraiger et al.
(1993)
�
Ford et al. (1997) �
Thayer&
Teachout (1995)
�
Colquitte &
Simmering (1998)
�
Martocchio &
Judge (1997)
�
The American Society for Training and Development (2008), shows that U.S.
organizations spent $134.39 billion yearly on employee training. Despite what
would appear to be adequate training dollars spent, the degree of change in
performance due to training does not always meet management expectations
(Bassi 2000).
Training professionals need to show the value of their training programs: the
effectiveness of the training and whether or not training is producing the
desired outcome. A review of the literature suggests that human resource

58
management practices are the most powerful predictor of improvements in the
companies’ productivity and profitability. Practitioners signalled that the goal of
training is immediate improvement in performance of skills in the workplace
(Schmidt & Bjork 1992; Broad & Newstrom 1992). Yet, only 10 percent of
training outlays result in the transfer of learned skills and knowledge to the job
(Baldwin & Ford 1988; Smith-Jentsch et al.2001).
The challenge for organisations already aware of quality improvement lies in
their unfamiliarity with the amount of training needed to support the
implementation of an effective quality improvement strategy (Johnson 1993).
Lack of suitable training has been known to lead to negative outcomes and
some organisations failed their quality initiatives (Chang 1993). Many
obstacles impede the effectiveness of training such as improper needs
assessment, unskilled trainers, and poor training techniques (McCahon et
al.1996). Organisations have often rushed into training programs without
thoughtful needs assessments (Johnson 1993). Excessively ambitious quality
directors sometimes implemented unnecessary training programs (Chang
1993). Therefore, to ensure positive training results, organisations need to
complete a number of necessary phases for training: needs assessment;
development and evaluation (Goldstein 1993). Wang & Lee (2001), draws
attention to the need to include training on assessment techniques. Training
ensures the IQ team have the knowledge and skills needed to carry out their
tasks to ensure alignment of processes.
The importance of training effectiveness is recognised as an important issue for
organizations (Noe 1986; Ford & Weissbein 1997). There is some research on
the area of transfer of training (Ford & Weissbein 1997). This body of
knowledge suggests many important factors: the organizational learning
environment (Tannenbaum 1997) the transfer climate, which impacts on the
extent to which gained skills are used on-the-job (Thayer & Teachout 1995)

59
time between training intervals and use (Arthur et al. 1998), and peer and
supervisor support that plays a central role in skills transfer to the workplace
(Tracey et al. 1995; Facteau 1995). Baldwin & Ford (1988), conceptualized the
transfer of training as the extent to which skills and knowledge gained in a
training program are applied and preserved over time in the job environment.
Goldstein & Dillon (1997) states that the greatest challenge is designing,
developing, and testing assessments of training and performance. Broad &
Newstom (1992), surveyed 85 trainees on how much of the material learned in
training was used on the job over time. Immediate use was 41 percent, six
months later 24 percent and one year later 15 percent. When conducting an
evaluation of a training program managers need to consider several factors
that influence transfer (Baldwin & Ford 1988). It is believed that characteristics
and the work environment have direct relationships with learning as well as
with generalization and maintenance (Yamnill & McLean 2001). Noe & Colquitt
(2002) expanded Baldwin and Ford’s model to include assessing the transfer
climate as an important factor of the work environment. Supervisor support has
been identified in the literature as a critical work environment factor influencing
transfer (Baldwin & Ford 1988).
Many authors have tried to optimize training through development of theoretical
models and examining the impact of training variables such as trainee
characteristics, training design, and work environment factors on the transfer
process (Baldwin & Ford 1988; Thayer & Teachout 1995; Holton 1996).
Kirkpatrick’s levels of training evaluation initially proposed in the 1950’s
dominated the field of training evaluation for many years (Kirkpatrick 1998).
This is an outcome based model defined by four levels: reaction, learning,
behaviour and results which organisations use to measure training programs
(table 2-11).

60
Level 1: Trainees’ reactions: measures participants’ satisfaction with content,
process and the training event. Kirkpatrick (1998) provided guidelines for
evaluation of reaction that include designing a form that facilitates quantifying
trainee reaction by gathering suggestions and feedback that measure reaction
against standards.
Level 2: Learning: measures the extent to which participants gain knowledge
and skills from the training program. The guideline suggests the use of control
groups to measure level of knowledge before and after training.
Level 3: Behaviour change: measures changes in attitudes and/or skills
improvement and is the stage of evaluation that decides the extent to which
trainees generalize training to the workplace given the appropriate climate.
The suggested guideline uses surveys and interviewing to capture the
evaluation criteria.
Level 4: Improvements in tangible organizational outcomes measure results
revealed in change by improved quality and higher profits. The guideline to
evaluate this level is the use of a control group to eliminate factors other than
training for observed changes. Kirkpatrick (1998), defined evaluation in two
ways: 1) measuring changes in behaviour that results from training and 2)
assessing the overall results of the training program.

61
Table 2-11 Kirpatrick’s Evaluation Model
Level Evaluation
Type
Evaluation Characteristics Evaluation Tools & Methods Relevance & Practicability
1 Reaction How the delegates felt
about the training
experience.
Feedback forms. Verbal
reaction, post-training surveys
or questionnaires.
Quick and easy to obtain.
Not expensive to gather or analyse.
2 Learning Measurement of the
increase in knowledge -
before and after training.
Assessments before and after
training. Interview / or
observation.
Relatively simple to set up; clear-
cut for quantifiable skills. Less easy
for complex learning.
3 Behaviour Extent of applied learning
on-the-job
Observation and interview
over time to assess change,
relevance and sustainability of
change.
Measurement of behaviour change
needs cooperation and skill of line-
managers.
4 Results Effect on business Measures are already in place
via normal management
systems and reporting - the
challenge is to relate to the
trainee.
Process must attribute clear
accountabilities.
Baldwin & Ford (1988) proposed a transfer model that highlights the
importance of three types of influences on transfer: trainee characteristics:
training design and features of the work environment such as peer and
supervisors support (Baldwin & Ford 1988). The literature suggests that
Baldwin and Ford’s transfer model has probably been the most influential on
transfer research (figure 2.7).
Figure 2-7 Baldwin and Ford Model of Training Transfer
Trainee Characteristic Self Efficacy Motivation
Course Characteristics Relevance
Environment Factors Management Support Autonomy
Transfer One month
Transfer One year

62
Many factors identified as important predictors of training effectiveness can be
classified under Baldwin and Ford’s three categories. These factors include
self-efficacy as an important trainee characteristic, and supervisor support as
an important aspect of the work environment (Baldwin & Ford 1988; Ford, et al.
1992). Ford & Weissbein (1997) invoked ‘the opportunity to perform’ construct
as a way to understand the transfer of training process.
Holton (1996) suggested a framework that included three primary outcomes of
training: individual learning; individual performance and organizational results
influenced by a combination of motivational, environmental and enabling
factors. Their Results Assessment System (RAS) is intended to provide a
measurable means for discovering if the desired outputs have been achieved.
The parts of RAS are:
1. Process: indicates the general steps necessary to conduct result
assessment.
2. Domains: identifies the metrics of outcomes that should be assessed.
3. Plan: defining the decisions necessary to design a results assessment.
4. Tools: how are the results measured and what instruments will be suitable
for measuring outcomes.
The outcome of individual learning is influenced by a trainee’s motivation to
learn, trainee’s reaction to training climate and trainee’s experience and ability;
the outcome of individual performance (after training) is influenced by the
trainees' motivation for transfer, transfer climate and the design of training
program; and the organizational results are determined by the utility of training
and the external events that constrain productivity (figure 2-8).

63
Figure 2-8 Holton’s Factors Affecting Transfer of Training
There is a growing body of evidence that personality measures are significantly
related to successful job performance (Hogan & Ones 1997). Thus an interest
in personality traits has increased in the training literature in recent years (Noe
1986; Colquitt et al. 2000). Many studies have found that personality can be a
predictor of work performance (Barrick & Mount 1991; Mount & Barrick 1998).
Consensus is emerging that a five-factor model (FFM), often termed the ‘Big
Five’ (Goldberg 1990), can be used to describe the many salient aspects of
personality.
2.4. Influence of Personality
According to the FFM, there are five broad categories in the personality trait
hierarchy: neuroticism-emotional stability, extraversion, openness to
experience, agreeableness, and conscientiousness (Costa & McCrae 1992).
Almost all personality tests existing today measure one or more of the five
factors depicted in table 2-12. However, Conscientiousness has been linked to
achievement and to the will to achieve.

64
Table 2-12 Personality Dimensions Costa & McCrae (1992)
Personality dimension High level
Low level
Neuroticism sensitive, nervous
secure, confident
Extraversion outgoing, energetic
shy, withdrawn
Openness to experience inventive, curious
cautious, conservative
Agreeableness friendly, compassionate
competitive, outspoken
Conscientiousness efficient, organized
easy-going, careless
Research supports a relationship between personality and job performance
(Barrick & Mount 1991; Costa & McCrae 1995; Colquitt & Simmering 1998;
Barrick et al. 1998). Among those traits, conscientiousness (Costa & McCrae
1992) is considered to be especially promising in predicting training proficiency
(Hogan & Ones 1997). The more conscientious a person is the more
competent, dutiful, orderly, responsible and thorough they are (Costa &
McCrae 1992). Training literature suggests that conscientiousness is positively
related to self-efficacy (Colquitt et al.2000) and self-deception (Barrick & Mount
1996; Martocchio & Judge 1997). Self-efficacy is positively associated with
work-related performance (Hartline & Ferrell 1996). Martocchio & Judge
(1997), provided a framework to potentially explain the relationship between
conscientiousness and learning. They presented a dual mediating model,
whereby both self-efficacy and self-deception mediate the relationship between
conscientiousness and learning but in opposite directions. Self-efficacy is
expected to have a positive effect on learning, whereas self-deception is
expected to have a negative effect on it. According to Bandura (1986) self-
efficacy refers to an individual's self-perceived ability to achieve certain
outcomes. Given the nature of self-efficacy, it is likely that persons high in self-
efficacy would experience higher levels of training motivation than those low in
self-efficacy. Persons high in self-efficacy are likely to see themselves as
capable of meeting the challenge of their present skills provided by training
opportunities (Noe 1986; Tannenbaum et al.1991). Thus, persons high in self-

65
efficacy should be more motivated to engage in training activities than those
who are not. Self-deception is a dispositional tendency indicating an unrealistic
positive self-image (Sackeim 1983).
In the Martocchio & Judge (1997) study a negative correlation between
conscientiousness and learning examined over a relatively short training
program (two 4-hr sessions, separated by 1 work day) was noted whereas, the
Colquitt & Simmering's (1998) study reported a positive correlation between
conscientiousness and learning, when adopting a relatively longer training
program (a 6-week course) was reported.
2.5. Gap in the Literature
It is important that IQM should be tailored to an organization’s needs. Even so,
little research has been conducted to identify the IQ predictors that should be
considered when developing Information Quality Training Plans IQTPs. This
thesis aims to address this shortcoming by identifying the predictors most
commonly affecting IQ.
While the published academic literature on QM can be traced back to the
1930's (Shewhart 1931), much of the literature of the 1980's and early 1990's is
prescriptive. The shortcoming is that the literature simply describes the
adoption of quality tools and techniques, rather than the impact on quality
performance, and most of the IS research focuses on theoretical modelling of
controls and measurement. There is much research on the impact of error in IS
(Wand & Weber 1989; Redmond 1998). Other studies focus on editing data
and input controls (Garfinkel 1986; Bowen 1993). Clearly much work has been
conducted in the IQ literature on IQ and its importance; however, there has
been no published work on the key predictors of IQ until the present study.

66
Given that quality performance is still an important potential source of
competitive advantage, firms cannot afford to ignore predictors of poor IQ.
Although many studies in the IQ literature of the late 1990’s have addressed
the relationship between the various dimensions of quality performance, the
omission of training, trainee characteristics, and the work environment as
predictors of IQ, posed a significant gap. There has been little understanding
from either the theoretical or practical perspective of the relationship between
these constructs. This represented a need to empirically measure IQ
outcomes based on these selected predictors of IQ to help fill the gap in both
theory construction and testing. Conversely, researchers from the training
discipline have shared a common interest in examining the effect of influencing
factors such as employee personality, work environment and training on
transfer of skills to the workplace. Nevertheless, no attempt has been made to
apply these predictor variables to IQ.
The influencing factors on training in general can be grouped into two main
categories: individual characteristics and organizational factors. Organizational
factors have been studied in IQ research, whereas others have been
investigated mainly in management training research. Individual characteristics
have long been found influential on training effectiveness. Some factors such
as conscientiousness, experience, the work environment, and training effects
have not been studied in IQ discipline. Therefore, their impact on IQ in
particular is still unknown.
Despite persuasive evidence that IQ problems in healthcare lead to loss of
human life, decreased quality of life and accounts for substantial economic
losses, the literature have to this point, been devoid of conceptual models or
systematic investigation of predictors of IQ. Therefore, this research was
undertaken, to fill this void by presenting a model of IQ predictors in this

67
context. It also provides an empirical analysis of the ability to predict IQ
outcomes based on these predictors. The research finding based on the model
addresses this drawback by identifying the factors which most commonly
predict IQ. Moreover, there are to date no guidelines for developing
individualised tailored Information Quality Training Plans, IQTPs. This study
demonstrates that quality can be improved by including training in IQ
importance and awareness, trainee characteristics, and work environment
factors in the planning and development of training programs.
2.6. Summary
Providing effective healthcare to patients involves teams of healthcare
providers interacting and delivering care to achieve a desired outcome (Hall et
al. 2005). IQ is a serious problem and healthcare organisations are no
exception (Wang et al.1995). The quality of the healthcare depends on how
well the team members communicate, coordinate care, and negotiate their
interdependency in practice, in order to achieve a cohesive treatment plan for
patients (Hall et al. 2005).
Although companies continue to spend large amounts of time and money on
improving employees’ performance, they need to demonstrate sustainable
methods to justify the value of training programs. Many organizations evaluate
the effectiveness of training by measuring the participants’ reaction, but few
organizations measure whether skills are transferred to the work environment
(Kraiger et al. 2004). Training effectiveness can, in part, be determined by
examining the transfer of learning to the work place (Noe 1986; Kirkpatrick
1998). Since Kirkpatrick's evaluation levels (reaction, learning, behaviour and
results) were first introduced in 1959, evaluations of transfer of learning have
included examining the characteristics of training programs and individual
trainees, and then relating these factors to training and job performance (Rollier

68
1993). A critical issue with any training program is the successful transfer of
learning to the work environment. Taking into account the external factors with
the traditional measures of training effectiveness, a manager can begin to
assess how well a training program is performing and determine what changes
would make it more effective
This chapter reveals that training research has focused on the role of the
training design, environmental factors and trainee characteristics in a training
context. Even if a training objective is effectively carried out, the overall
business objectives may not be (the trainee may have acquired the appropriate
skill but the work environment may be counter-productive to practice what was
learned). This chapter reviewed the literature related to training by discussing
the dominant evaluation models and approaches found in the literature that
have contributed to the emergence of the transfer of training concept.
Kirkpatrick (1994) developed a well-known and widely used four-level training
evaluation model. Baldwin & Ford (1988) built a model of training transfer.
Holton III (1996) produced an enhanced three-level training evaluation model.
Though these models provide invaluable insight on training, they do not
consider IQ related characteristics such as accuracy, consistency and
completeness. It is essential, therefore, to develop a comprehensive model of
IQ predictors in its own right to aid in a problem based solution. In Chapter 3
an outline of two paradigms Behavioural Science (BS), Design Science (DS) is
provided and a general overview of the chosen research approach for
conducting this study is presented.
69
C h a p t e r 3
METHODOLOGY
3.1. Introduction
Chapter 2 provided a review of related work in the IQ and training literatures.
In order to realize the goals for this chapter, an outline of two paradigms (a set
of beliefs shared by scientists) that characterizes much of research is briefly
described: 1) Behavioural Science (BS), and 2) Design Science (DS). A
general overview of DS, the chosen research approach for conducting this
study, is then presented in section 3-2. The philosophical stance and
epistemological underpinnings are presented in section 3-3. Section 3-4
introduces the research framework. Ethical considerations are dealt with in
section 3-5, and a brief summary of the chapter is given in section 3-6.
With an ever increasing number of ways to conceptualize and conduct
research, there is a greater duty on researchers to be knowledgeable about
suitable scientific paradigms within the context of research in general
(Easterby-Smith et al. 1997). Real world problems must be properly
conceptualized and represented, and techniques for their solution constructed,
implemented and evaluated. According to Hevner et al. (2004), two paradigms
characterize much of research in the Information System (IS) discipline: BS,
which has its roots in social science research methods and tries to understand
reality (March & Smith 1995) and DS, a technology oriented paradigm which
has its roots in engineering disciplines and tries to create things that meet
desired goals.

70
Theory and theorising plays a key role in BS. BS develops, justifies, and
verifies theories, using the application of existing knowledge to organizational
problems. Therefore BS tries to describe, predict or explain how phenomena
behaves and interacts with each other, and seek to find ‘what is true’. Due to
their belief in the complex and subjective nature of social reality the methods
used vary from positivist through interpretivist. In contrast, DS is a body of
knowledge about artificial (man made) objects and phenomena designed to
meet certain desired goals and it seeks to create ‘what is effective’ (figure 3-1).
This is achieved by 1) creating innovations, aimed at utility (results) that may be
in the form of constructs, methods, models or instantiations, and 2) research
activities, comprised of building, evaluating, theorizing about, and justifying
artefacts (March & Smith 1995).
Figure 3-1 Design Science and Behavioural Science
According to many authors DS research is an inventive, or creative problem
solving activity to increase the relevance of IS research in which new
technologies are the primary products (Nunamaker, et al. 1991; March & Smith
1995; Rossi & Sein 2003; Hevner et al. 2004). The reasoning behind DS is not
to understand the phenomena; rather, it is a problem-solution seeking
approach, addressing important unsolved problems in unique or innovative
ways, or solved problems in more effective or efficient ways, with the intention
Design Science Behaviour Science
Theories provide truth
Artefacts provides utility

71
of improving their functional performance. The DS goal is to use analytical,
quantitative or qualitative models derived from diverse disciplines and link them
in a rigorous framework. The design of an artifact, its specification, and the
assessment of its utility are integral to DS research. These must be combined
with behavioural and organizational theories to develop an understanding of
business problems, contexts, solutions, and evaluation approaches.
3.2. Research Paradigm for this Study
While information systems (IS) research has been conducted for many years and
traditional research methods are well established, the application of just one research
method is not sufficient to obtain viable results in design science considering the rigour
and relevance criteria as the main requirements of design science (Hevner et al.
2004). Traditional research often focuses on theory building and theory testing. In an
Academy of Management review, Whetten (1989) defined a framework of what
constitutes a ‘theoretical contribution’. Central to his framework and to theory building
is the notion of ‘understanding the ‘‘why’’ of a phenomenon in question to help discern
how things function and come to be as they are'. The nature of this current research is
not the understanding of a phenomenon but is rather a problem-solution finding
approach. It is mainly about investigating key predictors of, and their relationships to,
IQ, in order to provide a problem solution.
Some important questions that no doubt immediately follow are: 1) what is the most
valid and viable research approach for this study as it neither contributes to theory
building as previously defined nor to theory testing 2) what constitutes as being
scientific and 3) can a problem-solution finding approach qualify as scientific
specifically in IS.
Nunamaker et al. (1990) classify DS in IS as applied research that applies knowledge
to solve practical problems. Kuhn (1970) states that scientific research paradigms are
a collection of beliefs shared by scientists; a set of agreements about how problems
are to be understood. Therefore to ensure that this research qualifies as scientific, an

72
accepted problem-solution finding scientific research method applied to IS called DS
(March & Smith 1995; Au 2001; Ball 2001) method was identified as the most
appropriate approach for this study. This methodology of DS can be traced
back to the work of Brown (1992) and Collins (1992). Therefore, DS is not a
research method on its own, but a formalised combination of existing methods
with the intent of producing new theories, artefacts, and practices that can be
used to account for the impact of training trainee characteristics, training
design, IQ perception, the work environment and work experience on IQ.
Figure 3-2 shows the specific DS guidelines as applied to this study to produce
a valid and viable research approach.
Figure 3-2 Design Science Methodology Approach to Study
March & Smith (1995) in a widely cited paper propose a four by four framework
that produces sixteen cells under two axes: research activities; build, evaluate,
theorise and justify, and four outputs: constructs, models, methods, and
Environment – People
(Role)
Develop/Build
Justify/Evaluate
Knowledge Base –
(Guideline)
Design Science Circles Adapted from Hevner et al., (2004)
Additions
(Predictors)
Business needs
(Improve IQ)
Application-
(Training)
Applicable Knowledge
(Results)
Refine
Assess

73
instantiations (table 3-1) for describing a viable DS research effort. A research
effort can cover multiple cells but not necessarily all of them.
• Constructs arise during the conceptualization of the problem and form
the problem/solution domain.
• Models are a set of statements expressing relationships among
constructs.
• Methods are a goal directed set of steps (algorithm or guideline) for
manipulating constructs so that the solution statement model is realized.
• Instantiation is the realization of the artefact by operationalizing
constructs, models, and methods in an environment.
Table 3-1 Business Ontology – A DS Approach (March & Smith 1995)
RESEARCH ACTIVITIES
Build Evaluate Theorise Justify
Construct Predictors of IQ Experiment & Survey Interviews
Model IQ Predictor Model Experiment & Survey IQ Predictors Statistics
Method
Researc
h
Ou
tpu
ts
Instantiation Experiment & Survey Statistics Interviews
3.3. Philosophical Stance
By definition DS introduces novel artefacts with intended problem solving
functionality. Following the DS activities described in section 3-2, the objective
of this dissertation is to solve IQ problems by introducing into the environment
new design artefacts, the availability of which will cause employees to abandon
their previous problem producing behaviours. The purpose of using DS
research is the building of artefacts to address an important and relevant
environmental organisational problem. This was achieved as follows; 1) the
designing and building of a situational representation in the form of a predictor
model that help identify predictors of IQ. The constructs identified in the model

74
represented a real world situation, highlighted the problem, aided in problem
and solution understanding and thereby, suggested the solution space that
enabled exploration of the utility of the Information Quality Training
Requirements Analysis Guideline (IQTRAG) based solution; 2) by designing
and building a generic abstract level IQTRAG, a set of steps in performing the
task of developing an effective and usable Information Quality Training Plan
(IQTP), and 3) by evaluation of the IQ predictor model using a controlled
experiment, group discussions and a Web based survey. The results of this
thesis add to the knowledge goals of the scientific community by providing
valuable and valid input for the scientific knowledge base as well as providing a
solution to a practical, costly and topical IQ problem in organisations.
A quantitative and qualitative approach was recognised as the most useful as it
helped prevent bias in the gathering and presenting of research data. The
nature and definition of IQ as seen from the literature review in Chapter 2,
creates epistemological assumptions that IQ is a subjective term and can only
be measured from an individual perspective. The use of experimental
information collection avoided subjectivity by objectively collecting information.
In addition, the IQ literature typifies the notion that multiple assumptions can
and do survive side by side and a wide variety of approaches has been used
depending on the research proposition under investigation. This allows the
flexibility to select multiple paradigms and methodologies from within different
approaches and according to the DS Guidelines, table 3-2 is often found to be
more valuable.
3.4. Research Framework
Existing research provides several models to aid in the integration
management of IQ, but so far there has been little empirical or systematic
investigation into influencing factors of IQ to identify predictors and

75
subsequently the root cause of poor IQ. Accordingly, the aim of this study is to
address this issue. First a review of the QM, TQM, IQM, training, KM and IS
literature was undertaken and the omission of training, trainee characteristics,
and the work environment as predictor variables on IQ was noted from these
literatures. Finally the development and testing of a proposed model of
predictor variables was undertaken.
First, a triangulation research framework is presented. From the DS
perspective a guideline for IQTRA to aid in the development of effective IQTPs
is provided. Requirement training analyses are contextualised within the
healthcare setting as a means to provide an assessment of IQ training
requirements. A Web based survey is used as a theoretical foundation to
integrate BS into the DS process of including training design, duration, intervals
and other predictor variables to the context. This study presents a two
dimensional framework for research in IQM. The first dimension is based on
two research activities: 1) build and 2) evaluate. The second dimension is
based on two outputs: 1) constructs and 2) model. This study essentially
covers ‘build’ and ‘evaluate’ research activities and a research output of
‘construct and ‘model’. The first research goal of this study is to build an
ontology (artefact or model) that makes it possible to conceptually express the
logic of this study in a structured form. The second research goal consists of
applying this model to one of its possible uses (instantiation). Firstly, the
instantiation of the ontology in a nursing school environment at DCU, that
allows capture of the impact of training in a structured way and secondly, in a
Web based survey using Survey Monkey administered to a population of
practising professionals.
In terms of March and Smith's research framework this means aiming to find
the basic constructs of a model and building an ontology that expresses the
relationships among them. Subsequently, evaluation of the constructs and the

76
model, based on an adequate measurement system, was undertaken. The
research design was divided into two major sections: experimental design and
survey design. Experimental design concentrates on the procedure of the
experimental task. The survey design is to develop an instrument for validating
IQ predictors. This study adhered closely DS guidelines; see figure 3-3 and the
rigour of the research is shown on table 3-2.
Table 3-2 Rigour of the Research
DESIGN CONTRIBUTION
GUIDELINE
Grounded In Data Quality Foundations (Wang et al. 1997) Research Rigor
Performed in two phases 1) Experimental research of student nurses
2) Survey Groups of Medical Practitioners
Design Evaluation
Design as 1) Model of predictor variable
2) IQTRAG
Artifact
To begin, the exact problem to be addressed was selected and phrased to
select the correct design, methods and evaluation techniques. The first
problem, hypothesis H1 was to investigate the effects of training in selected IQ
dimensions on IQ. To explore this relationship IQ should be measured before
and after training. Based on the above hypothesis the following three
questions needed to be answered: 1) what are the most important IQ
dimensions for assessment and evaluation in the context of this study? 2) How
can an objective assessment of pre training and post training be effectively
carried out? 3) How can the effects of various other influencing factors be ruled
out? From reviewing the IQ literature an objective metric for measuring IQ
dimensions was selected (section 2-2-3). Furthermore, reviewing the various
research designs, it was noted that experimental research can typically enable
controls over various important factors and systematically and convincingly
‘rule out’ other possible explanations for improvement in a cause and effect
relationship. By definition, experimental design can be called a ‘blueprint’ of

77
the procedures that enable testing hypothesis in reaching valid conclusions
about relationships between training and IQ, and, for this reason, a laboratory
experiment was designed. The next step was to investigate important
predictors of IQ. Group discussions and face to face interviews were insightful
in identifying predictors other than training and invaluable as a means of
supporting the proposed IQ model. To develop the model the relevant
literatures were searched 1) for the most common training models (section 2-3)
and 2) for an instrument to measure trainee characteristics (section 2-4). The
developed model consisted of three main predictor categories.
Therefore, to gather the appropriate information to answer the research
questions in the most fitting way a mixed methodology approach (triangulation)
was used in which quantitative methods were supported by qualitative research
methodologies. Initially, an objective measurement method was used, to gather
data on information recording quality, before and after training. Subsequently,
in conjunction with the experiment, a survey with subjective measurements was
administered, to gather data about the present existing condition of IQ in the
healthcare domain and to determine predictors of IQ. The impact factor of
each construct was part of the objective. In the survey no manipulation of the
research environment was necessary and rather than employ various research
controls such as in the experimental approach, the survey data gathering
method centred on understanding the phenomena in their naturally occurring
states. In parallel to the quantitative method used for the survey and
experiment, a qualitative approach, group discussions and patient interviews,
was utilised to produce verbal information rather than numerical values. One
notable strength of conducting group discussions and interviews is that it
generates a truer feeling of the research setting, which cannot be obtained
from statistical analysis and numerical data used throughout the survey and
experiment. This method allowed flexibility in the data gathering and aided in
the analysis and interpretation of the data gathered in the survey and the

78
experiment. A roadmap to the DS guideline according to this study is given in
figure 3-3.
Medical ErrorReview
IQ ProblemIdentification
MediaCoverage
ResearchRelevance
ExperimentSurvey
Interviews
ArtefactIQ ModelIQTRAG
Wang FrameworkBaldwin & Ford
Goldberg Neo_PI
IQ TrainingRequirements
Analysis Guideline
SummaryResults
ExperimentSurveyInterviews
Hypotheses 2 - 6
ProblemIdentification
SolutionDesign
Evaluation
Denotes
Highlight
Build
Rigour Rigour
Redefines
EvaluateEvaluate
Evaluate
Provides
Contribution
Confirm
Instigates
Identifies ConstructsIdentifies Constructs
Thesis
Publication
Guideline 2:
Relevance
Guideline 5:Rigour
Guideline 5:Rigour
Guideline 1:Artefact
Guideline 6:
ResearchProcess
Guideline 6:
ResearchProcess
Guideline 6:ResearchProcess
Guideline 3Evaluate
Guideline 3Evaluate
Guideline 3Evaluate
Guideline 7Communication
Guideline 4Contribution
Guideline 4Contribution
Figure 3-3 Design Science Guideline Map to this Study

79
To recap, three types of data were gathered: 1) experiment with objective
measurements; 2) survey with subjective measurements, and 3) group
discussions and interviews to support and corroborate results from the survey,
and experiment and validate the conceptual model and IQTRAG.
Guideline 1 Design as an Artifact: This was achieved by the design and
development of an information quality training requirements analysis guideline
(Chapter 6) and the development of the IQ predictor model. Guideline 2
Problem Relevance can be seen from the many studies done on medical errors
with rising costs due in part to poor IQ detailed in Chapter 1. Guideline 3
Design Evaluation: The research was evaluated by a mixed method approach
which included an experiment to examine the impact of training, a Web based
survey to investigate predictor variables and their impact on IQ and interviews.
Guideline 4 Research Contributions: This research approach introduces new
concepts, constructs and their relationship to IQ within a predictor IQ model
and an output of an information quality training requirements analysis guideline
as a problem solution. Guideline 5 Research Rigour: This research is
supported by statistical analysis, existing evaluation methods, models and
measurements, and grounded in existing research using a modified version of
Wang and Strong’ IQ Framework, Goldberg's FFM and Baldwin and Ford's
Transfer of training model. Guideline 6 Design as a Search Process: Solution
divided into process steps and the most suitable instruments designed in each
step (survey, experiment or interviews). Guideline 7 Research Communication:
The knowledge gained in this study shall be communicated to the wider
audience by the publication of the thesis, presented at international
conferences, and published in international journals.
One challenge of doing IQ research on a DS approach is that although DS has
the potential to offer a useful methodological toolkit the question that must be
addressed if this approach is deemed credible and trustworthy to others is

80
‘What delineates DS from other forms of research?’ Therefore it is important to
clarify the distinction between existing methods and those central to DS. DS
focuses on understanding the complexity of real-world practice. Further, DS
involves flexible design revision, multiple dependent variables and capturing
social interaction. Lastly, given the focus on characterizing situations as
opposed to controlling variables, the focus of DS may be on developing a
profile or theory that characterizes the design in practice as opposed to simply
testing hypotheses. DS research requires more than understanding outcomes
in one particular context, but also requires showing the relevance of the
findings derived from this context to other contexts.
DS resembles formative evaluation methodologies as both are process-
oriented, iterative, and involve creating a tangible design that works in complex
social settings. Fundamentally, formative evaluation methodologies are about
improving the value of a particular designed artefact, whereas DS research is
concerned with using design in the service of developing models of how
humans think, know, act and learn. A critical component of DS research is that
the design is conceived not just to meet local needs, but to advance a
theoretical agenda, to uncover, explore, and confirm theoretical relationships.
What separates DS research in the sciences from formative evaluation is 1) a
constant impulse toward connecting design interventions with existing theory,
2) DS research may generate new theories and not simply testing existing
theories, and 3) that for some research propositions the context in which the
DS research is being carried out is the minimal ontology for which the variables
can be adequately investigated (we cannot return to the laboratory to further
test the theoretical claims). DS research requires more than simply showing
how a particular design works. It demands that it generates evidence-based
claims that address contemporary theoretical issues and further the theoretical
knowledge of the field.

81
3.5. Ethical Considerations
As this study required the participation of human respondents, certain ethical
issues were addressed. The consideration of these issues was necessary for
ensuring the privacy as well as the safety of the participants. Moreover, ethical
standards require that subjects not be compelled into taking part in the
research. Therefore, official ethics approval was sought and obtained, from the
Dublin City University Ethics Committee.
Ethical issues considered in the research process included consent and
confidentiality. Subjects were assured that the only records kept by the
experimenter were the random numbers on the task form, which did not relate
to their names. Subjects were also assured that their identities would remain
unknown to everyone, including the experimenter. Participants’ confidentiality
was guaranteed to be protected and identifying information would not be made
available to anyone, even those directly involved in the study. Only relevant
details that helped in answering the research propositions were included. Data
was reported in a way that would not reveal the identity of the individuals. ID
codes were used in a way that only the students would know their own number.
The anonymity and confidentiality of participation was fully protected. However,
these measures can only guarantee confidentiality within the limits of the law.
The results of this study were reported as group data only. Individual
information is not identifiable in the report.
To secure the consent of selected participants, the researcher relayed all-
important details of the study, including its aim and purpose. A plain language
statement (Appendix F) on the voluntary nature of the experiment was
provided. By explaining these important details the participants were able to
understand the importance of their role in the experiment. The participants
were advised that they could withdraw from the study at any time during the

82
process. They were not forced to engage in the research. The voluntary
participation of individuals in the research, which was based on a full
understanding of its possible benefits and risks, was provided. Informed
consent forms were signed by the participants when they agreed to the
contents and volunteered to engage in the study (Appendix G).
Approval was sought and obtained from the management of School of Nursing,
Dublin City University, Ireland, to undertake the research within their Nursing
School; to invite 3rd year nursing students as possible research participants,
and to gain exclusive use of the Dublin City University School of Nursing,
CHASETown, virtual hospital and classroom resources for experiment and
training purposes.
Control group participants were asked to participate in the skills based task and
document all relevant information. The total time commitment required of them
did not exceed 2 hours. However, the experimental participants were asked to
contribute in two ways: 1) to attend the training workshop where they would be
briefed in IQ, and 2) to participate in the skills based task and document all
relevant information so that documentation quality after training could be
evaluated. The total time commitment required of the experimental group did
not exceed 3 hours. Documented data was collected individually and
aggregated by the investigator.
3.6. Summary
The study suggests that the impact of high-quality healthcare documentation
should be assessed on several levels: the quality of information recording;
training sequencing; training duration; the work environment; team support; IS
and personality traits. Therefore, the survey methodology was used to further
explore these constructs and to discover their impact on IQ. The dimensions
83
chosen to be assessed were selected from the established IQ literature. The
study adopted the ideas of Ballou & Pazer (1985) using three of the suggested
four most important dimensions of IQ: accuracy, completeness, and
consistency from the IQ framework of Wang & Strong (1996). The literature
also provided a set of metrics for measuring IQ. Interviews with medical
professionals confirmed the importance and relevance of the selected
dimensions under investigation. Chapter 4 presents an analysis of the data
collected in the experiment and in Chapter 5, the survey phases of the study.
Both chapters describe how the data was analysed. Chapter 6 presents the
problem based solution, IQTRAG.

84
C h a p t e r 4
EXPERIMENTAL FRAMEWORK
4.1. Introduction
Chapter 3 argued for the Design Science (DS) research methodology used in
this research. The study was carried out in three phases. In phase one, a
controlled experiment was conducted, which included group discussions with
participants, interviews with patients and observations from two research
observers. In phase two, a web based survey was purposefully designed and
administered (detailed in Chapter 5) and based on the results ‘An Information
Quality Training Requirements Analysis Guideline' (IQTRAG) was developed
(outlined in Chapter 6) see figure 4-1. This chapter presents the findings from
phase one and outlines the experimental setup for data collection together with
a description of how the data was analysed.
Figure 4-1 Research Data Gathering and Research Output
To investigate the research proposition H1: 'Training will be associated with
improved IQ’, an experimental research approach was used within a virtual
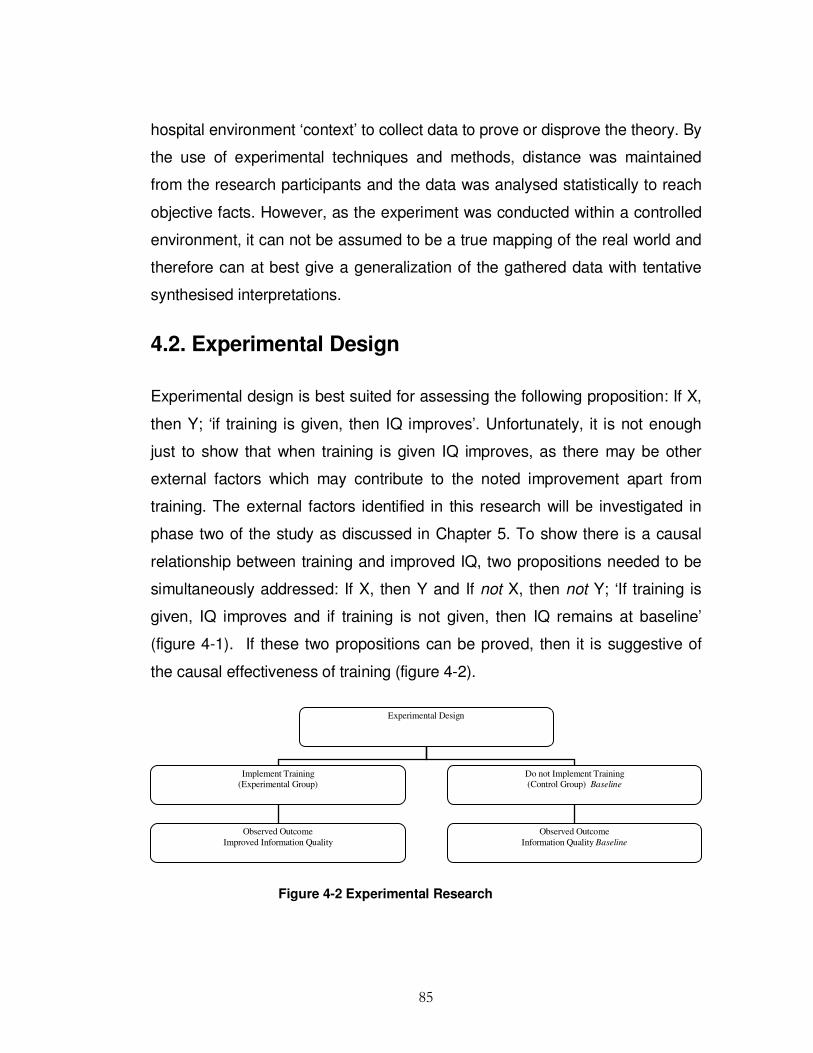
85
hospital environment ‘context’ to collect data to prove or disprove the theory. By
the use of experimental techniques and methods, distance was maintained
from the research participants and the data was analysed statistically to reach
objective facts. However, as the experiment was conducted within a controlled
environment, it can not be assumed to be a true mapping of the real world and
therefore can at best give a generalization of the gathered data with tentative
synthesised interpretations.
4.2. Experimental Design
Experimental design is best suited for assessing the following proposition: If X,
then Y; ‘if training is given, then IQ improves’. Unfortunately, it is not enough
just to show that when training is given IQ improves, as there may be other
external factors which may contribute to the noted improvement apart from
training. The external factors identified in this research will be investigated in
phase two of the study as discussed in Chapter 5. To show there is a causal
relationship between training and improved IQ, two propositions needed to be
simultaneously addressed: If X, then Y and If not X, then not Y; ‘If training is
given, IQ improves and if training is not given, then IQ remains at baseline’
(figure 4-1). If these two propositions can be proved, then it is suggestive of
the causal effectiveness of training (figure 4-2).
Figure 4-2 Experimental Research
Experimental Design
Implement Training
(Experimental Group)
Do not Implement Training
(Control Group) Baseline
Observed Outcome
Information Quality Baseline
Observed Outcome
Improved Information Quality
86
Given the difficulty of maintaining objectivity and claiming with certainty that
training alone caused improvement in IQ, a manipulative methodology using
experimental design and empirical methods, to reduce the problem of multiple
variable interferences was employed. In this way the researcher was able to
control the work environment, and thereby neutralize the effects from other
factors. This helped to remove bias by discovering objective facts and created
the ability to assess the impact of training on IQ. It is expected that training will
improve the baseline documentation quality and will show a statistically
significant difference in IQ recorded between the experimental and control
groups in accuracy, consistency or completeness, or a combination of these
dimensions.
4.2.1. Experimental Methodology
The experiment provided a framework for suggesting a relationship between
training and improved IQ. This involved manipulating the training variable and
noting the outcome on the IQ variable. Ideally, what were needed were
identical conditions and the same people to discover if IQ improves following
training. Campbell & Stanley (1963) indicate that a dependent variable may be
affected by subjects’ prior testing (pre-test) experience. Hence, the act of
completing a data gathering exercise a second time with the same subjects is
likely to affect subject performance or recall (Martella et al. 1999). However,
this created a paradoxical situation as training needed to be given and not
given to the same group simultaneously. However, this obstacle was overcome
by creating two groups that were as similar to each other as possible. Training
was not administered to the control group so that a pre-training baseline level
of IQ could be observed and training was administered to the experimental
group and the level of IQ improvement of baseline level of IQ was observed.
Firstly, two groups (that were equivalent to each other) were created. One
group (experimental) was trained and the other group (control) was not.
87
External factors were controlled by using similar people who shared a related
background knowledge and education. The two groups were deemed to be as
comparable as possible, thus this was arguably the closest method possible to
training and not training the same group simultaneously. Subsequently any
differences noted in the IQ documentation recorded between these two groups,
was due to the only feature that differed between them which was that the
experimental group was provided with training and the control group was not.
Effects associated with the subject selection process may influence the
independent variable in such a way that associated measurements are
unrepresentative of what might be expected (Campbell & Stanley 1963; Nelson
et al. 1999). The approach used in this study to select two equivalent groups
relied on the technique of randomly assigning subjects into groups from a
common pool of people. However, even with random assignment it can never
be expected that the two groups created are identical, so the idea was to rely
on the notion of probability and assume the two groups were ‘probabilistically
equivalent’ (Cook & Campbell 1979). It is assumed that if there are sufficient
people in our study there is a good chance of assessing whether training
caused improvement in IQ. It is generally recognized that clinical studies often
involve small samples. Kraemer (1981) pointed out that ’a minority of clinical
research studies report as many as 30- 40 subjects’. She further noted that ‘in
recent psychiatric clinical research, 20 seems a generally acceptable sample
size’ but that ‘many studies with fewer than 20 subjects are published’
(Kraemer 1981).
Both groups, see section 4-2-2, preformed a series of routine hospital tasks,
designed and developed by the researcher with advice from practitioners in the
medical field (see Appendix E). The experimental factors, such as the data set,
were the same for both groups. There were two experimenters dividing their
work at random between experimental and control groups, with both groups

88
working simultaneously. The IQ improvement was specifically measured, from
data collected in the manually filled patient records, recorded in all cases. The
experiment was completed, firstly with the control group, and the baseline pre
training documentation recording quality accessed. IQ levels were identified by
comparing the information recorded in the manually filled patient records to
what should have been recorded in accordance with the instruction sheet
provided.
As outlined in Chapter 2, section 2-4, notable research supports the
relationship between personality and job performance (Barrick & Mount 1991;
Costa & McCrae 1995; Colquitt & Simmering 1998; Barrick et al.1998).
Therefore, as well as the task based test, a NEO_PI personality questionnaire
(Goldberg 1990) (Appendix C), was administered to both groups. This helped
to identify nature vs. nurture aspects. Among the personality traits,
conscientiousness (Costa & McCrae 1992) was considered to be especially
promising in predicting training proficiency (Hogan & Ones 1997). The NEO_PI
test covered the conscientiousness trait of personality, which dealt with the
constructs of assertiveness, intellect, self-efficacy, orderliness, dutifulness,
achievement striving, self-discipline and cautiousness (Goldberg 1990).
4.2.2. Experiment Sampling Frame
To build the sample group selection for this study, certain inclusion criteria were
imposed. For the participants to qualify in the sample selection, students had
to be in the final year of an undergraduate nursing degree, studying the same
modules, and have undergone work experience in a real hospital setting. This
qualification ensured that the participants understood the nature of manually
recording patient information and its importance in their daily work processes,
thus making the task based scenarios easy for them to understand and
perform. Thirty eight final year student nurses from Dublin City University

89
School of Nursing signed the consent forms and were randomly assigned to
either the control or experimental group.
Random sampling was conducted whereby each member of a population had
an equal opportunity to become part of either group. For this procedure, a
lottery type sampling technique was employed. This method involved selecting
the groups at random from the sampling frame by using unsystematic numbers.
Letter (A) was assigned to the experimental group and letter (B) to the control
group. These letters were written on individual pieces of paper which were
folded and placed in a box. Each participating nurse in turn, and in random
order, drew one letter from the box which assigned them to a particular group.
This process was repeated until both groups were filled with 19 subjects
assigned to each group. However, on the appointed day of the experiment 23
subjects, fifteen who had been assigned to the control group and eight who had
been assigned to the experimental group participated.
4.2.3. Environment
CHASEtown is an open source virtual hospital learning environment in Dublin
City University, School of Nursing, Ireland. It focuses on the education and
training of healthcare professionals. Practical skills form a large part of the
programmes taught to students in the school-based simulated nursing
environment to prepare them for their practical experience in the clinical
environment. A central part of the School of Nursing strategy is to support all
students across the spectrum from novice, full-time undergraduate students, to
part-time students who are working full-time as experienced clinicians.
Given that nursing is a practice-focused discipline, the issue of integrating
theory and practice is particularly acute. Therefore, CHASEtown was an
appropriate setting for this study and extensive use of the CHASEtown virtual

90
hospital environment was used to simulate activities of a physical hospital
environment. This environment was carefully prepared to create the
atmosphere of a real hospital setting. The two hospital wards contained 16
hospital beds, manikins, drug trolleys, a nursing station and other relevant
equipment that could typically be found in a hospital. Sixteen subjects were
invited to role-play as patients.
4.2.4. Experimental Procedure
The procedure used in this experiment involved several steps (table 4-1).
Table 4-1 Experimental Procedure Steps
Steps Procedures
Step 1 Virtual patients set up with histories and medical records
Step 2 Meetings with members of program board (School of Nursing)
Step 3 The study explained to students to elicit participation
Step 4 A plain language statement administered to participants explaining the study in detail
Step 5 Consent forms signed by participating subjects
Step 6 The subjects complete a questionnaire
Step 7 Appointments scheduled for experiment
Step 8 Scheduled training session was experimental group
Step 9 Conduct the experiment
Initially eight virtual patients with medical histories were created. This led to
the design and development of individual manual patient charts. Each chart
had a unique identification (ID) hospital number, past medical histories, and
medication regimes. As it was attempted to simulate real-life, a selection of
typical practices within a real hospital was created. Nurses attended to
91
routine nursing activities such as admitting patients, taking and recording vital
signs, giving medication and discharging patients. The tasks also dealt with
reviewing patient notes and recording interventions and vital signs. The goal
based scenario was simulated, in which participants assumed their main role,
carried out the tasks associated with the scenarios and documented events.
Following this, the experiment research design and the aim of the experiment
was discussed at length with the course co-ordinator and two staff members
in the School of Nursing, Dublin City University, Ireland. Approval was sought
to elicit students as voluntary participants in the study and permission
obtained to carry out the experiment within the virtual hospital environment.
Next, students were then introduced to the study in a 30-minute introductory
session, which outlined the overall aim of the research. This allowed students
the opportunity to engage in a class discussion about their role in the study. All
students received a plain language statement as part of the ethical procedure
(Appendix F) and 38 students, who agreed to voluntarily participate, signed the
informed consent form (Appendix G). Students with any concerns about the
exercise were invited to speak to the investigator. Following this the
participants were divided into two groups. Nineteen were assigned to group A
(control group) which were expected to participate for two hours and 19
assigned to group B (experimental group). Subjects in this group were
expected to participate for 3 hours as described above.
Data collection began with a NEO_PI personality test administered to the entire
population (Appendix C). This included an IQ perception questionnaire to
access a baseline of participants’ IQ awareness and IQ recording experience,
as well as demographic information.
The control group arrived at the specified ward on the 17th November 2008 and
received instruction (Appendix B). Each student was given a unique ID number

92
and assigned a task packet. The ID number was used as a control number and
as an indicator to assign the student to either ward 1 or ward 2. The data was
collected through manually filled patient records (Appendix D) on given
scenarios (Appendix E). The scenarios were introduced as a ‘fact sheet’, which
gave the background history of the patient and the intervention to be
administered and recorded. Each nurse filled individual sets of patient records.
At the end of the two hour session, nurses were expected to have recorded all
relevant data into the manual patient charts. Each participant received an
individual set of patient records with both the participants’ and patients’ unique
ID numbers firmly attached to the workbook.
The experimental group arrived for training on November 24th 2008 and
received a training workshop. This training was an intensive one hour session
designed for people who were to partake in the next stages of the experiment
and had not been exposed to previous IQ training. Total participation was
limited to no more than 20 people and was designed for group participation.
The training was carried out in a computer laboratory in Dublin City University,
School of Nursing. A PowerPoint projector and large screen was set up at the
front of the laboratory. Participants were asked to partake in the discussion on
the importance of the workshop content and their perception of IQ in general.
Advance reading was not required. A set of patient record handout material
needed for this training was provided to each participant, together with a copy
of the PowerPoint training presentation. The goal of the training session was to
provide participants with an opportunity to better understand the concepts of
IQ, with a view to improving baseline IQ recording. The session began with:
1. An introduction to data management (DM) (5 minutes).
2. An Introduction to Information Quality (IQ) and why IQ is important (10
minutes).

93
3. A discussion of why accurate consistent and completeness of information
recording is important in general and in healthcare. This led to a further
discussion on medical errors (15 minutes).
4. A discussion on reasons for recording good quality documentation covering
topics of patient care, legal claims and payment justification (10 minutes).
5. Practical sample documentation recording of patient admission, medication
regime and discharge (10 minutes)
6. Questions and Answers and wrap up (10 minutes).
On completion of the workshop participants immediately underwent the same
experimental documentation recording process as the control group.
4.2.5. IQ Measurement
Two types of variables were identified: dependent variables, that measures
various dimensions of IQ (accuracy, completeness and consistency), and
independent variables that measures training. The IQ dimensions were
identified using Wang’s framework and the IQA developed by (Lee et al. 2002)
and measured using Redman's (1995) metric section 2-2-3. Experimental
tasks that measured the dimensions of accuracy, completeness and
consistency are listed in Appendix E.
The nature of the hospital environment was understood and analysed through
informal interviews with practitioners so important IQ dimensions could be
chosen for measurement. The IQ measurement was selected from established
measurement techniques in the IQ literature (Redman, 1995) outlined in
section 2-2-3. This form of measurement was useful for measuring
consistency, accuracy and completeness (table 4-2). When computing data
accuracy, the metric is defined as the number of data units accurate divided by
the total number of data elements. The total completeness is measured by

94
taking the ratio of the number of incomplete items to the total number of items.
A metric measuring consistency is the ratio of specific consistency type to the
total number of consistency items. The research propositions focused mainly
on finding relationships between training and accuracy, consistency and
completeness of IQ. In the context of this study, quality measure is essentially
pieces of data that tell how healthcare processes and interventions are being
documented under the selected IQ dimensions of accuracy, consistency and
completeness (Wang & Strong 1996). The accuracy measure tells what
percentage of the data items were documented in an accurate manner; the
consistency measure tells whether the nurses followed the precise
representation format specified by the code of practice (dd/mm/yyyy for year
and using 24-hour clock to record times e. g. 15:00). Although consistency
has two dimensions, structure and content, this study refers only to the
structure of the data and not to the content (Ballou & Pazer 2003). The
completeness measure reveals if all the data was recorded in a complete
manner.
Table 4-2 Information Quality Metrics Classification
DIMENSION METRIC DEFINITION AND MEASUREMENT PARAMETERS
Accuracy # correct values
# total values
The measure or degree of agreement between a data value and
the source agreed to be correct
Consistency # consistency
# total
The extent where the physical instance is in accordance with the
specified format
Completeness # incomplete items
# total items
The extent to which data elements are not missing
4.2.6. Pilot Study
To determine the quality of the experimental design, a pilot study was
conducted by administering the instrument to a group of five participants,
personally known to the researcher. The participants possessed varying
degrees of knowledge about IQ. Feedback obtained from the pilot study

95
ensured that problems were captured and changes made where required. It
used the same basic procedure as was used in the experiment. This produced
estimates of the average time to complete the tasks. Pilot participants were
also asked to comment on the usability and clarity of the questions, the
instrument and the intelligibility and consistency of tasks and procedure. The
instrument was then checked against the following:
� The applicability of the selected dimensions
� The language used in the tasks
� The design of the patient records
� The length of time required to complete the assessment.
The subjects in the pilot test also completed the personality test questionnaire.
They reported if there were ambiguities in either the task or the questionnaire.
The pilot study helped to clarify problems such as time management and as a
result, the experiment was reduced in size.
4.3. Experimental Findings
All data were examined and coded into SPSS (Statistical Package for Social
Sciences) 15.0 for Windows. A range of data analysis methods were employed
on the data. These included participants’ demographic information, section 4-
3-1; IQ descriptive statistics, section 4-3-2; tests for normal distribution section,
4-3-3; independent sample t-tests of IQ means, section 4-3-4; correlations of
participants’ IQ perception and IQ recording, section 4-3-5, and the impact of
trainee characteristics, section 4-3-6. The values were calculated as the
statistical mean of the items associated with each group. Data was evaluated
by objective measurements using the simple ratio method as described in
section 4-2-5.

96
The goal for the statistical part of this research is to investigate causality and in
particular to draw a conclusion on the effect of changes in the values of the
dependant variables. An experimental causal statistical method was used in
this research where the effect of the differences by the independent variable
(training) on the behaviour of the dependent variable (IQ) was observed. The
experimental study involved taking IQ measurements of the sample under
study, introduce training, and then take measurements using the same
procedure to determine if the training modified the original values of the IQ
measurements.
Descriptive statistics were used to summarize the population data by
describing what was observed in the sample with numerical descriptors that
include the mean and standard deviation while percentage were used for
describing categorical data (like gender and demographics).
4.3.1. Participants’ Demographics
By nationality, most participants were Irish 17 (74%) with the remaining 26%
equally distributed between European Union (EU) 3 (13%) and Non-EU 3
(13%) see table 4-3.
Table 4-3 Nationality
Frequency Percent
Valid Irish 17 73.9
EU 3 13.0
Non-EU 3 13.0
Total 23 100.0
By gender, the ratio of male to female respondents in the experiment was 3
(13%) to 20 (87%).
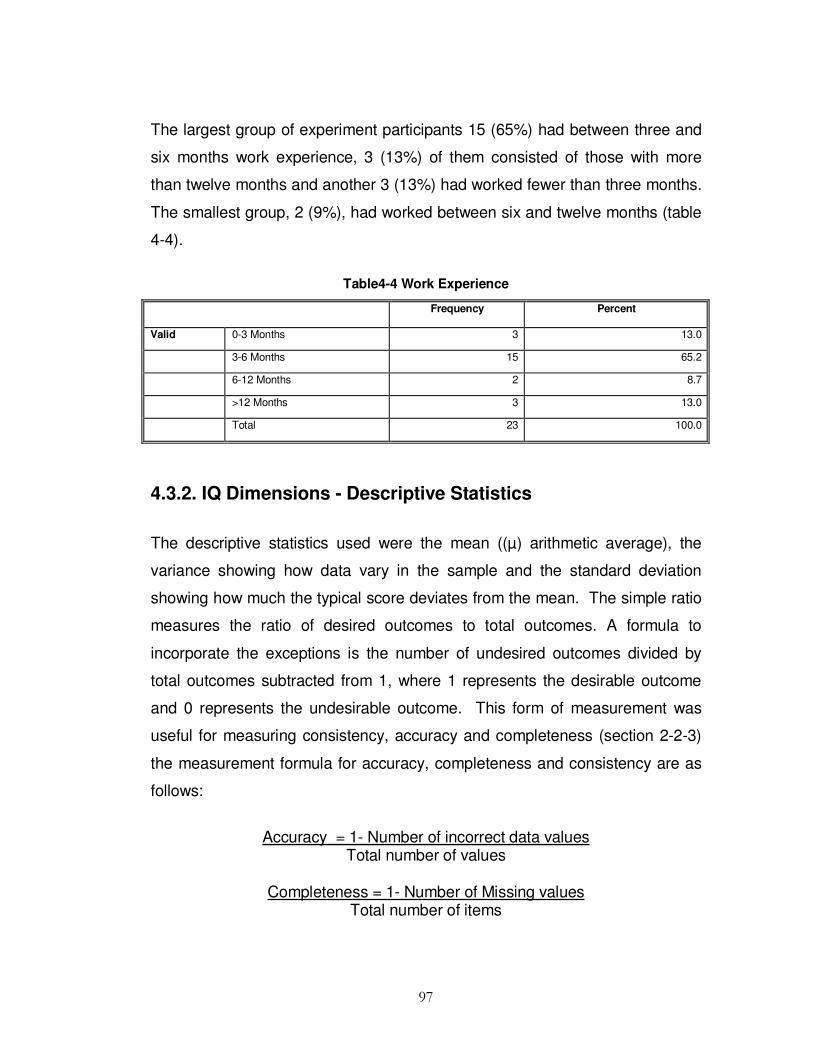
97
The largest group of experiment participants 15 (65%) had between three and
six months work experience, 3 (13%) of them consisted of those with more
than twelve months and another 3 (13%) had worked fewer than three months.
The smallest group, 2 (9%), had worked between six and twelve months (table
4-4).
Table4-4 Work Experience
Frequency Percent
Valid 0-3 Months 3 13.0
3-6 Months 15 65.2
6-12 Months 2 8.7
>12 Months 3 13.0
Total 23 100.0
4.3.2. IQ Dimensions - Descriptive Statistics
The descriptive statistics used were the mean ((µ) arithmetic average), the
variance showing how data vary in the sample and the standard deviation
showing how much the typical score deviates from the mean. The simple ratio
measures the ratio of desired outcomes to total outcomes. A formula to
incorporate the exceptions is the number of undesired outcomes divided by
total outcomes subtracted from 1, where 1 represents the desirable outcome
and 0 represents the undesirable outcome. This form of measurement was
useful for measuring consistency, accuracy and completeness (section 2-2-3)
the measurement formula for accuracy, completeness and consistency are as
follows:
Accuracy = 1- Number of incorrect data values Total number of values
Completeness = 1- Number of Missing values
Total number of items

98
Consistency = 1- Number of Inconsistent values
Total number of values
Of the 38 individuals volunteering to engage in the experiment, 23 of them
participated between November 17th 2008 and November 24th 2008 (a one-
week period). They were students of different gender, age and nationalities. Of
the total participants, 15 (65%) had been assigned to the control group and 8
(35%) had been assigned to the experimental group by random selection
described in section 4-2-2.
The central tendency of a distribution locates the ‘centre’ of a distribution of
values. The three major types of central tendency are the mean, the median,
and the mode, which is considered in more detail in the following section. The
mean is the most commonly used method of describing central tendency. To
compute the mean, the sum of the values for accuracy was taken and divided
by the count. For example, the µ IQ accuracy score Σ accuracy scores ⁄N.
Similarly the µ IQ score for consistency is determined Σ consistency scores ⁄ N,
and the µ IQ completeness score is determined by Σ completeness scores ⁄ N.
Table 4-5 shows descriptive statistics for accuracy, consistency and
completeness for both control and experimental groups. The control group had
µ accuracy, µ consistency and µ completeness levels of (0.51), (0.64) and
(0.57) respectively (∑ accuracy_score/15), and the experimental group had µ
accuracy, µ consistency and µ completeness levels of (0.66), (0.71) and (0.66)
respectively (∑ accuracy score /8. This shows that the experimental group had
greater mean accuracy consistency and completeness levels than the control
group.
The median is the score found at the middle of the set of values i.e., that has as
many cases with a larger value as have a smaller value. One way to compute
the median is to sort the values in numerical order and then locate the value in

99
the middle of the list. The control group median accuracy, consistency and
completeness score was (0.51), (0.60) and (0.56) respectively and the
experimental group had median accuracy, consistency and completeness
score of (0.61), (0.78) and (0.61) respectively. The median score for the control
group was less than the experimental group.
The mode is the most frequently occurring value in the set. The mode for the
control group, accuracy, consistency and completeness was (0.32), (0.46)
(0.34) respectively and the experimental group mode for accuracy, consistency
and completeness was (0.57), (0.37) and (0.56) respectively. The mode, for
the control group was higher than the experimental group for consistency but
lower in both accuracy and completeness.
Dispersion is the spread of values around the central tendency. There are two
common measures of dispersion, the range and the standard deviation (σ). The
range is the highest value (maximum) minus the lowest value (minimum). The
control group had a minimum accuracy, consistency and completeness (0.32),
(0.46) and (0.34) respectively and the experimental group had a minimum
accuracy, consistency and completeness (0.57), (0.37) and (0.56) respectively.
The minimum score for the control group was higher than that for the
experimental group for consistency but lower in both accuracy and
completeness. The control group had maximum accuracy, consistency and
completeness (0.65), (0.83) and (0.76) respectively and the experimental group
had maximum accuracy, consistency and completeness (0.86), (0.91) and
(0.84) respectively. The maximum score for the control group was lower than
that of the experimental group in all dimensions. The control group range for
accuracy, consistency and completeness was (0.33), (0.37) and (0.42)
respectively and the experimental group had a range for accuracy, consistency
and completeness of (0.29), (0.54) and (0.28) respectively. The spread for the
control group accuracy (0.33), consistency (0.37) and completeness (0.42)

100
while the experimental group had a spread for accuracy (0.28), consistency
(0.17) and completeness (0.28).This shows that the range for the control group
was higher than that of the experimental group for accuracy and completeness
but lower for consistency.
The σ is a more detailed estimate of dispersion and shows the relation that set
of scores has to the mean of the sample. The control group σ for accuracy,
consistency and completeness (0.09), (0.12) and (0.10) respectively and σ for
the experimental group was (0.11), (0.20) and (0.11) respectively. The σ of the
control group was lower than the experimental group σ. Control group
variance (VAR) for accuracy, consistency and completeness was (0.009),
(0.015) and (0.011) respectively and VAR for accuracy, consistency and
completeness for the experimental group was (0.011), (0.039) and (0.013)
respectively. The control group VAR was lower than that of experimental
group.
Table 4-5 Control and Experimental Group - Descriptive Statistics
Control
Accuracy
Experiment
Accuracy
Control
Consistency
Experiment
Consistency
Control
Completeness
Experiment
Completeness
N Valid 15 8 15 8 15 8
Missing 8 15 8 15 8 15
Mean .5115 .6633 .6374 .7075 .5688 .6559
Std. Error of
Mean
.02394 .03734 .03171 .06966 .02654 .04022
Median .5148 .6134 .6042 .7760 .5589 .6091
Mode .32(a) .57(a) .46(a) .37(a) .34(a) .56(a)
Std. Deviation .09273 .10561 .12280 .19702 .10280 .11375
Variance .009 .011 .015 .039 .011 .013
Range .33 .29 .37 .54 .42 .28
Minimum .32 .57 .46 .37 .34 .56
Maximum .65 .86 .83 .91 .76 .84
a: Multiple modes exist. The smallest value is shown

101
4.3.3. Test for Normal Distribution
The degree to which the sample is representative of the population is
addressed in this section. Screening for normality was conducted by calculating
the Kolmogorov-Smirnov Z test (KS Test) statistic to the sample data to
determine if the data in the sample corresponded to a normally distributed data
and to show that the data was not significantly different from a normal
distribution at p < 0.05 level of significance. To arrive at the mean (µ) IQ score,
Sigma (∑) of (µ) accuracy, (µ) consistency and (µ) completeness scores were
taken before calculating the KS test. All variables had Asymp. Sig. (2 tailed)
values of p > 0.05 for accuracy consistency and completeness for both groups,
and therefore, can be assumed to be normally distributed (table 4-6). Accuracy
control group (p= 0.253), experimental group (p= 0.463), consistency control
group (p= 0.930), experimental group (p = 0.825), completeness control group
(p = 0.948) and experimental group (p = 0.825).
The control group has µ accuracy (0.51) and σ (0.09) and the experimental
group has µ accuracy (0.66) and σ (0.11). The control group has µ consistency
(0.64) and σ (0.12) while the experimental group has µ consistency (0.71) and
σ (0.20). The control group has µ completeness (0.57) and σ (0.10) and the
experimental group has µ completeness (0.66) and σ (0.11). As there were no
significant difference (NS) between the population percentages and the sample
percentages it suggested the sample responses are broadly representative.

102
Table 4-6 Kolmogorov-Smirnov Test for Normality of Experiment Test Data
Control
Accuracy
Experimental
Accuracy
Control
Consistency
Experimental
Consistency
Control
Completeness
Experimental
Completeness
N 15 8 15 8 15 8
Normal Parameters a,b) Mean .5115 .6633 .6374 .7075 .5688 .6559
Std. Deviation .09273 .10561 .12280 .19702 .10280 .11375
Most Extreme Differences Absolute .262 .301 .140 .222 .135 .222
Positive .112 .301 .140 .154 .096 .222
Negative - 262 -.186 -.117 -.222 -.135 -.189
Kolmogorov-Smirnov Z 1.016 .852 .543 .628 .522 .628
Asymp. Sig. (2-tailed) .253 .463 .930 .825 .948 .825
a Test distribution is Normal.
b Calculated from data.

103
4.3.4 Independent Sample t-Tests of IQ Means
Having checked for normality and examined the frequency of the data set,
statistically significant differences in IQ recording between groups was tested
using the most appropriate independent sample t-test procedure. The t-test
assesses whether the means of the two groups are statistically different from
each other and shows whether or not training in accuracy, consistency and
completeness can be associated with improved IQ as set out in sub-hypothesis
H1a, H1b and H1c Chapter 1, section 1-3. The null hypothesis is H0: µ2-µ1 ≤
0, H1: µ2 - µ1 > 0, where µ1 is mean of control group and µ2 is mean of
experimental group. Independent sample t-tests were used because the
observations are independent and they are the best tests to determine whether
the means from the samples are different. First a test for equal variances using
Levene's Test for Equality of Variances was employed because the t-test
assumes that the data is more or less normally distributed and that the
variances are equal.
Table 4-7 shows the test result for equal variances for accuracy F=0.928, p >
0.05 (p = 0.346), which shows accuracy significant at t (21) = -3.567, p = 0.002.
Equal variances for consistency F=2.648, p > 0.05, (p= .119). Therefore, the
variances are non-significant t (21) = -10.055, p = 0.304 and equal variances
for completeness: F= 0.545, p > 0.05 (p =0.469), t (21) = -1.867, p = 0.076 and
was non-significant. To show whether the model is a reasonable
representation of the population, the probability of getting our results by chance
alone was computed. The probability of obtaining the accuracy value was (p =
0.002), p < 0.05, consistency (p =0.304), p > .05 and completeness (p= 0.08),
P >.05 Therefore only the accuracy dimension was statistically significant and
not suggestive of chance alone. However completeness and consistent was
not significant (NS).
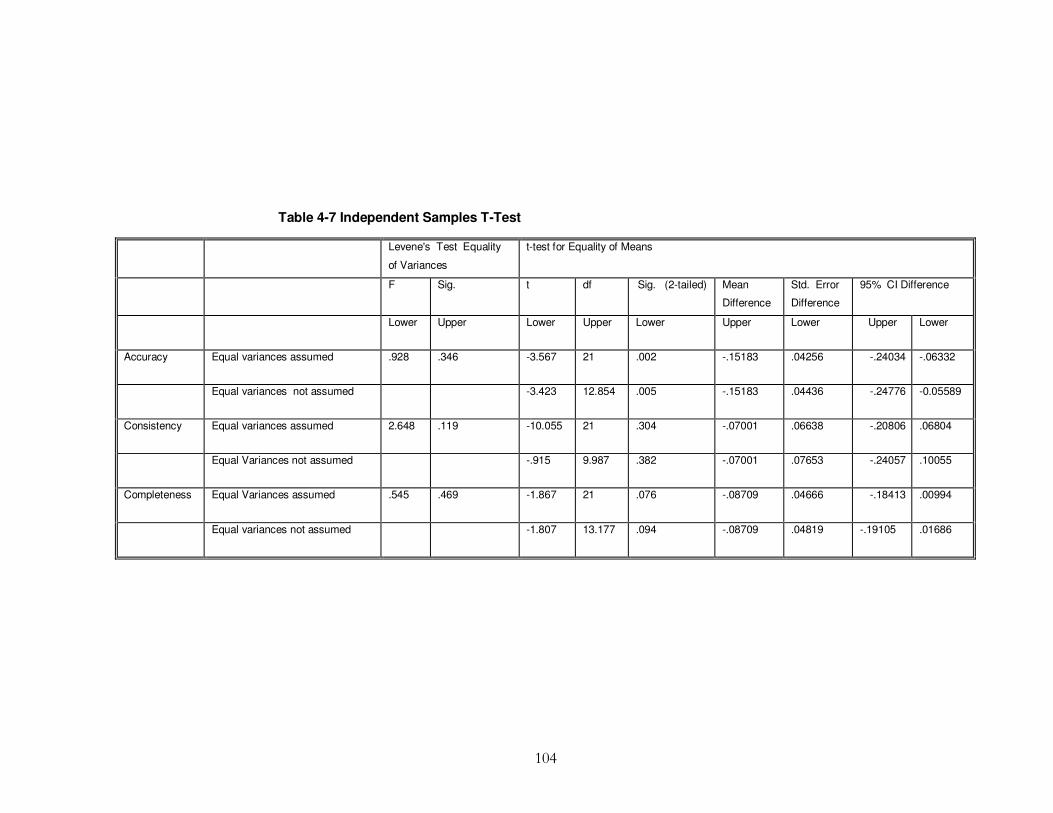
104
Table 4-7 Independent Samples T-Test
Levene's Test Equality
of Variances
t-test for Equality of Means
F Sig. t df Sig. (2-tailed) Mean
Difference
Std. Error
Difference
95% CI Difference
Lower Upper Lower Upper Lower Upper Lower Upper Lower
Accuracy Equal variances assumed .928 .346 -3.567 21 .002 -.15183 .04256 -.24034 -.06332
Equal variances not assumed -3.423 12.854 .005 -.15183 .04436 -.24776 -0.05589
Consistency Equal variances assumed 2.648 .119 -10.055 21 .304 -.07001 .06638 -.20806 .06804
Equal Variances not assumed -.915 9.987 .382 -.07001 .07653 -.24057 .10055
Completeness Equal Variances assumed .545 .469 -1.867 21 .076 -.08709 .04666 -.18413 .00994
Equal variances not assumed -1.807 13.177 .094 -.08709 .04819 -.19105 .01686
105
4.3.5 Participants’ IQ Perception
The degree of association between two variables (correlation) can be
described by a coefficient: indicating the strength of association. Correlation
statistics were used in this section to examine the relationships between
participants' IQ perception and IQ. Pearson's r parametric statistic was used,
which shows the strength of the relationship (0 being none and 1 being a
perfect relationship) and the direction of a relationship (-1 to +1). The means
for IQ perception and IQ recording was analysed (table 4.8).
Accuracy is positively related to completeness with a Pearson’s correlation
coefficient of r = 0.896**, N = 23, p <0.01, significant at .01 level. This
indicates that high scores in accuracy are associated with high scores in
completeness and is statistically significant at .01 level. Accuracy is negatively
related to IQ perception with a Pearson correlation coefficient of r = -0.489, N
= 23, p < 0.05, significant at the .05 level. This indicates that high scores in
accuracy are associated with low scores in IQ perception and is statistically
significant at .05 level.
Consistency is negatively related to IQ perception with a Pearson correlation
coefficient of r = -0.213, N = 23, p > 0.05. This indicates that high scores in
consistency are associated with low scores in IQ perception but is not
statistically significant (NS) at .05 level.
Completeness is negatively related to IQ perception with a Pearson
correlation coefficient of r = -0.319, N = 23, p > 0.05. This indicates that high
scores in completeness are associated with low scores in IQ perception (NS).
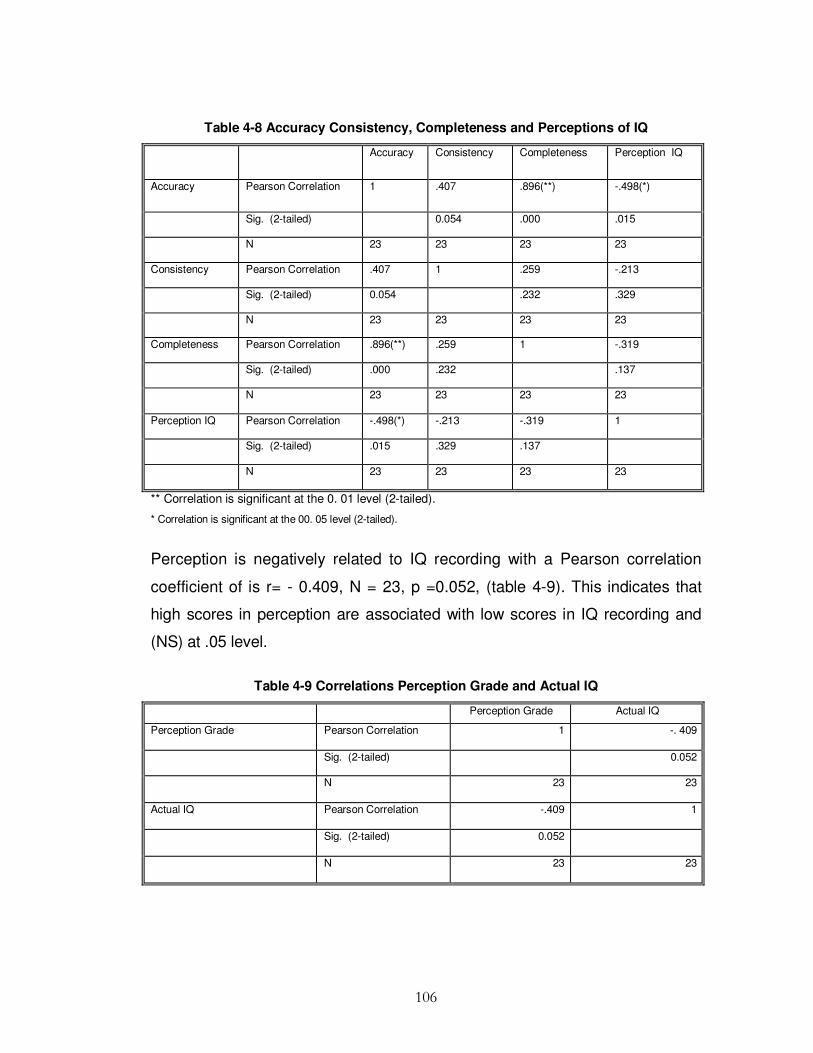
106
Table 4-8 Accuracy Consistency, Completeness and Perceptions of IQ
Accuracy Consistency Completeness Perception IQ
Accuracy Pearson Correlation 1 .407 .896(**) -.498(*)
Sig. (2-tailed) 0.054 .000 .015
N 23 23 23 23
Consistency Pearson Correlation .407 1 .259 -.213
Sig. (2-tailed) 0.054 .232 .329
N 23 23 23 23
Completeness Pearson Correlation .896(**) .259 1 -.319
Sig. (2-tailed) .000 .232 .137
N 23 23 23 23
Perception IQ Pearson Correlation -.498(*) -.213 -.319 1
Sig. (2-tailed) .015 .329 .137
N 23 23 23 23
** Correlation is significant at the 0. 01 level (2-tailed).
* Correlation is significant at the 00. 05 level (2-tailed).
Perception is negatively related to IQ recording with a Pearson correlation
coefficient of is r= - 0.409, N = 23, p =0.052, (table 4-9). This indicates that
high scores in perception are associated with low scores in IQ recording and
(NS) at .05 level.
Table 4-9 Correlations Perception Grade and Actual IQ
Perception Grade Actual IQ
Perception Grade Pearson Correlation 1 -. 409
Sig. (2-tailed) 0.052
N 23 23
Actual IQ Pearson Correlation -.409 1
Sig. (2-tailed) 0.052
N 23 23

107
Statistically significant differences in IQ perception and statistically significant
differences between actual IQ grades obtained in the laboratory experiment
between groups was tested using the independent sample t-test procedure. It
was found that perception grade was not significantly different between
groups, (p=.484), p>.05. However, the actual IQ grade obtained in the
experiment shows a statistically significant difference between groups with
(p=.02), p < 0.05 as shown in (table 4-10).
4.3.6. Impact of Personality on IQ
This section presents the statistics for correlation between IQ and the many
elements of conscientiousness trait of the personality. From the personality
test we find that Accuracy in the experimental group to Dutifulness has a
Pearson's correlation coefficient of r = 0.624 N = 8, (p=.098), p > 0.05, which
indicates a low association. Accuracy related to Achievement Striving, a
Pearson's correlation coefficient of r = 0.128 N = 8, (p=.762), p > 0.05, which
indicates a very low association. Accuracy related to Self-Discipline, a
Pearson's correlation coefficient of r = 0.700, N = 8, (p=.053), p > 0.05 which
indicates a low association, see (table 4-11).
Consistency in the experimental group related to Dutifulness has a Pearson's
correlation coefficient of r = 0.304 N = 8, (p=.463), p > 0.05, indicating a very
low association. Consistency related to Achievement Striving, a Pearson's
correlation coefficient of r = -0.210 N = 8, (p=.618), p >0.05 indicating a very
low association. Consistency related to Self-Discipline, a Pearson's
correlation coefficient of r = 0.282, N = 8, (p=.499), p > 0.05, indicating a very
low association, see (table 4-11). Completeness in the experimental group
related to Dutifulness has a Pearson's correlation coefficient of r = 0.576, N =
8, (p=.135), p > 0.05, which indicates a low association.

108
Completeness related to Achievement Striving, a Pearson's correlation
coefficient of r = 0.288 N = 8, (p=.488), p > 0.05 indicates a very low
association. Completeness related to Self-Discipline, a Pearson's correlation
coefficient of r =0.617, N = 8, (p=.103), p > 0.05 indicates a low association
see (table 4-11).
Accuracy in the control group related to Dutifulness has a Pearson's
correlation coefficient of r = -0.288 N = 15, (p=.298), p >0.05 indicates a very
low association. Accuracy related to Achievement Striving, a Pearson's
correlation coefficient of r = -0.357 N = 15, (p=.192), p > 0.05 also indicates a
very low association, and Accuracy related to Self Discipline, a Pearson's
correlation coefficient of r = - 0.164, N = 15, (p=. 559), p > 0.05, indicates a
very low association, see (table 4-12).
Consistency in the control group related to Dutifulness has a Pearson's
correlation coefficient of r = - 0.168 N = 15, (p=.549), p > 0.05 indicates a very
low association. Consistency related to Achievement Striving, a Pearson's
correlation coefficient of r = -0.238 N = 15, (p=.393), p > 0.05 indicates a very
low association, and Consistency related to Self Discipline, a Pearson's
correlation coefficient of r = -0.073, N = 15, (p=.795), p > 0.05 indicates a very
low association, see (table 4-12).
Completeness in the control group related to Dutifulness has a Pearson's
correlation coefficient of r = -0.120 N = 15, (p=.669), p > 0.05 indicates a very
low association. Completeness related to Achievement Striving, a Pearson's
correlation coefficient of r = -0.189 N = 15, (p=.499), p > 0. 05 also indicates a
very low association, and Completeness related to Self Discipline, a
Pearson's correlation coefficient of r = 0.043, N = 15, (p=.880), p > 0.05,
indicates a very low association, see (table 4-12).

109
Table 4-10 Independent Samples Test Perception Grade and Actual Grade Obtained
Levene's Test for
Equality of variances
t-test for Equality of Means
F Sig. t df Sig. (2-tailed) Mean
Difference
Std. Error
Difference
95% C I of the
Difference
Lower Upper Lower Upper Lower Upper Lower Upper Lower
Perception Grade Equal variances
assumed
1.815 .192 .712 21 .484 .22667 .31843 -.43554 .88887
Equal variances
Not assumed
.976 14.750 .345 .22667 .23227 -.26914 .72247
Actual IQ Equal variances
Assumed
.571 .458 -2.507 21 .020 -.10298 .04107 -.18839 -.01757
Equal variances
Not assumed
-2.288 11.269 .042 -.10298 .04501 -.20176 -.00419

110
Table 4-11 Correlations for Experimental Group
Experiment
Accuracy
Experiment
Consistency
Experiment
Completeness
Dutifulness Achievement
Straining
Self Discipline
Experimental Accuracy Pearson Correlation 1 .365 .973(**) .624 .128 .700
Sig. (2-tailed) .374 .000 .098 .762 0.053
N 8 8 8 8 8 8
Experimental Consistency Pearson Correlation .365 1 .247 .304 -.210 .282
Sig. (2-tailed) .374 .556 .463 .618 .499
N 8 8 8 8 8 8
Experimental Completeness Pearson Correlation .973(**) .247 1 .576 .288 .617
Sig. (2-tailed) .000 .556 .135 .488 .103
N 8 8 8 8 8 8
Dutifulness Pearson Correlation .624 .304 .576 1 .068 -.021
Sig. (2-tailed) .098 .463 .135 .759 .923
N 8 8 8 23 23 23
Achievement Striving Pearson Correlation .128 -.210 .288 .068 1 .327
Sig. (2-tailed) .762 .618 .488 .759 .127
N 8 8 8 23 23 23
Self- Discipline Pearson Correlation .700 .282 .617 -.021 .327 1
Sig. (2-tailed) 0.053 .499 .103 .923 .127
N 8 8 8 23 23 23
** Correlation is significant at the 0. 01 level (2-tailed).

111
Table 4-12 Correlations for Control Group
Control
Accuracy
Control
Consistency
Control
Completeness
Dutifulness Achievement
Straining
Self-
Discipline
Control Accuracy Pearson Correlation 1 .346 .868(**) -.288 -.357 -.164
Sig. (2-tailed) .206 .000 .298 .192 .559
N 15 15 15 15 15 15
Control Consistency Pearson Correlation .346 1 .153 .168 -.238 -.073
Sig. (2-tailed) .206 .587 .549 .393 .795
N 15 15 15 15 15 15
Control Completeness Pearson Correlation .868(**) .153 1 -.120 -.189 .043
Sig. (2-tailed) .000 .587 .669 .499 .880
N 15 15 15 15 15 15
Dutifulness Pearson Correlation -.288 .168 -.120 1 .068 -.021
Sig. (2-tailed) .298 .549 .669 .759 .923
N 15 15 15 23 23 23
Achievement Straining Pearson Correlation -.357 -.238 -.189 .068 1 .327
Sig. (2-tailed) .192 .393 .499 .759 .127
N 15 15 15 23 23 23
Self- Discipline Pearson Correlation -.164 -.073 .043 -.021 .327 1
Sig. (2-tailed) .559 .795 .880 .923 .127
N 15 15 15 23 23 23

112
4.4. Interviews with Patients
Cunningham (1993) argues that interviews are an important part of any
research project. They provide the opportunity for the researcher to gather
data, which could not have been obtained in other ways, and help further
investigate and solve problems. Interviews are particularly useful for getting
the story behind a participant's experiences (McNamara 1999). Interviews
were used as a follow-up to experiment to investigate the patient participant’s
experience of the patient care received. Therefore, immediately following the
experiment, a face-to-face, group interview with three subjects, (who had
previously role played as patients), was conducted. The venue selected for the
group patient interviews was the virtual hospital environment where the
experiment had just taken place.
The purpose of the interviews was fully explained to the interviewees and
confidentiality was guaranteed. A standardized open-ended interview was
employed with open-ended questions where respondents were free to answer
as desired. This approach facilitated faster interviews which could be more
easily analyzed and compared. The total time required for the group discussion
was 30 minutes. Two major themes emerged from the analysis: 1) patient
interaction and 2) time spend recording patient data. During the interviews all
subjects described how they became increasingly aware of the lack of patient
interaction from the experimental group who showed more interest in checking
data in comparison to the control group who were more interested in patient
interaction. They indicated that they felt that the time spent recording patient
details was significantly longer with the experimental group. A limitation of the
interview include the small sample size participants (N = 3).
113
4.4.1. Group Discussions
Group discussions are useful in exploring perceived ideas of the predictors of
IQ; however, our purpose in using group discussions was two-fold: 1) to
ascertain which IQ predictors should be investigated and measured by the
survey, in order to provide a useful and usable training plan model and training
guideline: 2) to identify the nurses’ attitudes and their perceptions of IQ
importance and training in general. The group discussion was also useful in
exploring barriers to the effectiveness of training. A group discussion provided
information to help develop and further investigate the problem using an online
survey instrument distributed to the real world hospital target population as
opposed to trainee nurses within a virtual hospital environment. The discussion
took place at the workplace of the subjects from the experiment sample.
The group discussion was a qualitative data gathering technique, essential in
the evaluation process, after completion of the experiment. The discussion
technique was used to determine participants’ opinions about their experience,
and the practicality and usefulness of the experiment and training. Twelve
experimental volunteers participated and questions were unstructured so as to
allow the respondents to contribute from a variety of dimensions. Topics were
carefully selected and phrased to elicit a maximum response from them. The
open-ended questions asked were:
� ‘What do you think was the biggest barrier to IQ recording in the
experiment?’
� ‘Do you think it is important to record information in a serious quality
manner?’
� ‘How did you feel about the training?’
� ‘How important do you think documentation recording is?’
� ‘Do you agree that the dimensions selected for training were justified?'

114
The group discussion lasted one hour. Participants were assured that the
proceedings were confidential and that their names would not be used in the
report. It was also established that there were no right or wrong answers and
that the objective of the exercise was to understand the opinions the group held
about IQ importance, the experiment in general, and training. The IQ
discussion on the experiment experience was to establish if they considered it
beneficial, with regard to their career. It was emphasised that a `no holds
barred’ discussion should be encouraged to establish how they felt about the
experiment and training, even if it might be negative.
When it came to the importance of IQ recording, participants continually
mentioned the shortage of time to check their input and several of them
suggested that it consisted of a lot of 'unnecessary work'. The general
consensus was that the time used to check data could be used more effectively
to attend the needs of patients.
Regarding training, one participant said, ‘I don't think consistency is all that
important’. Another summed it up: ‘‘Everyone knows the format it should be
recorded in and I can’t see the point in wasting time with format’.
A frequently mentioned reason for poor IQ recording of patient information was
highlighted: ‘It was just an experiment and not in real a hospital, and if it had
been a real hospital we would have recorded the information perfectly’. Another
response included ‘recording quality information in an experiment is of no
benefit to us for our degree’.
A major barrier to IQ recording in the experiment by all participants was time
commitments to academic assignments, which was an integral part of their
degree. ‘Investing time in IQ recording for the experiment, which does not
enhance the degree grade, is a hassle and a waste of time that could be

115
invested in assignments that go towards our overall degree,’ are the words of
one participant.
The next step was to analyse the content of the discussion and the aim of the
analysis was to look for trends and patterns. Three major trends appeared: 1)
assignment pressures, an intrinsic part of their degree; 2) the virtual
environment, which many disclosed was not a real life hospital, and 3) a ‘don’t
care’ or ‘could not be bothered’ attitude, where some viewed the experiment as
just an exercise, and so, therefore, did not take it seriously. The experiment
participants confirmed the words of authors such as Galliers (1991)
“a key weakness of the experiment is the ‘limited extent to which identified relationships exist in the real world because of over simplification of the experimental situation and isolating such situations from most of the variables that are found in the real world.”
Therefore, further investigation was attempted with a web based survey to
mitigate some of these issues (see Chapter 5). This feedback helped in
stimulating new ideas and it created concepts for further investigation, through
the survey approach described in Chapter 5.
4.4.2. Observation from Experiment
Direct observation was selected where participants were aware that they were
being observed and the danger was that they could be reacting to it. In order to
obtain reliability, behaviour should be observed several times. However, as
time went on, the presence of the observers did not seem to pose any
problems. The subjects appeared to grow accustomed to the observer’s
presence and appeared to act in a very relaxed manner. The mood of the
experimental participants was somewhat pleasant and they showed signs of
anticipation and good documentation recording behavioural signals to the task

116
in hand. Observations were interpreted using inferential observational variables
that required making inferences about what was observed. Direct observation
of the groups’ activities during the experiment suggested that 1) although it is
not possible to see attitudes, behavioural observation was possible and
therefore inferences about attitudes could be made, that may be attributed to
the participants’ personality. This was further emphasised by the findings of
the group discussions. Further findings demonstrated that 2) conflict with
integrating new information into practice in a short period of time after training,
and 3) student perceptions and attitude to the experiment in the virtual
environment. These observations provided constructs for consideration when
investigating the IQ training problem in the real world setting and suggested
possible avenues for future research.
A limitation of the observational research is that the findings only reflect a
unique population of trainee student nurses and may not be representative of
the population; also, the behaviour patterns observed are not representative of
the individual. Therefore it cannot be generalized to others.
4.5. Key Findings
This section gives a brief summary of the key findings from the experiment and
discussion groups, which helped form the basic constructs for the survey
instrument discussed in Chapter 5. The experimental group had higher mean,
median and mode for accuracy, consistency and completeness, which would
indicate that training had some impact on these dimensions even though the
impact was not statistically significant across all dimensions. There was no
statistically significant difference in completeness and consistency between
experimental and control groups. However, there was a statistically significant
difference in accuracy between the groups p= .02; p<.05 level of significance.
This result suggested that the subjects who were trained in IQ dimensions did

117
statistically significantly better in accuracy recording than those who were not.
The IQ perception grade was not significantly different between groups,
p=.484 ; p> 05. Non EU student nurses were more accurate and had more
completeness levels whereas; EU student nurses had higher levels of
consistency. Irish student nurses did not perform as well, in all three
dimensions of IQ documentation recording.
There was a high positive correlation between Accuracy and Self Discipline in
the experimental group, and a low negative correlation between Accuracy and
Self Discipline in the control group. There was a high positive correlation
between Accuracy and Dutifulness in the experimental group, and a low
negative correlation between Accuracy and Dutifulness in the control group.
There was a low positive correlation between Accuracy and Achievement
Striving in the experimental group, and a low negative correlation between
Accuracy and Achievement Striving in the control group.
There was a low positive correlation between Consistency and Self Discipline
in the experimental group, and a low negative correlation between Consistency
and Self Discipline in the control group. There was a low positive correlation
between Consistency and Dutifulness in the experimental group, and a low
positive correlation between Consistency and Dutifulness in the control group.
There was a low negative correlation between Consistency and Achievement
Striving in both the control and experimental group.
There was a high positive correlation between Completeness and Self
Discipline in the experimental group, and a low positive correlation between
Completeness and Self Discipline in the control group. There was a high
positive correlation between Completeness and Dutifulness in the experimental
group, and a low negative correlation between Completeness and Dutifulness
in the control group. There was a low positive correlation between
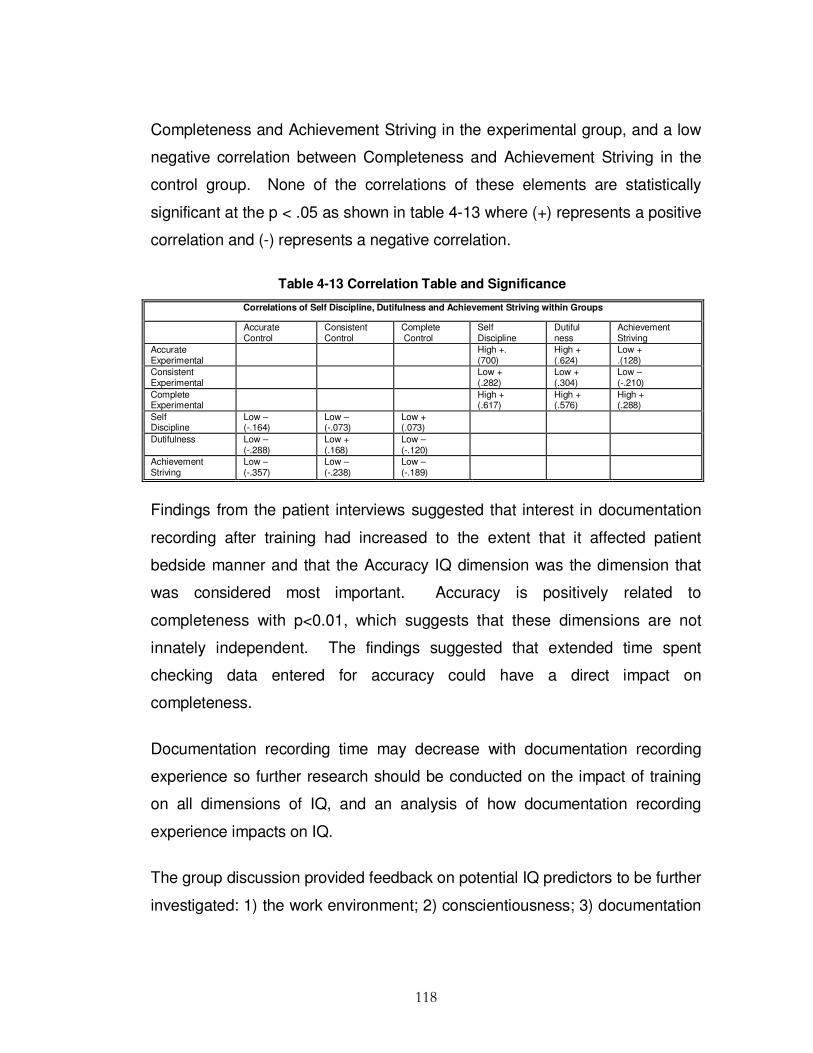
118
Completeness and Achievement Striving in the experimental group, and a low
negative correlation between Completeness and Achievement Striving in the
control group. None of the correlations of these elements are statistically
significant at the p < .05 as shown in table 4-13 where (+) represents a positive
correlation and (-) represents a negative correlation.
Table 4-13 Correlation Table and Significance
Correlations of Self Discipline, Dutifulness and Achievement Striving within Groups
Accurate Control
Consistent Control
Complete Control
Self Discipline
Dutiful ness
Achievement Striving
Accurate Experimental
High +. (700)
High + (.624)
Low + .(128)
Consistent Experimental
Low + (.282)
Low + (.304)
Low – (-.210)
Complete Experimental
High + (.617)
High + (.576)
High + (.288)
Self Discipline
Low – (-.164)
Low – (-.073)
Low + (.073)
Dutifulness Low – (-.288)
Low + (.168)
Low – (-.120)
Achievement Striving
Low – (-.357)
Low – (-.238)
Low – (-.189)
Findings from the patient interviews suggested that interest in documentation
recording after training had increased to the extent that it affected patient
bedside manner and that the Accuracy IQ dimension was the dimension that
was considered most important. Accuracy is positively related to
completeness with p<0.01, which suggests that these dimensions are not
innately independent. The findings suggested that extended time spent
checking data entered for accuracy could have a direct impact on
completeness.
Documentation recording time may decrease with documentation recording
experience so further research should be conducted on the impact of training
on all dimensions of IQ, and an analysis of how documentation recording
experience impacts on IQ.
The group discussion provided feedback on potential IQ predictors to be further
investigated: 1) the work environment; 2) conscientiousness; 3) documentation

119
recording experience; 4) training duration and training intervals, and 5)
perception of IQ importance.
4.6. Summary
This chapter outlined the main stages of the controlled experiment setup for
data collection which included group discussions with participants, interviews
with patients and observations from two experimenters. Simple random
sampling was conducted, whereby each member of a population had an equal
opportunity to become part of either the control or experimental group.
CHASEtown, virtual hospital environment in Dublin City University, School of
Nursing, Ireland, was utilised to simulate the activities of a typical hospital
environment. The goal based scenario was conducted, in which nurses
assume their main role - attending to routine nursing activities. Their mission
was to accomplish the task associated with the main role in the scenario, such
as admitting patients, taking and recording vital signs, giving medication and
discharging patients.
The experiment provided a framework for suggesting a relationship between
training and improved IQ. The chapter described how the data was analysed
and it presented the findings from phase one of the study. A range of data
analysis methods were employed on the data. The descriptive statistics used
were the mean, and variance, showing how data vary among the sample; and
standard deviation, showing how much the typical score deviates from the
mean. Correlation statistics were used to examine the relationships between
training and IQ. Pearson's r statistic, which shows the strength of the
relationship and the direction of a relationship, was used. The experimental
focus was aimed at examining the impact of training which IQ dimensions has
on IQ.
120
The main finding illustrates that the experimental group had higher mean,
median and mode for Accuracy, Consistency and Completeness, even though
the impact was not statistically significant across all dimensions. Accuracy was
shown to be positively related to Completeness, which suggests that these
two IQ dimensions may not be innately independent. Non EU student nurses
were more Accurate and had more Completeness levels than Irish and EU
student nurses, and EU student nurses had higher levels of Consistency than
both Irish and non EU student nurses.
There was a high positive correlation between Accuracy and Self Discipline,
and Accuracy and Dutifulness in the experimental group. There was a low
positive correlation between Consistency and Self Discipline and Consistency
and Dutifulness in the experimental group. There was a high positive
correlation between Completeness and Self Discipline and Completeness and
Dutifulness in the experimental group. In Chapter 5 the survey phase of the
study is described in detail and an analysis of the main findings is presented
which will provide a basis for the information quality training requirements
analysis guideline development in Chapter 6.

121
C h a p t e r 5
SURVEY INSTRUMENT
5.1. Introduction
Chapter 4 presented the findings from the experiment phase of the study,
described how the data was analysed and provided the constructs for the
survey which will be presented in detail in this chapter together with the findings
from the survey phase of the study. In preparation of the analysis, the data
was examined and coded into SPSS (Statistical Package for Social Sciences)
15.0 for Windows. The values were calculated as the statistical mean of the
items associated with each group. Data were subjectively measured on a 5-
point Likert scale.
To investigate the research proposition presented in hypothesis H1- H6, a web
based survey questionnaire (Appendix H) was designed and administered.
This explored the following:
1. If training can be associated with improved IQ (H1).
2. If conscientiousness can be associated with improved IQ (H2).
3. If training design can be associated with improved IQ (H3).
4. If the work environment can be associated with improved IQ (H4).
5. If experience can be associated with improved IQ (H5).
122
6. If perception of the importance of IQ can be associated with improved IQ
(H6).
The opinions and views of healthcare practitioners were obtained from the
answers provided by respondents.
The use of a questionnaire instead of more objective measures of IQ was
based on the respondents' capacity to truthfully and accurately answer the
questions. Nearly everyone has had some experience completing
questionnaires and they generally do not make people apprehensive. Unlike
other research methods, the respondent is not interrupted by the research
instrument, which is less intrusive than face-to-face surveys. Moreover
questionnaires reduce interviewer bias because there is uniform question
presentation (Jahoda et al.1962). Unlike in-person interviewing, there are no
verbal or visual clues to influence a respondent to answer in a particular way.
A questionnaire was selected because it was the most inexpensive and
feasible way to gather data from a large enough number of participants to allow
statistical analysis of the results to test the hypothesis (Kirakowski 1997;
Dillman 2000). This belief forms the basis of the use of questionnaires in
general and was further strengthened by the normal distribution of answers to
the questions.
5.2. Survey Research Design
This survey was a quantitative analysis exploring the predictability of IQ based
on training, work environment and trainee characteristics in order to provide
data to develop an Information Quality Training Analysis Guideline to aid
design of Information Quality Training Plans which will be detailed further in
Chapter 6. Performance indicators were evaluated from the different
perspectives of healthcare officials including nurses, physicians, administration

123
staff, clerks and laboratory technicians. This was then measured by evaluating
the perceived accuracy, consistency and completeness of patient admission
records.
Adaptations of Baldwin & Ford (1988) transfer of training model was deemed
suitable as a base for this study as it recognises the importance of trainee
characteristics, training design and the work environment on performance, and
therefore, was used for developing the IQ conceptual model (figure 1-1).
The primary goal of the survey was to identify if work environmental factors;
trainee characteristic (conscientiousness); training design factors and
experience predict IQ and if so how best to incorporate this information into the
development of an Information Quality Training Analysis Guideline IQTRAG
discussed in Chapter 6. Work environmental factors included IS, peer support
and form layout. Trainee characteristic (conscientiousness) included: self-
efficacy, self-discipline, achievement striving and dutifulness; training design
factors included: training frequency, and training duration.
5.2.1. Survey Methodology
In undertaking this study a specific procedure was followed. A literature review
from the disciplines of QM, TQM, IQM and training formed the basis for
developing the conceptual model. In an exploration of the literatures many
important predictors were identified but it must be stressed that these are in no
way exhaustive (table 5-1).

124
Table 5-1 Identification of Information Quality Predictors
Predictors Factors
Information System
Information Gathering Format
Work Environment
Peer Support
Dutifulness
Self-Efficacy
Achievement Striving
Trainee Characteristics
Self-Discipline
Training Duration Training
Training Sequencing
Documentation Experience Other Factors
Work Experience
A questionnaire was specifically designed to measure these IQ predictors and
then explored through a quantitative analysis to show that IQ outcomes could
be predicted by trainee characteristics (conscientiousness), training design,
sequencing, elements of the work environment, importance of IQ perception,
and documentation recording experience.
The questionnaire consisted of 65 items and was divided into sections. One
section contained demographic characteristics of the respondents such as age,
gender, profession as well as the number of years spent in the hospital.
Another explored employee’s perceptions of IQ, with particular emphasis on
accuracy, consistency and completeness of patient admission data. A training
section contained questions that identify the adequacy of the training programs,
training duration, and training intervals. The work environment section
contained questions that identify the IS mainly used in admitting patients, form
layout, and peer support. In addition to this, the trainee characteristics section
contained questions that identify the level of conscientiousness of participants

125
under the constructs of self-discipline, self-efficacy, dutifulness, and
achievement striving, using the Goldberg NEO_PI personality test.
A questionnaire was initially drafted and pre-tested with academics and IQ
experts to check its content validity and terminology, and was adjusted
accordingly to ensure unambiguous terminology. The adjusted questionnaire
was then tested to check its aptness and appropriateness for the target
population, before distribution.
Some of the survey items were based on existing items from validated
instruments found in the research literature (Goldberg 1990; Wang & Strong
1996). Many of the survey items (Personality traits) had been widely validated
in various settings (Goldberg 1990), while others (IQ elements) had been
validated in more limited contexts (Wang & Strong 1996). However, these
survey items had not previously been used together within a single instrument
and for this reasons, statistical tests were conducted to support the instrument
in the context of this study’s population and to test the reliability and validity of
the combined instrument.
The design of the questionnaire was a multi-stage process beginning with an
understanding of the aspects to be explored and ending with interpretation of
the results. The following is a broad outline of the steps followed in designing
and administering the questionnaire:
1. Objectives of the survey defined.
2. Sampling group determined.
3. Questionnaire appropriately designed.
4. Questionnaire rigorously tested
5. Questionnaire administered to predetermined sampling group.
6. Results analysed and interpreted.
7. Conclusions drawn.

126
First, the objectives of the study were defined so a clear goal and purpose was
created in order not to overlook important issues or waste participants' time
answering useless questions. The following list questions were used to gather
data:
1. IQ in patient admission forms.
2. Work environment structure.
3. Trainee characteristics.
4. Training perception duration and intervals.
5. Demographics.
6. Documentation experience.
The dependent variables were those used to measure IQ. These variables
were operationalised at the dimension level and measured directly using 13
survey items from Wang & Strong (1996) instrument. Several items from that
instrument were discarded because they are used to measure dimensions not
included in this study. This instrument utilized a scale from 1 to 5, where 1
represents very low and 5 represents very high. One dependent variable per
outcome dimension was calculated as the mean value of the response items
measuring that particular dimension.
Conscientiousness was tested by NEO_PI based on the five factor model
(Costa & McCrae 1992) and measured on a 5 point scale that formed two
poles ranging from strongly disagree to strongly agree. The scores of each of
the 16 items, which measured the four constructs of conscientiousness, were
summarised and each respondent obtained a raw score for each of the four
constructs.

127
5.2.2. Survey Design
According to Kirakowski (1997), closed-ended questionnaires are good when
processing massive quantities of data, or the questionnaire can be
appropriately scaled to yield meaningful numeric data. Therefore, closed
format questions that took the form of multiple-choice answers were employed.
Likert scales are concerned with developing a batch of items which have
approximately the same level of importance to the respondent, and are all more
or less talking about the same concept, which is the concept the scale is trying
to measure (Kirakowski 1997). Therefore, these questions in this questionnaire
were structured using the Likert scale wherein respondents had been given a
select number of response choices which were pre-coded, but gave enough
choices to fully cover a range of answers and not so many choices that the
distinction between them became blurred. Likert scaling provides the ability to
sum up the scores on the individual items, to yield a questionnaire score that
can be interpreted as differentiating between shades of opinion, from
'completely against' to 'completely for' the measured construct (Kirakowski
1997).
This rating scale requires the subject to indicate his or her choice which best
represents the degree of agreement/disagreement on the given
question/statement. In this survey five choices were provided for every
question. For example, questions that measured a single opinion, such as:
‘I feel that the duration between documentation training programmes
attended, were usually of adequate length. ’
Five options from a range of strongly disagree to strongly agree was provided.
Questions were posed as clearly and unambiguously as possible to eliminate

128
the possibility that the question could mean different things to different people.
For example, when asking a question such as:
‘The time I spend recording patient information relative to other duties
is?’
Precise choices to quantify the answers were provided and the following scale
was used to interpret the responses of all respondents for the question, by
computing the weighted mean.
Score Interpretation
0 % 1
1-25% 2
26- 50% 3
51-75% 4
75- 100%, 5
Leading questions that force or imply a certain type of answer were also
included and the following choices of answers were supplied that not only
covered a whole range of responses but were equally distributed throughout a
range of answers: for example
'I have received specific documentation training to maintain/improve
my skills and competency levels for the job I am charged with
doing’.
The following answer choices were provided and interpreted as follows:
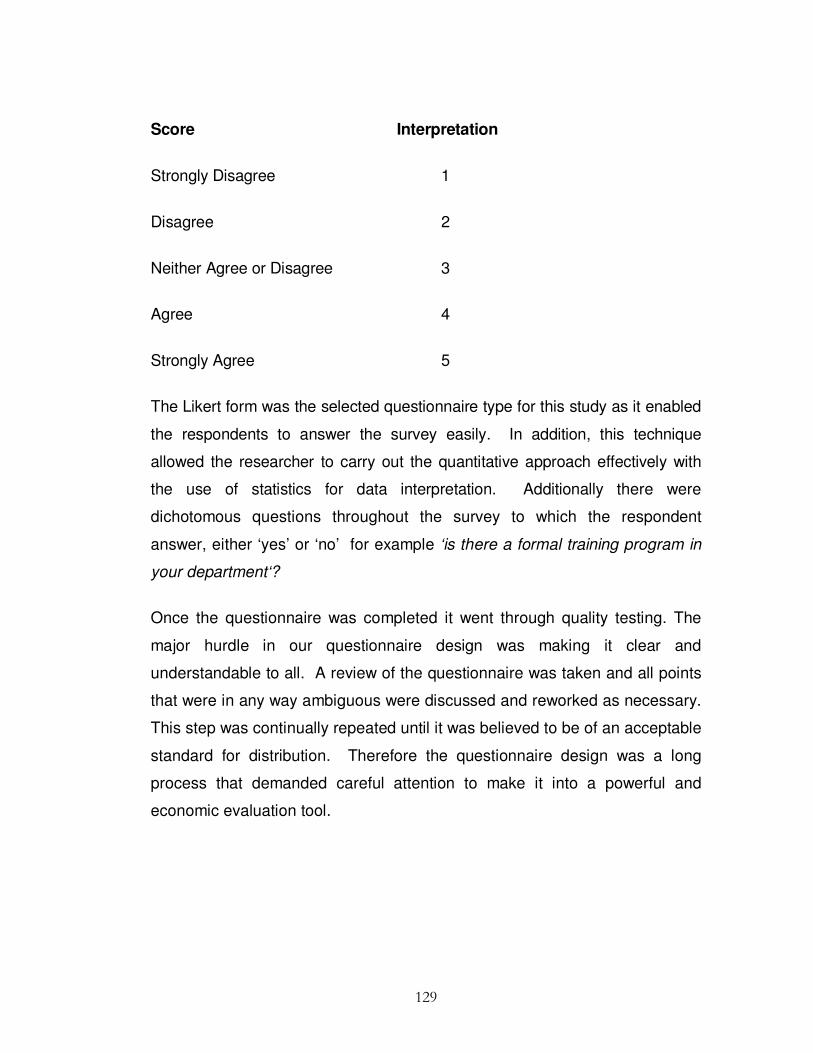
129
Score Interpretation
Strongly Disagree 1
Disagree 2
Neither Agree or Disagree 3
Agree 4
Strongly Agree 5
The Likert form was the selected questionnaire type for this study as it enabled
the respondents to answer the survey easily. In addition, this technique
allowed the researcher to carry out the quantitative approach effectively with
the use of statistics for data interpretation. Additionally there were
dichotomous questions throughout the survey to which the respondent
answer, either ‘yes’ or ‘no’ for example ‘is there a formal training program in
your department‘?
Once the questionnaire was completed it went through quality testing. The
major hurdle in our questionnaire design was making it clear and
understandable to all. A review of the questionnaire was taken and all points
that were in any way ambiguous were discussed and reworked as necessary.
This step was continually repeated until it was believed to be of an acceptable
standard for distribution. Therefore the questionnaire design was a long
process that demanded careful attention to make it into a powerful and
economic evaluation tool.

130
5.2.3. Validity of the Survey Instrument
The validity of a questionnaire is the degree to which it is actually measuring or
collecting data about what you think it should be measuring or collecting data
about (Kirakowski 1997). Thus, to test the validity of the survey the researcher
tested the questionnaire on twenty respondents from the academic, IQ and
medical professions. These respondents, as well as their answers, were only
used for testing purposes. After the questions had been answered, the
researcher asked the respondents for suggestions, or necessary corrections, to
ensure further improvement and validity of the instrument. The researcher then
excluded irrelevant questions and changed vague or difficult terminologies to
ensure understanding. Most items in the survey instrument were drawn directly
from prior studies for which construct validity had already been determined to
some degree, such as Goldberg’s NEP_PI (Goldberg 1990).
5.2.4. Reliability of the Survey Instrument
The reliability of a measurement instrument determines its ability to yield
consistent measures when filled out by like-minded people in similar
circumstances (Kirakowski 1997). It is usually expressed on a numerical scale
from zero (very unreliable) to one (extremely reliable):
If the reliability coefficient is low (near to zero) this means that some of the items may be more important to the respondents than others. If the reliability coefficient is high (near to one) then the items are most probably all of the same psychological size’ (Kirakowski 1997).
The reliability of this study was operationalized as consistency, completeness
and accuracy, which is the degree of inter-correlation among the items that
comprise a scale. Cronbach’s α was calculated for each scale. Items which
do not correlate well are clearly not part of the scale (going in a different
'direction') and should be thrown out or amended (Kirakowski 1997). According
131
to Kirakowski (1997) long questionnaires, as a rule of thumb, should yield
reliability values of 0.70 or more, therefore, the scale was accepted if it had a
strong α value of at least 0.70. Scales with α values less than 0. 70 were
further analysed to determine whether α could be improved by the removal of
some items (Kirakowski 1997).
5.2.5. Survey Sampling Frame
Specifically, 1200 respondents were randomly selected for the sample. The
target population for this study included doctors, nurses, laboratory workers,
clerks and administration staff from hospitals in Ireland. All subjects were
volunteers and received no pay or credit for this activity. To establish the size of
the survey population a sampling frame was taken from a contact database
from Dublin City University, Ireland, of past nursing students and from major
hospital boards. This produced an initial sample listing of 1,200. Telephone
contact was established with hospitals, and a key contact was identified to
select which individuals were responsible and capable of responding to
questions on training, quality, and work environment, which included doctors,
nurses, administration staff, clerks and laboratory technicians who had reason
to record or use information on admission data on a day-to-day basis. This
step was taken to improve the quality and quantity of responses.
5.2.6. Procedure
The study used an electronically administered web based survey hosted on a
server operated by Survey Monkey. Participants were invited to respond
electronically and were provided with the web address of the survey. After
accessing the on-line survey through the address provided, participants
marked their responses by making selections on a series of screens. On
132
completion of the survey, participants submitted their responses to the server,
where they were stored until retrieved for analysis.
Demographics were collected to analyse gender, experience, nationality,
occupation, and IQ view in general. Dewey (1938) suggested that it is
experience and context that serve as a foundation for education and
knowledge. Therefore a section of the questionnaire was given to discover the
level of experience individuals had at documentation recording. Taken that
experience is an important predictor of IQ it must be acknowledged that there
may be other influences (Peter & Jarvis 1991), such as how the person
interprets IQ importance. Therefore, the questionnaire also collected
information related to the subjects’ perception of errors, inconsistencies and
incompleteness in documentation of patient admissions in their hospital. This
gave subjective measurements of IQ.
Data on opinion of training offered and duration and intervals between them
was also gathered. The quality of the documentation training received, if any,
and their perception of the impact of trainee characteristics in documentation
quality was accessed.
Response data collected from the web server was downloaded as an excel
spreadsheet. Most items used a 5 point Likert scales with values from 1
through 5. Questions used binary numbers with values from 0 through 1 and
were coded automatically using this scale. Categorical data was also
collected for grouping purposes and were assigned an integer code
associated with a fitting text label in SPSS. All variables used in hypothesis
testing were associated with a set of survey items. The values for these
group item variables were calculated as the statistical mean of the items
associated with each variable. The hypotheses were tested using multiple

133
regression analysis. A summary of findings from the study was prepared and
factors that predict IQ identified in section 5-3-7.
5.2.7. Survey Data Measurements
The traditional way of measuring IQ relies on quantifying how data relate to the
dimensions of IQ. After a review of the literature on IQ metrics, the
measurement criteria for this study were chosen, and grouped into three
categories: accuracy, consistency and completeness. In the survey as in the
experiment phase detailed in Chapter 4, two types of variables were identified:
dependent variables that measure various dimensions of IQ, and independent
variables that measure perceptions of IQ, trainee characteristics, work
environment, experience and training. A set of demographic variables was also
identified for grouping purposes. The IQ dimensions were identified using
Wang’s framework and the IQA developed by Lee et al. (2002), and measured
using Redman (1995) metric section 2-2-3. Survey questions that measured
the dimensions of accuracy, completeness and consistency are listed in table
5-2.
The survey instrument used a Likert scale from 1-5, where 1 represents always
and 5 represents never. The dimension was calculated as the mean score of
the survey item responses that measured that dimension. Each of the
hypotheses was tested using multiple regressions. Multiple regression analysis
is a methodology for empirically examining sets of relationships represented in
the form of linear models. The output of the regression analysis had two parts
which are of interest to this study: the model summary and the ANOVA table.
The model summary R2 tells how much of an impact the independent variable
predicts the dependent variable, and the ANOVA table shows the degree to
which the relationship was linear. The F-test is the level of significance (Mertler
& Vannatta 2005).
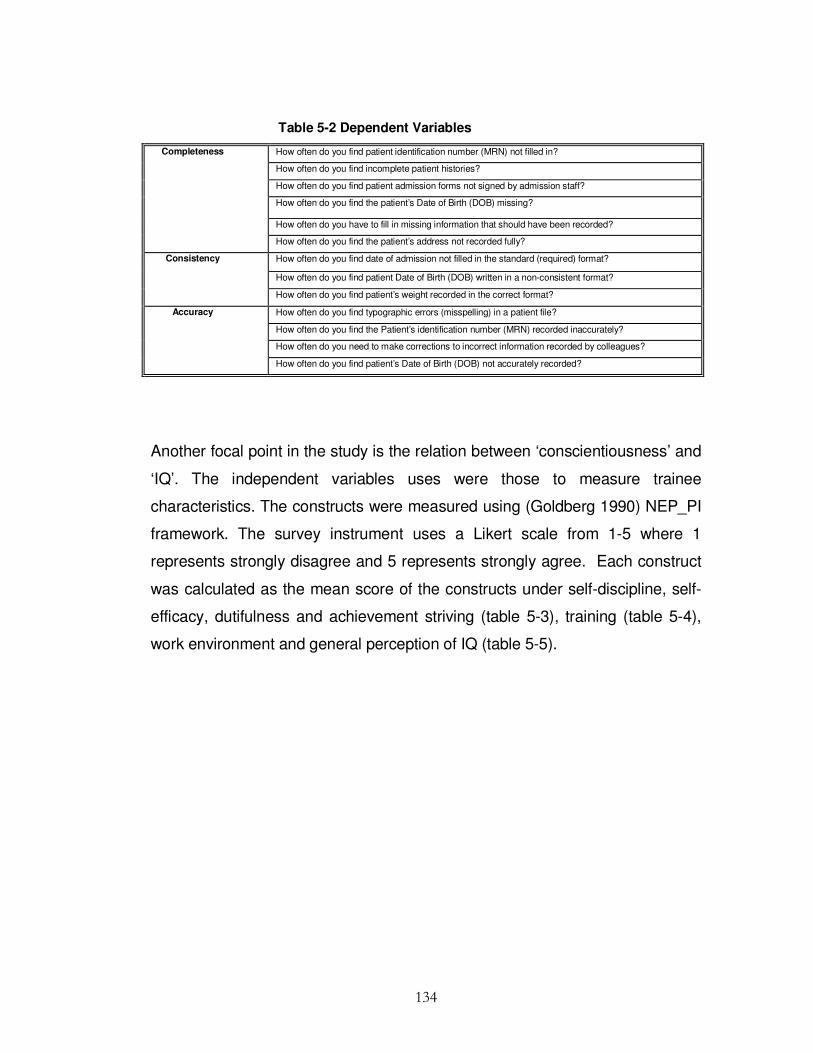
134
Table 5-2 Dependent Variables
How often do you find patient identification number (MRN) not filled in?
How often do you find incomplete patient histories?
How often do you find patient admission forms not signed by admission staff?
How often do you find the patient’s Date of Birth (DOB) missing?
How often do you have to fill in missing information that should have been recorded?
Completeness
How often do you find the patient’s address not recorded fully?
How often do you find date of admission not filled in the standard (required) format?
How often do you find patient Date of Birth (DOB) written in a non-consistent format?
Consistency
How often do you find patient’s weight recorded in the correct format?
How often do you find typographic errors (misspelling) in a patient file?
How often do you find the Patient’s identification number (MRN) recorded inaccurately?
How often do you need to make corrections to incorrect information recorded by colleagues?
Accuracy
How often do you find patient’s Date of Birth (DOB) not accurately recorded?
Another focal point in the study is the relation between ‘conscientiousness’ and
‘IQ’. The independent variables uses were those to measure trainee
characteristics. The constructs were measured using (Goldberg 1990) NEP_PI
framework. The survey instrument uses a Likert scale from 1-5 where 1
represents strongly disagree and 5 represents strongly agree. Each construct
was calculated as the mean score of the constructs under self-discipline, self-
efficacy, dutifulness and achievement striving (table 5-3), training (table 5-4),
work environment and general perception of IQ (table 5-5).

135
Table 5-3 Independent Variables
I usually get chores done right away
I am always prepared for every event
I always carry out my plans
I usually postpone making decisions for as long as possible
I usually go straight for the goal
I usually turn plans into actions
I tend to set high standards for myself and others
I am not really highly motivated to succeed
I try to follow the rules and seldom break them
I usually listen to my conscience
I sometimes break my promises
I sometimes misrepresent the facts
I usually complete tasks successfully
I usually excel in everything I do
I usually come up with good solutions to problems
Sometimes I may misjudge situations
Table 5-4 Training Questionnaire
There is a formal documentation recording training program in my department
I have received specific documentation training to maintain/improve my skills and competency
levels for the job I am charged with doing
I feel that time intervals between documentation training programs attended were appropriate
I feel the duration of documentation training program(s) attended were usually of adequate
length
The duration of documentation training program(s) I attended were usually
The effectiveness of the training received was usually
My experience of documentation recording is
My colleagues’ documentation recording quality is
Training
Of the training day(s) you attended in the past calendar year, what percentage was dedicated
specifically to documentation training
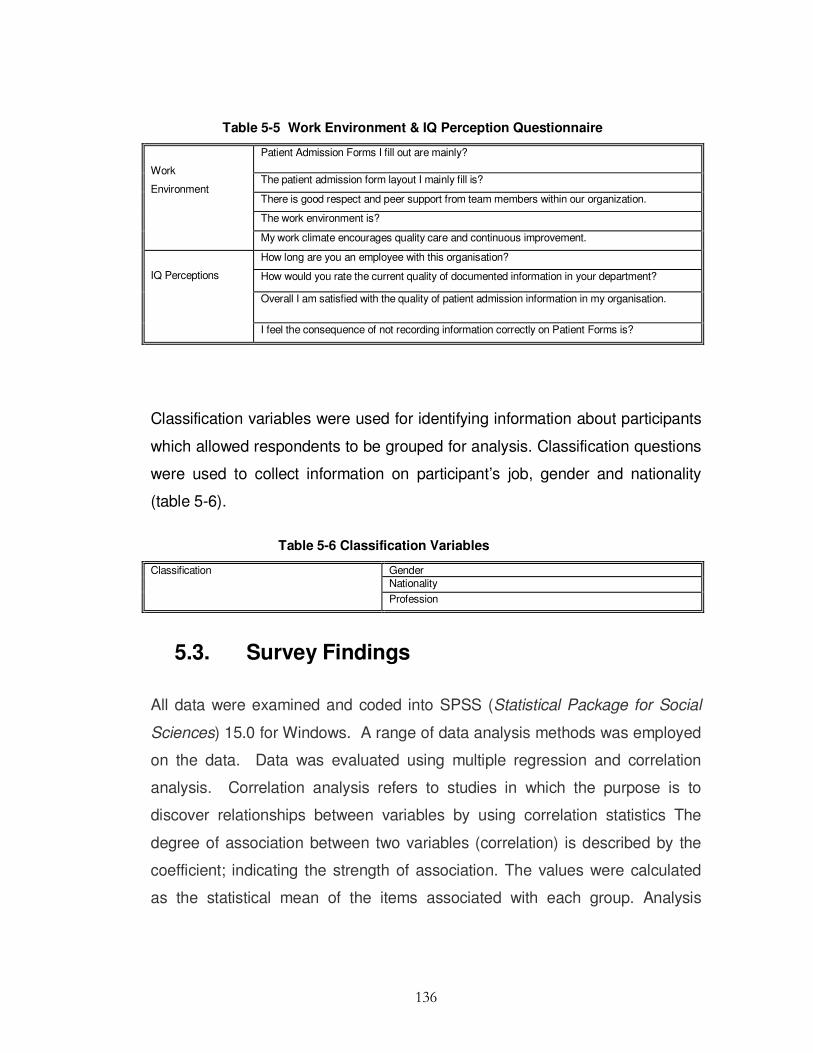
136
Table 5-5 Work Environment & IQ Perception Questionnaire
Patient Admission Forms I fill out are mainly?
The patient admission form layout I mainly fill is?
There is good respect and peer support from team members within our organization.
The work environment is?
Work
Environment
My work climate encourages quality care and continuous improvement.
How long are you an employee with this organisation?
How would you rate the current quality of documented information in your department?
Overall I am satisfied with the quality of patient admission information in my organisation.
IQ Perceptions
I feel the consequence of not recording information correctly on Patient Forms is?
Classification variables were used for identifying information about participants
which allowed respondents to be grouped for analysis. Classification questions
were used to collect information on participant’s job, gender and nationality
(table 5-6).
Table 5-6 Classification Variables
Gender Nationality
Classification
Profession
5.3. Survey Findings
All data were examined and coded into SPSS (Statistical Package for Social
Sciences) 15.0 for Windows. A range of data analysis methods was employed
on the data. Data was evaluated using multiple regression and correlation
analysis. Correlation analysis refers to studies in which the purpose is to
discover relationships between variables by using correlation statistics The
degree of association between two variables (correlation) is described by the
coefficient; indicating the strength of association. The values were calculated
as the statistical mean of the items associated with each group. Analysis
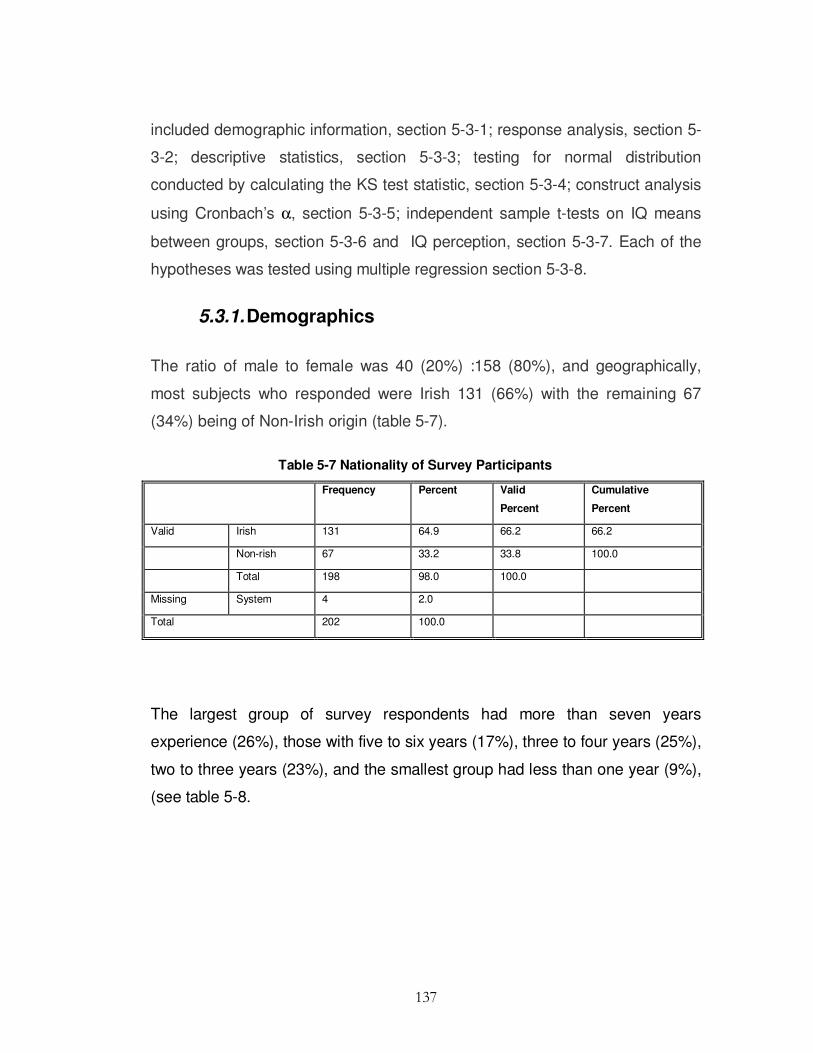
137
included demographic information, section 5-3-1; response analysis, section 5-
3-2; descriptive statistics, section 5-3-3; testing for normal distribution
conducted by calculating the KS test statistic, section 5-3-4; construct analysis
using Cronbach’s α, section 5-3-5; independent sample t-tests on IQ means
between groups, section 5-3-6 and IQ perception, section 5-3-7. Each of the
hypotheses was tested using multiple regression section 5-3-8.
5.3.1. Demographics
The ratio of male to female was 40 (20%) :158 (80%), and geographically,
most subjects who responded were Irish 131 (66%) with the remaining 67
(34%) being of Non-Irish origin (table 5-7).
Table 5-7 Nationality of Survey Participants
Frequency Percent Valid
Percent
Cumulative
Percent
Valid Irish 131 64.9 66.2 66.2
Non-rish 67 33.2 33.8 100.0
Total 198 98.0 100.0
Missing System 4 2.0
Total 202 100.0
The largest group of survey respondents had more than seven years
experience (26%), those with five to six years (17%), three to four years (25%),
two to three years (23%), and the smallest group had less than one year (9%),
(see table 5-8.
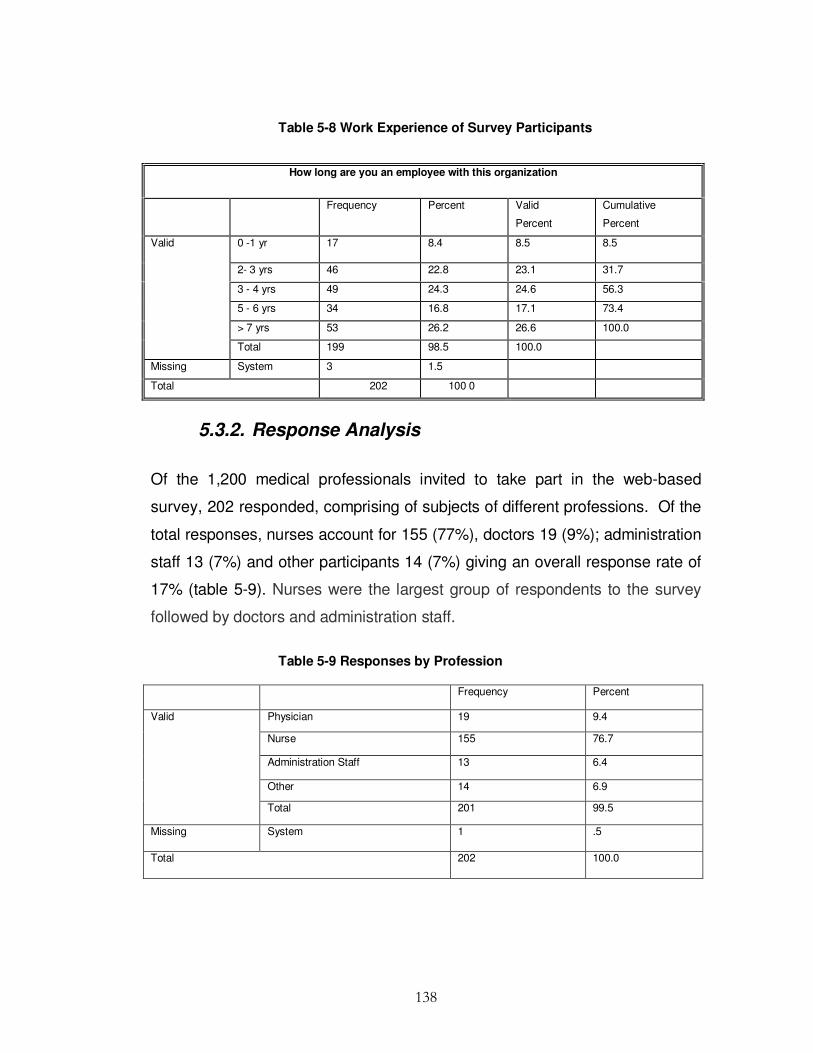
138
Table 5-8 Work Experience of Survey Participants
5.3.2. Response Analysis
Of the 1,200 medical professionals invited to take part in the web-based
survey, 202 responded, comprising of subjects of different professions. Of the
total responses, nurses account for 155 (77%), doctors 19 (9%); administration
staff 13 (7%) and other participants 14 (7%) giving an overall response rate of
17% (table 5-9). Nurses were the largest group of respondents to the survey
followed by doctors and administration staff.
Table 5-9 Responses by Profession
Frequency Percent
Physician 19 9.4
Nurse 155 76.7
Administration Staff 13 6.4
Other 14 6.9
Valid
Total 201 99.5
Missing System 1 .5
Total 202 100.0
How long are you an employee with this organization
Frequency
Percent Valid
Percent
Cumulative
Percent
0 -1 yr 17 8.4 8.5 8.5
2- 3 yrs 46 22.8 23.1 31.7
3 - 4 yrs 49 24.3 24.6 56.3
5 - 6 yrs 34 16.8 17.1 73.4
> 7 yrs 53 26.2 26.6 100.0
Valid
Total 199 98.5 100.0
Missing System 3 1.5
Total 202 100 0
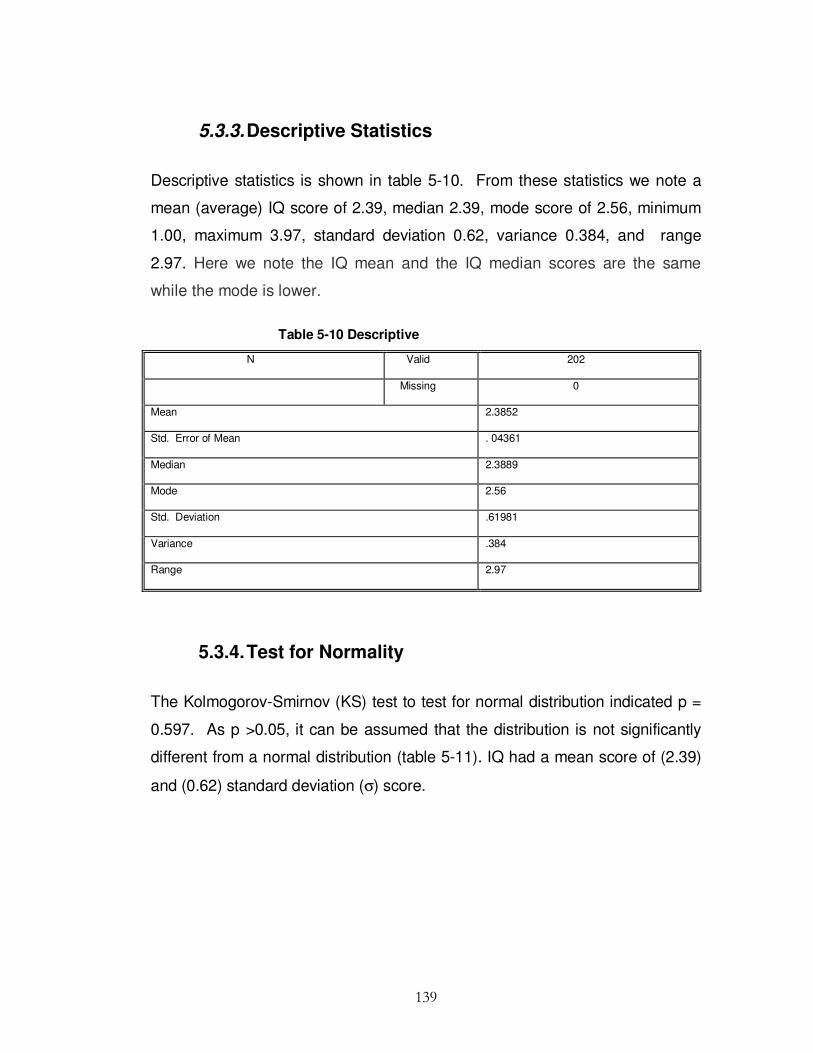
139
5.3.3. Descriptive Statistics
Descriptive statistics is shown in table 5-10. From these statistics we note a
mean (average) IQ score of 2.39, median 2.39, mode score of 2.56, minimum
1.00, maximum 3.97, standard deviation 0.62, variance 0.384, and range
2.97. Here we note the IQ mean and the IQ median scores are the same
while the mode is lower.
Table 5-10 Descriptive
N Valid 202
Missing 0
Mean 2.3852
Std. Error of Mean . 04361
Median 2.3889
Mode 2.56
Std. Deviation .61981
Variance .384
Range 2.97
5.3.4. Test for Normality
The Kolmogorov-Smirnov (KS) test to test for normal distribution indicated p =
0.597. As p >0.05, it can be assumed that the distribution is not significantly
different from a normal distribution (table 5-11). IQ had a mean score of (2.39)
and (0.62) standard deviation (σ) score.

140
Table 5-11 One-Sample Kolmogorov-Smirnov Test for Normality
Mean IQ
N 202
Normal Parameters(a,b) Mean 2.3852
Std. Deviation
.61981
Most Extreme Differences Absolute .054
Positive .054
Negative -.030
Kolmogorov-Smirnov Z .768
Asymp. Sig. (2-tailed) .597
a Test distribution is Normal.
b Calculated from data
5.3.5. Survey Instrument Construct Analysis
As this study uses multiple variables to measure constructs of IQ dimensions,
reliability tests were taken for each of the constructs. The set of target items
must be consistent in their measurement of each construct (Nunnally 1978).
The set of items must be reliable to the extent that they measure the construct
they are meant to represent and produce reliable and consistent scores.
Cronbach’s α, one of the recommended measures of reliability testing, was
used. The section of the survey that contained a set of target item questions to
measure and evaluates accuracy, consistency and completeness (three
dimensions of IQ) was evaluated separately with the following results. An α
value (above 0.70) signals the sample items correlate well with the domain of
items which it is intended to measure (Nunnally1978). Cronbach’s coefficient α
was calculated for accuracy, consistency and completeness constructs. It was
found the Cronbach’s α value for consistency construct fell well below 0.7.
According to Churchill (1979) adjustment can be made to improve the α by
removing some questions, therefore Q8 was removed, which increased the α

141
to 0.715. Cronbach’s coefficient α value for the accuracy construct had α
values of 0.714 and this suggested high reliability. Cronbach’s α value for the
completeness construct was 0.809, which showed very high reliability (table 5-
12).
Table 5-12 Cronbach Alpha Values Accuracy, Consistency & Completeness
5.3.6. Independent Sample t-tests on IQ
The t-test is the most commonly used method to evaluate the differences in
means between two groups. Therefore t-tests were carried out on Irish and
non-Irish respondents. Non-Irish respondents reported that documentation was
more accurate in their workplace with a mean of 2.57 against Irish respondents
with mean of 2.45. Irish respondents reported that documentation had
more completeness in their workplace with a mean of 2.42 and Non-Irish
respondents with a mean of 2.40. Once more Irish respondents reported that
documentation was more consistent in their workplace with a mean 2.28 as
opposed to Non-Irish respondents with a mean consistency of 2.2 (table 5-13).
Construct Reliability Statistics
N % Cronbach's α N of Items Valid 191 94.6
Excluded(a) 11 5.4
Accuracy
. 714 4
Cases
Total 202 100.0
N % Cronbach's α N of Items Valid 195 96.5
Excluded(a) 7 3.5
Consistency
. 715 2
Cases
Total 202 100.0
N % Cronbach's α N of Items Valid 189 93.6
Excluded(a) 13 6.4
Completeness
. 809 6
Cases
Total 202 100.0

142
Table 5-13 Descriptive statistics of Survey Participants Nationality
Nationality N Mean Std.
Deviation
Std.
Error
Mean
Mean Accuracy Irish 131 2.4599 .70221 .06135
Non-Irish 67 2.5672 .55887 .06828
Mean
Completeness
Irish 131 2.4168 .64712 .05654
Non-Irish 67 2.3905 .55559 .06788
Mean
Consistency
Irish 131 2.2824 .82065 .07170
Non-Irish 67 2.2015 .73371 .08964
The t-test assumes that the data is normally distributed and that the variances
are equal. The p-level reported with the t-test represented the probability of
error involved in difference. The difference between Irish and non Irish was not
found to be statistically significant (table 5-14) regarding accuracy, p = 0.279,
p >0.05, completeness, p = 0.778, p >0.05, and consistency p = 0.497 p
>0.05.
As seen in table 5-15 respondents with 5-6 years experience reported that
documentation was more accurate with a µ of 2.78, 3-4 years 2.36, 0-1 year
2.3, 2-3 years 2.26 and more than 7 years 2.7. Respondents with more than 7
years reported that documents were more complete with a µ of 2.65, 5-6 years
2.61, 2-3 years 2.27, 0-1 year 2.25, 3-4 years 2.17. Respondents with 5-6
years experience reported that documents were more consistent with a µ of
2.47, more than 7 years 2.43, 2-3 years 2.17, 3-4 years 2.05 and 0-1 year
reported that documents were least consistent with µ of 2.02. This shows that
respondents with 5-6 years experience said that documents were more
accurate and more consistent while respondents with more than 7 years said
documents were more complete.

143
Table 5-14 Independent Samples Test
Levene's Test for
Equality of
variances
t-test for Equality of Means
F Sig. t Df Sig. (2-
tailed)
Mean
Difference
Std. Error
Difference
95% CI of Difference
Lower Upper Lower Upper Lower Upper Lower Upper Lower
Mean
Accuracy
Equal variances
Assumed
5.790 .017 -1.086 196 .279 -.10724 . 09875 -.30198 .08750
Equal variances
not assumed
-1.168 161.992 .244 -.10724 . 09179 -.28850 .07402
Mean
Completeness
Equal variances
Assumed
1.122 .291 .283 196 .778 .02625 . 09279 -.15675 .20925
Equal variances
not assumed
.297 152.168 .767 .02625 . 08834 -.14828 .20078
Mean
Consistency
Equal variances
Assumed
1.292 .257 .680 196 .497 .08095 . 11902 -.15378 .31568
Equal variances
not assumed
.705 146.937 .482 .08095 . 11479 -.14589 .30779

Table 5-15 Group Statistics
How long are you an employee
with this organisation
N Mean Std. Deviation Std. Error
Mean
Mean
Accuracy
0 -1 yr 17 2.3088 .57642 .13980
2- 3 yrs 46 2.2591 .62884 .09272
3-4 yrs 49 2.3588 .62110 .08873
5-6 yrs 34 2.7843 .66354 .11380
>7 yrs 53 2.6903 .63473 .08719
Mean
Completeness
0-1 yr 17 2.2549 .69312 .16811
2-3 yrs 46 2.2667 .54952 .08102
3-4 yrs 49 2.1728 .53605 .07658
5-6 yrs 34 2.6059 .70694 .12124
>7 yrs 53 2.6465 .58017 .07969
Mean
Consistency
0-1 yr 17 2.0294 .79982 .19398
2-3 yrs 46 2.1739 .70881 .10451
3-4 yrs 49 2.0510 .67888 .09698
5-6 yrs 34 2.4706 .90404 .15504
> 7 yrs 53 2.4340 .85506 .11745
5.3.7. Respondents IQ Perception
Participants opinions on the quality of information on documentation and
participants’ overall perception of IQ within the organisation are given in table 5-
16.

145
Table 5-16 Participants Perception to IQ & Actual IQ
Mean IQ How would you rate the current
quality of documented information in
your department
Mean IQ Pearson Correlation 1 -.213(**)
Sig. (2-tailed) 003
N 202 198
How would you rate the
current quality of
documented information in
your department
Pearson Correlation -.213(**) 1
Sig. (2-tailed) .003
N 198 198
** Correlation is significant at the 0. 01 level (2-tailed).
As this data collected in the survey is calculated with rating scales the
correlations provided give general indications and not precise measurements.
The following difference in the linear relationships between IQ reported in
documentation and perception of the overall IQ within the organisation can be
seen. IQ is negatively related with perception of IQ with a Parsons correlation
coefficient of r = -0.213**, N = 198, p< 0.003. This means that as perception
of IQ increases, actual perception of documentation IQ within the organisation
decreases (significant at the .01 level (2-tailed)). The significance level shows
that the correlations reported due to chance in the form of random sampling
error is 0.003.
5.3.8. Hypothesis Testing
Six predictor variables underpinning this research were examined by a series
of multiple regression analyses: one of the most widely employed multivariate
techniques used in quantitative research to test the main-effect hypotheses.
Stepwise regression has been shown occasionally to omit predictors from the
model that would have produced statistically significant results with other
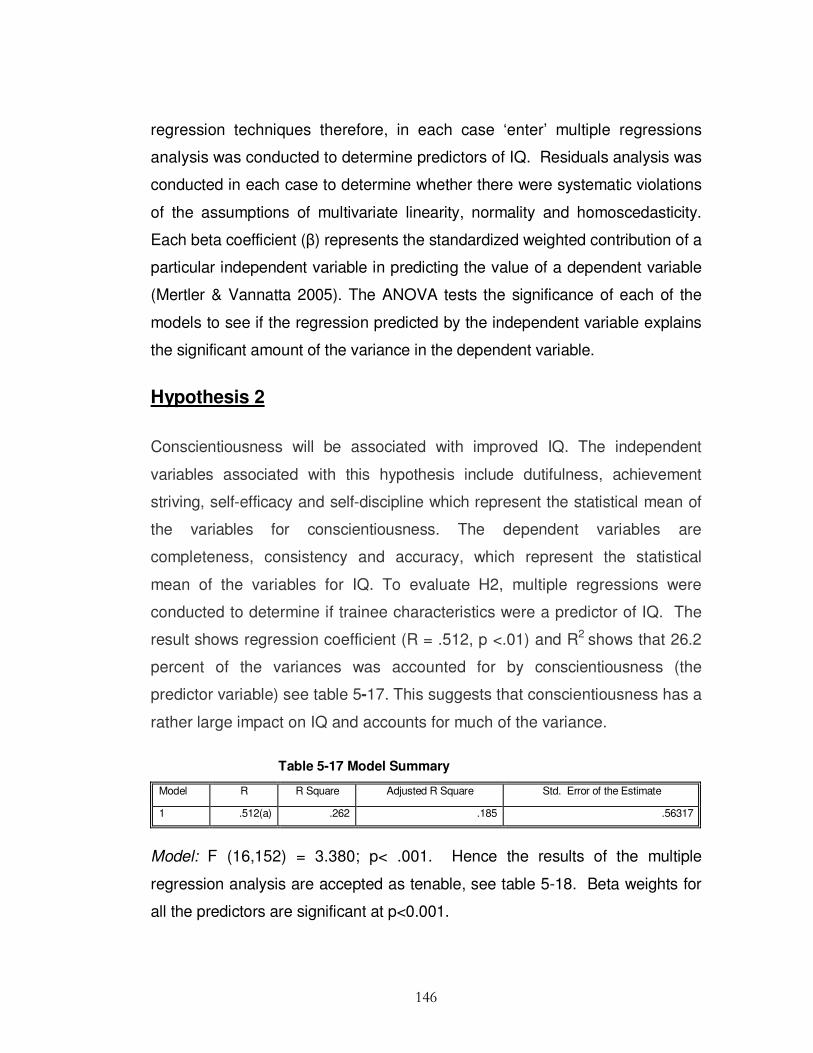
146
regression techniques therefore, in each case ‘enter’ multiple regressions
analysis was conducted to determine predictors of IQ. Residuals analysis was
conducted in each case to determine whether there were systematic violations
of the assumptions of multivariate linearity, normality and homoscedasticity.
Each beta coefficient (β) represents the standardized weighted contribution of a
particular independent variable in predicting the value of a dependent variable
(Mertler & Vannatta 2005). The ANOVA tests the significance of each of the
models to see if the regression predicted by the independent variable explains
the significant amount of the variance in the dependent variable.
Hypothesis 2
Conscientiousness will be associated with improved IQ. The independent
variables associated with this hypothesis include dutifulness, achievement
striving, self-efficacy and self-discipline which represent the statistical mean of
the variables for conscientiousness. The dependent variables are
completeness, consistency and accuracy, which represent the statistical
mean of the variables for IQ. To evaluate H2, multiple regressions were
conducted to determine if trainee characteristics were a predictor of IQ. The
result shows regression coefficient (R = .512, p <.01) and R2 shows that 26.2
percent of the variances was accounted for by conscientiousness (the
predictor variable) see table 5-17. This suggests that conscientiousness has a
rather large impact on IQ and accounts for much of the variance.
Table 5-17 Model Summary
Model R R Square Adjusted R Square Std. Error of the Estimate
1 .512(a) .262 .185 .56317
Model: F (16,152) = 3.380; p< .001. Hence the results of the multiple
regression analysis are accepted as tenable, see table 5-18. Beta weights for
all the predictors are significant at p<0.001.

147
Table 5-18 ANOVA
Model Sum of Squares df Mean Square F Sig.
1 Regression 17.154 16 1.072 3.380 .000(a)
Residual 48.208 152 .317
Total 65.362 168
Hypothesis 3
Training design will be associated with improved IQ. The independent
variables in this hypothesis are: training duration, training intervals, percentage
of information quality training days, training programs and perception of
effectiveness of training, which represent the statistical mean of the variables
for training. The dependent variables are completeness, consistency and
accuracy, which represent the statistical mean of the variables for IQ. To
evaluate H1, multiple regressions were conducted to determine if training
design was a predictor of IQ. The result shows regression coefficient (R =
.424, p < .001) and r2 shows that 17.9 % of the variances accounted by
training design (the predictor variable) see table 5-19.
Table 5-19 Model Summary
Model R R Square Adjusted R Square Std. Error of the Estimate
1 .424(a) .179 .146 .55142
Model: F (7,174) = 5.437; p<.001 Hence the results of the multiple regression
analysis are accepted as tenable and the null hypothesis H0 is rejected (table
5-20). Beta weights for all the predictors are significant at p<0.001. This is
suggestive that training design also has a significant impact on IQ and
accounting for a large percentage of the variance in IQ.
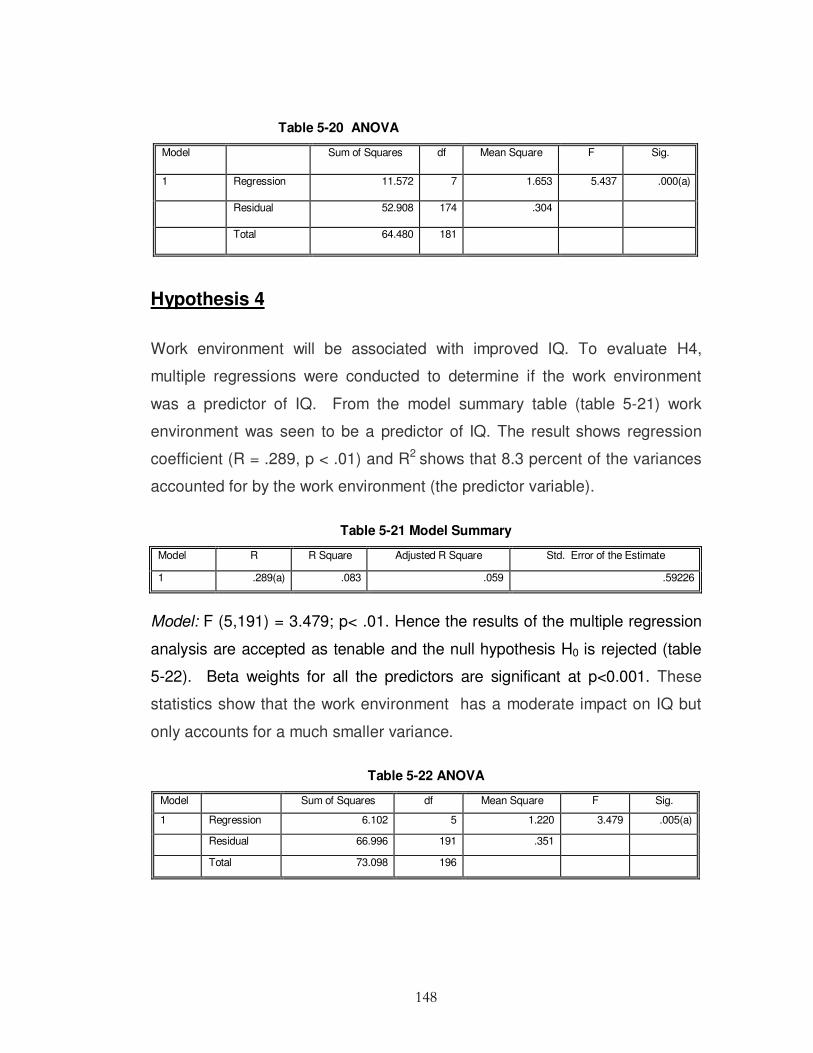
148
Table 5-20 ANOVA
Model Sum of Squares df Mean Square F Sig.
1 Regression 11.572 7 1.653 5.437 .000(a)
Residual 52.908 174 .304
Total 64.480 181
Hypothesis 4
Work environment will be associated with improved IQ. To evaluate H4,
multiple regressions were conducted to determine if the work environment
was a predictor of IQ. From the model summary table (table 5-21) work
environment was seen to be a predictor of IQ. The result shows regression
coefficient (R = .289, p < .01) and R2 shows that 8.3 percent of the variances
accounted for by the work environment (the predictor variable).
Table 5-21 Model Summary
Model R R Square Adjusted R Square Std. Error of the Estimate
1 .289(a) .083 .059 .59226
Model: F (5,191) = 3.479; p< .01. Hence the results of the multiple regression
analysis are accepted as tenable and the null hypothesis H0 is rejected (table
5-22). Beta weights for all the predictors are significant at p<0.001. These
statistics show that the work environment has a moderate impact on IQ but
only accounts for a much smaller variance.
Table 5-22 ANOVA
Model Sum of Squares df Mean Square F Sig.
1 Regression 6.102 5 1.220 3.479 .005(a)
Residual 66.996 191 .351
Total 73.098 196

149
Hypothesis 5
Experience will be associated with improved IQ. To evaluate H5, multiple
regressions were conducted to determine if experience was a predictor of IQ.
From the model summary (table 5-23) experience was deemed to be a
predictor of IQ. The result shows regression coefficient (R = .269, p < .001) and
r2 shows that 7.2 percent of the variances accounted for by Experience (the
predictor variable).
Table 5-23 Model Summary
Model R R Square Adjusted R Square Std. Error of the Estimate
1 .269(a) .072 .068 .59785
Model: F (1,197) = 15.340; p< .001. Hence the results of the multiple
regression analysis are accepted as tenable and the null hypothesis H0 is
rejected (table 5-24). Beta weights for predictors are significant at p<0.001.
Work experience has a much smaller impact on IQ variance as it accounts
for a smaller amount of the IQ variance.
Table 5-24 ANOVA
Model Sum of Squares Df Mean Square F Sig.
1 Regression 5.483 1 5.483 15.340 .000(a)
Residual 70.412 197 .357
Total 75.895 198
Recording experience impacts IQ documentation. To evaluate this statement
multiple regressions were conducted to discover if the recording experience
was a predictor of IQ. From the model summary (table 5-25) recording
experience was a predictor of IQ. The result shows regression coefficient (R
= .231, p < .001) and r2 shows that 5.3 percent of the variances accounted for
by documentation experience (the predictor variable).
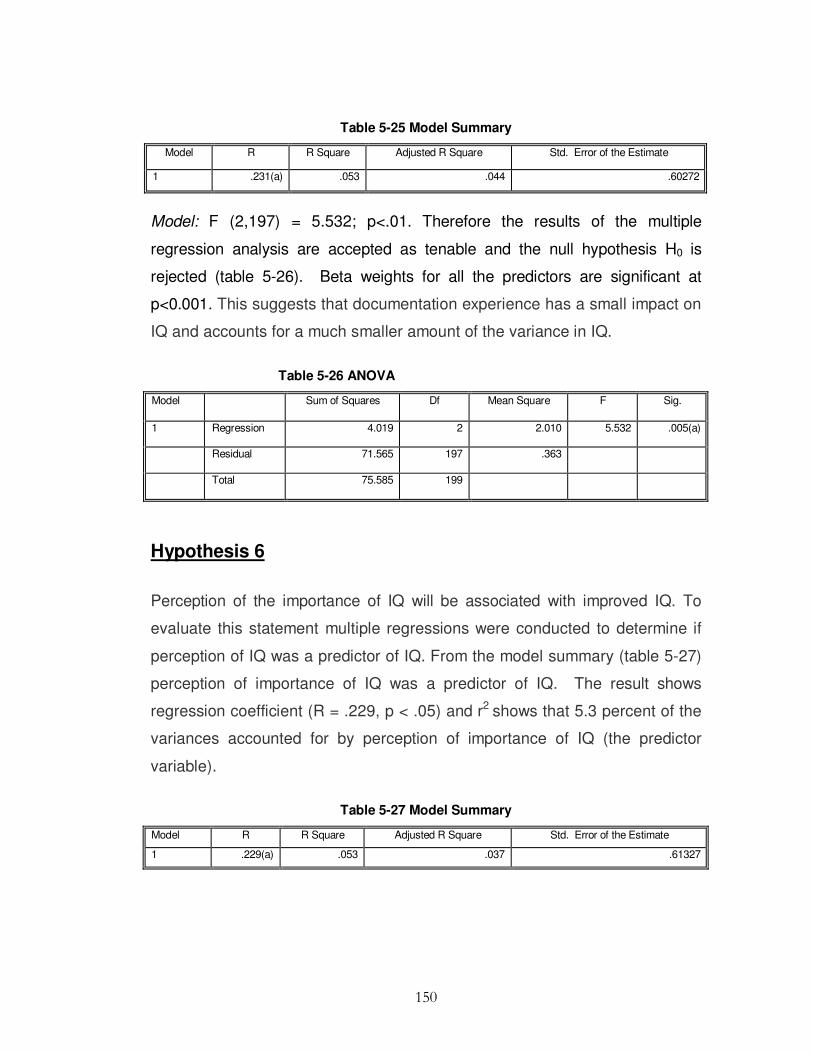
150
Table 5-25 Model Summary
Model R R Square Adjusted R Square Std. Error of the Estimate
1 .231(a) .053 .044 .60272
Model: F (2,197) = 5.532; p<.01. Therefore the results of the multiple
regression analysis are accepted as tenable and the null hypothesis H0 is
rejected (table 5-26). Beta weights for all the predictors are significant at
p<0.001. This suggests that documentation experience has a small impact on
IQ and accounts for a much smaller amount of the variance in IQ.
Table 5-26 ANOVA
Model Sum of Squares Df Mean Square F Sig.
1 Regression 4.019 2 2.010 5.532 .005(a)
Residual 71.565 197 .363
Total 75.585 199
Hypothesis 6
Perception of the importance of IQ will be associated with improved IQ. To
evaluate this statement multiple regressions were conducted to determine if
perception of IQ was a predictor of IQ. From the model summary (table 5-27)
perception of importance of IQ was a predictor of IQ. The result shows
regression coefficient (R = .229, p < .05) and r2 shows that 5.3 percent of the
variances accounted for by perception of importance of IQ (the predictor
variable).
Table 5-27 Model Summary
Model R R Square Adjusted R Square Std. Error of the Estimate
1 .229(a) .053 .037 .61327

151
Model: F (3,187) = 3.457; p<.05. Hence the results of the multiple regression
analysis are accepted as tenable and the null hypothesis H0 is rejected table
(5-28). Beta weights for all the predictors are significant at p<0.001. It would
appear that perception of IQ importance does not have as big an impact on
the variance of IQ as does conscientiousness and training design.
Nevertheless it is still an important predictor of IQ.
Table 5-28 ANOVA
Model Sum of Squares Df Mean Square F Sig.
1 Regression 3.901 3 1.300 3.457 .018(a)
Residual 70.331 187 .376
Total 74.232 190
5.4. Key Findings
This section gives a synopsis of the key findings from the survey which
assisted in the development of the Information Quality Training Analysis
Guideline discussed in Chapter 6. Findings from the survey instrument data
collection suggested predictor capabilities of varying degrees between training
and IQ, work environment factors and IQ, trainee characteristics and IQ;
training design and IQ, perceptions of IQ importance and IQ and experience
and IQ.
The majority of respondents were female and geographically, most
respondents were Irish. The largest group of survey respondents had more
than seven years experience. Of the total respondents, nurses accounted for
77%, doctors 9%, administration staff 7% and other participants 7%.
Non-Irish respondents reported that documentation was more accurate,
whereas the Irish respondents reported that documentation was more

152
consistent and better completeness levels. However, these findings were not
found to be statistically significant (NS).
Respondents with 5-6 years experience reported that documentation was more
accurate and more consistent, and respondents with more than 7 years
reported that documents were more complete. IQ is negatively correlated with
perception of IQ.
Conscientiousness accounts for 26.2 percent of the variances Beta weights for
all the predictors are significant at p<0.001. Experience accounts for 7.2
percent of the variances Beta weights for all predictors are significant at
p<0.001. Work environment accounts for 8.3 percent of the variances Beta
weights for predictors are significant at p<0.001. IQ perception accounts for
5.3 percent of the variances Beta weights for all predictors are significant at
p<0.001. Training design and sequencing accounts for 17.9 percent of the
variances Beta weights for all predictors are significant at p<.001.
5.5 Summary
This chapter outlined the development of a questionnaire that was specifically
designed to measure IQ predictors and then explored through a quantitative
analysis to show that IQ outcomes could be predicted by trainee characteristics
(conscientiousness), training design, sequencing, elements of the work
environment, importance of IQ perception and documentation recording
experience. Adaptations of Baldwin & Ford’s (1988) transfer of training model
were used for developing the IQ conceptual model for this study. The web
based survey was administered to a sample of healthcare professionals:
nurses, physicians, administration staff, clerks and laboratory technicians.
A range of data analysis methods were employed on the data. The values were
calculated as the statistical mean of the items associated with each group.

153
Analysis included demographic information, response analysis, descriptive
statistics, screening for normal distribution, construct analysis, independent
sample t-tests, multiple regression, and correlation analysis. All hypotheses
were tested using multiple regressions. The KS test indicated a normal
distribution. The set of items used to measure IQ was shown to be reliable to
the extent that they measured the construct they are meant to represent and
produced reliable and consistent scores.
The results show that training, work environment, experience, perception of IQ
importance, documentation recording experience, and conscientiousness are
all predictors of IQ. Support was found for all the main-effect hypotheses.
However, there are some other unknown predictors that account for the
remaining variance which have not been identified in this study. The results of
this survey points to the importance of examining IQ from a broader
perspective and valuable in identifying work environmental factors, trainee
characteristic (conscientiousness), the training design and experience as
predictors of IQ in order to incorporate these constructs in the development of
an Information Quality Training Analysis Guideline for the design of Information
Quality Training Plans presented in Chapter 6.
The questionnaire was suitable for gathering reliable subjective measures,
such as user perception of IQ, training, work environment and trainee
characteristics, and also useful as a confirmation tool to corroborate the results
of the experiment. Questions were designed to gather quantitative data and
carefully crafted, as much as possible, to avoid ambiguities. However, a
limitation of the study was that once the questionnaire was administered to the
sample population, control over the environment was limited. This loss of
control meant the validity of the results was more reliant on the honesty of the
respondent. Thus, it is more difficult to claim complete objectivity with the
questionnaire data than with the results of the controlled laboratory experiment.

154
C h a p t e r 6
INFORMATION QUALITY TRAINING
REQUIREMENTS ANALYSIS GUIDELINE
6.1. Introduction
This chapter outlines the construction of the Information Quality (IQ) conceptual
model (figure 6-1) and the design of an Information Quality Training
Requirements Analysis Guideline (IQTRAG) as a Design Science (DS),
problem-solving activity for improving IQ problems highlighted in studies
describing frequency, type, and clinical importance of hospital patient
admission records detailed in Chapter 1. IQ predictors identified in Chapter 4
and Chapter 5 provide key content elements for the design of the IQTRAG.
Figure 6-1 IQ Predictors

155
The DS approach used to create an artefact (IQTRAG) involved ‘Method
Engineering’. Method engineering consists of a ‘Role’ (in this case the
researcher) who is responsible for an ‘Activity’ (identifying IQ training needs),
which provides a ‘Result Document’ (IQTRAG) that is defined by a set of
‘Techniques’ (questionnaire, experiment and group interviews), using a set of
‘Tools’ (Survey Monkey, group interviews and laboratory experiment) (figure 6-
2).
Figure 6-2 Method Engineering Example
The Generic guideline was investigated by means of the mixed method
approach, and instantiated in a given domain specific application context
(healthcare) to define a task specific rational process (patient admittance form)
for assessing IQ training needs (IQ dimensions), and to assess IQ
documentation performance measures (outcomes) using three dimensions of
IQ (accuracy, consistency and completeness), (see figure 6-3).
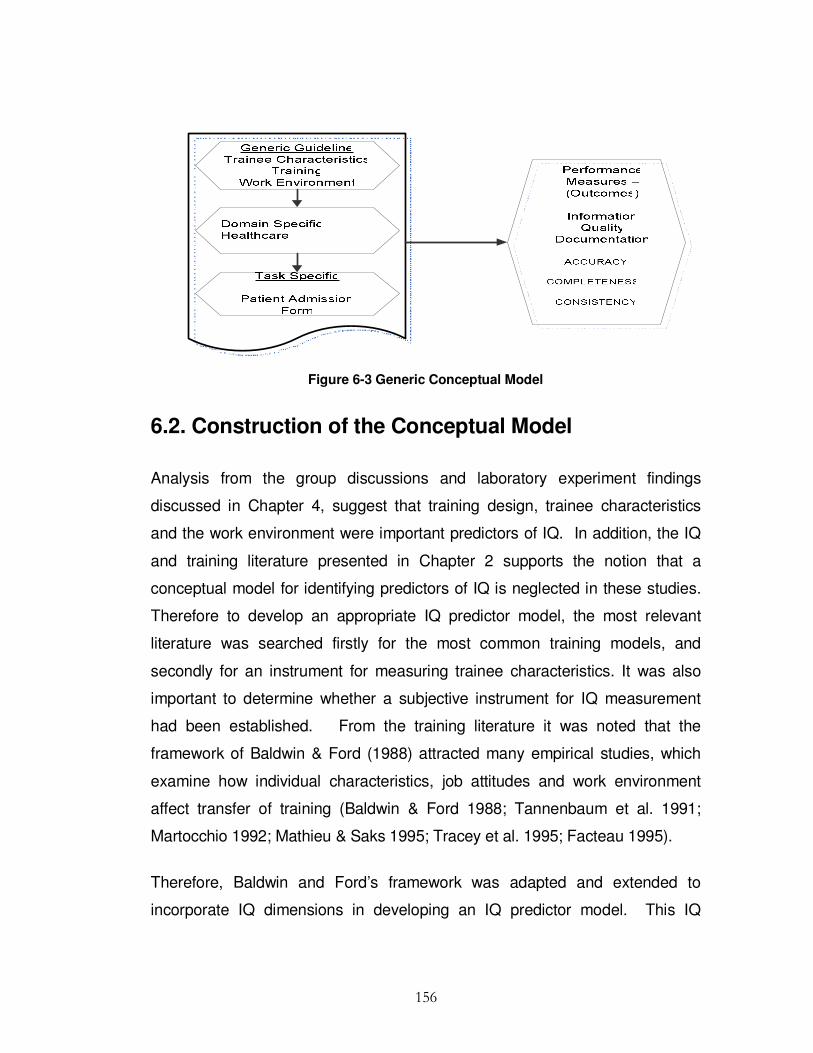
156
Figure 6-3 Generic Conceptual Model
6.2. Construction of the Conceptual Model
Analysis from the group discussions and laboratory experiment findings
discussed in Chapter 4, suggest that training design, trainee characteristics
and the work environment were important predictors of IQ. In addition, the IQ
and training literature presented in Chapter 2 supports the notion that a
conceptual model for identifying predictors of IQ is neglected in these studies.
Therefore to develop an appropriate IQ predictor model, the most relevant
literature was searched firstly for the most common training models, and
secondly for an instrument for measuring trainee characteristics. It was also
important to determine whether a subjective instrument for IQ measurement
had been established. From the training literature it was noted that the
framework of Baldwin & Ford (1988) attracted many empirical studies, which
examine how individual characteristics, job attitudes and work environment
affect transfer of training (Baldwin & Ford 1988; Tannenbaum et al. 1991;
Martocchio 1992; Mathieu & Saks 1995; Tracey et al. 1995; Facteau 1995).
Therefore, Baldwin and Ford’s framework was adapted and extended to
incorporate IQ dimensions in developing an IQ predictor model. This IQ

157
predictor model is unique in four ways: 1) it establishes training, work
environment and trainees' characteristics as predictor variables of IQ; 2) it is
studied in a specific domain (healthcare); 3) predictors are confirmed within a
specific task (patient admission form), and 4) it implements all these constructs
to find their predictor capabilities on three dimensions of IQ (accuracy,
completeness and consistency). Trainee characteristics’ impacts on IQ was
measured on the constructs of self-discipline, dutifulness, self-efficacy and
achievement striving. The work environment impact on IQ was measured by
the type of IS in operation (paper based or electronic form), admission form
layout (free style or tick box), and peer support. Training design impact on IQ
was measured on training duration, training intervals, documentation recording
experience, and trainees’ perception of IQ.
6.3. Training Plan
The basic IQTRAG for identifying elements of Information Quality Training
Plans (IQTPs) apply whether the Information Quality Training (IQT) consists of
a training programme, course, or module. This guideline is designed to guide
those involved in IQT in a wide variety of settings - training centres, companies
and other training sites. This guideline shows the general structure of IQT
designed to meet predefined IQ objectives. Preparing an IQTP is a process of
determining the content and sequencing of IQT units in order to provide
direction to learning and map it against IQ indicators which can be evaluated at
any given time. This IQTRAG is designed to promote or improve IQT and sets
out the minimum requirements to be addressed when preparing an IQTP.
6.4. Guideline Contents
Developing an IQTP includes a number of stages.

158
Stage 1: Set goals and objectives for the Training Plan. What is the aim of the
training program? Each of the objectives should be mapped to a specific IQ
unit of learning (e.g., accuracy, consistency, and completeness are important
and necessary elements for improvement as seen in the medical error studies
in Chapter 1, and supported by the experimental findings in Chapter 4, and the
survey findings in Chapter 5). Therefore the objective in this case may be to
improve accuracy consistency and completeness of documentation of
admission data forms.
a) Set realistic measurements for each objective (set up metrics to measure
each of the objectives identified in stage 1 (see IQ measurements, Chapter
2).
b) Identify the IQ trainee audience (Who needs to be trained: e.g., nurses,
doctors, administration staff, laboratory staff, other).
Stage 2: Identify IQT requirements: (What dimensions of IQ needs training?
(e.g., accuracy, see Findings: Chapter 4).
Stage 3: Budget Analysis (Cost implications needs to be considered, and
although this stage is most important, it is outside the scope of this study).
Stage 4: Development approach. Each identified module should be defined as
units of IQ learning and a detailed statement of the main IQ components
should be outlined.
a) Assess trainee characteristics (This variable has shown to be an important
predictor of IQ performance (see Findings: Chapter 5).
b) Identify training sources.
c) Duration (What is the most effective length of training sessions that suit the
trainee for best performance results?).
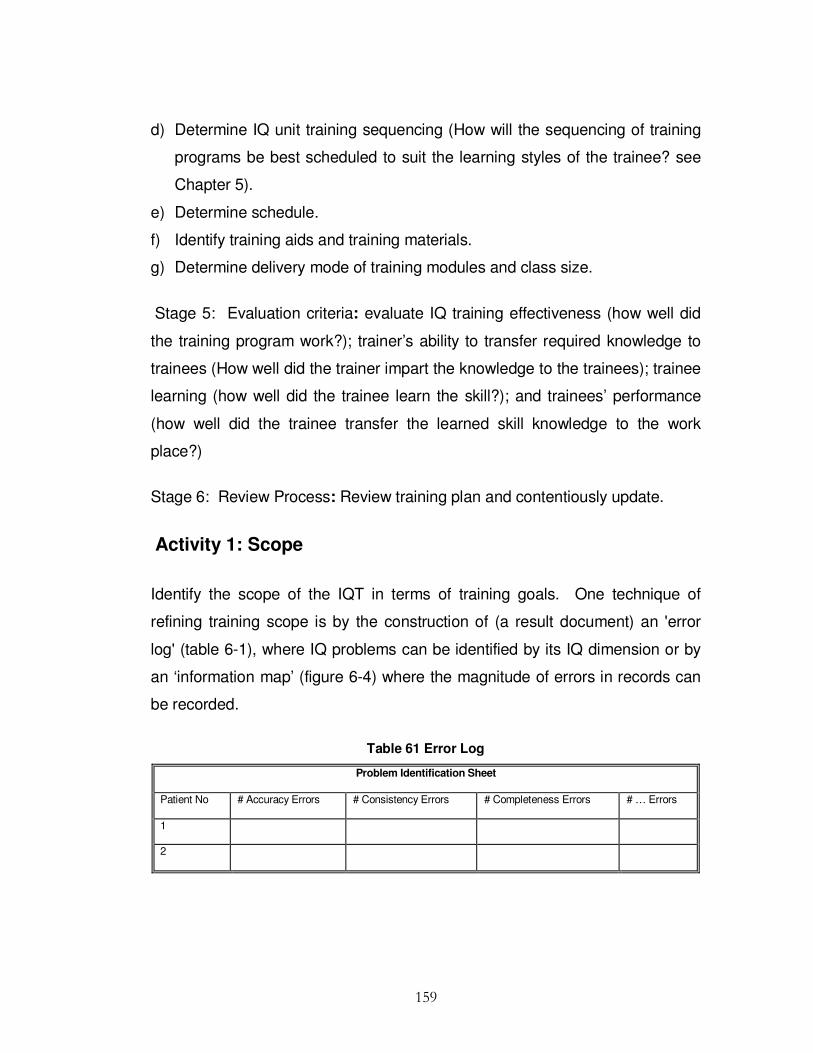
159
d) Determine IQ unit training sequencing (How will the sequencing of training
programs be best scheduled to suit the learning styles of the trainee? see
Chapter 5).
e) Determine schedule.
f) Identify training aids and training materials.
g) Determine delivery mode of training modules and class size.
Stage 5: Evaluation criteria: evaluate IQ training effectiveness (how well did
the training program work?); trainer’s ability to transfer required knowledge to
trainees (How well did the trainer impart the knowledge to the trainees); trainee
learning (how well did the trainee learn the skill?); and trainees’ performance
(how well did the trainee transfer the learned skill knowledge to the work
place?)
Stage 6: Review Process: Review training plan and contentiously update.
Activity 1: Scope
Identify the scope of the IQT in terms of training goals. One technique of
refining training scope is by the construction of (a result document) an 'error
log' (table 6-1), where IQ problems can be identified by its IQ dimension or by
an ‘information map’ (figure 6-4) where the magnitude of errors in records can
be recorded.
Table 61 Error Log
Problem Identification Sheet
Patient No # Accuracy Errors # Consistency Errors # Completeness Errors # … Errors
1
2

160
An Information map (result document) is a document that is derived from an
analysis of activities/tasks carried out in an organization. It is possible (figure 6-
4) for the Quality Control Manager (role) to gather error information (activity)
and create an information map (result document) using questionnaires
(techniques).
Figure 6-4 Error Assessment using an Information Map
An Information map (table 6-2) can be created from errors in specific records
where the data is sourced (R1- R2 and R3 etc. where R1 is record one, R2 is
record 2 and R3 is record 3. Analysis of this information shows that R1 had 25
percent completeness (as presented by the white block), 50 percent
consistency and 25 percent accuracy; R2 had 50 percent completeness, 100
percent consistency and 75 percent accuracy, and R3 had 100 percent
completeness, 75 percent consistency and 0 percent accuracy.

161
Table 6-2 Information Map
Information Map created by IQ manager on records R1, R2, and R3
R1 R2 R3
Completeness
Consistent
Accuracy (free from error)
Goals and Objectives
Determine the goal of what you are trying to accomplish (e.g., to improve
information quality accuracy, completeness, and consistency of documented
information). The Objectives of the IQTP needs to be understood, therefore,
it is necessary to describe the level of poor IQ that staff have encountered in
patient records on a daily basis, under each of the IQ dimensions (table 6-2).
Table 6-3 IQ Documentation Assessment
Employee Name Department Role IQ Dimension
Accuracy Consistency Completeness …
Set realistic measurements (metrics) for each objective (how are you going to
measure the IQ improvement? see example in table 6.4 taken from the IQ
literature).
Table 6-4 Information Quality Metrics Classification
Dimension Metric Definition and Measurement Parameters
Accuracy # correct values
# total values
The measure or degree of agreement between a data value and the
source agreed to be correct
Consistency # consistency
# Total
The extent where the physical instance is in accordance with the
specified format
Completeness # incomplete items
# total items
The extent to which data elements are not missing

162
Identify Audience
Who are you training? Describe the intended audience(s) for the training plan.
This may be broken down by role or department units (table 6-5).
Table 6-5 User Identification
Role Department
Activity 2: Training Requirements
Training needs can be identified by a needs and skills analysis.
Needs and Skills Analysis
This section provides a broad overview of the steps in a needs assessment
and the reasoning for implementing one. The needs assessment will help
determine content (figure 6-5): identify the target audiences for each course
module and assess the training needs for each target audience identified. A
questionnaire table 6-6, 6-7, 6-8, and 6-9 may be used to gather needs
requirements information. Identification of the ‘problem areas will determine
type of training, duration and extent of training.

163
Figure 6-5 Needs Assessment Determines Content
Table 6-6 IQ Required Training by Criticality Criteria
Job Title Name Department Training
Required
IQ Dimension Error Frequency Importance of Good IQ to
task
Yes No
Never Seldom Sometimes Usually Always Criticality 1 2 3 4 5
Accuracy Criticality 1 2 3 4 5
Consistency Criticality 1 2 3 4 5
Completeness

164
Table 6-7 IQ Needs Assessment
Employee Name: Title:
Completeness Never Seldom Sometimes Usually Always
How often do you find patient identification number
(MRN) not filled in?
How often do you find incomplete patient histories?
How often do you find patient admission forms not
signed by admission staff?
How often do you find that the patient’s Date of Birth
(DOB) missing?
How often do you have to fill in missing Information
that should have been recorded?
How often do you find the patient’s address not
recorded fully?
Consistency
How often do you find date of admission not filled in the
standard (required) format?
How often do you find patient Date of Birth (DOB)
written in a non consistent format?
How often do you find patient’s weight recorded in the
correct format?
Accuracy
How often do you find typographic errors(misspelling) in
a patient file?
How often do you find the Patient’s identification
number (MRN) recorded inaccurately?
How often do you need to make corrections to incorrect
information recorded by colleagues?
How often do you find patient’s Date of Birth (DOB) not
accurately recorded?
Table 6-8 Assessment of the Work Environment
Work Environment
Form layout Free style Tick box
Good Peer support Yes No
Information System Electronic Paper based

165
Table 6-9 Training Assessment Form
Complete this assessment, using the following scale:
1 = Needs Work (Unsatisfactory)
2 = Gets By (Marginal)
3 = Meets Requirements
4 = Exceeds Requirements
5 = Exceptional
Which of the following
areas do you think would
improve from further
specific training
All
Accuracy
Completeness
Consistency
None
The time I spent recording
patient information relative
to other duties is
0%
1- 25%
26-50%
51-75%
76- 100%
The frequency of which I
record patient information
is:
Never
Seldom
Occasionally
Often
Very Often
I feel the consequence of
recording inaccurate
information in Patient
Forms is
Negligible
Low
Moderate
High
Very High
I feel the consequence of
incompleteness of
information in Patient
Forms is
Negligible
Low
Moderate
High
Very High
I feel the consequence of
not recording consistent
information in Patient
Forms is
Negligible
Low
Moderate
High
Very High
Activity 3: Budget
Training plans must take into account feasibility; cost of training etc. (this is
outside the scope of this study)

166
Activity 4: Development Approach
This section discusses the activities, techniques and tools used to develop the
course curriculum and for identifying the materials required for the TP. The IQ
modules or units should relate to the IQ needs identified in the needs and ‘skills
analysis’ table 6-6, 6-7, 6-8, and 6-9, and should take into account factors such
as course objectives, the target audience, enrolment, training aids, venue,
trainers, schedule, participant feedback, performance review, trainer review,
training plan evaluation and costs (some of which are outside the scope of this
study).
Activity 4.1: Identify Information Elements
Table 6-10 provides a template of IQ dimensions that should be considered
when identifying the information elements for training, setting out the
measurements used and the information gathering techniques such as survey
or interview.
Table 6-10 Information Quality Dimensions
Training IQ Dimensions Measurement Technique Document
Y N
Accessibility
Believability
Completeness
Consistent representation
Ease of manipulation
Free from error
Relevancy
Timeliness

167
Activity 4.2: Training Sources
Describe the training provider. Training may be internal (course developed in-
house) or external (contracted to external training agencies).
Activity 4.3: Set Training Program Activities
Outline of training plan activities see checklist (table 6-11).
Table 6-11 Training Plan Activities
Sequence Activity
Complete Skills Assessment
Define class size by module
Identify training elements
Develop course designs
Develop training material
Set Curriculum
Develop Evaluation Plan
Check feasibility
Run pilot study
Evaluate and update training plan
Deliver training
Identify training program success factors
Execute Evaluation
Review feedback
Activity 4.4: Identify Class Size
Outline the number of trainees per session.

168
Activity 4.5: Facilities
Type of training and method of delivery will help to determine the physical
facilities needed for the training. The physical facilities in turn will determine
the location of the training. Size of training class will determine the venue.
Activity 4.6: Identify Training Staff
Identify the trainer(s) who will deliver the training course.
Activity 4.7: Identify Training Materials
This section describes the training resources required by both instructors (to
prepare the training program) and participants for the training course. This
may include hardware, software and training materials.
Activity 4.8: Delivery
This section describes how training can be delivered, e.g. in a class-room
environment, web-based sessions, workshops, seminars, lectures etc. One or
more methods of instruction may be used for example, lectures/classroom
environment may be better when the aim is to impart knowledge, and
demonstrations may be better if the aim is to teach skills, and a combination of
both if the aim is to impart knowledge with the view to teach a new or complex
skill.

169
Activity 4.9: Training Schedule
Describe the type of training (classroom) and the training schedule (duration,
location, and dates). Other factors include details of the training facilities,
access to networks, and security clearance and physical access to buildings
etc. Provide a description of the components that make up each course.
Each course may comprise of one or more modules. A course description
should be developed for each module. At a minimum, each course description
should include the course/module name; time; class size; the target audience;
course objectives; module content; specific training resources required such
as devices, aids, equipment, materials, and media to be used (table 6-12 and
6-13).
Table 6-12 Training Topics
Training Topics
Training Manager:-----------Researcher Course Title: -------
Module Approach Resource Start Date
IQ Principles Lecture
IQ Concepts Lecture
Induction Workshop
Legal Issues and IQ Workshop
Financial Issues and IQ Workshop
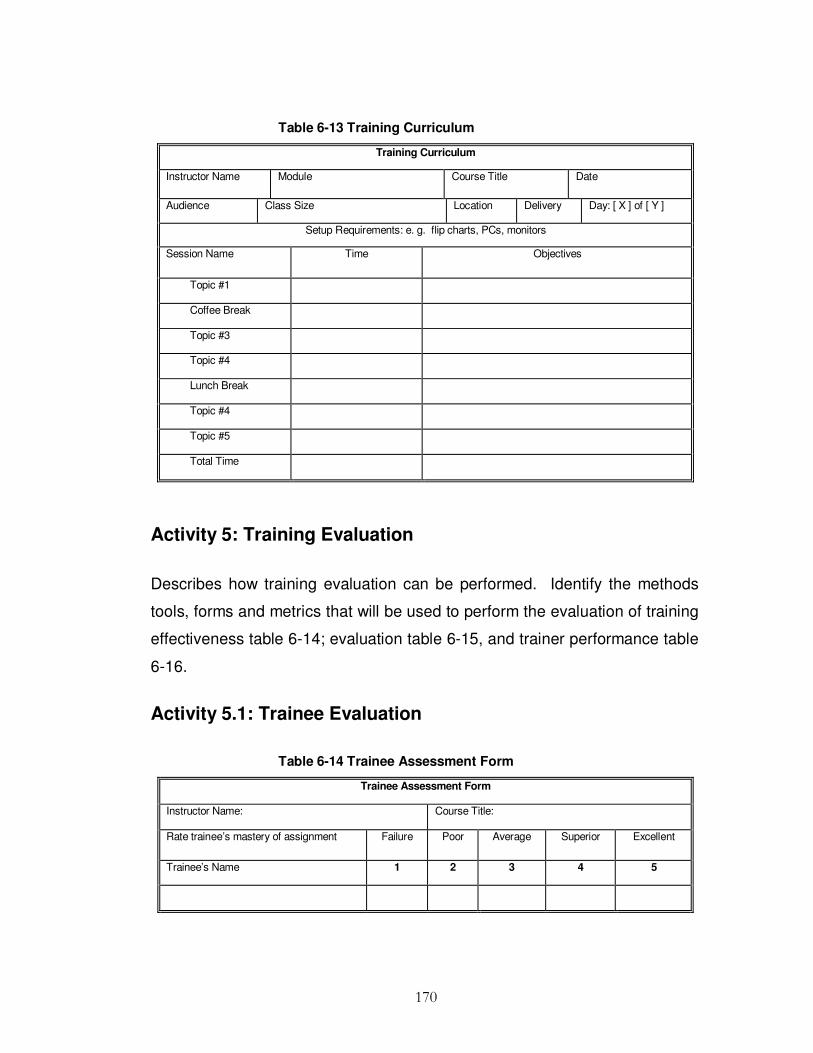
170
Table 6-13 Training Curriculum
Training Curriculum
Instructor Name Module Course Title Date
Audience Class Size Location Delivery Day: [ X ] of [ Y ]
Setup Requirements: e. g. flip charts, PCs, monitors
Session Name Time Objectives
Topic #1
Coffee Break
Topic #3
Topic #4
Lunch Break
Topic #4
Topic #5
Total Time
Activity 5: Training Evaluation
Describes how training evaluation can be performed. Identify the methods
tools, forms and metrics that will be used to perform the evaluation of training
effectiveness table 6-14; evaluation table 6-15, and trainer performance table
6-16.
Activity 5.1: Trainee Evaluation
Table 6-14 Trainee Assessment Form
Trainee Assessment Form
Instructor Name: Course Title:
Rate trainee’s mastery of assignment Failure Poor Average Superior Excellent
Trainee’s Name 1 2 3 4 5
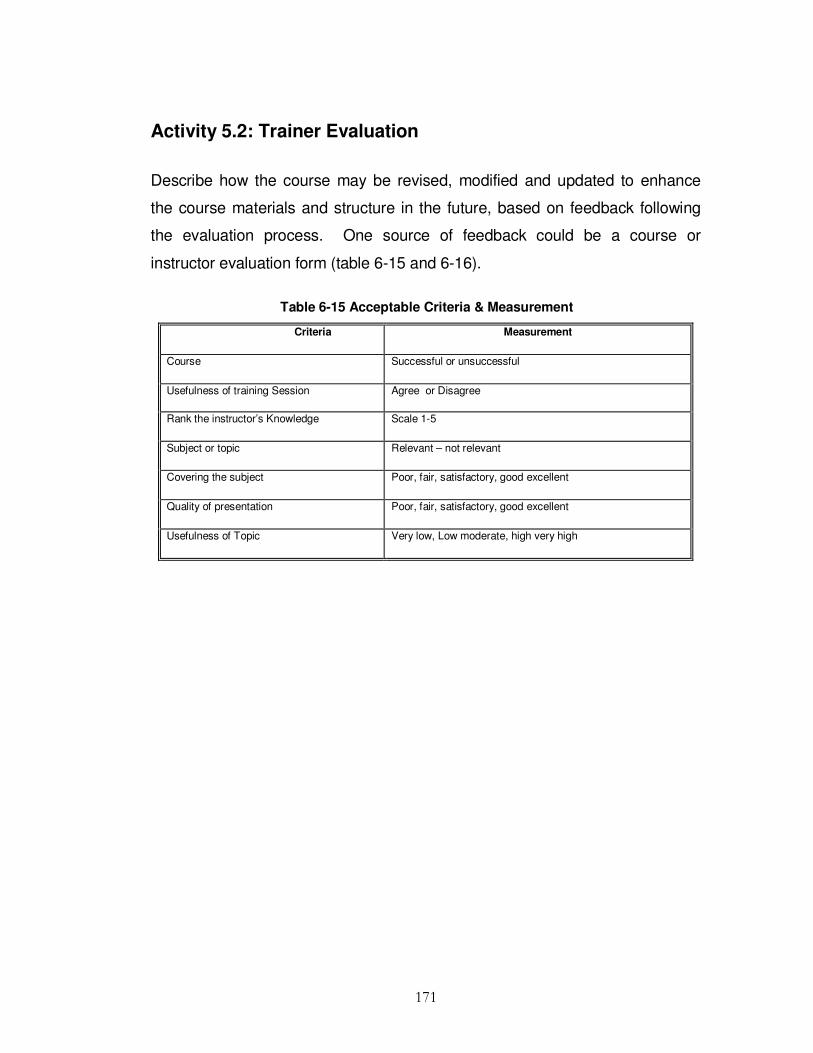
171
Activity 5.2: Trainer Evaluation
Describe how the course may be revised, modified and updated to enhance
the course materials and structure in the future, based on feedback following
the evaluation process. One source of feedback could be a course or
instructor evaluation form (table 6-15 and 6-16).
Table 6-15 Acceptable Criteria & Measurement
Criteria Measurement
Course Successful or unsuccessful
Usefulness of training Session Agree or Disagree
Rank the instructor’s Knowledge Scale 1-5
Subject or topic Relevant – not relevant
Covering the subject Poor, fair, satisfactory, good excellent
Quality of presentation Poor, fair, satisfactory, good excellent
Usefulness of Topic Very low, Low moderate, high very high

172
Table 6-16 Training Course Evaluation Form
Training Course Evaluation Form
Employee Name: Course Title:
Trainer: Training Company:
Instructor: Excellent Very Good Good Fair Poor
Knowledge of subject matter
Listening skills
Presentation skills/delivery
Overall instructor rating
Topics covered in too much detail
Course Content:
Course achieved its objectives
Exercises
Use of class time
Overall Content rating
Materials:
Overall course materials quality
Potential value as future reference material
Value of materials presentation
Flow/structure of information
Activity 5.3: Training Evaluation
Gather trainee reactions on the following topics: scope and relevance of
course, appropriateness of objectives, usefulness of assignments and
materials, effectiveness of course training materials, adequacy of the
facilities, timing or length of the course, effectiveness of the instructor(s). The
objectives of the training program may be evaluated and measured by
checking the error log of patient’s records before and after the training
Activity 6: Reviewing
Review training plans for improvement. This information can include updating
course contents, modification to training environment and other changes that
indicate additional training. Reviewers should cover three areas firstly people
with expertise in content who review the TP to verify completeness and report

173
sensibility; secondly experts in IQ field who review the method by which the
training plan is developed and report its validity and finally potential users of
the TP to judge its usefulness and provide feedback.
6.5. Guideline Validation
The issue of validity was addressed by eliciting the views of IQ experts and
medical professionals, and by using more than one method of data collection.
Combining qualitative and quantitative approaches ensures the research has
integrity and adequately measured what it intended to measure. Collection of
information using a triangulated approach helps cancel the limitations of one
method by the use of another and allow cross-checking of results to provide
more reliable findings. Additionally, further investigation by qualitative methods
(interviews) helps to fill gaps within the quantitative study. Figure 6-16 gives a
Design Science approach to developing an information quality training plan.
6.6. Summary
From a review of medical errors discussed in Chapter 1, insight was gained
into IQ problems in healthcare. By conducting interviews with healthcare
practitioners the most problematic areas of IQ recording were identified and
mapped to specific IQ dimensions. Medical professionals need to share a set
of pre-existing patient information data sets. The data recording process and
the task of accurately, completely and consistently recording patient
information have been seen to pose many challenges: data recorded
inaccurately, data recorded incompletely, and data recorded in an inconsistent
format. In most cases, practitioners make decisions with the available
information and use 'gut instinct' or experience to choose the correct course of
action when data available does not match expectations. This course of action
is complicated by evidence of medical errors in the media. Existing tools do

174
not appear to solve the problem and therefore it was important to devise a
problem solution artefact IQTRAG to help deal with this problem as outlined in
this chapter.
In the final chapter we give a brief overview of the study and its contribution to
the literature and practitioners, together with its limitations and
recommendations for further research.

175
IQ ProblemIdentification
Interviews
TrainingRelevance
ArtefactIQ
Training Plan
Review
ProblemIdentification
SolutionDesign
Evaluation
Build
Rigour
Provides
Instigates
IQTRAG
IQTraining
Psychology
TrainerAssessment
Form
TrainingAssessment
Form
TraineeAssessment
Form
Error Log
Identifies
Evaluate
Information Map
IQ NeedsAssessment
Determines
TrainingRequitements
Defines
TraineeCharacteristicsTraining Design
Work Environment
Depends on
Figure 6-6 Design Science Approach to IQTP

176
C h a p t e r 7
CONCLUSION
7.1. Introduction
There is considerable evidence to confirm that IQ problems in healthcare lead
to loss of life and decreased quality of life. It also accounts for substantial
economic losses. To date no attempt has been made to remedy these serious
problems within the related literature which is devoid of conceptual models, or
systematic investigation of key predictors of IQ. While there is a wealth of
literature regarding training transfer models and typologies, there is a
significant lack of studies, discussing the relationship between training, the
work environment, IQ perception, experience, training design and trainee
characteristics on IQ This research was therefore undertaken to fill this void. Its
aim is to provide a DS Information Quality Training Requirements Analysis
Guideline (roadmap) for IQ managers for the design of Information Quality
Training Plans. The presented artefact (model) guarantees rigour and
relevance of the guideline. Therefore, not only the use of this guideline for
practitioners but also a contribution to the IQ knowledge base is achieved.
The objective of this research was to investigate predictors of IQ and provide
an original and practical solution to poor IQ: Chapter 1 outlined the background
to the research, and motivation for conduction this study. This section also
outlined the hypothesis for investigation, research approach and contribution to
the body of knowledge. Justification was highlighted in terms of lack of prior
research on predictors of IQ.
Chapter 2 reviewed related work in the quality (section 2.1), information quality
management (sections 2.2), information systems (sections 2.2.2) and training
177
literatures (sections 2.3), and gave an overview of the most commonly used IQ
frameworks and training models (sections 2.4). It identified gaps in the body of
knowledge (sections 2.5), which highlighted the significance of the chosen
research area. The literature review revealed that no study to date has
empirically examined key predictors of IQ, and this in turn led to six hypotheses
for investigation.
Chapter 3 outlined and justified the appropriateness of a Design Science
research methodology, which was deemed the most suitable process for
investigating the research proposition ‘If training is applied, information quality
will increase in a way that will ultimately decrease medical errors in
documentation’. It also detailed the philosophical stance and the research
framework. Finally, ethical considerations of the research were addressed.
Chapter 4 provided a detailed account of the controlled laboratory experiment
that was used in this study to support the first hypothesis. Sufficiently well
specified tasks were supplied on predefined hospital scenarios. This section
also provided results of the data analysis from 23 participation trainee student
nurses, accompanied with analysis of the group interviews and discussions.
Chapter 5 outlined the Web based survey research phase where an
involvement from practitioners was sought from practitioners in Irish hospitals.
Thus, a better understanding of Information quality requirements in the
business world was established. It analysed the data collected from a total of
202 valid responses. The chapter included testing of hypotheses that gave an
insight into the relationships between the predictors and IQ.
Chapter 6 outlined the construction of the Information Quality Conceptual
Model and the Information Quality Training Requirements Analysis Guideline
(IQTRAG), as a Design Science (problem-solving activity) for improving IQ.

178
Conclusions from the research and the important specific contribution of this
work are presented in this final chapter. The implications of this research for
academia and practitioners are also highlighted in this section. The chapter
concludes with a discussion on the limitations of the study and an identification
of areas for further research.
7.2. Summary and Discussion of the Study
This study utilised a design science research process for conducting the study
that combined qualitative and quantitative research methods to guide the
overall research process (figure 7-1) The primary requirements on design
science are rigour and relevance (Hevner et al. 2004). Rigour was ensured by
applying suitable methodologies and frameworks. Relevance was ensured by
feedback from the business environment.

179
MedicalReviews
IQ ProblemIdentification
MediaCoverage
ResearchRelevance
Mixed MethodDesign Artefact
IQ ModelConstructs
IQ & TrainingLiterature
IQ TrainingRequirements
Analysis Guideline
SummaryResults
ExperimentSurveyInterviews
Hypotheses 2 - 6
ProblemIdentification
SolutionDesign
Evaluation
Denotes
Highlight
Build
Rigour Rigour
Redefines
EvaluateEvaluate
Evaluate
Provides
Utility
Confirm
Instigates
Identifies ConstructsIdentifies Constructs
Figure-7-1 Design Science Research Process
According to Rosemann & Vessey (2008) in the first phase of a research
process, a problem has to be identified that has practical relevance. This
phase was divided into the following steps: 1) identify the problem: to identify
the problem, a literature review was used where medical errors were
mentioned in scientific publications and medical reports, and 2) pre-evaluation

180
of the precise relevance: to evaluate relevance, medical reports were consulted
to assure practical relevance. The relevance was validated by medical reports;
therefore, a solid and important foundation was laid for this study. As a result
of this phase the research hypotheses were defined.
Once the problem was identified and a pre-evaluation on its relevance was
conducted a general research proposition postulating a link between the
solution space and the problem space was created as follows: ‘If training
(solution) is applied, information quality will increase in a way that will ultimately
decrease medical errors in documentation’. A literature review revealed that the
relationship between these constructs and IQ has not been, up now the subject
of investigation.
The study was guided according to the suggested design science research
process, making use of analytical, quantitative and qualitative methods derived
from the IQ and training disciplines and linking them in a rigorous framework.
Evaluation was achieved by the means of a laboratory experiment, interviews
and practitioner web based survey. Therefore, after evaluation of the laboratory
experiment results, interviews and group discussions, a Web based survey
was completed to finish the evaluation stage.
In the second phase, the solution was designed. It was divided into two steps
1) artefact design and, 2) supporting literature research. After identifying a
problem of poor IQ and pre-evaluating its relevance (medical errors), a solution
was developed in the form of an artefact (conceptual IQ predictor model).
Within this phase, research rigour was ensured by using all related work
available in the development of the model.
This conceptual model was developed by extending Baldwin & Ford’s (1988)
model that had been developed to fill similar gaps in the training literature,
which consisted of three primary lenses: the work environment, training design,

181
and trainee characteristics. The extended element is the inclusion of IQ
dimensions. Any number of IQ relationships can be analyzed within the
context of the IQ contextual model, which provides reference points for
anchoring the analysis within both the IQ and the training literatures.
With respect to this study, six relationships under the umbrella of three broad
categories: 1) training, 2) the work environment, and 3) trainee characteristics
were investigated as outlined in 1–6 , The results of which provided a vehicle
for developing a design science Information Quality Training Analysis Guideline
as a problem based solution to poor IQ.
H1: Training will be associated with improved IQ.
H2: Conscientiousness will be associated with improved IQ.
H3: Training design will be associated with improved IQ.
H4: Work environment will be associated with improved IQ.
H5: Experience will be associated with improved IQ.
H6: Perception of the importance of IQ will be associated with improved IQ.
Analysis was done using well known statistics to ensured rigour. Results are
summarised as follows and will be published in form of this PhD thesis, journals
and conferences articles. There is also a possibility to publish individual results
from each phase of this study.
Hypothesis 1: Training will be associated with improved IQ.
To find out what factors affect IQ it was necessary to examine the external
factors identified in the training literature that have been found to impact on
transfer of training to the work place. Therefore, after the analysis of the

182
experimental and group interview data (Chapter 4), a conceptual model of IQ
predictors was developed and organised into three constructs: trainee
characteristics, the work environment and, training design and sequencing,
which are investigated in the following hypotheses.
Hypothesis 2: Conscientiousness will be associated with improved
IQ.
Chapter 5, details the extent that trainee characteristics has with respect to job
performance. From our analysis of the survey data it is clear that the trainee
characteristics (such as conscientiousness) is one of the most important
predictors of IQ accounting for 26 percent of the IQ variance.
Hypothesis 3: Training design will be associated with improved IQ.
From our analysis of the survey data, training design (such as duration and
sequencing) accounts for 18 percent of the IQ variance and therefore, is also
an important predictor of IQ,
Hypothesis 4: Work environment will be associated with improved IQ.
The work environment was identified from the observational study and group
interviews, and then further tested using the Web based survey sent to Irish
hospitals. Findings supported this hypothesis (the work environment provided 8
percent impact on IQ).
Hypothesis 5: Experience will be associated with improved IQ.
This hypothesis was also supported accounting for 7 percent of the variance in
IQ,

183
Hypothesis 6: Perception of the importance of IQ will be associated
with improved IQ.
The difference between IQ perception and actual IQ recording was made clear.
The participants reported that there was a high degree of IQ within their
organisation, however, the errors they reported in the documentation was
contradictory. The result showed a sizable breach between perception of IQ
and the actual IQ, which indicated that although employees are aware of the
importance of good IQ, the transfer of this knowledge in practice to the
workplace failed. However, IQ perception of employees proved to also be a
key predictor of IQ but only accounting for 5 percent of the IQ variance.
From this overview it is now possible to address the principal research
proposition:
‘If systematic training is applied, information quality will increase in a way that will ultimately decrease medical errors in documentation’.
The findings of the survey, experiment, interviews and discussions provided a
solution to this problem by developing an Information Quality Training
Requirements Analysis Guideline (Chapter 6), which incorporated the identified
predictors of IQ, and is the final research output of this study. The literature
review of Chapter 2 concluded that there was a gap in the previous research
relating to predictors of IQ. Since there were no studies in the literature that
identified important predictors of IQ, the first (exploratory) stage of the research
was to list possible key predictors that may influence IQ. Subsequently, these
predictors categories were identified supported by group interviews and
discussions and were then incorporated into a conceptual IQ predictor model
for further analysis and testing through a Web based survey so that their
impact could be analysed. The analysis of these predictors' impact suggested

184
the need to incorporate their importance into the development of the
Information Quality Training Requirements Analysis Guideline artefact detailed
in chapter 6. Following the design science guideline 7, the complete results will
be published in the form of this PhD thesis.
This section presents the conclusions formed from analysis of the data
collected, and presented, in Chapter 4 and Chapter 5. Each hypothesis was
discussed concisely above. This analysis provided an insight into the
relationships between many external influencing factors and how they impact
on IQ. In the experiment in which we investigated H1, training had an effect on
accuracy as there was a statistically significant improvement between groups.
However, there was a non-significant statistical result for both completeness
and consistency. Despite this, support was found for hypotheses H2, H3, H4,
H5, and H6 with varying impacts on IQ, within the survey findings.
Additionally, perception of IQ within the organisation and the actual IQ reported
in documentation regarding accuracy, completeness and consistency posed
many questions as to the actual awareness IQ in general and is suggestive of
the need for IQ training at the most basic level.
Since many of the medical errors in healthcare relate to IQ dimensions, it is
reasonable to expect that the implementation of training in IQ would adequately
address this problem. However, the effects of just implementing training seem
to be less important than the analysis of trainee characteristics which has the
largest impact on IQ in the context of this study. Relying on our findings, we
suggest that training managers need to consider many factors, when
implementing an IQ training program; trainee characteristics, work
environment, training design, perception of IQ importance, and experience, to
ensure better IQ. In summary, this research found six key predictors that can
account for much of the variance in IQ. Given that little research has been

185
conducted to investigate predictors of IQ, this research is likely to make both
theoretical and practical contributions to the field of IQ and training literatures,
as discussed in section 7.3.
7.3. Contribution to the Literature
Previous research has highlighted the importance of quality management
(Deming 1982; Black & Porter 1996) and information quality management
(Redmen 1992; Wang 1998). There is also literature on identifying and
empirical testing critical success factors for quality management (Flynn et al.
1994; Behara & Gunderson 2001). Many studies in the IQ field have focused
on the theoretical modelling of controls (Redman 1998) and measurement/
dimensions of information quality (Ballou et al. 1985, 1987; Wang & Strong
1996; Huang et al. 1999). One of the drawbacks in the existing body of
knowledge regarding IQ is lack of identification of key IQ predictors, which to
date is largely unexplored. Therefore, this research is the first empirical study
that investigates IQ predictors for ensuring better IQ, and is an extension of IQ
theory not previously addressed.
Researchers of both training and IQ can benefit from this study in a number of
ways: Firstly the conceptual model presented in this study is useful to
researchers interested in examining the intersection of these two disciplines. It
is also particularly applicable to researchers examining various aspects of IQ
predictors and those researchers examining various characteristics of the
relationship between training, work environment, trainee characteristics and IQ.
Subsequently researchers are encouraged to use this model and continue
testing its capabilities. One may also benefit from considering the empirical
findings of this research in the development of research models examining
similar phenomena and provides a useful starting point for subsequent
empirical studies. Within the training literature, the conceptual model serves as

186
an extension of the three-lens framework presented by Baldwin & Ford (1988)
that expands each of those three lenses into IQ outcomes. The empirical
results of this research contribute to the training literature by demonstrating that
IQ has a quantifiable relationship to each of these training constructs.
In Summary, the research has theoretical implications in the following key
areas; an extension of theory to an area not previously addressed; the
development of an IQ predictor conceptual model and the identification of key
predictors of IQ that are critical for ensuring high IQ. The empirical results of
this research also contribute to the IQ literature by demonstrating that the three
constructs identified in the training literature have a systematically quantifiable
relationship to IQ. The empirical results of this research should also be of
benefit to practitioners as discussed in section 7.4.
7.4. Implications for Practitioners
The previous section discussed the implications for theory. Practitioners can
also benefit from this study. There can be no doubt that the critical impact
factors (predictors) identified by the study can serve practitioners in training
management as a useful guide to IQ management training activities, and IQ
improvement efforts. This study is a reminder of the importance of information
quality management and helpful to organisations in obtaining a better
understanding of IQ. In addition to this, the finding of this research have the
potential to help training managers and organisations focus on the most
important predictors of IQ, thereby obtaining greater benefit from less effort. If
organisations focus on these factors, they may be able to evaluate and
improve the perception of IQ in their organisations and thereby ensure better
IQ outcomes. The six factors identified as significant predictors of IQ also has
significance for health officials as it provides a reference for training managers
and focusing their attention and resource allocation for training plans.

187
Additionally they will be able to identify areas of IQ where improvements should
be made, and therein improve overall IQ. However, training managers should
note that the fact that some IQ dimensions which were not included in this
study should not be interpreted as them having no meaningful, practical
training applied to them. Finally practitioners can benefit by using the IQTRAG
developed in this study for designing effective IQTPs (Chapter 6).
7.5. Limitation of this Study
In the laboratory experiment the impact of training on IQ was investigated.
When designing the experiment, one limitation was information complexity.
The documentation recording process was relatively simplified. The
limitations of the experiment were mainly focused on the existence of the
identified relationship, due to the oversimplified experimental scenario. Thus
information was limited to a low complexity level, which would not be a true
reflection of the information complexity in a real world hospital setting.
Ultimately experimental design is intrusive and difficult to carry out in most real
world contexts. Because an experiment is often to some extent an intrusion, an
artificial situation was set up to assess a causal relationship with high internal
validity, which limits the degree to which the results can be generalized in
contexts where an experiment was not set up.
As discussed in Chapter 4, since the experiment was conducted in the
domain of student nurses there may be bias in the sample towards
inexperienced nurses. However, although the interpretation of the experimental
findings is limited in context and the empirical results cannot be generalized
beyond the population represented by the sample, this analysis has
demonstrated the ability to predict the impact of training on IQ outcomes. There
is room for many more experiments and with much larger number of subjects.
However, the results have been confirmed by survey data and qualitative
188
interviews. This increased the external validity to support the findings, and
since healthcare is a typically information rich organisation the results may be
applied to other business domains. Another limitation of this study is the
correlation between IQ dimensions.
From the methodology perspective limitations of the survey were noted. A
subjective assessment a survey research methodology was used to validate
IQ. Some limitations of survey research are whether the respondents
accurately reflect their viewpoints and whether their perspectives accurately
reflect the real world. Based on previous literature, this study moderated this
limitation by adopting a validated survey and providing reliability and validity
analysis. Due to time and resource constraints there were some limitations in
the approach to data gathering. Because of the prevalence of spam, ‘Web-
based surveys’ tend to have low response rates (Bullen 2005). This created a
small sample size, thus reducing the statistical power of the data and
increasing the probability of both Type I and Type II errors i.e. detecting
relationships where none exist and failing to detect relationships where they do
exist (Mertler & Vannatta 2005).
Arguably the main restraining factor of this study was the restricted survey
area. This was constrained to Ireland; therefore, the conclusions drawn from
this study may have a potential problem on generalisability. However, evidence
(Chapter 1) suggests that differences in IQ issues in Ireland, USA, and other
western countries are likely to be minor. Although the results of this study are
only drawn from hospitals in Ireland, there may be similar results if a study was
conducted in other western countries. Whether this is the case or not,
similarities and differences need to be further investigated.
In addition, the scale of the questionnaire was reduced from 1-10 to 1-5 (Wang
& Strong 1996) and this may have had an effect on the results. Even so the

189
result of this research can provide a first step towards a comprehensive IQ
model. The model and the results obtained from this study offer a valuable
basis for further research. Several limitations of this study were described.
Admittedly, the evidence from this research is limited and may be indicative of
other effects not measured at an observable level within the scope of this effort.
As such, further research is encouraged to better understand the relationship
between other predictors and IQ.
7.6. Recommendations for Further Research
This study has revealed the presence of an empirically measurable,
systematic relationship between training, work environment, trainee
characteristics and IQ. Based on these findings it is recommended that
organizations should undertake an Information Quality Training Requirements
Analysis by utilising these predictors before setting up an Information Quality
Training Plan.
Future research is motivated in acknowledgement of the need to create an
Information Quality Training Requirements Analysis Method that specialises in
method engineering. As stated by Hevner et al. (2004) experts in the
respective field should be consulted to develop the method content thus
assuring method quality, quality of created artefacts, relevance and scientific
rigour by the interaction of practitioners and researchers. Research similar to
this work, but using a different regression model, is recommended. Such a
study could build directly on the findings of this research. Researchers are
also encouraged to conduct similar research using different measurements of
IQ outcomes other than accuracy, consistency and completeness. Such
studies may reveal additional relationships not evident in this study.
190
Finally, researchers are encouraged to seek validation of these findings
through research conducted in accordance with research paradigms other
than the Design Science approach used in this study (such as a positivist
approach). Such studies can provide valuable validation of these findings.
This research has explored the effects of training design, trainee characteristics
and the work environment on IQ outcomes (accuracy, completeness and
consistency). In future research, other dimensions of IQ should be
investigated. For example, it would be beneficial to develop a comprehensive
and validated model to measure the impact of the constructs of this study on all
IQ dimensions.
7.7. Conclusion
The training literature identified predictors of transfer of training on
performance; however, little attempt was made to study and empirically test
these predictor capabilities on IQ. This research identified the important
predictors of transfer of training as also being important predictors of IQ;
provided a data measurement instrument; developed an IQ predictor model;
demonstrated that the relationship between the predictors and IQ is
systematically measurable and has created awareness of the importance of
training design, the work environment and trainee characteristics on IQ. The IQ
predictor model developed using a rigorous ontology approach made it
possible to develop an Information Quality Training Requirements Analysis
Guideline. This guideline can help to create more efficient and effective IQ
training programs tailored to the IQ needs of the information user.
This research has identified the relationships between the three constructs of
the conceptual model and IQ by undertaking a systematic examination from
both a quantitative and qualitative perspective. The analysis has demonstrated

191
the ability to identify many predictors of IQ, based on the measurement of the
selected IQ dimensions (accuracy, completeness and consistency). As such,
these findings can provide a starting point for subsequent empirical
examination.

192
References
AHRQ. (1998, February 2000). "Medical Errors: The Scope of the Problem An
Epidemic of Errors " Publication No. AHRQ 00-PO37, from
http://www.ahrq.gov/qual/errback.htm
AHRQ. (2006, March 2006). "Morbidity and Mortality Rounds on the web." Retrieved
1st March 2010, from http://www.webmn.ahrq.gov/case/aspx?caseID=116.
American Society for Quality (2006) http://asq.org
Anderson. JR., Corbett, AT., Koedinger, KR. and Pelletier, R. (1995). "Cognitive tutors:
lessons learned." J. Learn. Sci. 4, 1: 67-207.
Arthur, W., Bennett, W., Stanush, PL. and McNelly, TL. (1998). "Factors that influence
skill decay and retention: a quantitative review and analysis " Hum. Perform.
11, 79-86.
ASTD American Society for Training and Development (2008). from
http://www.astd.org/content/research/stateOfIndustry.htm.
Au, Y. A. (2001). "Design Science I: The Role of Design Science in Electronic
Commerce Research." Communications of the Association for Information
Systems (CAIS) 7.
Bacdayan, P (2001). "Quality improvement teams that stall due to poor project
selection: An exploration of contributing factors." Total Quality Management 12,
5: 589-598.
Bailey, J. E. and Pearson, S. W. (1983). "Development of a tool for measuring and
analyzing computer user satisfaction" Management Science 29, 5: 530-545.
Baldwin, T.T. and Ford, J.K. (1988). "Transfer of training: A review and directions for
future research." Personnel Psychology 41,1: 63-105.
Ball, N. L. (2001). "Design Science II: The Impact of Design Science on E-Commerce
Research and Practice." Communications of the Association for Information
Systems (CAIS) 7.
Ballou, D. and Pazer, H. (1995). "Designing information systems to optimize the
accuracy-timeliness tradeoff." Information Systems Research 6: 51-72.
Ballou. D. P. and Pazer, H. L. (1985). "Modeling data and process quality in multi-
input,multi-output information systems." Management Science, 31, 3: 150-162.

193
Ballou, D. P. and Tayi, G. K. (1999). "Enhancing data quality in data warehouse
environments." Communications of the ACM 42, 1: 73-78.
Ballou, D. P. and Pazer, H. L. 1987, 'Cost/quality Tradeoffs of Control procedures in
Information Systems', OMEGA: International Journal of Management
Science, 15, 6: 509-521.
Ballou, D. P., Wang, R. Y., Pazer, H. and Tayi, G. K. (1998). "Modeling information
manufacturing systems to determine information product quality. "
Management Science, 44, 4: 462-484.
Ballou, D. P. and Pazer, H. (2003). "Modelling completeness versus consistency
tradeoffs in information decision contexts." Transactions on Knowledge and
Data Engineering,15,1: 240-243.
Bandura, A. (1986). Social Foundations of Thought and Action: a Social Cognitive
Theory New Jersey: Prentice Hall.
Barrick, M. R and Mount, M. K. (1996). "Effects of impression management and self-
deception on the predictive validity of personality constructs." Journal of
Applied Psychology, 81: 261-272.
Barrick, M. R. and Mount, M. K. (1991). "The Big Five personality dimensions and job
performance: A meta-analysis. Personnel Psychology, 44: 1-26.
Barrick, M. R., Stewart, G. L., Neubert, M. J. and Mount, G. L (1998 ). "Relating
member ability and personality to work-team processes and team
effectiveness." Journal of Applied Psychology, 83: 377-391.
Bassi, L. (2000). The 2000 ASTD learning outcomes report. Washington, DC.
Beckford, J. (2005). Quality, London and New York: Rutledge Taylor & Frances Group.
Behara, R. S. and Gundersen, D. E. 2001. 'Analysis of Quality Management
Practices in Services', International Journal of Quality and Reliability
Management, 18, 6:, 584-603.
Belkin, L. (2004). How can we save the next victim? Ethical theory and business,
Upper Saddle River, NJ: Pearson - Prentice Hall.
Bertoletti, M., M., P., Scannapieco, M., Aimetti, P., & Batini, C. (2005). Improving
government-to-business relationships through data reconciliation and process
reengineering. Information quality, R. Y. Wang. E. M. Pierce. S. E. Madnick &
C. W. Fisher (Eds.). New York: M. E. Sharpe: 151-166.

194
Berwick Donald, M. (2002). "A user’s Manual for the IOM’s Quality Chasm’ Report."
Hope project- the people to people health foundation, inc., Health Affairs, 80-
90.
Black, S.A. and Porter, L.J. (1996). "Identification of the critical factors of TQM".
Decision Sciences, 27,1: 1-21.
Blackburn, R. and Rosen, B. (1993). "Total quality and human resource management:
lessons learned from Baldrige Award-winning companies." Academy of
Management Executive, 7, 3: 49-66.
Blades, M. (1995). Development of a simple model for analysis of quality. MCB
University press.
Bovee, M. W. (2004). "Information quality: A conceptual framework and empirical
evalidation" DAI, 65 (07).
Bowen, P. (1993). Managing Data Quality Accounting Information Systems: A
Stochastic Clearing System Approach. Unpublished Ph.D. Dissertation,
University of Tennessee.
Bowen,P.W. (1996). The need for quality cultures, MBC University press.
Bowen, P. L. (1992). "Managing data quality in accounting information systems: A
stochastic clearing system approach" Abstract in Dissertation Abstracts
International 54-03A (1992).
Boylan, Michael. 29 Apr (2010). Augustus Cullen Law , Medical Independent
Brennan, Troyen, Leape, A., Lucian, L., Laird, Nan M. et al. (1991). "Incidence of
adverse events and negligence in hospitalized patients: Results of the Harvard
Medical Practice Study I. N " Engl J Med. 324 : 370-376.
Broad, M. L. and Newstrom, J. W. (1992). Transfer of training: Action-packed
strategies to ensure high payoff from training investments. Reading, MA:
Addison-Wesley.
Brown, A. L. (1992). Design experiments: Theoretical and methodological challenges
in creating complex interventions in classroom settings. The Journal of The
Learning Sciences, 2, 2: 141–178.
Bugajski, J., Grossman, R.L. and Tang Zhao (2005). "An event based framework for
improving information quality that integrates baseline models, casual models
and formal models, IQIS " ACM

195
Bullen, J. I. (2005). "Information security in Brazil: Modeling and predicting outsourcing
decisions " DAI 65 (10): 3910.
Campbell, D. T. & Stanley, J. C. (1963). Experimental and quasi-experimental designs
for research. Chicago: Rand McNally.
Chang, R. (1993). "When TQM goes nowhere." Training and Development 47, 1: 22-
9.
Charatan, Fred (2002). "US report blames poor quality control for soaring healthcare
costs" BMJ, (1478) DOI.
Churchill, G. A., Jr. (1979). A paradigm for developing better measures of marketing
constructs. Journal of Marketing Research, 16, 1: 64-73.
Collins, A. (1992). Toward a design science of education. In E. Scanlon &T. O’Shea
(Eds.), New directions in educational technology 15-22. New York: Springer-
Verlag.
Colquitt, J. A. and Simmering, M. J (1998). "Conscientiousness, goal orientation, and
motivation to learn during the learning process: A longitudinal study " Journal of
Applied Psychology 83, 4: 654-665.
Colquitt, J.A., LePine, J.A. and Noe, R.A. (2000). "Toward an integrative theory of
training motivation: a meta-analytic path analysis of 20 years of research. " J.
Appl. Psychol. In press.
Connecting for Health Common Framework (2006) "Background Issues in Data
Quality: "Volume, DOI:
Cook, T. D., and Campbell, D. T. (1979). Quasi-experimentation: Design and analysis
issues for field settings. Chicago: Rand McNally.
Costa, P. T. and McCrae, R. R. (1995). "Domains and facets: Hierarchical personality
assessment using the revised NEO Personality Inventory." Journal of
Personality Assessment 68: 86-94.
Costa, P. T. and McCrae, R. R. (1992) "Revised NEO Personality Inventory and the
Five-Factor Inventory professional manual." Odessa, FL: Psychological
Assessment Resources.
Crosby, P. B. (1992). Completeness: Quality for the 21st century. New York:. Dutton.
Crosby, P. B. (1996 ). Reflections on quality. New York: , McGraw-Hill.
196
Crosby, P. B. (1995). Quality without Tears, The Art of Hassle Free Management, New
York: McGraw Hill Inc.
Crosby, Philip (1980). Quality is free: The art of making quality certain. New York:
Mentor.
Cunningham, J.B. (1993). Action research and organisational development. London:
Praeger.
DeLone and Mclean (1992). Information systems success: The quest for the
dependent variable - 87-88., Information Systems Research.
DeLone, W. H. and McLean, E. R. (2003). "The DeLone and McLean model of
information systems success: A ten-year update." Journal of Management
Information Systems, 19, 4: 9-30.
Deming, E. W. (1995). Out of the Crisis, MIT press.
Deming, W. E. 1982. Quality, Productivity, and Competitive Position, Cambridge, MA:
MIT Centre for Advanced Engineering Study.
Dept of Pharmacy Sunnybrook & Women's College Health Sciences Centre Toronto
Ontario Canada. from
http://www.ncbi.nlm.nih.gov/pubmed/15738372?ordinalpos=1&itool=EntrezSyst
em2.PEntrez.Pubmed.Pubmed_ResultsPanel.Pubmed_DiscoveryPanel.Pubm
ed_Discovery_RA&linkpos=1&log$=relatedarticles&logdbfrom=pubmed.
Dervin, B. and Nilan, M. (1986). "Information needs and uses." Annual Review of
Information Science and Technology 25: 3-33.
Dewey, J. (1938) Experience and Education. New York: Collier Books.
Dillard, R.A. (1992). "Using Data Quality Measures in Decision Making Algorithms",
IEEE Expert 7: 63-72.
Dillman, Don A. 2000. Mail and Internet Surveys: The Tailored Design Methods.
Second edition. New York: Wiley.
Donnellan, Eithne (2007). 60% of A&E patients had errors in their prescriptions. In:
Irish Times,. Ireland, Thursday 18th January (2007).
Donnellan, Eithne and Jamie Smyth (2010). Second baby scan error emerges in
Galway hospital, The Irish Times - Wednesday, June 9 .
Donnellan, Eithne (2010). Health Correspondent Inquiry told of kidney removal error
www.irishtimes.com - Last Updated: Thursday, May 27, 2010, 18:37.

197
Easterby-Smith M (1997) Management Research: an Introduction. London, Sage.
Eckerson, W.W. (2002). " Data quality and the Bottom line: Achieving business
success through a commitment to high quality data. "The Data warehousing
institute Report Series, 101, Chatsworth, USA.
English, L. (2002). "The Essentials of lnformation Quality Management, " DM Review
September
English, L. (2003). "TIQM Methodology." DM Review September.
English, L. (1996/ 2004). "Information Quality: Meeting Customer Needs, "DM Review,
3: 1
English, L. P. (1999). Improving data warehouse and business information quality:
methods for reducing costs and increasing profits. Chichester: Wiley.
English, L. P. (2003). "Plain English about information quality: How to save $576 925
000 through IQ management." DOI.
Eppler, M.J. (2006). Managing information quality: increasing the value of information
in knowledge-intensive products and processes (2nd ed.) Berlin: Springer.
Facteau, JD, D. G., Russel JEA, Ladd RT, Kudisch JD. (1995.). "The influence of
general perceptions for the training environment on pretraining motivation and
perceived training transfer." J. Manage 21, 1: 25.
Faculty of Medicine University of Ottawa, O., Ont.,. from
http://www.ncbi.nlm.nih.gov/pubmed/16129874?ordinalpos=1&itool=EntrezSyst
em2.PEntrez.Pubmed.Pubmed_ResultsPanel.Pubmed_DiscoveryPanel.Pubm
ed_Discovery_RA&linkpos=4&log$=relatedreviews&logdbfrom=pubmed
Feigenbaum Armand (1991) Total Quality Control, Revised (Fortieth Anniversary
Edition) McGraw Hill, inc. New York
Fisher, C., Lauría, E., Chengalur-Smith, S. and Wang R. (2006). "Introduction to
information quality." New York: M.I.T. Information Quality Programme.
Flynn, B. B., Schoeder, R. G. and Sakakibara, S. 1994. 'A Framework for Quality
Management Research and Associated Measurement Instrument', Journal of
Operations Management, 11: 339-66.
Ford, J.K. Weissbein DA. (1997). "Transfer of training: an updated review and analysis
" Perform. Improve. Q. 10: 22-41.
Fox, C. and Frakes, W. (1997). "The quality approach is it delivering." ACM: 25-29.

198
Gallagher, C. A (1974). "Perceptions of the value of a management information
system." Academy of Management Journal, 17,1: 46-55.
Galliers, R. D. (1991). “Choosing Information Systems Research Approaches,”
Contemporary Approaches Emergent Traditions, in Information Systems
Research: H. H-E. Nissen, K. Klein, and R. A. Hirschheim (eds.) . Amsterdam:
North-Holland, 327-346
Garfinkel, R. S., Kunnathur, A.S. and G. E. Liepins, G. E. (1986). "Optimal imputation
of erroneous data: Categorical data, general edits." Operations Research 34:
744-751.
Gendon, M. and D’Onofrio, M. (2001). "Data Quality in the Health Care Industry" Data
Quality, 7: 1.
Goldberg, L. R. (1990). "An alternative "description of personality": the Big-Five factor
structure. ." Journal of Personality and Social Psychology, 59, 6: 1216-1229.
Goldstein, Donald M. and Dillon, Katherine V. Amelia (1997). The Centennial
Biography of an Aviation Pioneer . Washington, D.C. :Brasseys, Inc.
Goldstein IL. (1993). Training in Organizations: Needs Assessment, Development and
Evaluation.
Goodden, R. (2001). "Product liability prevention: The next dimension in quality. " Total
Quality Management, 12, 5: 623-628.
Hall, Linda, McGillis, D. D. T. D. R. N. M. A. R. N. (2005). Quality Work Environments
For Nurse And Patient Safety, Jones and Bartlett.
Hansson, J. (2001). "Implementation of total quality management in small
organizations: A case study in Sweden." Total Quality Management, 12, 7 & 8:
988-99.
Hartline, M.D. and Ferrell, O.C. (1996). "The management of customer-contact service
employees: An empirical investigation," Journal of Marketing, 60, 4: 52- 69.
Healy, Tim (2010). A WOMAN has been awarded '90,000 in High Court damages after
a surgical wire was left in her body during an operation. Article from: Irish
Independent (Dublin, Republic of Ireland) Article date: March 27, 2010.
Helfert, M. and Herrmann, C. (2005). Introducing data-quality management in data
warehousing. . Information quality R.Y.W.E.M.P.S.E.M.C.W.F.(Eds.). New
York: M. E. Sharpe: 135-150.

199
Helfert, M., Zellner, G. and Sousa, C. (2002). Data quality problems and proactive data
quality management in data warehouse systems. Proceeding of the Business
Information Technology World Conference, 2002, 2-5 June.
Hevner, A., March, S., Park, J. and Ram, S. (2004). Design Science in Information
Systems Research, MIS Quarterly, 28, 1: 75-105.
Hogan, J. and Ones, D.S. (1997). Conscientiousness and integrity at work. Handbook
of personality psychology J. J. In R. Hogan, & S. Briggs (Eds.) San Diego: CA
Academic Press. 849-870.
Holton III, E.F. (1996). "The flawed four-level evaluation model." Human Resource
Development Quarterly 7, 1: 5-21.
Hospital Management (http://www. hospitalmanagement. net/press/).
HSE's medical errors list revealed in Republic of Ireland Date published: Tuesday,
January 27, 2009 News source: Irish Health.com Region: Republic of Ireland.
Huh, Y., U. F. R. Keller, T. C. Redman, a. A. R. W. (1990). "Data quality." Information
and Software Technology 32: 559-565.
Huang, H.-T., Lee, Y. W. and Wang, R. Y. 1999. Quality Information and Knowledge,
New Jersey: Prentice Hall.
Institute of Medicine (1999). To Err is Human: Building a Safer Health System.
Washington, D.C: National Academy Press.
Institute of Medicine (2001). Crossing the Quality Chasm: A New Health System for
the 21st Century. Washington, D.C: National Academy Press.
Institute of Medicine (July 2006) "Preventing Medication Errors." DOI.
Irish Health (www. irishhealth.com 2009). Irish Medical News (2006). Mixed reactions to estimates, health estimates highlights’
Institute for Safe Medication Practices (ISMP), Huntingdon Valley, Pennsylvania, USA.
http://www.ncbi.nlm.nih.gov/pubmed/15692279?ordinalpos=1&itool=EntrezSystem2.P
Entrez.Pubmed.Pubmed_ResultsPanel.Pubmed_DiscoveryPanel.Pubmed_Dis
covery_RA&linkpos=5&log$=relatedreviews&logdbfrom=pubmed.
ISO 9000 Bureau of Business Practice. (1992). ISO 9000: Handbook of Quality
Standard and Compliance. United States.
Jacobs, Joshua, L. Apatov Nathaniel and Flei Matthew (2007). Increasing vigilance on
the medical/surgical floor to improve patient safety, Blackwell publishing Ltd.

200
Jang, Y. H. B. Kon and R. Y. Wang (1992). A data consumer-based approach to
supporting data quality judgment Proceedings of the Second Annual Workshop
on Information Technology and Systems Dallas, Texas.
Jahoda, M., Deutsch, M. and Cook, S. 1962. Research Methods in Social Relations.
New York: Holt, Rinehart and Winston.
Johnson, R. J. (1993). TQM: Quality Training Practices, . Milwaukee, WI : ASQC
Press.
Juran, J. M. (1989). Juran on leadership for quality. New York: Free Press.
Juran, J. M. (1979). Quality Control Handbood. New York.
Kahn, B. K., Strong, D. M. and Wang, R. Y. (2002). "Information quality benchmarks:
Product and service performance " Communications of the ACM 45, 4: 184-
192.
Katz-Haas, R. and Lee Y. W. (2005). Understanding interdependencies between
information and organizational processes. Information quality . In R. Y. Wang.
E. M. Pierce. S. E. Madnick & C. W. Fisher (Eds.), New York: M. E. Sharpe,
167-178.
Kelly, Pat 29 Apr (2010) The tip of the iceberg Medical Independent 2010.
Keogh, Elaine (2006). Mother died after ambulance went to wrong address. In: Irish
Independent, Friday 15th December (2006) Ireland.
Kirakowski, J. (1997). Questionnaires in Usability Engineering. A List of Frequently
Asked Questions, Human Factors Research Group, Cork, Ireland.
http://www.ucc.ie/hfrg/resources/qfaq1.html .
Kirkpatrick, D. L. (1998). Evaluating training programs. San Francisco: Berrett -
Koehler.
Kirkpatrick, D.L. (1994). Evaluating Training Programs: The Four Levels New York:
McGraw-Hill.
Klein, B. D. (1998). User Detection of Errors in Data: Learning through Direct and
Indirect Experience. Paper presented at the. AIS 98.
Klein, B. D., Goodhue D.L. and G. B Davis (1997). "Can humans detect errors in data?
Impact of base rates, incentives, and goals." MIS Quarterly, 21, 2: 169-194.
Klein, B.D. (2001). "User perceptions of data quality: internet and traditional text
sources."The Journal of Computer Information Systems, 41, 4: 9-11.

201
Kovac, R., Lee, Y.W. and Pipino, L.L (1997). Total data quality management: the case
of IRI. The 1997 Conference on Information Quality Cambridge, MA.
Kozlowski SWJ. and Salas E. (1997). A multilevel organizational systems approach for
the implementation and transfer of training.
Kraeme, H. C. (1981). Coping strategies in psychiatric clinical research. Journal of
Consulting and Clinical Psychology, 49: 309-319.
Kraiger, K., McLinden D. and Casper WJ. (2004). "Collaborative planning for training
impact" Human Resource Management 43, 4: 337-351.
Kuhn, T. (1970). The Strucure of Scientific Revolutions. Chicago: University of
Chicago Press.
Kumar, G. and Tayi, B. (1998). "Examining data quality " Communications of the ACM
54-57.
Lee T.H. and Gharajedaghi, J. (1998). "Leadership in TQM: What does it mean?
"Center for Quality Management Journal,7, 1.
Lee Y., Strong D., Kahn B. and Wang R. (2002). "AIMQ: a methodology for information
quality assessment." Information & Management. 40, 2: 133-146.
Leitnaker, M. G., R. D. Sanders, and C. Hild. (1996). The power of statistical thinking:
Improving industrial processes, Addison-Wesley.
Levis Mary. Malcolm Brady and Markus Helfert (2007). IQ Management: Review of an
Evolving Research Area, 12th International Conference on Information Quality,
09-11 Nov 07, Cambridge, Massachusetts, USA.
Madu, C.N (2003). Competing on Quality and Environment, Chi Publishers Inc.
Mahoney F. X. & Thor C. G (1994). The TQM trilogy: Using ISO 9000, the Deming
Prize, and the Baldridge Award to establish a system for total
qualitymanagement. New York: American Management Association.
Mandal P., Howell A. and Sohal A. S. (1998). "A systemic approach to quality
improvements: The interactions between the technical, human and quality
systems." Total Quality Management, 9,1: 79-100.
Mann R.S. and Kehoe D.F. (1994) "The implementation of TQM (paper 2). Quality
World Technical Supplement, March 1994." 1
March, S. and Smith, G. (1995). Design and Natural Science Research on Information
Technology, Decision Support Systems, 15 : 251- 266.

202
Martella, R. C., Nelson, R. & Marchand-Martella, N. E., (1999). Research methods:
Learning to become a critical research consumer. Boston: Allyn & Bacon.
Martocchio J. J. and Judge T. A. (1997) "Relationship between conscientiousness and
learning in employee training: Mediating influences of self-deception and self-
efficacy."Journal of Applied Psychology, 82, 764-77.
Martocchio J.J (1992)."Microcomputer usage as an opportunity: the influence of
context in employee training", Personnel Psychology 45, 529-52.
Mathieu J.E., S.I. Tannenbaum and Salas E. (1992). "Influences of individual and
situational characteristics on measures of training effectiveness." Academy of
Management Journal 35, 4: 828-847.
Mathieu Richard G. and Khalil Omar (1998). "Data Quality in the Database Systems
Course." Data Quality, 4,1.
McCahon Cynthia S., Margaret J. Rys and Kenneth H. Ward (1996). "The impact of
training technique on the difficulty of quality improvement problem solving."
Industrial Management & Data Systems 96, 7: 24-31.
McNamara, Carter, PhD. General Guidelines for conducting Interviews, Minnesota,
1999.
Mertler C A. & Vannatta R.A (2005). Advanced and multivariate statistical methods
CA: Pyrczak, Glendale.
Miller, F. J. (2002). "Information has no intrinsic meaning." Information Research 8, 1.
Montgomery, D. C. (1991). Introduction to statistical quality control New York: John
Wiley and Sons.
Morey R.C. (1982). "Estimating and improving the quality of information " MIS.
Communications of the ACM (May) 337-342.
Mount M. K. and Barrick M. R. (1998). "Five reasons why the big five article has been
frequently cited " Personnel Psychology 51, 8: 849-857.
Nadkarni, P. (2006). Delivering data on time: the Assurant Health Case Proceedings of
the Eleventh International Conference on Information Quality Boston,
November (ICIQ-06).
National Institute of Standards and Technology (2005) "Frequently asked questions
and answers about the Malcolm Baldridge National Quality Award." DOI

203
Noe R.A (1986). "Training attributes and attitudes: Neglected influences of training
effectiveness." Academy of Management Review 11, 736-749.
Noe R.A. and J.A. Colquitt (2002). Planning for training impact: principles of training
effectiveness. . Creating, Implementing, and Maintaining Effective Training and
Development: State-of-the-Art Lessons for Practice. In K. Kraiger (ed.). San
Francisco: Jossey-Bass.
Nonaka (1991). "The Knowledge Creating Company’ " Harvard Business Review, 96-
104.
Nunnally, J. C. (1978). Psychometric theory (Second ed.). New York: McGraw-Hill.
Nunamaker, J.F. Jr., Chen, M., and Purdin, T.D.M. (1991). Systems Development in
Information Systems Research, Journal of Management Information Systems,
7, 3 (Winter 1990-1991), 89-106.
Nunamaker, J. F. J., M. Chen, et al. (1990). "Systems Development in Information
Systems Research." Journal of Management Information Systems 7, 3: 89-
107.
Oakland, John S. (2003). Total Quality Management: Text with Cases Elsevier.
O'Brien Carl Chief Reporter (2010), 84,000 clinical errors in hospitals The Irish Times -
Friday, April 23, 2010.
O Cionnaith, Fiachra (2009) €60m to be paid out for medical errors Irish Examiner
Monday, October 05, 2009.
OECD. Organisation for Economic Co-operation and Development Health Data.
(2008) from
http://www.oecd.org/document/27/0,3343,en_2649_34631_40902299_1_1_1_
1,00.html.
Olson, J.E. (2003). Data Quality: The Accuracy Dimension Morgan Kaufmann.
Omachonu V K, J. A. Swift Joel E. Ross (2004). Principles of Total Quality, CRC
Press.
O’ Regan, E. (2007) One in 10 patients is a victim of hospital blunders. Irish
Independent, Wednesday 17th January .
Orr, Ken (1998). "Data Quality and Systems." Communications of the ACM, February,
41, 2: 66-71.

204
Paradice D B. and Fuerst W. L (1991) "An MIS data quality methodology based on
optimal error detection." Journal of Information Systems, 5, 1: 48-66.
Parasuraman A. V. Zeithaml and L. Berry ' (1985). "A conceptual model of service
quality and its implications for future research." Journal of Marketing, 49, 4: 41-
50.
Patterson, E.S. and Woods DD (2001). "Shift Changes, Updates, and on Call
Architecture in Space Shuttle Mission Control." Computer Supported
Cooperative Work, 10, 3-4: 317-346.
Perry S (2004) "Transitions in Care: Studying Safety in Emergency Departments
Signovers. (2004 National Patient Safety Foundations)" Focus on Patient
Safety, DOI.
Peters, J.M., and Jarvis, P. (1991). Adult education: Evolution and achievements in
developing field of study. San Francisco: Jossey-Bass.
Pierce, E. M. (2004). Developing, implementing and monitoring an information product
quality strategy. Proceedings of the 2004 international conference on
information quality Cambridge: Massachusetts Institute of Technology.
Pipino, L. L., Wang R. Y., Kopsco D. and Rybolt W. (2005). "Developing measurement
scales for data-quality dimensions." Information quality E. M. P. In R. Y. Wang,
S. E. Madnick &C. W. Fisher (Eds.), New York: M. E. Sharpe: 37-51.
Pipino, L., Lee Y. and Wang R. (2002). "Data Quality Assessment." Communications
of the ACM 4: 211-218.
RCSI http://www.medicalprotection.org/Default.aspx?DN=d81adbc5-2890-4a14-940e-
f1b5d26c9d5f
Redman T. C. (2005). Measuring data accuracy: A framework and review. Information
quality In R. Y. Wang E. M. Pierce S. E. Madnick & C. W. Fisher (Eds.). New
York: M. E. Sharpe: 21-36.
Redman TC (1994). "Data quality for telecommunications." IEEE Journal On Selected
Areas In Communications. February 12, 2: 306-312.
Redman, T. C. 1992, Data Quality: Management and Technology, New York:
Bantam Books.
Redmond TC (1995). "Improve Data Quality for Competitive Advantage."Sloan
Management Review: 99-107.

205
Redmond, T. (1996). "Data Quality for the Information Age." Norwood MA: Artec
House.
Redmond, T.C. (1998). "The impact of poor quality on the typical enterprise".
Communications of the ACM, 41,2: 79-82.
Rollier, B. (1993). "A Database Project: Maximizing Its Value." Journal of Information
Systems Eduction, 5 : 36-41.
Rosemann, M. and Vessey, I. (2008). Toward Improving the Relevance of Information
Systems Research to Practice: The Role of Applicability Checks. MIS Quarterly
32, 1, 1-22.
Rossi, M. and Sein, M. (2003). “Design Research Workshop: A Proactive Research
Approach”, Presentation delivered at IRIS 26, August 9–12, 2003, presentation
slides available at
http://tiesrv.hkkk.fi/iris26/presentation/workshop_designRes.pdf, (accessed 15
October, 2005).
Sackeim, H.A. (1983). Self-deception, self-esteem, and depression: The adaptive
value of lying to oneself. Hillsdale, NJ: Erlbaum.
Sadler Blair L, J. D. (2006). Journal on Quality and Patient Safety 32,1.
Saks A.M (1995). "Longitudinal field investigation of the moderating and mediating
effects of self-efficacy on the relationship between training and newcomer
adjustment", Journal of Applied Psychology, 80, 2:211-25.
Scannapieco M., Pernici B. and Pierce E.M. (2005). IP-UML. In R. Y. Wang, E.
M.Pierce, S. E. Madnick & C. W. Fisher (Eds.) New York: M. E. Sharpe.
Schmidt R.A. and Bjork R.A. (1992). "New conceptualizations of practice: Common
principles in three paradigms suggest new concepts for training." Psychol. Sci.
3: 207-217.
Seddon Peter B. Staples Sandy. Patnayakuni Ravi. Bowtell Matthew. Ernst & Young
(1999). "Research methodology " Communications of the Association for
Information Systems 2, 20: 2-60 .
Shankaranarayanan G., Wang R. Y. and Ziad M (2000). IP-MAP: Representing the
manufacture of an information product. In B. D. Klein & D. F. Rossin (Eds.).
Proceedings of the 2000 international conference on information quality.
Cambridge: Massachusetts Institute of Technology.
206
Shewhart W. A. (1931) Economic Control for Quality of Manufactured Product. New
York: Van Nostrand Publishing.
Smith-Jentsch K.A., Salas E. and Brannick M. (2001). "To transfer or not to transfer?
An investigation of the combined effects of trainee characteristics and team
transfer environments."J. Appl. Psychol. In press.
Smith G. F. (1993). "The meaning of quality " Total Quality Management 4, 3: 235-244.
Snell S. and Dean J. (1992). "Integrated manufacturing and human resource
management: a human capital perspective", Academy of Management Journal,
35, 3: 467-504.
Soin (1998). Total Quality Essentials: Using Quality Tools and Systems to Improve and
Manage Your Business, McGraw-Hill Professional.
Stephens K.S. and Juran J.M (2005). American Society for Quality.
Strong Dianne, M. Lee, Yang W. and Wang Richard Y. (1997). "Data Quality in
Context" Communications of the ACM 40, 5: 103-109.
Stvilia B., Gasser L., Twidale M.B. and Smith L.C. (2007). "A framework for information
quality assessment". Journal of the American Society for Information Science
and Technology. 58, 12: 1720-1733.
Tannenbaum S., J. Mathieu., E. Salas and J. Cannon-Bowers (1991). "Meeting
trainees' expectations: The influence of training fulfillment on the development
of commitment, self efficacy, and motivation " Journal of Applied Psychology,76
:759-769.
Tannenbaum S.I. (1997). "Enhancing continuous learning: diagnostic findings from
multiple companies." Hum. Res. Manage.36: 437-452..
Tayi G.K. and Ballou D.P. (1998 ). "Examining data quality " Communications of the
ACM 41, 2: 54-57.
Thayer P.W. and Teachout, M. (1995). A Climate for Transfer Model. Rep. AL/HR-TP-
1995- 0035, Air Force Mat. Command Brooks Air Force Base, Tex.
Toronto General Hospital, University Health Network, Toronto, Ontario, Canada
http://www.ncbi.nlm.nih.gov/pubmed/18780806?ordinalpos=1&itool=EntrezSyst
em2.PEntrez.Pubmed.Pubmed_ResultsPanel.Pubmed_DiscoveryPanel.Pubm
ed_Discovery_RA&linkpos=1&log$=relatedarticles&logdbfrom=pubmed

207
Tracey J.B., S.I. Tannenbaum and M.J. Kavanagh. (1995). "Applying trained skills on
the job: the importance of the work environment ." Journal of Applied
Psychology, 80, 2: 239-252.
University of Ribat, Khartoum, Sudan. Department of Community Medicine.
http://www.ncbi.nlm.nih.gov/pubmed/17333840?ordinalpos=34&itool=EntrezSystem2.
PEntrez.Pubmed.Pubmed_ResultsPanel.Pubmed_DefaultReportPanel.Pubme
d_RVDocSum
U.S. Dept. of Defense (1997) "DoD Guidelines on data quality management." Defense
Information Systems Agency, DOI:
Van Eaton, EG Horcath KD., Loer W.B. & Pellegrini, C.A. (2004). "Organizing the
transfer of patient care information: the development of a computerized
resident Sign Out System." Surgery, July 2004 136: 1.
Wand Y. and Wang R.Y. (1996). "Anchoring data quality dimensions in ontological
foundations." Communications of the ACM 39, 11: 86-95.
Wand Y. and Weber R. (1989). An ontological evaluation of systems analysis and
design methods, Information System Concepts: An In-depth Analysis.
i.ED.F.a.P.L.(Eds.). Amsterdam, North-Holland: 79-107.
Wang R.Y. (1998). "A product perspective on total data quality management."
Communications of the ACM, 41, 2: 58-65.
Wang R., Zaid M. and Lee Y. (2001). Data Quality Kluwer Academic Publishers.
Wang, R. Y. and Strong, D. M. 1996, 'Beyond Accuracy: What Data Quality Means to
Data Consumers', Journal of Management Information Systems, 12, 4: 5-34.
Wang R.Y., V. Storey and C. Firth (1995). "A framework for analysis of data quality
research." IEEE Transactions on Knowledge and Data Engineering, 7, 4: 623-
640.
Wang R.Y. and H. B. Kon. (1993). Toward total data quality management. In
Information technology in action: Trends and perspectives, Englewood Cliffs,
New Jersey: Prentice Hall.
Wang R.Y., Lee Y.W., Pipino L.L. and Strong D.M (1998). "Manage your information
as a product." Sloan Management Review 39, 4: 95-105.
208
Wang R.Y. and M. P. Reedy (1993). Quality data objects. Working paper TDQM-92-
06, MIT TDQM Research Program, E53-320, 50 Memorial Drive, Cambridge,
Ma. 02139.
Wang Richard, Diane Strong and Lisa Guarascio (1994). An empirical investigation of
data quality dimensions: A data consumer's perspective. TDQM-94-01,MIT
TDQM Research Program, E53-320, 50 Memorial Drive, Cambridge, Ma.
02139.
Wheeler S. and Duggins S. (1998). "Improving software quality." ACM 300-309.
Whetten, D. A. (1989). "What Constitutes a Theoretical Contribution?" Academy of
Management Review 14, 4: 490-495.
Wilson T. D. and Walsh C. (1996). Information behaviour: an interdisciplinary
perspective. Sheffield: University of Sheffield, Department of Information
Studies.
Yamnill Siriporn and McLean Gary N. (2001). "Theories Supporting Transfer of
Training." Human Resource Development Quarterly 2, 2.
Zeithaml V.A., Berry L.L. and Parasuraman A. (1990). Delivering Quality Service:
Balancing Customer Perceptions and Expectations. New York, NY: Free
Press.

209
Appendix A: Medical Error Studies Study Participant
s Discharge Documents
Admittance Documents
Medication Charts
Incomplete Prescription
Inconsistent Prescriptions
Medication inaccuracy
Discrepancies Medical Errors
Affected Patients
Drug omission / Commission
RCSI April, 2008 139 � 10.8% 65.5% 20.9%
Toronto General Hospital, 2006 150 � 70.7% 29.5% 22.9%.
Dept of Pharmacy, Sunnybrook, Toronto, ,
151 � 53.6% 38.6% 46.4%
Faculty of Medicine, University of Ottawa,
22 studies (3755)
� 67% 19%- 75% 11%-59% 60%- 67%
Clinic of Internal Medicine Bispebjerg Hospital, Copenhagen,
200 � � 7% 19%
Markham Stouffville Hospital, Canada
60 � � 60% 18%
Clinical Pharmacology, Auckland Hospital, New Zealand.
100 � � � 8.58% 1.70%
Tåbelund Primary Health Care Centre, Eslöv, Sweden
69 � � 18.7%
Dept of Community Medicine, University of Ribat ,Khartoum,.
1000
� 80.5% 59.7%
Klinik für Anästhesiologie-AG Allgemeinmedizinische ersorgung, Universitätsklinikum Schleswig-Holstein, Campus, Lübeck
536 � 58%
University of California, Dept of Medicine, Los Angeles.
122 � 83%
Division of General Medicine, Brigham & Women's Hospital, Boston, USA.
180 � � 72% 12%
Hospital Pharmacy, Roskilde Hospital, Denmark
75 � � 2-7% 13%
Dept of Pharmacy, Medical Center, Phoenix, Arizona
851 � 3.3%
Nottingham University Hospitals, UK
108 � 66.6% 38%
State University Family Physicians of Kingsport, USA
157 97% 32%
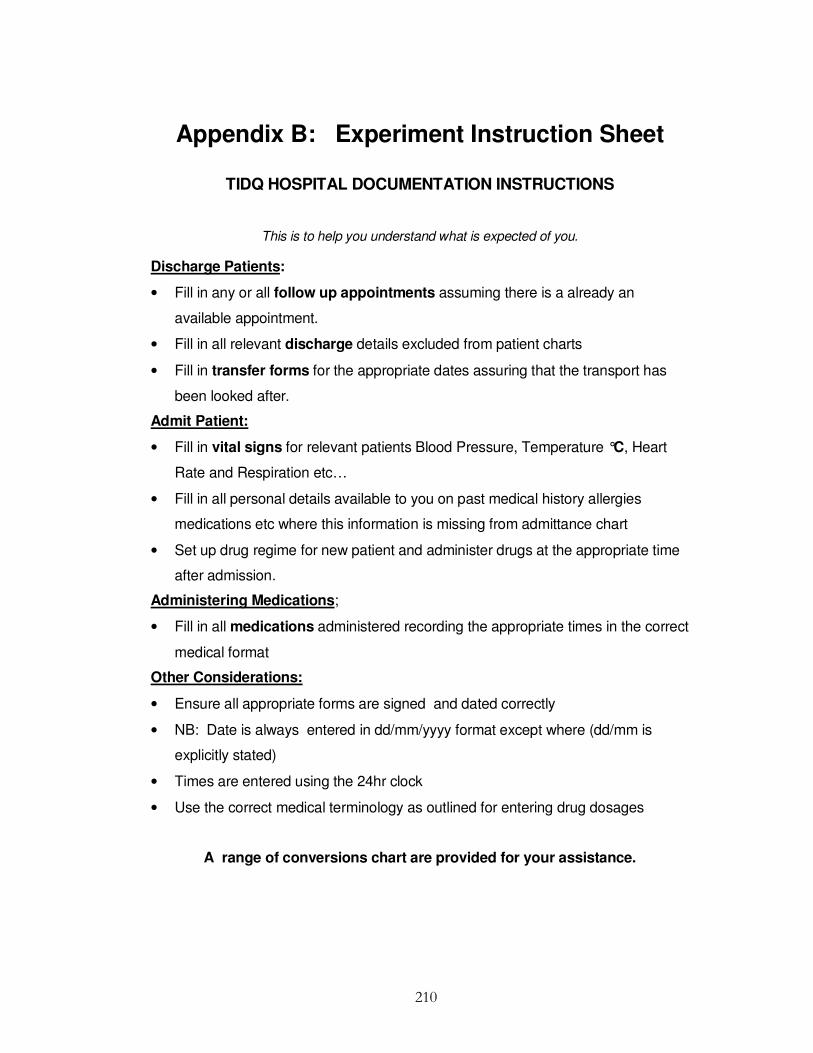
210
Appendix B: Experiment Instruction Sheet
TIDQ HOSPITAL DOCUMENTATION INSTRUCTIONS
This is to help you understand what is expected of you.
Discharge Patients:
• Fill in any or all follow up appointments assuming there is a already an
available appointment.
• Fill in all relevant discharge details excluded from patient charts
• Fill in transfer forms for the appropriate dates assuring that the transport has
been looked after.
Admit Patient:
• Fill in vital signs for relevant patients Blood Pressure, Temperature °C, Heart
Rate and Respiration etc…
• Fill in all personal details available to you on past medical history allergies
medications etc where this information is missing from admittance chart
• Set up drug regime for new patient and administer drugs at the appropriate time
after admission.
Administering Medications;
• Fill in all medications administered recording the appropriate times in the correct
medical format
Other Considerations:
• Ensure all appropriate forms are signed and dated correctly
• NB: Date is always entered in dd/mm/yyyy format except where (dd/mm is
explicitly stated)
• Times are entered using the 24hr clock
• Use the correct medical terminology as outlined for entering drug dosages
A range of conversions chart are provided for your assistance.

211
Appendix C: NEO_PI Personality Test
NEO PI-R PERSONALITY TEST FOR EXPERIMENT
ASSERTIVENESS (Alpha = .84)
Very Inaccurate
Moderately Inaccurate
Neither Inaccurate / Accurate
Moderately Accurate
Very Accurate
+
Take charge. � � � � �
Try to lead others � � � � �
Can talk others into doing things. � � � � �
Seek to influence others. � � � � �
Take control of things. � � � � �
- Wait for others to lead the way. � � � � �
Keep in the background. � � � � �
Hold back my opinions. � � � � �
Have little to say � � � � �
Don’t like to draw attention to myself
� � � � �
Hold back on my opinions � � � � �
INTELLECT (Alpha = .86) Very Inaccurate
Moderately Inaccurate
Neither Inaccurate / Accurate
Moderately Accurate
Very Accurate
+
Like to solve complex problems. � � � � �
Love to read challenging material � � � � �
Very Inaccurate
Moderately Inaccurate
Neither Inaccurate or Accurate
Moderately Accurate
Very Accurate
Have a rich vocabulary � � � � �
Can handle a lot of information. � � � � �
Enjoy thinking about things. � � � � �
-
Am not interested in abstract ideas.
� � � � �
Avoid philosophical discussions. � � � � �
Have difficulty understanding abstract ideas
� � � � �
Am not interested in theoretical discussions
� � � � �
Avoid difficult reading material. � � � � �
SELF-EFFICACY (Alpha = .78) Very
Inaccurate Moderately Inaccurate
Neither Inaccurate or Accurate
Moderately Accurate
Very Accurate
+
Complete tasks successfully. � � � � �
Excel in what I do. � � � � �
Handle tasks smoothly. � � � � �
Am sure of my ground. � � � � �
Come up with good solutions. � � � � �
Very Inaccurate
Moderately Inaccurate
Neither Inaccurate or Accurate
Moderately Accurate
Very Accurate
Know how to get things done. � � � � �
-
Misjudge situations. � � � � �
Don't understand things. � � � � �
Have little to contribute. � � � � �
Don't see the consequences of things.
� � � � �

212
ORDERLINESS (Alpha = .82) Very Inaccurate
Moderately Inaccurate
Neither Inaccurate or Accurate
Moderately Accurate
Very Accurate
+
Like order. � � � � �
Like to tidy up. � � � � �
Want everything to be "just right." � � � � �
Love order and regularity. � � � � �
Do things according to a plan. � � � � �
- Often forget to put things back in their proper place.
� � � � �
Leave a mess in my room � � � � �
Leave my belongings around � � � � �
Am not bothered by messy people.
� � � � �
Very Inaccurate
Moderately Inaccurate
Neither Inaccurate or Accurate
Moderately Accurate
Very Accurate
Am not bothered by disorder. � � � � �
DUTIFULNESS (Alpha = .71) Very
Inaccurate Moderately Inaccurate
Neither Inaccurate or Accurate
Moderately Accurate
Very Accurate
+
Try to follow the rules. � � � � �
Keep my promises. � � � � �
Pay my bills on time. � � � � �
Tell the truth. � � � � �
Listen to my conscience. � � � � �
- Break rules. � � � � �
Break my promises. � � � � �
Get others to do my duties. � � � � �
Misrepresent the facts. � � � � �
Do the opposite to what is asked � � � � �
ACHIEVEMENT-STRIVING (Alpha = .78)
Very Inaccurate
Moderately Inaccurate
Neither Inaccurate or Accurate
Moderately Accurate
Very Accurate
+
Go straight for the goal � � � � �
Very Inaccurate
Moderately Inaccurate
Neither Inaccurate or Accurate
Moderately Accurate
Very Accurate
Work hard. � � � � �
Turn plans into actions. � � � � �
Plunge into tasks with all my heart
� � � � �
Do more than what's expected of me
� � � � �
Set high standards for myself and others.
� � � � �
Demand quality. � � � � �
-
Am not highly motivated to succeed.
� � � � �
Do just enough work to get by. � � � � �
Put little time and effort into my work.
� � � � �

213
SELF-DISCIPLINE (Alpha = ..85) Very Inaccurate
Moderately Inaccurate
Neither Inaccurate or Accurate
Moderately Accurate
Very Accurate
+
Get chores done right away. � � � � �
Am always prepared. � � � � �
Start tasks right away. � � � � �
Get to work at once. � � � � �
Carry out my plans. � � � � �
- Find it difficult to get down to work.
� � � � �
Very Inaccurate
Moderately Inaccurate
Neither Inaccurate or Accurate
Moderately Accurate
Very Accurate
Waste my time. � � � � �
Need a push to get started. � � � � �
Have difficulty starting tasks. � � � � �
Postpone decisions. � � � � �
CAUTIOUSNESS (Alpha = .76) Very Inaccurate
Moderately Inaccurate
Neither Inaccurate or Accurate
Moderately Accurate
Very Accurate
+
Choose my words with care. � � � � �
Stick to my chosen path. � � � � �
Avoid Mistakes � � � � �
-
Jump into things without thinking. � � � � �
Make rash decisions. � � � � �
Like to act on a whim � � � � �
Rush into things. � � � � �
Do crazy things � � � � �
Act without thinking � � � � �
Often make last minute plans � � � � �
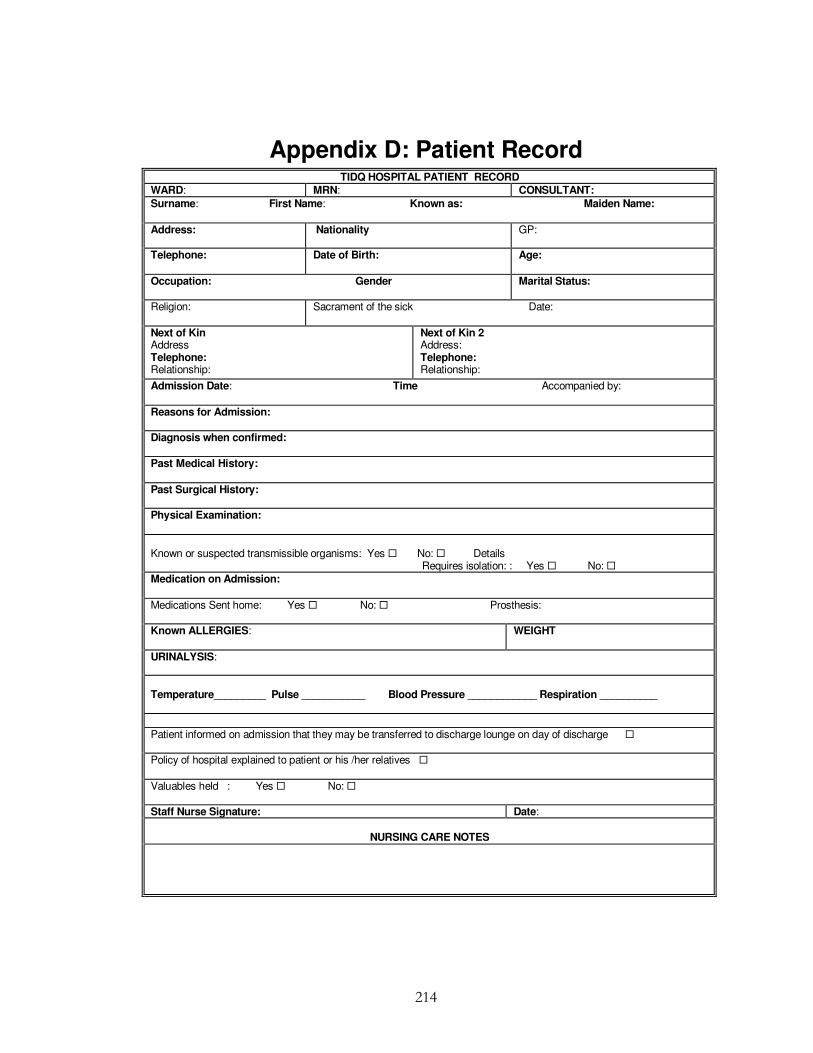
214
Appendix D: Patient Record TIDQ HOSPITAL PATIENT RECORD
WARD: MRN: CONSULTANT:
Surname: First Name: Known as: Maiden Name:
Address:
Nationality GP:
Telephone: Date of Birth: Age:
Occupation: Gender Marital Status:
Religion: Sacrament of the sick Date:
Next of Kin Address Telephone: Relationship:
Next of Kin 2 Address: Telephone: Relationship:
Admission Date: Time Accompanied by:
Reasons for Admission:
Diagnosis when confirmed:
Past Medical History:
Past Surgical History:
Physical Examination:
Known or suspected transmissible organisms: Yes � No: � Details Requires isolation: : Yes � No: � Medication on Admission:
Medications Sent home: Yes � No: � Prosthesis:
Known ALLERGIES: WEIGHT
URINALYSIS: Temperature_________ Pulse ___________ Blood Pressure ____________ Respiration __________
Patient informed on admission that they may be transferred to discharge lounge on day of discharge � Policy of hospital explained to patient or his /her relatives �
Valuables held : Yes � No: �
Staff Nurse Signature: Date:
NURSING CARE NOTES

215
PATIENT NAME: MRN
Day of Discharge
Diet sheet: � Doctors Letter: � Prescription: � Outpatient appointment: �
I.V. Cannula removed: � Transfer Letter: � Transferred to Discharge Lounge: � Comments / instructions given:
Valuables returned: Discharged to Date Time:
Signature:
PATIENT’S NAME
MRN:
TIDQ HOSPITAL LABS ORDERED
Date:
Investigations: Results:
Prior to Discharge
For Discharge to: Date:
Next of Kin informed of discharge: Yes � No: � Name:
Liaison Nurse informed? Yes � No � N/A � Home Help informed: Yes � No � N/A �
Convalescence required? Yes � No � N/A � Booked? Yes � No � N/A �
Public Health Nurse informed? Yes � No � N/A � Meals on Wheels? Yes � No � N/A � Day Hospital informed? Yes � No � N/A � Home Visit Yes � No � N/A � Date ___________
Comments:
Transport required? Yes � No � Booked Yes � No � N/A � Date _____________
Equipment required on discharge? ________________Ordered Yes � No � N/A � Date _____________ Type – please Specify:
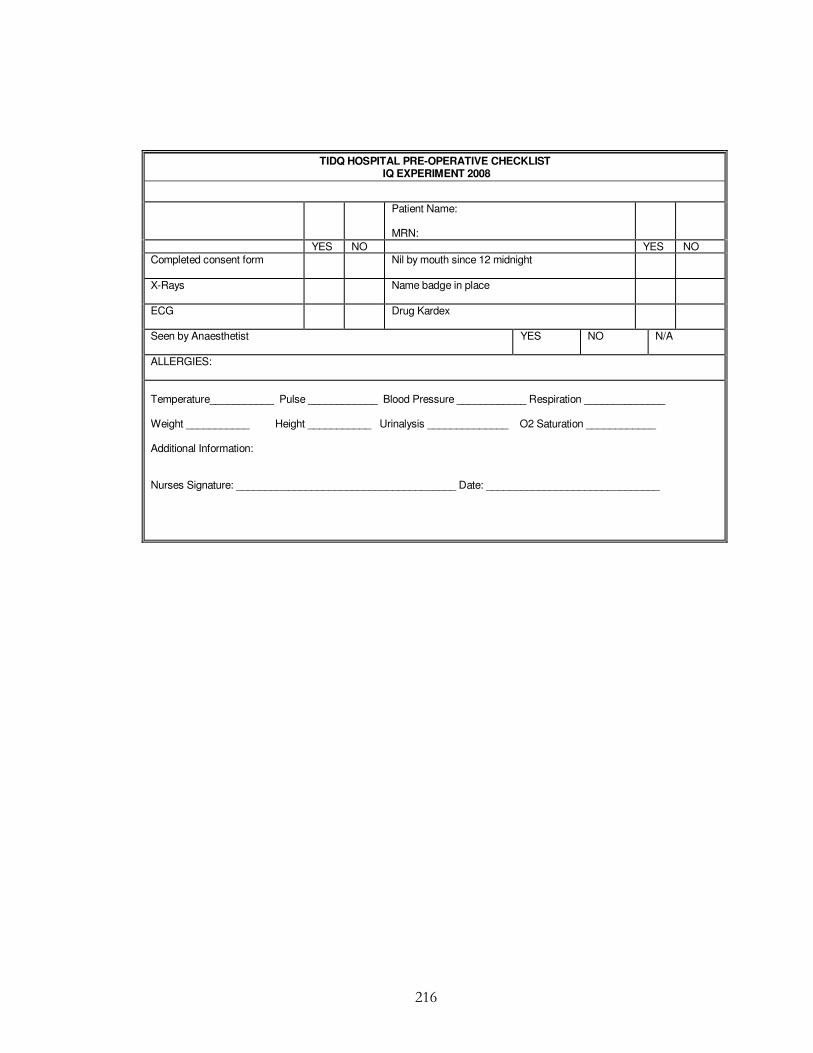
216
TIDQ HOSPITAL PRE-OPERATIVE CHECKLIST IQ EXPERIMENT 2008
Patient Name: MRN:
YES NO YES NO Completed consent form
Nil by mouth since 12 midnight
X-Rays
Name badge in place
ECG
Drug Kardex
Seen by Anaesthetist
YES NO N/A
ALLERGIES: Temperature___________ Pulse ____________ Blood Pressure ____________ Respiration ______________ Weight ___________ Height ___________ Urinalysis ______________ O2 Saturation ____________ Additional Information: Nurses Signature: ______________________________________ Date: ______________________________

217
PATIENT OBSERVATION CHART
IQ EXERIMENT 2008
Show daily (morning) or more frequent if required
Date:
SURNAME FIRST NAMES MRN No:
Frequency
Date
Time
C
250
240 230
220 210
200 190
180 170 160
150 140
130 120
110 100
Blo
od p
ress
ure
90 80
70 60
50
Puls
e
40
30
20 10
Respirati
on
0
BP
RR
T
HR/P
Signature

218
TIDQ HOSPITAL DRUG PRESCRIPTION AND ADMINISTRATION RECORD (MUST USE A LEADING 0 BEFORE A DECIMAL POINT)
REGULAR MEDICATION CHART TIME ADMINISTERED BY INTIIALS
Start Date
Date/ Month �
Drug Time � Dose Frequency Route
REGULAR MEDICATION CHART TIME ADMINISTERED BY INTIIALS
Start Date
Date/ Month �
Drug Time �
Dose
Frequency
Route
REGULAR MEDICATION CHART TIME ADMINISTERED BY INTIIALS
Start Date
Date/ Month �
Drug Time �
Dose
Frequency
Route
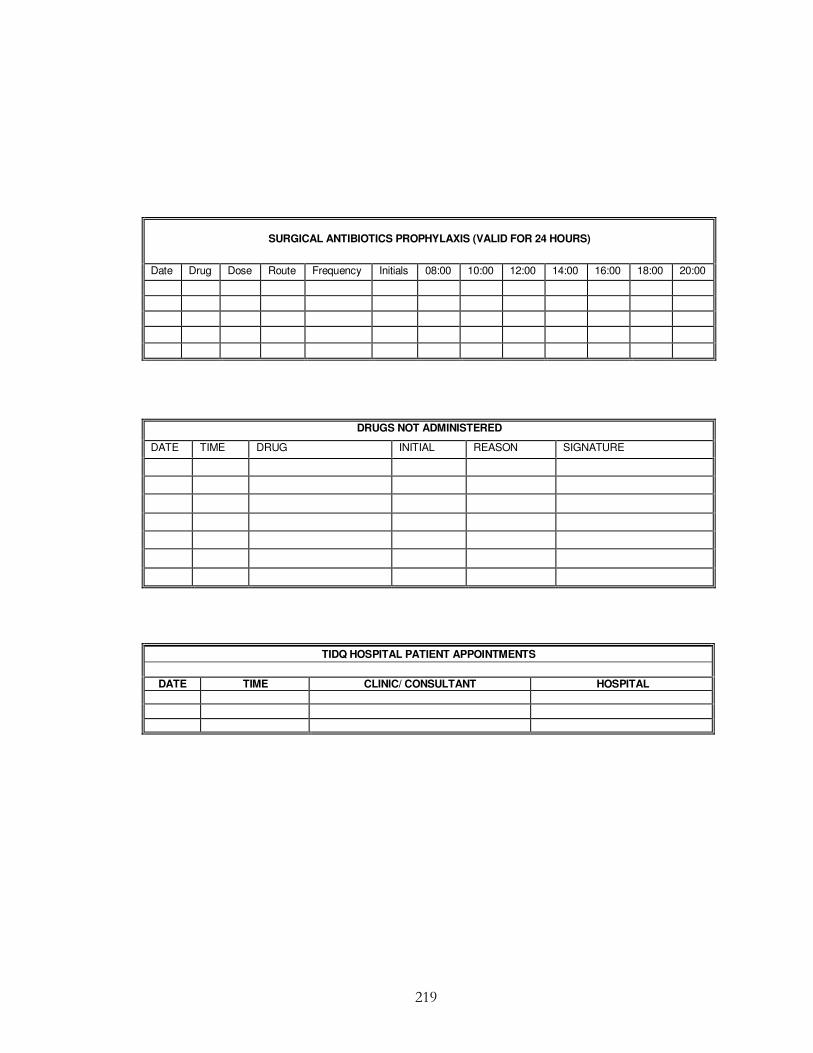
219
SURGICAL ANTIBIOTICS PROPHYLAXIS (VALID FOR 24 HOURS)
Date Drug Dose Route Frequency Initials 08:00 10:00 12:00 14:00 16:00 18:00 20:00
DRUGS NOT ADMINISTERED
DATE TIME DRUG INITIAL REASON SIGNATURE
TIDQ HOSPITAL PATIENT APPOINTMENTS
DATE TIME CLINIC/ CONSULTANT HOSPITAL
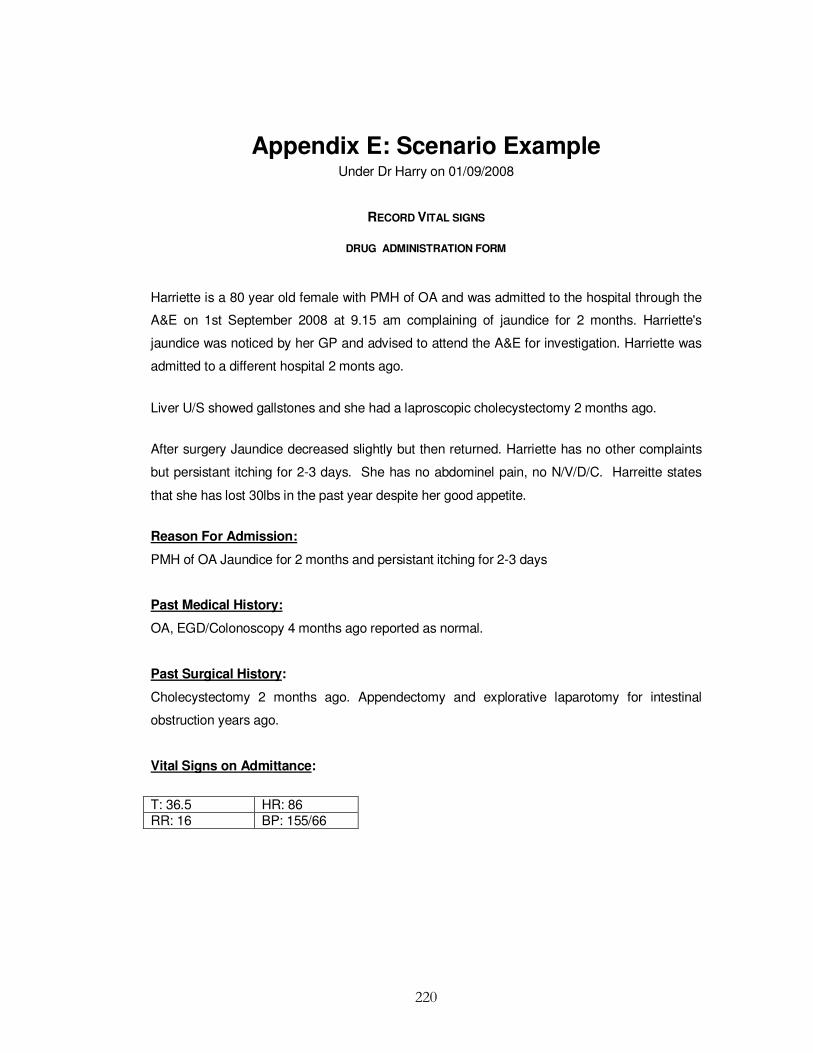
220
Appendix E: Scenario Example Under Dr Harry on 01/09/2008
RECORD VITAL SIGNS
DRUG ADMINISTRATION FORM
Harriette is a 80 year old female with PMH of OA and was admitted to the hospital through the
A&E on 1st September 2008 at 9.15 am complaining of jaundice for 2 months. Harriette's
jaundice was noticed by her GP and advised to attend the A&E for investigation. Harriette was
admitted to a different hospital 2 monts ago.
Liver U/S showed gallstones and she had a laproscopic cholecystectomy 2 months ago.
After surgery Jaundice decreased slightly but then returned. Harriette has no other complaints
but persistant itching for 2-3 days. She has no abdominel pain, no N/V/D/C. Harreitte states
that she has lost 30lbs in the past year despite her good appetite.
Reason For Admission:
PMH of OA Jaundice for 2 months and persistant itching for 2-3 days
Past Medical History:
OA, EGD/Colonoscopy 4 months ago reported as normal.
Past Surgical History:
Cholecystectomy 2 months ago. Appendectomy and explorative laparotomy for intestinal
obstruction years ago.
Vital Signs on Admittance:
T: 36.5 HR: 86 RR: 16 BP: 155/66

221
Medications:
Celebrex 200mg (100mg BID) PO
Arthrotec 225mg 3 timed daily PO
ASA 81 mg QD PO
FMH 2.5mg daily PO
HTN 100mg/d QD PO
Physical Examination:
WD/WN in NAD, visible skin and scleral icterus
No stigmata or chronic liver disease
Abdomen: soft, NT, ND, + BS, 4 'keyhole scars form the laparoscopic cholecystectomy, old
laparotomy scar.
Weight: 58kg
Labs:
CBCD
CMP
UA
Liver U/S or CT of the Abdomen and pelvis
Alergies None
Biographical data
Name Harriette Cash Gender Female
M.R.N. B012 Address 25 Alderwood Avenue, Swords, Co Dublin
Phone(H 01- 2599515 Marital Status Married
Occupation Carpenter Nationality Irish
Religion RC GP Dr Moodley
Consultant Dr Harry

222
Appendix F: Plain Language Statement
DUBLIN CITY UNIVERSITY BUSINESS SCHOOL/NURSING /COMPUTING
Project:________________________________________________________________________________
Introduction
_____________________________________________________________________________________________________________
_____________________________________________________________________________________________________________
_____________________________________________________________________________________________________________
What you will be asked to do?
_____________________________________________________________________________________________________________
_____________________________________________________________________________________________________________
_____________________________________________________________________________________________________________
Are there any potential risks?
_____________________________________________________________________________________________________________
_____________________________________________________________________________________________________________
_____________________________________________________________________________________________________________
How will your confidentiality be protected?
_____________________________________________________________________________________________________________
_____________________________________________________________________________________________________________
Are there any Benefits (direct or indirect) from involvement in the Research Study?
_____________________________________________________________________________________________________________
_____________________________________________________________________________________________________________
How will you receive feedback?
_____________________________________________________________________________________________________________
_____________________________________________________________________________________________________________
_____________________________________________________________________________________________________________
Will participation prejudice you in any way?
_____________________________________________________________________________________________________________
_____________________________________________________________________________________________________________
Where can you get further information?
_____________________________________________________________________________________________________________
_____________________________________________________________________________________________________________
_____________________________________________________________________________________________________________
How do you agree to participate?
_____________________________________________________________________________________________________________
_____________________________________________________________________________________________________________
If participants have concerns about this study and wish to contact an independent person please
Contact:
Tel _______________________________________________________________________________

223
Appendix G: Informed Consent Form
DUBLIN CITY UNIVERSITY
Informed Consent Form for Persons Participating in Research Project
PROJECT TITLE:
Name of participant:
Name of investigator(s): (Lecturer/Researcher),
1. I have read the plain language statement and I consent to participate in the project named above, the
particulars of which have been explained to me. A written copy of the information has been given to me to
keep.
2. I authorize the researcher to use for this purpose the results of my practical test and documentation
referred to under (1) above.
3. I acknowledge that this research is for the purpose of Mary Levis’s PhD thesis and contribution to
knowledge.
(a) My involvement requirement has been explained to me to my satisfaction:
(b) I have been informed that I am free to withdraw from the project at any time without explanation or
prejudice and to withdraw any unprocessed data previously supplied;
(c) The project is for the purpose of research
I have been informed that the confidentiality of the information I provide will be safeguarded subject to any
legal requirements.
I have been informed that participation or non participation in this study does in no way effect my grades
for the information management module
I have read and understood the information in this form. My questions and concerns have been answered
by the researchers, and I have a copy of this consent form. Therefore, I consent to take part in this
research project
Signature: Participants Signature:
Name in Block Capitals:-----------------------------
Witness: -----------------------------
Date:----------------------------- Student ID----------------------------
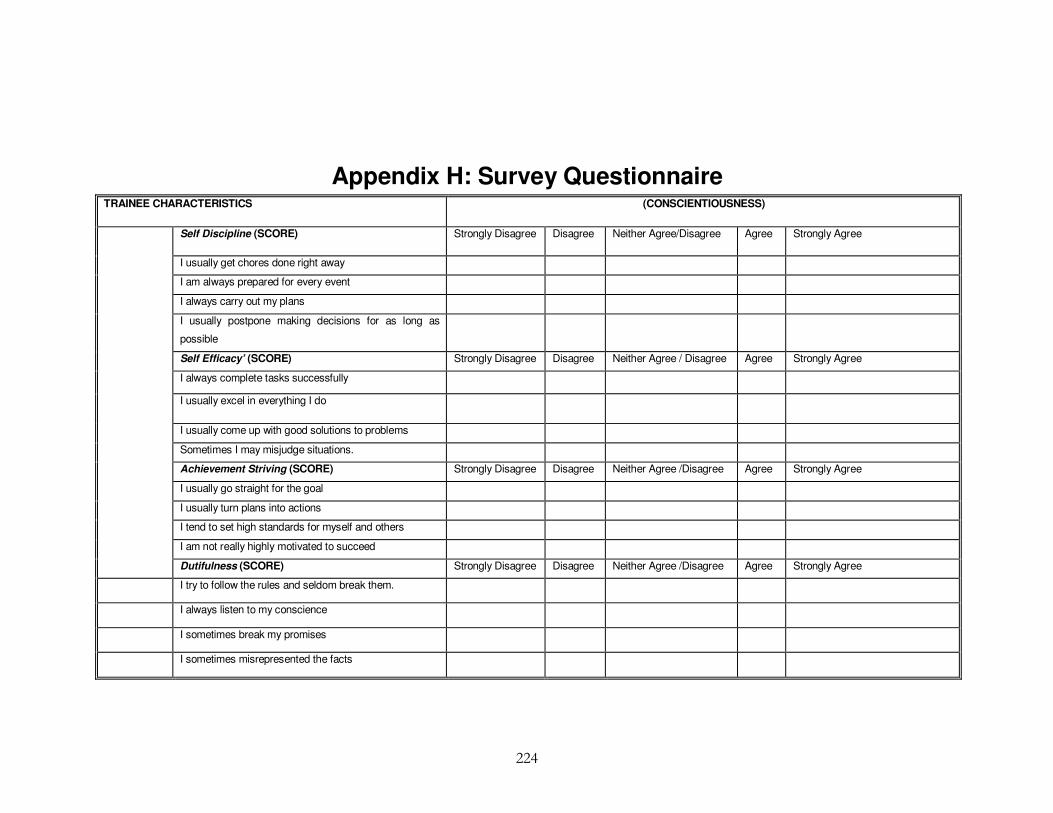
224
Appendix H: Survey Questionnaire TRAINEE CHARACTERISTICS (CONSCIENTIOUSNESS)
Self Discipline (SCORE) Strongly Disagree Disagree Neither Agree/Disagree Agree Strongly Agree
I usually get chores done right away
I am always prepared for every event
I always carry out my plans
I usually postpone making decisions for as long as
possible
Self Efficacy’ (SCORE) Strongly Disagree Disagree Neither Agree / Disagree Agree Strongly Agree
I always complete tasks successfully
I usually excel in everything I do
I usually come up with good solutions to problems
Sometimes I may misjudge situations.
Achievement Striving (SCORE) Strongly Disagree Disagree Neither Agree /Disagree Agree Strongly Agree
I usually go straight for the goal
I usually turn plans into actions
I tend to set high standards for myself and others
I am not really highly motivated to succeed
Dutifulness (SCORE) Strongly Disagree Disagree Neither Agree /Disagree Agree Strongly Agree
I try to follow the rules and seldom break them.
I always listen to my conscience
I sometimes break my promises
I sometimes misrepresented the facts

225
TRAINING
Duration of documentation training program I attended were usually adequate
(Interval)
Strongly
Disagree
Disagree Neither Agree
/Disagree
Agree Strongly
Agree
I have received relevant documentation training (Category) Strongly
Disagree
Disagree Neither Agree
/Disagree
Agree Strongly
Agree
Time intervals between training were usually adequate Strongly
Disagree
Disagree Neither Agree
/Disagree
Agree Strongly
Agree
Duration of documentation training program I attended were usually adequate
(Interval)
Strongly
Disagree
Disagree Neither Agree
/Disagree
Agree Strongly
Agree
The effectiveness of the training was usually Poor Fair Good Very good Excellent
There is a formal documentation recording training plan in my department (Binary) Yes � No �
Duration of documentation training I attended were usually One day or less More than one day
My Experience of documentation is Very Low Low Average High Very High
I consider my documentation recording experience as (Category) Very Low Low Average High Very High
WORK ENVIRONMENT
Information System
Patient admission forms within our organization is mainly
(Category)
Paper based � Electronic�
Peer Support
There is good peer support within the organization?(Binary) YES NO
Form Layout
The admission form layout is mainly (Category) Free Style Tick Box
The work environment is Poor Fair Average Good Excellent

226
DOCUMENTATION QUALITY
Experiment Survey
Completeness How often do you find… Ratio % Never Seldom Sometimes Usually Always
Patient MRN number not filled in on patient admission forms? (Category)
Incomplete histories in on patient admission forms? (Category)
Signatures filled in on patient admission forms? (Category)
Date of Birth (DOB) not filled in on patient admission forms? (Category)
You have to fill in missing admission data not already recorded in patient admission forms ?
(Category)
Patient’s full address in patient admission forms? (Category)
Patient MRN number not filled in on patient admission forms? (Category)
Consistency How often do you find… Ratio % Never Seldom Sometimes Usually Always
The date of admission in patient forms always filled in admission form in a consistent format?
(Category)
The patient Date of Birth (DOB) on admission form written in a non consistent format?
(Category)
Weight of patient recorded in the admission form in a consistent format? (Category)
Accuracy How often do you find… Ratio % Never Seldom Sometimes Usually Always
Typography errors in patient name on admission forms (Category)
Wrong MRN number recorded on Patient admission form (Category)
You need to make corrections to data recorded in patient admission forms (Category)
Patient Date of Birth (DOB) recorded accurately on admission forms (Category)

227
DEMOGRAPHICS INFORMATION
Gender: (Category) Male Female
Hospital Country (Nominal) ______________________________________________
Hospital County (if Ireland) (Nominal) ______________________________________________
Nationality: (Category) Irish UK EU (except Ireland & UK) Non EU
Profession: (Category) Physician Nurse Administration Staff Clerk Other
How long are you employed with the organization 0-1 yr 2-3 yrs 3-4 yrs 5-6 yrs Over 7 yrs
How would you rate quality of documented information in your department? (Category) Very High High Medium Low Very Low
Overall are I am satisfied with the quality of patient admission information in my organisation?
(Category)
Strongly Agree Agree Neither agree /Disagree Disagree Strongly
Disagree
What Documentation Training have you received in the last 5 years? (please tick all that
apply) (Category)
Conferences Seminars Workshops Other Training None
How many training days have you attended in the past calendar year? None 1-2 days 3-4 days 5-6 days Over 6
days
Of the training days what percentage was specifically dedicated to information recording 0% 1-10% 11-20% 21-30% Over 30%
My primary learning style is Visual Auditory Tactile/ kinaesthetic Mixed All of
these
Consequence of not recording information correctly is: Negligible Low Moderate High Very high
Difficulty of recording information is Very easy Easy Moderate Difficult Very
difficult
Frequency I record information is: Never Seldom Occasionally Often Very often
Time spent recording information relative to other duties is: 0% 1-25% 26-50% 51-75% 76-100%
I like to train at A steady pace Fits and starts
Organisations would benefit from further IQ training YES NO
Trainee characteristics impact on documentation recording YES NO
Consistency Ratio % Very High High Medium Low Very Low