commitment to our clients, partners and ... -...
TRANSCRIPT

Commitment to our clients, partners and people
2015 ANNUAL REPORT
FROM OUR CHAIRMAN
In 2012, the CSC Board of Directors authorized the transfor-mation of the company to drive efficiency, profitability and overall performance. Under the bold and creative leadership of President and Chief Executive Officer Mike Lawrie, CSC has implemented a common operating model, realized significant cost savings and new revenue streams, and aggressively pursued leadership in next-generation solutions. All of these actions have contributed to stronger financial performance and improved growth potential.
We continued to build on this progress over the past year. Non-GAAP earnings per share and free cash flow again improved in fiscal year 2015, and the company’s balance sheet remained strong, with $2.1 billion in cash on hand. Compared with fiscal year 2012, the market capitalization of CSC has more than doubled, and we continue to return cash to our shareholders. Since CSC resumed share buybacks in the third quarter of fiscal year 2013, the company has repurchased over $1.5 billion in stock.
With the successful completion of the “get fit” phase of the turnaround, we have intensified our commitment to driving the company’s growth and market leadership. As the transformation reached a new stage this year, the Board unanimously approved the separation of the company into two publicly traded, pure-play leaders: one to serve com-mercial and government clients globally and one to serve public sector clients in the United States.
This initiative will enable both companies to tightly align with unique customer needs while better optimizing capital strategies and cost structures to create long-term value and opportunities for investors. Concurrent with the separation, CSC intends to pay a special cash dividend to shareholders of $10.50 per share at the expected October 2015 closing.
This year the Board also authorized a series of targeted investments in our clients, partners and people to better position the company for growth. We drove additional improvement across the business by investing to help employees develop skills and find new opportunities, funding the creation of leading solutions like CSC MyWorkStyle, and providing resources to expand our partnerships with Amazon Web Services, IBM and others.
The independence and experience of the CSC Board of Directors translate into objective guidance and sound risk mitigation for the company. This year we were pleased to welcome two highly accomplished new Board members: Bruce Churchill, executive vice president of DIRECTV, and the Honorable Sean O’Keefe, former chief executive officer of Airbus Group Inc. and a previous administrator of NASA. Each brings to the Board extensive expertise in global business and in industries relevant to CSC.
Given our rapid progress over the past three years, I am optimistic that our two world-class CSC companies will capture new opportunities and continue moving forward. We bring to the marketplace a unique mix of technology independence, global reach, skilled professionals, innovative offerings and best-of-breed partnerships. These strengths will position our commercial and public sector businesses for increased growth in fiscal year 2016 as we focus on creating, selling and delivering the next-generation offerings our clients need to realize their most ambitious visions for the future.
Thank you for being a shareholder and for your confidence in CSC.
Rodney F. Chase Chairman

CSC 2015 ANNUAL REPORT | 1
“The ‘get fit’ phase of the CSC turn-around strengthened our business and enabled the company to reach new levels of achievement as a global provider of next-generation services and solutions. As we further sharpen our focus on growth and market lead-ership, the time is right to build on our success by separating CSC into two pure-play businesses focused on serving the respective digital transfor-mation needs of today’s commercial and public sector customers.”
Rodney F. ChaseChairman

CLARITY, CONFIDENCE AND COMMUNITY
Just three years ago, CSC faced serious challenges. The company had troubled contracts and a high cost structure that reduced profitability and cash flow. Earnings were negative, the stock price had fallen to $30 per share, and market capitalization had dropped nearly 40 percent to under $5 billion. The company had become less relevant to clients and the industry, and was not well positioned for growth.
To address these challenges, CSC launched an ambitious and comprehensive turnaround program at the start of fiscal year 2013. Our goal was to capitalize on historic shifts in the IT industry and better serve our shareholders, clients, partners and employees by working to become a global leader and innovator in next-generation technology solutions.
Since then we have made great strides in transforming the company. We implemented a common operating model, strengthened our leadership team, divested non-core businesses to raise over $1 billion and realized approximately $1.9 billion in cost takeout. CSC’s cash position, profitability and market capitalization have dramatically improved as a result. Significantly, too, we began to regain the confidence of our clients and the marketplace.
This progress continued in fiscal year 2015, with CSC again delivering profitable growth and strong cash flow. Our public sector margins are now among the best in the industry,
enabling strategic reinvestment. Non-GAAP earnings per share increased 9 percent. Free cash flow grew to $717 million against $689 million in fiscal year 2014. Through share repurchases and dividends, we returned a total of $867 million to our shareholders.
Sales of next-generation offerings again accelerated this fiscal year, client satisfaction scores in our commercial business continued on a positive path, and CSC and our alliance partners won several major deals, including many new logos. Large wins included a five-year agreement with BlueScope Steel for applications modernization, partnering with AT&T and HCL Technologies; a five-year contract with Vattenfall, one of Europe’s leading energy companies, to deliver CSC MyWorkStyle to 30,000 users, also with AT&T; and a seven-year, $78 million deal to support engineering consultancy Amey with next-generation solutions.
With our strategy translating into significantly improved performance, CSC continues to receive positive feedback from independent analysts. Recently, Forrester named CSC a “Leader” in Managed Security Services (North America), among our more than 10 current “Leader” designations. Additional recognition came from CR Magazine, which named CSC a Top 100 Best Corporate Citizen for 2015.
To build on the momentum of the turnaround, we are now focused on positioning the business for long-term growth and market leadership. To that end, the CSC Board of Directors has unanimously approved a plan to separate CSC into two publicly traded, pure-play leaders. One company will serve more than 1,000 commercial and government clients globally, and the other will be a top-three indepen-dent service provider to the U.S. public sector. We believe both companies will be well positioned to grow and lead, delivering a compelling value proposition to all stakeholders.
56 Yearsof Service to the Global 2000 and Government Clients
$867 MillionReturned to Shareholders in Fiscal Year 2015

CSC 2015 ANNUAL REPORT | 3
“With the rapid progress of our transfor-mation, CSC is much more efficient, more profitable and better positioned for growth than it was three years ago. The value of CSC stock has grown more than 118 percent to $65 per share, and our market capitalization has more than doubled to over $9 billion since the close of fiscal year 2012. Today we consistently return value to our share-holders through stock repurchases and a dividend that we increased in fiscal year 2015 by 15 percent.”
Mike LawriePresident and Chief Executive Officer

Ranked #3in IT Services FORTUNE Magazine, 2015
Ranked #229in the 2015 FORTUNE 500®
As we create these two world-class businesses, we are poised to make substantial investments in our clients, partners and people to drive growth. It starts with invest-ment to ensure that our community of employees around the world brings the right mix of skills to help our clients succeed. With a new global workforce transformation initiative, we are fully committed to further enhancing our skill base to serve clients better.
As part of this strategic initiative, we are investing in an end-to-end workforce management process to better onboard, train, incent and retain skilled professionals to quickly address shifts in client demand. We will create a new success-sharing plan for our top performers at all levels while adding new training tools to the CSC University learning environment. Through partnerships with universities, we will support STEM degree programs for millennials and other workers. New tools and processes, including upgraded HR and financial systems, will help every CSC employee work better and smarter, and realize new growth opportunities.
To improve commercial performance, we continue to build next-generation offerings and tap into our vibrant ecosystem of best-of-breed technology partners. Today we are invest-ing in CSC MyWorkStyle, new network offerings with AT&T, our Big Data Platform as a Service, cybersecurity,
applications modernization, Storage as a Service, mobility and the integration of CSC Agility Platform™ for cloud management with public clouds from IBM, Microsoft, VMware and Amazon. When added to CSC’s unique technol-ogy independence, our partner-enabled go-to-market strategy allows us to provide clients with the right combina-tion of innovative capabilities and objective guidance.
In fiscal year 2016 we will intensify our focus on growth. That means investing to further align our sales force by industry, strengthening our top accounts, improving cross-sell and using metrics more effectively to double our win rate on deals of over $100 million. CSC and our partners will invest more heavily in research and development of high-growth healthcare and insurance offerings. Investment in more joint ventures and more small acquisitions in fiscal year 2016 will add market-facing capabilities and strengthen our offerings portfolio to capture new revenue.
As the cloud era advances, we recognize that our market will continue to change rapidly and unpredictably, presenting new opportunities for growth and innovation. As these shifts occur, I am confident that our ability to bring clarity, value and a community of expertise to our clients will position CSC’s two world-class businesses for success. We are committing more and investing more in our clients, our partners and our people — and we expect to win more, grow more and achieve more in the year ahead for you, our shareholders.
Thank you for your support of CSC.
Mike Lawrie President and Chief Executive Officer
“We recognize that operating ethically and responsibly to deliver sustainable value to our clients and stakeholders is vital to our business success. That is why, as we continue to focus on business growth and performance excellence, we remain strongly committed to corporate responsibility and sustainability across our global operations, from energy reduction and community involvement to investments that help our people gain new skills and opportunities.”
Mike LawriePresident and Chief Executive Officer

GUIDED BY PRINCIPLE
Global access to technology has empowered consumers
while disrupting nearly every company in every industry.
In this fast-paced and uniquely demanding environment,
three core principles enable CSC to deliver the
exceptional results that we and our stakeholders expect:
CONFIDENCE: We approach each collaboration with a
confidence earned through 56 years of creating lasting
transformations for businesses and governments worldwide.
CLARITY: We bring unmatched clarity to our clients’ ambitions,
simplifying what is overly complex and removing barriers and
complications to mission delivery.
COMMUNITY: We bring together a community of expertise and imaginative minds, galvanized
by a common purpose: to fulfill our clients’ vision.
With clarity, confidence and community, our exceptional teams work tirelessly together to deliver innovation and value for our clients around the world.

6 | CSC 2015 ANNUAL REPORT
CAPITAL TO SHAREHOLDERS ($M)
SHARE BUYBACKSDIVIDENDS
$123FY
2013$428$305
$118FY
2014$623$505
$131FY
2015$867$736
FREE CASH FLOW ($M) 2
FY 2013
$264
$689$717
FY 2014 FY 2015
CUMULATIVE TOTAL SHAREHOLDER RETURN
FY 2013
68%
109%
130%
FY 2013 – FY 2014 FY 2013 – FY 2015
NON-GAAP FULLY DILUTED EARNINGS PER SHARE (EPS) FROM CONTINUING OPERATIONS 1
FINANCIAL PERFORMANCE: FISCAL YEAR 2015 HIGHLIGHTS
YEAR IN REVIEW
FY 2013
$3.45
$4.27
FY 2014 FY 2015
$4.64
1. Please see non-GAAP reconciliation of EPS on page 27 of the 10-K.
2. Please see non-GAAP reconciliation of free cash flow on page 29 of the 10-K.
CSC 2015 ANNUAL REPORT | 7
DELIVERING CLARITY: NEXT-GENERATION OFFERINGS
In fiscal year 2015 CSC delivered standardized, scalable, next-generation offerings that helped our clients gain clarity and create value by applying the latest technologies to increase agility, reduce costs and improve performance:
• CSC Agility Platform for seamless enterprise cloud management
• Managed Security Services to deter cyberthreats at all levels
• CSC Big Data Platform as a Service for rapid deployment of powerful analytics
• Storage as a Service to reduce data storage costs while increasing scalability
• FuturEdge for Modernization to transform the applications portfolio
• CSC MyWorkStyle for a more personalized, collaborative and secure workspace
• Mobile Solutions to enable anytime, anywhere collaboration and productivity
EARNING CONFIDENCE: INDUSTRY-LEADING CAPABILITIES
As our next-generation IT strategy continued to resonate with clients and partners in fiscal year 2015, we also earned the confidence of independent analysts, with CSC gaining recognition for excellence across our offerings portfolio. Examples include:
• “Leader,” Applications Outsourcing (EMEA), Forrester
• “Leader,” Data Center Outsourcing and Infrastructure Utility Services (Europe and North America), Gartner
• “Leader,” End User Outsourcing (North America), Gartner
• “Leader,” Enterprise Cloud Infrastructure Services, Everest
• “Leader,” Global IT Infrastructure Outsourcing, Forrester
• “Leader,” Healthcare IT Outsourcing Providers, Everest
• “Leader,” Workplace Virtualization Services (Western Europe), IDC
• “Leader,” Worldwide Managed Security Services, IDC
TOWARD A MORE SUSTAINABLE ENTERPRISE
With a strong commitment to corporate responsibility, we strive to demonstrate that doing good for people, our communities and the planet is also good for our business. In fiscal year 2015, CSC reduced global energy consumption more than 15 percent, signifi-cantly exceeding our 10 percent target a year ahead of schedule, and earned recognition from CR Magazine as a Top 100 Best Corporate Citizen for 2015.
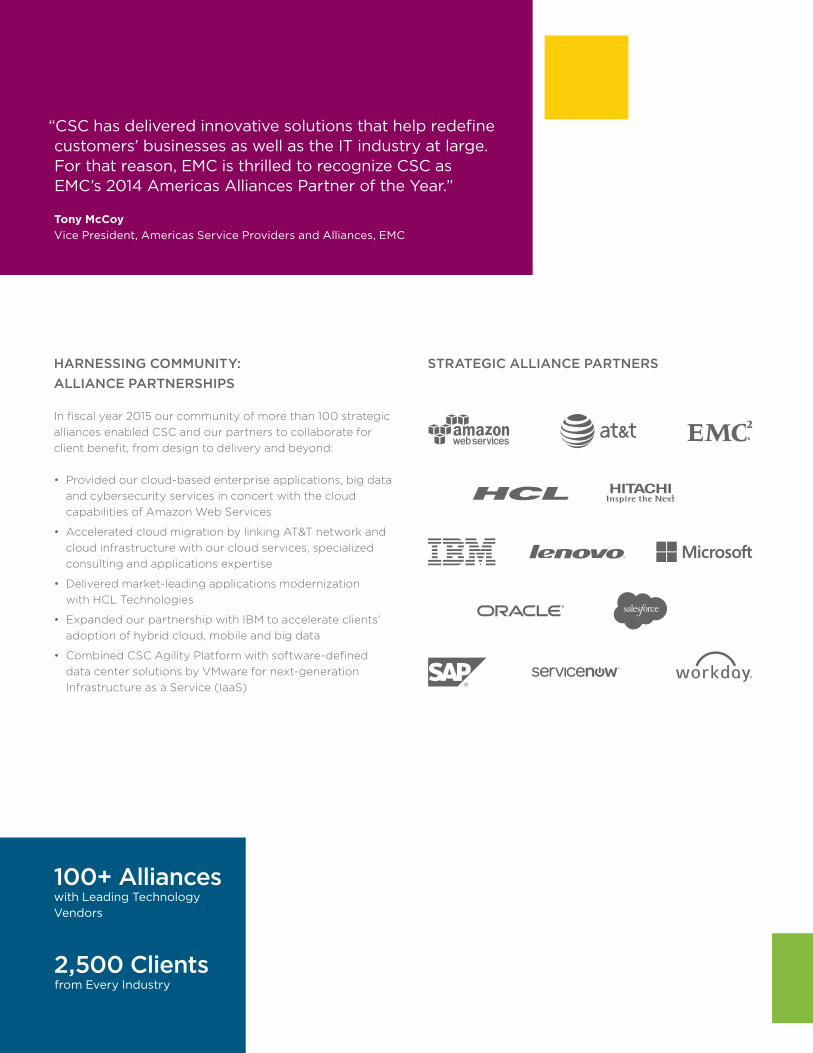
STRATEGIC ALLIANCE PARTNERS
100+ Allianceswith Leading Technology Vendors
2,500 Clientsfrom Every Industry
HARNESSING COMMUNITY: ALLIANCE PARTNERSHIPS
In fiscal year 2015 our community of more than 100 strategic alliances enabled CSC and our partners to collaborate for client benefit, from design to delivery and beyond:
• Provided our cloud-based enterprise applications, big data and cybersecurity services in concert with the cloud capabilities of Amazon Web Services
• Accelerated cloud migration by linking AT&T network and cloud infrastructure with our cloud services, specialized consulting and applications expertise
• Delivered market-leading applications modernization with HCL Technologies
• Expanded our partnership with IBM to accelerate clients’ adoption of hybrid cloud, mobile and big data
• Combined CSC Agility Platform with software-defined data center solutions by VMware for next-generation Infrastructure as a Service (IaaS)
“CSC has delivered innovative solutions that help redefine customers’ businesses as well as the IT industry at large. For that reason, EMC is thrilled to recognize CSC as EMC’s 2014 Americas Alliances Partner of the Year.”
Tony McCoy Vice President, Americas Service Providers and Alliances, EMC

CSC 2015 ANNUAL REPORT | 9

PROVEN INSIGHTS, NEXT-GENERATION RESULTS
ACCELERATING CLOUD MIGRATION
Leading technology company telent sought to reduce operating costs and create a new level of IT flexibility by harnessing the cloud. By virtualizing the client’s server system with software from alliance partner VMware, CSC helped increase cost-effectiveness and improve business continuity and disaster recovery capabilities.
UPDATING CRITICAL SYSTEMS
Dubai-based Danway Electrical & Mechanical Engineering had outgrown its older enterprise resource planning (ERP) system. Cost overruns were becoming a serious problem, billings were not always completed properly, maintenance and support costs were rising, and customers were dissatisfied. Danway selected CSC as its implementation partner, largely based on its ability to complete the SAP implementation quickly and with a minimum of customization work. The implementation went smoothly by all accounts, and was completed both on time and within budget. Today, some 90 Danway projects of various sizes are being run on these SAP systems.
DRIVING BUSINESS TRANSFORMATION
When U.S. pharmaceutical distributor H. D. Smith wanted to expand its focus to both products and services, the company asked CSC to help build a world-class cloud infrastructure while controlling capital costs. Today the client relies on CSC Agility Platform for cloud to manage, provision and invoice services in a centralized and consistent way; network infrastructure from CSC alliance partner AT&T; and Platform as a Service from alliance partner Microsoft. Benefits to H. D. Smith include up to 100 percent system availability for customers, flexibility to integrate multiple cloud solutions, and faster time to market.

IMPROVING SALES AGILITY
The Guardian Life Insurance Company of America® (Guardian), a leading mutual insurer, needed a new, more flexible billing solution to enable sales of multiple product types following U.S. healthcare reform. CSC deployed our Premium Billing 360° Software as a Service (SaaS) solution to enable integrated, scalable billing and collection administration. As a result of this project, Guardian gained the agility it needed to introduce new products, while offering customers greater choice in billing and payment services.
PREVENTING CYBERATTACKS
In Australia, an electronic voting system that allows electors to cast ballots via the Internet and telephone saw its successful debut at the 2011 parliamen-tary election in the State of New South Wales (NSW). As officials prepared the iVote system for its first full operation at the NSW state election in 2015, the NSW Electoral Commission looked to CSC to assess cybersecurity risks such as impersonation, tampering, ballot-box stuffing and challenges to integrity and ballot secrecy. By identifying risks to the iVote system, CSC helped the Commission provide the secrecy, transparency and trust that voters and candidates expect.
INNOVATION WITHOUT BOUNDARIES
Through the annual CSC Awards for Technical Excellence, we recognize the innovative spirit of our global team in applying powerful next-generation technologies to create extraordi-nary results for the organizations we serve. In fiscal year 2015, the people of CSC helped a national rail system use mobile solutions to give 7,000 field professionals instant, on-the-go alerts for better work-order fulfillment; created a new DevOps platform for our Lorenzo electronic health records system to help clients improve patient care while reducing deployment time and hardware costs; and designed a radio-frequency-enabled soft-ware implant to enable a client to seamlessly extract user data after malicious system shutdowns.
Learn more at csc.com/awardforexcellence.
70,000Skilled Next-Generation Professionals
Service to Clients in
70+ Countries
Organizations from many industries choose CSC to provide the expertise,
teamwork and innovative services they need to harness the agility and
cost-effectiveness of the cloud, safeguard the enterprise from cyberattack,
integrate key systems and processes for greater efficiency and accomplish
other critical business objectives.

CSC EMPLOYEES: ENABLING OUR TRANSFORMATION
“ I joined CSC seven years ago in the UK because I love the way CSC can use technology to improve people’s lives. I’m proud to say that I do that every single day across Asia, the Middle East and Africa — using technology to improve healthcare outcomes for patients and business out-comes for clients.”
– Phil Humber, Director, IS&S Healthcare and Life Sciences, AMEA, Singapore
“ My deeply rooted belief that we need to work to make the world a better place led me to join the U.S. federal government early in my career. Now that I’m an AGM within CSC’s North American Public Sector, I get to bring that passion to my government customer’s mission. Working with col-leagues across CSC and with external partners, we deliver the most innovative solutions to some of CSC’s most innovative customers, including, in my case, NASA.”
– Dr. Sharon Hays, North American Public Sector Account General Manager, USA
“ As a 10-year CSC veteran, I’m incredibly proud of our history and the great founda-tion it provides for our future. I am compelled to help share that excitement, confidence and sense of purpose with CSC employees and our valued clients.”
– Neil Brownlie, General Manager, Bulgaria
“ Coming to CSC right out of college, I didn’t know what to expect. But I have been met with remarkable support from top to bottom and have received guidance from my direct manager and even members of executive leadership. My experience is rock- solid proof that CSC is investing in its future and that my success and the success of this company are interdependent. That’s a huge motivator for me.”
– Omari Hewlett, Client Development and Satisfaction Associate, USA
12 | CSC 2015 ANNUAL REPORT

“I joined CSC 18 months ago and have been extremely impressed by the strong desire and eagerness of the China team to open the local market. Every employee I’ve met in region is so passionate and willing to go beyond assigned job duties to bring in new business and to grow the China market for CSC.”
– Wen Chen, Country Manager, China
“ Having come to CSC through acquisition of a technology startup, I can honestly say that the innovation, the people and the talent at CSC is the same. It is awesome to work for a company that has the scale and the opportunity take a world-class startup product and integrate it and drive IT transformation all over the world.”
– Tammy Brandt, Chief Mergers and Acquisitions and Alliance Counsel, USA
“ What draws me to CSC is the fact that, no matter what business unit or position someone is in, everyone I’ve encountered has done nothing but shower me with encouragement and push me to be a better person workwise and in my personal life, and to grasp every amazing opportunity that comes my way. It’s obvious to me CSC is making the right plays and investing for the future.”
– Jove Harris, Associate Project Administrator, Innovation and Technology, USA
“I love to make an impact and I love winning. CSC can bring value to our clients at so many different levels through our strategy, partners and ecosys-tem. I firmly believe we have a winning proposition and can bring value to life at every customer we work with.”
– Hassan Nasser, Solution Architect, UAE
“ When I joined CSC 14 months ago, I went to see a customer who essentially asked ‘Who is CSC?’ Now, less than a year later, we have signed the first applications deal for South and West Europe in Insurance; we are delivering even more projects and becoming a trusted partner. The client said we were unique in bringing one CSC to solve the client’s architecture problems, insurance expertise and delivery capacity from the service center in Bulgaria.”
– Agnès Lucot, Client Relationship Executive, France
CSC people are our most important asset and have been critically important in our
turnaround. There’s no doubt that their pride, passion and sense of purpose will be
equally influential in the company’s next successful phase. Employees from around
the world shared their thoughts on what CSC means to them at the company’s
annual Global Sales and Technology Conference in April.
CSC 2015 ANNUAL REPORT | 13
14 | CSC 2015 ANNUAL REPORT
2015 BOARD OF DIRECTORS AND OFFICERS OF THE COMPANYBOARD OF DIRECTORS
Rodney F. Chase 3, member ex-officio 1, 2, 4
ChairmanGenel Energy plc
J. Michael Lawrie 3
President and Chief Executive OfficerCSC
David J. Barram 1, 3, 4
Director Quisk, Inc. (formerly Mobibucks Corporation)
Erik Brynjolfsson 2, 4
ProfessorMIT Sloan School
Bruce B. Churchill 1, 4
Executive Vice PresidentDIRECTV
Nancy Killefer 2
Director EmeritusMcKinsey & Company, Inc.
Brian P. MacDonald 1, 4
Former Chief Executive OfficerHertz Equipment Rental Corporation
Sean O’Keefe 2
ProfessorMaxwell School of Citizenship and Public Affairs, Syracuse University
EXECUTIVE OFFICERS
J. Michael LawriePresident and Chief Executive Officer
Paul N. SalehExecutive Vice President and Chief Financial Officer
Romil BahlExecutive Vice President and General Manager, Global Industries
Stephen HiltonExecutive Vice President and General Manager, Global Infrastructure Services
Diane WilfongVice President and Controller
William L. Deckelman Jr.Executive Vice President, General Counsel and Secretary
Ashish MahadwarExecutive Vice President and General Manager, Strategic Business
Lawrence PriorExecutive Vice President and General Manager, North American Public Sector
James R. SmithExecutive Vice President and General Manager, Global Business Services
David W. ZoletExecutive Vice President and General Manager, Americas Region
COMMITTEE MEMBERSHIPS
1. Audit 2. Compensation 3. Executive 4. Nominating/Corporate Governance
UNITED STATES SECURITIES AND EXCHANGE COMMISSION
WASHINGTON, D.C. 20549FORM 10-K
(Mark One)
ANNUAL REPORT PURSUANT TO SECTION 13 OR 15(d) OF THE SECURITIES EXCHANGE ACT OF 1934
For the fiscal year ended April 3, 2015
OR
TRANSITION REPORT PURSUANT TO SECTION 13 OR 15(d) OF THE SECURITIES EXCHANGE ACT OF 1934For the transition period from to
Commission File No.: 1-4850
COMPUTER SCIENCES CORPORATION(Exact name of Registrant as specified in its charter)
Nevada 95-2043126(State of incorporation or organization) (I.R.S. Employer Identification No.)
3170 Fairview Park DriveFalls Church, Virginia 22042
(Address of principal executive offices) (zip code)
Registrant's telephone number, including area code: (703) 876-1000Securities registered pursuant to Section 12(b) of the Act:
Title of each class: Name of each exchange on which registeredCommon Stock, $1.00 par value per share New York Stock Exchange
Preferred Stock Purchase Rights
Securities registered pursuant to Section 12(g) of the Act: None
Indicate by check mark if the registrant is a well-known seasoned issuer, as defined in Rule 405 of the Securities Act. Yes No Indicate by check mark if the registrant is not required to file reports pursuant to Section 13 or Section 15(d) of the Act. Yes No Indicate by check mark whether the Registrant (1) has filed all reports required to be filed by Section 13 or 15(d) of the Securities Exchange Act of 1934 during the preceding 12 months (or for such shorter period that the registrant was required to file such reports), and (2) has been subject to such filing requirements for the past 90 days. Yes No Indicate by check mark whether the registrant has submitted electronically and posted on its corporate website, if any, every Interactive Data File required to be submitted and posted pursuant to Rule 405 of Regulation S-T during the preceding 12 months (or for such shorter period that the registrant was required to submit and post such files). Yes No Indicate by check mark if disclosure of delinquent filers pursuant to Item 405 of Regulation S-K is not contained herein, and will not be contained, to the best of Registrant’s knowledge, in definitive proxy or information statements incorporated by reference in Part III of this Form 10-K or any amendment to this Form 10-K. Indicate by check mark whether the registrant is a large accelerated filer, an accelerated filer, or a non-accelerated filer or a smaller reporting company.
Large accelerated filer Accelerated filer Non-accelerated filer Smaller reporting company
Indicate by check mark whether the registrant is a shell company (as defined in Rule 12b-2 of the Exchange Act). Yes No
As of October 3, 2014, the aggregate market value of stock held by non-affiliates of the Registrant was approximately $8,261,393,187.
There were 137,679,779 shares of the Registrant’s common stock outstanding as of May 15, 2015.
DOCUMENTS INCORPORATED BY REFERENCEPortions of the Registrant’s definitive Proxy Statement for its 2015 Annual Meeting of Stockholders, which will be filed with the Securities and Exchange Commission within 120 days after April 3, 2015, are incorporated by reference into Part III hereof.

TABLE OF CONTENTS
Item Page
PART I
1. Business
1A. Risk Factors
1B. Unresolved Staff Comments
2. Properties
3. Legal Proceedings
4. Mine Safety Disclosures
Executive Officers of the Registrant
PART II
5. Market for the Registrant’s Common Equity, Related Stockholder Matters and Issuer Purchases of Equity Securities
6. Selected Financial Data
7. Management’s Discussion and Analysis of Financial Condition and Results of Operations
7A. Quantitative and Qualitative Disclosures about Market Risk
8. Financial Statements and Supplementary Data
9. Changes in and Disagreements with Accountants on Accounting and Financial Disclosure
9A. Controls and Procedures
9B. Other Information
PART III
10. Directors, Executive Officers and Corporate Governance
11. Executive Compensation
12. Security Ownership of Certain Beneficial Owners and Management and Related Stockholder Matters
13. Certain Relationships and Related Transactions, and Director Independence
14. Principal Accountant Fees and Services
PART IV
15. Exhibits, Financial Statement Schedules
1
6
15
15
16
16
16
18
21
22
49
50
126
126
129
129
129
129
130
130
130
1
PART I
Item 1. Business
INTRODUCTION AND HISTORY
General
Computer Sciences Corporation (CSC or the Company), incorporated in the state of Nevada, is a global provider of information technology (IT) and professional services and solutions. Since the Company was founded in 1959, CSC has helped its clients develop and integrate their IT assets in support of operational efficiency, new growth initiatives and other business objectives. CSC's clients include commercial enterprises and the U.S. federal government, as well as state, local and non-U.S. government agencies. The Company has 70,000 employees in more than 60 countries.
The Company's mission is to enable superior returns on our clients' technology investments through best-in-class industry solutions, domain expertise and global scale. CSC generally does not operate through exclusive agreements with hardware or software providers and believes this independence enables the Company to better identify and manage solutions specifically tailored to each client’s needs.
The Company’s strategy is to become a leader in next-generation IT services which include applications modernization, cloud infrastructure, cyber security, big data and mobility. Current and prospective clients are changing how they buy and consume IT services. Clients are looking for greater operational agility from their IT services and they are looking to benefit from the insights provided by mobility, social media, and big data analytics. At the same time, they continue to seek significant cost reductions by migrating from traditional IT infrastructure to the cloud.
This change in client preferences is creating a market opportunity for CSC. The Company is responding by assembling key assets and forming strategic partnerships with technology leaders. CSC has built a highly secure, flexible, private cloud infrastructure offering, BizCloud, for our enterprise as well as our government clients.
CSC also entered into a global alliance with AT&T to merge the Company’s cloud infrastructure, specialized consulting and applications expertise with AT&T’s highly-secure network and cloud infrastructure platform to help global businesses move more quickly to the cloud. This alliance helps to reduce capital intensity and creates the global scale necessary to run modernized application workloads. CSC acquired one of the leading providers of enterprise cloud management software, ServiceMesh, to facilitate the orchestration of enterprise applications across multi-vendor hybrid clouds including, Amazon Web Services, VMware and Microsoft. Additionally, ServiceMesh provides our clients with the advanced capabilities such as tiered services levels, different levels of security, self-service options, governance, policy and real time monitoring. CSC is also creating a Cloud Center of Excellence using services from Amazon, to accelerate the development of cloud solutions for enterprise and public sector customers.
CSC’s strategic partnership with HCL Technologies aims to create a world-class applications modernization delivery network. The Company expects to offer our commercial customers a global footprint of delivery capabilities for modernizing their legacy applications and moving them to the cloud. HCL and CSC will also jointly create a Banking Center of Excellence to accelerate and expand our core banking and card services solutions by leveraging our global banking expertise which includes CSC’s Hogan and Celeriti offerings.
CSC's service contracts are of various duration, scope and terms and conditions. CSC's contracts typically contain provisions by which customers may terminate the contract prior to completion, though such instances are infrequent due to the differentiated services provided, complex transition of personnel, assets, methodologies and processes involved. If a contract is terminated early for convenience, the Company seeks to recover tangible assets, investments and other intangible assets through stated contract terms or negotiation. If a contract is terminated early due to CSC's default, the Company may have additional liability and also its ability to compete for future business could be adversely impacted. The U.S. federal government may terminate almost all of CSC's government contracts and subcontracts either at its convenience or for default based on factors set forth in the Federal Acquisition Regulation. Upon termination for convenience of a fixed-price type contract, our U.S. federal government contracts normally entitle us to receive the purchase price for delivered items, reimbursement for contractual commitments and allowable costs for work-in-process, and a reasonable allowance for profit, although there can also be financial impact resulting from the negotiated contract

2
settlement. Upon termination for convenience of a U.S. federal government cost reimbursable or time and material contract, we normally are entitled to reimbursement of allowable costs plus a fee. Allowable costs generally include the cost to terminate agreements with suppliers and subcontractors. The amount of the fee recovered, if any, generally is related to the portion of the work completed prior to termination and is determined by negotiation. See Risk Factor number 17 under Item 1A "Risk Factors" in this Annual Report for further discussion.
On May 19, 2015, CSC's board of directors unanimously approved the announcement of a plan to separate (the Separation) CSC’s North American Public Sector business into an independent publicly traded company (CSC - U.S. Public Sector) the shares of which would be spun off in a distribution to holders of CSC shares on the record date. After the Separation, CSC would focus on serving commercial clients globally and public sector clients outside the United States. The Separation is intended to be tax free for federal income tax purposes. CSC also announced an intention to pay a special dividend of approximately $1.5 billion (or $10.50 per share) in cash concurrent with the Separation. It is currently expected that CSC - U.S. Public Sector will consist of substantially all the assets and operations currently comprising CSC's North American Public Sector reportable segment, and shortly prior to the Separation will incur approximately $1.5 billion in principal amount of debt as well as approximately $150 million in principal amount of pre-existing capital lease obligations outstanding. In addition, at the time of the Separation CSC - U.S. Public Sector is expected to have approximately $300 million in cash, and to assume substantially all CSC’s U.S. defined benefit plan obligations, together with receiving associated assets. Any assets and liabilities not transferred to CSC - U.S. Public Sector, including the Company's GBS and GIS reportable segments, will remain with CSC after the Separation.
Completion of the Separation will not require a shareholder vote but will be subject to customary conditions, including final approval of our board of directors, the receipt of a favorable legal opinion from counsel with respect to the tax-free nature of the Separation, and the effectiveness of a Form 10 filing with the U.S. Securities and Exchange Commission. See “Risks Relating to the Proposed Separation” under Item 1A “Risk Factors” in this Annual Report for further discussion.
Services and Sectors
The Company's reportable segments are Global Business Services (GBS), Global Infrastructure Services (GIS), and North American Public Sector (NPS). Geographically, CSC has significant operations throughout North America, Europe, Asia and Australia. Segment and geographic information are included in Note 20 to the Consolidated Financial Statements for the year ended April 3, 2015. For a discussion of risks associated with our foreign operations, see Risk Factor number 14 under Item 1A "Risk Factors".
GBS
GBS provides innovative technology solutions including consulting, applications services, and software, which address key business challenges within the customer’s industry. GBS strives to help clients understand and exploit industry trends of IT modernization and virtualization of the IT portfolio (hardware, software, networking, storage and computing assets). GBS has three primary growth engines: end-to-end applications services; consulting services; and industry aligned next-generation software and solutions. Applications Services optimize and modernize clients' business and technical environments, enabling clients to capitalize on emerging services such as cloud, mobility, and big data within new commercial models such as the "as a Service" and digital economies. The consulting business helps organizations innovate, transform, and create sustainable competitive advantage through a combination of industry, business process, technology, systems integration and change management expertise. The industry software & solutions unit’s vertically-aligned software solutions and process-based intellectual property power mission-critical transaction engines in insurance, banking, healthcare and life sciences, manufacturing and a host of diversified industries. Key competitive differentiators for GBS include its global scale, solution objectivity, depth of industry expertise, strong partnerships, vendor and product independence and end-to-end solutions and capabilities. Changing business issues such as globalization, fast-developing economies, government regulation, and growing concerns around risk, security, and compliance drive demand for these GBS offerings.
GIS
GIS provides managed and virtual desktop solutions, unified communications and collaboration services, data center management, cyber security, compute and managed storage solutions to commercial clients globally. GIS also delivers CSC's next-generation Cloud offerings, including Infrastructure as a Service (IaaS), private Cloud solutions, CloudMail and Storage as a Service (SaaS). GIS provides a portfolio of standard offerings that have predictable outcomes and

3
measurable results while reducing business risk and operational costs for clients. To provide clients with differentiated offerings, GIS maintains a select number of key alliance partners to make investments in developing unique offerings and go-to market strategies. This collaboration helps CSC determine the best technology, road map and opportunities to differentiate solutions, expand market reach, augment capabilities, and jointly deliver impactful solutions. GIS seeks to capitalize on the emerging market trend and rebundled IT portfolio on virtualized infrastructure.
NPS
NPS delivers IT, mission, and operations-related services to the Department of Defense, civil agencies of the U.S. federal government, as well as state and local government agencies. Commensurate with the Company's strategy, NPS is leveraging our commercial best practices and next-generation technologies to bring scalable and more cost-effective IT solutions to government agencies that are seeking efficiency through innovation. This approach is designed to yield lower implementation and operational costs as well as a higher standard of delivery excellence. Demand for NPS offerings are driven by evolving government priorities such as: 1) migration to next-generation IT solutions, which include hybrid cloud infrastructure, application modernization and orchestration, 2) mission intelligence driven by big data solutions, 3) health IT and informatics, and 4) cyber security.
During the last three fiscal years, the Company’s revenue mix by line of business was as follows:
2015 2014 2013Global Business Services 33% 33% 34%Global Infrastructure Services 34 35 33North American Public Sector 33 32 33Total Revenue 100% 100% 100%
Fiscal 2015 Overview
Total revenue of $12,173 million decreased by 6.3% year over year, reflecting certain headwinds in its commercial infrastructure outsourcing business and the repositioning of its consulting business, impact of restructured contracts, and price-downs.
Overall market demand for IT services was in transition in fiscal 2015 as organizations sought to use technology to improve enterprise efficiency, agility and productivity. The Company expanded its sales force and invested in sales tools, next-generation offerings, internal systems and workforce optimization during fiscal 2015. During fiscal 2015, GBS contract awards were $4.7 billion as compared to $6.1 billion in the prior year. Total contract value (TCV) within GIS remained flat at $4.1 billion for both fiscal 2015 and 2014. During fiscal 2015, NPS had contract awards of $2.9 billion, a decline when compared with fiscal 2014 awards of $4.3 billion, primarily due to the signing of one large recompete contract during the second quarter of 2014. The Company is participating in the general industry trend of smaller contract awards of $100 million or less, and a decline in the number and total value of large contract awards valued at more than $100 million.
Acquisitions and Divestitures
Acquisitions
During the fourth quarter of fiscal 2015, CSC acquired Autonomic Resources, LLC (Autonomic), a North Carolina-based cloud-computing infrastructure provider, for cash consideration of $14 million. The acquisition enhances CSC's ability to provide cloud services under the Federal Risk and Authorization Management Program (FedRAMP) to federal, state and local governments. Autonomic will be integrated into the NPS segment.
During the second quarter of fiscal 2015, CSC acquired a privately held entity for $35 million in an all-cash transaction. CSC acquired this entity primarily to enhance its cyber security, systems engineering, and software development service offerings in the federal intelligence sector. This entity is now a component of the Company's NPS segment.
During fiscal 2014, CSC acquired ServiceMesh Inc., a privately-held enterprise cloud services management company, headquartered in Santa Monica, California, with operations in the United States, Australia and the United Kingdom, for a
4
total purchase consideration of $282 million. The acquisition enhances CSC's ability to help its clients migrate their applications into Cloud computing environments and to automate the deployment and management of enterprise applications and platforms across private, public and hybrid cloud environments. ServiceMesh is now a component of the Company's GIS segment.
Additionally, during fiscal 2014, CSC acquired Infochimps, Inc., a privately-held company, in an all-cash transaction for $27 million. The acquisition complements CSC’s existing Big Data business by providing a flexible, scalable, platform-as-a-service offering, and is associated to the Company's GBS segment.
During fiscal 2013, CSC acquired 42Six Solutions, LLC (42Six) for $35 million in an all cash transaction. 42Six, a software development company specializing in providing analytics and applications software products and services for the U.S. government intelligence community and the Department of Defense, was acquired primarily to enhance CSC's Big Data offerings. This acquisition is related to the Company's NPS segment.
Divestitures
During fiscal 2015, 2014 and 2013, the Company divested certain non-core businesses as a part of its service portfolio optimization initiative to focus on the next-generation technology services. Certain of the divestitures met the criteria of discontinued operations presentation, and consequently, their historical results have been presented as discontinued operations in the Company's Consolidated Statement of Operations.
On July 31, 2014, CSC completed the sale of a German software business to a strategic investor for cash consideration of $3 million. This divestiture, which had been included in the GBS segment's healthcare group, resulted in a pre-tax loss of $22 million, representing the excess of the carrying value of the net assets of the business and transaction costs over the net proceeds. On July 19, 2013, CSC completed the sale of its base operations, aviation and ranges services business unit, Applied Technology Division (ATD) within its NPS Segment, to a strategic investor for cash consideration of $178 million plus a net working capital adjustment receivable of $6 million. The pre-tax gain on disposal was $77 million, representing the excess of the sale price over the carrying value of the net assets of the divested business, less transaction costs of $5 million. On May 21, 2013, CSC completed the divestiture of its flood insurance-related business process outsourcing practice (flood insurance BPO), within CSC's GBS segment, to a financial investor for cash consideration of $43 million plus a net working capital adjustment of $4 million. The pre-tax gain on disposal was $25 million, representing the excess of the net proceeds over the carrying value of the net assets of the divested business and the related transaction costs.
During the third quarter of fiscal 2013, CSC completed the divestiture of its U.S.-based credit services business for cash proceeds of $1 billion, and its Italian consulting and system integration business for a cash payment of $35 million. During the fourth quarter of fiscal 2013, CSC completed the divestiture of one of its enterprise systems integration businesses based in Singapore and Malaysia for consideration of approximately $103 million. This business was primarily involved in the reselling of enterprise hardware and software and providing the related maintenance services. All of these fiscal 2013 divestitures were components of the Company's GBS segment. During the fourth quarter of fiscal 2013, the Company divested its Australian information technology staffing unit, Paxus, for cash consideration of $79 million. Due to CSC's ongoing business involvement with Paxus, this divestiture did not qualify to be presented as discontinued operations, and therefore its results were included in continuing operations.
For further discussion of these acquisitions and divestitures, see Notes 4 and 5 to the Consolidated Financial Statements.
Competition
The IT and professional services markets in which CSC competes are not dominated by a single company or a small number of companies. A substantial number of companies offer services that overlap and are competitive with those offered by the Company. In addition, the increased importance of offshore labor centers has brought a number of foreign-based firms into competition with CSC. Offshore IT outsourcers selling directly to end-users have captured an increasing share of awards as they compete directly with U.S. domestic suppliers of these services. The Company continues to increase resources in offshore locations to mitigate this market development.
More recently, the accelerating demand for multi-tenant infrastructure services, commonly referred to as Cloud Computing offerings, is continuing to alter the landscape of competition. New entrants to our markets are offering service models that

5
change the decision criteria and contracting expectations of our target market. Amazon Web Services, for example, has emerged as a strong competitor in cloud computing, and other major competitors in this area include large and well-funded technology companies that are increasingly using social, mobile, analytics and cloud technologies to create agile new business models. Smaller and more nimble companies also continue to enter and disrupt markets with innovations in cloud and other areas and could emerge as significant competitors to CSC.
The Company has responded to these changing market conditions with new capabilities, partnerships and offerings that are intended to position CSC favorably in the high-growth markets for next-generation IT services and solutions. CSC’s acquisition of ServiceMesh, for example, allows the Company to deliver new offerings with partners like VMware and Microsoft and to integrate with other cloud computing providers. The addition of big data service provider Infochimps allows for advanced analytics delivered as a service to customers. The Company’s new strategic partnerships with AT&T and HCL Technologies similarly enable expanded cloud, applications modernization and other next-generation technology services.
CSC’s ability to obtain business is dependent upon its ability to offer better strategic concepts and technical solutions, better value, a quicker response, more flexibility, better quality, a higher level of experience, or a combination of these factors. In the opinion of the Company’s management, CSC’s lines of business are positioned to compete effectively in the GBS, GIS and NPS markets based on its technology and systems expertise and large project management skills. It is also management’s opinion that CSC’s competitive position is enhanced by the full spectrum of IT and professional services it provides, including consulting and software and systems design, implementation and integration, IT and business process outsourcing and technical services, delivered to a broad commercial and government customer base.
EMPLOYEES
The Company has offices worldwide, and as of April 3, 2015, had approximately 70,000 employees. The services provided by CSC require proficiency in many fields, such as computer sciences, programming, telecommunications networks, mathematics, physics, engineering, astronomy, geology, operations, research, finance, economics, statistics and business administration.
U.S. SECURITIES AND EXCHANGE COMMISSION REPORTS
All of the Company’s Annual Reports on Form 10-K, Quarterly Reports on Form 10-Q, Current Reports on Form 8-K and all amendments to those reports, and other materials required to be filed with or furnished to the U.S. Securities and Exchange Commission (SEC), are available free of charge through the Company’s Internet website, www.csc.com, or through the CSC Investor Relations Office at 1-800-542-3070. The content on any website referred to in this Annual Report on Form 10-K is not incorporated by reference into this report, unless expressly noted otherwise. As soon as reasonably practical after the Company has electronically filed such material with or furnished it to the SEC, these items can be read and copied at the SEC’s Public Reference Room at 100 F Street, NE, Washington, DC 20549. Periodic reports, proxy statements, information statements, and other information filed with or furnished by the Company to the SEC are available on the SEC’s website, www.sec.gov, or by calling the SEC at 1-800-SEC-0330 (1-800-732-0330).
FORWARD-LOOKING AND CAUTIONARY STATEMENTS
All statements and assumptions contained in this Annual Report and in the documents attached or incorporated by reference that do not directly and exclusively relate to historical facts constitute “forward-looking statements” within the meaning of the Safe Harbor provisions of the Private Securities Litigation Reform Act of 1995. These statements represent current expectations and beliefs of CSC, and no assurance can be given that the results described in such statements will be achieved.
Forward-looking information contained in these statements include, among other things, statements with respect to CSC’s financial condition, results of operations, cash flows, business strategies, operating efficiencies or synergies, competitive position, growth opportunities, plans and objectives of management, and other matters. Such statements are subject to numerous assumptions, risks, uncertainties and other factors, many of which are outside of CSC’s control, which could cause actual results to differ materially from the results described in such statements. These factors include without limitation those listed below under Item 1A. "Risk Factors."

6
Forward-looking statements in this Annual Report speak only as of the date of this Annual Report, and forward-looking statements in documents attached or incorporated by reference speak only as to the date of those documents. CSC does not undertake any obligation to update or release any revisions to any forward-looking statement or to report any events or circumstances after the date of this Annual Report or to reflect the occurrence of unanticipated events, except as required by law.
Item 1A. Risk Factors
Past performance may not be a reliable indicator of future financial performance. Future performance and historical trends may be adversely affected by the following factors, as well as other variables, and should not be relied upon to project future period results.
Risks Relating to Our Business
1. Our business may be adversely impacted as a result of changes in demand, both globally and in individual market segments, for consulting, industry software & solutions, application services and next-generation cloud offerings. In addition, worldwide economic weakness and uncertainty could adversely affect our revenue and expenses.
Current weakness in worldwide economic conditions and political uncertainty may adversely impact our customers' demand for our services in the markets in which we compete, including our customers' demand for consulting, industry software & solutions, application services and next-generation cloud offerings and other IT services. Our government customers' demand may also be affected by budgetary and political uncertainties, changing priorities, military conflicts and other events.
2. Contracts with the U.S. federal government and related agencies account for a significant portion of our revenue and earnings.
Our NPS segment generated approximately 33% of our revenue for fiscal 2015, primarily from sales to the U.S. federal government. Consequently, we closely monitor federal budget, legislative and contracting trends and activities and continually examine our strategies to take these into consideration. The U.S. federal government continues to face significant fiscal and economic challenges such as financial deficits and the debt ceiling limit. The Administration and Congress make decisions in a constrained fiscal environment largely imposed by the Budget Control Act of 2011 (Budget Act). The Budget Act established limits on discretionary spending that began with U.S. federal government fiscal year (GFY) 2012 (a U.S. federal government fiscal year starts on October 1 and ends on September 30). The Bipartisan Budget Act of 2013 (BBA) that was signed into law on December 26, 2013 did not significantly alter the spending constraints established by the Budget Act. The BBA is significant, however, in that it represents the first bipartisan budget passed by a divided Congress in 27 years and eliminates the need for Congress to pass another budget until September 2015.
The Budget Act provided for additional automatic spending reductions, known as sequestration, which went into effect on March 1, 2013, and further reduced planned government spending. The BBA extended the sequestration into GFY 2023. While the defense budget sustained the largest single reduction, civil agencies and programs also were impacted significantly by sequestration cuts. In light of the Budget Act, the BBA and other deficit reduction pressures, it is likely that discretionary spending by the federal government will remain constrained for a number of years. As a result of sequestration, our U.S. federal government customers are more cautious with contract awards and spending, resulting in longer procurement cycles, smaller award values and an inclination towards extension of existing customer contracts, and we expect this behavior to continue. We are continuously reviewing our operations in an attempt to identify those programs that could be at risk so that we can make appropriate contingency plans. While we have experienced reduced funding on some of our programs, and may see further reductions, we do not expect the cancellation of any of our major programs.
The U.S. federal government has established a limit on the level of federal debt that the U.S. federal government can have outstanding, often referred to as the debt ceiling. On February 15, 2014 legislation was signed that suspended the U.S. debt limit ceiling through March 15, 2015. Effective March 16, 2015, the debt ceiling was reinstated. If the debt ceiling is not increased or suspended in the interim, the Congressional Budget Office projects that the Treasury would exhaust available funds in October or November of 2015, however, the timing
7
and magnitude of revenues and outlays over the next several months could vary noticeably from CBO’s projections.
Significant issues remain with respect to federal budgetary and spending matters. Any future changes to the fiscal policies of the U.S. federal government may decrease overall government funding, result in delays in the procurement of our products and services due to lack of funding, cause the U.S. federal government and government agencies to reduce their purchases under existing contracts, or cause them to exercise their rights to terminate contracts at-will or to abstain from exercising options to renew contracts, any of which would have an adverse effect on our business, financial condition, results of operations and/or cash flows.
3. Our ability to continue to develop and expand our service offerings to address emerging business demands and technological trends will impact our future growth. If we are not successful in meeting these business challenges, our results of operations and cash flows will be materially and adversely affected.
Our ability to implement solutions for our customers incorporating new developments and improvements in technology which translate into productivity improvements for our customers and to develop service offerings that meet current and prospective customers' needs are critical to our success. The markets we serve are highly competitive. Our competitors may develop solutions or services that make our offerings obsolete. Our ability to develop and implement up to date solutions utilizing new technologies which meet evolving customer needs in cloud, consulting, industry software and solutions and application services markets will impact our future revenue growth and earnings.
4. Our primary markets, consulting, industry software and solutions, application services, and next-generation cloud, are highly competitive markets. If we are unable to compete in these highly competitive markets, our results of operations will be materially and adversely affected.
Our competitors include large, technically competent and well capitalized companies, some of which have emerged as a result of industry consolidation, as well as “pure play” companies that have a single product focus. The competition created by these companies may place downward pressure on operating margins in our industry, particularly for technology outsourcing contract extensions or renewals. As a result, we may not be able to maintain our current operating margins, or achieve favorable operating margins, for technology outsourcing contracts extended or renewed in the future.
Any reductions in margins will require that we effectively manage our cost structure. If we fail to effectively manage our cost structure during periods with declining margins, our results of operations will be adversely affected.
5. Our ability to raise additional capital for future needs will impact our ability to compete in the markets we serve.
Our credit ratings are based upon information furnished by us or obtained by a rating agency from its own sources and are subject to revision, suspension or withdrawal by one or more rating agencies at any time. Rating agencies may review the ratings assigned to us due to developments that are beyond our control, including as a result of new standards requiring the agencies to reassess rating practices and methodologies.
In addition, subsequent to our announcement to separate into two publicly traded companies, all three credit rating agencies took ratings action. Fitch Ratings formally reaffirmed its existing credit ratings of BBB with "Stable" outlook. S&P put the Company's credit ratings on "Credit Watch" but stated its expectations to reaffirm S&P's ratings of BBB+ with "Stable" outlook. Moody's put the Company's ratings of Baa2 and "Stable" under "credit review" and that its expectations were to either reaffirm Moody's existing Baa2 rating or a one-notch downgrade to Baa3, both of which are investment grade credit ratings.
If changes in our credit ratings were to occur, it could result in higher interest costs under certain of our credit facilities. It would also cause our future borrowing costs to increase and limit our access to capital markets. Any downgrades could negatively impact the perception of the Company by lenders and other third parties. In addition, certain of the Company's major contracts provide customers with a right of termination in certain circumstances in the event of a rating downgrade below investment grade.
8
6. Achieving our growth objectives may prove unsuccessful. We may be unable to identify future attractive acquisitions and strategic partnerships, which may adversely affect our growth. In addition, our ability to consummate or integrate acquisitions we consummate and implement our strategic partnerships may materially and adversely affect our profitability if we fail to achieve anticipated revenue improvements and cost reductions.
We intend to identify strategic acquisitions that will allow us to expand our operations. However, we may be unable to identify attractive candidates or complete acquisitions on terms favorable to us. In addition, our ability to successfully integrate the operations we acquire and leverage these operations to generate revenue and earnings growth will significantly impact future revenue and earnings as well as investor returns. Integrating acquired operations is a significant challenge and there is no assurance that the Company will be able to manage such integrations successfully. Failure to successfully integrate acquired operations may adversely affect our cost structure, thereby reducing our margins and return on investment.
We have also entered into, and intend to identify and enter into additional strategic partnerships with other industry participants that will allow us to expand our business. However, we may be unable to identify attractive strategic partnership candidates or complete such partnerships on terms favorable to us. In addition, if we are unable to successfully implement our partnership strategies or our strategic partners do not fulfill their obligations or otherwise prove advantageous to our business, our investments in such partnerships and our anticipated business expansion could be adversely affected.
7. We could suffer additional losses due to asset impairment charges.
We test our goodwill for impairment during the second quarter of every year, and on an interim date should events or changes in circumstances indicate the carrying value of goodwill may not be recoverable in accordance with Accounting Standards Codification (ASC) 350 "Goodwill and Other Intangible Assets". If the fair value of a reporting unit is revised downward due to declines in business performance or other factors, an impairment under ASC 350 could result and a non-cash charge could be required.
We also test certain equipment and deferred cost balances associated with contracts when the contract is materially underperforming or is expected to materially underperform in the future, as compared to the original bid model or budget. If the projected cash flows of a particular contract are not adequate to recover the unamortized cost balance of the asset group, the balance is adjusted in the tested period based on the contract's fair value. Either of these impairments could materially affect our reported net earnings.
8. If our customers experience financial difficulties or request out-of-scope work, we may not be able to collect our receivables, which would materially and adversely affect our profitability.
Over the course of a long-term contract, our customers' financial condition may change such that their ability to pay their obligations, and our ability to collect our fees for services rendered, is adversely affected. Additionally, we may perform work for the U.S. federal government and state governments, with respect to which we must file requests for equitable adjustment or claims with the proper agency to seek recovery in whole or in part, for out-of-scope work directed or caused by the government customer in support of its critical missions. While we may resort to other methods to pursue our claims or collect our receivables, these methods are expensive and time consuming and successful collection is not guaranteed. Failure to collect our receivables or prevail on our claims would have an adverse effect on our profitability.
9. If we are unable to accurately estimate the cost of services and the time line for completion of contracts, the profitability of our contracts may be materially and adversely affected.
Our commercial and federal government contracts are typically awarded on a competitive basis. Our bids are based upon, among other items, the cost to provide the services. To generate an acceptable return on our investment in these contracts, we must be able to accurately estimate our costs to provide the services required by the contract and to complete the contracts in a timely manner. In addition, revenues from some of our contracts are recognized using the percentage-of-completion method, which requires estimates of total costs at completion, fees earned on the contract, or both. This estimation process, particularly due to the technical nature of the services being performed and the long-term nature of certain contracts, is complex and involves significant judgment. Adjustments to original estimates are often required as work progresses, experience is gained and
9
additional information becomes known, even though the scope of the work required under the contract may not change. If we fail to accurately estimate our costs or the time required to complete a contract, the profitability of our contracts may be materially and adversely affected.
10. We are defendants in pending litigation that may have a material and adverse impact on our profitability.
As noted in Part I, Item 3, "Legal Proceedings" and Note 22 to the Consolidated Financial Statements, we are currently party to a number of disputes which involve or may involve litigation. We are not able to predict the ultimate outcome of these disputes or the actual impact of these matters on our profitability. If we agree to settle these matters or judgments are secured against us, we may incur liabilities which may have a material and adverse impact on our liquidity and earnings.
11. Our contracts with U.S. government agencies are subject to regulations, audits and cost adjustments by the U.S. government, which could materially and adversely affect our operations.
We are engaged in providing services under contracts with U.S. government agencies. These contracts are subject to extensive legal and regulatory requirements and, from time to time, such agencies audit or investigate whether our operations are being conducted in accordance with these requirements. These audits or investigations may include a review of our performance on contracts, pricing practices, cost structure and compliance with applicable laws and regulations. U.S. government audits or investigations of us, whether related to the Company's federal government contracts or conducted for other reasons, including, without limitation, the settlement of the SEC investigation described herein, could result in administrative, civil or criminal liabilities, including repayments, fines or penalties being imposed upon us, or could lead to suspension or debarment from future U.S. government contracting. In addition, we could suffer serious reputational harm. If any of these should occur, our reputation may be adversely impacted and our relationship with the agencies we work with may be damaged, resulting in a material and adverse effect on our profitability.
12. Our ability to provide our customers with competitive services is dependent on our ability to attract and retain qualified personnel.
Our ability to grow and provide our customers with competitive services is partially dependent on our ability to attract and retain highly motivated people with the skills necessary to serve our customers. As we noted above, the markets we serve are highly competitive and competition for skilled employees in the technology outsourcing and consulting and systems integration markets is intense for both on-shore and offshore locales. The loss of personnel could impair our ability to perform under certain of our contracts, which could have a material adverse effect on our consolidated financial position, results of operations and cash flows.
13. Our ability to perform services for certain of our government clients is dependent on our ability to maintain necessary security clearances.
Select U.S. and non-U.S. government clients require CSC to maintain security clearances for certain of our facilities used in the performance of classified contracts. Employees who perform under certain government contracts are required to possess appropriate personnel security clearances for access to classified information granted by the respective government. The competition for qualified personnel who possess security clearance is very strong in certain public sector markets. In the event that a government customer were to revoke the facility and/or personnel clearances of all or substantially all of the employees performing work under a classified contract, such revocation could be grounds for termination of the contract by the government customer. Similarly, if the Company is unable to hire sufficient qualified and cleared personnel to meet contractual commitments, a contract could be terminated for non-performance. Under either circumstance, such termination, depending on the contract value, could have a material adverse effect on our consolidated financial position, results of operations and cash flows.
14. Our international operations are exposed to risks, including fluctuations in exchange rates, which may be beyond our control.
For fiscal 2015, approximately 39.6% of our recognized revenues were denominated in currencies other than the U.S. dollar. The exposure to currencies other than the U.S. dollar may impact our results as they are expressed
10
in U.S. dollars. In particular, the uncertainty with respect to the ability of certain European countries to continue to service their sovereign debt obligations and the related European financial restructuring efforts may cause the value of the euro to fluctuate. Currency variations also contribute to variations in sales of products and services in impacted jurisdictions. For example, in the event that one or more European countries were to replace the euro with another currency, sales in that country or in Europe generally may be adversely affected until stable exchange rates are established. While currency risk, including exposure to fluctuations in currency exchange rates, is partially mitigated largely by matching costs with revenues in a given currency, our exposure to fluctuations in other currencies against the U.S. dollar increases as revenue in currencies other than the U.S. dollar increase and as more of the services we provide are shifted to lower cost regions of the world. We believe that the percentage of our revenue denominated in currencies other than the U.S. dollar will continue to represent a significant portion of our revenue. Also, we believe that our ability to match revenue and expenses in a given currency will decrease as more work is performed at offshore locations.
We operate in approximately seventy countries and our operations in these countries are subject to the local legal and political environments. Our operations are subject to, among other things, employment, tax, statutory reporting, trade restriction and other regulations. Notwithstanding our best efforts, we may not be in compliance with all regulations in the countries in which we operate and may be subject to penalties and/or fines as a result. These penalties or fines may materially and adversely impact our profitability.
15. We may be exposed to negative publicity and other potential risks if we are unable to maintain effective internal controls over financial reporting.
We are required under the Sarbanes-Oxley Act of 2002 to include a report of management on the Company's internal controls that contains an assessment by management of the effectiveness of our internal control over financial reporting. In addition, the public accounting firm auditing our financial statements must report on the effectiveness of our internal control over financial reporting. If we are unable to conclude that we have effective internal control over financial reporting or, if our independent registered public accounting firm is unable to provide us with an unqualified report as to the effectiveness of our internal control over financial reporting as of each fiscal year end, we may be exposed to negative publicity. The resulting negative publicity may materially and adversely affect our business and stock price.
16. In the course of providing services to customers, we may inadvertently infringe on the intellectual property rights of others and be exposed to claims for damages.
The solutions we provide to our customers may inadvertently infringe on the intellectual property rights of third parties resulting in claims for damages against us or our customers. Our contracts generally indemnify our clients from claims for intellectual property infringement for the services and equipment we provide under our contracts. The expense and time of defending against these claims may have a material and adverse impact on our profitability. Additionally, the publicity we may receive as a result of infringing intellectual property rights may damage our reputation and adversely impact our ability to develop new business.
17. Our contracts generally contain provisions under which a customer may terminate the contract prior to completion. Early contract terminations may materially and adversely affect our revenues and profitability.
Our contracts typically contain provisions by which customers may terminate the contract prior to completion of the term of the contract. These contracts generally allow the customer to terminate the contract for convenience upon providing written notice. If a contract is terminated for convenience, we seek, either by defined contract schedules or through negotiations, recovery of our property, plant, equipment, outsourcing costs, investments, and other intangibles. However, there is no assurance we will be able to fully recover our investments. We may not be able to replace the revenue and earnings from these contracts in the short-term. In the long-term, our reputation may be harmed by the publicity generated from contract terminations.
The U.S. federal government may terminate our government contracts either at its convenience or for default based on factors set forth in the Federal Acquisition Regulation. Similarly, where we are a subcontractor to a prime contractor with the U.S. federal government, termination of the prime contract typically will lead to termination of our subcontract. Upon termination for convenience of a fixed-price type contract, our U.S. federal government contracts normally entitle us to receive the purchase price for delivered items, reimbursement for
11
contractual commitments and allowable costs for work-in-process, and a reasonable allowance for profit, although there can also be financial impact resulting from the negotiated contract settlement.
Upon termination for convenience of a U.S. federal government cost reimbursable or time and materials contract, we normally are entitled to reimbursement of allowable costs plus a fee. Allowable costs generally include the cost to terminate agreements with suppliers and subcontractors. The amount of the fee recovered, if any, generally is related to the portion of the work completed prior to termination and is determined by negotiation.
A termination arising out of our default may expose us to liability and have a material adverse effect on our ability to compete for future contracts and orders. Our contracts and the services we provide under our contracts are often highly complex and may include numerous mutual performance obligations and conditions as well as terms permitting each party to issue default notices unilaterally which, assuming the notices are validated as proper under the contract and the default is not remedied within the applicable cure period, may entitle the non-defaulting party to terminate the contract. During the course of a contractual relationship one or both parties may issue default notices; however, given the nature of our services and our relationships with our customers, the parties routinely resolve these issues on commercially reasonable terms. If we are not able to negotiate a commercially reasonable resolution in a particular situation and termination rights are asserted, protracted litigation could ensue.
In addition, certain of our U.S. federal government contracts span one or more base years and multiple option years. The U.S. federal government generally has the right not to exercise option periods and may not exercise an option period for various reasons, effectively terminating the contract when the period of performance expires. Any decision by the U.S. federal government not to exercise an option or to terminate a major contract could adversely impact our revenue, profitability and financial condition. There have been no U.S. federal government terminations or renegotiations that materially impacted the Company's consolidated financial position, results of operations or cash flows in fiscal years 2015, 2014, and 2013.
18. Our ability to compete in certain markets we serve is dependent on our ability to continue to expand our capacity in certain offshore locations. However, as our presence in these locations increases, we are exposed to risks inherent to these locations which may adversely impact our revenue and profitability.
A significant portion of our application outsourcing and software development activities have been shifted to India, and we plan to continue to expand our presence there and in other lower cost locations. As such, we are exposed to the risks inherent to operating in India including (1) a highly competitive labor market for skilled workers which may result in significant increases in labor costs as well as shortages of qualified workers in the future, and (2) the possibility that the U.S. federal government or the European Union may enact legislation that provides significant disincentives for customers to locate certain of their operations offshore which would reduce the demand for the services we provide in India and may adversely impact our cost structure and profitability. In addition, India has experienced civil unrest and acts of terrorism and has been involved in confrontations with Pakistan. If India continues to experience this civil unrest or if its conflicts with Pakistan escalate, our operations in India could be adversely affected.
The Foreign Corrupt Practices Act (FCPA) and similar anti-bribery laws in other jurisdictions prohibit U.S.-based companies and their intermediaries from making improper payments to non-U.S. officials for the purpose of obtaining or retaining business. We pursue opportunities in certain parts of the world that experience government corruption, and in certain circumstances, compliance with anti-bribery laws may conflict with local customs and practices. Our internal policies mandate compliance with all applicable anti-bribery laws. We require our employees, partners, subcontractors, agents and others who work for us or on our behalf to comply with the FCPA and other anti-bribery laws. There is no assurance that our policies or procedures will protect us against liability under the FCPA or other laws for actions taken by our agents, employees and intermediaries. If we are found to be liable for FCPA violations (either due to our own acts or our inadvertence, or due to the acts or inadvertence of others), we could suffer from severe criminal or civil penalties or other sanctions, which could have a material adverse effect on our reputation, business, results of operations or cash flows. In addition, detecting, investigating and resolving actual or alleged violations of the FCPA or other anti-bribery violations is expensive and could consume significant time and attention of our senior management.

12
19. Our performance on contracts, including those on which we have partnered with third parties, may be adversely affected if we or the third parties fail to deliver on commitments.
Our contracts are increasingly complex and, in some instances, require that we partner with other parties, including software and hardware vendors, to provide the complex solutions required by our customers. Our ability to deliver the solutions and provide the services required by our customers is dependent on our and our partners' ability to meet our customers' delivery schedules. If we or our partners fail to deliver services or products on time, our ability to complete the contract may be adversely affected, which may have a material and adverse impact on our revenue and profitability.
20. Security breaches or service interruptions could expose us to liability or impair our reputation, which could cause significant financial loss.
As a provider of information technology services to private and public sector customers operating in a number of regulated industries and countries, we store and process increasingly large amounts of sensitive data of our clients, including personal information and information relating to sensitive government functions. At the same time, the continued occurrence of high-profile data breaches provides evidence of an external environment increasingly hostile to information security. We rely on internal and external information and technological systems to manage our operations and are exposed to risk of loss resulting from breaches in the security or other failures of these systems. We collect and store certain personal and financial information from customers and employees. Security breaches could expose us to a risk of loss of this information, regulatory scrutiny, actions and penalties, extensive contractual liability litigation, reputational harm, and a loss of confidence that could potentially have an adverse impact on future business with current and potential customers.
Advances in computer capabilities, new discoveries in the field of cryptography or other events or developments may result in a compromise or breach of the algorithms that we use to protect sensitive customer transaction data. A party who is able to circumvent our security measures could misappropriate proprietary information or cause interruption in our operations. We are required to expend capital and other resources to protect against such security breaches or cyber attacks or to alleviate problems caused by such breaches or attacks. Our security measures are designed to identify and protect against security breaches and cyber attacks, and no threat incident identified to date has resulted in a material adverse effect on us or our customers; however, our failure to detect, prevent or adequately respond to a future threat incident could subject us to liability, damage our reputation and have a material adverse effect on our business.
Increasing data privacy and information security obligations could also impose additional regulatory pressures on our customers’ businesses, and indirectly, on our operations. In response, some of our customers have sought, and may continue to seek, to contractually impose certain strict data privacy and information security obligations on us and some of our customer contracts may not contractually limit our liability for the loss of confidential information. If we are unable to adequately address these concerns, our business and results of operations could suffer. Compliance with new privacy and security laws, requirements and regulations, where required or undertaken by us, may result in cost increases due to potential systems changes, the development of additional administrative processes and increased enforcement actions and fines and penalties. While we strive to comply with all applicable data protection laws and regulations as well as our own posted privacy policies, any failure or perceived failure to comply or any misappropriation, loss or other unauthorized disclosure of sensitive or confidential information may result in proceedings or actions against us by government or other entities, private lawsuits against us such as class actions or the loss of customers, which could potentially have an adverse effect on our business, reputation and results of operations.
21. Changes in the Company's tax rates could affect our future results.
Our future effective tax rates could be affected by changes in the mix of earnings in countries with differing statutory tax rates, changes in the valuation of deferred tax assets and liabilities, or by changes in tax laws or their interpretation. We are subject to the continuous examination of its income tax returns by the U.S. Internal Revenue Service and other tax authorities. We regularly assess the likelihood of adverse outcomes resulting from these examinations to determine the adequacy of its provision for taxes. There can be no assurance that the outcomes from these examinations will not have a material adverse effect on our financial condition and operating results.

13
22. We may be adversely affected by disruptions in the credit markets, including disruptions that reduce our customers' access to credit and increase the costs to our customers of obtaining credit.
The credit markets have historically been volatile and therefore it is not possible for the Company to predict the ability of our clients and customers to access short-term financing and other forms of capital. If a disruption in the credit markets were to occur, it could also pose a risk to our business if customers and suppliers are unable to obtain financing to meet payment or delivery obligations to the Company. In addition, customers may decide to downsize, defer or cancel contracts which could negatively affect our revenue.
23. Our hedging program is subject to counterparty default risk.
We enter into foreign currency forward contracts and options and interest rate swaps with a number of counterparties. As of April 3, 2015, we had outstanding foreign currency forward contracts with a notional value of $700 million, outstanding option contracts with a notional value of $0 million, and interest rate swap transactions of $275 million. As a result, we are subject to the risk that the counterparty to one or more of these contracts defaults on its performance under the contract. During an economic downturn, the counterparty's financial condition may deteriorate rapidly and with little notice and we may be unable to take action to protect our exposure. In the event of a counterparty default, we could incur significant losses, which may harm our business and financial condition. In the event that one or more of our counterparties becomes insolvent or files for bankruptcy, our ability to eventually recover any losses suffered as a result of that counterparty's default may be limited by the liquidity of the counterparty.
24. We derive significant revenue and profit from contracts awarded through competitive bidding processes, which can impose substantial costs on us, and we will not achieve revenue and profit objectives if we fail to bid on such projects effectively.
We derive significant revenue and profit from government contracts that are awarded through competitive bidding processes. We expect that most of the government business we seek in the foreseeable future will be awarded through competitive bidding. Competitive bidding imposes substantial costs and presents a number of risks, including:
• the substantial cost and managerial time and effort that we spend to prepare bids and proposals for contracts that may or may not be awarded to us;
• the need to estimate accurately the resources and costs that will be required to service any contracts we are awarded, sometimes in advance of the final determination of their full scope and design;
• the expense and delay that may arise if our competitors protest or challenge awards made to us pursuant to competitive bidding, and the risk that such protests or challenges could result in the requirement to resubmit bids, and in the termination, reduction, or modification of the awarded contracts; and
• the opportunity cost of not bidding on and winning other contracts we might otherwise pursue.
Within our NPS segment, we are also seeing an increasing number of bid protests from unsuccessful bidders on new program awards. Bid protests could result in litigation expenses to the company, contract modifications or the award decision being overturned and loss of the contract award. Even where a bid protest does not result in the loss of an award, the resolution can extend the time until the contract activity can begin, and delay earnings.
25. Catastrophic events or climate conditions may disrupt our business.
The Company and its customers are subject to various federal, state, local and foreign government requirements relating to the protection of the environment. Our revenues and results of operations may be adversely affected by the passage of climate change and other environmental legislation and regulations. For example, new legislation or regulations may result in increased costs directly relating to our compliance or indirectly to the extent that such requirements increase prices charged to us by vendors because of increased compliance costs. At this point, we are unable to determine the impact that climate change and other environmental legislation and regulations could have on our overall business.

14
Risks Relating to the Proposed Separation
26. The proposed Separation of our current business into two independent, publicly traded companies is contingent upon the satisfaction of a number of conditions, and the Separation may not be consummated on the terms or timeline currently contemplated or may not achieve the intended results.
On May 19, 2015, we announced that we are pursuing a plan to separate our existing organization into two publicly traded companies: one to serve commercial and government clients globally and one to serve public sector clients in the U.S. We currently expect that the Separation, if completed, will occur by October 2015. Our ability to timely effect the Separation is subject to several customary conditions, including, among others, final approval by our Board of Directors, the receipt of a favorable legal opinion from counsel with respect to the tax-free nature of the transaction and the SEC declaring effective a registration statement relating to the securities of the separated entity. In addition, we currently expect to pay a special dividend to shareholders at closing; however, we cannot assure the amount of the dividend or that any such dividend will be paid in connection with the Separation. For these and other reasons, the Separation may not be completed on the terms or timeline contemplated, if at all. Further, if the Separation is completed, it may not achieve the intended results.
27. The actions required to implement the complete Separation of our current businesses into two independent, publicly traded companies will take significant management time and attention and may require us to incur significant costs.
The complete Separation of our existing organization into two publicly traded companies will require significant amounts of management's time and efforts, which will be in addition to and may divert management's time and attention from the operation of our business, and the execution of our other strategic initiatives. Additionally, we may incur significant costs in connection with the Separation.
28. The proposed Separation may result in disruptions to relationships with customers and other business partners.
While we intend to manage our operations to minimize any disruptions to our customers and business partners, uncertainty related to the proposed Separation may nevertheless lead to disruption in those relationships. These disruptions if not managed by us could have an adverse effect on our businesses, financial condition, results of operations and prospects.
29. The Company’s proposed Separation could result in substantial tax liability to the Company and its shareholders.
Among the conditions to completing the Separation will be our receipt of an legal opinion of tax counsel substantially to the effect that, for U.S. federal income tax purposes, the Separation will qualify for tax-free treatment as a spin-off under Section 355 of the Internal Revenue Code. The legal opinions we receive will be based on, among other things, various assumptions and representations we will provide to counsel. If any of those assumptions or representations are or become inaccurate or incomplete, we may not be able to rely on the opinion. Furthermore, a legal opinion of counsel is not binding on the IRS or the courts. Accordingly, the IRS or the courts may challenge the conclusions stated in the opinion and such challenge could prevail. If, notwithstanding receipt of the opinion, the Separation is determined to be taxable, we could be subject to a substantial tax liability. In addition, if the transaction is taxable, each holder of our common stock who receives shares of the new company would generally be treated as receiving a taxable distribution of property in an amount equal to the fair market value of the shares received, thereby potentially increasing such holder’s tax liability.
Even if the Separation otherwise qualifies as a tax-free spin-off transaction, the distribution could be taxable to us (but not to our shareholders) in certain circumstances if future significant acquisitions of our stock or the stock of the new company are deemed to be part of a plan or series of related transactions that include the spin-off. In this event, the resulting tax liability could be substantial. In connection with the Separation, we expect to enter into a tax matters agreement with CSC - U.S. Public Sector, under which it will agree not to enter into any transaction without our consent that could cause any portion of the Separation to be taxable to us and to indemnify us for any tax liabilities resulting from such transactions. These obligations and potential tax liabilities may discourage, delay or prevent a change of control of us or of CSC - U.S. Public Sector.

15
30. We cannot predict the effect of the Separation on the market value of our common stock.
We cannot predict the prices at which shares of our common stock may trade after the Separation, nor can we predict whether the combined market value of the shares of our common stock and the shares of CSC - U.S. Public Sector to be spun-off will be less than, equal to or greater than the market value of our common stock immediately prior to the Separation.
Item 1B. Unresolved Staff Comments
The Company has previously received comment letters from the Staff of the SEC’s Division of Corporation Finance with respect to certain of the Company’s filings for its fiscal years 2011, 2012 and 2013. The Company has responded to each of these letters and believes that it has addressed the Staff’s comments. Further, the Company believes that its Form 10-K/A in respect of its 2014 fiscal year, filed with the SEC on June 5, 2015, also addressed certain of the Staff’s prior comments. Nonetheless, as of the date of this annual report, the Company has not yet received confirmation from the Staff that its review process is complete. The Company intends to continue to work with the Staff to resolve any remaining open issues with respect to the Staff’s prior comments.
On September 25, 2014, the Company received a letter from the Staff of the SEC's Division of Corporation Finance as part of its review of the Company's Form 10-K for the fiscal year ended March 28, 2014 and the Company's Form 10-Q for the quarter ended July 4, 2014. The Staff requested additional information and provided comments related to certain accounting disclosures, including disclosure relating to software development costs, contingencies and goodwill. The Company responded to that letter on October 16, 2014 and believes that it has addressed the Staff's comments. As of the date of this annual report, the Company has not received confirmation from the Staff that its review process is complete. The Company intends to continue to work with the Staff and respond to any remaining comments.
Item 2. Properties
Following is a summary of properties owned and leased by CSC or its subsidiaries as of April 3, 2015:
Properties OwnedApproximate
Square Footage General UsageBlythewood, South Carolina 456,000 Computer and General OfficeFalls Church, Virginia 401,000 General OfficeCopenhagen, Denmark 368,000 Computer and General OfficeAldershot, United Kingdom 211,000 General OfficeNewark, Delaware 176,000 Computer and General OfficeDaleville, Alabama 150,000 General OfficeNorwich, Connecticut 144,000 Computer and General OfficePetaling Jaya, Malaysia 126,000 Computer and General OfficeMeriden, Connecticut 118,000 Computer and General OfficeMaidstone, United Kingdom 79,000 Computer and General OfficeJacksonville, Illinois 60,000 General OfficeChesterfield, United Kingdom 51,000 General OfficeTunbridge Wells, United Kingdom 43,000 Computer and General OfficeSterling, Virginia 41,000 General OfficeVarious other U.S. and foreign locations 76,000 General Office

16
Properties LeasedApproximate
Square Footage General UsageIndia 2,441,000 General OfficeWashington, D.C. area 1,500,000 Computer and General OfficeGermany 653,000 General OfficeAustralia & other Pacific Rim locations 635,000 Computer and General OfficeDenmark 350,000 General OfficeNorth Carolina 331,000 General OfficeTexas 266,000 Computer and General OfficeNew York 229,000 General OfficeNew Jersey 223,000 General OfficeFrance 193,000 General OfficeUnited Kingdom 159,000 General OfficeSpain 149,000 General OfficeIllinois 148,000 General OfficeCanada 145,000 General OfficeConnecticut 135,000 Computer and General OfficeSweden 126,000 General OfficeCalifornia 120,000 General OfficeChina 106,000 General OfficeBulgaria 101,000 General OfficeVarious other U.S. and foreign locations 1,275,000 Computer and General Office
Upon expiration of its leases, the Company expects to obtain renewals or to lease alternative space. Lease expiration dates range from fiscal 2016 through fiscal 2028. We believe that all of the properties are well-maintained, suitable and adequate to meet current and anticipated requirements.
Item 3. Legal Proceedings
The information required by this Item is set forth in Note 22, Commitments & Contingencies of the Notes to the Consolidated Financial Statements under the caption “Contingencies”, contained in Part II - Item 8 of this filing. Such information is incorporated herein by reference and made a part hereof.
Item 4. Mine Safety Disclosures
Not applicable.
Executive Officers of the Registrant
Name Age
Year First Elected asan Officer
Term as an
Officer Position Held With the Registrant as of the filing dateFamily
RelationshipJ. Michael Lawrie 61 2012 Indefinite President and Chief Executive Officer NonePaul N. Saleh 58 2012 Indefinite Executive Vice President and Chief Financial Officer NoneRomil Bahl 46 2014 Indefinite Executive Vice President and General Manager, Global Industries NoneWilliam L. Deckelman, Jr. 57 2008 Indefinite Executive Vice President, General Counsel and Secretary NoneStephen Hilton 45 2015 Indefinite Executive Vice President and General Manager, Global
Infrastructure ServicesNone
Ashish Mahadwar 48 2014 Indefinite Executive Vice President and General Manager, Strategic Business NoneLawrence Prior 59 2014 Indefinite Executive Vice President & General Manager, North American
Public SectorNone
James R. Smith 48 2013 Indefinite Executive Vice President and General Manager, Global BusinessServices
None
Diane E. Wilfong 53 2014 Indefinite Vice President and Controller NoneDavid W. Zolet 54 2012 Indefinite Executive Vice President and General Manager, Americas Region None

17
Business Experience of Executive Officers
J. Michael Lawrie joined CSC as President and Chief Executive Officer on March 19, 2012 and as a member of its Board of Directors in February 2012. Prior to joining CSC, he served as the Chief Executive Officer of UK-based Misys plc, a leading global IT solutions provider to the financial services industry, from November 2006 to March 2012. Mr. Lawrie also served as the Executive Chairman of Allscripts-Misys Healthcare Solutions, Inc., from October 2008 to August 2010. From 2005 to 2006, Mr. Lawrie was a general partner with ValueAct Capital, a San Francisco-based private investment firm. He also served as Chief Executive Officer of Siebel Systems, Inc., an international software and solutions company, from 2004 to 2005. Mr. Lawrie also spent 27 years with IBM where he rose to Senior Vice President and Group Executive, responsible for sales and distribution of all IBM products and services worldwide. From 1998 to 2001, Mr. Lawrie was General Manager for IBM's business in Europe, the Middle East and Africa, which included operations in 124 countries and 90,000 employees. Prior to that, Mr. Lawrie served as General Manager of Industries for IBM's business operations in Asia Pacific, based in Tokyo. Mr. Lawrie is a Trustee of Drexel University, Philadelphia.
Paul N. Saleh joined CSC as Vice President and Chief Financial Officer on May 23, 2012. His current CSC job title is Executive Vice President and Chief Financial Officer. Prior to joining the Company, Mr. Saleh served as the Chief Financial Officer of Gannett Co. from 2010 to 2012. Prior to his tenure at Gannett Co., from 2008 to 2010, Mr. Saleh was a Managing Partner at Menza Partners, an operational and financial advisory group focusing on media, telecommunications, and technology industries. Prior to that, he served as Chief Financial Officer of Sprint Nextel Communications from 2001 to 2007 and as Interim Chief Executive Officer of Sprint Nextel until 2008. He served as Senior Vice President and Chief Financial Officer of Walt Disney International where he also held various other senior positions from 1997 to 2001.
Romil Bahl is currently the Executive Vice President and General Manager, Global Industries. Prior to joining CSC, Mr. Bahl was President and Chief Executive Officer of PRGX Global, a provider of business analytics and recovery audit services, from 2009 to 2013. Prior to his tenure at PRGX, Mr. Bahl led the systems integration business unit of Infosys and was a co-founder of the company’s business consulting subsidiary in the U.S., where he led the industry practices and the go-to-market services portfolio from 2004 to 2009. Prior to that, he also served as head of Global Consulting Services at EDS and the European Strategic Technology Practice A.T. Kearney from 1995 to 2004.
William L. Deckelman, Jr. was appointed Executive Vice President, General Counsel and Secretary in August 2014. Mr. Deckelman joined CSC in January 2008 and served as Vice President, General Counsel and Secretary from 2008 to 2012, and as Executive Vice President and General Counsel from 2012 to August 2014. Prior to joining CSC, Mr. Deckelman served as Executive Vice President and General Counsel of Affiliated Computer Services Inc., since March 2000, and served as a director from 2000 to 2003, holding various executive positions there since 1989.
Stephen Hilton is the Executive Vice President and General Manager, Global Infrastructure Services. He joined CSC on March 2, 2015. Prior to joining CSC, from 2006 to 2014, Mr. Hilton served as Managing Director and Chief Information Officer, Technology Infrastructure Services, and as Head of Corporate Real Estate & Services at Credit Suisse. Prior to his tenure at Credit Suisse, Mr. Hilton served from 2003 to 2006 in an Information Technology leadership role at JP Morgan Chase. Prior to that, from 1996 to 2003, Mr. Hilton worked at CSC as a service delivery executive, technical architect and business development/sales director and was based in London, Singapore and New York.
Ashish Mahadwar is the Executive Vice President and General Manager, Strategic Business. Mr. Mahadwar joined CSC in July 2014. Prior to joining CSC, from 2003 to 2014, he served as Senior Vice President and Global Head of Strategic Partnerships at Cognizant Technology Solutions Corp. Prior to that, Mr. Mahadwar co-founded Planetasia.com, and held management positions for Microland and for an HCL Technologies and Hewlett Packard joint venture. He served in analyst roles at A. F. Ferguson & Co. and CMC.
Lawrence Prior was appointed Executive Vice President & General Manager, North American Public Sector in December 2014. Mr. Prior joined CSC in May 2013 as Vice President and General Manager, North American Public Sector. Prior to joining CSC, Mr. Prior served as Executive Vice President of BAE Systems, Inc. from July 2010 to January 2013. Prior to that he served as President & COO of Mantech International Corporation from July 2009 to July 2010.
James R. Smith is the Executive Vice President and General Manager, Global Business Services. He joined CSC in August 2013. Prior to joining CSC, Mr. Smith served as Chief Executive Officer of Motricity, a provider of cloud-based
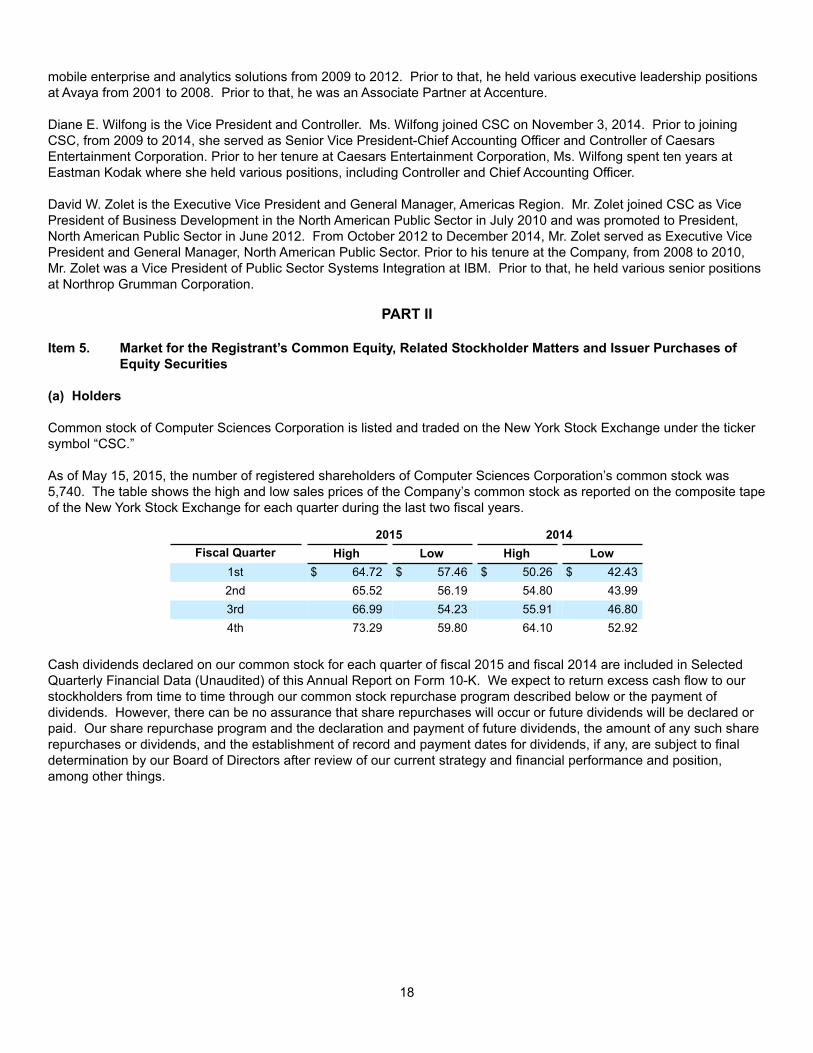
18
mobile enterprise and analytics solutions from 2009 to 2012. Prior to that, he held various executive leadership positions at Avaya from 2001 to 2008. Prior to that, he was an Associate Partner at Accenture.
Diane E. Wilfong is the Vice President and Controller. Ms. Wilfong joined CSC on November 3, 2014. Prior to joining CSC, from 2009 to 2014, she served as Senior Vice President-Chief Accounting Officer and Controller of Caesars Entertainment Corporation. Prior to her tenure at Caesars Entertainment Corporation, Ms. Wilfong spent ten years at Eastman Kodak where she held various positions, including Controller and Chief Accounting Officer.
David W. Zolet is the Executive Vice President and General Manager, Americas Region. Mr. Zolet joined CSC as Vice President of Business Development in the North American Public Sector in July 2010 and was promoted to President, North American Public Sector in June 2012. From October 2012 to December 2014, Mr. Zolet served as Executive Vice President and General Manager, North American Public Sector. Prior to his tenure at the Company, from 2008 to 2010, Mr. Zolet was a Vice President of Public Sector Systems Integration at IBM. Prior to that, he held various senior positions at Northrop Grumman Corporation.
PART II
Item 5. Market for the Registrant’s Common Equity, Related Stockholder Matters and Issuer Purchases of Equity Securities
(a) Holders
Common stock of Computer Sciences Corporation is listed and traded on the New York Stock Exchange under the ticker symbol “CSC.”
As of May 15, 2015, the number of registered shareholders of Computer Sciences Corporation’s common stock was 5,740. The table shows the high and low sales prices of the Company’s common stock as reported on the composite tape of the New York Stock Exchange for each quarter during the last two fiscal years.
2015 2014Fiscal Quarter High Low High Low
1st $ 64.72 $ 57.46 $ 50.26 $ 42.432nd 65.52 56.19 54.80 43.993rd 66.99 54.23 55.91 46.804th 73.29 59.80 64.10 52.92
Cash dividends declared on our common stock for each quarter of fiscal 2015 and fiscal 2014 are included in Selected Quarterly Financial Data (Unaudited) of this Annual Report on Form 10-K. We expect to return excess cash flow to our stockholders from time to time through our common stock repurchase program described below or the payment of dividends. However, there can be no assurance that share repurchases will occur or future dividends will be declared or paid. Our share repurchase program and the declaration and payment of future dividends, the amount of any such share repurchases or dividends, and the establishment of record and payment dates for dividends, if any, are subject to final determination by our Board of Directors after review of our current strategy and financial performance and position, among other things.

19
(b) Purchases of Equity Securities
The following table provides information on a monthly basis for the fourth quarter ended April 3, 2015 with respect to the Company’s purchase of equity securities:
Period
Total Number of Shares
Purchased (1)
Average Price Paid Per
Share
Total Number of Shares Purchased as
Part of Publicly Announced Plans or
Programs (2)
Approximate Dollar Value
of Shares that May Yet be Purchased
Under the Plans or Programs (2)
January 3, 2015 to January 30, 2015 1,730 $62.88 — $1,113,250,728January 31, 2015 to February 27, 2015 358,061 $63.01 355,308 $1,090,881,714February 28, 2015 to April 3, 2015 2,887,006 $70.50 2,864,712 $888,790,474
(1) The Company accepted 24,503 shares of its common stock in the quarter ended April 3, 2015 from employees in lieu of cash due to the Company in connection with the issuance of shares of common stock related to vested RSUs. The Company accepted 2,274 shares of common stock in the quarter ended April 3, 2015 tendered by employees in lieu of cash due to the Company in connection with the exercise of stock options. Such shares of common stock are stated at cost and held as treasury shares to be used for general corporate purposes.
(2) During the first quarter of fiscal 2015, the Company's Board of Directors approved a new share repurchase program authorizing up to $1.5 billion in share repurchases of the Company's outstanding common stock. CSC has been implementing these programs through purchases made in open market transactions in compliance with SEC Rule 10b-18 and Rule 10b5-1, subject to market conditions, and applicable state and federal legal requirements. Share repurchases will be funded with available cash. The timing, volume, and nature of share repurchases will be at the discretion of management, and may be suspended or discontinued at any time. CSC’s Board of Directors has not established an end date for the repurchase program. The Company repurchased 3,220,020 shares of its common stock in the fiscal quarter ended April 3, 2015 pursuant to the share repurchase program, of which 2,864,712 shares were under Accelerated Share Repurchase arrangement (see Note 16 of the Consolidated Financial Statements). The approximate amount for which shares may yet be purchased under this program at April 3, 2015 is $889 million.

20
(c) Performance Graph
The following graph compares the cumulative total return on CSC common stock during the last five fiscal years with the cumulative total return on the Standard & Poor’s 500 Stock Index and the S&P North American Technology Services Index.
CSC Total Shareholder Return(Period Ended April 3, 2015)
Indexed Return Chart (2010 = 100)Return 2011 Return 2012 Return 2013 Return 2014 Return 2015 CAGR
CSC common stock -7.61% -37.74% 68.31% 24.35% 10.04% 5.79%S&P 500 Index 15.36% 8.00% 13.96% 20.88% 13.59% 14.28%S&P North American TechnologyServices Index 18.49% 15.36% 18.02% 22.38% 20.53% 18.93%
Assumes $100 invested on April 2, 2010, in CSC common stock, the S&P 500 Index, and the S&P North American Technology Services Index, formerly the Goldman Sachs Technology Services Index. Indexed amounts and return percentages follow CSC fiscal years.
(d) Equity Compensation Plans
See Item 12 of this Annual Report on Form 10-K for information regarding our equity compensation plans.

21
Item 6. Selected Financial Data
Five Year ReviewAmounts in millions, except per share amounts April 3, 2015 March 28, 2014 March 29, 2013 March 30, 2012 April 1, 2011Total assets $ 10,201 $ 11,389 $ 11,251 $ 11,189 $ 12,232
Debt
Long-term, net of current maturities 1,765 2,207 2,498 1,486 2,409
Short-term 371 444 — 43 29
Current maturities 533 237 234 1,211 141
Total 2,669 2,888 2,732 2,740 2,579
Stockholders’ equity 2,949 3,944 3,160 2,834 3,662
Net debt-to-total capitalization 10.2% 6.5% 11.5% 29.5% 11.9%
Five Year Review
Fiscal Year
Amounts in millions, except per-share amount 2015 2014 2013 2012 2011
Revenues $ 12,173 $ 12,998 $ 14,195 $ 14,673 $ 14,470
Costs of services (excludes depreciation and amortization, contract charge, settlement chargeand restructuring costs) 9,534 9,272 11,293 12,643 11,527
Costs of services – specified contract charge (excludes amount charged to revenue of $132)(3) — — — — 1,026
Costs of services – settlement charge (excludes amount charged to revenue of $42)(2) — — — 227 —
Selling, general and administrative - SEC settlement related charges 197 — — — —
Restructuring costs 261 76 264 140 —
Goodwill impairment(1) — — — 232 2,511
(Loss) income from continuing operations, before taxes (276) 1,263 235 (992) (2,703)
Income tax (benefit) expense (312) 383 (62) (228) 239
Income (loss) from continuing operations, net of taxes 36 880 297 (764) (2,942)
(Loss) income from discontinued operations, net of taxes (29) 88 482 162 131
Net (loss) income attributable to CSC common stockholders $ (8) $ 947 $ 760 $ (616) $ (2,832)
Earnings (loss) per common share:
Basic:
Continuing operations $ 0.15 $ 5.81 $ 1.80 $ (5.02) $ (19.18)
Discontinued operations (0.21) 0.60 3.12 1.05 0.85
$ (0.06) $ 6.41 $ 4.92 $ (3.97) $ (18.33)
Diluted:
Continuing operations $ 0.15 $ 5.70 $ 1.79 $ (5.02) $ (19.18)
Discontinued operations (0.20) 0.58 3.10 1.05 0.85
$ (0.05) $ 6.28 $ 4.89 $ (3.97) $ (18.33)
Cash dividend per common share(4) $ 0.92 $ 0.80 $ 0.80 $ 0.80 $ 0.70
(1) Fiscal 2012 goodwill impairment charge related to one reporting unit in the GBS segment and fiscal 2011 goodwill impairment charge related to the GIS segment and one reporting unit in the GBS segment.
(2) Fiscal 2012 settlement charge related to the contract settlement with the federal government. (3) Fiscal 2011 specified contract charge related to the Company’s contract with the U.K. National Health Service.(4) In fiscal 2011, the Company implemented a regular quarterly dividend.

22
Item 7. Management’s Discussion and Analysis of Financial Condition and Results of Operations
General
The following discussion and analysis provides information management believes is relevant to an assessment and understanding of the consolidated results of operations and financial condition of the Company. This discussion should be read in conjunction with the Company's consolidated financial statements and associated notes as of and for the year ended April 3, 2015.
There are three primary objectives of this discussion:
1. Provide a narrative on the consolidated financial statements, as presented through the eyes of management;2. Enhance the disclosures in the consolidated financial statements and footnotes by providing context within which the
consolidated financial statements should be analyzed; and3. Provide information to assist the reader in ascertaining the predictive value of the reported financial results.
To achieve these objectives, the management discussion and analysis is presented in the following sections:
Overview - includes a description of the Company's business, how it earns revenue and generates cash, as well as a discussion of economic and industry factors, key business drivers, key performance indicators and fiscal 2015 highlights.
Results of Operations - discusses year-over-year changes to operating results for fiscal 2013 through fiscal 2015, describing the factors affecting revenue on a consolidated and reportable segment basis, including new contracts, acquisitions and divestitures and currency impacts, and also describing the factors affecting changes in the Company's major cost and expense categories.
Financial Condition - discusses causes of changes in cash flows and describes the Company's liquidity and available capital resources.
Critical Accounting Estimates - discusses the significant accounting policies that require critical judgments and estimates.
Overview
CSC is a global leader of information technology (IT) and professional services and solutions. The Company's mission is to enable superior returns on our clients' technology investments through best-in-class industry solutions, domain expertise and global scale.
The Company’s reportable segments are as follows:
• Global Business Services (GBS) – GBS provides end-to-end applications services, consulting, big data, and industry-aligned software and solutions to enterprise clients around the world. GBS manages and industrializes clients' application ecosystem through its Applications Services offering. The company has formed a number of strategic partnerships with leading technology companies such as HCL Technologies and SAP to deliver world-class solutions to its customers. These partnerships will enable clients to modernize and move enterprise workloads to next generation cloud infrastructure, while leveraging the benefits of mobility, social networking and big data. The GBS consulting business assists clients in achieving greater value from current IT assets as well as aiding in the direction of future IT investments. GBS software and solutions include vertically-aligned solutions and process-based intellectual property. Clients include major global enterprises in the insurance, banking, healthcare, life sciences, manufacturing and a host of diversified industries. Key competitive differentiators for GBS include its global scale, depth of industry expertise, strong partnerships with leading technology companies, vendor and product independence and end-to-end capabilities. Changing business issues such as globalization, fast-developing economies, government regulation, and growing concerns around risk, security, and compliance drive demand for these GBS offerings.

23
• Global Infrastructure Services (GIS) – GIS provides managed and virtual desktop solutions, unified communications and collaboration services, data center management, cloud services, cyber security, compute and managed storage solutions to commercial clients globally. GIS also delivers next-generation hybrid Cloud infrastructure solutions to clients. The company integrates public cloud offerings from Amazon Web Services, IBM, Microsoft, and VMware, with its industry-leading private cloud solution, BizCloud. The CSC Agility Platform enables enterprises to manage, monitor, and automate applications over heterogeneous and hybrid clouds. The GIS portfolio of standard offerings delivers measurable results while reducing business risk and operational costs for clients. Collaboration with key alliance partners helps CSC to determine the best technology road map for clients and opportunities to differentiate solutions, expand market reach, augment capabilities, and jointly deliver impactful solutions.
• North American Public Sector (NPS) – NPS delivers IT, mission, and operations-related services to the Department of Defense and civil agencies of the U.S. federal government, as well as state and local government agencies. Commensurate with the Company's strategy of leading the next generation of IT services, NPS is leveraging our commercial best practices and next-generation offerings to bring more cost-effective IT solutions to government agencies which are seeking efficiency through innovation. This approach is designed to yield lower implementation and operational costs as well as a higher standard of delivery excellence. Demand for NPS offerings are driven by evolving government priorities such as: 1) migration to next-generation IT solutions, which includes hybrid cloud infrastructure, application modernization and orchestration, 2) mission intelligence driven by big data solutions, 3) health IT and informatics, and 4) cyber security.
On May 19, 2015, CSC's board of directors unanimously approved the announcement of a plan to separate (the Separation) CSC’s North American Public Sector business into an independent publicly traded company (CSC - U.S. Public Sector) the shares of which would be spun off in a distribution to holders of CSC shares on the record date. After the Separation, CSC would focus on serving commercial clients globally and public sector clients outside the United States. The Separation is intended to be tax free for federal income tax purposes. CSC also announced an intention to pay a special dividend of approximately $1.5 billion (or $10.50 per share) in cash concurrent with the Separation. It is currently expected that CSC - U.S. Public Sector will consist of substantially all the assets and operations currently comprising CSC's North American Public Sector reportable segment, and shortly prior to the Separation will incur approximately $1.5 billion in principal amount of debt as well as approximately $150 million in principal amount of pre-existing capital lease obligations outstanding. In addition, at the time of the Separation CSC - U.S. Public Sector is expected to have approximately $300 million in cash, and to assume substantially all CSC’s U.S. defined benefit plan obligations, together with receiving associated assets. Any assets and liabilities not transferred to CSC - U.S. Public Sector, including the Company's GBS and GIS reportable segments, will remain with CSC after the Separation.
Economic and Industry Factors
The Company's results of operations are impacted by economic conditions generally, including macroeconomic conditions. CSC monitors the macroeconomic conditions, the credit market conditions, and levels of business confidence, and assesses their potential impact on its customers and its own business. A severe and/or prolonged economic downturn could adversely affect the financial condition and the levels of business activities in the industries and geographies in which CSC operates. This may reduce demand for CSC's services or depress pricing of those services and have a material adverse effect on its new contract bookings and results of operations. Particularly in light of recent economic uncertainty, CSC continues to monitor its costs closely in order to respond to changing conditions and to manage any impact to its results of operations.
The Company's results of operations are also affected by levels of business activity and rates of change in the industries it serves, as well as by the pace of technological change and the type and level of technology spending by its clients. The ability to identify and capitalize on these markets and technological changes early in their cycles is a key driver of CSC's performance.
Revenues are driven by the Company's ability to secure new contracts and to deliver solutions and services that add value to its clients. CSC's ability to add value to clients, and therefore generate revenues, depends in part on its ability to deliver market-leading service offerings and to deploy skilled teams of professionals quickly and on a global basis.
The GBS and GIS segment markets are affected by various economic and industry factors. The economic environment in the regions CSC serves will impact customers' decisions for discretionary spending on IT projects. CSC is in a highly
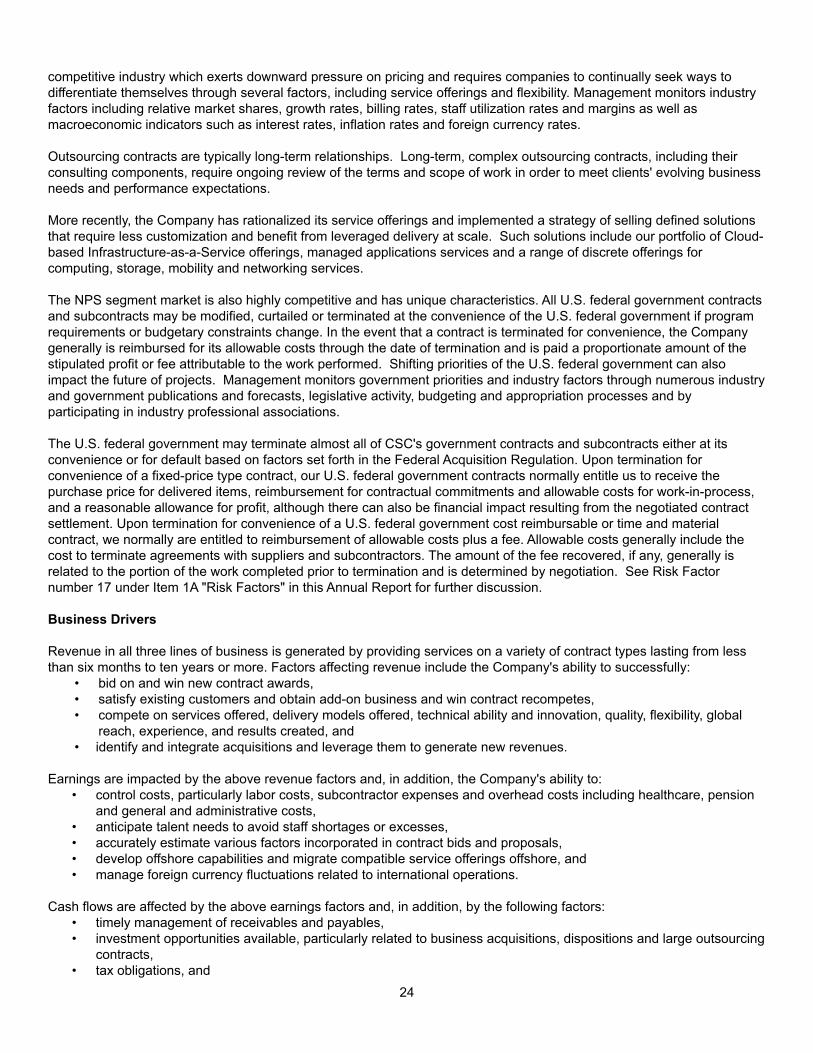
24
competitive industry which exerts downward pressure on pricing and requires companies to continually seek ways to differentiate themselves through several factors, including service offerings and flexibility. Management monitors industry factors including relative market shares, growth rates, billing rates, staff utilization rates and margins as well as macroeconomic indicators such as interest rates, inflation rates and foreign currency rates.
Outsourcing contracts are typically long-term relationships. Long-term, complex outsourcing contracts, including their consulting components, require ongoing review of the terms and scope of work in order to meet clients' evolving business needs and performance expectations.
More recently, the Company has rationalized its service offerings and implemented a strategy of selling defined solutions that require less customization and benefit from leveraged delivery at scale. Such solutions include our portfolio of Cloud-based Infrastructure-as-a-Service offerings, managed applications services and a range of discrete offerings for computing, storage, mobility and networking services.
The NPS segment market is also highly competitive and has unique characteristics. All U.S. federal government contracts and subcontracts may be modified, curtailed or terminated at the convenience of the U.S. federal government if program requirements or budgetary constraints change. In the event that a contract is terminated for convenience, the Company generally is reimbursed for its allowable costs through the date of termination and is paid a proportionate amount of the stipulated profit or fee attributable to the work performed. Shifting priorities of the U.S. federal government can also impact the future of projects. Management monitors government priorities and industry factors through numerous industry and government publications and forecasts, legislative activity, budgeting and appropriation processes and by participating in industry professional associations.
The U.S. federal government may terminate almost all of CSC's government contracts and subcontracts either at its convenience or for default based on factors set forth in the Federal Acquisition Regulation. Upon termination for convenience of a fixed-price type contract, our U.S. federal government contracts normally entitle us to receive the purchase price for delivered items, reimbursement for contractual commitments and allowable costs for work-in-process, and a reasonable allowance for profit, although there can also be financial impact resulting from the negotiated contract settlement. Upon termination for convenience of a U.S. federal government cost reimbursable or time and material contract, we normally are entitled to reimbursement of allowable costs plus a fee. Allowable costs generally include the cost to terminate agreements with suppliers and subcontractors. The amount of the fee recovered, if any, generally is related to the portion of the work completed prior to termination and is determined by negotiation. See Risk Factor number 17 under Item 1A "Risk Factors" in this Annual Report for further discussion.
Business Drivers
Revenue in all three lines of business is generated by providing services on a variety of contract types lasting from less than six months to ten years or more. Factors affecting revenue include the Company's ability to successfully:
• bid on and win new contract awards, • satisfy existing customers and obtain add-on business and win contract recompetes, • compete on services offered, delivery models offered, technical ability and innovation, quality, flexibility, global
reach, experience, and results created, and• identify and integrate acquisitions and leverage them to generate new revenues.
Earnings are impacted by the above revenue factors and, in addition, the Company's ability to: • control costs, particularly labor costs, subcontractor expenses and overhead costs including healthcare, pension
and general and administrative costs, • anticipate talent needs to avoid staff shortages or excesses, • accurately estimate various factors incorporated in contract bids and proposals, • develop offshore capabilities and migrate compatible service offerings offshore, and • manage foreign currency fluctuations related to international operations.
Cash flows are affected by the above earnings factors and, in addition, by the following factors: • timely management of receivables and payables, • investment opportunities available, particularly related to business acquisitions, dispositions and large outsourcing
contracts, • tax obligations, and

25
• the ability to efficiently manage capital deployed for outsourcing contracts, software, and property, plant and equipment.
Key Performance Indicators
The Company manages and assesses the performance of its business through various means, with the primary financial measures including new contract wins, revenue, operating margins, and free cash flow.
New contract wins: In addition to being a primary driver of future revenue, new contract wins also provide management an assessment of the Company's ability to compete. The total level of wins tends to fluctuate from year to year depending on the timing of new or recompeted contracts, as well as numerous external factors.
Revenue: Revenue is a product of contracts won in prior periods, known as backlog, and work secured in the current year. Year-over-year revenues tend to vary less than new contract wins, and reflect performance on both new and existing contracts. Foreign currency fluctuations also impact revenue.
Operating margins: Operating margins reflect the Company's performance on contracts and ability to control costs. While the ratios of various cost elements as a percentage of revenue can shift as a result of changes in the mix of businesses with different cost profiles, a focus on maintaining and improving overall margins leads to improved efficiencies and profitability. Although the majority of the Company's costs are denominated in the same currency as revenues, increased use of offshore support also exposes CSC to additional margin fluctuations.
Free cash flow: Primary drivers of the Company's free cash flow are earnings provided by the Company's operations and the use of capital to generate those earnings. Also contributing to short-term cash flow results are movements in current asset and liability balances.

26
Fiscal 2015 Highlights
The key operating results for fiscal 2015 include:
• Revenues decreased $825 million, or 6.3%, to $12,173 million compared to fiscal 2014. On a constant currency basis(1), revenues decreased $676 million, or 5.2%.
• Operating income(2) was $1,088 million as compared to $1,416 million in fiscal 2014. The operating income margins decreased to 8.9% from 10.9% in fiscal 2014. Operating income was adversely impacted by an increase in restructuring costs of $185 million during fiscal 2015. Restructuring costs were $261 million in fiscal 2015, including the fourth quarter special restructuring of $246 million, as compared to $76 million in fiscal 2014.
• (Loss) earnings before interest and taxes(3) (EBIT) decreased to $(148) million as compared to $1,394 million in fiscal 2014. The EBIT margin decreased to (1.2)% from 10.7% in fiscal 2014, largely as a result of the year-over-year increase in pension and OPEB actuarial losses of $1,041 million, and the SEC settlement related and other charges of $200 million.
(1) Selected references are made on a “constant currency basis” so that certain financial results can be viewed without the impact of fluctuations in foreign currency rates, thereby providing comparisons of operating performance from period to period. Financial results on a “constant currency basis” are non-U.S. Generally Accepted Accounting Principle (GAAP) measures calculated by translating current period activity into U.S. dollars using the comparable prior period’s currency conversion rates. This approach is used for all results where the functional currency is not the U.S. dollar.
(2) Operating income is a non-GAAP measure used by management to assess performance of the Company's segments and on a consolidated basis. The Company’s definition of such measure may differ from other companies. CSC defines operating income as revenue less costs of services, segment general and administrative (G&A) expense, depreciation and amortization expense, and restructuring costs. Operating income excludes corporate G&A, actuarial and settlement charges related to CSC's pension and other post-employment benefit (OPEB) plans, and SEC settlement related and other charges. Operating margin is defined as operating income as a percentage of revenue. Management compensates for the limitations of this non-GAAP measure by also reviewing income (loss) from continuing operations before taxes. A reconciliation of consolidated operating income to (loss) income from continuing operations before taxes is as follows:
Twelve Months Ended
(Amounts in millions) April 3, 2015 March 28, 2014 March 29, 2013
Operating income $ 1,088 $ 1,416 $ 961
Corporate G&A (242) (263) (293)
Pension & OPEB actuarial (losses) gains (782) 259 (297)
SEC settlement related charges and other (200) — —
Interest expense (148) (147) (183)
Interest Income 20 16 22
Other income, net (12) (18) 25
(Loss) income from continuing operations before taxes $ (276) $ 1,263 $ 235
(3) EBIT is a non-U.S. GAAP measure that provides useful information to investors regarding the Company's results of operations as it provides another measure of the Company's profitability, and is considered an important measure by financial analysts covering CSC and its peers. The Company’s definition of such measure may differ from that used by other companies. CSC defines EBIT as income from continuing operations less interest expense, interest income and income tax benefit (expense). EBIT margin is defined as EBIT as a percentage of revenue. A reconciliation of EBIT to income from continuing operations is as follows:
Twelve Months Ended(Amounts in millions) April 3, 2015 March 28, 2014 March 29, 2013(Loss) earnings before interest and taxes (EBIT) $ (148) $ 1,394 $ 396Interest expense (148) (147) (183)Interest income 20 16 22Income tax benefit (expense) 312 (383) 62Income from continuing operations $ 36 $ 880 $ 297
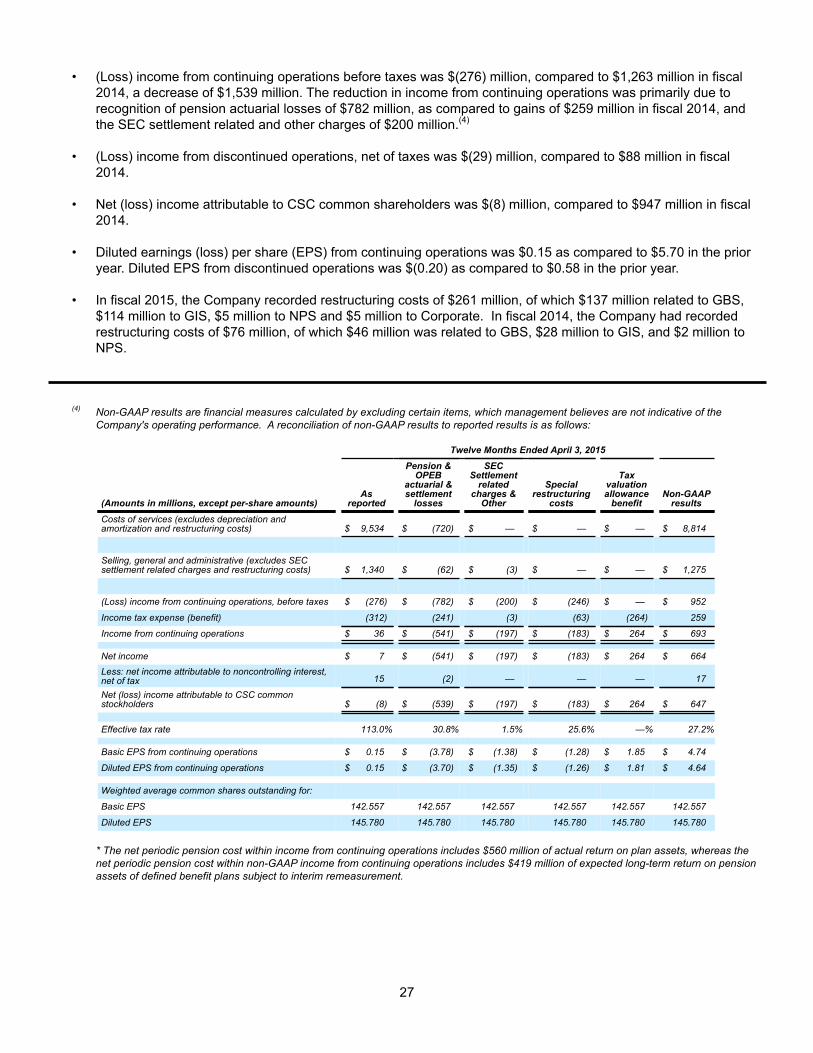
27
• (Loss) income from continuing operations before taxes was $(276) million, compared to $1,263 million in fiscal 2014, a decrease of $1,539 million. The reduction in income from continuing operations was primarily due to recognition of pension actuarial losses of $782 million, as compared to gains of $259 million in fiscal 2014, and the SEC settlement related and other charges of $200 million.(4)
• (Loss) income from discontinued operations, net of taxes was $(29) million, compared to $88 million in fiscal 2014.
• Net (loss) income attributable to CSC common shareholders was $(8) million, compared to $947 million in fiscal 2014.
• Diluted earnings (loss) per share (EPS) from continuing operations was $0.15 as compared to $5.70 in the prior year. Diluted EPS from discontinued operations was $(0.20) as compared to $0.58 in the prior year.
• In fiscal 2015, the Company recorded restructuring costs of $261 million, of which $137 million related to GBS, $114 million to GIS, $5 million to NPS and $5 million to Corporate. In fiscal 2014, the Company had recorded restructuring costs of $76 million, of which $46 million was related to GBS, $28 million to GIS, and $2 million to NPS.
(4) Non-GAAP results are financial measures calculated by excluding certain items, which management believes are not indicative of the Company's operating performance. A reconciliation of non-GAAP results to reported results is as follows:
Twelve Months Ended April 3, 2015
(Amounts in millions, except per-share amounts)As
reported
Pension &OPEB
actuarial &settlement
losses
SECSettlement
relatedcharges &
Other
Specialrestructuring
costs
Taxvaluationallowance
benefitNon-GAAP
results
Costs of services (excludes depreciation andamortization and restructuring costs) $ 9,534 $ (720) $ — $ — $ — $ 8,814
Selling, general and administrative (excludes SECsettlement related charges and restructuring costs) $ 1,340 $ (62) $ (3) $ — $ — $ 1,275
(Loss) income from continuing operations, before taxes $ (276) $ (782) $ (200) $ (246) $ — $ 952
Income tax expense (benefit) (312) (241) (3) (63) (264) 259
Income from continuing operations $ 36 $ (541) $ (197) $ (183) $ 264 $ 693
Net income $ 7 $ (541) $ (197) $ (183) $ 264 $ 664Less: net income attributable to noncontrolling interest,net of tax 15 (2) — — — 17
Net (loss) income attributable to CSC commonstockholders $ (8) $ (539) $ (197) $ (183) $ 264 $ 647
Effective tax rate 113.0% 30.8% 1.5% 25.6% —% 27.2%
Basic EPS from continuing operations $ 0.15 $ (3.78) $ (1.38) $ (1.28) $ 1.85 $ 4.74
Diluted EPS from continuing operations $ 0.15 $ (3.70) $ (1.35) $ (1.26) $ 1.81 $ 4.64
Weighted average common shares outstanding for:
Basic EPS 142.557 142.557 142.557 142.557 142.557 142.557
Diluted EPS 145.780 145.780 145.780 145.780 145.780 145.780
* The net periodic pension cost within income from continuing operations includes $560 million of actual return on plan assets, whereas the net periodic pension cost within non-GAAP income from continuing operations includes $419 million of expected long-term return on pension assets of defined benefit plans subject to interim remeasurement.

28
Twelve Months Ended March 28, 2014
(Amounts in millions, except per-share amounts) As reported
Pension andOPEB
actuarialgains
Reversal ofcontingent
considerationNon-GAAP
results
Costs of services (excludes depreciation and amortization andrestructuring costs) $ 9,272 $ 212 $ — $ 9,484
Selling, general and administrative (excludes SEC settlement relatedcharges and restructuring costs) $ 1,220 $ 47 $ 21 $ 1,288
Income from continuing operations, before taxes $ 1,263 $ 259 $ 21 $ 983
Income tax expense 383 64 — 319
Income from continuing operations $ 880 $ 195 $ 21 $ 664
Net income $ 968 $ 195 $ 21 $ 752
Less: net income attributable to noncontrolling interest, net of tax 21 — — 21
Net income attributable to CSC common stockholders $ 947 $ 195 $ 21 $ 731
Effective tax rate 30.3% 24.7% —% 32.5%
Basic EPS from continuing operations $ 5.81 $ 1.32 $ 0.14 $ 4.35
Diluted EPS from continuing operations $ 5.70 $ 1.29 $ 0.14 $ 4.27
Weighted average common shares outstanding for:
Basic EPS 147.647 147.647 147.647 147.647
Diluted EPS 150.761 150.761 150.761 150.761
* The net periodic pension cost within income from continuing operations includes $500 million of actual return on plan assets, whereas the net periodicpension cost within non-GAAP income from continuing operations includes $384 million of expected long-term return on pension assets of defined benefit plans subject to interim remeasurement.
Twelve Months March 29, 2013
(Amounts in millions, except per-share amounts) As reported
Pensionand OPEBactuariallosses
Non-GAAPresults
Costs of services (excludes depreciation and amortization and restructuring costs) $ 11,293 $ (268) $ 11,025
Selling, general and administrative (excludes SEC settlement related charges andrestructuring costs) $ 1,197 $ (29) $ 1,168
Income (loss) from continuing operations, before taxes $ 235 $ (297) $ 532
Income tax benefit (62) (39) (23)
Income (loss) from continuing operations $ 297 $ (258) $ 555
Net income (loss) $ 779 $ (258) $ 1,037
Less: net income attributable to noncontrolling interest, net of tax 19 — 19
Net income (loss) attributable to CSC common stockholders $ 760 $ (258) $ 1,018
Effective tax rate (26.4)% 13.1% (4.3)%
Basic EPS from continuing operations $ 1.80 $ (1.67) $ 3.47
Diluted EPS from continuing operations $ 1.79 $ (1.66) $ 3.45
Weighted average common shares outstanding for:
Basic EPS 154.590 154.590 154.590
Diluted EPS 155.557 155.557 155.557
* The net periodic pension cost within income from continuing operations includes $558 million of actual return on plan assets, whereas the net periodicpension cost within non-GAAP income from continuing operations includes $292 million of expected long-term return on pension assets of defined benefit plans subject to interim remeasurement.
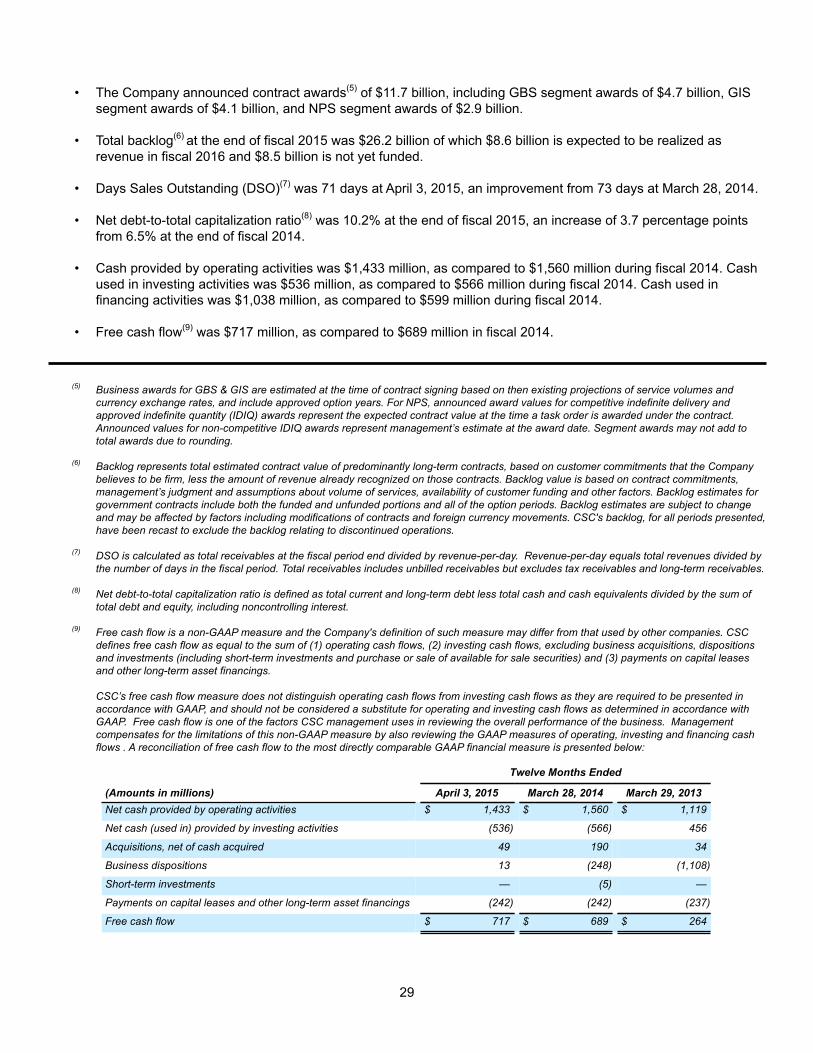
29
• The Company announced contract awards(5) of $11.7 billion, including GBS segment awards of $4.7 billion, GIS segment awards of $4.1 billion, and NPS segment awards of $2.9 billion.
• Total backlog(6) at the end of fiscal 2015 was $26.2 billion of which $8.6 billion is expected to be realized as revenue in fiscal 2016 and $8.5 billion is not yet funded.
• Days Sales Outstanding (DSO)(7) was 71 days at April 3, 2015, an improvement from 73 days at March 28, 2014.
• Net debt-to-total capitalization ratio(8) was 10.2% at the end of fiscal 2015, an increase of 3.7 percentage points from 6.5% at the end of fiscal 2014.
• Cash provided by operating activities was $1,433 million, as compared to $1,560 million during fiscal 2014. Cash used in investing activities was $536 million, as compared to $566 million during fiscal 2014. Cash used in financing activities was $1,038 million, as compared to $599 million during fiscal 2014.
• Free cash flow(9) was $717 million, as compared to $689 million in fiscal 2014.
(5) Business awards for GBS & GIS are estimated at the time of contract signing based on then existing projections of service volumes and currency exchange rates, and include approved option years. For NPS, announced award values for competitive indefinite delivery and approved indefinite quantity (IDIQ) awards represent the expected contract value at the time a task order is awarded under the contract. Announced values for non-competitive IDIQ awards represent management’s estimate at the award date. Segment awards may not add to total awards due to rounding.
(6) Backlog represents total estimated contract value of predominantly long-term contracts, based on customer commitments that the Company believes to be firm, less the amount of revenue already recognized on those contracts. Backlog value is based on contract commitments, management’s judgment and assumptions about volume of services, availability of customer funding and other factors. Backlog estimates for government contracts include both the funded and unfunded portions and all of the option periods. Backlog estimates are subject to change and may be affected by factors including modifications of contracts and foreign currency movements. CSC's backlog, for all periods presented, have been recast to exclude the backlog relating to discontinued operations.
(7) DSO is calculated as total receivables at the fiscal period end divided by revenue-per-day. Revenue-per-day equals total revenues divided by the number of days in the fiscal period. Total receivables includes unbilled receivables but excludes tax receivables and long-term receivables.
(8) Net debt-to-total capitalization ratio is defined as total current and long-term debt less total cash and cash equivalents divided by the sum of total debt and equity, including noncontrolling interest.
(9) Free cash flow is a non-GAAP measure and the Company's definition of such measure may differ from that used by other companies. CSC defines free cash flow as equal to the sum of (1) operating cash flows, (2) investing cash flows, excluding business acquisitions, dispositions and investments (including short-term investments and purchase or sale of available for sale securities) and (3) payments on capital leases and other long-term asset financings.
CSC’s free cash flow measure does not distinguish operating cash flows from investing cash flows as they are required to be presented in accordance with GAAP, and should not be considered a substitute for operating and investing cash flows as determined in accordance with GAAP. Free cash flow is one of the factors CSC management uses in reviewing the overall performance of the business. Management compensates for the limitations of this non-GAAP measure by also reviewing the GAAP measures of operating, investing and financing cash flows . A reconciliation of free cash flow to the most directly comparable GAAP financial measure is presented below:
Twelve Months Ended
(Amounts in millions) April 3, 2015 March 28, 2014 March 29, 2013Net cash provided by operating activities $ 1,433 $ 1,560 $ 1,119
Net cash (used in) provided by investing activities (536) (566) 456
Acquisitions, net of cash acquired 49 190 34
Business dispositions 13 (248) (1,108)
Short-term investments — (5) —
Payments on capital leases and other long-term asset financings (242) (242) (237)
Free cash flow $ 717 $ 689 $ 264

30
Results of Operations Revenues
Revenues for the GBS, GIS, and NPS segments for fiscal 2015, 2014, and 2013 are as follows:
Twelve Months EndedApril 3, 2015 March 28, 2014 March 29, 2013
(Amounts in millions) AmountPercentChange Amount
PercentChange Amount
GBS $ 4,036 (6.6)% $ 4,321 (10.8)% $ 4,844GIS 4,080 (10.9) 4,578 (2.4) 4,689NPS 4,057 (1.0) 4,099 (12.1) 4,662Total Revenue $ 12,173 (6.3)% $ 12,998 (8.4)% $ 14,195
The major factors affecting the percent change in revenues are presented as follows:
Twelve Months EndedApril 3, 2015 vs. March 28, 2014 Acquisitions
ApproximateImpact ofCurrency
Fluctuations
OrganicGrowth
(Decline) TotalGBS — (1.9)% (4.7)% (6.6)%GIS 0.5% (1.5) (9.9) (10.9)NPS 0.4 — (1.4) (1.0)Cumulative Net Percentage 0.3% (1.1)% (5.5)% (6.3)%
Twelve Months EndedMarch 28, 2014 vs. March 29, 2013 Acquisitions
ApproximateImpact ofCurrency
Fluctuations
OrganicGrowth
(Decline) TotalGBS — — (10.8)% (10.8)%GIS 0.4% (0.6)% (2.2) (2.4)NPS 0.1 (0.1) (12.1) (12.1)Cumulative Net Percentage 0.2% (0.2)% (8.4)% (8.4)%
The Company's fiscal 2015 revenue decreased $825 million as compared to fiscal 2014. This decrease was primarily due to a reduction in organic revenue of $720 million and the adverse impact of foreign currency movement of $149 million, partially offset by $44 million of revenue from acquisitions. The fiscal 2015 revenue reduction was primarily related to CSC's commercial sector, and was due to revenues from new business not keeping pace with revenue reductions due to contract completion and termination and contractual price reductions.
The Company's fiscal 2014 revenue decreased $1,197 million as compared to fiscal 2013. This decrease was primarily due to a reduction in organic revenue of $1,188 million and the adverse impact of foreign currency movement of $33 million, partially offset by $24 million of revenue from acquisitions. The fiscal 2014 revenue reduction was due to lower commercial revenue from new contracts as compared to revenue reduction from contract completion and terminations, and also due to the adverse impact of the budget pressures facing the U.S. federal government and the consequent spending reductions and sequestration.
31
Global Business Services Fiscal 2015
GBS segment revenue decreased $285 million, or 6.6%, as compared to fiscal 2014. In constant currency, revenue decreased $205 million or 4.7%. The unfavorable foreign currency impact was due to the strengthening of the U.S. dollar against most currencies except the British pound.
The decrease in GBS' revenue of $205 million was mainly due to lower revenue from its consulting and applications offerings. These consulting revenue decreases were primarily due to project completions not fully offset by new business. The consulting revenue was also adversely impacted by the continuing repositioning of the business from a partner-led model to a more industry-focused technology consulting model. The U.K. region, where the repositioning of the consulting business was first initiated had year-over-year revenue increases. In addition, consulting's year-over-year trend was adversely impacted by $36 million of revenue recognized in fiscal 2014 that did not recur in fiscal 2015, as a result of initiation of revenue recognition on a contract where revenue was previously deferred under software accounting rules. The decrease in applications business was due to the contracts winding down or completed not fully replaced by new business. These decreases in GBS revenue were partially offset by $23 million of adverse fiscal 2014 revenue adjustments, within the industry software and solutions (IS&S) group, which did not repeat in fiscal 2015.
During fiscal 2015, GBS had contract awards of $4.7 billion compared to $6.1 billion in fiscal 2014.
Fiscal 2014
GBS segment revenue decreased $523 million, or 10.8%, as compared to fiscal 2013. In constant currency, revenue decreased $522 million, or 10.8%.
GBS revenue was unfavorably impacted by certain fiscal 2013 revenues that did not recur in fiscal 2014. These principally included revenues from the fiscal 2013 divestiture of the Company's Australian information technology staffing business unit (Paxus) of $216 million (see Note 5 to the Consolidated Financial Statements) and $55 million of milestone revenue realized on the U.K. National Health Service (the NHS) contract during the first quarter of fiscal 2013. In addition, fiscal 2014 GBS revenue was adversely impacted by adjustments of $23 million on certain contracts within the IS&S group and net year-over-year adverse revenue adjustments of $19 million on contracts accounted for under the percentage-of-completion method.
Excluding the effect of the items mentioned above, GBS fiscal 2014 revenue decreased $210 million, or 4.3%, over the prior year. Of the total revenue decrease, $388 million was attributable primarily to GBS' efforts to reposition its consulting business to a partner-led model, and continuing challenging economic conditions and associated business performance, primarily in Australia and in the Central Europe regions. These revenue decreases were partially offset by $169 million of revenue growth on certain existing and new contracts.
During fiscal 2014, GBS had contract awards of $6.1 billion compared to $7.7 billion in fiscal 2013.
Global Infrastructure Services
Fiscal 2015
GIS segment revenue decreased $498 million, or 10.9%, as compared to fiscal 2014. In constant currency, revenue decreased $429 million, or 9.4%. The unfavorable foreign currency impact was due to the strengthening of the U.S. dollar against most currencies except the British pound.
The decrease in GIS' revenue of $429 million was primarily a result of reduced revenue of $252 million from contracts that terminated or concluded, lower revenue of $354 million due to price-downs and restructured contracts, and $31 million of lower pass-through revenue. Partially offsetting these decreases was increased revenue of $208 million from new business and net growth on existing contracts, and from the next generation cloud and cyber security offerings.
During fiscal 2015, GIS had contract awards with a total value of $4.1 billion compared to $4.1 billion during fiscal 2014.

32
Fiscal 2014
GIS segment revenue decreased $111 million, or 2.4%, as compared to fiscal 2013. In constant currency, revenue decreased $83 million, or 1.8%. The unfavorable foreign currency impact was primarily due to unfavorable movement in the U.S. dollar against the Australian dollar, Canadian dollar, and Japanese yen, partially offset by favorable movement in the U.S. dollar against the euro, Danish kroner, and the British pound.
The decrease in GIS' net internal revenue for fiscal 2014 of $101 million was due to reduced revenue of $97 million from contracts that terminated or concluded and reduced revenue of $171 million due to price-downs and restructured contracts. Partially offsetting these decreases was increased net revenue of $167 million.
During fiscal 2014, GIS had contract awards with a total value of $4.1 billion as compared to $3.2 billion during fiscal 2013.
North American Public Sector
The Company’s NPS Sector segment revenues were derived from the following sources:
Twelve Months EndedApril 3, 2015 March 28, 2014 March 29, 2013
Dollars in millions AmountPercent Change Amount
PercentChange Amount
Department of Defense $ 2,177 (9.3)% $ 2,401 (15.7)% $ 2,848Civil agencies 1,543 3.1 1,497 (6.4) 1,600Other (1) 337 67.7 201 (6.1) 214Total $ 4,057 (1.0)% $ 4,099 (12.1)% $ 4,662
(1) Other revenues consist of foreign, state and local government work as well as commercial contracts performed by the NPS segment.
Fiscal 2015
NPS segment revenue decreased $42 million, or 1.0%, as compared to fiscal 2014. This decline was primarily attributable to Department of Defense (DOD) contracts, partially offset by revenue increase from Civil Agencies (Civil) and Other contracts.
Revenues from DOD decreased $224 million, or 9.3%. These revenue decreases included reduced revenue of $62 million on certain contracts that either had concluded or were winding down, and reduced revenue of $188 million due to a net reduction in tasking on existing contracts. These decreases were partially offset by revenue of $18 million from an acquired entity and $8 million from a new contract.
Revenue from Civil Agencies contracts increased $46 million, or 3.1%. The revenue increase was due to a net increase in tasking of $65 million on existing contracts, and an increase of $51 million on new contracts. These increases were partially offset by lower revenue of $70 million on contracts that had concluded or were winding down.
NPS won contracts of $2.9 billion during fiscal 2015 compared to $4.3 billion during fiscal 2014.
We see positive signs in this year's federal government budget. The budget request for Defense when coupled with the congressional additions in their budget resolutions will likely continue the trend of the last two years to negotiate sequester relief, first for DoD and then a negotiated increase for non-Defense domestic discretionary spending:
• DoD budget outlays are projected to increase in fiscal 2016 given the large increase in requested base budget funding. Estimated addressable contract obligations will have positive growth.
• Overall IT spending in DoD is projected to increase by 1.6% in fiscal 2016 to $30.5 billion.• The Intelligence Community budget request increased from $62.7 billion in fiscal 2015 to $72 billion fiscal 2016.• We are experiencing increased activity to extend the period of performance for our large and most complex IT
contracts; seeing increased procurement activity across the federal government; and expect adjudications to increase.

33
Fiscal 2014
NPS segment revenue for fiscal 2014 decreased $563 million, or 12.1%, as compared to fiscal 2013. This decline was mainly due to decreases on its DOD and Civil contracts of $447 million, or 15.7%, and $103 million, or 6.4%, respectively.
The revenue decreases on DOD contracts comprised of reduced revenue of $169 million on certain contracts that either had concluded or were winding down. Revenue decreases of $345 million were attributable to a net reduction in tasking on existing contracts and were partially offset by net favorable revenue adjustments of $18 million on contracts accounted for under the percentage-of-completion method. These revenue decreases were further offset by increased revenue of $52 million on new contracts.
Revenue decrease on contracts with Civil Agencies was due to a reduction in scope and tasking on existing contracts of $88 million and reduced revenue of $91 million due to programs winding down or ending. These revenue decreases were partially offset by new tasking on existing contracts of $41 million on contracts and net favorable adjustments of $37 million on contracts accounted for under the percentage-of-completion method.
NPS won new contracts of $4.3 billion during fiscal 2014 as compared to $3.2 billion during fiscal 2013.
Costs and Expenses
The Company’s total costs and expenses were as follows:
Twelve Months Ended Percentage of Revenue
Dollars in millionsApril 3,
2015March 28,
2014March 29,
2013 2015 2014 2013Costs of services (excludes depreciation andamortization and restructuring costs) $ 9,534 $ 9,272 $ 11,293 78.4% 71.4% 79.6%
Selling, general and administrative (excludes SECsettlement related charges and restructuring costs) 1,340 1,220 1,197 11.0 9.4 8.4
Selling, general and administrative - SEC settlementrelated charges 197 — — 1.6 — —Depreciation and amortization 977 1,018 1,070 8.0 7.8 7.5Restructuring costs 261 76 264 2.1 0.6 1.9Interest expense, net 128 131 161 1.1 1.0 1.1Other expense (income), net 12 18 (25) 0.1 0.1 (0.2)Total costs $ 12,449 $ 11,735 $ 13,960 102.3% 90.3% 98.3%
The year-over-year trend of total costs has been impacted by the recognition of pension actuarial (gains) losses, in accordance with the Company's new accounting policy for defined benefit plans (See Note 15 of the Consolidated Financial Statements for further discussion). Total costs for fiscal 2015 increased by $1,041 million as compared to fiscal 2014, and total costs for fiscal 2014 had decreased $556 million as compared to fiscal 2013, due to pension actuarial losses. Excluding the impact of pension actuarial losses and restructuring costs, the total costs as a percentage of revenue for fiscal 2015, 2014, and 2013 were 93.7%, 91.7%, and 94.4%, respectively. Costs of services include $720 million, $(212) million, and $268 million of pension actuarial losses (gains) for fiscal 2015, 2014, and 2013, respectively. Similarly, selling, general and administrative expenses include $62 million, $(47) million, and $29 million of pension actuarial losses (gains) for fiscal 2015, 2014, and 2013, respectively.
Costs of Services
Fiscal 2015
Costs of services (COS), excluding restructuring charges ($253 million and $70 million, for fiscal 2015 and 2014, respectively), and depreciation and amortization, as a percentage of revenue, increased to 78.4% for fiscal 2015 from 71.4% for fiscal 2014. The increase in the COS ratio is attributable to the year-over-year unfavorable impact of $932 million resulting from recognition of pension and OPEB actuarial losses associated with the Company's defined benefit

34
plans. For fiscal 2015, the Company recognized $720 million of net actuarial losses, compared to $212 million of net actuarial gains in fiscal 2014. Excluding the impact of the pension adjustments described above, the COS ratio for fiscal 2015 was 72.4%, and it decreased 0.6 percentage points from the fiscal 2014 ratio of 73.0%.
The decrease in the COS ratio, was largely due to lower year-over-year headcount resulting from management's restructuring efforts that were directed to align resources to support business needs, and other initiatives to reduce costs. The reduction in the COS ratio due to these activities more than offset the impact of decreased revenues. In addition, the COS ratio benefited from the gain of $53 million on sale of certain intangible assets.
Fiscal 2014
COS, excluding depreciation and amortization and restructuring charges of $70 million and $238 million, for fiscal 2014 and 2013, respectively, as a percentage of revenue decreased to 71.4% for fiscal 2014 from 79.6% for fiscal 2013. Overall, the fiscal 2014 COS ratio for the Company was favorably impacted by lower headcount resulting from management's restructuring efforts that were directed to align resources to support business needs, including the assessment of management span of control and layers. Lower year-over-year total compensation and overall reduced spending also impacted the COS ratio favorably. In addition, the COS ratio was favorably impacted by certain commercial account management previously engaged in the contract delivery activities (which rolled up under COS) in fiscal 2013, being redirected to focus on sales activities in fiscal 2014. The COS ratio also benefited from a year-over-year favorable cost impact of $480 million resulting from changes in pension actuarial gains and losses. Fiscal 2014 had pension actuarial gains of $212 million, as compared to pension actuarial losses of $268 million in fiscal 2013.
The GBS ratio for fiscal 2014 benefited from year-over year net favorable cost impact of $50 million, partially offset by net adverse revenue impact of $19 million, due to adjustments on contracts accounted under the percentage-of-completion method.
The GIS COS ratio for fiscal 2014 benefited from the continuing focus on delivery on certain key contracts resulted in better margins including reduced start-up issues on new contracts. This reduction is mainly driven by ongoing operational improvements on focus accounts, the positive effects of restructuring taken over previous periods and the continued focus on cost reductions driven by standardization of products and processes.
The NPS COS ratio for fiscal 2014 benefited from year-over-year net favorable revenue impact of $50 million, partially offset by year-over year net adverse cost impact of $23 million, due to adjustments on contracts accounted under the percentage-of-completion method. Included in the adverse costs adjustments was a favorable cost adjustment in the third quarter of fiscal 2013 of $34 million from a contract settlement with the U.S. government, which did not recur in fiscal 2014.
Selling, General and Administrative
Fiscal 2015
Selling, general and administrative (SG&A) expense, excluding the SEC settlement related charges of $197 million and restructuring charges of $8 million and $6 million for fiscal 2015 and 2014, respectively, as a percentage of revenue, increased to 11.0% for fiscal 2015 from 9.4% for fiscal 2014.
The increase in the fiscal 2015 SG&A ratio was primarily attributable to the year-over-year unfavorable impact of $109 million resulting from recognition of pension and OPEB actuarial losses associated with the Company's defined benefit plans. For fiscal 2015, the Company recognized $62 million of net actuarial losses, compared to $47 million of net actuarial gains in fiscal 2014. The fiscal 2015 SG&A ratio was also unfavorably impacted by $21 million gain recognized in fiscal 2014, resulting from reversal of contingent consideration related to the fiscal 2014 acquisition of ServiceMesh, Inc., which did not repeat in fiscal 2015 (see Note 4 to the Consolidated Financial Statements). Excluding the impact of the pension and OPEB adjustments and the ServiceMesh related gain described above, the SG&A ratio for fiscal 2015 was 10.5% and it increased 0.6% percentage points from the fiscal 2014 ratio of 9.9%.
The higher SG&A ratio for fiscal 2015 was due to lower revenues, increase in bid and proposal spend mainly within GIS and NPS segments, and greater investments in the sales coverage and sales support functions within the GBS and GIS segments. The year-over-year SG&A ratio comparison was also adversely impacted due to redirecting of certain account-

35
focused executives, who were previously engaged in contract delivery activities and included within COS, to focus on sales activities effective the second quarter of fiscal 2014.
Corporate general and administrative expenses (Corporate G&A) for fiscal 2015 were $242 million, as compared to $263 million for 2014. The decrease in Corporate G&A was due to management's overhead reduction initiatives.
Fiscal 2014
SG&A expense, excluding restructuring charges ($6 million and $26 million for fiscal 2014 and 2013, respectively), as a percentage of revenue, increased to 9.4% for fiscal 2014 from 8.4% for fiscal 2013. The fiscal 2014 increase was primarily due to management's decision to expand market coverage through a larger dedicated global commercial sales force in line with the overall business strategy surrounding next-generation IT services. As per this strategy, certain account-focused executives in the commercial space, who were previously engaged in the contract delivery activities which rolled up under COS in fiscal 2013, were redirected to focus on sales activities in fiscal 2014. In addition, the Company made new investments in its commercial sales force by making incremental hires of sales personnel. In addition, the SG&A ratio increased due to increased investments in the next-generation offerings. Separately, 0.8% points of the increase in the SG&A ratio was due to reduced fiscal 2014 revenues. Partially offsetting these increases was a favorable year-over-year impact of $76 million resulting from changes in pension actuarial gains and losses.
Offsetting the increases in the SG&A ratio described above were benefits from the reduced amount of contingent consideration payable in connection with the ServiceMesh acquisition; total lower compensation expense, excluding the impact of restructuring actions and the sales personnel mentioned above; and reduced bid and proposal spend by NPS.
During the fourth quarter of fiscal 2014, the Company finalized the amount of contingent consideration payable for the ServiceMesh, Inc. acquisition at $98 million. This amount was $21 million lower than the $119 million amount accrued at the end of the third quarter, primarily due to the deferral of revenues related to certain software license sales to periods beyond the specified earn-out measurement period (see Note 5 to the Consolidated Financial Statements). This gain of $21 million was recorded as an offset to general & administrative expenses, which benefited the SG&A ratio.
Corporate general and administrative expenses for fiscal 2014 were $263 million, as compared to $293 million for 2013. The reduction in corporate general and administrative expenses was primarily due to lower net expense on legal settlement, legal expenses on shareholder derivative lawsuits, and legal expenses on SEC investigation of $65 million, partially offset by higher costs associated with the Company's financial transformation project of $19 million, and higher stock-based compensation of $16 million.
Selling, general and administrative - SEC settlement related charges
During the third quarter of fiscal 2015, the Company reached an understanding with the staff of the SEC regarding a settlement of a formal civil investigation by the SEC that commenced on January 28, 2011 and covered a range of matters as previously disclosed, including certain of the Company's prior disclosures and accounting determinations. As part of the Company’s understanding with the staff of the SEC regarding terms of the settlement, the Company agreed to pay a penalty of $190 million and to implement a review of its compliance policies through an independent compliance consultant. The Company recorded pre-tax charges of $197 million for the penalty and related expenses in fiscal 2015.
During the first quarter of fiscal 2016, the agreed-upon settlement with the SEC was formally approved by the SEC and became effective on June 5, 2015 and the Company has agreed, in addition to the payment of the fine and the engagement of the compliance consultant referenced above, to cease and desist from further violations of the anti-fraud, reporting, and books-and-records provisions of the U.S. securities laws. As part of the settlement, the Company has neither admitted nor denied the SEC’s allegations concerning such matters. Further, as part of the settlement, on June 5, 2015, the Company filed its Form 10-K/A in respect of its fiscal year ended March 28, 2014 in order to restate its financial statements for fiscal 2012 and its summary financial results for fiscal 2011 and 2010 reflected in the five year financial data table, all as previously set forth in the Company’s originally filed Form 10-K for its 2014 fiscal year. The restatement had no impact on the Company’s Consolidated Balance Sheets, Statements of Operations, Statements of Comprehensive Income (Loss), Statements of Cash Flows and Statements of Changes in Equity for fiscal 2013 or fiscal 2014 or on its financial statements for fiscal 2015. See Note 2 to the Consolidated Financial Statements for additional information regarding the settlement of the SEC investigation.
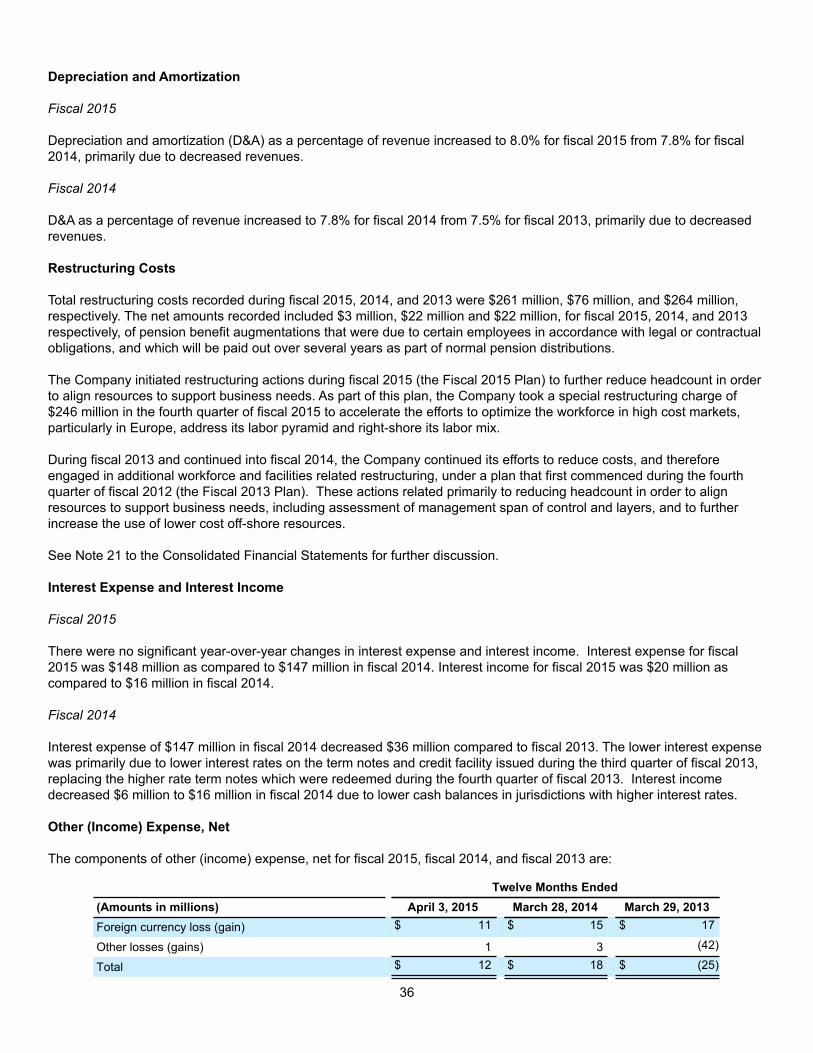
36
Depreciation and Amortization
Fiscal 2015
Depreciation and amortization (D&A) as a percentage of revenue increased to 8.0% for fiscal 2015 from 7.8% for fiscal 2014, primarily due to decreased revenues.
Fiscal 2014
D&A as a percentage of revenue increased to 7.8% for fiscal 2014 from 7.5% for fiscal 2013, primarily due to decreased revenues.
Restructuring Costs
Total restructuring costs recorded during fiscal 2015, 2014, and 2013 were $261 million, $76 million, and $264 million, respectively. The net amounts recorded included $3 million, $22 million and $22 million, for fiscal 2015, 2014, and 2013 respectively, of pension benefit augmentations that were due to certain employees in accordance with legal or contractual obligations, and which will be paid out over several years as part of normal pension distributions.
The Company initiated restructuring actions during fiscal 2015 (the Fiscal 2015 Plan) to further reduce headcount in order to align resources to support business needs. As part of this plan, the Company took a special restructuring charge of $246 million in the fourth quarter of fiscal 2015 to accelerate the efforts to optimize the workforce in high cost markets, particularly in Europe, address its labor pyramid and right-shore its labor mix.
During fiscal 2013 and continued into fiscal 2014, the Company continued its efforts to reduce costs, and therefore engaged in additional workforce and facilities related restructuring, under a plan that first commenced during the fourth quarter of fiscal 2012 (the Fiscal 2013 Plan). These actions related primarily to reducing headcount in order to align resources to support business needs, including assessment of management span of control and layers, and to further increase the use of lower cost off-shore resources.
See Note 21 to the Consolidated Financial Statements for further discussion.
Interest Expense and Interest Income
Fiscal 2015
There were no significant year-over-year changes in interest expense and interest income. Interest expense for fiscal 2015 was $148 million as compared to $147 million in fiscal 2014. Interest income for fiscal 2015 was $20 million as compared to $16 million in fiscal 2014.
Fiscal 2014
Interest expense of $147 million in fiscal 2014 decreased $36 million compared to fiscal 2013. The lower interest expense was primarily due to lower interest rates on the term notes and credit facility issued during the third quarter of fiscal 2013, replacing the higher rate term notes which were redeemed during the fourth quarter of fiscal 2013. Interest income decreased $6 million to $16 million in fiscal 2014 due to lower cash balances in jurisdictions with higher interest rates.
Other (Income) Expense, Net
The components of other (income) expense, net for fiscal 2015, fiscal 2014, and fiscal 2013 are:
Twelve Months Ended(Amounts in millions) April 3, 2015 March 28, 2014 March 29, 2013Foreign currency loss (gain) $ 11 $ 15 $ 17
Other losses (gains) 1 3 (42)
Total $ 12 $ 18 $ (25)

37
Fiscal 2015
The foreign currency loss decreased by $4 million due to favorable movement in exchange rates between the U.S. dollar and the Indian Rupee, which favorably impacted the Company's foreign currency economic hedges.
Fiscal 2014
The foreign currency loss decreased by $2 million due to currency rate movements which favorably impacted the Company's hedging program. Reduction in other gains is primarily due to fiscal 2013 gains on the sale of Paxus that did not recur in fiscal 2014.
Taxes
The Company's effective tax rate (ETR) on (loss) income from continuing operations for fiscal years 2015, 2014, and 2013 was (113.0)%, 30.3%, and (26.4)%, respectively. As a global enterprise, our ETR is affected by many factors, including our global mix of earnings, the extent to which those global earnings are indefinitely reinvested outside the U.S., legislation, acquisitions, dispositions, and tax characteristics of our income. Our tax returns are routinely audited and settlements of issues raised in these audits sometimes affect our tax provisions. A reconciliation of the differences between the U.S. federal statutory rate and the ETR, as well as other information about our income tax provision, is provided in Note 13 to the Consolidated Financial Statements. For the tax impact of discontinued operations, see Note 5 to the Consolidated Financial Statements.
In fiscal year 2015, the ETR was primarily driven by:• The impact of the non-deductible SEC settlement of $190 million, which decreased the income tax benefit and
the ETR by $73 million, or 26.4%, respectively.• Changes in valuation allowances in certain non-U.S. jurisdictions, including a valuation allowance release in the
United Kingdom. The total impact of the valuation allowance release increased the income tax benefit and the ETR by $235 million, or 85.2%. There was a net decrease in valuation allowances in fiscal year 2015.
In fiscal year 2014, the ETR was primarily driven by:• The Company recorded a tax expense of $10 million related to the previous restructuring of an operating
subsidiary. This expense increased the ETR by 0.8%.• A net increase in uncertain tax positions across various jurisdictions of $36 million which increased the ETR by
2.9%. The primary drivers of this increase in tax expense were related to various tax issues including transfer pricing and foreign exchange losses.
• A decrease in the valuation allowance determined on a tax jurisdictional basis due to a shift in the global mix of income which decreased tax expense and the ETR by $58 million and 4.6%, respectively.
• Local income on investment recoveries in Luxembourg (i) decreased the valuation allowance and the ETR by $91 million and 7.2%, respectively, and (ii) increased the foreign rate differential and ETR by $91 million and by 7.2%, respectively.
In fiscal 2013, the ETR was primarily driven by:• The Company executed an internal restructuring whereby a significant operating subsidiary was recapitalized.
Certain securities issued pursuant to the recapitalization were subsequently sold to a third party. The sale resulted in the recognition of a capital loss of approximately $640 million, which reduced tax expense and the ETR by $248 million and 105.4%, respectively.
• A valuation allowance recorded for certain of the Company's German subsidiaries related to net operating losses and other net deferred tax assets. The impact to tax expense and the ETR was an increase of $77 million and 32.8%, respectively.
• An increase in the valuation allowance determined on a tax jurisdictional basis due to several factors including: (i) a shift in the global mix of income which increased tax expense and the ETR by $76 million and 32.3%, respectively (ii) capital gains from the sale of certain other assets which decreased tax expense and the ETR by $12 million and 4.9%, respectively and (iii) state capital losses and credits not expected to be fully utilized within the carryforward period which increased tax expense and the ETR by $30 million and 12.6%, respectively.

38
• Local losses on investment write-downs in Luxembourg (i) increased the valuation allowance and the ETR by $241 million and 102.3%, respectively, and (ii) decreased the foreign rate differential and ETR by $241 million and 102.3%, respectively.
As of April 3, 2015, in accordance with ASC 740, "Income Taxes," the Company’s liability for uncertain tax positions was $241 million, including interest of $38 million, penalties of $9 million, and net of tax attributes of $115 million. During the year ended April 3, 2015, the Company had a net increase in interest of $11 million ($12 million net of tax) and a reduction in accrued penalties of $10 million.
Significant management judgment is required in determining the Company's provision for income taxes, deferred tax assets and liabilities, and any valuation allowance recorded against deferred tax assets. A valuation allowance has been recorded against deferred tax assets of approximately $958 million as of April 3, 2015 due to uncertainties related to the ability to utilize these assets. Valuation allowances are evaluated periodically and will be subject to change in each future reporting period as a result of changes in various factors. In determining whether the deferred tax assets are realizable, the Company considers all available positive and negative evidence, including future reversals of existing taxable temporary differences, taxable income in prior carryback years, projected future taxable income, tax planning strategies, and recent financial operations. During 2015, there was a partial valuation allowance release in the United Kingdom which increased the income tax benefit by $264 million. The release was the result of objectively verifiable positive evidence related to both sustained earnings and three years of cumulative profits.
The U.K. Finance Act 2015 received Royal Assent and was enacted on March 26, 2015. This legislation includes a new Diverted Profits Tax (“DPT”). The DPT will apply as of April 1, 2015 to profits of multinationals that are considered to have been diverted from the U.K. taxation as defined under the law. If the U.K. determines that profits have been diverted, such profits will be subject to tax at a rate of 25%. The DPT will apply in two situations; (a) where a foreign company has purposefully avoided having a taxable presence in the U.K, or (b) where a group has entered into a tax advantageous structure or transaction that lacks economic substance. Although the intentions of the legislation are to address aggressive tax planning lacking in economic substance, the legislation may have a wider reach as the guidance was drafted very broadly. Given the uncertainties related to its application and how the U.K. will enforce the newly enacted law, it is difficult to determine the impact of the new DPT on our future operating results.
In May 2013, the India Finance Act 2013 introduced a share buyback tax. Additional legislation was passed effective in May 2015 that increased the share buyback tax rate to 23.07% and increased the dividend distribution tax rate to 20.36%, among other changes. The Company uses the lower undistributed tax rate to measure deferred taxes on inside basis differences, including undistributed earnings, of our India operations as these earnings are permanently reinvested. While the Company has no plans to do so, events may occur in the future that could effectively force management to change its intent not to repatriate our India earnings. If the Company changes its intent and repatriates such earnings, a dividend distribution tax or share buyback tax will be incurred. These additional taxes will be recorded as tax expense in the period in which the Company changes its intent.
The Finance Act of 2012 (the 2012 Finance Act) was signed into law in India on May 28, 2012. The Act provides for the taxation of indirect foreign investment in India, including on a retroactive basis. The Finance Act overrides the Vodafone NL ruling by the Supreme Court of India which held that the Indian Tax Authorities cannot assess capital gains taxes on the sale of shares of non-Indian companies that indirectly own shares in an Indian company. The retroactive nature of these changes in law has been strongly criticized. The 2012 Finance Act has been challenged in the Indian courts. However, there is no assurance that such a challenge will be successful. CSC has engaged in the purchase of shares of foreign companies that indirectly own shares of an Indian company and internal reorganizations. The Indian tax authorities may seek to apply the provisions of the 2012 Finance Act to these prior transactions and seek to tax CSC directly or as a withholding agent or representative assessee of the sellers involved in prior acquisitions. The Company believes that the 2012 Finance Act does not apply to these prior acquisitions and that it has strong defenses against any claims that might be raised by the Indian tax authorities.
Income from Discontinued Operations
During fiscal 2015, 2014 and 2013, the Company divested certain businesses as a part of its service portfolio optimization initiative to focus on the next-generation technology services. In fiscal 2015, the Company divested a software business within the GBS segment. Fiscal 2014 divestitures included one business divested from within the NPS segment and one business from within the GBS segment. Fiscal 2013 divestitures included three businesses divested from within the GBS

39
segment. All fiscal 2015, 2014 and fiscal 2013 divestitures have been presented separately as discontinued operations in the Consolidated Statement of Operations, and the prior years' results have been recast to reflect the divested businesses.
The fiscal 2015 loss from discontinued operations, net of taxes, was $29 million, and included $18 million of loss on disposition, net of taxes from the sale of the businesses. The fiscal 2014 income from discontinued operations, net of taxes, was $88 million, and included $86 million gain on disposition, net of taxes. The fiscal 2013 income from discontinued operations, net of taxes was $482 million and included $417 million of gain on disposition, net of taxes (see Note 5 to the Consolidated Financial Statements).
Earnings (Loss) Per Share and Share Base
Fiscal 2015
Diluted earnings (loss) per share (EPS) for fiscal 2015 was $(0.05) and decreased $6.33 compared to prior year. EPS from continuing operations decreased $5.55, and EPS from discontinued operations decreased $0.78.
Diluted EPS from continuing operations decreased primarily due to the following items (on pre-tax basis):• Year-over-year increase in pension and OPEB actuarial losses of $1,041 million, or $(5.03);• SEC settlement and related charges and other of $200 million, or $(1.35); and,• Special restructuring charges of $246 million, or $(1.26);• Partially offset by tax benefit from reversal of a valuation allowance of $264 million or $1.81.
Decrease in the diluted EPS from discontinued operations resulted primarily from non-recurrence of fiscal 2014 divestitures of NPS ATD division and GBS flood insurance BPO business.
Fiscal 2014
EPS, on a diluted basis, increased $1.39 to $6.28 fiscal 2014. This increase in total diluted EPS was comprised of an increase in EPS from continuing operations of $3.91, partially offset by a decrease in EPS from discontinued operations of $2.52. The $1.39 increase in total EPS included a $0.14 benefit due to decrease in the weighted average shares outstanding.
The increase in income from continuing operations was primarily a result of the Company's fiscal 2013 cost reduction initiatives, partially offset by an increase in tax expense due to the change in global mix of income and change in valuation allowances. Additionally, income from continuing operations benefited from a year-over-year favorable cost impact of $556 million resulting from changes in pension actuarial gains and losses. The decrease in income from discontinued operations was due to the gain on disposition, net of taxes, of $417 million recorded in fiscal 2013, which did not repeat in fiscal 2014.
Financial Condition
Cash Flows
Amounts in millions Fiscal 2015 Fiscal 2014 Fiscal 2013Net cash from operations $ 1,433 $ 1,560 $ 1,119Net cash (used in) provided by investing (536) (566) 456Net cash used in from financing (1,038) (599) (589)Effect of exchange rate changes on cash and cash equivalents (204) (6) (25)Net increase (decrease) in cash and cash equivalents (345) 389 961Cash and cash equivalents at beginning of year 2,443 2,054 1,093
Cash and cash equivalents at end of year $ 2,098 $ 2,443 $ 2,054

40
Operating Cash Flow
Net cash provided by operating activities during fiscal 2015 was $1,433 million, which decreased $127 million as compared to fiscal 2014. This decrease was primarily the result of lower cash receipts from customers due to decreased fiscal 2015 revenues, partially offset by reduced payroll payments due to lower headcount, lower restructuring payments and lower contributions to defined benefit pension and OPEB plans.
Net cash provided by operating activities during fiscal 2014 was $1,560 million, which increased $441 million as compared to fiscal 2013. During fiscal 2013, the Company received a non-recurring cash inflow of $185 million associated with the NHS contract. Excluding the impact of NHS, net cash provided by operating activities increased $626 million. This increase in net operating cash flow was primarily attributable to $660 million lower pension contributions, $92 million of lower tax payments, $46 million of lower interest payments, lower vendor payments due to cost reductions and lower payroll payments due to reduced headcount. These increases to cash flow were partially offset by lower year-over-year collections from customers.
Investing Cash Flow
Net cash used in investing activities during fiscal 2015 of $536 million decreased $30 million compared to fiscal 2014. The decrease in cash used for investing activities was primarily as a result of $117 million of higher proceeds from sale of contract assets to customers upon contract termination, and $40 million of lower cash outflow for capital expenditures. These cash inflows were partially offset by a net increase of $120 million in cash used for business acquisitions and divestitures. The $120 million consists of lower cash inflows of $261 million from business divestitures, offset by $141 million of lower cash outflows for business acquisitions (see Notes 4 and 5 to the Consolidated Financial Statements).
Net cash used in investing activities during fiscal 2014 of $566 million increased $1,022 million compared to fiscal 2013. The increase is primarily due to lower proceeds from business divestitures and higher payments for business acquisitions.During fiscal 2014, the Company received an aggregate of $248 million, mostly from the divestitures of its Applied Technology Division and flood-insurance-related business process outsourcing business, compared with $1,108 million net proceeds received from the sale of its credit services business, its Italian consulting and system integration business and its Australian information technology staffing business unit during fiscal 2013. Also, during fiscal 2014, the Company paid an aggregate of $190 million to acquire InfoChimps, Inc. and ServiceMesh, Inc., while during the same period in fiscal 2013, the Company paid $34 million to purchase a privately held entity (see Notes 4 and 5 to the Consolidated Financial Statements).
Financing Cash Flow
Net cash used in in financing activities during fiscal 2015 was $1,038 million, an increase of $439 million from fiscal 2014. The increase was primarily due to $321 million of higher share repurchases, and $221 million lower net proceeds from borrowings, partially offset by $98 million of contingent consideration paid in fiscal 2014 related to the Company's acquisition of ServiceMesh Inc., which did not recur in fiscal 2015 (see Note 4 of the Consolidated Financial Statements). The lower net proceeds from borrowings consists of $439 million of reduced borrowings offset by $218 million of lower principal repayments on borrowings.
Net cash used in financing activities during fiscal 2014 was $599 million, an increase of $10 million from fiscal 2013. The increase was primarily due to an increase in cash payments for share repurchases of $238 million and payment of $98 million for the settlement of the contingent consideration related to the Company's acquisition of ServiceMesh, Inc., partially offset by higher net proceeds from borrowings of $149 million, and higher proceeds from stock option exercises of $159 million. The higher net proceeds from borrowings comprised lower repayments on borrowings of $915 million partially offset by lower proceeds from the issuance of new long-term debt of $766 million.
Effect of exchange rate changes on cash and cash equivalents
In fiscal 2015, the U.S. dollar strengthened against most of the major world currencies resulting in a $204 million adverse effect on cash and cash equivalents. Comparatively, in fiscal 2014 and fiscal 2013, there was $6 million and $25 million of adverse impact of exchange rate changes on cash and cash equivalents, respectively.

41
Liquidity and Capital Resources
Cash and cash equivalents were $2.1 billion and $2.4 billion at April 3, 2015 and March 28, 2014, respectively. Of the total cash at April 3, 2015, $1.2 billion was held outside of the U.S. as compared to $1.0 billion at March 28, 2014. It is generally management's intent to permanently reinvest earnings of its foreign operations. Should the Company repatriate any portion of this cash as taxable dividends, it would be required to accrue and pay additional U.S. taxes. The Company has no current plans and does not anticipate repatriating cash to the U.S. as taxable dividends. The Company is currently considering transactions which would enable it to repatriate some of the cash to the U.S. through settlement of inter-company loans or return of capital distributions in a tax efficient manner. The cash held outside of the U.S. can also be used to fund acquisitions, such as the fiscal 2012 acquisitions of iSOFT and AppLabs.
At the end of fiscal 2015, CSC’s ratio of net debt-to-total capitalization was 10.2%, an increase from 6.5% at the end of fiscal 2014. The increase in the ratio was primarily the result of an increase in net debt, due to the decrease in cash and cash equivalents, and a decrease in equity primarily due to the fiscal 2015 share repurchases and the net loss driven largely by pension actuarial losses. The following table summarizes the Company’s capitalization ratios as of fiscal year end 2015 and 2014:
Amount in millions April 3, 2015 March 28, 2014Total debt $ 2,669 $ 2,888
Cash and cash equivalents 2,098 2,443
Net debt $ 571 $ 445
Total debt $ 2,669 $ 2,888
Equity 2,949 3,944
Total capitalization $ 5,618 $ 6,832
Debt-to-total capitalization 47.5% 42.3%
Net debt-to-total capitalization 10.2% 6.5%
At April 3, 2015, the Company had $904 million of short-term borrowings and current maturities of long-term debt, and $1,765 million of long-term debt. There were no borrowings outstanding against the Company's $2.5 billion committed revolving credit facility and the CSC Finance Co. LLC's (CSC Finco) $250 million Lease Credit Facility (see Note 14 to the Consolidated Financial Statements).
During the second quarter of fiscal 2015, CSC modified its existing $2.5 billion credit facility agreement by extending the maturity date from January 15, 2019 to January 15, 2020. Also, the Company extended the maturity date of its £250 million ($371 million) note payable from December 19, 2014 to January 19, 2016, effective December 19, 2014. The Company was in compliance with all financial covenants applicable to the credit facility agreement and note payable as April 3, 2015 and March 28, 2014.
During the first quarter of fiscal 2015, CSC Asset Funding I LLC, which is a special purpose subsidiary of CSC Finance Co. LLC (CSC Finco) which is a wholly owned subsidiary of the Company, entered into a master loan and security agreement with a financial institution on behalf of a syndicate of banks which provides for a $250 million committed Lease Credit Facility (Leasing Facility) to finance CSC Finco's capital expenditures of IT equipment and associated software in support of IT services provided to the Company's customers. The draw down availability period for the Leasing Facility is eighteen months, and once drawn, converts into individual term notes of variable terms up to sixty months therefrom, depending on the nature of the underlying equipment being financed. There were no borrowings outstanding under the Leasing Facility as of April 3, 2015. CSC Finco was in compliance with all financial covenants under the Leasing Facility as of April 3, 2015.
In May 2014, the Company's Board of Directors approved a new share repurchase program authorizing up to $1.5 billion in share repurchases of the Company's outstanding common stock, after completion of a prior repurchase program. The timing, volume, and nature of future share repurchases are at the discretion of management, and may be suspended or discontinued at any time. No end date has been established for the repurchase program.

42
During fiscal 2015, the Company repurchased 11,715,551 shares for a total consideration of $736 million, at a weighted average price of $62.83. These repurchases were made through open market purchases as well as through accelerated share repurchase arrangements (ASRs). As a part of an ASR arrangement entered into during the fourth quarter of fiscal 2015, the Company received an initial delivery of shares, and may either receive additional shares or may be required to return a number of shares, based on the trading prices of the Company’s stock over the defined trading execution period under the agreement. In addition, this ASR arrangement has a $100 million prepaid contingent delivery provision, which requires the financial institution to deliver additional shares if the Company's stock price is below a predetermined price, on certain predetermined dates. However, in the event the Company's stock price exceeds the predetermined price, the prepaid amounts would be returned to the Company as cash or shares at the Company's option. The final settlement under this ASR agreement is expected to occur during the third quarter of fiscal 2016 (see Note 16 of the Consolidated Financial Statements).
Liquidity Risk
The Company’s total liquidity is comprised of cash and cash equivalents plus any borrowing available under its revolving credit facility. As of April 3, 2015, the Company’s total liquidity was $4.6 billion, consisting of $2.1 billion of cash and cash equivalents and the full $2.5 billion available under the Company's revolving credit facility. In addition, the Company had access to CSC Finco's undrawn $250 million Leasing Facility at CSC Finco to fund capital expenditures. In the opinion of management, CSC will be able to meet its liquidity and cash needs for the foreseeable future through the combination of cash flows from operating activities, available cash balances, and available borrowings under the Company's undrawn credit facilities and CSC Finco's Leasing Facility. If these resources need to be augmented, additional cash requirements would likely be financed by the issuance of debt and/or equity securities. However, there can be no assurances that the Company will be able to obtain debt financing on acceptable terms in the future.
As noted above, the Company holds $1.2 billion of cash outside of the U.S. Should the Company repatriate any portion of this cash as taxable dividends, it would be required to accrue and pay additional U.S. taxes.
The Company's exposure to operational liquidity risk is primarily from long-term contracts which require significant investment of cash during the initial phases of the contracts. The recovery of these investments is over the life of the contract and is dependent upon the Company's performance as well as customer acceptance. Continuing uncertainty in global economic conditions may also affect the Company's business as customers and suppliers may decide to downsize, defer or cancel contracts which could negatively affect operating cash flow.
On March 6, 2015, Fitch took a rating action by revising the outlook from "positive" to "stable" with no change to the underlying rating. Moody's and S&P did not take ratings actions during fiscal 2015. The most recent ratings and outlooks issued by Moody's, S&P and Fitch are described in the table below:
Rating Agency Rating OutlookShort Term Ratings
*Fitch BBB Stable -Moody's Baa2 Stable -S&P BBB+ Stable -
* The Company elected to suspend its commercial paper program; as a result, the rating agencies withdrew their short-term ratings (S&P's rating was withdrawn on April 14, 2014). The company believes that it can re-activate its commercial paper program at any time it is needed.
Subsequent to the May 19, 2015 announcement of the proposed Separation, all three credit rating agencies took ratings action. Fitch Ratings formally reaffirmed its existing credit ratings of BBB with "Stable" outlook. S&P put the Company's credit ratings on "Credit Watch" but stated its expectations to reaffirm S&P's ratings of BBB+ with "Stable" outlook. Moody's put the Company's ratings of Baa2 and "Stable" under "credit review" and that its expectations were to either reaffirm Moody's existing Baa2 rating or a one-notch downgrade to Baa3, both of which are investment grade credit ratings.
Credit rating agencies review their ratings periodically and, therefore, the credit rating assigned to us by each agency may be subject to revision at any time. Accordingly, CSC is not able to predict whether its current credit ratings will remain as disclosed above. Factors that can affect the Company's credit ratings include changes in its operating performance, its
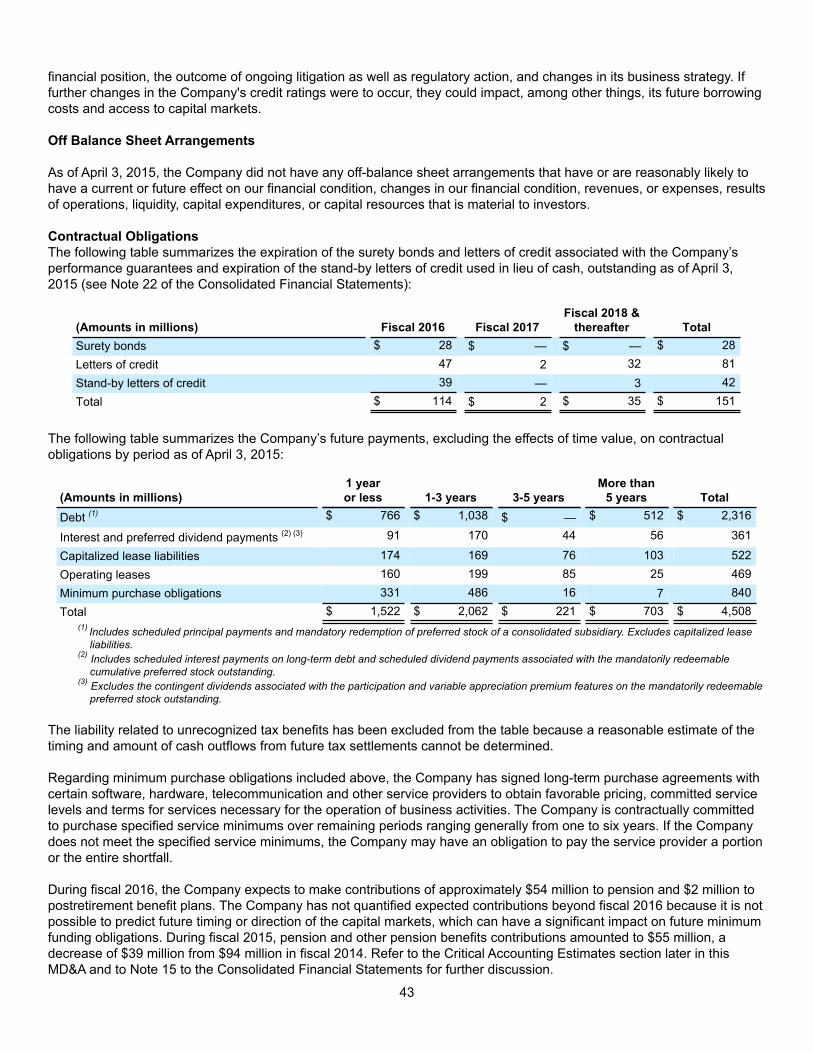
43
financial position, the outcome of ongoing litigation as well as regulatory action, and changes in its business strategy. If further changes in the Company's credit ratings were to occur, they could impact, among other things, its future borrowing costs and access to capital markets.
Off Balance Sheet Arrangements
As of April 3, 2015, the Company did not have any off-balance sheet arrangements that have or are reasonably likely to have a current or future effect on our financial condition, changes in our financial condition, revenues, or expenses, results of operations, liquidity, capital expenditures, or capital resources that is material to investors.
Contractual Obligations The following table summarizes the expiration of the surety bonds and letters of credit associated with the Company’s performance guarantees and expiration of the stand-by letters of credit used in lieu of cash, outstanding as of April 3, 2015 (see Note 22 of the Consolidated Financial Statements):
(Amounts in millions) Fiscal 2016 Fiscal 2017Fiscal 2018 &
thereafter TotalSurety bonds $ 28 $ — $ — $ 28Letters of credit 47 2 32 81Stand-by letters of credit 39 — 3 42Total $ 114 $ 2 $ 35 $ 151
The following table summarizes the Company’s future payments, excluding the effects of time value, on contractual obligations by period as of April 3, 2015:
(Amounts in millions)1 yearor less 1-3 years 3-5 years
More than5 years Total
Debt (1) $ 766 $ 1,038 $ — $ 512 $ 2,316
Interest and preferred dividend payments (2) (3) 91 170 44 56 361
Capitalized lease liabilities 174 169 76 103 522Operating leases 160 199 85 25 469Minimum purchase obligations 331 486 16 7 840Total $ 1,522 $ 2,062 $ 221 $ 703 $ 4,508
(1) Includes scheduled principal payments and mandatory redemption of preferred stock of a consolidated subsidiary. Excludes capitalized lease liabilities.
(2) Includes scheduled interest payments on long-term debt and scheduled dividend payments associated with the mandatorily redeemable cumulative preferred stock outstanding.
(3) Excludes the contingent dividends associated with the participation and variable appreciation premium features on the mandatorily redeemable preferred stock outstanding.
The liability related to unrecognized tax benefits has been excluded from the table because a reasonable estimate of the timing and amount of cash outflows from future tax settlements cannot be determined.
Regarding minimum purchase obligations included above, the Company has signed long-term purchase agreements with certain software, hardware, telecommunication and other service providers to obtain favorable pricing, committed service levels and terms for services necessary for the operation of business activities. The Company is contractually committed to purchase specified service minimums over remaining periods ranging generally from one to six years. If the Company does not meet the specified service minimums, the Company may have an obligation to pay the service provider a portion or the entire shortfall.
During fiscal 2016, the Company expects to make contributions of approximately $54 million to pension and $2 million to postretirement benefit plans. The Company has not quantified expected contributions beyond fiscal 2016 because it is not possible to predict future timing or direction of the capital markets, which can have a significant impact on future minimum funding obligations. During fiscal 2015, pension and other pension benefits contributions amounted to $55 million, a decrease of $39 million from $94 million in fiscal 2014. Refer to the Critical Accounting Estimates section later in this MD&A and to Note 15 to the Consolidated Financial Statements for further discussion.

44
Dividends
During fiscal 2015, quarterly dividends declared aggregated to $0.92 per share or $131 million. Of the total dividends declared, $32 million was declared but unpaid at April 3, 2015, and was paid on April 24, 2015. Dividends paid during fiscal 2015 were approximately $128 million. The Company has sufficient liquidity and expects to continue paying quarterly cash dividends although such payments are subject to continued approval by the Board of Directors. On May 19, 2015, the Company's Board of Directors declared a regular quarterly dividend of $0.23 per share.
CRITICAL ACCOUNTING ESTIMATES
Our Consolidated Financial Statements have been prepared in accordance with GAAP. Our significant accounting policies are described in Note 1 to the Consolidated Financial Statements under “Summary of Significant Accounting Policies.” The preparation of Consolidated Financial Statements in accordance with GAAP requires us to make estimates and judgments that affect the reported amounts of assets, liabilities, revenue and expenses, as well as the disclosure of contingent assets and liabilities. We base our estimates and judgments on historical experience and other factors believed to be reasonable under the circumstances. Many of the estimates made are for contract-specific issues. Changes to estimates or assumptions on a specific contract could result in a material adjustment to the Consolidated Financial Statements.
We have identified several critical accounting estimates. An accounting estimate is considered critical if both: (a) the nature of the estimates or assumptions is material due to the levels of subjectivity and judgment involved, and (b) the impact of changes in the estimates and assumptions would have a material effect on the Consolidated Financial Statements. Our critical accounting estimates relate to: revenue recognition, cost estimation and recoverability on long-term, fixed-price contracts; revenue recognition on software license sales that require significant customization; capitalization of outsourcing contract costs and software development costs; estimates used to determine deferred income taxes; assumptions related to purchase accounting and goodwill; assumptions to determine retirement benefits costs and liabilities; and assumptions and estimates used to analyze contingencies and litigation. For all of these estimates, we caution that future events rarely develop exactly as forecast, and the best estimates routinely require adjustment.
Revenue recognition
The majority of our revenue is recognized based on objective criteria and does not require significant estimates that may change over time. However, some arrangements are subject to specific accounting guidance that may require significant estimates, including contracts subject to percentage-of-completion accounting, contracts that include multiple-element deliverables, and contracts subject to software accounting guidance.
Percentage-of-completion method
Certain software development projects, all long-term construction-type contracts, and certain contracts with the U.S. federal government require the use of estimates at completion in the application of the percentage-of-completion accounting method, whereby the determination of revenues and costs on a contract through its completion can require significant judgment and estimation. Under this method, and subject to the effects of changes in estimates, we recognize revenue using an estimated margin at completion as contract milestones or other input or output-based measures are achieved. This can result in costs being deferred as work in process until contractual billing milestones are achieved. Alternatively, this can result in revenue recognized in advance of billing milestones if output-based or input-based measures are achieved. Contracts that require estimates at completion using the percentage-of-completion method accounted for approximately 17% of the Company's revenues.
The percentage-of-completion method requires estimates of revenues, costs and profits over the entire term of the contract, including estimates of resources and costs necessary to complete performance. The cost estimation process is based upon the professional knowledge and experience of our software and systems engineers, program managers and financial professionals. The Company follows this method because reasonably dependable estimates of the revenue and costs applicable to various elements of a contract can be made; however, some estimates are particularly difficult for activities involving state-of-the-art technologies such as system development projects. Key factors that are considered in estimating the work to be completed and ultimate contract profitability include the availability and productivity of labor, the

45
nature and complexity of the work to be performed, results of testing procedures, and progress toward completion. Management regularly reviews project profitability and the underlying estimates. A significant change in an estimate on one or more contracts could have a material effect on our results of operations. Revisions in profit estimates are reflected in the period in which the facts that give rise to the revision become evident.
Modifications to contract scope, schedule, and price may be required on contracts accounted for on a percentage-of-completion basis. Accounting for such changes prior to formal contract modification requires evaluation of the characteristics and circumstances of the effort completed and assessment of probability of recovery. If recovery is deemed probable, we may, as appropriate, either defer the costs until the parties have agreed on the contract change or recognize the costs and related revenue as current period contract performance. We periodically negotiate such contract modifications.
Multiple-element arrangements
Many of our contracts call for us to provide a range of services or elements to our customers, which may include any combination of services, products or both. As a result, significant judgment may be required to determine the appropriate accounting, including whether the elements specified in a multiple-element arrangement should be treated as separate units of accounting for revenue recognition purposes, and, if so, how the total estimated revenue should be allocated among the elements and when to recognize revenue for each element. Allocation of total contract consideration to each element requires estimating the fair value or selling price of each element based on vendor specific objective evidence (VSOE), third party evidence (TPE) or management's best estimate of selling price (BESP) for the deliverables when VSOE or TPE are not available. VSOE is established for an element based on the price charged when the element is sold separately. TPE is established by considering our competitors' prices for comparable product and service offerings in the market in which we operate. When we conclude that comparable products or services are sold by competitors to similarly situated customers, we consult available information sources to arrive at TPE such as published list prices, quoted market prices, and industry reports. We establish BESP consistent with our existing pricing practices involving a cost-plus-reasonable-margin methodology as well as comparison of the margins to those realized on recent contracts for similar products or services in that market. Once the total estimated revenue has been allocated to the various contract elements, revenue for each element is recognized based on the relevant revenue recognition method for the services performed or elements delivered if the revenue recognition criteria have been met. Estimates of total revenue at contract inception often differ materially from actual revenue due to volume differences, changes in technology or other factors which may not be foreseen at inception.
Software sales If significant customization is required in the delivery of a proprietary software product, and VSOE is available to support accounting for the software as a separate unit of account, the software is determined to be delivered as the customization services are performed and revenue is recognized in accordance with the percentage-of-completion method described above. Thus, cost and profit estimates are required over the life of the project, and changes in such estimates can have a material effect on results. Changes in judgments on these assumptions and estimates could materially impact the timing of revenue recognition.
Capitalization of outsourcing contract costs
Certain costs incurred upon initiation of an outsourcing contract are deferred and amortized over the contract life. These costs consist of contract acquisition and transition/set-up costs, costs associated with installation of systems and processes, and amounts paid to customers in excess of the fair market value of assets acquired (i.e., contract premiums). Finance staff, working with program management, reviews costs to determine appropriateness for deferral in accordance with the relevant accounting guidance.
Key estimates and assumptions that we must make include assessing the fair value of assets acquired from a customer in order to calculate the contract premium and projecting future cash flows in order to assess the recoverability of deferred costs. We utilize the experience and knowledge of our professional staff in program management, operations, procurement and finance areas, as well as third parties on occasion, to determine the fair values of assets acquired. To assess recoverability, undiscounted estimated cash flows of the contract are projected over its remaining life and compared to the carrying amount of contract related assets, including the unamortized deferred cost balance. Such estimates require judgment and assumptions, which are based upon the professional knowledge and experience of our

46
personnel. Key factors that are considered in estimating the undiscounted cash flows include projected labor costs and productivity efficiencies. A significant change in an estimate or assumption on one or more contracts could have a material effect on our results of operations. Amortization of contract premiums is recorded as a reduction of revenue.
Capitalization of software development costs
We capitalize certain costs incurred to develop commercial software products to be sold, leased or otherwise marketed after establishing technological feasibility and we capitalize costs to develop or purchase internal-use software. Significant estimates and assumptions include: determining the appropriate period over which to amortize the capitalized costs based on estimated useful lives, estimating the marketability of the commercial software products and related future revenues, and assessing the unamortized cost balances for impairment.
For commercial software products, determining the appropriate amortization period is based on estimates of future revenues from sales of the products. We consider various factors to project marketability and future revenues, including an assessment of alternative solutions or products, current and historical demand for the product, and anticipated changes in technology that may make the product obsolete.
For internal-use software, the appropriate amortization period is based on estimates of our ability to utilize the software on an ongoing basis. To assess the recoverability of capitalized software costs, we consider estimates of future revenue, costs and cash flows. Such estimates require assumptions about future cash inflows and outflows, and are based on the experience and knowledge of professional staff. A significant change in an estimate related to one or more software products could result in a material change to our results of operations.
Estimates used to determine income tax expense
We make certain estimates and judgments in determining income tax expense for financial statement purposes. These estimates and judgments occur in the calculation of certain tax assets and liabilities, which principally arise from differences in the timing of recognition of revenue and expense for tax and financial statement purposes. We also must analyze income tax reserves, as well as determine the likelihood of recoverability of deferred tax assets, and adjust any valuation allowances accordingly. Considerations with respect to the recoverability of deferred tax assets include the period of expiration of the tax asset, planned use of the tax asset, and historical and projected taxable income as well as tax liabilities for the tax jurisdiction to which the tax asset relates. Valuation allowances are evaluated periodically and will be subject to change in each future reporting period as a result of changes in one or more of these factors. The calculation of our tax liabilities also involves dealing with uncertainties in the application of complex tax regulations. The Company recognizes uncertain tax positions in the financial statements when it is more likely than not the tax position will be sustained under examination.
Assumptions related to acquisition-method accounting, acquired intangible assets and goodwill
We account for acquisitions using the acquisition method of accounting. This method requires us to estimate the fair values of the assets acquired, including for the acquired intangible assets such as customer-related intangibles, the liabilities assumed, and contingent consideration, if any. Liabilities assumed may include litigation and other contingency reserves existing at the time of acquisition, and require judgment in ascertaining the related fair values. Independent appraisals may be used to assist in the determination of the fair value of certain assets and liabilities. Such appraisals are based on significant estimates provided by the Company, such as forecasted revenues or profits utilized in determining the fair value of contract-related acquired intangible assets or liabilities. Additional information obtained during the allocation period, not to exceed one year, related to the acquisition date fair value of acquired assets and liabilities may result in changes to the recorded values of acquired assets and liabilities, resulting in an offsetting adjustment to the goodwill associated with the business acquired. Any adjustment to the fair value of contingent consideration is recorded in earnings. Significant changes in assumptions and estimates subsequent to completing the allocation of the purchase price to the assets and liabilities acquired, as well as differences in actual and estimated results, could result in material impacts to earnings.
Goodwill is reviewed for impairment annually and whenever events or changes in circumstances indicate the carrying value of goodwill may not be recoverable in accordance with ASC 350 “Goodwill and Other Intangible Assets.” A significant amount of judgment is involved in determining if an event representing an indicator of impairment has occurred between annual test dates. Such indicators may include, among others: a significant decline in expected future cash

47
flows; a sustained, significant decline in stock price and market capitalization; a significant adverse change in legal factors or in the business climate; unanticipated competition; the testing for recoverability of a significant asset group within a reporting unit; and reductions in revenue or profitability growth rates. Any adverse change in these factors could have a significant impact on the recoverability of goodwill.
The goodwill impairment test initially involves the assessment of qualitative factors to determine whether the existence of events or circumstances leads to a determination that it is more likely than not that the fair value of a reporting unit is less than its carrying amount. If the Company determines that it is not more likely than not, then the subsequent two-step process is not required, although the Company has the option to bypass the initial qualitative assessment stage and proceed directly to perform a step one analysis. If the Company determines that it is more likely than not, then it proceeds with the subsequent two-step goodwill impairment testing process. The first step is to compare each reporting unit’s fair value to its carrying value. If the reporting unit’s fair value exceeds its carrying value, no further procedures are required. However, if a reporting unit’s fair value is less than its carrying value, an impairment of goodwill may exist, requiring a second step to measure the amount of impairment loss. In this step, the reporting unit’s fair value is determined and is allocated to all of the assets and liabilities of the reporting unit, including any unrecognized intangible assets, to calculate the implied fair value of goodwill in the same manner as if the reporting unit was being acquired in a business acquisition. If the implied fair value of goodwill is less than the recorded goodwill, an impairment charge is recorded for the difference.
The Company estimates the fair value of each reporting unit using a combination of the income approach and the market approach. The income approach incorporates the use of a discounted cash flow method in which the estimated future cash flows and terminal values for each reporting unit are discounted to a present value using a discount rate. Cash flow projections are based on management's estimates of economic and market conditions which drive key assumptions of revenue growth rates, operating margins, capital expenditures and working capital requirements. The discount rate in turn is based on the specific risk characteristics of each reporting unit, the weighted average cost of capital and its underlying forecast. The market approach estimates fair value by applying performance metric multiples to the reporting unit's prior and expected operating performance. The multiples are derived from comparable publicly traded companies with similar operating and investment characteristics as the reporting unit. If the fair value of the reporting unit derived using the income approach is significantly different from the fair value estimate using the market approach, the Company reevaluates its assumptions used in the two models. The fair values determined by the market approach and income approach, as described above, are weighted to determine the fair value for each reporting unit. The weighted values assigned to each reporting unit are primarily driven by two factors: 1) the number of comparable publicly traded companies used in the market approach, and 2) the similarity of the operating and investment characteristics of the reporting units to the comparable publicly traded companies used in the market approach.
In order to assess the reasonableness of the calculated reporting unit fair values, the Company also compares the sum of the reporting units’ fair values to its market capitalization (per share stock price multiplied by shares outstanding) and calculates an implied control premium (the excess of the sum of the reporting units’ fair values over the market capitalization). The Company evaluates the control premium by comparing it to control premiums of recent comparable transactions. If the implied control premium is not reasonable in light of these recent transactions, the Company will reevaluate its fair value estimates of the reporting units by adjusting the discount rates and/or other assumptions. As a result, when the price for CSC’s common stock is low, this reevaluation can result in lower estimated fair values of the reporting units.
Determining the fair value of a reporting unit is judgmental in nature and involves the use of significant estimates and assumptions. These estimates and assumptions include revenue growth rates, operating margins, terminal growth rates, and capital expenditures, as well as discount rates. Estimates involve the assessment of labor and other direct costs on existing contracts, estimates of overhead costs and other indirect costs, and assessments of new business prospects and projected win rates. In addition, judgments and assumptions are required for allocating shared assets and liabilities to determine the carrying values of each reporting unit. Although we have consistently used the same methods in developing the assumptions and estimates underlying the fair value calculations, such estimates are uncertain and can vary from actual results.

48
Assumptions to determine retirement benefits costs and liabilities Effective the first quarter of fiscal 2015, CSC changed its accounting policy for measurement and recognition of actuarial gains and losses and settlements for its defined benefit pension and other post-retirement benefit plans and the calculation of expected return on pension plan assets. Under the new policy, actuarial gains and losses are recognized in earnings at the time of plan remeasurement, typically annually during the fourth quarter, rather than amortized over time (see Note 3 to the Consolidated Financial Statements).
The computation of CSC's pension and other post-retirement benefit costs and obligations is dependent on various actuarial assumptions. Two of the most significant assumptions are the expected long-term rate of return on plan assets and discount rates.
The assumption for the expected long-term rate of return on plan assets is selected by taking into account the asset mix of the plan and other factors. Under its new accounting policy, CSC uses fair value rather than the market-related value of plan assets. The weighted-average of the expected long-term rate of return, for all pension plans, on plan assets utilized for the fiscal 2015 and 2014 pension plan valuations was 7.1% and 6.7%, respectively (see Note 15 to the Consolidated Financial Statements). Holding all other assumptions constant, a one-half percentage increase in the assumed rates of return on plan assets would have increased the fiscal 2015 net periodic pension benefit, excluding mark-to-market (MTM), settlement and contractual termination charges, by approximately $29 million, and increased the fiscal 2015 MTM, settlement, and contractual termination charges by $28 million. Similarly, a one-half percentage decrease would have decreased the fiscal 2015 net periodic pension benefit, excluding MTM benefit, by approximately $29 million, and decreased the MTM, settlement, and contractual termination charges by $28 million.
The discount rate assumption reflects the market rate for high-quality, fixed income debt instruments based on the expected duration of the benefit payments for our pension and postretirement plans as of the annual measurement date and is subject to change each year. The weighted-average of the discount rates utilized for the fiscal 2015 net periodic pension cost was 4.4% compared to 4.3% used for fiscal 2014. Holding all other assumptions constant, a one-half percent increase in the assumed discount rates would have decreased the fiscal 2015 net periodic pension benefit, excluding MTM, settlement and contractual termination charges, by approximately $7 million, and increased the fiscal 2015 MTM, settlement and contractual termination charges by approximately $65 million. Similarly, a one-half percentage decrease in discount rates would have increased the fiscal 2015 net periodic pension benefit, excluding MTM, settlement and contractual termination charges, by approximately $11 million, and decreased the fiscal 2015 MTM, settlement and contractual termination charges by approximately $53 million.
Assumptions and estimates used to analyze contingencies and litigation We are subject to various claims and contingencies associated with lawsuits, insurance, tax and other issues arising in the normal course of business. The Consolidated Financial Statements reflect the treatment of claims and contingencies based on management's view of the expected outcome. CSC consults with legal counsel on issues related to litigation and seeks input from other experts and advisors with respect to matters in the ordinary course of business. If the likelihood of an adverse outcome is probable and the amount is estimable, we accrue a liability in accordance with ASC 450 “Contingencies.” Significant changes in the estimates or assumptions used in assessing the likelihood of an adverse outcome could have a material effect on the consolidated financial results.
49
Item 7A. Quantitative and Qualitative Disclosures about Market Risk
Interest Rates
The Company utilizes fixed-rate long-term debt obligations and other borrowings subject to market risk from changes in interest rates.
Pursuant to its interest rate and risk management strategy, during fiscal 2014, CSC entered into multiple interest rate swap transactions to hedge the fair value of $275 million of its 4.45% term notes, due 2022, which effectively converted the debt into floating interest rate debt. For accounting purposes, these interest rate swap transactions were designated as fair value hedges and qualified for the short-cut method of hedge accounting, as defined under ASC 815 "Derivatives and Hedging." At April 3, 2015, the fair value of these derivatives was an asset of $18 million, and is included in the other assets line on the Company's Consolidated Balance Sheet (see Notes 9 and 14 of the Consolidated Financial Statements).
A 10% increase in interest rates would have a negative impact of approximately $1 million and a 10% decrease in interest rates would have a positive impact of approximately $1 million on the annual interest expense related to the Company's interest rates swaps corresponding to the 4.45% term notes.
Foreign Currency
As a large global organization, the Company faces exposure to adverse movements in foreign currency exchange rates. In the ordinary course of business, the Company enters into certain contracts denominated in foreign currency. Potential foreign currency exposures arising from these contracts are analyzed during the contract bidding process. The Company generally manages these contracts by incurring costs in the same currency in which revenue is received, and any related short-term contract financing requirements are met by borrowing in the same currency. Thus, by generally matching revenues, costs and borrowings to the same currency, the Company is able to mitigate a portion of the foreign currency risk to earnings. However, as the Company has increased its use of offshore support in recent years, it has become more exposed to currency fluctuations.
The Company has policies and procedures to manage the exposure to fluctuations in foreign currency by using short-term foreign currency forward and option contracts to economically hedge certain foreign currency denominated assets and liabilities, including intercompany accounts and loans. For accounting purposes, these foreign currency forward and option contracts are not designated as hedges and changes in their fair value are reported in current period earnings within the other (income) expense line of the Consolidated Statements of Operations.
The Company also uses foreign currency forward contracts to reduce foreign currency exchange rate risk related to certain Indian Rupee denominated intercompany obligations and forecasted transactions. For accounting purposes these foreign currency forward contracts are designated as cash flow hedges with critical terms match with the hedged items; therefore, the changes in fair value of these forward contracts are recorded in accumulated Other Comprehensive Income and subsequently classified into earnings in the period during which the hedged transactions are recognized in earnings. CSC does not use derivatives tor trading or speculative purposes.
During fiscal 2015, 39.6% of the Company’s revenue was generated outside of the U.S. The Company uses a sensitivity analysis to assess the impact of movement in foreign currency exchange rates on revenue and earnings. For the year ended April 3, 2015, a hypothetical 10% increase in the value of the U.S. dollar against all currencies would have impacted revenue by approximately 4%, or $482 million, while a hypothetical 10% decrease in the value of the U.S. dollar against all currencies would increase revenue by 4%, or $482 million. In the opinion of management, a substantial portion of this fluctuation would be offset by expenses incurred in local currency. As a result, a hypothetical 10% movement of the value of the U.S. dollar against all currencies in either direction would impact the Company’s earnings before interest and taxes by approximately $33 million for the year ended April 3, 2015. This amount would be offset, in part, from the impacts of local income taxes and local currency interest expense.
As of April 3, 2015, the Company had approximately $1.2 billion of cash and cash equivalents outside of the U.S. The Company had no borrowings outstanding under committed lines of credit with foreign banks as of April 3, 2015 and March 28, 2014.

50
Item 8. Financial Statements and Supplementary Data
Index to Consolidated Financial Statements and Financial Statement Schedule
PageReport of Independent Registered Public Accounting FirmConsolidated Balance Sheets as of April 3, 2015 and March 28, 2014Consolidated Statements of Operations for the Twelve Months Ended April 3, 2015, March 28, 2014, and March 29, 2013Consolidated Statements of Comprehensive (Loss) Income for the Twelve Months Ended April 3, 2015, March 28, 2014, and March 29, 2013Consolidated Statements of Cash Flows for the Twelve Months Ended April 3, 2015, March 28, 2014, and March 29, 2013Consolidated Statements of Changes in Equity for the Twelve Months Ended April 3, 2015, March 28, 2014, and March 29, 2013
Notes to Consolidated Financial StatementsNote 1–Summary of Significant Accounting PoliciesNote 2–Settlement of SEC InvestigationNote 3–Defined Pension Benefit Plan Accounting MethodologyNote 4–AcquisitionsNote 5-DivestituresNote 6-Earnings Per ShareNote 7–ReceivablesNote 8–Fair ValueNote 9–Derivative InstrumentsNote 10-Property and EquipmentNote 11–Intangible AssetsNote 12–GoodwillNote 13–Income TaxesNote 14–DebtNote 15–Pension and Other Benefit PlansNote 16–Stockholders' EquityNote 17–Stock Incentive PlansNote 18-Cash FlowsNote 19–Other Income/ExpenseNote 20–Segment and Geographic InformationNote 21-Restructuring CostsNote 22–Commitments and ContingenciesNote 23–Subsequent Events
Selected Quarterly Financial Data (Unaudited)
Schedule
Schedule II, Valuation and Qualifying Accounts for the years ended April 3, 2015, March 28, 2014, and March 29, 2013
Schedules other than that listed above have been omitted since they are either not required, are not applicable, or the requiredinformation is shown in the Consolidated Financial Statements or related notes.
515253
545556
576768707275757678808082838990
105108112113113115118121
123
125

51
REPORT OF INDEPENDENT REGISTERED PUBLIC ACCOUNTING FIRM
To the Board of Directors and Stockholders ofComputer Sciences CorporationFalls Church, Virginia
We have audited the accompanying consolidated balance sheets of Computer Sciences Corporation and subsidiaries (the "Company") as of April 3, 2015 and March 28, 2014, and the related consolidated statements of operations, comprehensive (loss) income, cash flows, and changes in equity for each of the three fiscal years in the period ended April 3, 2015. Our audits also included the financial statement schedule listed in the Index at Item 8. These financial statements and financial statement schedule are the responsibility of the Company's management. Our responsibility is to express an opinion on the financial statements and financial statement schedule based on our audits.
We conducted our audits in accordance with the standards of the Public Company Accounting Oversight Board (United States). Those standards require that we plan and perform the audit to obtain reasonable assurance about whether the financial statements are free of material misstatement. An audit includes examining, on a test basis, evidence supporting the amounts and disclosures in the financial statements. An audit also includes assessing the accounting principles used and significant estimates made by management, as well as evaluating the overall financial statement presentation. We believe that our audits provide a reasonable basis for our opinion.
In our opinion, such consolidated financial statements present fairly, in all material respects, the financial position of Computer Sciences Corporation and subsidiaries as of April 3, 2015 and March 28, 2014, and the results of their operations and their cash flows for each of the three fiscal years in the period ended April 3, 2015, in conformity with accounting principles generally accepted in the United States of America. Also, in our opinion, such financial statement schedule, when considered in relation to the basic consolidated financial statements taken as a whole, presents fairly, in all material respects, the information set forth therein.
We have also audited, in accordance with the standards of the Public Company Accounting Oversight Board (United States), the Company's internal control over financial reporting as of April 3, 2015, based on the criteria established in Internal Control - Integrated Framework (1992) issued by the Committee of Sponsoring Organizations of the Treadway Commission and our report dated June 8, 2015 expressed an unqualified opinion on the Company's internal control over financial reporting.
/s/ DELOITTE & TOUCHE LLP
McLean, VirginiaJune 8, 2015

52
COMPUTER SCIENCES CORPORATION CONSOLIDATED BALANCE SHEETS
(Amounts in millions) April 3, 2015 March 28, 2014
Current assets:Cash and cash equivalents $ 2,098 $ 2,443Receivables, net of allowance for doubtful accounts of $41 (fiscal 2015) and $48 (fiscal 2014) 2,369 2,759Prepaid expenses and other current assets 438 426
Total current assets 4,905 5,628Intangible and other assets:
Software, net of accumulated amortization of $1,642 (fiscal 2015) and $1,680 (fiscal 2014) 751 650Outsourcing contract costs, net of accumulated amortization of $476 (fiscal 2015) and $1,038 (fiscal 2014) 326 427Goodwill 1,671 1,667Other assets 965 986
Total intangible and other assets 3,713 3,730Property and equipment, net of accumulated depreciation of $3,461 (fiscal 2015) and $3,620 (fiscal 2014) 1,583 2,031Total Assets $ 10,201 $ 11,389
Current liabilities:Short-term debt and current maturities of long-term debt $ 904 $ 681Accounts payable 422 394Accrued payroll and related costs 356 592Accrued expenses and other current liabilities 1,239 1,094Deferred revenue and advance contract payments 618 624Income taxes payable and deferred income taxes 62 77
Total current liabilities 3,601 3,462
Long-term debt, net of current maturities 1,765 2,207Income tax liabilities and deferred income taxes 412 557Other long-term liabilities 1,474 1,219Commitments and contingenciesCSC stockholders’ equity:
Preferred stock, par value $1 per share; authorized 1,000,000 shares; none issued — —
Common stock, par value $1 per share; authorized 750,000,000; issued 148,373,736 (fiscal 2015) and154,720,451 (fiscal 2014) 148 155Additional paid-in capital 2,286 2,304Earnings retained for use in business 912 1,592Accumulated other comprehensive loss 21 279Less: common stock in treasury, at cost, 9,600,396 (fiscal 2015) and 9,149,009 (fiscal 2014) (446) (418)
Total CSC stockholders’ equity 2,921 3,912Noncontrolling interest in subsidiaries 28 32Total Equity 2,949 3,944Total Liabilities and Equity $ 10,201 $ 11,389
(See Notes to Consolidated Financial Statements.)
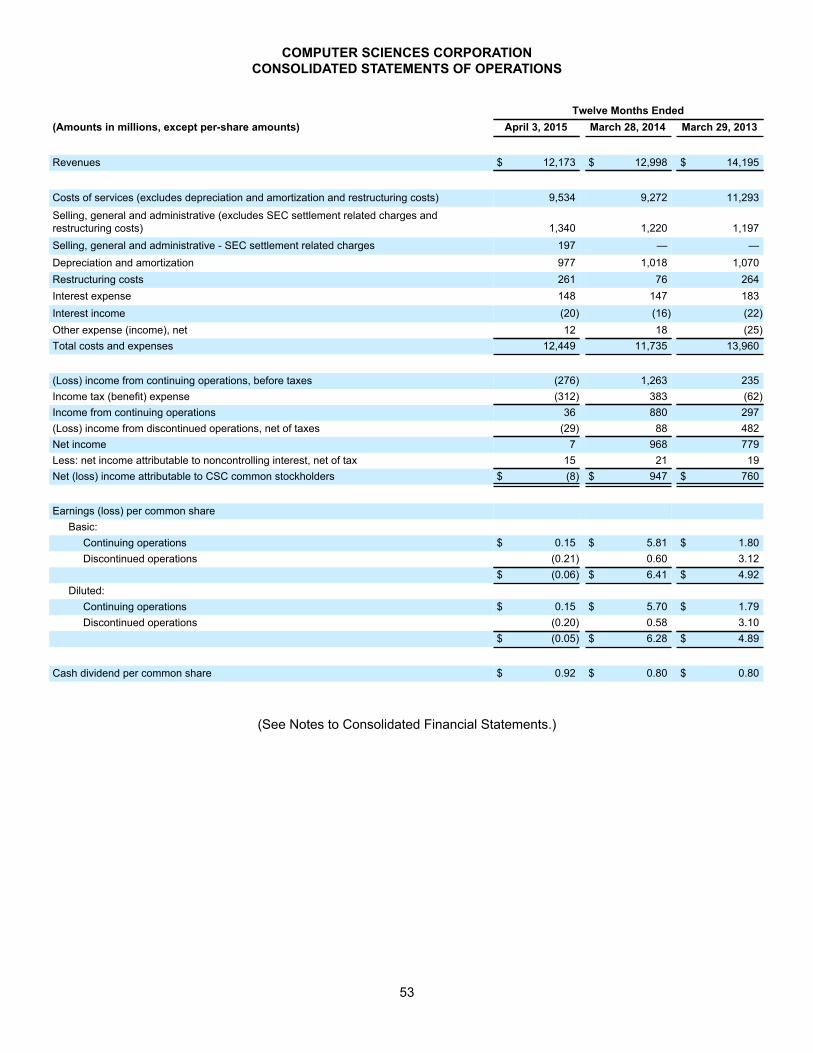
53
COMPUTER SCIENCES CORPORATION CONSOLIDATED STATEMENTS OF OPERATIONS
Twelve Months Ended(Amounts in millions, except per-share amounts) April 3, 2015 March 28, 2014 March 29, 2013
Revenues $ 12,173 $ 12,998 $ 14,195
Costs of services (excludes depreciation and amortization and restructuring costs) 9,534 9,272 11,293
Selling, general and administrative (excludes SEC settlement related charges andrestructuring costs) 1,340 1,220 1,197Selling, general and administrative - SEC settlement related charges 197 — —Depreciation and amortization 977 1,018 1,070Restructuring costs 261 76 264Interest expense 148 147 183Interest income (20) (16) (22)Other expense (income), net 12 18 (25)Total costs and expenses 12,449 11,735 13,960
(Loss) income from continuing operations, before taxes (276) 1,263 235Income tax (benefit) expense (312) 383 (62)Income from continuing operations 36 880 297(Loss) income from discontinued operations, net of taxes (29) 88 482Net income 7 968 779Less: net income attributable to noncontrolling interest, net of tax 15 21 19Net (loss) income attributable to CSC common stockholders $ (8) $ 947 $ 760
Earnings (loss) per common shareBasic:
Continuing operations $ 0.15 $ 5.81 $ 1.80Discontinued operations (0.21) 0.60 3.12
$ (0.06) $ 6.41 $ 4.92Diluted:
Continuing operations $ 0.15 $ 5.70 $ 1.79Discontinued operations (0.20) 0.58 3.10
$ (0.05) $ 6.28 $ 4.89
Cash dividend per common share $ 0.92 $ 0.80 $ 0.80
(See Notes to Consolidated Financial Statements.)

54
COMPUTER SCIENCES CORPORATION CONSOLIDATED STATEMENTS OF COMPREHENSIVE (LOSS) INCOME
Twelve Months Ended
(Amounts in millions) April 3, 2015 March 28, 2014 March 29, 2013
Net income $ 7 $ 968 $ 779
Other comprehensive (loss) income, net of taxes:
Foreign currency translation adjustments, net of tax (expense) benefit of $(3), $(2),and $12 in fiscal 2015, 2014, and 2013 (310) (81) (92)
Foreign currency forward contracts, net of tax expense of $0 in fiscal 2015, 2014,and 2013) (2) — —Pension and other postretirement benefit plans, net of tax:
Prior service credit, net of tax (expense) benefit of $(37), $0, and $(8) in fiscal2015, 2014, and 2013 57 265 19
Amortization of transition obligation, net of tax expense of $0 for fiscal 2015,2014, and 2013 1 1 1
Amortization of prior service cost, net of tax benefit of $7, $1, and $1 in fiscal2015, 2014, and 2013 (16) (4) —
Foreign currency exchange (loss) gain, net of tax benefit (expense) of $0, $0,and $(8) in fiscal 2015, 2014, and 2013 — 2 (8)
Pension and other postretirement benefit plans, net of tax 42 264 12Other comprehensive (loss) income, net of taxes (270) 183 (80)
Comprehensive (loss) income (263) 1,151 699Less: comprehensive income attributable to noncontrolling interest 15 30 19
Comprehensive (loss) income attributable to CSC common stockholders $ (278) $ 1,121 $ 680
(See Notes to Consolidated Financial Statements.)

55
COMPUTER SCIENCES CORPORATION CONSOLIDATED STATEMENTS OF CASH FLOWS
Twelve Months Ended(Amounts in millions) April 3, 2015 March 28, 2014 March 29, 2013Cash flows from operating activities:
Net income $ 7 $ 968 $ 779Adjustments to reconcile net income to net cash provided by operating activities:
Depreciation and amortization 977 1,018 1,070Pension & OPEB actuarial & settlement losses (gains) 782 (259) 297Stock-based compensation 68 73 49Deferred taxes (449) 169 99Gain on dispositions (22) (85) (797)Provision for losses on accounts receivable 2 4 18Excess tax benefit from stock based compensation (18) (8) (3)Unrealized foreign currency exchange gain (4) (29) (37)Impairment losses and contract write-offs — 3 9Cash surrender value in excess of premiums paid (9) (8) (10)
Other non-cash charges, net 39 55 64Changes in assets and liabilities, net of effects of acquisitions and dispositions:
Decrease in receivables 237 168 55(Increase) decrease in prepaid expenses and other current assets (36) (40) 22Decrease in accounts payable and accrued expenses (335) (549) (766)Increase in accrual for SEC settlement related charges 190 — —(Decrease) increase in income taxes payable and income tax liability (23) 119 40Increase in advanced contract payments and deferred revenue 11 2 270Other operating activities, net 16 (41) (40)
Net cash provided by operating activities 1,433 1,560 1,119
Cash flows from investing activities:Purchases of property and equipment (381) (420) (395)Payments for outsourcing contract costs (68) (71) (115)Software purchased and developed (199) (197) (162)Payments for acquisitions, net of cash acquired (49) (190) (34)Proceeds from business dispositions (13) 248 1,108Proceeds from sale of assets 155 38 32Other investing activities, net 19 26 22
Net cash (used in) provided by investing activities (536) (566) 456
Cash flows from financing activities:Borrowings under lines of credit and short-term debt — 439 128Repayment of borrowings under lines of credit (32) — (169)Borrowing on long-term debt, net of discount — — 1,077Principal payments on long-term debt (242) (492) (1,238)Proceeds from stock options and other common stock transactions 196 214 55Excess tax benefit from stock based compensation 18 8 3Repurchase of common stock and advance payment for accelerated share repurchase (842) (521) (283)Dividend payments (128) (119) (124)Payment of contingent consideration — (98) —Other financing activities, net (8) (30) (38)
Net cash used in financing activities (1,038) (599) (589)Effect of exchange rate changes on cash and cash equivalents (204) (6) (25)Net (decrease) increase in cash and cash equivalents (345) 389 961Cash and cash equivalents at beginning of year 2,443 2,054 1,093Cash and cash equivalents at end of year $ 2,098 $ 2,443 $ 2,054
(See Notes to Consolidated Financial Statements.)

56
COMPUTER SCIENCES CORPORATION CONSOLIDATED STATEMENTS OF CHANGES IN EQUITY
(Amounts in millions except shares in thousands)
Common Stock AdditionalPaid-in Capital
EarningsRetained for
Use in Business
AccumulatedOther
ComprehensiveIncome (Loss)
CommonStock in Treasury
TotalCSC
Equity
Non-Controlling
Interest Total EquityShares Amount
Balance at March 30, 2012 163,720 $ 164 $ 2,168 $ 668 $ 188 $ (390) $ 2,798 $ 36 $ 2,834
Net income 760 760 19 779
Other comprehensive loss (80) (80) (80)
Stock-based compensation expense 48 48 48
Acquisition of treasury stock (11) (11) (11)
Share repurchase program (6,708) (7) (94) (204) (305) (305)
Stock option exercises and other common stocktransactions 1,972 2 45 47 47
Cash dividends declared (123) (123) (123)
Noncontrolling interest distributions and other — (29) (29)
Balance at March 29, 2013 158,984 $ 159 $ 2,167 $ 1,101 $ 108 $ (401) $ 3,134 $ 26 $ 3,160
Net income 947 947 21 968
Other comprehensive income 183 183 183
Stock-based compensation expense 71 71 71
Acquisition of treasury stock (17) (17) (17)
Share repurchase program (9,773) (10) (145) (350) (505) (505)
Stock option exercises and other common stocktransactions 5,510 6 211 217 217
Cash dividends declared (118) (118) (118)
Adjustments from business disposition — 9 9
Noncontrolling interest distributions and other 12 (12) — (24) (24)
Balance at March 28, 2014 154,721 $ 155 $ 2,304 $ 1,592 $ 279 $ (418) $ 3,912 $ 32 $ 3,944
Net (loss) income (8) (8) 15 7
Other comprehensive loss (270) (270) (270)
Stock-based compensation expense 67 67 67
Acquisition of treasury stock (28) (28) (28)
Share repurchase program (11,716) (12) (295) (529) (836) (836)
Stock option exercises and other common stocktransactions 5,369 5 210 215 215
Cash dividends declared (131) (131) (131)
Noncontrolling interest distributions and other (12) 12 — (19) (19)
Balance at April 3, 2015 148,374 $ 148 $ 2,286 $ 912 $ 21 $ (446) $ 2,921 $ 28 $ 2,949
(See Notes to Consolidated Financial Statements.)

COMPUTER SCIENCES CORPORATION - NOTES TO CONSOLIDATED FINANCIAL STATEMENTS
57
Note 1 - Summary of Significant Accounting Policies
Basis of Presentation and Principles of Consolidation
The accompanying consolidated financial statements and notes are those of Computer Sciences Corporation, its subsidiaries, and those business entities in which the Company maintains a controlling interest, hereafter collectively referred to as “CSC” or “the Company.” Investments in business entities in which the Company does not have control, but has the ability to exercise significant influence over operating and financial policies, are accounted for by the equity method. Other investments are accounted for by the cost method. All intercompany transactions and balances have been eliminated.
The accompanying consolidated financial statements have been prepared in accordance with accounting principles generally accepted in the United States of America (GAAP) and pursuant to the rules and regulations of the Securities and Exchange Commission (SEC).
The Company reports its results based on a fiscal year convention that comprises four thirteen-week quarters. Every fifth year includes an additional week in the first quarter to prevent the fiscal year from moving from an approximate end of March date. As a result, the first quarter of fiscal 2015 was a fourteen-week quarter.
During the first quarter of fiscal 2015, the Company changed its accounting policy for the recognition of actuarial gains and losses for its defined benefit pension and other post-employment benefit plans. These changes have been reported through retrospective application of the new accounting methods to all periods presented (see Note 3).
Effective fiscal 2015, the Company changed its inter-company accounting policy. Previously, inter-company transactions between segments were generally reflected as inter-company revenue. Under the new policy, inter-company transactions are now generally treated as cost transfers. The new inter-company policy has been applied retrospectively, adjusting the segment results for all prior periods (see Note 20).
For classification of certain assets and liabilities of our U.S. federal government contracts as current or long-term, we use the duration of the related contract as our operating cycle, which is generally longer than one year.
Use of Estimates
GAAP requires management to make estimates and assumptions that affect the amounts reported in the Consolidated Financial Statements and accompanying notes. These estimates are based on management’s best knowledge of historical experience, current events, and on various other assumptions that are believed to be reasonable under the circumstances. Actual results could differ from these estimates. Amounts subject to significant judgment and estimates include, but are not limited to, contracts accounted for using the percentage-of-completion method, cash flows used in the evaluation of impairment of goodwill and other long-lived assets, intangible assets, certain deferred costs, collectability of receivables, reserves for uncertain tax benefits, valuation allowances on deferred tax assets, loss accruals for litigation, pension related liabilities, inputs used for computing stock-based compensation and the fair value of derivative instruments.

COMPUTER SCIENCES CORPORATION - NOTES TO CONSOLIDATED FINANCIAL STATEMENTS
58
The Company's income (loss) from continuing operations, before taxes and noncontrolling interests, and diluted earnings per share (EPS) from continuing operations included the following adjustments due to changes in estimated profitability on fixed price contracts accounted for under the percentage-of-completion method for the fiscal years presented:
Twelve Months Ended(Amounts in millions), except per share data April 3, 2015 March 28, 2014 March 29, 2013Gross favorable $ 112 $ 125 $ 142
Gross unfavorable (40) (50) (122)
Total net adjustments, before taxes and noncontrolling interests (1) $ 72 $ 75 $ 20
Impact on diluted EPS from continuing operations $ 0.29 $ 0.31 $ (0.10)
(1) Quarterly changes in estimated profitability on the same fixed price contract are disclosed gross as either favorable or unfavorable.
Revenue Recognition
The Company's primary service offerings are information technology (IT) outsourcing, other professional services, or a combination thereof. Revenues are recognized when persuasive evidence of an arrangement exists, services or products have been provided to the client, the sales price is fixed or determinable, and collectability is reasonably assured. For non-software arrangements that include multiple-elements, revenue recognition involves the identification of separate units of accounting after consideration of combining and/or segmenting contracts and allocation of the arrangement consideration to the units of accounting on the basis of their relative selling price. Revenue under such contracts is recognized based upon the levels of services delivered in the periods in which they are provided. Upfront fees billed for the contract set-up include configuring hardware to new service levels, consolidating and migrating customer architecture from physical to virtual servers, and establishing disaster recoverability capability. These activities do not qualify as separate units of accounting, and the related revenues are deferred until service commencement and recognized ratably over the period of performance during the period in which CSC provides the related service, which is typically the life of the contract. Costs are expensed as incurred, except for direct and incremental set-up costs that are capitalized and amortized on a straight-line basis over the life of the contract (see Outsourcing Contract Costs below). See the section below regarding software transactions that include multiple elements.
The Company provides these services under time and materials, cost-reimbursable, unit-price and fixed-price contracts, the revenue for which is recognized in the following manner:
Time and materials contracts - Revenue is recorded at agreed-upon billing rates at the time services are provided.
Cost-reimbursable contracts - Revenue is recorded at the time costs are incurred and associated fees are recognized when probable and estimable by applying an estimated factor to costs as incurred, such factor being determined by the contract provisions and prior experience.
Unit-price contracts - Revenue is recognized on unit-price contracts based on unit metrics multiplied by the agreed upon contract unit price or when services are delivered.
Fixed-price contracts - For certain fixed-price contracts, revenue is recognized under the percentage-of-completion method as described below; these include certain software development projects, all long-term construction-type contracts, and certain fixed-price arrangements with the U.S. federal government. For other fixed-price contracts, revenue is recognized based on the proportion of the services delivered to date as a percentage of the total services to deliver over the contract term. If output or input measures are not available or cannot be reasonably estimated, revenues are recognized ratably over the contract term.
Under the percentage-of-completion method, progress towards completion is measured based on either achievement of specified contract milestones, costs incurred as a proportion of estimated total costs, or other measures of progress when available. Profit in a given period is reported at the estimated profit margin to be achieved on the overall contract. This method can result in the recognition of unbilled receivables, the deferral of costs as work in process, or deferral of profit

COMPUTER SCIENCES CORPORATION - NOTES TO CONSOLIDATED FINANCIAL STATEMENTS
59
on these contracts. Contracts that require estimates at completion using the percentage-of-completion method accounted for approximately 16.5% of the Company's revenues for fiscal 2015. Management regularly reviews project profitability and underlying estimates. Revisions to the estimates at completion are reflected in results of operations as a change in accounting estimate in the period in which the facts that give rise to the revision become known by management. Provisions for estimated losses at completion, if any, are recognized in the period in which the loss becomes evident. The provision includes estimated costs in excess of estimated revenue and any profit margin previously recognized.
Multiple-element software sales - For multiple-element arrangements that involve the sale of CSC proprietary software, post contract customer support, and other software-related services, vendor-specific objective evidence (VSOE) of fair value is required to allocate and recognize revenue for each element. VSOE of fair value is determined based on the price charged where each deliverable is sold separately. In situations where VSOE of fair value exists for all undelivered elements but not a delivered element (typically the software license element), the residual method is used to allocate revenue to the undelivered elements equal to their VSOE value with the remainder allocated to the delivered element. If significant customization is required, and VSOE is available to support accounting for the software as a separate unit of account, software revenue is recognized as the related software customization services are performed in accordance with the percentage-of-completion method described above. In situations where VSOE of fair value does not exist for all of the undelivered software-related elements, revenue is deferred until only one undelivered element remains and then recognized following the pattern of delivery of the final undelivered element.
Depreciation and Amortization
The Company’s depreciation and amortization policies are as follows:
Property and Equipment:Buildings Up to 40 yearsComputers and related equipment 3 to 5 yearsFurniture and other equipment 2 to 15 yearsLeasehold improvements Shorter of lease term or useful life
Software 2 to 7 yearsOutsourcing contract costs Contract life, excluding option yearsCustomer related intangibles Expected customer service lifeAcquired contract related intangibles Contract life and first contract renewal, where applicable
The cost of property and equipment, less applicable residual values, is depreciated using predominately the straight-line method. Depreciation commences when the specific asset is complete, installed and ready for normal use.
Software and outsourcing contract costs are amortized using predominately the straight-line method. Acquired contract related and customer related intangible assets are amortized in proportion to the estimated undiscounted cash flows projected over the estimated life of the asset or on a straight-line basis if such cash flows cannot be reliably estimated.
Termination Benefits
Termination benefits, offered to employees in connection with workforce reductions, are considered part of an ongoing benefit arrangement and are accounted for in accordance with ASC Topic 712, “Compensation — Non-retirement Post-employment Benefits.” Consequently, such benefits are recorded when payment of the benefits is probable and can be reasonably estimated.
Pension and Other Benefit Plans
The Company and its subsidiaries offer a number of pension and postretirement benefits, life insurance benefits, deferred compensation, and other plans. Most of CSC's pension liabilities are frozen to new accruals. All plans are accounted for
COMPUTER SCIENCES CORPORATION - NOTES TO CONSOLIDATED FINANCIAL STATEMENTS
60
using the guidance of Accounting Standards Codification (ASC) 710 "Compensation - General" and ASC 715 “Compensation—Retirement Benefits” and are measured as of the end of the fiscal year.
Effective the first quarter of fiscal 2015, the Company changed its accounting policy for measuring and recognition of actuarial gains and losses for its defined benefit pension and other post-retirement benefit plans and the calculation of the expected return on pension plan assets. Historically, the Company recognized actuarial gains and losses in excess of 10% of the greater of the market-related value of plan assets or the plans’ projected benefit obligations (the “corridor”) as a component of accumulated other comprehensive loss and, depending on the benefit plan, the Company amortized these gains and losses to earnings either over the remaining average service period for the active participants or over the average remaining life expectancy of the inactive participants. Additionally, for the Company’s U.S. plans and the Australian plan, the Company previously used a calculated value for the market-related valuation of pension plan assets, reflecting changes in the fair value of plan assets over a three-year and a one-year period, respectively. Under the Company’s new accounting policy, the Company recognizes changes in actuarial gains and losses and the changes in fair value of plan assets in earnings at the time of plan remeasurement, typically annually during the fourth quarter of each year as a component of net periodic benefit expense, and the Company no longer applies a corridor and, therefore, no longer defers any gains or losses.
The new accounting policies result in the changes in actuarial gains and losses and the changes in fair value of plan assets being recognized in earnings in the year they occur, rather than amortized over time, and therefore recognized earlier than under the Company’s previous methods of accounting. The Company believes the new pension accounting policies are preferable as they recognize the effects of plan investment performance, interest rate changes, changes in actuarial assumptions as a component of earnings in the year in which they occur rather than amortized over time, and additionally, conform all plans to a consistent policy for determining market-related value of plan assets.
The remaining components of pension/postretirement expense, primarily current period service and interest costs and expected return on plan assets, will continue to be recorded on a quarterly basis.
Inherent in the application of the actuarial methods are key assumptions, including, but not limited to, discount rates, expected long-term rates of return on plan assets, mortality rates, rates of compensation increases, and medical cost trend rates. Company management evaluates these assumptions annually and updates assumptions as necessary. The fair value of assets are determined based on the prevailing market prices or estimated fair value of investments when quoted prices are not available.
Software Development Costs
The Company capitalizes costs incurred to develop commercial software products to be sold, leased or otherwise marketed after establishing technological feasibility until such time the software products are available for general release to customers. Costs incurred to establish technological feasibility are charged to expense as incurred. Enhancements to software products are capitalized where such enhancements extend the life or significantly expand the marketability of the products. Amortization of capitalized software development costs is determined separately for each software product. Annual amortization expense is calculated based on the greater of the ratio of current gross revenues for each product to the total of current and anticipated future gross revenues for the product or the straight-line amortization method over the estimated economic life of the product.
Unamortized capitalized software costs associated with commercial software products are regularly evaluated for impairment on a product-by-product basis by a comparison of the unamortized balance to the product’s net realizable value. The net realizable value is the estimated future gross revenues from that product reduced by the related estimated future costs. When the unamortized balance exceeds the net realizable value, the unamortized balance is written down to the net realizable value and an impairment charge is recorded.
The Company capitalizes costs incurred to develop internal-use computer software during the application development stage. Costs related to preliminary project activities and post implementation activities are expensed as incurred. Internal and external costs incurred in connection with development of upgrades or enhancements that result in additional functionality are also capitalized. Capitalized costs associated with internal-use software are amortized on a straight-line basis over the estimated useful life of the software. Purchased software is capitalized and amortized over the estimated
COMPUTER SCIENCES CORPORATION - NOTES TO CONSOLIDATED FINANCIAL STATEMENTS
61
useful life of the software. Internal-use software assets are evaluated for impairment whenever events or changes in circumstances occur that could impact the recoverability of these assets.
Outsourcing Contract Costs
Costs on outsourcing contracts, including costs incurred for bid and proposal activities, are generally expensed as incurred. However, certain costs incurred upon initiation of an outsourcing contract are deferred and expensed over the contract life. These costs represent incremental external costs or certain specific internal costs that are directly related to the contract acquisition or transition activities and can be separated into two principal categories: contract premiums and transition/set-up costs. Examples of such capitalized costs include labor and related fringe benefits, subcontractor costs, travel costs, and premiums on property and equipment purchases.
Contract premiums are amounts paid to customers in excess of the fair value of assets acquired. Fixed assets acquired in connection with outsourcing contracts are capitalized at fair value and depreciated consistent with the depreciation and amortization policy described above. Contract premiums paid are capitalized as outsourcing contract costs and amortized over the contract life. The amortization of contract premiums is accounted for as a reduction in revenue.
Transition/set-up costs are primarily associated with assuming control over customer IT operations and transforming them in line with contract specifications and are amortized over the contract life.
In the event indications exist that an outsourcing contract cost balance related to a particular contract may be impaired, the remaining estimated undiscounted cash flows of the contract are compared to the associated long-lived asset group including the unamortized outsourcing contract cost balance. If the remaining estimated undiscounted cash flows are not adequate to recover the unamortized cost balance of the asset group, a detailed evaluation is performed and, based on the fair value of the long-lived assets group, any unrecoverable balance is recognized as impairment in the period. Examples of such indicators include situations when a contract is materially underperforming, or is expected to materially underperform in the future, as compared to the original bid model or subsequent annual budgets.
In the event of an early termination of an outsourcing contract, the Company and the customer, pursuant to certain contractual provisions, engage in discussions to determine the recovery of unamortized contract costs, lost profits, transfer of personnel, rights to implemented systems and processes, as well as other matters.
Stock-Based Compensation
The Company provides different forms of stock-based compensation to its employees and non-employee directors. This includes stock options and restricted stock units (RSUs), including performance-based restricted stock units (PSUs). The fair value of the awards is determined on the grant date, based on the Company's closing stock price. For awards settled in shares, the Company recognizes compensation expense based on the grant-date fair value net of estimated forfeitures over the vesting period. For awards settled in cash, the Company recognizes compensation expense based on the fair value at each reporting date net of estimated forfeitures.
The Company uses the Black-Scholes-Merton model in determining the fair value of options granted. The expected term is calculated based on the Company’s historical experience with respect to its stock plan activity in combination with an estimate of when vested and unexercised option shares will be exercised. The expected term of options is based on the two separate job tier classifications, which have distinct historical exercise behavior. The risk-free interest rate is based on the zero-coupon interest rate of U.S. government issued Treasury strips with a period commensurate with the expected term of the options. Expected volatility is based on a blended approach, which uses a 2/3 weighting for historical volatility and 1/3 weighting for implied volatility. The Company’s historical volatility calculation is based on either the Company’s six-year or seven-year historical closing prices, based on employee class, in order to bring this factor more closely into alignment with the expected terms of the stock options. The dividend yield assumption was added concurrent with the introduction of a cash dividend in fiscal 2011 and is based on the respective fiscal year dividend payouts. The Company periodically evaluates its significant assumptions used in the fair value calculation.

COMPUTER SCIENCES CORPORATION - NOTES TO CONSOLIDATED FINANCIAL STATEMENTS
62
Acquisition Accounting and Goodwill
When the Company acquires a controlling financial interest through a business combination, CSC uses the acquisition method of accounting to allocate the purchase consideration to the assets acquired and liabilities assumed, which are generally recorded at fair value. Any excess of purchase consideration over the fair value of the acquired assets and assumed liabilities is recognized as goodwill.
If the initial accounting for an acquisition is incomplete by the end of the reporting period in which it occurs, the Company reports provisional amounts for the items for which the accounting is incomplete. During the measurement period - no longer than one year from the date of the acquisition - the Company retroactively adjusts the provisional amounts recognized at the acquisition date if CSC obtains new information about facts and circumstances that existed as of the acquisition date that, if known, would have changed the measurement of the amounts originally recognized. Any measurement adjustments to the acquired assets or the assumed liabilities are recorded with a corresponding adjustment to goodwill.
For contingent consideration recorded as a liability, the Company initially measures the amount at fair value as of the acquisition date and adjusts the liability, if needed, to fair value each reporting period. Changes in the fair value of contingent consideration, other than measurement period adjustments, are recognized as operating income or expense.
Acquisition-related expenses are recognized separately from the business combination and are expensed as incurred. The results of operations of acquired businesses are included in the Consolidated Financial Statements from the acquisition date.
The Company tests goodwill for impairment on an annual basis, as of the first day of the second fiscal quarter, and between annual tests if circumstances change, or if an event occurs that would more likely than not reduce the fair value of a reporting unit below its carrying amount. A significant amount of judgment is involved in determining whether an event indicating impairment has occurred between annual testing dates. Such indicators include, among other things: a significant decline in expected future cash flows; a significant adverse change in legal factors or in the business climate; unanticipated competition; the disposal of a significant component of a reporting unit; and the testing for recoverability of a significant asset group within a reporting unit.
The goodwill impairment test initially involves the assessment of qualitative factors to determine whether the existence of events or circumstances leads to a determination that it is more likely than not that the fair value of a reporting unit is less than its carrying amount. If the Company determines that it is not more likely than not, then the subsequent two-step process is not required. However, the Company has the option to bypass this initial qualitative assessment for its annual test and proceed directly to step one of the two-step process for one or more of its reporting units. If the Company determines that it is more likely than not that a reporting unit's carrying value exceeds it fair value, then it proceeds with the subsequent two-step goodwill impairment testing process. The first step is to compare each reporting unit’s fair value to its carrying value. If the reporting unit’s fair value exceeds its carrying value, no further procedures are required and no impairment is recorded. However, if a reporting unit’s fair value is less than its carrying value, an impairment of goodwill may exist, requiring the second step to measure the amount of any impairment loss. In the second step, the reporting unit’s fair value is allocated to all of the assets and liabilities of the reporting unit, including any unrecognized intangible assets, for the sole purpose of calculating the implied fair value of goodwill - as if applying the acquisition method of accounting described above to the reporting unit's assets and liabilities. If the implied fair value of goodwill is less than the recorded goodwill, an impairment charge is recorded in operations for the difference.
When the Company performs step one of the two-step test for a reporting unit, it estimates the fair value of the reporting unit using both the income approach and the market approach. The income approach incorporates the use of a discounted cash flow method in which the estimated future cash flows and terminal values for each reporting unit are discounted to a present value using a discount rate. Cash flow projections are based on management's estimates of economic and market conditions, which drive key assumptions of revenue growth rates, operating margins, capital expenditures and working capital requirements. The discount rate is based on the specific risk characteristics of each reporting unit, the weighted-average cost of capital and its underlying forecasts. The market approach estimates fair value by applying performance-metric multiples to the reporting unit's prior and expected operating performance. The multiples are derived from comparable publicly traded companies that have operating and investment characteristics similar to
COMPUTER SCIENCES CORPORATION - NOTES TO CONSOLIDATED FINANCIAL STATEMENTS
63
those of the reporting unit. If the fair value of the reporting unit derived using one approach is significantly different from the fair value estimate using the other approach, the Company reevaluates its assumptions used in the two models. The fair values determined by the market approach and income approach, as described above, are weighted to determine the fair value for each reporting unit. The weighting ascribed to the market approach fair value, assigned to each reporting unit, is driven by two primary factors: 1) the number of comparable publicly traded companies used in the market approach, and 2) the similarity of the operating and investment characteristics of the reporting units to the comparable publicly traded companies used in the market approach.
If CSC performs a step one analysis for all of its reporting units in conjunction with its annual goodwill testing, it also compares the sum of all of its reporting units’ fair values to the Company's market capitalization (per-share stock price multiplied by the number of shares outstanding) and calculates an implied control premium (the excess of the sum of the reporting units’ fair values over the market capitalization). The Company evaluates the reasonableness of the control premium by comparing it to control premiums derived from recent comparable business combinations. If the implied control premium is not reasonable in light of the actual acquisition transactions, the Company reevaluates its fair value estimates of the reporting units by adjusting the discount rates and/or other assumptions. As a result, when CSC’s stock price - and thus market capitalization - is low relative to the sum of the estimated fair value of its reporting units, this reevaluation can result in reductions to its estimated fair values for the reporting units.
Fair Value
The Company uses the fair value measurement guidance to value certain of its assets and liabilities. Under this guidance, assets and liabilities are required to be valued based on assumptions used by a market participant, consistent with the following hierarchy of inputs:
Level 1— Quoted prices unadjusted for identical assets or liabilities in an active market.
Level 2— Inputs other than quoted prices that are observable, either directly or indirectly, for similar assets orliabilities.
Level 3— Unobservable inputs that reflect the entity’s own assumptions which market participants would use inpricing the asset or liability.
The assets and liabilities which are valued using the fair value measurement guidance, on a recurring basis, include the Company’s money market funds and money market deposits, time deposits, short-term investments, pension assets, and derivative instruments including foreign currency forward and option contracts, interest rate swap contracts and total return swaps.
The fair value of foreign currency forward contracts is based on quoted prices for similar but not identical derivative instruments; as such, the inputs are considered Level 2 inputs. Option contracts are valued using inputs which are based on quoted pricing intervals from external valuation models, which do not involve management judgment and as such these inputs are considered Level 2 inputs. The fair value of interest rate swaps is estimated based on valuation models that use interest rate yield curves as inputs, which also do not involve management judgment and as such these inputs are considered Level 2 inputs. Total return swaps are settled on the last day of every fiscal month. Certain pension assets are valued using model based pricing methods that use observable market data; as such these inputs are considered Level 2 inputs. There were no significant assets or liabilities measured at fair value on a recurring basis using significant unobservable (Level 3) inputs.
Receivables
Receivables consist of amounts billed and currently due from customers, amounts earned but unbilled (including contracts measured under the percentage-of-completion method of accounting), amounts retained by the customer until the completion of a specified contract, completion of U.S. federal government audit activities, negotiation of contract modification, and claims.
Allowances for uncollectible billed trade receivables are estimated based on a combination of write-off history, aging analysis and any specific known collectability issues. Unbilled amounts under contracts in progress that are recoverable
COMPUTER SCIENCES CORPORATION - NOTES TO CONSOLIDATED FINANCIAL STATEMENTS
64
do not have an allowance for credit losses. Adjustments to unbilled amounts under contracts in progress related to credit quality, should they occur, would be recorded as a reduction of revenue.
Impairment of Long-Lived Assets
Long-lived assets are reviewed for impairment whenever events or changes in circumstances indicate that the carrying amount of an asset or group of assets may not be recoverable. Recoverability of long-lived assets or groups of assets is assessed based on a comparison of the carrying amount to the estimated future net cash flows. If estimated future undiscounted net cash flows are less than the carrying amount, an expense is recorded in the amount, if any, required to reduce the carrying amount to fair value. Fair value is determined based on a discounted cash flow approach or, when available and appropriate, comparable market values. Long-lived assets to be disposed of are reported at the lower of their carrying amount or their fair value less costs to sell.
Income Taxes
Accounting for income taxes requires the recognition of deferred tax assets and liabilities for the expected future tax consequences of temporary differences between the financial statement carrying amounts and the tax bases of assets and liabilities. The Company maintains valuation allowances when, based on the weight of available evidence, it is more likely than not that all or a portion of a deferred tax asset will not be realized. Changes in valuation allowances from period to period are included in the Company’s tax provision in the period of change. In determining whether a valuation allowance is warranted, the Company takes into account such factors as prior earnings history, expected future earnings, carryback and carryforward periods, and tax strategies that could potentially enhance the likelihood of realization of a deferred tax asset.
The Company recognizes uncertain tax positions in the financial statements when it is more likely than not that the tax position will be sustained upon examination. Uncertain tax positions are measured based on the probabilities that the uncertain tax position will be realized upon final settlement (see Note 13).
Cash and Cash Equivalents
The Company considers investments with an original maturity of three months or less to be cash equivalents. The Company’s cash equivalents consist of time deposits, money market funds and money market deposit accounts with a number of institutions that have high credit ratings.
Foreign Currency
The Company has determined that, generally, the local currency of its foreign affiliates is their functional currency. Accordingly, the assets and liabilities of the foreign affiliates are translated from their respective functional currency to U.S. dollars using year-end exchange rates, income and expense accounts are translated at the average rates in effect during the year, and equity accounts are translated at historical rates. The resulting translation adjustment is reported in the Consolidated Statements of Comprehensive Income and recorded as part of accumulated other comprehensive income (AOCI).
Derivative Instruments
The Company is exposed to certain market risks, including the effect of changes in interest rates and foreign currency exchange rates, and the value of notional investments underlying the Company's non-qualified deferred compensation plan. Changes in benchmark interest rates can impact the fair value of the Company's term notes, whereas changes in foreign currency exchange rates can impact the Company's foreign currency denominated monetary assets and liabilities and forecasted transactions in foreign currency. Market volatility of the notional investments underlying the Company's non-qualified deferred compensation plan can impact the Company's obligations under the plan. The Company uses derivative instruments to mitigate the impact of these market risks, not for trading or any speculative purpose.
The Company designates certain derivative instruments as hedges for purposes of hedge accounting, as defined under ASC 815, “Derivatives and Hedging.” For such derivative instruments, the Company documents its risk management

COMPUTER SCIENCES CORPORATION - NOTES TO CONSOLIDATED FINANCIAL STATEMENTS
65
objectives and strategy for undertaking hedging transactions, as well as all relationships between hedging and hedged risks. The Company's derivative instruments designated for hedge accounting consist mainly of interest rate swaps and foreign currency forward contracts. Changes in the fair value measurements of the cash flow hedge derivative instruments are reflected as adjustments to other comprehensive income and subsequently reclassified into earnings in the period during which the hedged transactions are recognized in earnings. Changes in fair value measurements of interest rate swaps are recorded in current period earnings and fully offset the changes in the fair value of the hedged debt where such instruments have qualified for the short-cut method of hedge accounting under ASC 815
The derivative instruments not designated as hedges for purposes of hedge accounting include total return swaps and certain short-term foreign currency forward and option contracts. These instruments are recorded at their respective fair values and the change in their value is reported in current period earnings.
All cash flows associated with the Company's derivative instruments are classified as operating activities in the Consolidated Statements of Cash Flows.
Earnings (Loss) Per Share
Basic earnings (loss) per common share (EPS) are computed using the weighted average number of common shares outstanding during the period. Diluted EPS reflect the incremental shares issuable upon the assumed exercise of stock options and equity awards.
New Accounting Standards During fiscal year 2015, the Company adopted the following Accounting Standard Update (ASU):
In April 2015, the Financial Accounting Standards Board (FASB) issued ASU No. 2015-04, "Compensation - Retirement Benefits (Topic 715): Practical Expedient for the Measurement Date of an Employer's Defined Benefit Plan Obligation and Plan Assets." The objective of ASU 2015-04 is to provide a practical expedient that permits an entity with a fiscal year end that does not coincide with a month end to measure defined benefit plan assets and obligations using the month end that is closest to the fiscal year end. Effective April 3, 2015, CSC early adopted the ASU for each of its defined benefit plans, and determined that it did not have a material effect on its Consolidated Financial Statements.
In February 2013, the FASB issued ASU No. 2013-04, "Obligations Resulting from Joint and Several Liability Arrangements for which the Total Amount of the Obligation Is Fixed at the Reporting Date” (ASU 2013-04). ASU 2013-04 requires an entity to measure obligations resulting from joint and several liability arrangements for which the total amount of the obligation within the scope of this guidance is fixed at the reporting date, as the sum of the amount the reporting entity agreed to pay on the basis of its arrangement among its co-obligors and any additional amount the reporting entity expects to pay on behalf of its co-obligors. The guidance in ASU 2013-04 also requires an entity to disclose the nature and amount of the obligation as well as other information about those obligations. The amendments in ASU 2013-04 are effective for fiscal years, and interim periods within those years, beginning after December 15, 2013. Effective March 29, 2014, CSC adopted the amendments in ASU 2013-04 and determined that they did not have a material effect on CSC’s Consolidated Financial Statements.
Standards Issued But Not Yet Effective
The following ASUs were recently issued but have not yet been adopted by CSC:
In April 2015, the FASB issued ASU No. 2015-05, "Intangibles - Goodwill and Other - Internal-Use Software (Subtopic 350-40): Customer's Accounting for Fees Paid in a Cloud Computing Arrangement". The amendment adds guidance to existing GAAP by providing guidance to customers about whether a cloud computing arrangement includes a software license. If a cloud computing arrangement does not contain a software license, the customer should account for the arrangement as a service contract. The amendment does not change the accounting for a customer's accounting for service contracts. As a result of the amendment, all software licenses within the scope of Subtopic 350-40 will be accounted for consistent with other licenses of intangible assets. ASU 2015-05 will be effective for CSC in fiscal 2017 and early adoption is permitted. The amendment can either be adopted (1) prospectively to all arrangements entered into or
COMPUTER SCIENCES CORPORATION - NOTES TO CONSOLIDATED FINANCIAL STATEMENTS
66
materially modified after the effective date; or (2) retrospectively. For prospective transition, the only disclosure requirements at transition are the nature of and reason for the change in accounting principle, the transition method, and a qualitative description of the financial statement line items affected by the change. For retrospective transition, the disclosure requirements at transition include the requirements for prospective transition and quantitative information about the effects of the accounting change. CSC is currently evaluating the impact that the adoption of ASU 2015-05 may have on CSC's Consolidated Financial Statements.
In April 2015, the FASB issued ASU 2015-03, "Interest—Imputation of Interest (Subtopic 835-30): Simplifying the Presentation of Debt Issuance Costs", which changes the presentation of debt issuance costs in financial statements. Under the ASU, such costs are presented in the balance sheet as a direct deduction from the related debt liability rather than as an asset. Amortization of the costs is reported as interest expense. Early adoption is allowed for all entities for financial statements that have not been previously issued. The guidance is to be applied retrospectively to all prior periods (i.e., the balance sheet for each period is adjusted). ASU 2015-03 will be effective for CSC beginning in fiscal 2017. CSC is currently evaluating the impact that the adoption of ASU 2015-03 may have on CSC's Consolidated Financial Statements.
In February 2015, the FASB issued ASU No. 2015-02, “Consolidation (Topic 810): Amendments to the Consolidation Analysis” (ASU 2015-02). The objective of ASU 2015-02 is to modify the consolidation requirements of Topic 810 to ensure that reporting entities do not consolidate other legal entities in situations where deconsolidation actually more accurately represents operational and economic results. Among other changes, the amendments to ASC 810 include lessening the relevance on fees paid to a decision-maker or service provider and the related party tiebreaker test. The amendments are effective for public business entities for fiscal years, and for interim periods within those fiscal years beginning after December 15, 2015. This ASU may be adopted using a full retrospective approach or a modified retrospective approach by recording a cumulative effect adjustment to equity as of the beginning of the fiscal year of adoption. ASU 2015-02 will be effective for CSC beginning in fiscal 2017. CSC is currently evaluating the impact that the adoption of ASU 2015-02 may have on CSC’s Consolidated Financial Statements.
In August 2014, the FASB issued ASU No. 2014-15, “Presentation of Financial Statements - Going Concern (Subtopic 205-40): Disclosure of Uncertainties about an Entity’s Ability to Continue as a Going Concern” (ASU 2014-15). ASU 2014-15 is intended to define management’s responsibility to evaluate whether there is substantial doubt about an organization’s ability to continue as a going concern and to provide related footnote disclosures. This ASU provides guidance to an organization’s management, with principles and definitions that are intended to reduce diversity in the timing and content of disclosures that are commonly provided by organizations today in the financial statement footnotes. The amendments are effective for annual periods ending after December 15, 2016, and interim periods within annual periods beginning after December 15, 2016. Early adoption is permitted for annual or interim reporting periods for which the financial statements have not previously been issued. ASU 2014-15 will be effective for CSC for fiscal 2017. CSC believes that the adoption of ASU 2014-15 will not have a material effect on CSC's Consolidated Financial Statements.
In May 2014, the FASB issued ASU No. 2014-09, “Revenue from Contracts with Customers (Topic 606)” (ASU 2014-09). ASU 2014-09 supersedes the revenue recognition requirements in ASC Topic 605, “Revenue Recognition” and some cost guidance included in ASC Subtopic 605-35, Revenue Recognition - Construction-Type and Production-Type Contracts”. The core principle of ASU 2014-09 is that revenue is recognized to depict the transfer of goods or services to customers in an amount that reflects the consideration to which CSC expects to be entitled in exchange for those goods or services. ASU 2014-09 requires the disclosure of sufficient information to enable users of CSC’s financial statements to understand the nature, amount, timing and uncertainty of revenue and cash flows arising from customer contracts. CSC will also be required to disclose information regarding significant judgments and changes in judgments, and assets recognized from costs incurred to obtain or fulfill a contract. ASU 2014-09 provides two methods of retrospective application. The first method would require CSC to apply ASU 2014-09 to each prior reporting period presented. The second method would require CSC to retrospectively apply with the cumulative effect of initially applying ASU 2014-09 recognized at the date of initial application. ASU 2014-09 will be effective for CSC beginning in fiscal 2018; however, a delay in the effective date is currently being considered by the FASB, which we expect will result in at least a one year deferral. The FASB may also permit companies to adopt ASU 2014-09 early, but not before the original public company effective date (that is, annual periods beginning after December 15, 2016). CSC is currently evaluating the impact that the adoption of ASU 2014-09 may have on CSC’s Consolidated Financial Statements.

COMPUTER SCIENCES CORPORATION - NOTES TO CONSOLIDATED FINANCIAL STATEMENTS
67
In April 2014, the FASB issued ASU No. 2014-08, “Presentation of Financial Statements (Topic 205) and Property, Plant, and Equipment (Topic 360): Reporting Discontinued Operations and Disclosures of Disposals of Components of an Entity” (“ASU 2014-08”), which changes the requirements for reporting discontinued operations in Subtopic 205-20 “Presentation of Financial Statements - Discontinued Operations.” The ASU changes the definition of discontinued operations by limiting discontinued operations reporting to disposals that represent strategic shifts that have (or will have) a major effect on an entity’s operations and financial results. Under current U.S. GAAP, many disposals, some of which may be routine in nature and not representative of a substantive change in an entity’s strategy, are reported in discontinued operations. ASU 2014-08 requires expanded disclosures for discontinued operations designed to provide users of financial statements with more information about the assets, liabilities, revenues, expenses and cash flows related to discontinued operations. ASU 2014-08 also requires an entity to disclose the pretax profit or loss (or change in net assets for a not-for-profit entity) of an individually significant component of an entity that does not qualify for discontinued operations reporting. The amendments in ASU 2014-08 are effective prospectively for fiscal years, and interim periods, beginning after December 15, 2014. ASU 2014-08 will be effective for CSC beginning in Q1 FY 2016 and CSC will evaluate each divestiture to determine the appropriate presentation and disclosure requirements associated with CSC's Consolidated Financial Statements.
In January 2014, the FASB issued ASU No. 2014-05, "Service Concession Arrangements (Topic 853) (a consensus of the FASB Emerging Issues Task Force)” (“ASU 2014-05”). ASU 2014-05 provides guidance on the accounting for service concession arrangements, which are arrangements between a public-sector entity grantor and an operating entity under which the operating entity operates the grantor’s infrastructure (e.g. airports, roads, or bridges). The operating entity also may provide the construction, upgrading, or maintenance services of the grantor’s infrastructure. ASU 2014-05 specifies that an operating entity should not account for a service concession arrangement that is within the scope of this ASU as a lease in accordance with Topic 840, "Leases." ASU 2014-05 also specifies that the infrastructure used in a service concession arrangement should not be recognized as property, plant, and equipment of the operating entity. For CSC, ASU 2014-05 will be effective beginning in fiscal 2016. CSC has determined this ASU will not have a material impact on CSC's Consolidated Financial Statements.
Note 2 - Settlement of SEC Investigation
As previously disclosed, on January 28, 2011, the Company was notified by the Division of Enforcement of the SEC that it had commenced a formal civil investigation. That investigation covered a range of matters as previously disclosed by the Company, including the Company’s prior use in fiscal years 2009-2012 of the terms of ongoing contract negotiations with the U.K. National Health Service (the NHS) in developing its assumptions and judgments with respect to the margin used in recognizing profit under the percentage of completion accounting method and in evaluating the recoverability of NHS contract assets, as well as the Company’s prior disclosures concerning such matters. On May 2, 2011, the Audit Committee commenced an independent investigation and, in August 2012, determined in that its independent investigation was complete. The Audit Committee instructed its independent counsel to cooperate with the SEC's Division of Enforcement by completing production of documents and providing any further information requested by the SEC's Division of Enforcement.
As a result of findings by the Audit Committee’s independent investigation, the Company has previously acknowledged certain historic errors and irregularities relating to accounting entries arising from the Nordics region, Australia, and the Company’s contractual relationship with the NHS, self-reported these errors and irregularities to the SEC’s Division of Enforcement, and made out of period adjustments to its financial statements as reported in its past filings. In addition, as previously disclosed, certain personnel in certain foreign operations were reprimanded, suspended, terminated and/or resigned and additional controls were implemented. Based on recommendations from the Audit Committee’s independent investigation and discussions with the SEC's staff concerning the SEC's investigation, the Company also instituted comprehensive enhancements beginning in 2011 to its compliance, financial and disclosure controls, and to the function of internal audit. In doing so, the Company made significant changes to prevent the type of misconduct identified by the Audit Committee’s independent investigation from recurring. The Company also previously took significant steps to enhance its compliance culture and to remediate any deficiencies.
During the third quarter of fiscal 2015, the Company reached an understanding with the staff of the SEC regarding a settlement of a formal civil investigation by the SEC that commenced on January 28, 2011 and covered a range of matters, as previously disclosed, including certain of the Company’s prior disclosures and accounting determinations. As

COMPUTER SCIENCES CORPORATION - NOTES TO CONSOLIDATED FINANCIAL STATEMENTS
68
part of the Company’s understanding with the staff of the SEC regarding terms of the settlement, the Company agreed to pay a penalty of $190 million and to implement a review of its compliance policies through an independent compliance consultant. The Company recorded a pre-tax charge of $197 million for the penalty and related expenses in fiscal 2015.
During the first quarter of fiscal 2016, the agreed-upon settlement with the SEC was formally approved by the SEC and became effective on June 5, 2015 and the Company has agreed, in addition to the payment of the fine and the engagement of the compliance consultant referenced above, to cease and desist from further violations of the anti-fraud, reporting, and books-and-records provisions of the U.S. securities laws. As part of the settlement, the Company has neither admitted nor denied the SEC’s allegations concerning such matters. Further, as part of the settlement, on June 5, 2015, the Company filed its Form 10-K/A in respect of its fiscal year ended March 28, 2014 in order to restate its financial statements for fiscal 2012 and its summary financial results for fiscal 2011 and 2010 reflected in the five year financial data table, all as previously set forth in the Company’s originally filed Form 10-K for its 2014 fiscal year. The restatement had no impact on the Company’s Consolidated Balance Sheets, Statements of Operations, Statements of Comprehensive Income (Loss), Statements of Cash Flows and Statements of Changes in Equity for fiscal 2013 or fiscal 2014 or on its financial statements for fiscal 2015.
Note 3 - Defined Benefit Pension Plan Accounting Policy Changes
During the first quarter of fiscal 2015, the Company changed its accounting policy for the recognition of actuarial gains and losses for its defined benefit pension and other post-retirement benefit plans and the calculation of expected return on pension plan assets. Historically, the Company recognized actuarial gains and losses in excess of 10% of the greater of the market-related value of plan assets or the plans’ projected benefit obligations (the “corridor”) as a component of accumulated other comprehensive loss in its Consolidated Balance Sheets and, depending on the benefit plan, the Company amortized these gains and losses to earnings either over the remaining average service period for the active participants or over the average remaining life expectancy of the inactive participants. Additionally, for the Company’s U.S. plans and the Australian plan, the Company previously used a calculated value for the market-related valuation of pension plan assets, reflecting changes in the fair value of plan assets over a three-year and a one-year period, respectively.
Under the Company’s new accounting policies, the Company recognizes changes in actuarial gains and losses and the changes in fair value of plan assets in earnings at the time of plan remeasurement, annually during the fourth quarter of each year, or if there is an interim remeasurement, as a component of net periodic (benefit)/cost (and the Company no longer applies a corridor and, therefore, no longer defers any gains or losses). The new accounting policies result in the changes in actuarial gains and losses and the changes in fair value of plan assets being recognized in earnings in the year they occur, rather than amortized over time, and therefore recognized earlier than under the Company’s previous methods of accounting. The Company believes the new pension accounting policies are preferable as they recognize the effects of plan investment performance, interest rate changes, and changes in actuarial assumptions as a component of earnings in the year in which they occur rather than amortized over time, and additionally, conform all plans to a consistent policy for determining market-related value of plan assets. These changes have been reported through retrospective application of the new accounting methods to all periods presented. The remaining components of pension/post-retirement expense, primarily current period service and interest costs and expected return on plan assets, will continue to be recorded on a quarterly basis.
In addition to the above mentioned accounting policy changes, the Company also changed the way in which it allocates the elements of net periodic pension (benefit) cost to its reportable segments to be aligned with changes in how the Company's chief operating decision maker evaluates segment performance. Historically, total net periodic pension (benefit) cost, including the amortization of deferred actuarial losses/(gains) and changes in fair value of plan assets, were reported within operating income, as defined by the Company, and fully allocated to reportable segments. Under the new allocation approach, net actuarial gains and losses as well as settlement gain and losses components of the net periodic pension (benefit) cost are excluded entirely from the Company’s definition of operating income and not allocated to the reportable segments. All of the other elements of net periodic pension (benefit)/cost, excluding actuarial gains and losses and settlement gains and losses, will continue to be included within operating income of the Company’s reportable segments. The Company has applied the change in the allocation approach retrospectively, adjusting segment reporting for all prior periods presented (see Note 20).
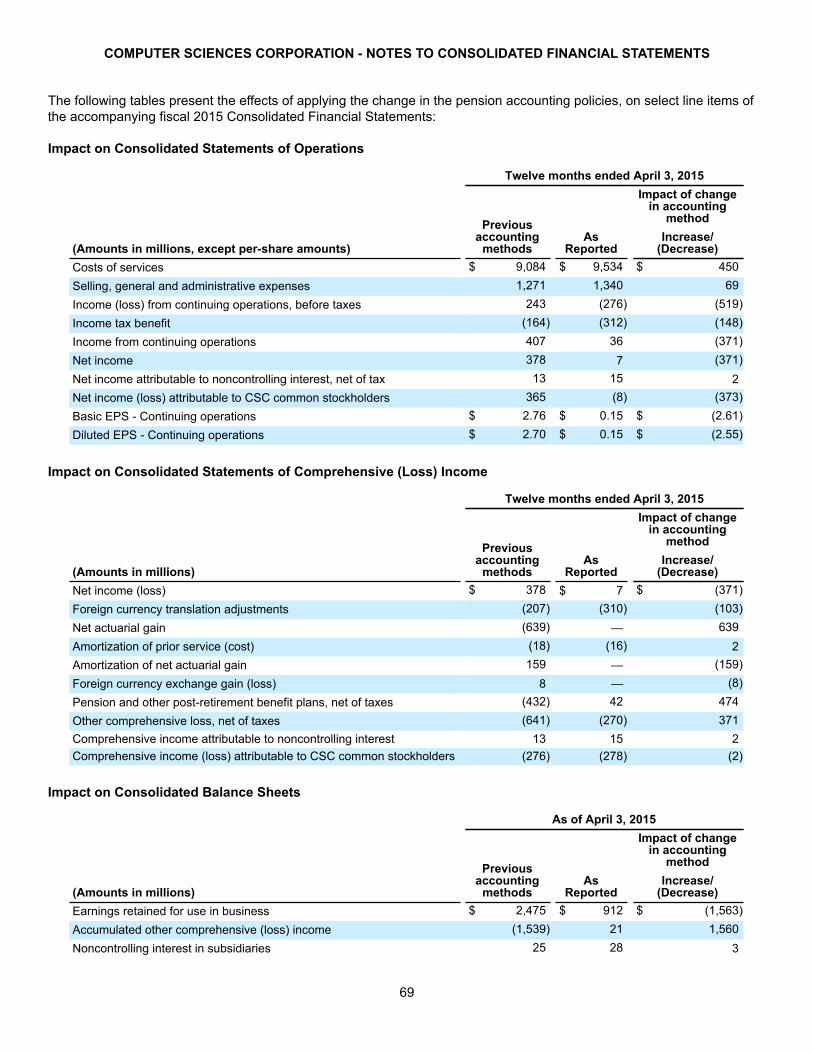
COMPUTER SCIENCES CORPORATION - NOTES TO CONSOLIDATED FINANCIAL STATEMENTS
69
The following tables present the effects of applying the change in the pension accounting policies, on select line items of the accompanying fiscal 2015 Consolidated Financial Statements:
Impact on Consolidated Statements of Operations
Twelve months ended April 3, 2015
Previousaccounting
methodsAs
Reported
Impact of changein accounting
method
(Amounts in millions, except per-share amounts)Increase/
(Decrease)Costs of services $ 9,084 $ 9,534 $ 450Selling, general and administrative expenses 1,271 1,340 69Income (loss) from continuing operations, before taxes 243 (276) (519)Income tax benefit (164) (312) (148)Income from continuing operations 407 36 (371)Net income 378 7 (371)Net income attributable to noncontrolling interest, net of tax 13 15 2Net income (loss) attributable to CSC common stockholders 365 (8) (373)Basic EPS - Continuing operations $ 2.76 $ 0.15 $ (2.61)Diluted EPS - Continuing operations $ 2.70 $ 0.15 $ (2.55)
Impact on Consolidated Statements of Comprehensive (Loss) Income
Twelve months ended April 3, 2015
Previousaccounting
methodsAs
Reported
Impact of changein accounting
method
(Amounts in millions)Increase/
(Decrease)Net income (loss) $ 378 $ 7 $ (371)Foreign currency translation adjustments (207) (310) (103)Net actuarial gain (639) — 639Amortization of prior service (cost) (18) (16) 2Amortization of net actuarial gain 159 — (159)Foreign currency exchange gain (loss) 8 — (8)Pension and other post-retirement benefit plans, net of taxes (432) 42 474Other comprehensive loss, net of taxes (641) (270) 371Comprehensive income attributable to noncontrolling interest 13 15 2Comprehensive income (loss) attributable to CSC common stockholders (276) (278) (2)
Impact on Consolidated Balance Sheets
As of April 3, 2015
Previousaccounting
methodsAs
Reported
Impact of changein accounting
method
(Amounts in millions)Increase/
(Decrease)Earnings retained for use in business $ 2,475 $ 912 $ (1,563)Accumulated other comprehensive (loss) income (1,539) 21 1,560Noncontrolling interest in subsidiaries 25 28 3
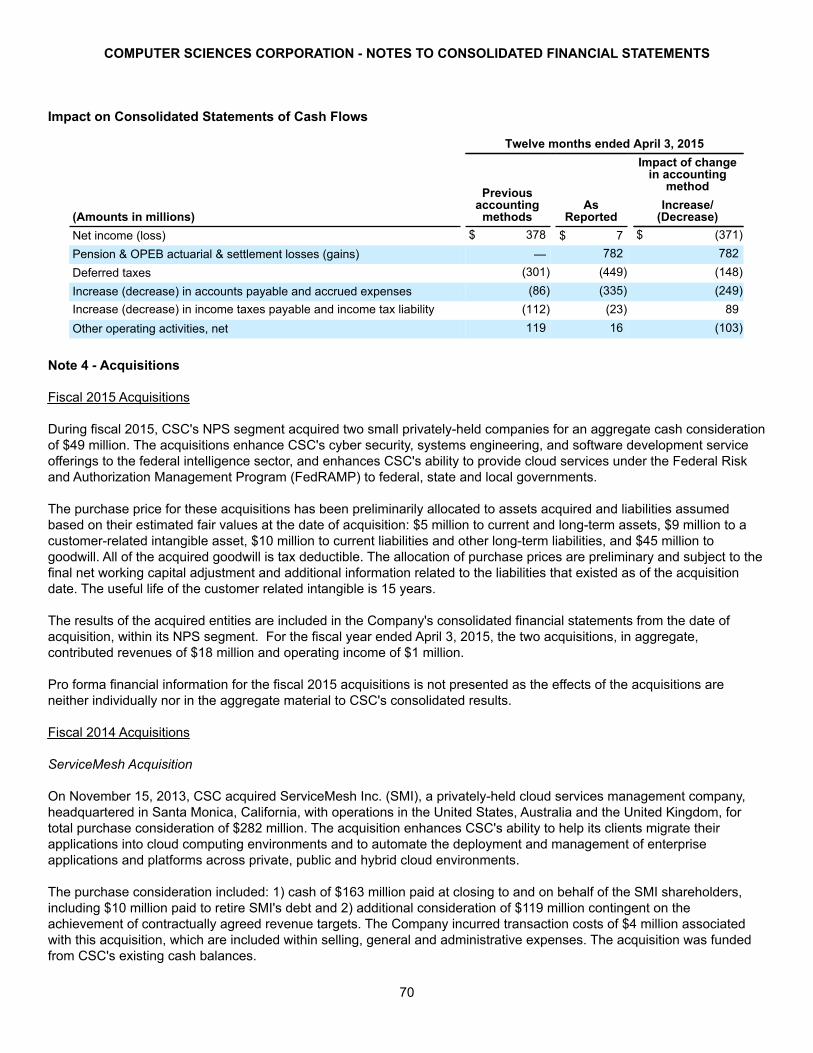
COMPUTER SCIENCES CORPORATION - NOTES TO CONSOLIDATED FINANCIAL STATEMENTS
70
Impact on Consolidated Statements of Cash Flows
Twelve months ended April 3, 2015
Previousaccounting
methodsAs
Reported
Impact of changein accounting
method
(Amounts in millions)Increase/
(Decrease)Net income (loss) $ 378 $ 7 $ (371)Pension & OPEB actuarial & settlement losses (gains) — 782 782Deferred taxes (301) (449) (148)Increase (decrease) in accounts payable and accrued expenses (86) (335) (249)Increase (decrease) in income taxes payable and income tax liability (112) (23) 89Other operating activities, net 119 16 (103)
Note 4 - Acquisitions
Fiscal 2015 Acquisitions
During fiscal 2015, CSC's NPS segment acquired two small privately-held companies for an aggregate cash consideration of $49 million. The acquisitions enhance CSC's cyber security, systems engineering, and software development service offerings to the federal intelligence sector, and enhances CSC's ability to provide cloud services under the Federal Risk and Authorization Management Program (FedRAMP) to federal, state and local governments.
The purchase price for these acquisitions has been preliminarily allocated to assets acquired and liabilities assumed based on their estimated fair values at the date of acquisition: $5 million to current and long-term assets, $9 million to a customer-related intangible asset, $10 million to current liabilities and other long-term liabilities, and $45 million to goodwill. All of the acquired goodwill is tax deductible. The allocation of purchase prices are preliminary and subject to the final net working capital adjustment and additional information related to the liabilities that existed as of the acquisition date. The useful life of the customer related intangible is 15 years.
The results of the acquired entities are included in the Company's consolidated financial statements from the date of acquisition, within its NPS segment. For the fiscal year ended April 3, 2015, the two acquisitions, in aggregate, contributed revenues of $18 million and operating income of $1 million.
Pro forma financial information for the fiscal 2015 acquisitions is not presented as the effects of the acquisitions are neither individually nor in the aggregate material to CSC's consolidated results.
Fiscal 2014 Acquisitions
ServiceMesh Acquisition
On November 15, 2013, CSC acquired ServiceMesh Inc. (SMI), a privately-held cloud services management company, headquartered in Santa Monica, California, with operations in the United States, Australia and the United Kingdom, for total purchase consideration of $282 million. The acquisition enhances CSC's ability to help its clients migrate their applications into cloud computing environments and to automate the deployment and management of enterprise applications and platforms across private, public and hybrid cloud environments.
The purchase consideration included: 1) cash of $163 million paid at closing to and on behalf of the SMI shareholders, including $10 million paid to retire SMI's debt and 2) additional consideration of $119 million contingent on the achievement of contractually agreed revenue targets. The Company incurred transaction costs of $4 million associated with this acquisition, which are included within selling, general and administrative expenses. The acquisition was funded from CSC's existing cash balances.
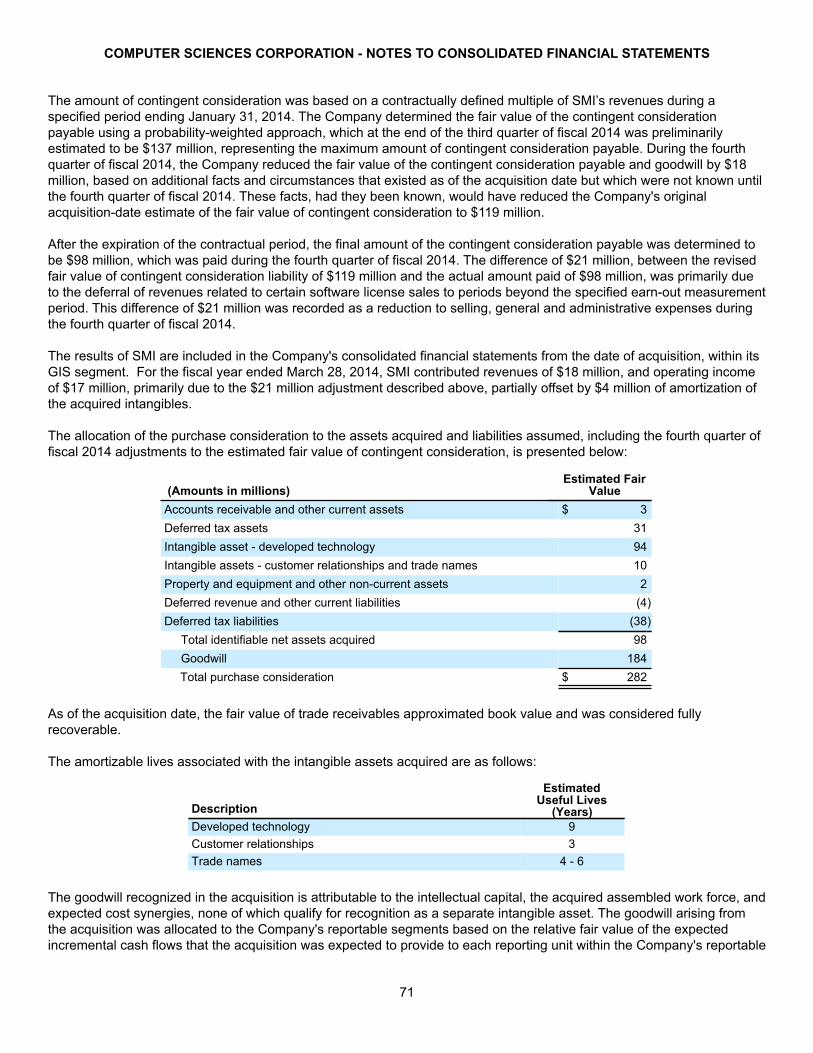
COMPUTER SCIENCES CORPORATION - NOTES TO CONSOLIDATED FINANCIAL STATEMENTS
71
The amount of contingent consideration was based on a contractually defined multiple of SMI’s revenues during a specified period ending January 31, 2014. The Company determined the fair value of the contingent consideration payable using a probability-weighted approach, which at the end of the third quarter of fiscal 2014 was preliminarily estimated to be $137 million, representing the maximum amount of contingent consideration payable. During the fourth quarter of fiscal 2014, the Company reduced the fair value of the contingent consideration payable and goodwill by $18 million, based on additional facts and circumstances that existed as of the acquisition date but which were not known until the fourth quarter of fiscal 2014. These facts, had they been known, would have reduced the Company's original acquisition-date estimate of the fair value of contingent consideration to $119 million.
After the expiration of the contractual period, the final amount of the contingent consideration payable was determined to be $98 million, which was paid during the fourth quarter of fiscal 2014. The difference of $21 million, between the revised fair value of contingent consideration liability of $119 million and the actual amount paid of $98 million, was primarily due to the deferral of revenues related to certain software license sales to periods beyond the specified earn-out measurement period. This difference of $21 million was recorded as a reduction to selling, general and administrative expenses during the fourth quarter of fiscal 2014.
The results of SMI are included in the Company's consolidated financial statements from the date of acquisition, within its GIS segment. For the fiscal year ended March 28, 2014, SMI contributed revenues of $18 million, and operating income of $17 million, primarily due to the $21 million adjustment described above, partially offset by $4 million of amortization of the acquired intangibles.
The allocation of the purchase consideration to the assets acquired and liabilities assumed, including the fourth quarter of fiscal 2014 adjustments to the estimated fair value of contingent consideration, is presented below:
(Amounts in millions)Estimated Fair
ValueAccounts receivable and other current assets $ 3Deferred tax assets 31Intangible asset - developed technology 94Intangible assets - customer relationships and trade names 10Property and equipment and other non-current assets 2Deferred revenue and other current liabilities (4)Deferred tax liabilities (38) Total identifiable net assets acquired 98 Goodwill 184
Total purchase consideration $ 282
As of the acquisition date, the fair value of trade receivables approximated book value and was considered fully recoverable.
The amortizable lives associated with the intangible assets acquired are as follows:
Description
EstimatedUseful Lives
(Years)Developed technology 9Customer relationships 3Trade names 4 - 6
The goodwill recognized in the acquisition is attributable to the intellectual capital, the acquired assembled work force, and expected cost synergies, none of which qualify for recognition as a separate intangible asset. The goodwill arising from the acquisition was allocated to the Company's reportable segments based on the relative fair value of the expected incremental cash flows that the acquisition was expected to provide to each reporting unit within the Company's reportable

COMPUTER SCIENCES CORPORATION - NOTES TO CONSOLIDATED FINANCIAL STATEMENTS
72
segments. Goodwill was allocated as follows: GBS: $28 million, GIS: $120 million, and NPS: $36 million. The goodwill is not deductible for tax purposes.
In connection with the SMI acquisition, the Company granted to certain SMI employees restricted stock units with a grant-date fair value of $41 million. These awards generally vest over a three-year period, associated with the continuing employment of the SMI employees, beginning from the date of acquisition, and are recorded as compensation expense ratably over the three-year period.
Infochimps Acquisition
On August 5, 2013, CSC acquired Infochimps, Inc. (Infochimps), a privately held company, in an all-cash transaction for $27 million. The acquisition complements CSC’s existing Big Data business by providing a flexible, scalable, platform-as-a-service offering. The purchase price has been allocated to assets acquired and liabilities assumed based on their estimated fair values at the date of acquisition: $2 million to current and other long-term assets, $2 million to current and long-term liabilities, and $27 million to goodwill. As of the acquisition date, the fair value of trade receivables approximated book value and was considered fully recoverable. The goodwill is associated with the Company's GBS segment and is not tax-deductible.
Pro forma financial information for the fiscal 2014 acquisitions was not presented as the effects of the acquisitions were neither individually nor in the aggregate material to CSC's consolidated results.
Fiscal 2013 Acquisition
In the second quarter of fiscal 2013, CSC acquired a privately-held entity for $35 million in an all-cash transaction. The entity was acquired to enhance CSC's capabilities in Big Data processing and analytics. The purchase price was allocated to assets acquired and liabilities assumed based on their estimated fair values at the acquisition date: $4 million to current assets, $8 million to acquired intangible assets, $2 million to liabilities, and $25 million to goodwill. As of the acquisition date, the fair value of trade receivables approximated book value and was considered fully recoverable. The goodwill is associated with the NPS segment and is tax deductible. The pro forma financial information for this acquisition is not presented because the effects of this acquisition were not material to CSC’s consolidated results.
Note 5 - Divestitures
During fiscal 2015, 2014, and 2013, the Company divested certain non-core businesses as a part of its service portfolio optimization initiative to focus on next-generation technology services. Certain of the divestitures met the criteria for discontinued operations presentation, and their historical results have been presented as discontinued operations in the Company's Consolidated Statement of Operations.
Discontinued Operations
Fiscal 2015 Divestiture
On July 31, 2014, CSC completed the sale of a German software business to a strategic investor for cash consideration of $3 million. This divestiture, which had been included in the GBS segment's healthcare group, resulted in a pre-tax loss of $22 million, representing the excess of the carrying value of the net assets of the business and transaction costs over the net proceeds. The divested assets and liabilities included: current assets of $54 million (including $21 million of cash); noncurrent assets of $25 million; current liabilities of $33 million; and noncurrent liabilities of $23 million. As of March 28, 2014, the assets and liabilities classified as held-for-sale for this business were: current assets of $25 million, property and equipment and other long-term assets of $31 million, current liabilities of $31 million, and long-term liabilities of $25 million.
The historical results of this business have been presented as discontinued operations in the Company's Consolidated Statement of Operations.

COMPUTER SCIENCES CORPORATION - NOTES TO CONSOLIDATED FINANCIAL STATEMENTS
73
Fiscal 2014 Divestitures
On July 19, 2013, CSC completed the sale of its base operations, aviation and ranges services business unit, the Applied Technology Division (ATD) within its NPS Segment, to a strategic investor for cash consideration of $178 million, plus a net working capital adjustment receivable of $6 million, $3 million of which was collected in the first quarter of fiscal 2015. The ATD divestiture resulted in a pre-tax gain of $77 million. During the first quarter of fiscal 2015, NPS recorded a $1 million final net working capital adjustment, which reduced the total gain on sale.
On May 21, 2013, CSC completed the divestiture of its flood insurance-related business process outsourcing practice (flood insurance BPO), within the GBS segment, to a financial investor for cash consideration of $43 million plus a net working capital adjustment receivable of $4 million. The divestiture resulted in a pre-tax gain of $25 million. During the fourth quarter of fiscal 2014, the Company received cash of $3 million, representing the final net working capital adjustment, and reduced the gain on disposal by $1 million. During the first quarter of fiscal 2015, CSC received an additional $2 million as a purchase price adjustment, which was recorded as an additional gain on the sale of this divestiture.
The historical results of these businesses have been presented as discontinued operations in the Company's Consolidated Statement of Operations.
Fiscal 2013 Divestitures
During fiscal 2013, CSC completed the sales of three businesses within its GBS Segment: the U.S.-based credit services business, an enterprise systems integration business with operations in Malaysia and Singapore, and the Italian consulting and system integration business.
For the sale of its U.S.-based credit services business, the Company received cash proceeds of $1,003 million, of which $2 million was received in the first quarter of fiscal 2014 for a subsequent net working capital adjustment. For the sale of its enterprise system integration business, the Company received $90 million in cash and an additional $13 million for subsequent working capital adjustments. For the disposal of its Italian consulting and system integration business, the Company paid $35 million (plus $8 million of cash included in the divested entity's net assets) and received $6 million from the buyer, during the second quarter of fiscal 2014, for a net working capital adjustment.
These three divestitures resulted in a total pre-tax gain of $769 million (after-tax gain of $417 million), representing the excess of the net proceeds over the carrying value of the net assets of the divested businesses and transaction costs of $11 million. The fiscal 2013 divested assets and liabilities included current assets of $129 million, property and equipment and other long-lived assets of $11 million, goodwill of $241 million, and liabilities of $85 million.
The historical results of these businesses have been presented as discontinued operations in the Company's Consolidated Statement of Operations.

COMPUTER SCIENCES CORPORATION - NOTES TO CONSOLIDATED FINANCIAL STATEMENTS
74
Following is the summary of the results of the discontinued operations:
Twelve Months Ended(Amounts in millions) April 3, 2015 March 28, 2014 March 29, 2013OperationsRevenue $ 10 $ 235 $ 1,193
(Loss) income from discontinued operations, before taxes (11) 9 116Income tax expense — 7 51Net (loss) income from discontinued operations (11) 2 65
Disposal(Loss) gain on disposition $ (21) $ 101 $ 769Income tax (benefit) expense (3) 15 352(Loss) gain on disposition, net of taxes (18) 86 417
(Loss) income from discontinued operations, net of taxes $ (29) $ 88 $ 482
The tax expense on the gain on sale of ATD was minimal primarily due to the difference between the book and tax basis of the assets sold. The primary difference between the book and tax gains on the sale of the flood insurance BPO business was the write-off of approximately $12 million of goodwill, the majority of which was not deductible for tax purposes.
In connection with the sale of the U.S.-based credit services business, the primary difference between the book and tax gain was the write-off of approximately $241 million of goodwill, a majority of which was not deductible for tax purposes. The income tax expense recorded included an allocation of a deferred tax charge related to such goodwill. In addition, a significant tax benefit was realized on the divestment of the Italian consulting and system integration business. The gain from the sale of the enterprise systems integration business with operations in Malaysia and Singapore was exempt from income tax.
Other Divestitures
During the fourth quarter of fiscal 2013, the Company sold Paxus, its Australian IT staffing business unit, included within the Company's GBS Segment. This divestiture did not qualify to be presented as discontinued operations due to CSC's significant continuing business relationship with the divested entity. The total consideration for this divestiture was $79 million, of which $63 million was received in cash and $16 million was recorded as a receivable. During the first quarter of fiscal 2014, CSC collected cash of $10 million and offset the remaining $6 million against a current payable due to the buyer to settle this consideration receivable. The sale of Paxus resulted in a pre-tax gain of $38 million, representing the excess of the proceeds over the carrying value of the net assets divested, net of transaction costs of $3 million. The divested assets and liabilities included current assets of $41 million, property and equipment and other long-lived assets of $2 million, and liabilities of $5 million. The Company recognized no tax expense or benefit on the gain on sale because it had sufficient capital losses in its Australian business unit to completely offset the capital gain.
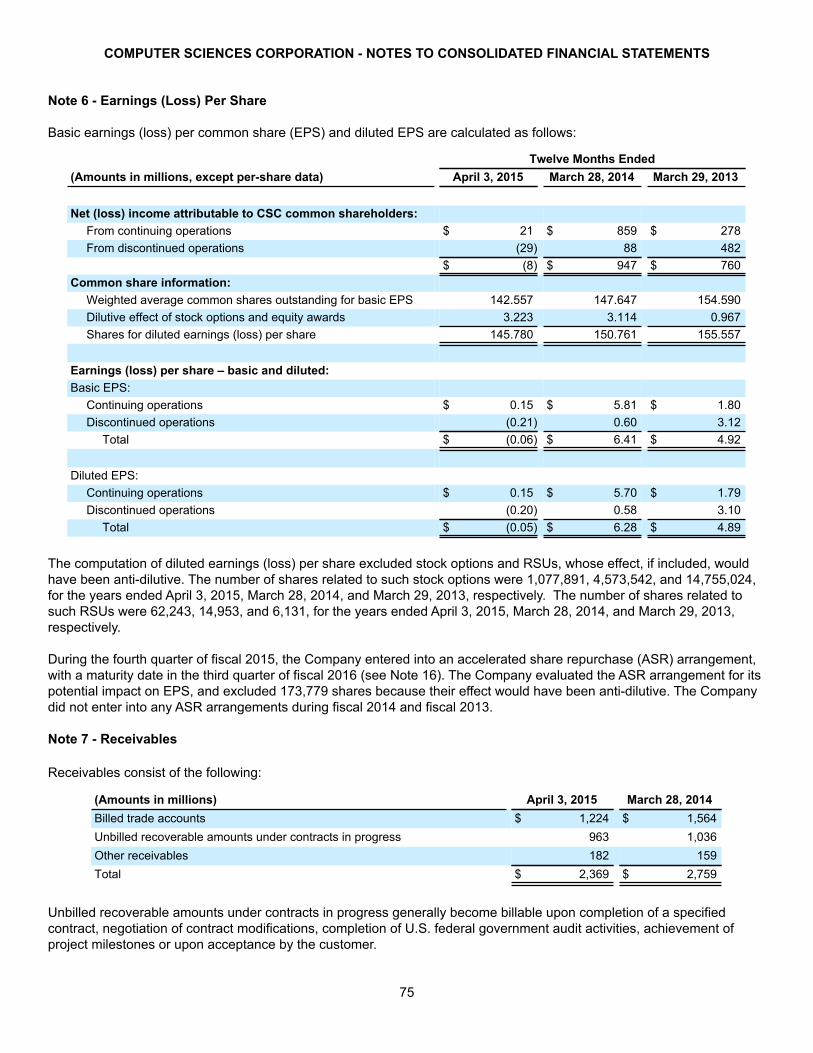
COMPUTER SCIENCES CORPORATION - NOTES TO CONSOLIDATED FINANCIAL STATEMENTS
75
Note 6 - Earnings (Loss) Per Share
Basic earnings (loss) per common share (EPS) and diluted EPS are calculated as follows:
Twelve Months Ended(Amounts in millions, except per-share data) April 3, 2015 March 28, 2014 March 29, 2013
Net (loss) income attributable to CSC common shareholders:From continuing operations $ 21 $ 859 $ 278From discontinued operations (29) 88 482
$ (8) $ 947 $ 760Common share information:
Weighted average common shares outstanding for basic EPS 142.557 147.647 154.590Dilutive effect of stock options and equity awards 3.223 3.114 0.967Shares for diluted earnings (loss) per share 145.780 150.761 155.557
Earnings (loss) per share – basic and diluted:Basic EPS:
Continuing operations $ 0.15 $ 5.81 $ 1.80Discontinued operations (0.21) 0.60 3.12
Total $ (0.06) $ 6.41 $ 4.92
Diluted EPS:Continuing operations $ 0.15 $ 5.70 $ 1.79Discontinued operations (0.20) 0.58 3.10
Total $ (0.05) $ 6.28 $ 4.89
The computation of diluted earnings (loss) per share excluded stock options and RSUs, whose effect, if included, would have been anti-dilutive. The number of shares related to such stock options were 1,077,891, 4,573,542, and 14,755,024, for the years ended April 3, 2015, March 28, 2014, and March 29, 2013, respectively. The number of shares related to such RSUs were 62,243, 14,953, and 6,131, for the years ended April 3, 2015, March 28, 2014, and March 29, 2013, respectively.
During the fourth quarter of fiscal 2015, the Company entered into an accelerated share repurchase (ASR) arrangement, with a maturity date in the third quarter of fiscal 2016 (see Note 16). The Company evaluated the ASR arrangement for its potential impact on EPS, and excluded 173,779 shares because their effect would have been anti-dilutive. The Company did not enter into any ASR arrangements during fiscal 2014 and fiscal 2013.
Note 7 - Receivables
Receivables consist of the following:
(Amounts in millions) April 3, 2015 March 28, 2014Billed trade accounts $ 1,224 $ 1,564Unbilled recoverable amounts under contracts in progress 963 1,036Other receivables 182 159Total $ 2,369 $ 2,759
Unbilled recoverable amounts under contracts in progress generally become billable upon completion of a specified contract, negotiation of contract modifications, completion of U.S. federal government audit activities, achievement of project milestones or upon acceptance by the customer.

COMPUTER SCIENCES CORPORATION - NOTES TO CONSOLIDATED FINANCIAL STATEMENTS
76
Unbilled recoverable amounts under contracts in progress resulting from sales, primarily to the U.S. and other governments, which are expected to be collected after fiscal year 2016 totaled $19 million.
Note 8 - Fair Value
Fair value measurements on a recurring basis
The following table presents the Company’s assets and liabilities, excluding pension assets (see Note 15), that are measured at fair value on a recurring basis as of April 3, 2015 and March 28, 2014:
April 3, 2015Fair Value Hierarchy
(Amounts in millions) Fair Value Level 1 Level 2 Level 3Assets:Money market funds and money market deposit accounts $ 344 $ 344 $ — $ —Time deposits 411 411 — —Derivative instruments 20 — 20 —
Total assets $ 775 $ 755 $ 20 $ —
Liabilities:Derivative instruments $ 5 $ — $ 5 $ —
Total liabilities $ 5 $ — $ 5 $ —
March 28, 2014Fair Value Hierarchy
(Amounts in millions) Fair Value Level 1 Level 2 Level 3Assets:Money market funds and money market deposit accounts $ 717 $ 717 $ — $ —Time deposits 693 693 — —Derivative instruments 5 — 5 —
Total assets $ 1,415 $ 1,410 $ 5 $ —
Liabilities:Derivative instruments $ 4 $ — $ 4 $ —
Total liabilities $ 4 $ — $ 4 $ —
The Company's money market funds, money market deposit accounts and time deposits are included in cash and cash equivalents. The balance sheet classifications of the Company's derivative instruments are presented in Note 9. There were no transfers between Level 1 and Level 2 and no transfers into or out of Level 3.
Derivative instruments include foreign currency forward and option contracts, interest rate swap contracts and total return swaps (see Note 9). The fair value of foreign currency forward contracts represents the estimated amount required to settle the contracts using current market exchange rates, and is based on the month-end foreign currency exchange rates and forward points. The fair value of foreign currency options is estimated based on valuation models that use the original strike price, movement and volatility in foreign currency exchange rates, and length of time to expiration as inputs. The fair value of interest rate swaps is estimated based on valuation models that use interest rate yield curves as inputs. Total return swaps are settled on the last day of every fiscal month. Therefore, there are no such swaps outstanding as of any balance sheet date. The inputs used to estimate the fair value of the Company's derivatives are classified as Level 2.

COMPUTER SCIENCES CORPORATION - NOTES TO CONSOLIDATED FINANCIAL STATEMENTS
77
Fair value measurements on a non-recurring basis
Assets and liabilities measured at fair value on a non-recurring basis include goodwill, tangible assets, intangible assets and other contract related long-lived assets. Such assets are reviewed quarterly for impairment indicators. If a triggering event has occurred, the assets are remeasured when the estimated fair value of the corresponding asset or asset group is less than the carrying value. The fair value measurements, in such instances, are based on significant unobservable inputs (Level 3). There were no significant impairments recorded during the fiscal years ended April 3, 2015 and March 28, 2014.
Financial Instruments not measured at fair value
The carrying amounts of the Company’s financial instruments with short-term maturities are deemed to approximate their market values. The carrying amount of the Company’s long-term debt, excluding capital leases, was $1,550 million and $1,874 million and the estimated fair value was $1,681 million and $2,057 million as of April 3, 2015, and March 28, 2014, respectively. The fair value of long-term debt is estimated based on the current interest rates offered to the Company for instruments with similar terms and remaining maturities and are classified as Level 2.
The Company is subject to counterparty risk in connection with its derivative instruments (see Note 9). With respect to its foreign currency derivatives, as of April 3, 2015, there were six counterparties with concentration of credit risk. Based on gross fair value of these foreign currency derivative instruments, the maximum amount of loss that the Company could incur is less than $2 million. With respect to its interest rate swaps, there were three counterparties with concentration of risk and the maximum amount of loss that the Company could incur was $19 million as of April 3, 2015.
The primary financial instruments other than derivatives (see Note 9) that potentially subject the Company to concentrations of credit risk are accounts receivable. The Company’s customer base includes Fortune 500 companies, the U.S. federal and other governments and other significant, well-known companies operating in North America, Europe and the Pacific Rim. Credit risk with respect to accounts receivable is minimized because of the nature and diversification of the Company’s customer base. Furthermore, the Company continuously reviews its accounts receivable and records provisions for doubtful accounts as needed.
The Company’s credit risk is also affected by customers in bankruptcy proceedings; however, because most of these proceedings involve business reorganizations rather than liquidations and the nature of the Company’s services are often considered essential to the operational continuity of these customers, the Company is generally able to avoid or mitigate significant adverse financial impact in these cases. As of April 3, 2015, the Company had $13 million of accounts receivable, $9 million of related allowance for doubtful accounts, $1 million of other assets, and $4 million of accounts payable with customers involved in bankruptcy proceedings.

COMPUTER SCIENCES CORPORATION - NOTES TO CONSOLIDATED FINANCIAL STATEMENTS
78
Note 9 - Derivative Instruments
The following table presents the fair values of derivative instruments included on the Consolidated Balance Sheets as of April 3, 2015 and March 28, 2014:
Derivative Assets Derivative Liabilities
(Amounts in millions)Balance Sheet
line item
As ofApril 3,
2015
As ofMarch 28,
2014Balance Sheet
line item
As ofApril 3,
2015
As ofMarch 28,
2014
Derivatives designated for hedge accounting:
Interest rate Other assets $ 18 $ 3Other long-termliabilities $ — $ —
Foreign Currency forwardcontracts
Prepaid expenseand other currentassets $ 1 $ —
Accrued expensesand other currentliabilities 3 —
Total fair value of derivatives designated for hedgeaccounting $ 19 $ 3 $ 3 $ —
Derivatives not designated for hedge accounting:
Foreign Currency forwardcontracts
Prepaid expenseand other currentassets $ 1 $ 2
Accrued expensesand other currentliabilities $ 2 $ 4
Total fair value of derivatives not designated for hedgeaccounting $ 1 $ 2 $ 2 $ 4
Derivative instruments designated as hedges
Fair value hedges
Pursuant to its interest rate and risk management strategy, during the second quarter of fiscal 2014, the Company entered into multiple interest rate swap transactions to hedge the fair value of $275 million of the Company's 4.45% term notes, due 2022, which effectively converted the debt into floating interest rate debt. For accounting purposes, these interest rate swap transactions were designated as fair value hedges and qualified for short-cut method of hedge accounting, as defined under ASC 815, “Derivatives and Hedging.” Accordingly, changes in the fair values of the interest rate swaps are reported in earnings and fully offset changes in the fair value of the hedged debt (see Note 14); therefore, no net gain or loss is recognized in the Consolidated Statement of Operations.
The following table presents the pre-tax gains (losses) related to the fair value hedges and the related hedged items, for the twelve months ended April 3, 2015 and March 28, 2014, respectively:
Derivative Instrument Hedged Item
(Amounts in millions)
Statement ofOperations
line itemGain (Loss) for the Twelve
Months Ended
BalanceSheet line
itemGain (Loss) for the Twelve
Months Ended
April 3,2015
March 28,2014 April 3, 2015
March 28,2014
Interest rate swapsOther Income
(Expense) $ 15 $ 3 Debt $ (15) $ (3)
Cash flow hedges
During the first quarter of fiscal 2015, the Company designated certain foreign currency forward contracts as cash flow hedges, to reduce risks related to certain Indian Rupee denominated intercompany obligations and forecasted

COMPUTER SCIENCES CORPORATION - NOTES TO CONSOLIDATED FINANCIAL STATEMENTS
79
transactions. As of April 3, 2015, the notional amount of foreign currency forward contracts designated as cash flow hedges was $383 million, and the related forecasted transactions extend through March 2017. The Company did not enter into any transactions designated as cash flow hedges in fiscal 2014 and 2013.
The Company performed an assessment at the inception of the cash flow hedge transactions and determined all critical terms of the hedging instruments and hedged items matched; therefore there is no ineffectiveness to be recorded and all changes in the hedging instruments’ fair value are recorded in accumulated OCI and subsequently reclassified into earnings in the period during which the hedged transactions are recognized in earnings. The Company performs an assessment of critical terms on an on-going basis throughout the hedging period.
During the year ended April 3, 2015, the Company had no cash flow hedges for which it was probable that the hedged transaction would not occur. As of April 3, 2015, less than $1 million of the existing amount of losses related to the cash flow hedge reported in accumulated OCI is expected to be reclassified into earnings within the next 12 months.
The following table presents the pre-tax gains (losses) associated with the cash flow hedges, recognized in accumulated OCI, for the twelve months ended April 3, 2015:
(Amounts inmillions)
Gain (Loss) recognized inAccumulated OCI (effective
portion) for the Twelve MonthsEnded
Gain (Loss) reclassified into costof services from Accumulated OCI(effective portion) for the Twelve
Months Ended
Gain (Loss) recognized inOther Income (Expense)
(ineffective portion) for theTwelve Months Ended
April 3, 2015
Foreign currencyforward and optioncontracts $ (2) $ — $ —
Derivatives not designated for hedge accounting
Total return swaps
Beginning in the first quarter of fiscal 2015, the Company entered into total return swaps derivative contracts (TRS) to manage exposure to market volatility of the notional investments underlying the Company's deferred compensation obligations. For accounting purposes, these TRS are not designated as hedges, as defined under ASC 815, “Derivatives and Hedging,” and all changes in their fair value and changes in the associated deferred compensation liabilities are recorded in cost of services and selling, general and administrative expenses. The TRS are entered into monthly and are settled on the last day of every fiscal month. The Company did not enter into TRS in fiscal 2014 and 2013.
Foreign currency derivatives
The Company manages the exposure to fluctuations in foreign currencies by using short-term foreign currency forward and option contracts to economically hedge certain foreign currency denominated assets and liabilities, including intercompany accounts and loans. For accounting purposes, these foreign currency option and forward contracts are not designated as hedges, as defined under ASC 815, “Derivatives and Hedging,” and all changes in their fair value are reported in current period earnings within the other income (expense) line of the Consolidated Statements of Operations. The notional amount of the foreign currency forward contracts outstanding as of April 3, 2015 and March 28, 2014 was $700 million and $816 million, respectively. The notional amount of option contracts outstanding as of April 3, 2015 and March 28, 2014 was $0 million and $81 million, respectively.

COMPUTER SCIENCES CORPORATION - NOTES TO CONSOLIDATED FINANCIAL STATEMENTS
80
The following table presents the pretax amounts affecting income related to derivatives not designated for hedge accounting for the years ended April 3, 2015, March 28, 2014, and March 29, 2013 respectively:
Twelve Months Ended(Amounts inmillions)
Statement ofOperations line item April 3, 2015
March 28,2014
March 29,2013
Total return swaps
Cost of services andSelling, general &administrative expenses $ 8 $ — $ —
Foreign currencyforwards and options Other Income (Expense) (11) (15) (17)Total $ (3) $ (15) $ (17)
Other risks
As discussed further in Note 8, the Company is exposed to the risk of losses in the event of non-performance by the counterparties to its derivative contracts. To mitigate counterparty credit risk, the Company regularly reviews its credit exposure and the creditworthiness of the counterparties. The Company also enters into enforceable master netting arrangements with some of its counterparties. However for financial reporting purposes it is the Company’s policy to not offset derivative assets and liabilities despite the existence of enforceable master netting arrangements with some of its counterparties. As of April 3, 2015, the amount that the Company elected to not offset for derivatives subject to master netting arrangements was approximately $1 million. As of March 28, 2014 there were no amounts that the Company elected to offset. The Company's derivative contracts do not require it to hold or post collateral.
Note 10 - Property and Equipment
Property and equipment consisted of the following:
(Amounts in millions) April 3, 2015 March 28, 2014Property and equipment — gross:
Land, buildings and leasehold improvements $ 1,107 $ 1,226Computers and related equipment 3,609 4,051Furniture and other equipment 305 346Construction in progress 23 28
5,044 5,651Less: accumulated depreciation and amortization 3,461 3,620
Property and equipment, net $ 1,583 $ 2,031
Depreciation expense for fiscal years 2015, 2014, and 2013 was $606 million, $661 million, and $709 million, respectively.
Note 11 - Intangible Assets
A summary of amortizable intangible assets is as follows:
As ofApril 3, 2015
(Amounts in millions)
GrossCarrying
ValueAccumulatedAmortization
NetCarrying
ValueOutsourcing contract costs $ 802 $ 476 $ 326Software 2,393 1,642 751Customer and other intangible assets 476 327 149Total intangible assets $ 3,671 $ 2,445 $ 1,226

COMPUTER SCIENCES CORPORATION - NOTES TO CONSOLIDATED FINANCIAL STATEMENTS
81
As ofMarch 28, 2014
(Amounts in millions)
GrossCarrying
ValueAccumulatedAmortization
NetCarrying
ValueOutsourcing contract costs $ 1,465 $ 1,038 $ 427Software 2,330 1,680 650Customer and other intangible assets 588 315 273Total intangible assets $ 4,383 $ 3,033 $ 1,350
Amortization expense for the years ended April 3, 2015, March 28, 2014, and March 29, 2013 was $408 million, $402 million, and $414 million, respectively, including reductions of revenue for amortization of outsourcing contract cost premiums of $27 million, $34 million, and $40 million and for amortization of contract related intangible asset of $10 million, $11 million and $11 million in each of the respective years (see Note 1).
Estimated amortization related to intangible assets, including amortization of contract cost premium, as of April 3, 2015, for fiscal 2016 through fiscal 2020, is as follows: $330 million, $261 million, $212 million, $176 million, and $138 million, respectively.
During fiscal 2015, CSC sold certain intangible assets to a third party for total consideration of $53 million of which cash consideration was received of $31 million. As a result, CSC recorded a gain on sale of $53 million as a reduction of cost of sales in its GIS segment. As of April 3, 2015, CSC had $22 million of outstanding receivables related to these sales, which will be paid in quarterly installments.
Purchased and internally developed software, net of accumulated amortization, consisted of the following:
(Amounts in millions) April 3, 2015 March 28, 2014Purchased software $ 256 $ 287Internally developed commercial software 364 308Internally developed internal-use software 131 55Total $ 751 $ 650
Amortization expense related to purchased software was $143 million, $130 million, and $143 million, for the years ended April 3, 2015, March 28, 2014, and March 29, 2013, respectively. Amortization expense related to internally developed commercial software was $63 million, $56 million, and $53 million, for the years ended April 3, 2015, March 28, 2014, and March 29, 2013, respectively. Amortization expense related to internally developed internal-use software was $6 million, $2 million, and $2 million, for the years ended April 3, 2015, March 28, 2014, and March 29, 2013, respectively.
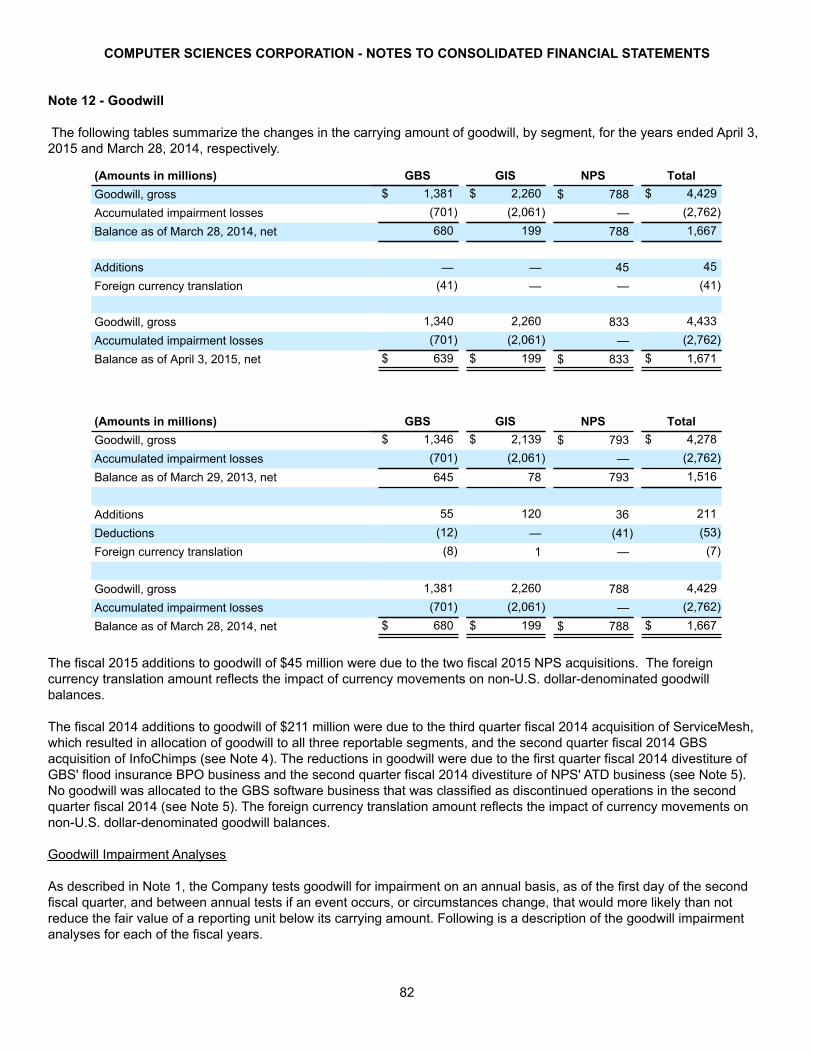
COMPUTER SCIENCES CORPORATION - NOTES TO CONSOLIDATED FINANCIAL STATEMENTS
82
Note 12 - Goodwill
The following tables summarize the changes in the carrying amount of goodwill, by segment, for the years ended April 3, 2015 and March 28, 2014, respectively.
(Amounts in millions) GBS GIS NPS TotalGoodwill, gross $ 1,381 $ 2,260 $ 788 $ 4,429Accumulated impairment losses (701) (2,061) — (2,762)Balance as of March 28, 2014, net 680 199 788 1,667
Additions — — 45 45Foreign currency translation (41) — — (41)
Goodwill, gross 1,340 2,260 833 4,433Accumulated impairment losses (701) (2,061) — (2,762)Balance as of April 3, 2015, net $ 639 $ 199 $ 833 $ 1,671
(Amounts in millions) GBS GIS NPS TotalGoodwill, gross $ 1,346 $ 2,139 $ 793 $ 4,278Accumulated impairment losses (701) (2,061) — (2,762)Balance as of March 29, 2013, net 645 78 793 1,516
Additions 55 120 36 211Deductions (12) — (41) (53)Foreign currency translation (8) 1 — (7)
Goodwill, gross 1,381 2,260 788 4,429Accumulated impairment losses (701) (2,061) — (2,762)Balance as of March 28, 2014, net $ 680 $ 199 $ 788 $ 1,667
The fiscal 2015 additions to goodwill of $45 million were due to the two fiscal 2015 NPS acquisitions. The foreign currency translation amount reflects the impact of currency movements on non-U.S. dollar-denominated goodwill balances.
The fiscal 2014 additions to goodwill of $211 million were due to the third quarter fiscal 2014 acquisition of ServiceMesh, which resulted in allocation of goodwill to all three reportable segments, and the second quarter fiscal 2014 GBS acquisition of InfoChimps (see Note 4). The reductions in goodwill were due to the first quarter fiscal 2014 divestiture of GBS' flood insurance BPO business and the second quarter fiscal 2014 divestiture of NPS' ATD business (see Note 5). No goodwill was allocated to the GBS software business that was classified as discontinued operations in the second quarter fiscal 2014 (see Note 5). The foreign currency translation amount reflects the impact of currency movements on non-U.S. dollar-denominated goodwill balances.
Goodwill Impairment Analyses
As described in Note 1, the Company tests goodwill for impairment on an annual basis, as of the first day of the second fiscal quarter, and between annual tests if an event occurs, or circumstances change, that would more likely than not reduce the fair value of a reporting unit below its carrying amount. Following is a description of the goodwill impairment analyses for each of the fiscal years.

COMPUTER SCIENCES CORPORATION - NOTES TO CONSOLIDATED FINANCIAL STATEMENTS
83
Fiscal 2015
As of the beginning of fiscal 2015, the Company reallocated goodwill among certain of its GBS reporting units due to 1) changes in the structure of segment management reporting; and 2) the availability of discrete financial information. Goodwill was reallocated using a relative fair value allocation approach. CSC performed a quantitative and qualitative goodwill impairment assessment for the changed reporting units and determined that there was no indication that goodwill was impaired for those reporting units as of the reallocation date.
For the Company’s annual goodwill impairment assessment as of July 5, 2014, the Company assessed qualitative factors to determine whether events or circumstances existed that would lead the Company to conclude that it was more likely than not that the fair value of any of its reporting units was below their carrying amounts. The Company determined that, based on its qualitative assessment of such factors for all reporting units, no reporting units met the more-likely-than-not threshold. Accordingly, the Company did not perform further analysis.
At the end of the fourth quarter of fiscal 2015, the Company assessed whether there were events or changes in circumstances that would more likely than not reduce the fair value of any of its reporting units below its carrying amount and require further analysis. The Company determined that there were no such indicators and, as a result, it was unnecessary to perform an interim impairment test as of April 3, 2015.
Fiscal 2014
As of the beginning of the first quarter of fiscal 2014, the Company performed the first step of the traditional two-step goodwill impairment test for all reporting units due to a reallocation of goodwill caused by segment changes impacting the composition of certain reporting units. Based on the results of the first step of the impairment test, the Company concluded that the fair value of each reporting unit significantly exceeded its carrying value and therefore the second step of the goodwill impairment test was not required as of the goodwill reassignment date.
Fiscal 2013
In connection with the fiscal 2013 annual impairment assessment, the Company chose to bypass the initial qualitative assessment and proceeded directly to the first step of the traditional two-step impairment test for all reporting units, and concluded that no impairment had occurred. The fair values of all of CSC's reporting units were significantly in excess of their carrying values.
Note 13 - Income Taxes
The sources of (loss) income from continuing operations, before income taxes, classified between domestic entities and those entities domiciled outside of the United States, are as follows:
Twelve Months Ended(Amounts in millions) April 3, 2015 March 28, 2014 March 29, 2013Domestic entities $ (369) $ 574 $ (113)Entities outside the United States 93 689 348Total $ (276) $ 1,263 $ 235

COMPUTER SCIENCES CORPORATION - NOTES TO CONSOLIDATED FINANCIAL STATEMENTS
84
The income tax (benefit) expense on income (loss) from continuing operations is comprised of:
Twelve Months Ended
(Amounts in millions) April 3, 2015 March 28, 2014 March 29, 2013Current:
Federal $ 49 $ 81 $ (330)
State (10) 7 (5)
Foreign 98 126 174
137 214 (161)
Deferred:
Federal (126) 119 76
State (21) 25 (18)
Foreign (302) 25 41
(449) 169 99
Total income tax expense (benefit) $ (312) $ 383 $ (62)
The current (benefit) provision for fiscal years 2015, 2014, and 2013, includes interest and penalties of $1 million, $(9) million, and $10 million, respectively, for uncertain tax positions.
The major elements contributing to the difference between the U.S. federal statutory tax rate of 35% and the effective tax rate (ETR) for continuing operations are as follows:
Twelve Months EndedApril 3, 2015 March 28, 2014 March 29, 2013
Statutory rate (35.0)% 35.0% 35.0 %State income tax, net of federal tax (4.0) 1.8 (2.6)Change in uncertain tax positions 0.6 2.9 2.4Foreign tax rate differential (127.2) 2.8 (126.7)Income tax credits (2.0) (0.3) (0.1)Valuation allowance 32.6 (11.8) 175.2Change in entity tax status — — (0.7)Loss on sale of securities — 0.8 (105.4)SEC settlements 26.4 — —Other items, net (4.4) (0.9) (3.5)Effective tax rate (113.0)% 30.3% (26.4)%
In fiscal year 2015, the ETR was primarily driven by:• The impact of the non-deductible SEC settlement of $190 million, which decreased the income tax benefit and the
ETR by $73 million and 26.4%, respectively.• Local losses on investments in Luxembourg increased the foreign rate differential and increased the ETR by
$325 million and by 117.8%, respectively, with an offsetting decrease in the ETR due to an increase in the valuation allowance of the same amount.
• Changes in valuation allowances in certain jurisdictions, including a valuation allowance release in the United Kingdom. The total impact of the valuation allowance release increased the income tax benefit and the ETR by $235 million and 85.2%, respectively. There was a net decrease in valuation allowances in fiscal year 2015.
In fiscal year 2014, the ETR was primarily driven by:• The Company recorded a tax expense of $10 million related to the previous restructuring of an operating
subsidiary. This expense increased the ETR by 0.8%.

COMPUTER SCIENCES CORPORATION - NOTES TO CONSOLIDATED FINANCIAL STATEMENTS
85
• A net increase in uncertain tax positions across various jurisdictions of $36 million which increased the ETR by 2.9%. The primary drivers of this increase in tax expense were related to various tax issues including transfer pricing and foreign exchange losses.
• A decrease in the valuation allowance determined on a tax jurisdictional basis due to a shift in the global mix of income which decreased tax expense and the ETR by $58 million and 4.6%, respectively
• Local income on investment recoveries in Luxembourg (i) decreased the valuation allowance and the ETR by $90.6 million and 7.2%, respectively, and (ii) increased the foreign rate differential and ETR by $90.6 million and by 7.2%, respectively.
In fiscal 2013, the ETR was primarily driven by:• An internal restructuring whereby a significant operating subsidiary was recapitalized. Certain securities issued
pursuant to the recapitalization were subsequently sold to a third party. The sale resulted in the recognition of a capital loss of approximately $640 million, which reduced tax expense and the ETR by $248 million and 105.4%, respectively.
• A valuation allowance recorded for certain of the Company's German subsidiaries related to net operating losses and other net deferred tax assets. The impact to tax expense and the ETR was an increase of $77 million and 32.8%, respectively.
• An increase in the valuation allowance determined on a tax jurisdictional basis due to several factors including: (i) a shift in the global mix of income which increased tax expense and the ETR by $76 million and 32.3%, respectively (ii) capital gains from the sale of certain other assets which decreased tax expense and the ETR by $11.5 million and 4.9%, respectively and (iii) state capital losses and credits not expected to be fully utilized within the carryforward period which increased tax expense and the ETR by $29.6 million and 12.6%, respectively.
• Local losses on investment write-downs in Luxembourg (i) increased the valuation allowance and the ETR by $240.5 million and 102.3%, respectively, and (ii) decreased the foreign rate differential and ETR by $240.5 million and 102.3%, respectively.
For the tax impact of discontinued operations, see Note 5.
The deferred tax assets (liabilities) are as follows:
(Amounts in millions) April 3, 2015 March 28, 2014Deferred Tax Assets
Employee benefits $ 431 $ 333Tax loss/credit carryforwards 1,083 919Accrued interest 24 20State taxes 7 10Cumulative foreign exchange gain/loss 6 2Contract accounting 38 38Other assets 80 66
Total Deferred Tax Assets 1,669 1,388Valuation allowance (958) (1,006)
Net Deferred Tax Assets 711 382
Deferred Tax LiabilitiesDepreciation and amortization (287) (341)Investment basis differences (110) (126)Other liabilities (97) (112)
Total Deferred Tax Liabilities (494) (579)
Total Deferred Tax Assets $ 217 $ (197)
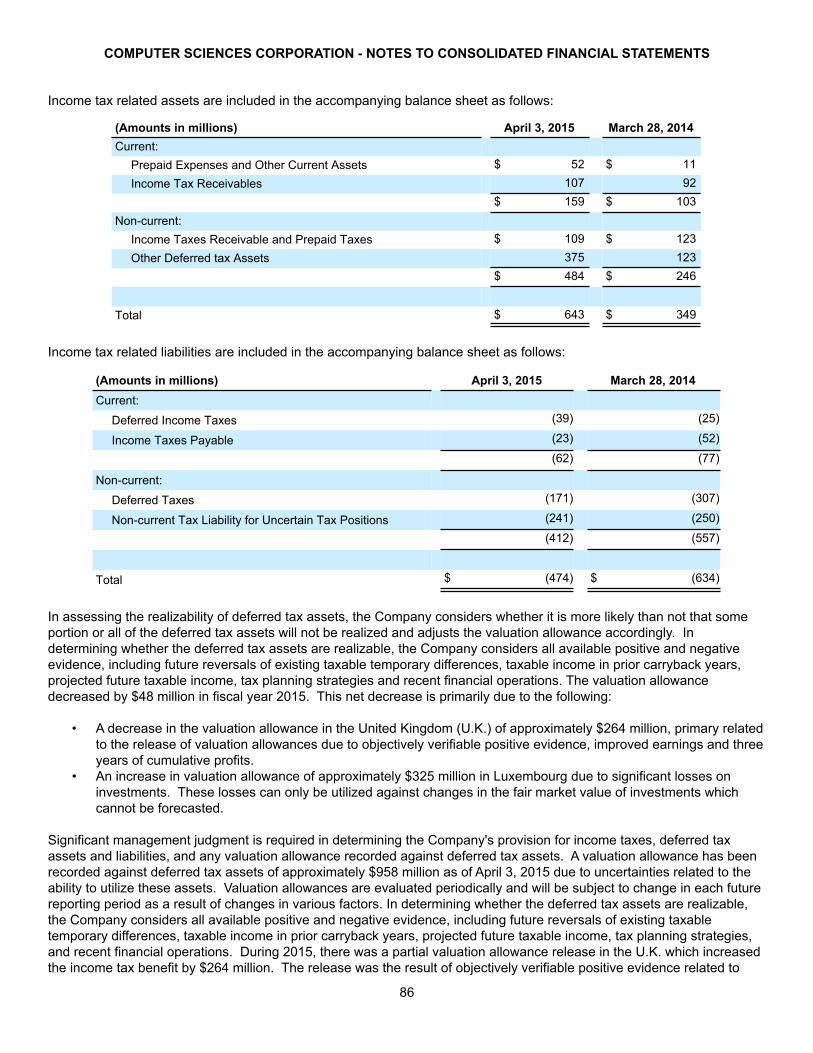
COMPUTER SCIENCES CORPORATION - NOTES TO CONSOLIDATED FINANCIAL STATEMENTS
86
Income tax related assets are included in the accompanying balance sheet as follows:
(Amounts in millions) April 3, 2015 March 28, 2014Current:
Prepaid Expenses and Other Current Assets $ 52 $ 11Income Tax Receivables 107 92
$ 159 $ 103Non-current:
Income Taxes Receivable and Prepaid Taxes $ 109 $ 123Other Deferred tax Assets 375 123
$ 484 $ 246
Total $ 643 $ 349
Income tax related liabilities are included in the accompanying balance sheet as follows:
(Amounts in millions) April 3, 2015 March 28, 2014Current:
Deferred Income Taxes (39) (25)
Income Taxes Payable (23) (52)
(62) (77)
Non-current:
Deferred Taxes (171) (307)
Non-current Tax Liability for Uncertain Tax Positions (241) (250)
(412) (557)
Total $ (474) $ (634)
In assessing the realizability of deferred tax assets, the Company considers whether it is more likely than not that some portion or all of the deferred tax assets will not be realized and adjusts the valuation allowance accordingly. In determining whether the deferred tax assets are realizable, the Company considers all available positive and negative evidence, including future reversals of existing taxable temporary differences, taxable income in prior carryback years, projected future taxable income, tax planning strategies and recent financial operations. The valuation allowance decreased by $48 million in fiscal year 2015. This net decrease is primarily due to the following:
• A decrease in the valuation allowance in the United Kingdom (U.K.) of approximately $264 million, primary related to the release of valuation allowances due to objectively verifiable positive evidence, improved earnings and three years of cumulative profits.
• An increase in valuation allowance of approximately $325 million in Luxembourg due to significant losses on investments. These losses can only be utilized against changes in the fair market value of investments which cannot be forecasted.
Significant management judgment is required in determining the Company's provision for income taxes, deferred tax assets and liabilities, and any valuation allowance recorded against deferred tax assets. A valuation allowance has been recorded against deferred tax assets of approximately $958 million as of April 3, 2015 due to uncertainties related to the ability to utilize these assets. Valuation allowances are evaluated periodically and will be subject to change in each future reporting period as a result of changes in various factors. In determining whether the deferred tax assets are realizable, the Company considers all available positive and negative evidence, including future reversals of existing taxable temporary differences, taxable income in prior carryback years, projected future taxable income, tax planning strategies, and recent financial operations. During 2015, there was a partial valuation allowance release in the U.K. which increased the income tax benefit by $264 million. The release was the result of objectively verifiable positive evidence related to
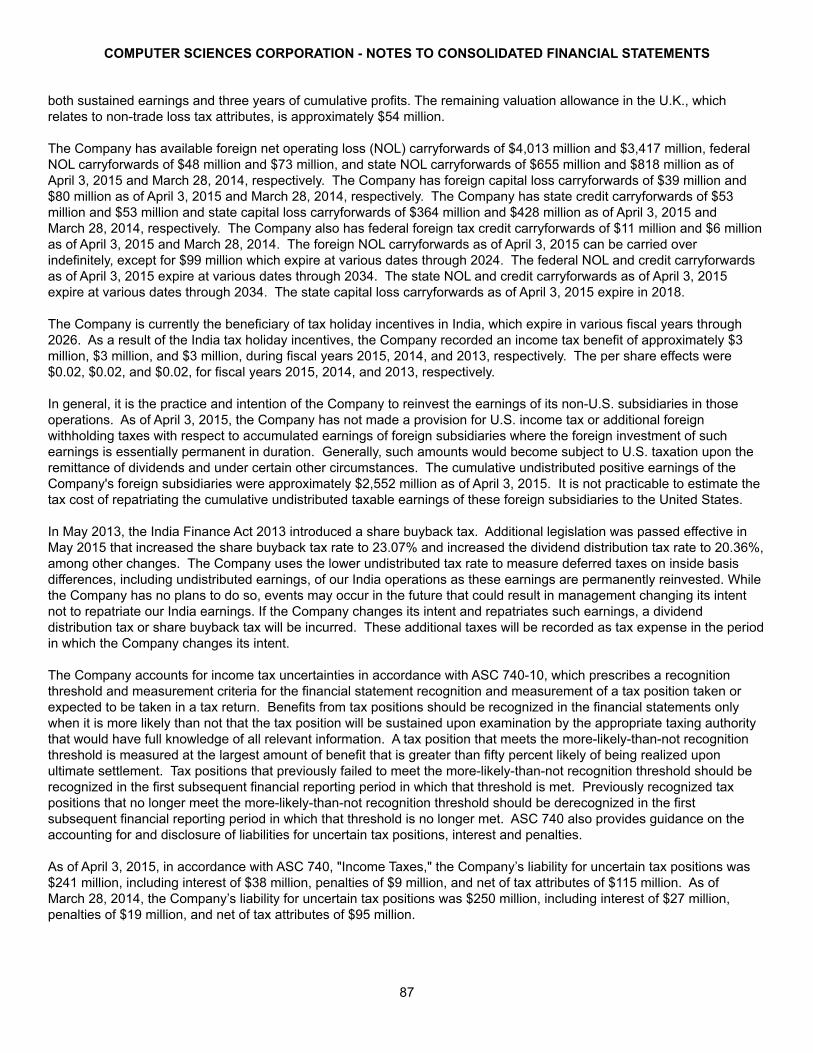
COMPUTER SCIENCES CORPORATION - NOTES TO CONSOLIDATED FINANCIAL STATEMENTS
87
both sustained earnings and three years of cumulative profits. The remaining valuation allowance in the U.K., which relates to non-trade loss tax attributes, is approximately $54 million.
The Company has available foreign net operating loss (NOL) carryforwards of $4,013 million and $3,417 million, federal NOL carryforwards of $48 million and $73 million, and state NOL carryforwards of $655 million and $818 million as of April 3, 2015 and March 28, 2014, respectively. The Company has foreign capital loss carryforwards of $39 million and $80 million as of April 3, 2015 and March 28, 2014, respectively. The Company has state credit carryforwards of $53 million and $53 million and state capital loss carryforwards of $364 million and $428 million as of April 3, 2015 and March 28, 2014, respectively. The Company also has federal foreign tax credit carryforwards of $11 million and $6 million as of April 3, 2015 and March 28, 2014. The foreign NOL carryforwards as of April 3, 2015 can be carried over indefinitely, except for $99 million which expire at various dates through 2024. The federal NOL and credit carryforwards as of April 3, 2015 expire at various dates through 2034. The state NOL and credit carryforwards as of April 3, 2015 expire at various dates through 2034. The state capital loss carryforwards as of April 3, 2015 expire in 2018.
The Company is currently the beneficiary of tax holiday incentives in India, which expire in various fiscal years through 2026. As a result of the India tax holiday incentives, the Company recorded an income tax benefit of approximately $3 million, $3 million, and $3 million, during fiscal years 2015, 2014, and 2013, respectively. The per share effects were $0.02, $0.02, and $0.02, for fiscal years 2015, 2014, and 2013, respectively.
In general, it is the practice and intention of the Company to reinvest the earnings of its non-U.S. subsidiaries in those operations. As of April 3, 2015, the Company has not made a provision for U.S. income tax or additional foreign withholding taxes with respect to accumulated earnings of foreign subsidiaries where the foreign investment of such earnings is essentially permanent in duration. Generally, such amounts would become subject to U.S. taxation upon the remittance of dividends and under certain other circumstances. The cumulative undistributed positive earnings of the Company's foreign subsidiaries were approximately $2,552 million as of April 3, 2015. It is not practicable to estimate the tax cost of repatriating the cumulative undistributed taxable earnings of these foreign subsidiaries to the United States.
In May 2013, the India Finance Act 2013 introduced a share buyback tax. Additional legislation was passed effective in May 2015 that increased the share buyback tax rate to 23.07% and increased the dividend distribution tax rate to 20.36%, among other changes. The Company uses the lower undistributed tax rate to measure deferred taxes on inside basis differences, including undistributed earnings, of our India operations as these earnings are permanently reinvested. While the Company has no plans to do so, events may occur in the future that could result in management changing its intent not to repatriate our India earnings. If the Company changes its intent and repatriates such earnings, a dividend distribution tax or share buyback tax will be incurred. These additional taxes will be recorded as tax expense in the period in which the Company changes its intent.
The Company accounts for income tax uncertainties in accordance with ASC 740-10, which prescribes a recognition threshold and measurement criteria for the financial statement recognition and measurement of a tax position taken or expected to be taken in a tax return. Benefits from tax positions should be recognized in the financial statements only when it is more likely than not that the tax position will be sustained upon examination by the appropriate taxing authority that would have full knowledge of all relevant information. A tax position that meets the more-likely-than-not recognition threshold is measured at the largest amount of benefit that is greater than fifty percent likely of being realized upon ultimate settlement. Tax positions that previously failed to meet the more-likely-than-not recognition threshold should be recognized in the first subsequent financial reporting period in which that threshold is met. Previously recognized tax positions that no longer meet the more-likely-than-not recognition threshold should be derecognized in the first subsequent financial reporting period in which that threshold is no longer met. ASC 740 also provides guidance on the accounting for and disclosure of liabilities for uncertain tax positions, interest and penalties.
As of April 3, 2015, in accordance with ASC 740, "Income Taxes," the Company’s liability for uncertain tax positions was $241 million, including interest of $38 million, penalties of $9 million, and net of tax attributes of $115 million. As of March 28, 2014, the Company’s liability for uncertain tax positions was $250 million, including interest of $27 million, penalties of $19 million, and net of tax attributes of $95 million.

COMPUTER SCIENCES CORPORATION - NOTES TO CONSOLIDATED FINANCIAL STATEMENTS
88
The following table summarizes the activity related to the Company’s uncertain tax positions (excluding interest and penalties and related tax attributes):
Twelve Months Ended(Amounts in millions) April 3, 2015 March 28, 2014 March 29, 2013Balance at Beginning of Fiscal Year $ 299 $ 294 $ 340Gross increases related to prior year tax positions 45 31 7Gross decreases related to prior year tax positions (11) (27) (40)Gross increases related to current year tax positions 12 10 8Settlements and statute of limitation expirations (25) (1) (18)Foreign exchange and others (11) (8) (3)Balance at End of Fiscal Year $ 309 $ 299 $ 294
The Company’s liability for uncertain tax positions at April 3, 2015, March 28, 2014, and March 29, 2013, includes $153 million, $161 million, and $148 million, respectively, related to amounts that, if recognized, would affect the effective tax rate (excluding related interest and penalties).
The Company recognizes interest accrued related to uncertain tax positions and penalties as a component of income tax expense. During the year ended April 3, 2015, the Company had a net increase in interest of $11 million ($12 million net of tax) and a reduction in accrued penalties of $10 million, and as of April 3, 2015, has recognized a liability for interest of $38 million ($32 million net of tax) and penalties of $9 million. During the year ended March 28, 2014, the Company had a net reduction in interest of $11 million ($7 million net of tax) and accrued penalties of $2 million, and as of March 28, 2014, recognized a liability for interest of $27 million ($21 million net of tax) and penalties of $19 million. During the year ended March 29, 2013, the Company accrued interest expense of $7 million ($5 million net of tax) and accrued penalties of $2 million, and as of March 29, 2013, recognized a liability for interest of $38 million ($28 million net of tax) and penalties of $17 million.
Tax Examination Status:
The Company is currently under examination in several tax jurisdictions. A summary of the tax years that remain subject to examination in certain of the Company’s major tax jurisdictions are:
Jurisdiction:
Tax Years that Remain Subject to Examination
(Fiscal Year Ending):
United States – Federal 2008 and forward
United States – Various States 2005 and forward
Australia 2011 and forward
Canada 2008 and forward
Denmark 2010 and forward
France 2012 and forward
Germany 2006 and forward
India 2009 and forward
United Kingdom 2010 and forward
It is reasonably possible that during the next twelve months the Company's liability for uncertain tax positions may change by a significant amount. The Internal Revenue Service (IRS) is examining the Company's federal income tax returns for fiscal years 2008 through 2013. The IRS examined several issues for the fiscal years 2008 through 2010 that resulted in audit adjustments to the Company’s federal income tax return. The Company does not agree with many of the proposed adjustments and has filed an Appeals brief. Therefore, the Company now expects to reach a resolution for fiscal years 2008 through 2010 no earlier than fiscal year 2017. The significant items subject to examination primarily relate to foreign
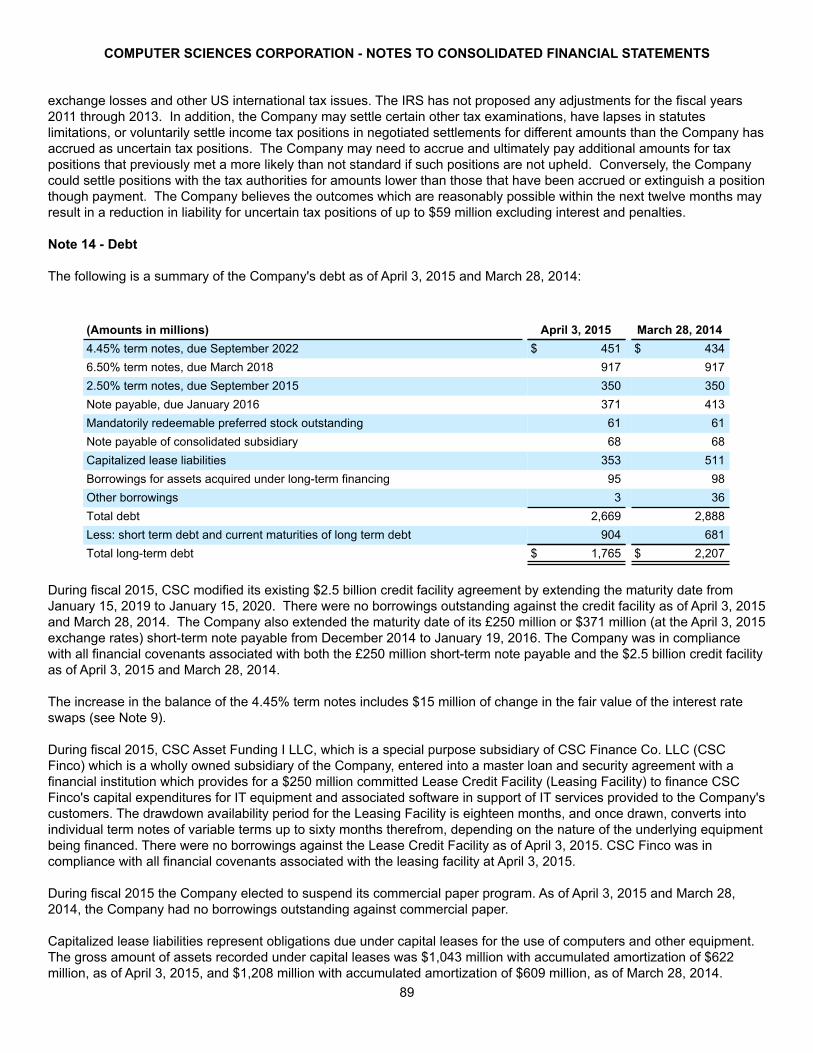
COMPUTER SCIENCES CORPORATION - NOTES TO CONSOLIDATED FINANCIAL STATEMENTS
89
exchange losses and other US international tax issues. The IRS has not proposed any adjustments for the fiscal years 2011 through 2013. In addition, the Company may settle certain other tax examinations, have lapses in statutes limitations, or voluntarily settle income tax positions in negotiated settlements for different amounts than the Company has accrued as uncertain tax positions. The Company may need to accrue and ultimately pay additional amounts for tax positions that previously met a more likely than not standard if such positions are not upheld. Conversely, the Company could settle positions with the tax authorities for amounts lower than those that have been accrued or extinguish a position though payment. The Company believes the outcomes which are reasonably possible within the next twelve months may result in a reduction in liability for uncertain tax positions of up to $59 million excluding interest and penalties.
Note 14 - Debt
The following is a summary of the Company's debt as of April 3, 2015 and March 28, 2014:
(Amounts in millions) April 3, 2015 March 28, 20144.45% term notes, due September 2022 $ 451 $ 4346.50% term notes, due March 2018 917 9172.50% term notes, due September 2015 350 350Note payable, due January 2016 371 413Mandatorily redeemable preferred stock outstanding 61 61Note payable of consolidated subsidiary 68 68Capitalized lease liabilities 353 511Borrowings for assets acquired under long-term financing 95 98Other borrowings 3 36Total debt 2,669 2,888Less: short term debt and current maturities of long term debt 904 681Total long-term debt $ 1,765 $ 2,207
During fiscal 2015, CSC modified its existing $2.5 billion credit facility agreement by extending the maturity date from January 15, 2019 to January 15, 2020. There were no borrowings outstanding against the credit facility as of April 3, 2015 and March 28, 2014. The Company also extended the maturity date of its £250 million or $371 million (at the April 3, 2015 exchange rates) short-term note payable from December 2014 to January 19, 2016. The Company was in compliance with all financial covenants associated with both the £250 million short-term note payable and the $2.5 billion credit facility as of April 3, 2015 and March 28, 2014.
The increase in the balance of the 4.45% term notes includes $15 million of change in the fair value of the interest rate swaps (see Note 9).
During fiscal 2015, CSC Asset Funding I LLC, which is a special purpose subsidiary of CSC Finance Co. LLC (CSC Finco) which is a wholly owned subsidiary of the Company, entered into a master loan and security agreement with a financial institution which provides for a $250 million committed Lease Credit Facility (Leasing Facility) to finance CSC Finco's capital expenditures for IT equipment and associated software in support of IT services provided to the Company's customers. The drawdown availability period for the Leasing Facility is eighteen months, and once drawn, converts into individual term notes of variable terms up to sixty months therefrom, depending on the nature of the underlying equipment being financed. There were no borrowings against the Lease Credit Facility as of April 3, 2015. CSC Finco was in compliance with all financial covenants associated with the leasing facility at April 3, 2015.
During fiscal 2015 the Company elected to suspend its commercial paper program. As of April 3, 2015 and March 28, 2014, the Company had no borrowings outstanding against commercial paper.
Capitalized lease liabilities represent obligations due under capital leases for the use of computers and other equipment. The gross amount of assets recorded under capital leases was $1,043 million with accumulated amortization of $622 million, as of April 3, 2015, and $1,208 million with accumulated amortization of $609 million, as of March 28, 2014.

COMPUTER SCIENCES CORPORATION - NOTES TO CONSOLIDATED FINANCIAL STATEMENTS
90
Certain asset purchases under outsourcing contracts were financed by borrowings from customers. These borrowings carry a rate of interest from 0.0% to 5.0% and will mature over the next four years. Gross amounts of assets purchased under long-term financings included $58 million and $88 million in property and equipment, $97 million and $76 million in software, $44 million and $93 million in outsourcing contract costs and $0 million and $10 million in other intangible assets as of April 3, 2015 and March 28, 2014, respectively.
Foreign subsidiaries of the Company had $0 million and $31 million of borrowings outstanding as of April 3, 2015 and March 28, 2014, respectively, under uncommitted lines of credit with certain foreign banks. CSC has provided parent guarantees for these short-term lines of credit which carry no commitment fees or significant covenants. In addition, the Company had $3 million and $5 million of other borrowings outstanding as of April 3, 2015 and March 28, 2014, respectively, consisting of other interest bearing debt and notes payable.
Expected maturities of long-term debt, including borrowings for asset financing but excluding future minimum capital lease payments, for years subsequent to April 3, 2015, are as follows:
Fiscal YearAmount
(in millions)2016 $ 7662017 452018 9932019 —2020 —Thereafter 512Total $ 2,316
The future minimum lease payments required to be made under the capital leases as of April 3, 2015, are as follows:
Fiscal YearAmount
(in millions)2016 $ 1742017 1102018 592019 412020 35Thereafter 103Total minimum lease payments 522Less: Amount representing interest and executory costs (169)Present value of net minimum lease payments 353Less: Current maturities of capital lease obligations (138)Long-term capitalized lease liabilities $ 215
Note 15 - Pension and Other Benefit Plans
The Company sponsors a number of defined benefit plans and defined contribution plans for the benefit of eligible employees. The defined benefit plans comprise primarily pension plans and post-retirement medical benefit plans. The defined contribution plans include the Company's deferred compensation plan for executives and non-employee directors.

COMPUTER SCIENCES CORPORATION - NOTES TO CONSOLIDATED FINANCIAL STATEMENTS
91
Defined Benefit Pension Plans
U.S. Plans
Contributory, defined benefit pension plans have been generally available to U.S. employees. However, the largest U.S. defined benefit pension plan was frozen for most participants in fiscal 2010. In addition, the Company has two supplemental executive retirement plans (SERP), which are non-qualified, non-contributory pension plans. The Company's funding policy is to make contributions to the Plans in amounts, as determined by an independent actuary, that meets the minimum requirements of the Internal Revenue Code (IRC) and ERISA, and that may exceed such minimum requirements if determined to be beneficial to the Company for cost recoverability, tax, or other regulatory reasons.
During the third quarter of fiscal 2015, the Company offered lump sum settlements to the vested participants of certain of its U.S. defined benefit pension plans, who were no longer with the Company. The lump-sum settlement required interim remeasurement of the plans' assets and liabilities, as of the end of the third quarter of fiscal 2015, which resulted in a net loss of $430 million, comprising actuarial losses of $374 million and a settlement loss of $56 million. The actuarial and settlement losses were primarily a result of the adoption of the new mortality tables issued by the Society of Actuaries in October 2014. The economic benefit realized due to the lump sum payments was $98 million which was included in the net loss of $430 million. The lump sum settlement resulted in reduction of the aggregate pension benefit obligation (PBO) of these U.S. defined benefit plans by $583 million, whereas the interim remeasurement resulted in an increase in PBO of $474 million. A weighted average discount rate of 4.13% was used to remeasure the plans; a decrease from 4.58% used in the prior fiscal year. The average funded status of the impacted U.S. pension plans, after remeasurement, was 87%. The weighted-average expected long-term rate of return on plan assets, after remeasurement, is 7.60% which was consistent with the rate used at the beginning of the fiscal year 2015.
On April 30, 2014, one of the U.S. pension plans was curtailed, which resulted in a settlement loss of $2 million, caused by amortization of the prior service cost. The plan was remeasured using a discount rate of 4.14%, a decrease from 4.23% at the prior fiscal year end, which resulted in an increase to the fair value of actuarial PBO of $1 million, increasing the plan’s unfunded obligations.
On July 19, 2013, CSC completed the sale of ATD (see Note 5), which had a pension and a retiree medical plan. The divestiture of these plans resulted in the recognition of a settlement gain of $36 million that was recorded as part of the gain on sale of ATD, and a reduction to long-term liabilities of $28 million. The net periodic pension cost related to the divested plans, excluding the settlement gain, for the years ended March 28, 2014 and March 29, 2013 was $1 million and $6 million respectively.
On December 31, 2012, the Company made a discretionary cash contribution of $400 million to its largest U.S. pension plan resulting in a remeasurement of the plan. The effects of this remeasurement were recorded during the fourth quarter of fiscal 2013 and resulted in a reduction of net periodic pension cost of $10 million for fiscal 2013, along with additional plan liabilities of $379 million due to using a new discount rate of 4.0%, a decrease from the previous rate of 4.85%. On March 26, 2013, the Company made an additional discretionary cash contribution of $80 million to various U.S. pension plans.
Non-US Plans
Eligible non-U.S. employees are enrolled in defined benefit pension plans in their country of domicile. The Contributory defined benefit pension plan in the U.K. represents the largest plan outside of the U.S. Effective July 1, 2010, the accrual of future benefits was discontinued for certain U.K. pension plans. In addition, healthcare, dental and life insurance benefits are also provided to certain non-U.S. employees. A significant number of employees outside the U.S. are covered by government sponsored programs at no direct cost to the Company other than related payroll taxes.
On December 31, 2014, a defined benefit pension plan in Switzerland was subject to interim remeasurement due to the significant amount of settlement payments from the plan. The interim remeasurement of the plan assets and liabilities resulted in an aggregate charge of $29 million, comprising actuarial losses of $26 million and a settlement loss of $3 million. A discount rate of 1.20% was used to remeasure the plans; a decrease from 2.10% in the prior fiscal year. As a result of the remeasurement, the plan's PBO decreased by $38 million and the funded status was 78%. The weighted-
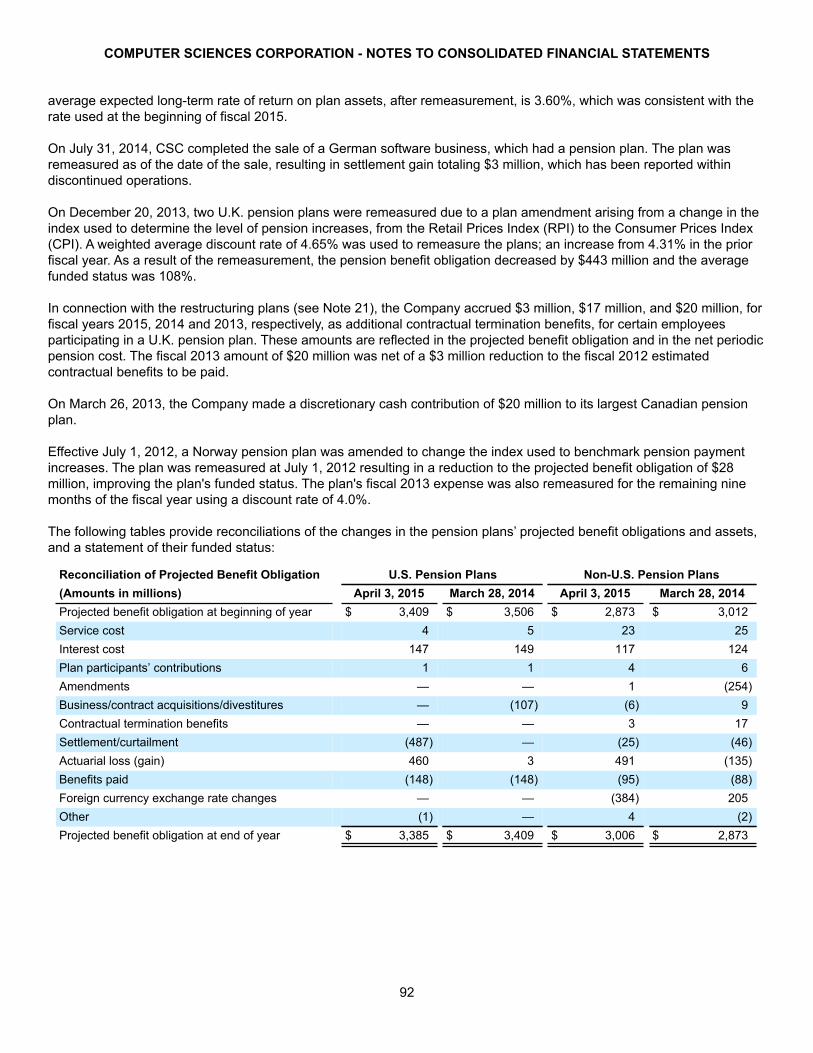
COMPUTER SCIENCES CORPORATION - NOTES TO CONSOLIDATED FINANCIAL STATEMENTS
92
average expected long-term rate of return on plan assets, after remeasurement, is 3.60%, which was consistent with the rate used at the beginning of fiscal 2015.
On July 31, 2014, CSC completed the sale of a German software business, which had a pension plan. The plan was remeasured as of the date of the sale, resulting in settlement gain totaling $3 million, which has been reported within discontinued operations.
On December 20, 2013, two U.K. pension plans were remeasured due to a plan amendment arising from a change in the index used to determine the level of pension increases, from the Retail Prices Index (RPI) to the Consumer Prices Index (CPI). A weighted average discount rate of 4.65% was used to remeasure the plans; an increase from 4.31% in the prior fiscal year. As a result of the remeasurement, the pension benefit obligation decreased by $443 million and the average funded status was 108%.
In connection with the restructuring plans (see Note 21), the Company accrued $3 million, $17 million, and $20 million, for fiscal years 2015, 2014 and 2013, respectively, as additional contractual termination benefits, for certain employees participating in a U.K. pension plan. These amounts are reflected in the projected benefit obligation and in the net periodic pension cost. The fiscal 2013 amount of $20 million was net of a $3 million reduction to the fiscal 2012 estimated contractual benefits to be paid.
On March 26, 2013, the Company made a discretionary cash contribution of $20 million to its largest Canadian pension plan.
Effective July 1, 2012, a Norway pension plan was amended to change the index used to benchmark pension payment increases. The plan was remeasured at July 1, 2012 resulting in a reduction to the projected benefit obligation of $28 million, improving the plan's funded status. The plan's fiscal 2013 expense was also remeasured for the remaining nine months of the fiscal year using a discount rate of 4.0%.
The following tables provide reconciliations of the changes in the pension plans’ projected benefit obligations and assets, and a statement of their funded status:
Reconciliation of Projected Benefit Obligation U.S. Pension Plans Non-U.S. Pension Plans(Amounts in millions) April 3, 2015 March 28, 2014 April 3, 2015 March 28, 2014Projected benefit obligation at beginning of year $ 3,409 $ 3,506 $ 2,873 $ 3,012Service cost 4 5 23 25Interest cost 147 149 117 124Plan participants’ contributions 1 1 4 6Amendments — — 1 (254)Business/contract acquisitions/divestitures — (107) (6) 9Contractual termination benefits — — 3 17Settlement/curtailment (487) — (25) (46)Actuarial loss (gain) 460 3 491 (135)Benefits paid (148) (148) (95) (88)Foreign currency exchange rate changes — — (384) 205Other (1) — 4 (2)Projected benefit obligation at end of year $ 3,385 $ 3,409 $ 3,006 $ 2,873

COMPUTER SCIENCES CORPORATION - NOTES TO CONSOLIDATED FINANCIAL STATEMENTS
93
Reconciliation of Fair Value of Plan Assets U.S. Pension Plans Non-U.S. Pension Plans(Amounts in millions) April 3, 2015 March 28, 2014 April 3, 2015 March 28, 2014Fair value of plan assets at beginning of year $ 3,263 $ 3,125 $ 2,824 $ 2,550Actual return on plan assets 187 364 367 129Employer contribution 8 7 45 81Plan participants’ contributions 1 1 4 6Benefits paid (148) (148) (95) (88)Business/contract acquisitions/divestitures — (86) — 9Contractual termination benefits — — 23 —
Plan settlement (488) — (25) (46)Foreign currency exchange rate changes — — (340) 183Other — — (1) —
Fair value of plan assets at end of year $ 2,823 $ 3,263 $ 2,802 $ 2,824
Funded status at end of year $ (562) $ (146) $ (204) $ (49)
The following table provides the amounts recorded in the Company’s Consolidated Balance Sheet:
U.S. Pension Plans Non-U.S. Pension Plans(Amounts in millions) April 3, 2015 March 28, 2014 April 3, 2015 March 28, 2014Non-current assets $ — $ — $ 83 $ 166Current liabilities - Accrued expenses and othercurrent liabilities (8) (8) (4) (7)Non-current liabilities - Other long-term liabilities (554) (138) (283) (208)Net amount recorded $ (562) $ (146) $ (204) $ (49)
The following is a summary of amounts in accumulated other comprehensive loss, before tax effects, as of April 3, 2015 and March 28, 2014 that have not been recognized in the Consolidated Statements of Operations as components of net periodic pension cost:
U.S. Pension Plans Non-U.S. Pension Plans(Amounts in millions) April 3, 2015 March 28, 2014 April 3, 2015 March 28, 2014Net transition obligation $ — $ — $ 2 $ 3Prior service cost — 2 (273) (279)Accumulated other comprehensive loss $ — $ 2 $ (271) $ (276)
The following table summarizes the weighted average assumptions used in the determination of the Company’s pension plans’ benefit obligations as of April 3, 2015 and March 28, 2014:
U.S. Pension Plans Non-U.S. Pension PlansApril 3, 2015 March 28, 2014 April 3, 2015 March 28, 2014
Discount rate 3.9% 4.6% 3.0% 4.3%Rates of increase in compensation levels 4.4% 4.3% 2.8% 3.4%

COMPUTER SCIENCES CORPORATION - NOTES TO CONSOLIDATED FINANCIAL STATEMENTS
94
The following table lists selected information for the pension plans as of April 3, 2015 and March 28, 2014:
U.S. Pension Plans Non-U.S. Pension Plans(Amounts in millions) April 3, 2015 March 28, 2014 April 3, 2015 March 28, 2014Projected benefit obligation $ 3,385 $ 3,409 $ 3,006 $ 2,873Accumulated benefit obligation 3,372 3,394 2,948 2,833Fair value of plan assets 2,823 3,263 2,802 2,824
Pension Plans with Projected Benefit Obligation in Excess of Plan Assets
(U.S. and Non-U.S.)
Pension Plans with Accumulated BenefitObligation in Excess of Plan Assets
(U.S. and Non-U.S.)(Amounts in millions) April 3, 2015 March 28, 2014 April 3, 2015 March 28, 2014Projected benefit obligation $ 4,035 $ 3,945 $ 4,007 $ 3,917Accumulated benefit obligation 3,976 3,906 3,958 3,888Fair value of plan assets 3,186 3,585 3,166 3,564
The net periodic pension cost for U.S. and non-U.S. pension plans included the following components:
U.S. Pension Plans Non-U.S. Pension Plans
(Amounts in millions)April 3,
2015March 28,
2014March 29,
2013April 3,
2015March 28,
2014March 29,
2013Service cost $ 4 $ 5 $ 10 $ 23 $ 25 $ 25Interest cost 147 149 153 117 124 123Expected return on assets (233) (216) (170) (181) (166) (122)Amortization of transition obligation — — — 1 1 1Amortization of prior service costs — 2 2 (10) (5) (1)Contractual termination benefit — — — 3 17 20Settlement loss(gain) 59 (28) — 1 — (8)Recognition of actuarial loss/(gain) 450 (138) 115 274 (101) 199Net periodic pension expense/(income) $ 427 $ (226) $ 110 $ 228 $ (105) $ 237
Other before tax changes in plan assets and benefit obligations recognized in other comprehensive income during fiscal years 2015, 2014 and 2013 included the following components:
U.S. Pension Plans Non-U.S. Pension Plans
(Amounts in millions)April 3,
2015March 28,
2014March 29,
2013April 3,
2015March 28,
2014March 29,
2013Prior service (credit)/cost $ — $ — $ — $ 2 $ (265) $ (27)Amortization of: Transition (asset)/obligation — — — (1) (1) (1) Prior service (credit)/cost (2) (2) (2) 10 5 1Foreign currency exchange rate changes — — — — (2) —Total recognized in other comprehensive income $ (2) $ (2) $ (2) $ 11 $ (263) $ (27)
Other comprehensive (income) loss related to unamortized pension costs for the years ended April 3, 2015, March 28, 2014, and March 29, 2013 was $7 million (net of tax impact of $2 million), $(265) million (net of taxes of $0 million), and $(14) million (net of tax impact of $15 million), respectively.

COMPUTER SCIENCES CORPORATION - NOTES TO CONSOLIDATED FINANCIAL STATEMENTS
95
The estimated net transitional obligation and prior service credit for defined benefit plans that will be amortized from accumulated other comprehensive income into net periodic pension cost over the next fiscal year are $1 million, and $(9) million respectively.
The weighted-averages of the assumptions used to determine net periodic pension cost were:
U.S. Pension Plans Non-U.S. Pension PlansApril 3,
2015March 28,
2014March 29,
2013April 3,
2015March 28,
2014March 29,
2013Discount or settlement rates 4.5% 4.4% 4.6% 4.2% 4.1% 4.7%Expected long-term rates of return on assets 7.6% 7.2% 6.8% 6.5% 6.2% 5.4%Rates of increase in compensation levels 4.3% 4.3% 4.1% 3.4% 3.5% 4.1%
Information about the expected cash flows for pension plans as of April 3, 2015, is as follows:
(Amounts in millions) U.S. Plans Non-U.S. PlansEmployer contributions:2016 $ 8 $ 46
Benefit Payments:2016 $ 161 $ 1042017 164 1112018 173 1192019 180 1282020 186 1362021-2025 990 835
Defined Benefit Other Postretirement Benefit Plans
The Company provides subsidized healthcare and life insurance retirement benefits for certain U.S. employees and retirees, generally for those employed prior to August 1992. In response to the passage of the Patient Protection and Affordable Care Act of 2010 (PPACA), a number of changes were made to the underlying healthcare coverage offered to certain U.S. retirees. In conjunction with those changes, the Company established limits on the level of employer subsidy it will provide to some retirees. Several plans were amended and the impact of these changes was first reflected on April 1, 2011. In 2012, several retiree medical plans were further amended to allow Medicare Part D subsidies from 2012 and beyond to be collected by the healthcare provider and was reflected on March 30, 2012. The Company further amended its retiree healthcare plans effective February 1, 2015. Under the amended plans, Medicare eligible and Medicare ineligible retirees receive healthcare benefits through different means.
On October 6, 2014, the Company amended its U.S. retiree medical health plans to provide coverage to eligible Medicare retirees through a private insurance marketplace. The insurance marketplace will allow retirees to choose the health insurance terms, cost and coverage that best fit their needs, while CSC will continue to provide financial support to the Medicare eligible participants in the form of a tax free contribution to a health reimbursement account. These amendments resulted in interim remeasurement of the retiree medical plans, which resulted in an actuarial loss of $1 million. A weighted average discount rate of 4.01% was used to remeasure the plans; a decrease from 4.32% in the prior fiscal year. As a result of the remeasurement, the benefit obligations decreased and the prior service credit increased by $99 million each. Subsequent to the remeasurement, the average funded status was 74%. The weighted-average expected long-term rate of return on plan assets is 7.50% as of October 6, 2014, after remeasurement, which is consistent with the rate at the beginning of the year, March 29, 2014.
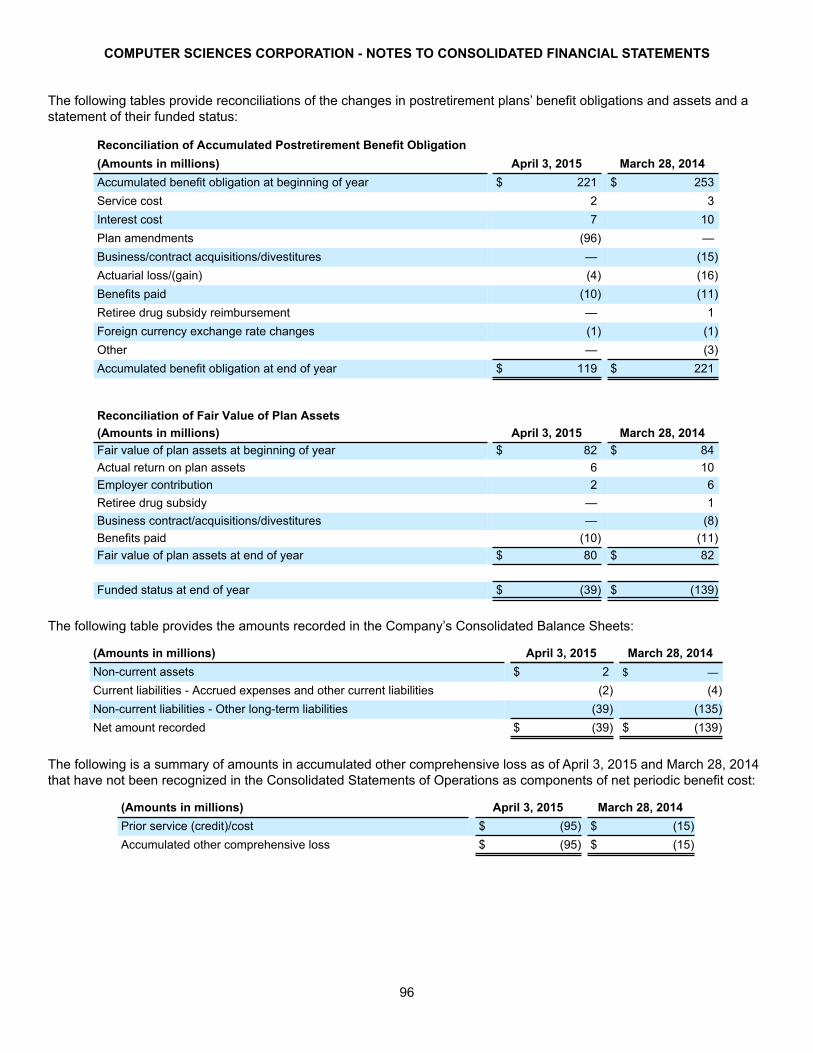
COMPUTER SCIENCES CORPORATION - NOTES TO CONSOLIDATED FINANCIAL STATEMENTS
96
The following tables provide reconciliations of the changes in postretirement plans’ benefit obligations and assets and a statement of their funded status:
Reconciliation of Accumulated Postretirement Benefit Obligation(Amounts in millions) April 3, 2015 March 28, 2014Accumulated benefit obligation at beginning of year $ 221 $ 253Service cost 2 3Interest cost 7 10Plan amendments (96) —Business/contract acquisitions/divestitures — (15)Actuarial loss/(gain) (4) (16)Benefits paid (10) (11)Retiree drug subsidy reimbursement — 1Foreign currency exchange rate changes (1) (1)Other — (3)Accumulated benefit obligation at end of year $ 119 $ 221
Reconciliation of Fair Value of Plan Assets(Amounts in millions) April 3, 2015 March 28, 2014Fair value of plan assets at beginning of year $ 82 $ 84Actual return on plan assets 6 10Employer contribution 2 6Retiree drug subsidy — 1Business contract/acquisitions/divestitures — (8)Benefits paid (10) (11)Fair value of plan assets at end of year $ 80 $ 82
Funded status at end of year $ (39) $ (139)
The following table provides the amounts recorded in the Company’s Consolidated Balance Sheets:
(Amounts in millions) April 3, 2015 March 28, 2014Non-current assets $ 2 $ —
Current liabilities - Accrued expenses and other current liabilities (2) (4)Non-current liabilities - Other long-term liabilities (39) (135)Net amount recorded $ (39) $ (139)
The following is a summary of amounts in accumulated other comprehensive loss as of April 3, 2015 and March 28, 2014 that have not been recognized in the Consolidated Statements of Operations as components of net periodic benefit cost:
(Amounts in millions) April 3, 2015 March 28, 2014Prior service (credit)/cost $ (95) $ (15)Accumulated other comprehensive loss $ (95) $ (15)

COMPUTER SCIENCES CORPORATION - NOTES TO CONSOLIDATED FINANCIAL STATEMENTS
97
The following table lists selected information for other postretirement benefit plans as of April 3, 2015 and March 28, 2014:
Plans withAccumulated Postretirement
Benefit Obligation in Excess of the Fair Value of Plan Assets
(Amounts in millions) April 3, 2015 March 28, 2014 April 3, 2015 March 28, 2014Accumulated postretirement benefit obligation $ 119 $ 221 $ 41 $ 221Fair value of plan assets 80 82 — 82
As of April 3, 2015 and March 28, 2014, the Company had no postretirement healthcare plan assets outside the U.S. Benefits paid include amounts paid directly from plan assets and amounts paid by the Company.
The following table summarizes the weighted average assumptions used in the determination of the Company’s postretirement benefit obligations as of April 3, 2015 and March 28, 2014:
April 3, 2015 March 28, 2014Discount rate 3.7% 4.3%
The assumed healthcare cost trend rate used in measuring the accumulated postretirement benefit obligation was 8.8% for fiscal 2015, declining to 5.0% for 2024 and subsequent years for all retirees. Assumed healthcare cost trend rates have a significant effect on the amounts reported for the healthcare plans. A one-percentage point change in the assumed healthcare cost trend rates would have had the following effect:
One Percentage Point(Amounts in millions) Increase DecreaseEffect on accumulated postretirement benefit obligation as of April 3, 2015 $ 2 $ (2)
The net periodic benefit cost for other postretirement benefit plans included the following components:
(Amounts in millions) April 3, 2015 March 28, 2014 March 29, 2013Service cost $ 2 $ 3 $ 4Interest cost 7 10 11Expected return on assets (6) (5 ) (5 )Amortization of transition obligation — — —Amortization of prior service costs (15) (2 ) (2 )Settlements loss(gain) — (8 ) —Recognized actuarial loss/(gain) (5) (20) (8)Net periodic pension expense/(income) $ (17 ) $ (22 ) $ —
Other before tax changes in plan assets and benefit obligations recognized in other comprehensive income during fiscal years 2015, 2014 and 2013 included the following components:
(Amounts in millions) April 3, 2015 March 28, 2014 March 29, 2013Prior service (credit)/cost (96) — —Amortization of: Transition (asset)/obligation — — — Prior service (credit)/cost 15 2 2Total recognized in other comprehensive income $ (81) $ 2 $ 2
Other comprehensive (income) loss related to unamortized postretirement benefit plan costs for the years ended April 3, 2015, March 28, 2014, and March 29, 2013 was $(49) million (net of tax impact of $32 million), $1 million (net of tax impact of $1 million), and $2 million (net of taxes of $0 million), respectively.
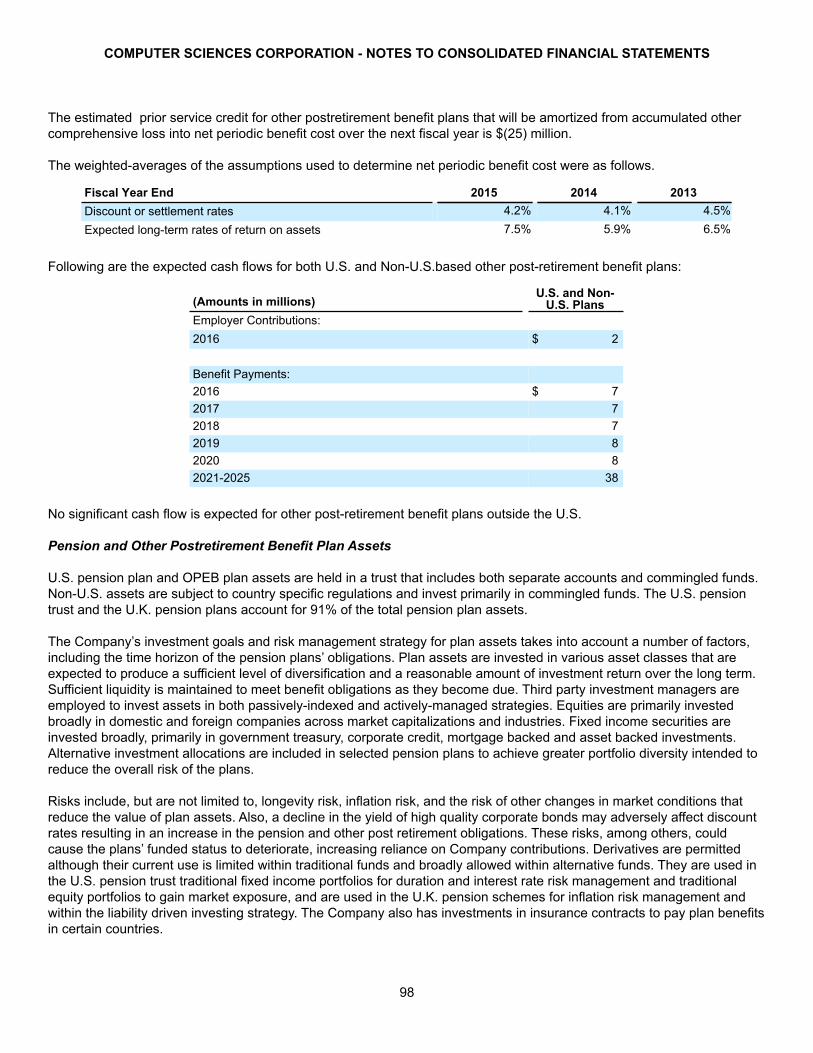
COMPUTER SCIENCES CORPORATION - NOTES TO CONSOLIDATED FINANCIAL STATEMENTS
98
The estimated prior service credit for other postretirement benefit plans that will be amortized from accumulated other comprehensive loss into net periodic benefit cost over the next fiscal year is $(25) million.
The weighted-averages of the assumptions used to determine net periodic benefit cost were as follows.
Fiscal Year End 2015 2014 2013Discount or settlement rates 4.2% 4.1% 4.5%Expected long-term rates of return on assets 7.5% 5.9% 6.5%
Following are the expected cash flows for both U.S. and Non-U.S.based other post-retirement benefit plans:
(Amounts in millions)U.S. and Non-
U.S. PlansEmployer Contributions:2016 $ 2
Benefit Payments:2016 $ 72017 72018 72019 82020 82021-2025 38
No significant cash flow is expected for other post-retirement benefit plans outside the U.S.
Pension and Other Postretirement Benefit Plan Assets
U.S. pension plan and OPEB plan assets are held in a trust that includes both separate accounts and commingled funds. Non-U.S. assets are subject to country specific regulations and invest primarily in commingled funds. The U.S. pension trust and the U.K. pension plans account for 91% of the total pension plan assets.
The Company’s investment goals and risk management strategy for plan assets takes into account a number of factors, including the time horizon of the pension plans’ obligations. Plan assets are invested in various asset classes that are expected to produce a sufficient level of diversification and a reasonable amount of investment return over the long term. Sufficient liquidity is maintained to meet benefit obligations as they become due. Third party investment managers are employed to invest assets in both passively-indexed and actively-managed strategies. Equities are primarily invested broadly in domestic and foreign companies across market capitalizations and industries. Fixed income securities are invested broadly, primarily in government treasury, corporate credit, mortgage backed and asset backed investments. Alternative investment allocations are included in selected pension plans to achieve greater portfolio diversity intended to reduce the overall risk of the plans.
Risks include, but are not limited to, longevity risk, inflation risk, and the risk of other changes in market conditions that reduce the value of plan assets. Also, a decline in the yield of high quality corporate bonds may adversely affect discount rates resulting in an increase in the pension and other post retirement obligations. These risks, among others, could cause the plans’ funded status to deteriorate, increasing reliance on Company contributions. Derivatives are permitted although their current use is limited within traditional funds and broadly allowed within alternative funds. They are used in the U.S. pension trust traditional fixed income portfolios for duration and interest rate risk management and traditional equity portfolios to gain market exposure, and are used in the U.K. pension schemes for inflation risk management and within the liability driven investing strategy. The Company also has investments in insurance contracts to pay plan benefits in certain countries.

COMPUTER SCIENCES CORPORATION - NOTES TO CONSOLIDATED FINANCIAL STATEMENTS
99
For the U.S. pension trust, an allocation range by asset class is developed. The allocation has a significant weighting to equity investments in part due to the relatively long duration of the plans’ obligations. As of March 2015, the plan fiduciaries adopted investment allocation targets for the U.S. pension trust of 30% equities, 30% fixed income securities, and 40% alternative investments. Alternatives include risk parity, global tactical, hedge fund and hedge fund of fund allocations. An allocation range is established for each asset class and cash equivalents may represent 0%-10% of the fund. Asset allocations are monitored closely and investment reviews are conducted regularly. The Company consults with internal and external advisors regarding asset strategy.
For the U.K. pension plans, the Company's second largest pension plans by assets and projected liabilities, a target allocation by asset class is developed to achieve their long term objectives. As of March 2015, the plans held investment allocation targets of 35% equities, 33% fixed income (including 23% corporate bonds and 10% in liability-driven investment products), and 32% alternatives. Alternatives include risk parity, hedge fund, multi-asset credit, and property fund allocations. Asset allocations are monitored closely by the plan trustees and investment reviews are conducted regularly. The plan trustees consult with internal and external advisors regarding asset strategy.
CSC early adopted the provisions of ASU No. 2015-04 (see Note 1) and used March 31, 2015 as the date closest to its fiscal year end, to value plan assets of all its defined benefit plans. There was no material impact of adoption of this ASU on the fair value of plan assets.
Plan Asset Valuation Techniques
Cash equivalents are primarily short term money market commingled funds that are categorized as Level 2, except for funds that have quoted prices in active markets, which are classified as Level 1. They are valued at cost plus accrued interest which approximates fair value.
Fixed income accounts are categorized as Level 2. Investments in corporate bonds are primarily investment grade bonds. These investments are generally priced using model-based pricing methods that use observable market data as inputs. Broker dealer bids or quotes of securities with similar characteristics may also be used.
Domestic and global equity separate accounts are categorized as Level 1 if the securities trade on national or international exchanges and are valued at their last reported closing price. Equity assets in commingled funds reporting a net asset value (NAV) are categorized as Level 2.
Insurance contracts purchased to cover benefits payable to retirees are valued using the assumptions used to value the projected benefit obligation. Most of the plans' insurance contracts are categorized as level 2 while one plan has a level 3 insurance contract.
Derivatives are categorized as Level 1 if the securities trade actively on a recognized exchange, as Level 2 if the securities can be valued using observable inputs, or as Level 3 if the securities are valued using significant unobservable inputs.
Alternative investment fund securities are categorized as Level 1 if held in a mutual fund or in a separate account structure and actively traded through a recognized exchange, or as Level 2 if they are held in commingled or collective account structures and are actively traded. Alternative investment fund securities are classified as Level 3 if they are held in Limited Company or Limited Partnership structures or cannot otherwise be classified as Level 1 or Level 2.
The fair value of pension plan assets and postretirement benefit plans by investment category and the corresponding level within the fair value hierarchy as of April 3, 2015 are as follows:
(Amounts in millions) U.S. PlansNon-U.S.
PlansFair value of pension plan assets $ 2,823 $ 2,802Fair value of other postretirement benefit plan assets 80 —Total fair value of retirement plan assets as of April 3, 2015 $ 2,903 $ 2,802

COMPUTER SCIENCES CORPORATION - NOTES TO CONSOLIDATED FINANCIAL STATEMENTS
100
U.S. Pension and Other Postretirement BenefitPlans(Amounts in millions) Level 1 Level 2 Level 3 TotalEquity:
U.S. Domestic Stocks $ 149 $ — $ — $ 149Global/International 23 — — 23Domestic Equity commingled funds 4 451 — 455Global Equity commingled funds — 154 — 154
Fixed Income:Fixed income mutual funds 102 — — 102Fixed income commingled funds 3 495 — 498Mortgage and asset backed securities — 52 — 52Corporate — 41 — 41U.S. Treasuries — 23 — 23Non U.S. Government — 2 — 2U.S. Government Agencies — 1 — 1
Alternatives:Other Alternatives (a) 305 528 — 833Hedge Funds (b) — — 548 548
Cash and Cash equivalents 1 29 — 30Total $ 587 $ 1,776 $ 548 $ 2,911Unsettled Trade Receivable and Accrued Income 21Unsettled Trade Payable and Accrued Expenses (29)Fair value of assets for U.S. pension and postretirement medical plans as of April 3, 2015 $ 2,903
(a) Represents institutional funds consisting mainly of equities, bonds, or commodities.(b) Represents investments in diversified fund of hedge funds in which the CSC pension plans are the sole investor.
Below is a reconciliation of the assets valued using significant unobservable inputs (Level 3):
(Amounts in millions) Level 3Beginning balance as of March 28, 2014 $ 328Actual return on plan assets held at the reporting date 20Purchases, sales, and settlements 200Ending balance as of April 3, 2015 $ 548

COMPUTER SCIENCES CORPORATION - NOTES TO CONSOLIDATED FINANCIAL STATEMENTS
101
Non-U.S. Pension Plan Assets(Amounts in millions) Level 1 Level 2 Level 3 TotalEquity:
Global/International Equity commingled funds — 817 — 817Global equity mutual funds — 122 — 122U.S./North American Equity commingled funds $ — $ 64 $ — $ 64
Fixed Income:Fixed income commingled funds — 944 — 944
Alternatives: Other Alternatives (a) 3 392 116 511
Hedge Funds (b) — — 169 169Insurance contracts — 137 4 141Cash and cash equivalents 30 4 — 34Total $ 33 $ 2,480 $ 289 $ 2,802Unsettled Trades —Fair value of non-U.S. pension assets as of April 3, 2015 $ 2,802
(a) Represents real estate, and other commingled funds consisting mainly of equities, bonds, or commodities.(b) Represents investments in diversified fund of hedge funds.
Below is a reconciliation of the assets valued using significant unobservable inputs (Level 3):
Non-U.S. PlansInsuranceContracts(Amounts in millions)
Beginning balance as of March 28, 2014 $ 209Actual return on plan assets held at the reporting date 18Purchases, sales, and settlements (13)Transfers in and / or out of Level 3 105Changes due to exchange rates (30)Ending balance as of April 3, 2015 $ 289
The fair value of our pension plan assets and postretirement benefit plans by investment category and the corresponding level within the fair value hierarchy as of March 28, 2014, are as follows:
(Amounts in millions) U.S. PlansNon-U.S.
PlansFair value of pension plan assets $ 3,263 $ 2,824Fair value of other postretirement benefit plan assets 82 —Total fair value of retirement plan assets as of March 28, 2014 $ 3,345 $ 2,824
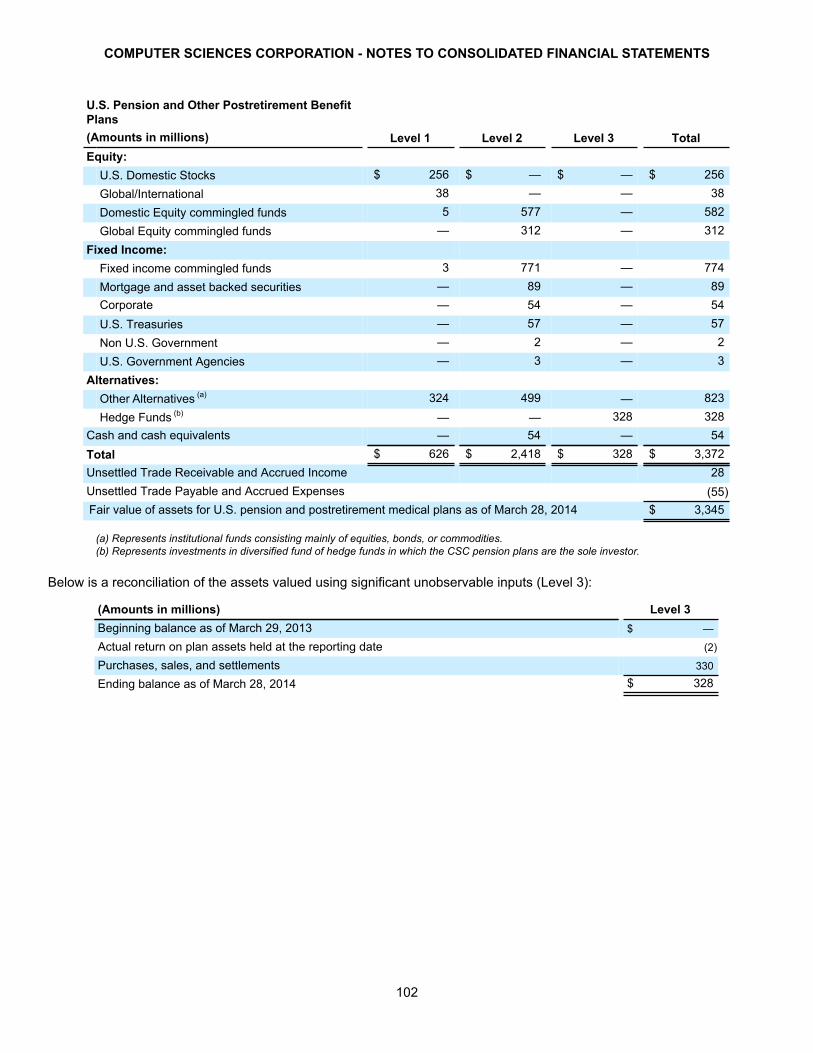
COMPUTER SCIENCES CORPORATION - NOTES TO CONSOLIDATED FINANCIAL STATEMENTS
102
U.S. Pension and Other Postretirement BenefitPlans(Amounts in millions) Level 1 Level 2 Level 3 TotalEquity:
U.S. Domestic Stocks $ 256 $ — $ — $ 256Global/International 38 — — 38Domestic Equity commingled funds 5 577 — 582Global Equity commingled funds — 312 — 312
Fixed Income:Fixed income commingled funds 3 771 — 774Mortgage and asset backed securities — 89 — 89Corporate — 54 — 54U.S. Treasuries — 57 — 57Non U.S. Government — 2 — 2U.S. Government Agencies — 3 — 3
Alternatives:Other Alternatives (a) 324 499 — 823Hedge Funds (b) — — 328 328
Cash and cash equivalents — 54 — 54Total $ 626 $ 2,418 $ 328 $ 3,372Unsettled Trade Receivable and Accrued Income 28Unsettled Trade Payable and Accrued Expenses (55)Fair value of assets for U.S. pension and postretirement medical plans as of March 28, 2014 $ 3,345
(a) Represents institutional funds consisting mainly of equities, bonds, or commodities.(b) Represents investments in diversified fund of hedge funds in which the CSC pension plans are the sole investor.
Below is a reconciliation of the assets valued using significant unobservable inputs (Level 3):
(Amounts in millions) Level 3Beginning balance as of March 29, 2013 $ —
Actual return on plan assets held at the reporting date (2)
Purchases, sales, and settlements 330
Ending balance as of March 28, 2014 $ 328

COMPUTER SCIENCES CORPORATION - NOTES TO CONSOLIDATED FINANCIAL STATEMENTS
103
NON-U.S. PENSION PLAN ASSETS(Amounts in millions) Level 1 Level 2 Level 3 TotalEquity:
Global/International Equity commingled funds $ — $ 899 $ — $ 899Global equity mutual funds — 81 — 81U.S./North American Equity commingled funds — 47 — 47
Fixed Income:Fixed income commingled funds — 951 — 951
Alternatives: Other Alternatives (a) — 460 26 486 Hedge Funds (b) — — 177 177Insurance contracts — 161 6 167Cash equivalents — 16 — 16Total $ — $ 2,615 $ 209 $ 2,824Unsettled Trades —Fair value of non-U.S. pension assets as of March 28, 2014 $ 2,824
(a) Represents real estate, and other commingled funds consisting mainly of equities, bonds, or commodities.(b) Represents investments in diversified fund of hedge funds.
Below is a reconciliation of the assets valued using significant unobservable inputs (Level 3):
Non-U.S. PlansInsuranceContracts(Amounts in millions)
Beginning balance as of March 29, 2013 $ 6Purchases, sales, and settlements 164Transfers in and / or out of Level 3 32Changes due to exchange rates 7Ending balance as of March 28, 2014 $ 209
The asset allocation of pension plans at April 3, 2015 and March 28, 2014, respectively, is as follows:
U.S. Plans Non-U.S. PlansAsset Category April 3, 2015 March 28, 2014 April 3, 2015 March 28, 2014Equity securities 27% 35% 36% 36%Debt securities 25% 29% 34% 34%Alternatives 47% 34% 24% 24%Cash and other 1% 2% 6% 6%Total 100% 100% 100% 100%
The asset allocation for U.S. other postretirement benefit plans at April 3, 2015 and March 28, 2014, respectively, is as follows:
Percentage of PlanAssets at Year End
Asset Category April 3, 2015 March 28, 2014Equity securities 55% 59%Debt securities 39% 38%Cash and other 6% 3%Total 100% 100%
COMPUTER SCIENCES CORPORATION - NOTES TO CONSOLIDATED FINANCIAL STATEMENTS
104
Return on Assets
The Company consults with internal and external advisors regarding the expected long-term rate of return on assets. In the U.S. and U.K., the Company uses a "building block" approach to compute the expected long-term rate of return of the major asset classes expected in each of the plans. CSC utilizes long-term, typically 30 years, asset class return assumptions provided by external advisors. Consideration is also given to the extent active management is employed in each asset class and also to management expenses. A single expected long-term rate of return is calculated for each plan by assessing the plan's expected asset allocation strategy, the benefits of diversification therefrom, historical excess returns from actively managed traditional investments, expected long-term returns for alternative investments and expected investment expenses. The resulting composite rate of return is reviewed by internal and external parties for reasonableness.
Retirement Plan Discount Rate
The U.S. discount rate assumption is prepared with a two-step process; the first step is a yield curve developed as of the measurement date using high-quality corporate bond yields. In step two, each plan's future cash flows are applied to the appropriate years on the yield curve and the weighted value of the cash flows is used to determine a single equivalent discount rate. In fiscal 2015, the discount rates were developed separately for each U.S. pension and other postretirement plan to the nearest basis point using a single yield curve, the Aon Hewitt AA Only Above Median Curve. This yield curve is a hypothetical AA or greater yield curve represented by a series of annualized individual spot discount rates going out 100 years. This curve provides a more transparent view to the underlying bonds and is available daily which provides for a discount rate to be calculated specific to the Company's fiscal year end. For years prior to fiscal 2014, the U.S. discount rates were determined using an average of the Citigroup yield curve and the AON Hewitt yield curve rounded to the nearest 10bps.
In fiscal 2015 , the U.K. pension plans began using the AON Hewitt Single Agency Yield Curve to set the discount rate. This bond universe includes all non-gilt bonds which are rated AA by at least one of the main ratings agencies. Cash flow data is applied to yields of different durations to determine a single equivalent discount rate. For fiscal 2014, the U.K. discount rate assumption was set by reference to the AA Corporate Bond Mercer Pension Discount Yield Curve. For years prior to fiscal 2014, the U.K. discount rate assumption was set by reference to the yield on the iBoxx GBP AA rated +15 years corporate bond index with an appropriate adjustment for duration if necessary after considering yield curve models and conditions in credit markets.
Defined Contribution Plans
The Company sponsors defined contribution plans for substantially all U.S. employees and certain foreign employees. The plans allow employees to contribute a portion of their earnings in accordance with specified guidelines. Effective January 1, 2014, matching contributions are made once annually in January following the end of the calendar year. In order to receive such contributions, a participant must be employed on December 31 of the plan year. However, if a participant retires (or should decease) from CSC prior to December 31, the participant will be eligible to receive matching contributions approximately 30 days following separation from service. The plan was also amended so participants vest after one year of service from a five-year graded vest. During fiscal 2015, fiscal 2014, and fiscal 2013, the Company contributed $177 million, $179 million, and $213 million, respectively. At April 3, 2015, plan assets included 8,231,499 shares of the Company’s common stock.
Deferred Compensation Plan
Effective August 14, 1995, the Company adopted the Computer Sciences Corporation Deferred Compensation Plan (the Plan). The Plan consists of two separate plans, one for the benefit of key executives and one for the benefit of non-employee directors. Pursuant to the Plan, certain management and highly compensated employees are eligible to defer all or a portion of their regular salary that exceeds the limitation set forth in Internal Revenue Section 401(a)(17) and all or a portion of their incentive compensation, and non-employee directors are eligible to defer up to 100% of their compensation. The liability, which is included in “Other long-term liabilities” under the Plan, amounted to $117 million as
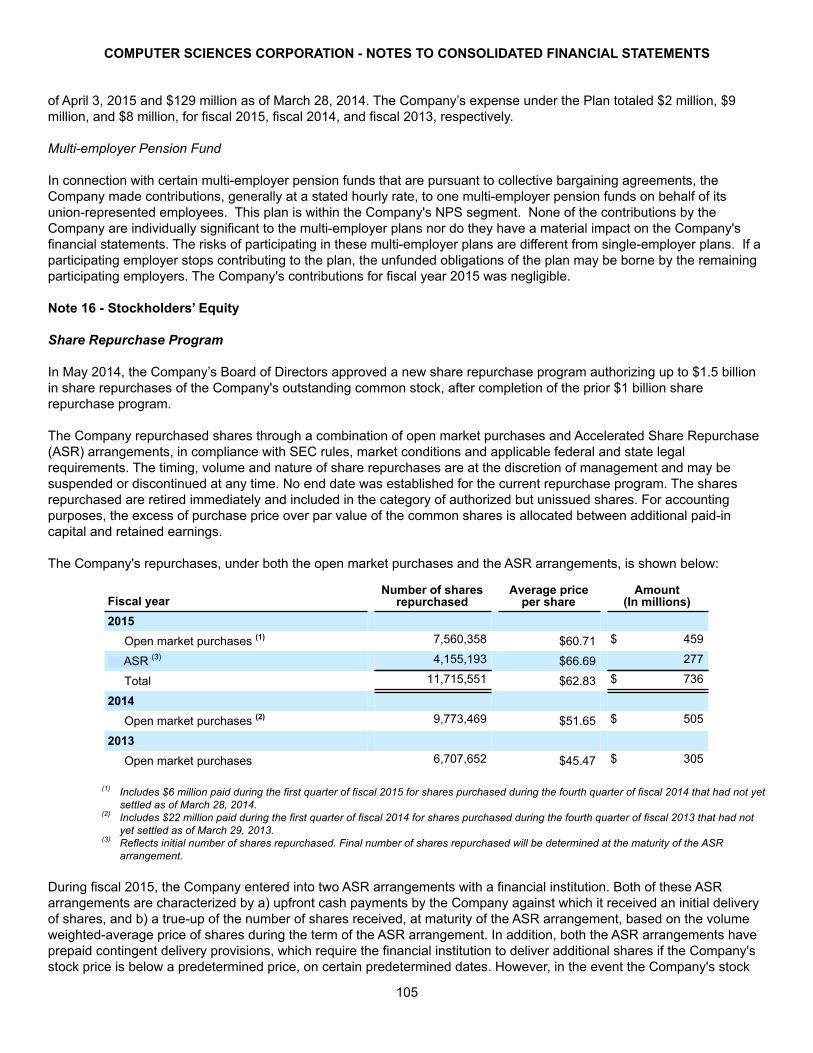
COMPUTER SCIENCES CORPORATION - NOTES TO CONSOLIDATED FINANCIAL STATEMENTS
105
of April 3, 2015 and $129 million as of March 28, 2014. The Company’s expense under the Plan totaled $2 million, $9 million, and $8 million, for fiscal 2015, fiscal 2014, and fiscal 2013, respectively.
Multi-employer Pension Fund
In connection with certain multi-employer pension funds that are pursuant to collective bargaining agreements, the Company made contributions, generally at a stated hourly rate, to one multi-employer pension funds on behalf of its union-represented employees. This plan is within the Company's NPS segment. None of the contributions by the Company are individually significant to the multi-employer plans nor do they have a material impact on the Company's financial statements. The risks of participating in these multi-employer plans are different from single-employer plans. If a participating employer stops contributing to the plan, the unfunded obligations of the plan may be borne by the remaining participating employers. The Company's contributions for fiscal year 2015 was negligible.
Note 16 - Stockholders’ Equity
Share Repurchase Program
In May 2014, the Company’s Board of Directors approved a new share repurchase program authorizing up to $1.5 billion in share repurchases of the Company's outstanding common stock, after completion of the prior $1 billion share repurchase program.
The Company repurchased shares through a combination of open market purchases and Accelerated Share Repurchase (ASR) arrangements, in compliance with SEC rules, market conditions and applicable federal and state legal requirements. The timing, volume and nature of share repurchases are at the discretion of management and may be suspended or discontinued at any time. No end date was established for the current repurchase program. The shares repurchased are retired immediately and included in the category of authorized but unissued shares. For accounting purposes, the excess of purchase price over par value of the common shares is allocated between additional paid-in capital and retained earnings.
The Company's repurchases, under both the open market purchases and the ASR arrangements, is shown below:
Fiscal yearNumber of shares
repurchasedAverage price
per shareAmount
(In millions)2015 Open market purchases (1) 7,560,358 $60.71 $ 459
ASR (3) 4,155,193 $66.69 277
Total 11,715,551 $62.83 $ 736
2014 Open market purchases (2) 9,773,469 $51.65 $ 505
2013 Open market purchases 6,707,652 $45.47 $ 305
(1) Includes $6 million paid during the first quarter of fiscal 2015 for shares purchased during the fourth quarter of fiscal 2014 that had not yet settled as of March 28, 2014.
(2) Includes $22 million paid during the first quarter of fiscal 2014 for shares purchased during the fourth quarter of fiscal 2013 that had not yet settled as of March 29, 2013.
(3) Reflects initial number of shares repurchased. Final number of shares repurchased will be determined at the maturity of the ASR arrangement.
During fiscal 2015, the Company entered into two ASR arrangements with a financial institution. Both of these ASR arrangements are characterized by a) upfront cash payments by the Company against which it received an initial delivery of shares, and b) a true-up of the number of shares received, at maturity of the ASR arrangement, based on the volume weighted-average price of shares during the term of the ASR arrangement. In addition, both the ASR arrangements have prepaid contingent delivery provisions, which require the financial institution to deliver additional shares if the Company's stock price is below a predetermined price, on certain predetermined dates. However, in the event the Company's stock

COMPUTER SCIENCES CORPORATION - NOTES TO CONSOLIDATED FINANCIAL STATEMENTS
106
price exceeds the predetermined price, the prepaid amounts would be returned to the Company as cash or shares at the Company's option. Both the ASR arrangements met all applicable criteria for equity classification and, therefore, were not accounted for as derivative instruments. The amount of prepaid consideration for contingent delivery of shares, associated with the fourth quarter ASR arrangement, was recorded as contra-equity.
The details of the two fiscal 2015 ASR arrangements are as follows:
Program Contract maturity
Total valueof ASR
(in millions)
Number ofshares
repurchased
Considerationfor initialpurchase
(in millions)
Averageprice per
shareSecond quarter ASR arrangement (1) November 6, 2014 $ 125 1,290,481 $ 75 $ 58.12Fourth quarter ASR arrangement (2) November 8, 2015 302 2,864,712 202 $ 70.55Total $ 427 4,155,193 $ 277 $ 66.69
(1) In the third quarter of fiscal 2015, the Company received an additional 31,830 shares and a refund of the $50 million prepayment in cash upon settlement of the second quarter ASR arrangement.
(2) Consideration includes transaction costs. The final number of shares ultimately delivered and therefore the average price paid per share will be determined at maturity of the fourth quarter ASR arrangement. CSC may receive a refund of $100 million prepayment in cash or shares upon settlement of the fourth quarter ASR arrangement.
Treasury Stock Transactions
In fiscal 2015, 2014, and 2013 the Company accepted 121,350, 168,739, and 91,921 shares of its common stock, respectively, in lieu of cash in connection with exercise of stock options. In fiscal 2015, 2014, and 2013, the Company accepted 330,037, 160,753, and 209,056 shares of its common stock, respectively, in lieu of cash in connection with the tax withholdings associated with the release of common stock upon vesting of restricted stock and restricted stock units.
Dividends
During fiscal 2015, the Company declared cash dividends per common share of $0.92 totaling $131 million. Of the total dividends declared, $32 million was declared but unpaid as of April 3, 2015. Such dividends were paid on April 24, 2015.
During fiscal 2014, the Company declared cash dividends per common share of $0.80 totaling $118 million. Of the total dividends declared, $29 million was unpaid as of March 28, 2014.
Similarly, during fiscal 2013, the Company declared cash dividends per common share of $0.80 totaling $123 million. Of the total dividends declared, $30 million was unpaid as of March 29, 2013.

COMPUTER SCIENCES CORPORATION - NOTES TO CONSOLIDATED FINANCIAL STATEMENTS
107
Accumulated Other Comprehensive Loss (Income)
The following tables show the activity in the components of other comprehensive loss, including the respective tax effects, and reclassification adjustments for the years ended April 3, 2015, March 28, 2014, and March 29, 2013, respectively:
For the year ended April 3, 2015(Amounts in millions)
Before TaxAmount
Tax ImpactIncrease/
(Decrease)Net of TaxAmount
Foreign currency translation adjustments $ (307) $ (3) $ (310)Loss on foreign currency forward and option contracts (2) — (2)Pension and other post-retirement benefit plans adjustments:
Prior service credit (1) 94 (37) 57Amortization of transition obligation (2) 1 — 1Amortization of prior service (cost) (2) (23) 7 (16)
Total pension and other post-retirement benefit plans 72 (30) 42Total other comprehensive loss $ (237) $ (33) $ (270)
(1) Represents the result of remeasurement of the U.S. OPEB benefit obligations (see Note 15).(2) Represents current period reclassification out of accumulated other comprehensive loss. The reclassified amounts are included in the net
periodic pension cost and net periodic post-retirement benefit cost (see Note 15).
For the year ended March 28, 2014(Amounts in millions)
Before TaxAmount
Tax ImpactIncrease/
(Decrease)Net of TaxAmount
Foreign currency translation adjustments $ (79) $ (2) $ (81)Pension and other post-retirement benefit plans:
Prior service credit (1) 265 — 265Amortization of transition obligation (2) 1 — 1Amortization of prior service (cost) (2) (5) 1 (4)Foreign currency exchange (loss) gain 2 — 2
Total pension and other post-retirement benefit plans 263 1 264Total other comprehensive income (loss) $ 184 $ (1) $ 183 (1) Represents the result of remeasurement of the pension liability associated primarily with plans in the U.K.(see Note 15).(2) Represents current period reclassification out of accumulated other comprehensive loss. The reclassified amounts are included in the net
periodic pension cost and net periodic post-retirement benefit cost (see Note 15).
For the year ended March 29, 2013(Amounts in millions)
Before TaxAmount
Tax ImpactIncrease/
(Decrease)Net of TaxAmount
Foreign currency translation adjustments $ (104) $ 12 $ (92)Pension and other post-retirement benefit plans:
Prior service (cost) 27 (8) 19Amortization of transition obligation (1) 1 — 1Amortization of prior service (costs) (1) (1) 1 —Foreign currency exchange loss — (8) (8)
Total pension and other post-retirement benefit plans 27 (15) 12Total other comprehensive loss $ (77) $ (3) $ (80)
(1) Represents current period reclassification out of accumulated other comprehensive loss. The reclassified amounts are included in the net periodic pension cost and net periodic post-retirement benefit cost (see Note 15).

COMPUTER SCIENCES CORPORATION - NOTES TO CONSOLIDATED FINANCIAL STATEMENTS
108
The following table shows the changes in accumulated other comprehensive gain (loss) for fiscal 2015, 2014, and 2013:
(Amounts in millions)
ForeignCurrency
TranslationAdjustments
CashFlow
Hedge
Pension andOther
PostretirementBenefit Plans
AccumulatedOther
ComprehensiveIncome (Loss)
Balance at March 30, 2012 $ 167 $ — 21 188Current-period other comprehensive (loss), net of taxes (92) — 11 (81)Amounts reclassified from accumulated other comprehensiveloss, net of taxes — — 1 1Balance at March 29, 2013 $ 75 $ — 33 108Current-period other comprehensive income (loss), net of taxes (81) — 267 186Amounts reclassified from accumulated other comprehensiveloss, net of taxes — — (15) (15)
Balance at March 28, 2014 $ (6) $ — $ 285 $ 279Current-period other comprehensive (loss) income, net of taxes (310) (2) 57 (255)Amounts reclassified from accumulated other comprehensiveloss, net of taxes — — (3) (3)
Balance at April 3, 2015 $ (316) $ (2) $ 339 $ 21
Note 17 - Stock Incentive Plans
Employee Incentives
The Company has two stock incentive plans which authorize the issuance of stock options, restricted stock and other stock-based incentives to employees upon terms approved by the Compensation Committee of the Board of Directors. The Company’s overall stock-based compensation granting practice has not changed significantly year over year. The Company issues authorized but previously unissued shares upon the exercise of stock options, the granting of restricted stock awards and the settlement of restricted stock units (RSU). There were no restricted stock awards outstanding during fiscal years 2015, fiscal 2014, and fiscal 2013. As of April 3, 2015, 15,959,036 shares of CSC common stock were available for the grant of future stock options, restricted stock or other stock-based incentives to employees.
The Company recognized stock-based compensation expense for fiscal 2015, fiscal 2014, and fiscal 2013 as follows:
Twelve Months Ended(Amounts in millions) April 3, 2015 March 28, 2014 March 29, 2013Cost of services $ 19 $ 25 $ 22Selling, general and administrative 49 48 27Total $ 68 $ 73 $ 49Total, net of tax $ 43 $ 46 $ 31
Stock-based compensation for fiscal 2015 decreased $5 million when compared to the prior year. The decrease was primarily due to $25 million of lower expense on account of higher forfeitures for terminating employees. The decrease was partially offset by $12 million of fiscal 2015 option and RSU grants, impacted by the Company's higher stock price, and $8 million higher expense associated with the RSUs granted to the employees of ServiceMesh, which was acquired in the third quarter of fiscal 2014.
The $24 million increase in the stock-based compensation expense during fiscal 2014 was primarily due to adjustments for actual and expected achievement of the specified performance criteria for certain performance-based RSUs that increased the expense by $21 million, and due to an increased number of RSUs granted during fiscal 2014 at a higher CSC stock price, which increased expense by $13 million. Included in the $13 million increase was an increase of $6 million due to RSUs granted to ServiceMesh employees. These increases in expense were partially offset by an adjustment to reflect actual forfeitures of stock options and RSUs during fiscal 2014 that reduced expense by $9 million.
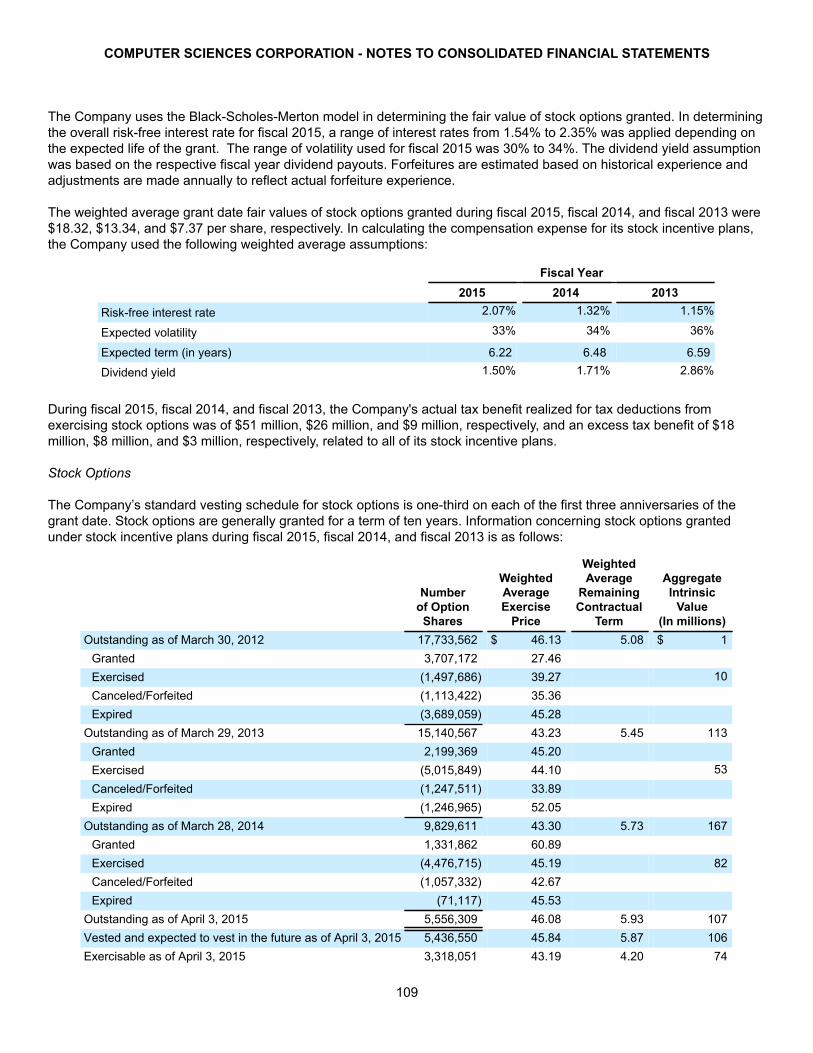
COMPUTER SCIENCES CORPORATION - NOTES TO CONSOLIDATED FINANCIAL STATEMENTS
109
The Company uses the Black-Scholes-Merton model in determining the fair value of stock options granted. In determining the overall risk-free interest rate for fiscal 2015, a range of interest rates from 1.54% to 2.35% was applied depending on the expected life of the grant. The range of volatility used for fiscal 2015 was 30% to 34%. The dividend yield assumption was based on the respective fiscal year dividend payouts. Forfeitures are estimated based on historical experience and adjustments are made annually to reflect actual forfeiture experience.
The weighted average grant date fair values of stock options granted during fiscal 2015, fiscal 2014, and fiscal 2013 were $18.32, $13.34, and $7.37 per share, respectively. In calculating the compensation expense for its stock incentive plans, the Company used the following weighted average assumptions:
Fiscal Year2015 2014 2013
Risk-free interest rate 2.07% 1.32% 1.15%
Expected volatility 33% 34% 36%
Expected term (in years) 6.22 6.48 6.59
Dividend yield 1.50% 1.71% 2.86%
During fiscal 2015, fiscal 2014, and fiscal 2013, the Company's actual tax benefit realized for tax deductions from exercising stock options was of $51 million, $26 million, and $9 million, respectively, and an excess tax benefit of $18 million, $8 million, and $3 million, respectively, related to all of its stock incentive plans.
Stock Options
The Company’s standard vesting schedule for stock options is one-third on each of the first three anniversaries of the grant date. Stock options are generally granted for a term of ten years. Information concerning stock options granted under stock incentive plans during fiscal 2015, fiscal 2014, and fiscal 2013 is as follows:
Numberof Option Shares
WeightedAverageExercise
Price
WeightedAverage
RemainingContractual
Term
AggregateIntrinsic
Value(In millions)
Outstanding as of March 30, 2012 17,733,562 $ 46.13 5.08 $ 1Granted 3,707,172 27.46Exercised (1,497,686) 39.27 10Canceled/Forfeited (1,113,422) 35.36Expired (3,689,059) 45.28
Outstanding as of March 29, 2013 15,140,567 43.23 5.45 113Granted 2,199,369 45.20Exercised (5,015,849) 44.10 53Canceled/Forfeited (1,247,511) 33.89Expired (1,246,965) 52.05
Outstanding as of March 28, 2014 9,829,611 43.30 5.73 167Granted 1,331,862 60.89Exercised (4,476,715) 45.19 82Canceled/Forfeited (1,057,332) 42.67Expired (71,117) 45.53
Outstanding as of April 3, 2015 5,556,309 46.08 5.93 107Vested and expected to vest in the future as of April 3, 2015 5,436,550 45.84 5.87 106Exercisable as of April 3, 2015 3,318,051 43.19 4.20 74

COMPUTER SCIENCES CORPORATION - NOTES TO CONSOLIDATED FINANCIAL STATEMENTS
110
April 3, 2015Options Outstanding Options Exercisable
Range of Option Exercise PriceNumber
Outstanding
WeightedAverageExercise
Price
WeightedAverage
RemainingContractual
TermNumber
Exercisable
WeightedAverageExercise
Price$23.06 - $44.65 2,706,562 $ 36.39 6.64 1,675,961 $ 34.65$44.89 - $60.90 2,756,837 55.03 5.15 1,633,753 51.85$61.93 - $63.06 92,910 62.62 8.58 8,337 62.36
5,556,309 3,318,051
The total grant date fair value of stock options vested during fiscal 2015, fiscal 2014, and fiscal 2013, was $9 million, $14 million, and $20 million, respectively. The cash received from stock options exercised during fiscal 2015, fiscal 2014, and fiscal 2013, was $196 million, $214 million, and $55 million, respectively.
As of April 3, 2015, there was $28 million of unrecognized compensation expense related to unvested stock options, net of expected forfeitures. The cost is expected to be recognized over a weighted-average period of 1.69 years.
Restricted Stock Units
RSUs consist of equity awards with the right to receive one share of common stock of the Company issued at a price of $0. RSUs generally vest over periods of three to five years. Upon the settlement date, RSUs are settled in shares of CSC common stock and dividend equivalents. If, prior to the vesting of the RSU grant in full, the employee’s status as a full-time employee is terminated, then the RSU grant is automatically canceled on the employment termination date and any unvested shares and dividend equivalents are forfeited.
Certain executives were awarded service-based RSUs for which the shares are redeemable over the ten anniversaries following the executive's separation from service as a full-time employee, provided the executive complies with certain non-competition covenants during the ten-year period following the executive's separation of service. For certain executives who joined the company in fiscal year 2013 and after, the awards vest at age 62, or 50% of the award vests at age 55 with 5 years' service with an additional 10% vesting each additional year of service up to 10 years of service. Prior to fiscal year 2013, awards vested at age 65 or age 55 with 10 years of service.
The Company also grants performance-based restricted stock units (PSUs). PSUs, generally vest over period of three years. The number of performance-based RSUs that ultimately vest is dependent upon the Company’s achievement of certain specified financial performance criteria over a three-year period. Awards are settled for shares of CSC common stock and dividend equivalents upon the filing with the SEC of the Annual Report on Form 10-K for the last fiscal year of the performance period if the specified performance criteria is met. Beginning in fiscal 2013, PSU awards granted include the potential for accelerated vesting of 25% of the shares granted after the first and second fiscal years if certain company performance targets are met early. Compensation expense during the performance period is estimated at each reporting date using management's expectation of the probable achievement of the specified performance criteria and is adjusted to the extent the expected achievement changes. In the first quarter of fiscal 2015, shares were settled due to meeting the company performance targets in fiscal year 2014. The probable achievement was also increased to the maximum payout based on management's expectation of meeting the performance criteria resulting in additional expense recognized. In the table below, such awards are reflected at the number of shares originally granted.
Information concerning RSUs (including PSUs) granted under the stock incentive plans during fiscal 2015, fiscal 2014, and fiscal 2013, is as follows:

COMPUTER SCIENCES CORPORATION - NOTES TO CONSOLIDATED FINANCIAL STATEMENTS
111
Number ofShares
WeightedAverage
Fair ValueOutstanding as of March 30, 2012 1,740,925 $ 40.29
Granted 1,724,639 26.12Settled (423,321) 33.17Canceled/Forfeited (778,971) 38.27
Outstanding as of March 29, 2013 2,263,272 31.53Granted 2,018,416 49.05Settled (464,293) 33.06Canceled/Forfeited (629,654) 38.11
Outstanding as of March 28, 2014 3,187,741 41.34Granted 1,000,150 60.91Settled (829,861) 40.81Canceled/Forfeited (778,355) 42.62
Outstanding as of April 3, 2015 2,579,675 48.70
As of April 3, 2015, there was $78 million total unrecognized compensation expense related to unvested RSUs,net of expected forfeitures. The unrecognized compensation expense is expected to be recognized over a weighted-average period of 1.86 years.
Non-employee Director Incentives
The Company has two stock incentive plans which authorize the issuance of stock options, restricted stock and other stock-based incentives to non-employee directors upon terms approved by the Company’s Board of Directors. As of April 3, 2015, 175,300 shares of CSC common stock remained available for the grant to nonemployee directors of future RSUs or other stock-based incentives.
RSU awards to non-employee directors are granted at a price of $0. For RSU awards granted in fiscal 2014, RSUs vest and settle at the earlier of (i) the one-year anniversary of the grant date, or (ii) the date of the Company's first Annual Meeting of the Stockholders held after the grant date. Alternatively, settlement of the RSU may be deferred per election of the non-employee director. For awards granted in fiscal 2013 and prior, vested RSUs are automatically settled for shares of CSC common stock and dividend equivalents when the non-employee director ceases to be a director of the Company.
The number of shares to be settled is equal to the number of RSUs that are vested at the time the holder ceases to be a director. At the holder’s election, the RSUs may be settled (i) in their entirety, upon the day the holder ceases to be a director, or (ii) in substantially equal amounts upon the first five, ten or fifteen anniversaries of such termination of service.

COMPUTER SCIENCES CORPORATION - NOTES TO CONSOLIDATED FINANCIAL STATEMENTS
112
Information concerning RSUs granted to non-employee directors during fiscal 2015, fiscal 2014, and fiscal 2013 is as follows:
Number ofShares
WeightedAverage
Fair ValueOutstanding as of March 30, 2012 196,361 $ 42.81
Granted 42,800 30.30Settled (50,716) 43.30Canceled/Forfeited — —
Outstanding as of March 29, 2013 188,445 39.85Granted 25,000 51.55Settled (29,299) 35.81Canceled/Forfeited — —
Outstanding as of March 28, 2014 184,146 42.07Granted 22,100 59.63Settled (62,260) 44.10Canceled/Forfeited — —
Outstanding as of April 3, 2015 143,986 43.88
Note 18 - Cash Flows
Cash payments for interest on indebtedness and cash payments for taxes on income are as follows:
Twelve Months Ended(Amounts in millions) April 3, 2015 March 28, 2014 March 29, 2013Interest $ 144 $ 140 $ 186Taxes on income, net of refunds 146 122 214
Non-cash investing activities include the following:
Twelve Months Ended(Amounts in millions) April 3, 2015 March 28, 2014 March 29, 2013Capital expenditures in accounts payable and accrued expenses $ 39 $ 45 $ 32Capital expenditures through capital lease obligations 24 149 181Assets acquired under long-term financing 64 49 26
Non-cash financing activities for the years ended April 3, 2015, March 28, 2014 and March 29, 2013 included common stock dividends declared but not yet paid of $32 million, $29 million and $30 million, respectively. Non-cash financing activities also included shares repurchased under the stock repurchase plan but not settled of $6 million and $22 million as of March 28, 2014 and March 29, 2013, respectively. All shares repurchased under the stock repurchase plan in fiscal 2015 were settled as of April 3, 2015.
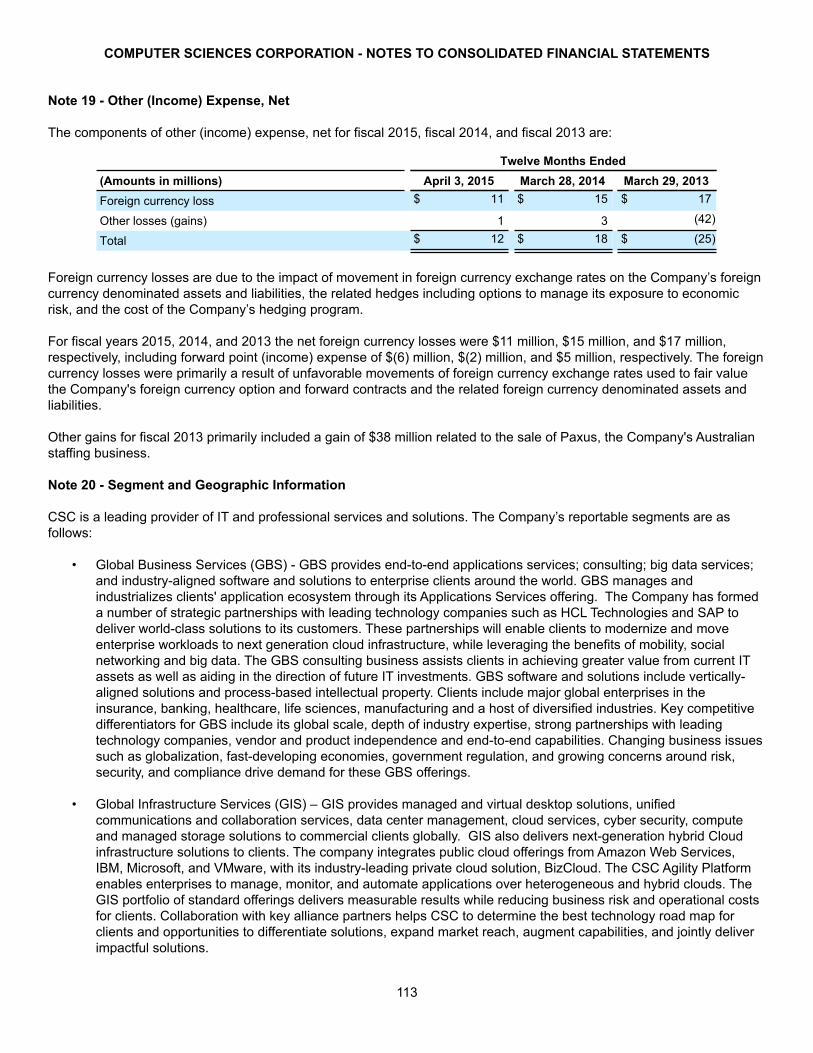
COMPUTER SCIENCES CORPORATION - NOTES TO CONSOLIDATED FINANCIAL STATEMENTS
113
Note 19 - Other (Income) Expense, Net
The components of other (income) expense, net for fiscal 2015, fiscal 2014, and fiscal 2013 are:
Twelve Months Ended(Amounts in millions) April 3, 2015 March 28, 2014 March 29, 2013Foreign currency loss $ 11 $ 15 $ 17
Other losses (gains) 1 3 (42)
Total $ 12 $ 18 $ (25)
Foreign currency losses are due to the impact of movement in foreign currency exchange rates on the Company’s foreign currency denominated assets and liabilities, the related hedges including options to manage its exposure to economic risk, and the cost of the Company’s hedging program.
For fiscal years 2015, 2014, and 2013 the net foreign currency losses were $11 million, $15 million, and $17 million, respectively, including forward point (income) expense of $(6) million, $(2) million, and $5 million, respectively. The foreign currency losses were primarily a result of unfavorable movements of foreign currency exchange rates used to fair value the Company's foreign currency option and forward contracts and the related foreign currency denominated assets and liabilities.
Other gains for fiscal 2013 primarily included a gain of $38 million related to the sale of Paxus, the Company's Australian staffing business.
Note 20 - Segment and Geographic Information
CSC is a leading provider of IT and professional services and solutions. The Company’s reportable segments are as follows:
• Global Business Services (GBS) - GBS provides end-to-end applications services; consulting; big data services; and industry-aligned software and solutions to enterprise clients around the world. GBS manages and industrializes clients' application ecosystem through its Applications Services offering. The Company has formed a number of strategic partnerships with leading technology companies such as HCL Technologies and SAP to deliver world-class solutions to its customers. These partnerships will enable clients to modernize and move enterprise workloads to next generation cloud infrastructure, while leveraging the benefits of mobility, social networking and big data. The GBS consulting business assists clients in achieving greater value from current IT assets as well as aiding in the direction of future IT investments. GBS software and solutions include vertically-aligned solutions and process-based intellectual property. Clients include major global enterprises in the insurance, banking, healthcare, life sciences, manufacturing and a host of diversified industries. Key competitive differentiators for GBS include its global scale, depth of industry expertise, strong partnerships with leading technology companies, vendor and product independence and end-to-end capabilities. Changing business issues such as globalization, fast-developing economies, government regulation, and growing concerns around risk, security, and compliance drive demand for these GBS offerings.
• Global Infrastructure Services (GIS) – GIS provides managed and virtual desktop solutions, unified communications and collaboration services, data center management, cloud services, cyber security, compute and managed storage solutions to commercial clients globally. GIS also delivers next-generation hybrid Cloud infrastructure solutions to clients. The company integrates public cloud offerings from Amazon Web Services, IBM, Microsoft, and VMware, with its industry-leading private cloud solution, BizCloud. The CSC Agility Platform enables enterprises to manage, monitor, and automate applications over heterogeneous and hybrid clouds. The GIS portfolio of standard offerings delivers measurable results while reducing business risk and operational costs for clients. Collaboration with key alliance partners helps CSC to determine the best technology road map for clients and opportunities to differentiate solutions, expand market reach, augment capabilities, and jointly deliver impactful solutions.
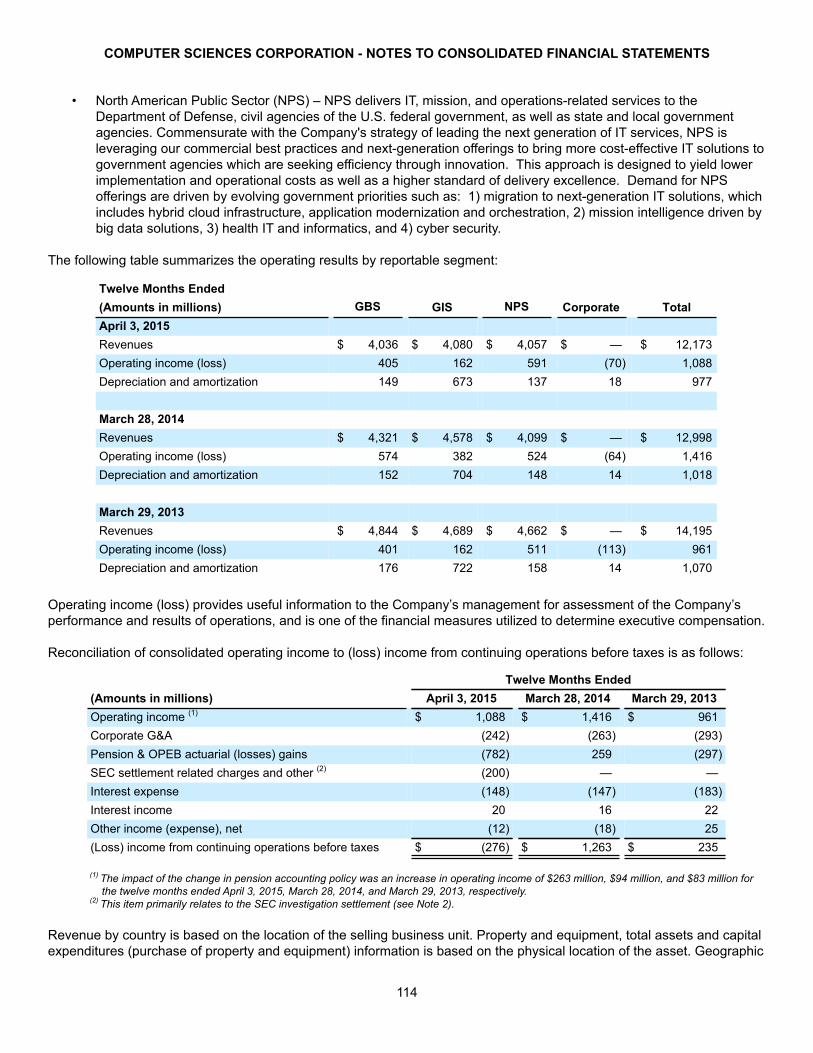
COMPUTER SCIENCES CORPORATION - NOTES TO CONSOLIDATED FINANCIAL STATEMENTS
114
• North American Public Sector (NPS) – NPS delivers IT, mission, and operations-related services to the Department of Defense, civil agencies of the U.S. federal government, as well as state and local government agencies. Commensurate with the Company's strategy of leading the next generation of IT services, NPS is leveraging our commercial best practices and next-generation offerings to bring more cost-effective IT solutions to government agencies which are seeking efficiency through innovation. This approach is designed to yield lower implementation and operational costs as well as a higher standard of delivery excellence. Demand for NPS offerings are driven by evolving government priorities such as: 1) migration to next-generation IT solutions, which includes hybrid cloud infrastructure, application modernization and orchestration, 2) mission intelligence driven by big data solutions, 3) health IT and informatics, and 4) cyber security.
The following table summarizes the operating results by reportable segment:
Twelve Months Ended(Amounts in millions) GBS GIS NPS Corporate TotalApril 3, 2015Revenues $ 4,036 $ 4,080 $ 4,057 $ — $ 12,173Operating income (loss) 405 162 591 (70) 1,088Depreciation and amortization 149 673 137 18 977
March 28, 2014Revenues $ 4,321 $ 4,578 $ 4,099 $ — $ 12,998Operating income (loss) 574 382 524 (64) 1,416Depreciation and amortization 152 704 148 14 1,018
March 29, 2013Revenues $ 4,844 $ 4,689 $ 4,662 $ — $ 14,195Operating income (loss) 401 162 511 (113) 961Depreciation and amortization 176 722 158 14 1,070
Operating income (loss) provides useful information to the Company’s management for assessment of the Company’s performance and results of operations, and is one of the financial measures utilized to determine executive compensation. Reconciliation of consolidated operating income to (loss) income from continuing operations before taxes is as follows:
Twelve Months Ended(Amounts in millions) April 3, 2015 March 28, 2014 March 29, 2013Operating income (1) $ 1,088 $ 1,416 $ 961Corporate G&A (242) (263) (293)Pension & OPEB actuarial (losses) gains (782) 259 (297)SEC settlement related charges and other (2) (200) — —Interest expense (148) (147) (183)Interest income 20 16 22Other income (expense), net (12) (18) 25(Loss) income from continuing operations before taxes $ (276) $ 1,263 $ 235
(1) The impact of the change in pension accounting policy was an increase in operating income of $263 million, $94 million, and $83 million for the twelve months ended April 3, 2015, March 28, 2014, and March 29, 2013, respectively.
(2) This item primarily relates to the SEC investigation settlement (see Note 2).
Revenue by country is based on the location of the selling business unit. Property and equipment, total assets and capital expenditures (purchase of property and equipment) information is based on the physical location of the asset. Geographic

COMPUTER SCIENCES CORPORATION - NOTES TO CONSOLIDATED FINANCIAL STATEMENTS
115
revenue, property and equipment, net, total assets, and capital expenditures for the three years ended April 3, 2015, March 28, 2014, and March 29, 2013, are as follows:
April 3, 2015
(Amounts in millions)UnitedStates
UnitedKingdom
OtherEurope
OtherInternational Total
Revenue $ 7,322 $ 1,721 $ 1,928 $ 1,202 $ 12,173Property and Equipment, net 978 257 176 172 1,583Total Assets 5,956 1,620 1,189 1,436 10,201Capital Expenditures 225 58 73 50 406
March 28, 2014UnitedStates
UnitedKingdom
OtherEurope
OtherInternational Total
Revenue $ 7,766 $ 1,699 $ 2,150 $ 1,383 $ 12,998
Property and Equipment, net 1,177 335 253 266 2,031
Total Assets 6,728 1,614 1,473 1,574 11,389
Capital Expenditures 333 89 85 88 595
March 29, 2013UnitedStates
UnitedKingdom
OtherEurope
OtherInternational Total
Revenue $ 8,571 $ 1,729 $ 2,193 $ 1,702 $ 14,195
Property and Equipment, net 1,273 320 217 374 2,184
Total Assets 6,454 1,389 1,487 1,921 11,251
Capital Expenditures 290 70 80 128 568
The Company derives a significant portion of its revenues from departments and agencies of the U.S. federal government, which accounted for 31%, 30%, and 31% of the Company’s revenues for fiscal 2015, fiscal 2014, and fiscal 2013, respectively. As of April 3, 2015 and March 28, 2014, approximately 30% and 25% of the Company’s net accounts receivables was due from the U.S. federal government. No single commercial customer exceeded 10% of the Company’s revenues during fiscal 2015, fiscal 2014, or fiscal 2013.
Note 21 - Restructuring Costs
The Company recorded restructuring costs of $261 million, $76 million, and $264 million for fiscal years 2015, 2014, and 2013, respectively.
Fiscal 2015 Plan
In June 2014, the Company initiated restructuring actions (the Fiscal 2015 Plan) across its business segments. The objectives of the Fiscal 2015 Plan are to further reduce headcount in order to align resources to support business needs. Total restructuring costs for the Fiscal 2015 Plan recorded during fiscal 2015 were $273 million, and consisted mainly of termination benefits associated with the workforce reductions, including $10 million of pension benefit augmentation. As part of this plan, the Company took a restructuring charge of $246 million in the fourth quarter of fiscal 2015 to accelerate the efforts to optimize the workforce in high cost markets, particularly in Europe, address its labor pyramid and right-shore its labor mix.

COMPUTER SCIENCES CORPORATION - NOTES TO CONSOLIDATED FINANCIAL STATEMENTS
116
The composition of the restructuring liability for the Fiscal 2015 Plan as of April 3, 2015 is as follows:
(Amounts in millions)
Restructuringliability as of
March 28, 2014
Costsexpensed infiscal 2015
Less: costs not affecting restructuring
liability (1) Cash Paid Other(2)
Restructuringliability as ofApril 3, 2015
Workforce reductions $ — $ 265 $ (10) $ (21) $ (4) $ 230
Facilities costs — 8 (3) — — $ 5$ — $ 273 $ (13) $ (21) $ (4) $ 235
(1) Charges primarily consist of pension benefit augmentations and are recorded as a pension liability.(2) Foreign currency translation adjustments.
Fiscal 2013 Plan
In September 2012, the Company initiated restructuring actions (the Fiscal 2013 Plan) across its business segments. The objectives of the Fiscal 2013 Plan were to (i) further increase the use of lower cost off-shore resources, (ii) reduce headcount in order to align resources to support business needs, including the assessment of management span of control and layers and (iii) optimize utilization of facilities. Actions under the Fiscal 2013 Plan commenced in September 2012 and continued through fiscal 2014. The expense reduction in fiscal 2015 was due to cancellation of a portion of a restructuring plan in a region, as well as revisions on plans that were executed at lower than expected costs.
Total restructuring costs for the Fiscal 2013 Plan recorded during fiscal 2015, 2014, and 2013 were $(12) million, $74 million, and $233 million, respectively, including pension benefit augmentations of $(7) million, $22 million, and $21 million, respectively, that are owed to certain employees in accordance with legal or contractual obligations, and which will be paid out over several years as part of normal pension distributions. The total restructuring costs recorded during fiscal 2013 also included $17 million of professional fees incurred for restructuring related consultancy.
The composition of the restructuring liability for the Fiscal 2013 Plan as of April 3, 2015 is as follows:
(Amounts in millions)
Restructuringliability as of
March 28, 2014
Costsexpensed infiscal 2015
Less: costs not affecting restructuring
liability (1) Cash paid Other(2)
Restructuringliability as ofApril 3, 2015
Workforce reductions $ 70 $ (13) $ 7 $ (57) $ (4) $ 3
Facilities costs 13 1 — (8) — 6$ 83 $ (12) $ 7 $ (65) $ (4) $ 9
(1) Charges primarily consist of pension benefit augmentations and are recorded as a pension liability.(2) Foreign currency translation adjustments.
The composition of the restructuring liability for the Fiscal 2013 Plan as of March 28, 2014 was as follows:
(Amounts in millions)
Restructuringliability as of
March 29, 2013
Costsexpensed infiscal 2014
Less: costs not affecting restructuring
liability (1) Cash paid Other(3)
Restructuringliability as of
March 28, 2014Workforce reductions $ 155 $ 63 $ (22) $ (130) $ 4 $ 70
Facilities costs 10 11 — (8) — 13
Other(2) 11 — — (11) — —$ 176 $ 74 $ (22) $ (149) $ 4 $ 83
(1) Charges primarily consist of pension benefit augmentations and are recorded as a pension liability.(2) Other direct costs associated with the restructuring program.(3) Foreign currency translation adjustments.

COMPUTER SCIENCES CORPORATION - NOTES TO CONSOLIDATED FINANCIAL STATEMENTS
117
Fiscal 2012 Plan
In March 2012, the Company initiated restructuring actions (the Fiscal 2012 plan) primarily impacting its GIS segment. The objectives of the Fiscal 2012 plan were to (i) align the Company's workforce across various geographies with business needs, (ii) increase use of lower cost off-shore resources, and (iii) optimize utilization of facilities. Actions under the Fiscal 2012 plan commenced in March 2012 and were carried out in fiscal 2013 and fiscal 2014.
The restructuring costs for the Fiscal 2012 plan recorded during fiscal 2015, 2014, and 2013 were $0 million, $2 million, and $31 million, respectively, and were associated primarily with employee terminations.
The composition of the restructuring liability for the Fiscal 2012 plan as of April 3, 2015 is as follows:
(Amounts in millions)
Restructuringliability as of
March 28, 2014
Costsexpensed infiscal 2015
Less: costsnot affectingrestructuring
liability Cash paid Other (1)
Restructuringliability as ofApril 3, 2015
Facilities costs 2 — — (2) 1 1
(1) Foreign currency translation adjustments.
The composition of the restructuring liability for the Fiscal 2012 plan as of March 28, 2014 was as follows:
(Amounts in millions)
Restructuringliability as of
March 29, 2013
Costsexpensed infiscal 2014 Cash paid Other (1)
Restructuringliability as of
March 28, 2014Workforce reductions $ 9 $ 2 $ (10) $ (1) $ —
Facilities costs 5 — (3) — 2
Total $ 14 $ 2 $ (13) $ (1) $ 2
(1) Foreign currency translation adjustments and reclassification of $1 million to liabilities held for sale related to the small software business that CSC committed to sell in fiscal 2014 and completed in fiscal 2015 (see Note 5).
The composition of restructuring costs by segment for fiscal years 2015, 2014, and 2013 is as follows:
Twelve Months Ended(Amounts in millions) April 3, 2015 March 28, 2014 March 29, 2013GBS $ 137 $ 46 $ 87GIS 114 28 142
NPS 5 2 13
Corporate 5 — 22
Total $ 261 $ 76 $ 264
Of the total $245 million restructuring liability as of April 3, 2015, $244 million is included in accrued expenses and other current liabilities and $1 million is included in other long-term liabilities. Of the total $85 million restructuring liability as of March 28, 2014, $83 million was included in accrued expenses and other current liabilities and $2 million was included in other long-term liabilities.
The composition of restructuring expenses for fiscal years 2015, 2014, and 2013 by financial statement line item is as follows:

COMPUTER SCIENCES CORPORATION - NOTES TO CONSOLIDATED FINANCIAL STATEMENTS
118
Twelve Months Ended(Amounts in millions) April 3, 2015 March 28, 2014 March 29, 2013Cost of services $ 253 $ 70 $ 238Selling, general and administrative 8 6 26Total $ 261 $ 76 $ 264
Note 22 - Commitments and Contingencies
Commitments
The Company has operating leases for the use of certain real estate and equipment. Substantially all operating leases are non-cancelable or cancelable only by the payment of penalties. All lease payments are based on the lapse of time but include, in some cases, payments for insurance, maintenance and property taxes. There are no purchase options on operating leases at favorable terms, but most real estate leases have one or more renewal options. Certain leases on real estate are subject to annual escalations for increases in utilities and property taxes. Lease rental expense amounted to $209 million, $280 million, and $319 million, for the years ended April 3, 2015, March 28, 2014, and March 29, 2013, respectively. In addition, the Company also has $22 million of sublease income to be received through fiscal 2020.
Minimum fixed rentals required for the next five years and thereafter under operating leases in effect at April 3, 2015, are as follows:
Fiscal Year(Amounts in millions) Real Estate Equipment2016 $ 134 $ 262017 111 132018 71 42019 50 22020 33 —Thereafter 25 —
$ 424 $ 45
The Company has signed long-term purchase agreements with certain software, hardware, telecommunication and other service providers to obtain favorable pricing and terms for services and products that are necessary for the operations of business activities. Under the terms of these agreements, the Company is contractually committed to purchase specified minimums over periods ranging from one to six years. If the Company does not meet the specified minimums, the Company would have an obligation to pay the service provider all or a portion of the shortfall. Minimum purchase commitments are $331 million in fiscal 2016, $308 million in fiscal 2017, $178 million in fiscal 2018, $8 million in fiscal 2019, $8 million in fiscal 2020, and $7 million thereafter.
In the normal course of business, the Company may provide certain clients, principally governmental entities, with financial performance guarantees, which are generally backed by stand-by letters of credit or surety bonds. In general, the Company would only be liable for the amounts of these guarantees in the event that nonperformance by the Company permits termination of the related contract by the Company’s client. As of April 3, 2015, the Company had $81 million of outstanding letters of credit and $28 million of surety bonds relating to these performance guarantees. The Company believes it is in compliance with its performance obligations under all service contracts for which there is a financial performance guarantee, and the ultimate liability, if any, incurred in connection with these guarantees will not have a material adverse effect on its consolidated results of operations or financial position.
The Company also uses stand-by letters of credit, in lieu of cash, to support various risk management insurance policies. These letters of credit represent a contingent liability and the Company would only be liable if it defaults on its payment obligations towards these policies. As of April 3, 2015, the Company had $42 million of outstanding stand-by letters of credit. Generally, such guarantees have a one-year term and are renewed annually.
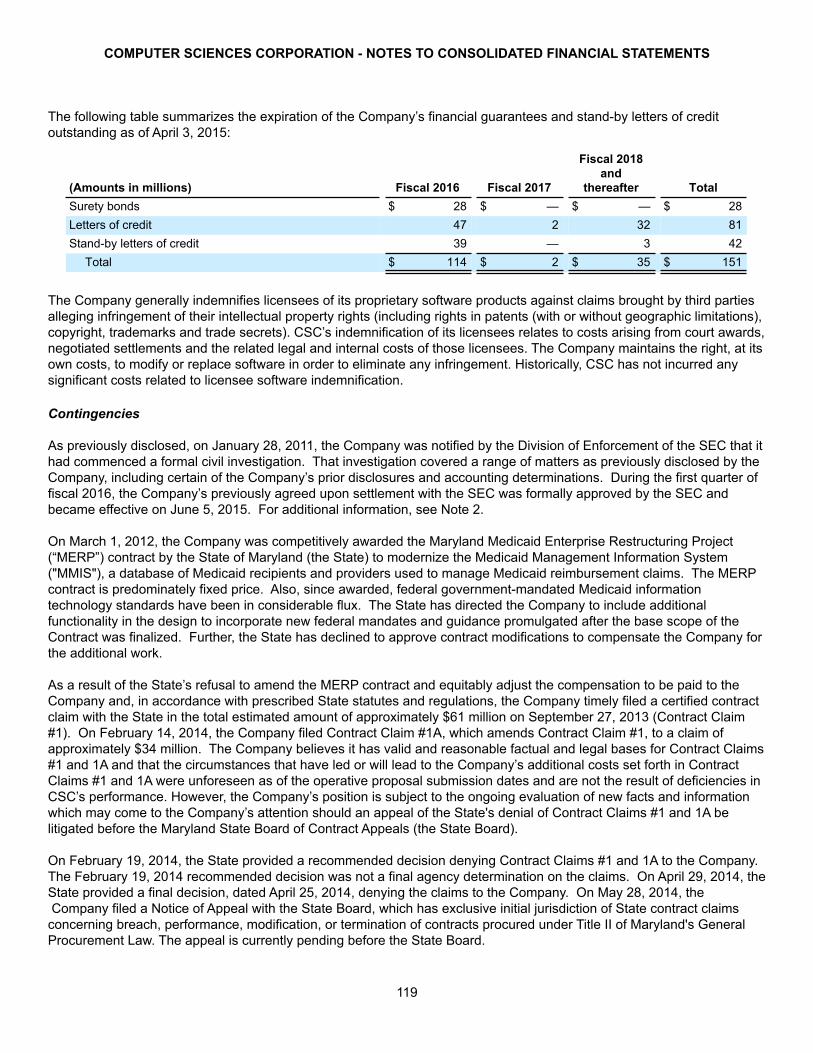
COMPUTER SCIENCES CORPORATION - NOTES TO CONSOLIDATED FINANCIAL STATEMENTS
119
The following table summarizes the expiration of the Company’s financial guarantees and stand-by letters of credit outstanding as of April 3, 2015:
(Amounts in millions) Fiscal 2016 Fiscal 2017
Fiscal 2018and
thereafter TotalSurety bonds $ 28 $ — $ — $ 28Letters of credit 47 2 32 81Stand-by letters of credit 39 — 3 42
Total $ 114 $ 2 $ 35 $ 151
The Company generally indemnifies licensees of its proprietary software products against claims brought by third parties alleging infringement of their intellectual property rights (including rights in patents (with or without geographic limitations), copyright, trademarks and trade secrets). CSC’s indemnification of its licensees relates to costs arising from court awards, negotiated settlements and the related legal and internal costs of those licensees. The Company maintains the right, at its own costs, to modify or replace software in order to eliminate any infringement. Historically, CSC has not incurred any significant costs related to licensee software indemnification.
Contingencies
As previously disclosed, on January 28, 2011, the Company was notified by the Division of Enforcement of the SEC that it had commenced a formal civil investigation. That investigation covered a range of matters as previously disclosed by the Company, including certain of the Company’s prior disclosures and accounting determinations. During the first quarter of fiscal 2016, the Company’s previously agreed upon settlement with the SEC was formally approved by the SEC and became effective on June 5, 2015. For additional information, see Note 2.
On March 1, 2012, the Company was competitively awarded the Maryland Medicaid Enterprise Restructuring Project (“MERP”) contract by the State of Maryland (the State) to modernize the Medicaid Management Information System ("MMIS"), a database of Medicaid recipients and providers used to manage Medicaid reimbursement claims. The MERP contract is predominately fixed price. Also, since awarded, federal government-mandated Medicaid information technology standards have been in considerable flux. The State has directed the Company to include additional functionality in the design to incorporate new federal mandates and guidance promulgated after the base scope of the Contract was finalized. Further, the State has declined to approve contract modifications to compensate the Company for the additional work.
As a result of the State’s refusal to amend the MERP contract and equitably adjust the compensation to be paid to the Company and, in accordance with prescribed State statutes and regulations, the Company timely filed a certified contract claim with the State in the total estimated amount of approximately $61 million on September 27, 2013 (Contract Claim #1). On February 14, 2014, the Company filed Contract Claim #1A, which amends Contract Claim #1, to a claim of approximately $34 million. The Company believes it has valid and reasonable factual and legal bases for Contract Claims #1 and 1A and that the circumstances that have led or will lead to the Company’s additional costs set forth in Contract Claims #1 and 1A were unforeseen as of the operative proposal submission dates and are not the result of deficiencies in CSC’s performance. However, the Company’s position is subject to the ongoing evaluation of new facts and information which may come to the Company’s attention should an appeal of the State's denial of Contract Claims #1 and 1A be litigated before the Maryland State Board of Contract Appeals (the State Board).
On February 19, 2014, the State provided a recommended decision denying Contract Claims #1 and 1A to the Company. The February 19, 2014 recommended decision was not a final agency determination on the claims. On April 29, 2014, the State provided a final decision, dated April 25, 2014, denying the claims to the Company. On May 28, 2014, the Company filed a Notice of Appeal with the State Board, which has exclusive initial jurisdiction of State contract claims concerning breach, performance, modification, or termination of contracts procured under Title II of Maryland's General Procurement Law. The appeal is currently pending before the State Board.

COMPUTER SCIENCES CORPORATION - NOTES TO CONSOLIDATED FINANCIAL STATEMENTS
120
On August 22, 2014, the State unilaterally suspended performance under the Contract for 90 days. On September 12, 2014, the State modified its August 22nd suspension of the Contract and authorized CSC, during the remainder of the 90-day suspension, to assign up to nine full-time-equivalent staff to perform various analyses of cost and schedule. On November 20, 2014, the State sent a letter extending the Suspension until January 5, 2015, and on January 2, 2015, the State again extended the Suspension until February 20, 2015.
As the result of the 90-day suspension, as extended, and other actions and inactions by the State in performance of its obligations under and management of the Contract, the Company filed a second set of Claims with the State Board (Claims #2A-D). Claim #2A, in the amount of $77 million, asserts that the Company's contractual undertaking did not include an agreement to receive reduced and delayed payments, and the State's unilateral imposition of such reductions and delays, together with the other factors result in a material change to the Contract entitling the Company to compensation for all costs incurred to date, including all liabilities incurred, and fee, as well as expected profit under the full contract. Alternatively, Claim #2B, in the amount of $65 million, asserts that the Maryland General Assembly's reduction to the appropriations for the MERP Project for fiscal 2015 effectively cancels the MERP Contract, entitling the Company to recover all costs incurred to date including all liabilities incurred, and a reasonable allowance for profit on costs and liabilities. Similarly, Claims #2C, also in the amount of $65 million, asserts that the State's actions, inactions, and decisions amount to a constructive termination for convenience entitling the Company to recover all costs incurred to date including, all liabilities incurred, and reasonable allowance for profit on costs and liabilities. Claim #2D is a claim for suspension costs during the 90-day period of $3 million, including labor costs, facilities costs and other costs needed to remain ready to re-start program. Due to the new claims, management assessed the adequacy of contract reserves and concluded that such reserves were adequate. Since April 2015, CSC and the State have been in negotiations, including the matters in litigation before the State Board, and the contract has been extended to accommodate those discussions.
On October 27, 2014, the United States District Court for the Southern District of New York unsealed a qui tam complaint that had been filed under seal over two years prior in a case entitled United States of America and State of New York ex rel. Vincent Forcier v. Computer Sciences Corporation and The City of New York, Case No. 1:12-cv-01750-DAB. The original complaint was brought by Vincent Forcier, a former employee of Computer Sciences Corporation, as a private party qui tam relator on behalf of the United States and the State of New York. The relator’s amended complaint, dated November 15, 2012, which remained under seal until October 27, 2014, alleged civil violations of the federal False Claims Act, 31 U.S.C. § 3729 et seq., and New York State’s False Claims Act, NY. Finance L, Art. 13, § 187 et seq., arising out of certain coding methods employed with respect to claims submitted by the Company to Medicaid for reimbursements as fiscal agent on behalf of its client, New York City’s Early Intervention Program (EIP). EIP is a federal program promulgated by the Individuals with Disabilities in Education Act, 20 U.S.C. § 1401 et seq. (IDEA), that provides early intervention services for infants and toddlers who have, or are likely to have, developmental delays.
Prior to the unsealing of the complaint on October 27, 2014, the United States Attorney’s Office for the Southern District of New York investigated the allegations in the qui tam relator’s complaint. That investigation included requests for information to the Company concerning the Company’s databases, software programs, and related documents regarding EIP claims submitted by the Company on behalf of New York City. The Company produced documents and information that the government requested and cooperated fully with the government’s investigation regarding this matter at all times. In addition, the Company conducted its own investigation of the matter, and openly shared its findings and worked constructively with all parties to resolve the matter. At the conclusion of its investigation, the Company concluded that it had not violated the law in any respect.
On October 27, 2014, the United States Attorney’s Office for the Southern District of New York and the Attorney General for the State of New York filed complaints-in-intervention on behalf of the United States and the State of New York, respectively. The complaints allege that, from 2008 to 2012, the Company and New York City used the automatic defaulting capabilities of a computerized billing system that the Company developed for New York City’s EIP in order to orchestrate a billing fraud against Medicaid. The New York Attorney General’s complaint also alleges that the Company did not comply with Medicaid requirements regarding submission of claims to private insurance and failed to reimburse Medicaid in certain instances where insurance had paid a portion of the claim. The lawsuits seek damages under the False Claims Act and common law theories in an amount equal to three times the sum of an unspecified amount of damages the United States and New York State allegedly sustained, plus civil penalties together with attorneys’ fees and costs. The Company believes that the allegations are without merit and intends to vigorously defend itself.

COMPUTER SCIENCES CORPORATION - NOTES TO CONSOLIDATED FINANCIAL STATEMENTS
121
On May 12, 2015, the Company and its wholly owned subsidiary, ServiceMesh Inc. (SMI), filed a civil complaint in the Court of Chancery of the State of Delaware against Eric Pulier (C.A. No. 11011-VCP). The Company acquired SMI on November 15, 2013. The purchase consideration included a cash payment at closing, as well as additional contingent consideration based on a contractually defined multiple of SMI’s revenues during a specified period ending January 31, 2014 (the Earnout Payment), all as set forth in the purchase agreement governing the acquisition. Before the acquisition, Mr. Pulier was the chief executive officer, chairman and one of the largest equity holders of SMI. Following the acquisition, Mr. Pulier became employed by the Company, at which time he executed a retention agreement pursuant to which he received a grant of restricted stock units of the Company and agreed to be bound by the Company’s rules and policies, including the Company’s Code of Business Conduct.
In March 2015, the Company became aware of, and began its own investigation into the circumstances surrounding, the arrests of two former employees of the Commonwealth Bank of Australia Ltd. (CBA) in connection with payments allegedly received by them, either directly or indirectly, from Mr. Pulier. SMI and CBA had entered into several contracts with each other, including contracts that contributed to the Earnout Payment. In April 2015, the Company was contacted by the Australian Federal Police regarding the alleged payments. The Company is cooperating with and assisting the Australian authorities in their investigation of this matter.
The Company and SMI’s complaint against Mr. Pulier asserts claims for (i) breach of the purchase agreement, (ii) breach of the implied covenant of good faith and fair dealing in the purchase agreement, (iii) fraud, (iv) fraud by omission, (v) breach of his retention agreement, (vi) breach of the implied covenant of good faith and fair dealing in his retention agreement and (vii) breach of fiduciary duty. The complaint seeks recovery of payments made to Mr. Pulier under the purchase agreement, the value of Mr. Pulier’s vested restricted stock units of the Company granted to him under his retention agreement and the full amount of the Earnout Payment, which was approximately $98 million. Mr. Pulier filed a motion to dismiss the complaint on May 28, 2015, but has not yet filed an opening brief in support of such motion. The Company also has asserted claims for indemnification related to this matter under the purchase agreement. The Company’s investigation of this matter is ongoing.
Publicity surrounding any of the foregoing matters could have an adverse impact on the Company’s reputation, financial condition, results of operations or cash flows. The Company is unable to estimate with confidence or certainty any possible loss or range of loss associated with these matters at this time.
In addition to the matters noted above, the Company is currently party to a number of disputes which involve or may involve litigation. The Company accrues a liability when management believes that it is both probable that a liability has been incurred and the amount of loss can be reasonably estimated under ASC 450. The Company believes it has appropriately recognized liabilities for any such matters. Regarding other matters that may involve actual or threatened disputes or litigation, the Company, in accordance with the applicable reporting requirements, provides disclosure of such matters for which the likelihood of material loss is at least reasonably possible.
The Company also considered the requirements regarding estimates used in the disclosure of contingencies under ASC Subtopic 275-10, Risks and Uncertainties. Based on that guidance, the Company determined that supplemental accrual and disclosure was not required for a change in estimate that involve contingencies because the Company determined that it was not reasonably possible that a change in estimate will occur in the near term. The Company reviews contingencies during each interim period and adjusts its accruals to reflect the impact of negotiations, settlements, rulings, advice of legal counsel, and other information and events pertaining to a particular case.
Note 23 - Subsequent Events
On April 21, 2015, CSC entered into a Master Accounts Receivable Purchase Agreement with The Royal Bank of Scotland, Plc. as Purchaser along with Mitsubishi UFJ Financial Group Ltd. and Bank of Nova Scotia, each as a Participant. The agreement results in the continuous non-recourse true sale of eligible receivables, and establishes a receivables purchase facility (the "Facility") that provides for up to $450 million in funding based on the availability of eligible receivables and the satisfaction of certain conditions. The Facility is an uncommitted facility that has a term of one year, unless terminated earlier. Under the Facility, the Company will sell eligible NPS segment receivables, including both receivables that have already been billed under an invoice and also certain unbilled receivables arising from contracts where the Company has performed work under a “cost plus fixed fee” or “time and materials” contract and other required
COMPUTER SCIENCES CORPORATION - NOTES TO CONSOLIDATED FINANCIAL STATEMENTS
122
conditions. The Company expects to use the proceeds from receivables sales under the Facility for general corporate purposes.
On April 27, 2015, the Company completed the divestiture of its wholly-owned subsidiary, Welkin Associates Limited (Welkin), a provider of systems engineering and technical assistance services to the intelligence community and other Department of Defense clients. Total consideration received was $34 million, and the after-tax gain on sale is estimated to be $14 million. The Welkin business was a part of CSC's NPS segment.
On May 19, 2015, the Company's board of directors unanimously approved the announcement of a plan to separate (the “Separation”) CSC’s North American Public Sector business into an independent publicly traded company ("CSC - U.S. Public Sector"), the shares of which would be spun off in a distribution to holders of CSC shares on the record date. After the Separation, CSC would focus on serving commercial clients globally and public sector clients outside the United States. The Separation is intended to be tax free for federal income tax purposes. The Company also announced an intention to pay a special dividend of approximately $1.5 billion (or $10.50 per share) in cash concurrent with the Separation. Completion of the Separation will be subject to customary conditions, including final approval of the Company's board of directors, the receipt of a favorable legal opinion from counsel with respect to the tax-free nature of the Separation, and the effectiveness of a Form 10 filing with the U.S. Securities and Exchange Commission.
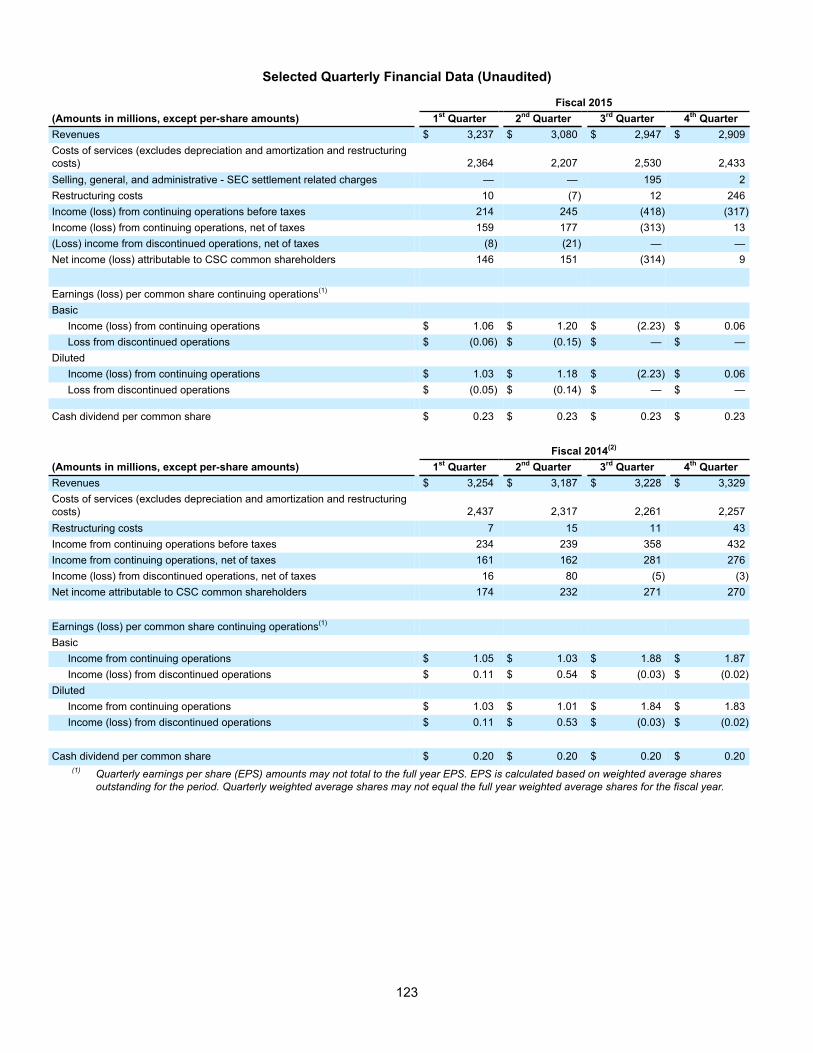
123
Selected Quarterly Financial Data (Unaudited)
Fiscal 2015(Amounts in millions, except per-share amounts) 1st Quarter 2nd Quarter 3rd Quarter 4th QuarterRevenues $ 3,237 $ 3,080 $ 2,947 $ 2,909Costs of services (excludes depreciation and amortization and restructuringcosts) 2,364 2,207 2,530 2,433Selling, general, and administrative - SEC settlement related charges — — 195 2Restructuring costs 10 (7) 12 246Income (loss) from continuing operations before taxes 214 245 (418) (317)Income (loss) from continuing operations, net of taxes 159 177 (313) 13(Loss) income from discontinued operations, net of taxes (8) (21) — —Net income (loss) attributable to CSC common shareholders 146 151 (314) 9
Earnings (loss) per common share continuing operations(1)
BasicIncome (loss) from continuing operations $ 1.06 $ 1.20 $ (2.23) $ 0.06Loss from discontinued operations $ (0.06) $ (0.15) $ — $ —
DilutedIncome (loss) from continuing operations $ 1.03 $ 1.18 $ (2.23) $ 0.06Loss from discontinued operations $ (0.05) $ (0.14) $ — $ —
Cash dividend per common share $ 0.23 $ 0.23 $ 0.23 $ 0.23
Fiscal 2014(2)
(Amounts in millions, except per-share amounts) 1st Quarter 2nd Quarter 3rd Quarter 4th QuarterRevenues $ 3,254 $ 3,187 $ 3,228 $ 3,329Costs of services (excludes depreciation and amortization and restructuringcosts) 2,437 2,317 2,261 2,257Restructuring costs 7 15 11 43Income from continuing operations before taxes 234 239 358 432Income from continuing operations, net of taxes 161 162 281 276Income (loss) from discontinued operations, net of taxes 16 80 (5) (3)Net income attributable to CSC common shareholders 174 232 271 270
Earnings (loss) per common share continuing operations(1)
BasicIncome from continuing operations $ 1.05 $ 1.03 $ 1.88 $ 1.87Income (loss) from discontinued operations $ 0.11 $ 0.54 $ (0.03) $ (0.02)
DilutedIncome from continuing operations $ 1.03 $ 1.01 $ 1.84 $ 1.83Income (loss) from discontinued operations $ 0.11 $ 0.53 $ (0.03) $ (0.02)
Cash dividend per common share $ 0.20 $ 0.20 $ 0.20 $ 0.20(1) Quarterly earnings per share (EPS) amounts may not total to the full year EPS. EPS is calculated based on weighted average shares
outstanding for the period. Quarterly weighted average shares may not equal the full year weighted average shares for the fiscal year.
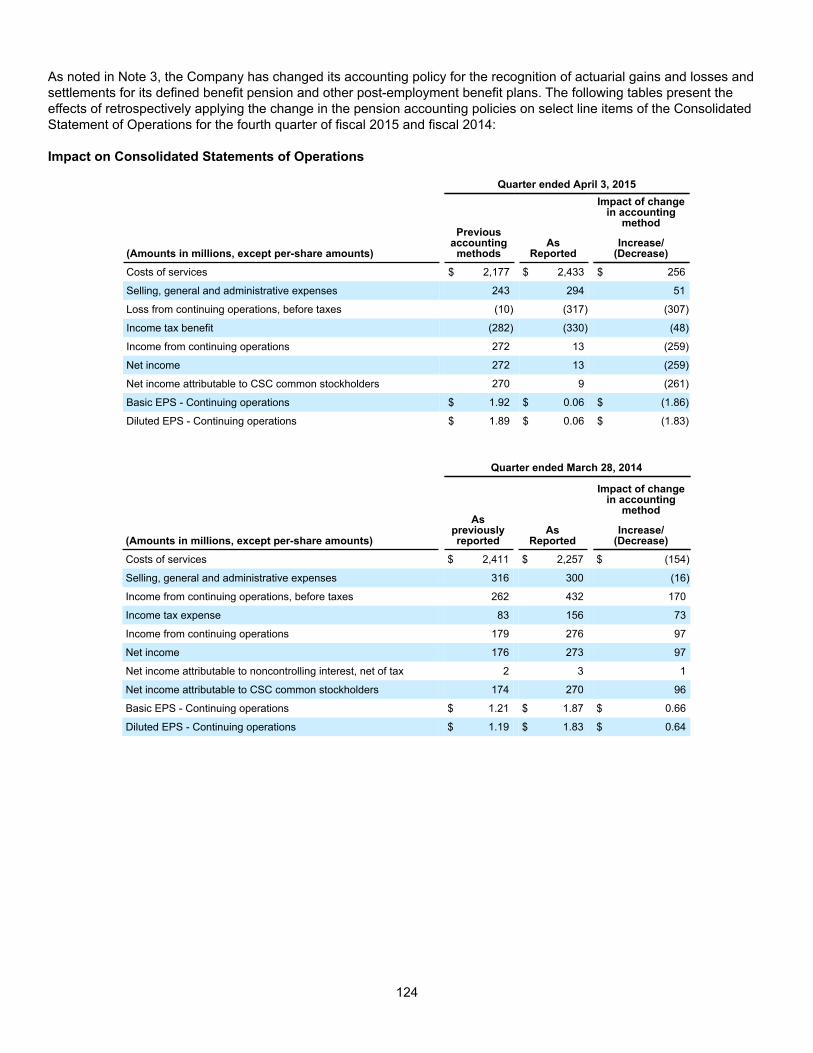
124
As noted in Note 3, the Company has changed its accounting policy for the recognition of actuarial gains and losses and settlements for its defined benefit pension and other post-employment benefit plans. The following tables present the effects of retrospectively applying the change in the pension accounting policies on select line items of the Consolidated Statement of Operations for the fourth quarter of fiscal 2015 and fiscal 2014:
Impact on Consolidated Statements of Operations
Quarter ended April 3, 2015
Previousaccounting
methodsAs
Reported
Impact of changein accounting
method
(Amounts in millions, except per-share amounts)Increase/
(Decrease)
Costs of services $ 2,177 $ 2,433 $ 256
Selling, general and administrative expenses 243 294 51
Loss from continuing operations, before taxes (10) (317) (307)
Income tax benefit (282) (330) (48)
Income from continuing operations 272 13 (259)
Net income 272 13 (259)
Net income attributable to CSC common stockholders 270 9 (261)
Basic EPS - Continuing operations $ 1.92 $ 0.06 $ (1.86)
Diluted EPS - Continuing operations $ 1.89 $ 0.06 $ (1.83)
Quarter ended March 28, 2014
Aspreviouslyreported
AsReported
Impact of changein accounting
method
(Amounts in millions, except per-share amounts)Increase/
(Decrease)
Costs of services $ 2,411 $ 2,257 $ (154)
Selling, general and administrative expenses 316 300 (16)
Income from continuing operations, before taxes 262 432 170
Income tax expense 83 156 73
Income from continuing operations 179 276 97
Net income 176 273 97
Net income attributable to noncontrolling interest, net of tax 2 3 1
Net income attributable to CSC common stockholders 174 270 96
Basic EPS - Continuing operations $ 1.21 $ 1.87 $ 0.66
Diluted EPS - Continuing operations $ 1.19 $ 1.83 $ 0.64

125
COMPUTER SCIENCES CORPORATION AND SUBSIDIARIES
SCHEDULE II, VALUATION AND QUALIFYING ACCOUNTS
(Amounts in millions)
Balance,beginningof period
Charged tocost andexpenses Other(1) Deductions
Balance,end ofperiod
For the year ended April 3, 2015:Allowance for doubtful receivables $ 48 $ 2 $ (4) $ (5) $ 41
For the year ended March 28, 2014:Allowance for doubtful receivables 48 4 (2) (2) 48
For the year ended March 29, 2013:Allowance for doubtful receivables 51 16 (1) (18) 48
(1) Includes balances from acquisitions and changes in foreign currency exchange rates.

126
Item 9. Changes in and Disagreements with Accountants on Accounting and Financial Disclosure
None.
Item 9A. Controls and Procedures
Evaluation of Disclosure Controls and Procedures
“Disclosure controls and procedures” are the controls and other procedures of an issuer that are designed to ensure that information required to be disclosed by the issuer in the reports filed or submitted by it under the Securities Exchange Act of 1934, as amended (Exchange Act) is recorded, processed, summarized and reported, within the time periods specified in the Securities and Exchange Commission’s rules and forms. “Disclosure controls and procedures” include, without limitation, controls and procedures designed to ensure that information required to be disclosed by an issuer in its Exchange Act reports is accumulated and communicated to the issuer’s management, including its principal executive and financial officers, as appropriate to allow timely decisions regarding required disclosure.
Under the direction of the Company’s Chief Executive Officer and Chief Financial Officer, the Company has evaluated its disclosure controls and procedures as of April 3, 2015 to ensure (i) that information required to be disclosed by us in the reports that we file or submit under the Exchange Act is recorded, processed, summarized and reported, within the time periods specified in the SEC's rules and forms and (ii) that information required to be disclosed by us in the reports that we file or submit under the Exchange Act is accumulated and communicated to our management, including the principal executive and principal financial officers, or persons performing similar functions, as appropriate, to allow timely decisions regarding required disclosure. Based on this evaluation, the Chief Executive Officer and Chief Financial Officer have concluded that the Company’s disclosure controls and procedures were effective as of April 3, 2015.

127
Management’s Report on Internal Control over Financial Reporting
The management of Computer Sciences Corporation (the Company) is responsible for establishing and maintaining adequate internal control over financial reporting. Internal control over financial reporting is a process designed to provide reasonable assurance regarding the reliability of financial reporting and the preparation of the consolidated financial statements for external reporting purposes in accordance with accounting principles generally accepted in the United States of America.
The Company’s internal control over financial reporting includes policies and procedures that (i) pertain to the maintenance of records that, in reasonable detail, accurately and fairly reflect transactions and dispositions of assets; (ii) provide reasonable assurance that transactions are recorded as necessary to permit preparation of consolidated financial statements in accordance with accounting principles generally accepted in the United States of America, and receipts and expenditures are being made only in accordance with authorization of management and the directors of the Company; and (iii) provide reasonable assurance regarding prevention or timely detection of unauthorized acquisition, use or disposition of the Company’s assets that could have a material effect on the Company’s consolidated financial statements. All internal controls, no matter how well designed, have inherent limitations. Therefore, even where internal control over financial reporting is determined to be effective, it can provide only reasonable assurance. Projections of any evaluation of effectiveness to future periods are subject to the risk controls may become inadequate because of changes in conditions, or the degree of compliance with the policies or procedures may deteriorate.
As of the end of the Company’s fiscal year 2015, management conducted an assessment of the effectiveness of the Company’s internal control over financial reporting based on the framework established in Internal Control—Integrated Framework (1992) issued by the Committee of Sponsoring Organizations of the Treadway Commission (COSO). Based on this assessment, management has determined that the Company’s internal control over financial reporting, as of April 3, 2015, was effective.
The Company’s internal control over financial reporting as of April 3, 2015, has been audited by the Company’s independent registered public accounting firm, as stated in their report appearing on page 128. Date: June 8, 2015
Changes in Internal Controls Over Financial Reporting
There were no changes in internal controls during the quarter ended April 3, 2015, which materially affected or are reasonably likely to materially affect, the Company's internal control over financial reporting.
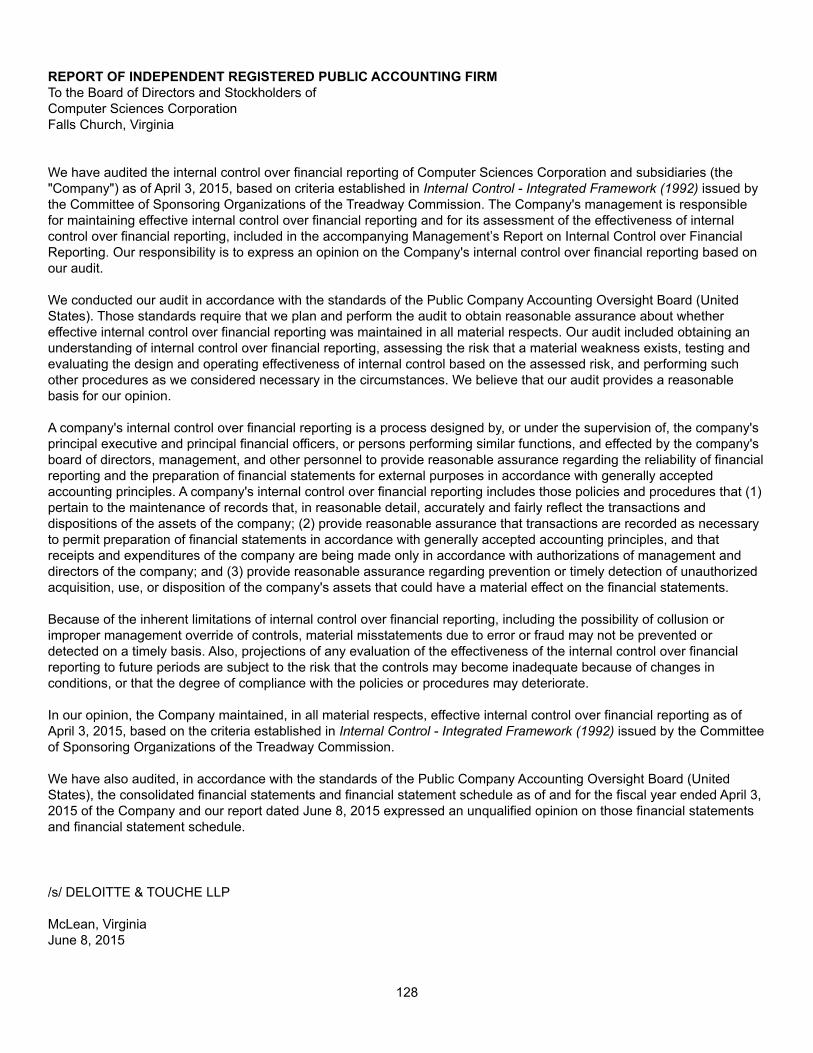
128
REPORT OF INDEPENDENT REGISTERED PUBLIC ACCOUNTING FIRMTo the Board of Directors and Stockholders ofComputer Sciences CorporationFalls Church, Virginia
We have audited the internal control over financial reporting of Computer Sciences Corporation and subsidiaries (the "Company") as of April 3, 2015, based on criteria established in Internal Control - Integrated Framework (1992) issued by the Committee of Sponsoring Organizations of the Treadway Commission. The Company's management is responsible for maintaining effective internal control over financial reporting and for its assessment of the effectiveness of internal control over financial reporting, included in the accompanying Management’s Report on Internal Control over Financial Reporting. Our responsibility is to express an opinion on the Company's internal control over financial reporting based on our audit.
We conducted our audit in accordance with the standards of the Public Company Accounting Oversight Board (United States). Those standards require that we plan and perform the audit to obtain reasonable assurance about whether effective internal control over financial reporting was maintained in all material respects. Our audit included obtaining an understanding of internal control over financial reporting, assessing the risk that a material weakness exists, testing and evaluating the design and operating effectiveness of internal control based on the assessed risk, and performing such other procedures as we considered necessary in the circumstances. We believe that our audit provides a reasonable basis for our opinion.
A company's internal control over financial reporting is a process designed by, or under the supervision of, the company's principal executive and principal financial officers, or persons performing similar functions, and effected by the company's board of directors, management, and other personnel to provide reasonable assurance regarding the reliability of financial reporting and the preparation of financial statements for external purposes in accordance with generally accepted accounting principles. A company's internal control over financial reporting includes those policies and procedures that (1) pertain to the maintenance of records that, in reasonable detail, accurately and fairly reflect the transactions and dispositions of the assets of the company; (2) provide reasonable assurance that transactions are recorded as necessary to permit preparation of financial statements in accordance with generally accepted accounting principles, and that receipts and expenditures of the company are being made only in accordance with authorizations of management and directors of the company; and (3) provide reasonable assurance regarding prevention or timely detection of unauthorized acquisition, use, or disposition of the company's assets that could have a material effect on the financial statements.
Because of the inherent limitations of internal control over financial reporting, including the possibility of collusion or improper management override of controls, material misstatements due to error or fraud may not be prevented or detected on a timely basis. Also, projections of any evaluation of the effectiveness of the internal control over financial reporting to future periods are subject to the risk that the controls may become inadequate because of changes in conditions, or that the degree of compliance with the policies or procedures may deteriorate.
In our opinion, the Company maintained, in all material respects, effective internal control over financial reporting as of April 3, 2015, based on the criteria established in Internal Control - Integrated Framework (1992) issued by the Committee of Sponsoring Organizations of the Treadway Commission.
We have also audited, in accordance with the standards of the Public Company Accounting Oversight Board (United States), the consolidated financial statements and financial statement schedule as of and for the fiscal year ended April 3, 2015 of the Company and our report dated June 8, 2015 expressed an unqualified opinion on those financial statements and financial statement schedule.
/s/ DELOITTE & TOUCHE LLP
McLean, VirginiaJune 8, 2015

129
Item 9B. Other Information
None.
PART III
Certain information required by Part III is omitted from this Annual Report on Form 10-K and is incorporated herein by reference to the definitive proxy statement with respect to our 2015 Annual Meeting of Stockholders (the “Proxy Statement”), which we will file with the Securities and Exchange Commission no later than 120 days after the end of the fiscal year covered by this Report.
Item 10. Directors, Executive Officers and Corporate Governance
Information regarding executive officers of the Company is included in Part I under the caption “Executive Officers of the Registrant.” Other information required by this Item will appear in the Proxy Statement under the headings “Proposal 1-Election of Directors”; "Additional Information-Section 16(a) Beneficial Ownership Reporting Compliance"; “Corporate Governance”; and “Additional Information-Business for 2015 Annual Meeting,” which sections are incorporated herein by reference.
Information about the Code of Business Conduct governing our Chief Executive Officer, Chief Financial Officer, and Controller can be found on our website, www.csc.com, under the Investor Relations - Corporate Governance tab.
The Company intends to disclose required information regarding any amendment to or waiver under the Code of Business Conduct referred to above by posting such information on our website within four business days after any such amendment or waiver.
Item 11. Executive Compensation
Information required by this Item will appear in the Proxy Statement under the headings “Executive Compensation” and “Corporate Governance,” which sections are incorporated herein by reference.
Item 12. Security Ownership of Certain Beneficial Owners and Management and Related Stockholder Matters
The following table gives information about our Common Stock that may be issued under our equity compensation plans as of April 3, 2015. See Note 17, “Stock Incentive Plans,” to the Consolidated Financial Statements included herein for information regarding the material features of these plans.
Plan category
Number of securities to beissued upon exercise of
outstanding options,warrants and rights
(a)
Weighted-averageexercise price of
outstanding options,warrants and rights
(b)
Number of securities remainingavailable for future issuance under
equity compensation plans (excludingsecurities reflected in column (a))
(c)Equity compensation plansapproved by security holders 8,279,970 $ 30.92 16,134,336 1
Equity compensation plans notapproved by security holders — — —Total 8,279,970 16,134,336
1Includes 3,000 shares available for future issuance under the 2006 Non-Employee Director Incentive Plan. This plan permits shares to be issued pursuant to stock options, restricted stock, and RSUs. Includes 172,300 shares available for future issuance under the 2010 Non-Employee Director Incentive Plan. This plan permits shares to be issued pursuant to RSUs and restricted stock.
Includes 2,960,106 shares available for future issuance under the 2007 Incentive Plan. This plan permits shares to be issued pursuant to stock options, restricted stock or RSUs, or pursuant to performance awards payable in shares of CSC stock, restricted stock, RSUs or any combination of the foregoing. Of the shares available for issuance under the 2007 plan, 2,960,106 shares are available for future grant as stock options with each option granted counted as one share against the available shares under such plan or assuming no options are granted, 1,480,053 shares are available for future awards of restricted stock or RSUs, after giving effect to the requirement set forth in the 2007 plan that a grant of one share of restricted stock or one RSU be counted as two shares against the available shares under such plan.
130
Includes 12,998,930 shares available for future granting under the 2011 Omnibus Incentive Plan. This plan permits shares to be issued pursuant to stock options, restricted stock or RSUs, or pursuant to performance awards payable in shares of CSC stock, restricted stock, RSUs or any combination of the foregoing. Of the shares available for issuance under the 2011 Omnibus Incentive Plan, 12,998,930 shares are available for future grant as stock options with each option granted counted as one share against the available shares under such plan or assuming no options are granted, 6,499,465 shares are available for future awards of restricted stock or RSUs, after giving effect to the requirement set forth in the 2011 Omnibus Incentive Plan that a grant of one share of restricted stock or one RSU be counted as two shares against the available shares under such plan.
Other information required by this Item will appear in the Proxy Statement under the heading “Stock Ownership,” which section is incorporated herein by reference.
Item 13. Certain Relationships and Related Transactions, and Director Independence
Information required by this Item will appear in the Proxy Statement under the heading “Corporate Governance,” which section is incorporated herein by reference.
Item 14. Principal Accountant Fees and Services
Information required by this Item will appear in the Proxy Statement under the heading “Proposal 3-Ratification of Independent Auditors-Fees,” which section is incorporated herein by reference.
Item 15. Exhibits, Financial Schedules
(1) and (2) Consolidated Financial Statements and Financial Statement ScheduleThese documents are included in the response to Item 8 of this report. See the index on page 50. (3) ExhibitsThe following exhibits are filed with this report or incorporated by reference to other filings listed on the Exhibit Index.
ExhibitNumber Description of Exhibit
2.1 Scheme Implementation Agreement by and among Computer Sciences Corporation, CSC Computer Sciences AustraliaHoldings Pty Limited, and iSOFT Group Limited (incorporated by reference to Exhibit 2 to the Company's Current Reporton Form 8-K (filed on April 5, 2011) (file number 11739300))
3.1 Amended and Restated Articles of Incorporation filed with the Nevada Secretary of State on August 9, 2010(incorporated by reference to Exhibit 3.1 to the Company's Quarterly Report on Form 10-Q for the fiscal quarter endedJuly 2, 2010 (filed August 11, 2010) (file number 101007138))
3.2 Amended and Restated Bylaws dated as of February 7, 2012 (incorporated by reference to Exhibit 3.2 to the Company'sAnnual Report on Form 10-K for the fiscal year ended March 30, 2012 (filed May 29, 2012) (file number 12874585))
3.3 Certificate of Amendment to the Amended and Restated Bylaws, dated August 7, 2012 (incorporated by reference toExhibit 3.2.1 to the Company's Current Report on Form 8-K (filed August 10, 2012) (file number 121024334))
3.4 Certificate of Amendment to Section 1 of Article III of the Amended and Restated Bylaws, dated August 13, 2014 (incorporated by reference to Exhibit 3.2.1 to the Company's Current Report on Form 8-K (filed August 14, 2014) (file number 141040586))
4.1 Indenture dated as of March 3, 2008, for the 5.50% senior notes due 2013 and the 6.50% senior notes due 2018(incorporated by reference to Exhibit 4.1 to the Company's Current Report on Form 8-K (filed September 15, 2008) (filenumber 081071955))
4.2 Indenture dated as of September 18, 2012, for the 2.500% senior notes due 2015 and the 4.450% senior notes due 2022by and between the Company and The Bank of New York Mellon Trust Company, N.A., as trustee (incorporated byreference to Exhibit 4.1 to the Company's Current Report on Form 8-K (filed September 19, 2012) (file number121100352))
4.3 First Supplemental Indenture dated as of September 18, 2012, by and between the Company and The Bank of New YorkMellon Trust Company, N.A., as trustee, and attaching a specimen form of the 2.500% Senior Notes due 2015 and the4.450% Senior Notes due 2022 (incorporated by reference to Exhibit 4.2 to the Company's Current Report on Form 8-K(filed September 19, 2012) (file number 121100352))
4.4 2.500% Senior Note due 2015 (in global form), dated September 18, 2012, among the Company and The Bank of NewYork Mellon Trust Company, N.A., as trustee (incorporated by reference to Exhibit 4.3 to the Company's Current Reporton Form 8-K (filed September 19, 2012) (file number 121100352))
4.5 4.450% Senior Note due 2022 (in global form), dated September 18, 2012, among the Company and The Bank of NewYork Mellon Trust Company, N.A., as trustee (incorporated by reference to Exhibit 4.4 to the Company's Current Reporton Form 8-K (filed September 19, 2012) (file number 121100352))

131
10.1 Credit Agreement, dated as of October 11, 2013, among the Company, certain subsidiaries of the Company from time totime party thereto, the financial institutions listed therein, and Citibank, N.A., as Administrative Agent (incorporated byreference to Exhibit 10.1 to the Company's Current Report on Form 8-K (filed October 17, 2013) (file number001-04850))
10.2 Asset Purchase Agreement, dated as of December 1, 2012, by and among Computer Sciences Corporation, CSC CreditServices, Inc., Equifax Inc. and Equifax Information Services LLC (incorporated by reference to Exhibit 10.1 to theCompany's Current Report on Form 8-K (filed December 3, 2012) (file number 121236237))
10.3 Term Loan Agreement, dated as of September 18 , 2012, by and between the Company, the financial institutions namedtherein, as lenders, and The Bank of Tokyo-Mitsubishi UFJ, Ltd., as administrative agent (incorporated by reference toExhibit 10.1 to the Company's Current Report on Form 8-K) (filed September 19, 2012) (file number 121100352)
10.4 Credit Agreement dated as of March 18, 2011 (incorporated by reference to Exhibit 10.1 to the Company's CurrentReport on Form 8-K) (filed March 22, 2011) (file number 11704203)
10.5 Master Loan and Security Agreement, dated as of May 28, 2014, among CSC Asset Funding I LLC, as Borrower,Computer Sciences Corporation, as Guarantor, Bank of America Leasing & Capital, LLC as Lender and Bank of America,N.A., as Administrative Agent (incorporated by reference to Exhibit 10.1 to the Company's Current Report on Form 8-K(filed May 30, 2014) (file number 14878500))
10.6 Master Accounts Receivable Purchase Agreement, dated as of April 21, 2015, by and between the Company, as seller,and The Royal Bank of Scotland PLC, as purchaser (incorporated by reference to Exhibit 10.1 to the Company's CurrentReport on Form 8-K (filed April 27, 2015) (file number 15795683))
10.7 1998 Stock Incentive Plan(1) (incorporated by reference to Exhibit 10.10 to the Company's Quarterly Report on Form 10-Q for the fiscal quarter ended July 3, 1998) (filed August 14, 1998) (file number 98687059)
10.8 2001 Stock Incentive Plan(1) (incorporated by reference to Appendix B to the Company's Proxy Statement for the AnnualMeeting of Stockholders held on August 13, 2001) (filed June 29, 2001) (file number 1672145)
10.9 2004 Incentive Plan(1) (incorporated by reference to Appendix B to the Company's Proxy Statement for the AnnualMeeting of Stockholders held on August 9, 2004) (filed June 30, 2004) (file number 04890067)
10.10 2007 Employee Incentive Plan(1) (incorporated by reference to Appendix B to the Company's Proxy Statement for theAnnual Meeting of Stockholders held on July 30, 2007) (filed June 29, 2007) (file number 07948632)
10.11 2011 Omnibus Incentive Plan(1), as amended and restated effective May 14, 2013 (incorporated by reference toAppendix C to the Company's Proxy Statement for the Annual Meeting of Stockholders held on August 13, 2013) (filedJune 28, 2013) (file number 13940391)
10.12 Form of Award Agreement for Employees(1) (incorporated by reference to Exhibit 10.6 to the Company's QuarterlyReport on Form 10-Q for the fiscal quarter ended December 31, 2010) (filed February 9, 2011) (file number 11585668)
10.13 Form of Stock Option Agreement for Employees(1) (incorporated by reference to Exhibit 10.7 to the Company's QuarterlyReport on Form 10-Q for the fiscal quarter ended December 31, 2010) (filed February 9, 2011) (file number 11585668)
10.14 Form of Stock Option Award Agreement under the 2004 Incentive Plan(1) (incorporated by reference to Exhibit 10.7 ofthe Company’s Quarterly Report on Form 10-Q for the fiscal quarter ended June 28, 2013) (filed August 7, 2013) (filenumber 131014660)
10.15 Form of International Stock Option Agreement for Employees(1) (incorporated by reference to Exhibit 10.8 to theCompany's Quarterly Report on Form 10-Q for the fiscal quarter ended December 31, 2010) (filed February 9, 2011) (filenumber 11585668)
10.16 Form Stock Option Schedule for United Kingdom Employees under the 2001 Employee Incentive Plan(1) (incorporatedby reference to Exhibit 10.9 to the Company's Quarterly Report on Form 10-Q for the fiscal quarter ended July 1, 2011)(filed August 10, 2011) (file number 111024699)
10.17 Form of Restricted Stock Agreements for Employees(1) (incorporated by reference to Exhibit 10.6 to the Company'sQuarterly Report on Form 10-Q for the fiscal quarter ended July 1, 2005) (filed August 5, 2005) (file number 051002523)
10.18 Form of Service Based Restricted Stock Unit Agreement for Employees(1) (incorporated by reference to Exhibit 10.10 tothe Company's Quarterly Report on Form 10-Q for the fiscal quarter ended December 31, 2010) (filed February 9, 2011)(file number 11585668)
10.19 Form of Performance Based Restricted Stock Unit Agreement for Employees(1) (incorporated by reference to Exhibit10.11 to the Company's Quarterly Report on Form 10-Q for the fiscal quarter ended December 31, 2010) (filed February9, 2011) (file number 11585668)
10.20 Form of Performance Based Restricted Stock Unit Award Agreement under the 2011 Omnibus Incentive Plan(1)(incorporated by reference to Exhibit 10.4 of the Company’s Quarterly Report on Form 10-Q for the fiscal quarter endedJune 28, 2013) (filed August 7, 2013) (file number 131014660)
10.21 Form of Career Shares Restricted Stock Unit Agreement for Employees(1) (incorporated by reference to Exhibit 10.12 tothe Company's Quarterly Report on Form 10-Q for the fiscal quarter ended December 31, 2010) (filed February 9, 2011)(file number 11585668)
10.22 Form of Career Shares Restricted Stock Unit Award Agreement with J. Michael Lawrie(1) (incorporated by reference toExhibit 10.2 of the Company’s Quarterly Report on Form 10-Q for the fiscal quarter ended June 28, 2013) (filed August 7,2013) (file number 131014660)

132
10.23 Form of Career Shares Restricted Stock Unit Award Agreement with Paul N. Saleh(1) (incorporated by reference toExhibit 10.3 of the Company’s Quarterly Report on Form 10-Q for the fiscal quarter ended June 28, 2013) (filed August 7,2013) (file number 131014660)
10.24 Form of Career Shares Restricted Stock Unit Award Agreement under the 2011 Omnibus Incentive Plan(1) (incorporatedby reference to Exhibit 10.5 of the Company’s Quarterly Report on Form 10-Q for the fiscal quarter ended June 28, 2013)(filed August 7, 2013) (file number 131014660)
10.25 Form of Career Shares Restricted Stock Unit Award Agreement under the 2011 Omnibus Incentive Plan(1) (incorporatedby reference to Exhibit 10.6 of the Company’s Quarterly Report on Form 10-Q for the fiscal quarter ended June 28, 2013)(filed August 7, 2013) (file number 131014660)
10.26 Form of International Service Based Restricted Stock Unit Agreement for Employees(1) (incorporated by reference toExhibit 10.14 to the Company's Quarterly Report on Form 10-Q for the fiscal quarter ended July 1, 2011) (filed August 10,2011) (file number 111024699)
10.27 Form of International Performance Based Restricted Stock Unit Agreement for Employees(1) (incorporated by referenceto Exhibit 10.15 to the Company's Quarterly Report on Form 10-Q for the fiscal quarter ended July 1, 2011) (filed August10, 2011) (file number 111024699)
10.28 Form of International Career Shares Restricted Stock Unit Agreement for Employees(1) (incorporated by reference toExhibit 10.16 to the Company's Quarterly Report on Form 10-Q for the fiscal quarter ended July 1, 2011) filed August 10,2011) (file number 111024699)
10.29 Form of Senior Management and Key Employee Severance Agreement, as amended and restated effective May 20,2009(1) (incorporated by reference to Exhibit 10.31 to the Company's Annual Report on Form 10-K for the fiscal yearended April 3, 2009) (filed May 29, 2009) (file number 09858607)
10.30 Supplemental Executive Retirement Plan, amended and restated effective December 3, 2007(1) (incorporated byreference to Exhibit 10.1 to the Company's Current Report on Form 8-K) (filed December 4, 2007) (file number071283050)
10.31 First Amendment to Supplemental Executive Retirement Plan(1) (incorporated by reference to Exhibit 10.3 to theCompany’s Quarterly Report on Form 10-Q for the quarter ended September 27, 2013) (filed October 31 , 2013) (filenumber 131180353)
10.32 Supplemental Executive Retirement Plan No. 2, effective December 3, 2007(1) (incorporated by reference to Exhibit 10.2to the Company's Current Report on Form 8-K) (filed December 4, 2007) (file number 071283050)
10.33 First Amendment to the Supplemental Executive Retirement Plan No. 2(1) (incorporated by reference to Exhibit 10.4 tothe Company’s Quarterly Report on Form 10-Q for the quarter ended September 27, 2013) (filed October 31, 2013) (filenumber 131180353)
10.34 Excess Plan, effective December 3, 2007(1) (incorporated by reference to Exhibit 10.3 to the Company's Current Reporton Form 8-K) (filed December 4, 2007) (file number 071283050)
10.35 First Amendment to the Excess Plan(1) (incorporated by reference to Exhibit 10.5 to the Company’s Quarterly Report onForm 10-Q for the quarter ended September 27, 2013) (filed October 31, 2013) (file number 131180353)
10.36 Employment Agreement, dated February 7, 2012, between the Company and J. Michael Lawrie(1) (incorporated byreference to Exhibit 10.1 to the Company's Current Report on Form 8-K dated February 7, 2012) (filed February 8, 2012)(file number 12581529)
10.37 Service Based Inducement Restricted Stock Unit Award Agreement, dated April 16, 2012, between the Company and J.Michael Lawrie(1) (incorporated by reference to Exhibit 10.21 to the Company's Annual Report on Form 10-K for thefiscal year ended March 30, 2012) (filed May 29, 2012) (file number 12874585)
10.38 Fiscal Year 2013 CEO Stock Option Award Agreement, dated April 16, 2012, between the Company and J. MichaelLawrie(1) (incorporated by reference to Exhibit 10.22 to the Company's Annual Report on Form 10-K for the fiscal yearended March 30, 2012) (filed May 29, 2012) (file number 12874585)
10.39 Fiscal Year 2014 CEO Stock Option Award Agreement, dated May 20, 2013, between the Company and J. MichaelLawrie(1) (incorporated by reference to Exhibit 10.1 to the Company’s Quarterly Report on Form 10-Q for the fiscalquarter ended June 28, 2013) (filed August 7, 2013) (file number 131014660)
10.40 Service Based Inducement Restricted Stock Unit Award Agreement, dated June 15, 2012, between the Company andPaul N. Saleh(1) (incorporated by reference to Exhibit 10.24 to the Company's Quarterly Report on Form 10-Q for thequarter ended June 29, 2012) (filed August 8, 2012) (file number 121016715)
10.41 Form of Performance Based Restricted Stock Unit Award Agreement for Employees(1) (incorporated by reference toExhibit 10.26 to the Company's Quarterly Report on Form 10-Q for the quarter ended June 29, 2012) (filed August 8,2012) (file number 121016715)
10.42 Form of International Performance Based Restricted Stock Unit Award Agreement for Employees(1) (incorporated byreference to Exhibit 10.27 to the Company's Quarterly Report on Form 10-Q for the quarter ended June 29, 2012) (filedAugust 8, 2012) (file number 121016715)
10.43 Deferred Compensation Plan, amended and restated effective December 31, 2012(1) (incorporated by reference toExhibit 10.2 to the Company's Quarterly Report on Form 10-Q for the quarter ended December 28, 2012) (filed February6, 2013) (file number 13575189)
10.44 First Amendment to Deferred Compensation Plan(1) (filed herewith)
133
10.45 Severance Plan for Senior Management and Key Employees, amended and restated effective October 28, 2007(1)(incorporated by reference to Exhibit 10.3 to the Company's Current Report on Form 8-K dated October 28, 2007) (filedNovember 1, 2007) (file number 071207160)
10.46 First Amendment to the Severance Plan for Senior Management and Key Employees(1) (incorporated by reference toExhibit 10.2 to the Company’s Quarterly Report on Form 10-Q for the quarter ended September 27, 2013) (filed October31, 2013) (file number 131180353)
10.47 Form of Indemnification Agreement for officers and directors(1) (incorporated by reference to Exhibit 10.1 to theCompany's Current Report on Form 8-K dated February 18, 2010) (filed February 22, 2010) (file number 10622679)
10.48 2010 Non-Employee Director Stock Incentive Plan(1), as amended and restated effective May 24, 2013 (incorporated byreference to Appendix B to the Company's Proxy Statement for the Annual Meeting of Stockholders held on August 13,2013) (filed June 28, 2013) (file number 13940391)
10.49 1997 Nonemployee Director Stock Incentive Plan(1) (incorporated by reference to Appendix A to the Company's ProxyStatement for the Annual Meeting of Stockholders held on August 11, 1997) (filed July 2, 1997) (file number 97635310)
10.50 2006 Nonemployee Director Incentive Plan(1) (incorporated by reference to Appendix B to the Company's ProxyStatement for the Annual Meeting of Stockholders held on July 31, 2006) (filed June 22, 2006) (file number 06918523)
10.51 Form of Restricted Stock Unit Agreement for directors(1) (incorporated by reference to Exhibit 10.18 to the Company'sQuarterly Report on Form 10-Q for the fiscal quarter ended July 1, 2005) (filed August 5, 2005) (file number 051002523)
10.52 Form of Amendment to Restricted Stock Unit Agreement for directors (1) (incorporated by reference to Exhibit 10.5 to theCompany's Current Report on Form 8-K dated December 5, 2005) (filed December 6, 2005) (file number 051246311)
10.53 Form of Restricted Stock Unit Agreement for directors pursuant to the 2010 Non-Employee Director Incentive Plan(1)(incorporated by reference to Exhibit 10.32 to the Company's Quarterly Report on Form 10-Q for the fiscal quarter endedJuly 1, 2011) (filed August 10, 2011) (file number 111024699)
10.54 Form of Performance Stock Unit Agreement with Mr. J. Michael Lawrie (incorporated by reference to Exhibit 10.2 to theCompany's Quarterly Report on Form 10-Q for the fiscal quarter ended July 4, 2014 (filed August 12, 2014) (file number141034640))
10.55 Service Based Restricted Stock Unit Award Agreement, dated May 15, 2014, between the Company and Romil Bahl(filed herewith)
10.56 Service Based Restricted Stock Unit Award Agreement, dated August 15, 2014, between the Company and AshishMahadwar (filed herewith)
12.1 Calculation of Ratio of Earnings to Fixed Charges and Ratio of Earnings to Combined Fixed Charges and PreferenceDividends.
18.1 Preferability Letter on Change in Accounting Principle (incorporated by reference to Exhibit 18.1 to the Company'sQuarterly Report on Form 10-Q for the fiscal quarter ended July 4, 2014 (filed August 12, 2014) (file number 141034640))
21 Significant Active Subsidiaries and Affiliates of the Registrant23 Consent of Independent Registered Public Accounting Firm
31.1 Section 302 Certification of the Chief Executive Officer31.2 Section 302 Certification of the Chief Financial Officer32.1 Section 906 Certification of Chief Executive Officer32.2 Section 906 Certification of Chief Financial Officer99.1 Revised Financial Information Disclosure as a result of the Company's restructuring (incorporated by reference to
Exhibits 99.01, 99.02 and 99.03 to the Company's Current Report on Form 8-K dated December 16, 2008) (filedDecember 16, 2008) (file number 081252513)
99.2 Revised Financial Information Disclosure as a result of the Company's fiscal 2014 divestitures and change in reportablesegments (incorporated by reference to Exhibits 99.1 and 99.2 to the Company's Current Report on Form 8-K datedFebruary 7, 2014) (file number 14584785)
101.INS XBRL Instance101.SCH XBRL Taxonomy Extension Schema101.CAL XBRL Taxonomy Extension Calculation101.LAB XBRL Taxonomy Extension Labels101.PRE XBRL Taxonomy Extension Presentation
(1) Management contract or compensatory plan or agreement

134
SIGNATURES
Pursuant to the requirements of the Securities Exchange Act of 1934, the Registrant has duly caused this report to be signed on its behalf by the undersigned, thereunto duly authorized.
COMPUTER SCIENCES CORPORATION
Dated: June 8, 2015 By: /s/ J. Michael Lawrie
Name: J. Michael Lawrie
Title: President and Chief Executive Officer
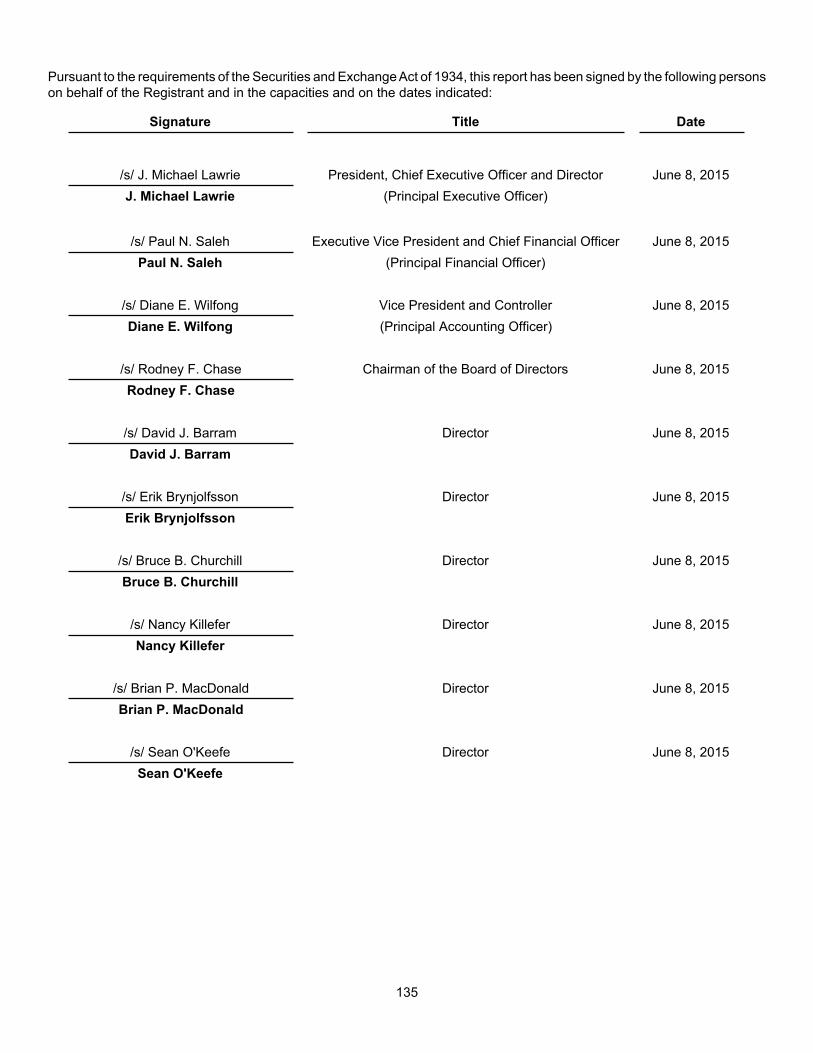
135
Pursuant to the requirements of the Securities and Exchange Act of 1934, this report has been signed by the following persons on behalf of the Registrant and in the capacities and on the dates indicated:
Signature Title Date
/s/ J. Michael Lawrie President, Chief Executive Officer and Director June 8, 2015J. Michael Lawrie (Principal Executive Officer)
/s/ Paul N. Saleh Executive Vice President and Chief Financial Officer June 8, 2015Paul N. Saleh (Principal Financial Officer)
/s/ Diane E. Wilfong Vice President and Controller June 8, 2015Diane E. Wilfong (Principal Accounting Officer)
/s/ Rodney F. Chase Chairman of the Board of Directors June 8, 2015Rodney F. Chase
/s/ David J. Barram Director June 8, 2015David J. Barram
/s/ Erik Brynjolfsson Director June 8, 2015Erik Brynjolfsson
/s/ Bruce B. Churchill Director June 8, 2015Bruce B. Churchill
/s/ Nancy Killefer Director June 8, 2015Nancy Killefer
/s/ Brian P. MacDonald Director June 8, 2015Brian P. MacDonald
/s/ Sean O'Keefe Director June 8, 2015Sean O'Keefe
SHAREHOLDER INFORMATIONSTOCK INFORMATION
Common Stock Symbol: CSC, listed and traded on the New York Stock Exchange (NYSE). Shares of common stock outstanding were 137,679,779 shares as of May 15, 2015. There were 5,740 Shareholders of Record as of May 15, 2015.
TRANSFER AGENT AND REGISTRAR
All inquiries concerning registered shareholder accounts and stock transfer matters, including address changes and consolidation of multiple accounts, should be directed to Computershare, CSC’s transfer agent and registrar.
Shareholder correspondence should be mailed to:
Computershare Investor Services P.O. Box 43078 Providence, RI 02940-3078
Overnight correspondence should be mailed to:
Computershare Investor Services 250 Royall Street Canton, MA 02021 Website for registered shareholders www.computershare.com/investor
By phone:
1.800.676.0654 (U.S. Domestic) 1.201.680.6578 (International)
FINANCIAL COMMUNITY INFORMATION
Institutional and individual investors, financial analysts and portfolio managers should contact:
George Price CSC Investor Relations 3170 Fairview Park Drive Falls Church, VA 22042 1.703.641.3000 1.800.542.3070 [email protected]
Written requests, including requests for Company filings with the U.S. Securities and Exchange Commission (SEC), should be directed to:
CSC Investor Relations 3170 Fairview Park Drive, Falls Church, VA 22042 [email protected]
To enroll for electronic delivery of CSC’s Proxy Statement, Annual Report and other materials, log on to:
https://enroll.icsdelivery.com/csc/Default.aspx
COMPANY WEBSITE
Additional CSC information is available at www.csc.com, including all of the documents the Company files with or furnishes to the SEC, which are available free of charge.
CERTIFICATIONS
The Company has included as Exhibits 31.1, 31.2, 32.1 and 32.2 to its Annual Report on Form 10-K for fiscal year 2015 filed with the SEC, certificates of CSC’s Chief Executive Officer and Chief Financial Officer certifying the quality of the Company’s public disclosure. The Chief Executive Officer has also submitted to the NYSE a certificate certifying that he is not aware of any violations by CSC of the NYSE Corporate Governance Listing Standards.
ANNUAL MEETING
The Annual Meeting of Stockholders is scheduled for 10:00 a.m. (ET) on August 14, 2015, at CSC, 3170 Fairview Park Drive, Falls Church, VA 22042. Proxies for the meeting will be solicited in a separate Proxy Statement.
DIVIDEND POLICY
The Company instituted a regular quarterly dividend policy in fiscal year 2011.
INDEPENDENT AUDITORS
Deloitte & Touche LLP 7900 Tysons One Place, Suite 800 McLean, VA 22102

© 2015 Computer Sciences Corporation. All rights reserved. Designed and produced by CSC’s Creative Services. Printed in USA MD_8553a-16 06-15
About CSCCSC is a global leader in next-generation IT services and solutions. The company’s mission is to enable superior returns on our clients’ technology investments through best-in-class industry solutions, domain expertise and global scale. For more information, visit us at www.csc.com.
Regional CSC Headquarters
The Americas3170 Fairview Park Drive Falls Church, Virginia 22042 United States +1.703.876.1000
Asia, Middle East, AfricaLevel 9, UE BizHub East 6 Changi Business Park Avenue 1 Singapore 468017 Republic of Singapore +65.6809.9000
Australia26 Talavera Road Macquarie Park, NSW 2113 Australia +61(2)9034.3000
Central and Eastern EuropeAbraham-Lincoln-Park 1 65189 Wiesbaden Germany +49.611.1420
Nordic and Baltic RegionRetortvej 8 DK-2500 Valby Denmark +45.36.14.4000
South and West EuropeImmeuble Balzac 10 place des Vosges 92072 Paris la Défense Cedex France +33.1.55.707070
UK, Ireland and NetherlandsFloor 4 One Pancras Square London N1C 4AG United Kingdom +44.020.3696.3000