combined qi network 5 - brhpc.org€¦ · combined qi network meeting july 16, ... (qip)...
TRANSCRIPT

Broward Regional Health Planning Council, Inc. 200 Oakwood Lane, Suite 100 Hollywood, Florida 33020 T: (954) 561-9681 F: (954) 561-9685
T
(
9
5
4
)
5
6
1
.
9
6
8
1
F
(
9
5
4
)
5
6
3
4
.
9
6
8
5
COMBINED QI NETWORK October 15, 2013 at 2:00 p.m.
Ryan White Part A Program Office 115 S. Andrews Ave., Ft. Lauderdale, FL 33301
AGENDA
I. Call to Order
II. Welcome/Introductions
III. Review October 15, 2013 Meeting Agenda and July 16, 2013 Meeting Minutes
IV. Health Literacy Quality Improvement Project Development ACTION ITEM: Review findings from health literacy pilot and discuss next steps.
I. NQC In+Care Campaign Measures Report
ACTION ITEM: Review summary of retention rates and continue discussion of role of Support Services in retention.
II. Checklist for Patient Understanding
ACTION ITEM: Review and discuss Network recommendations to modify checklist for each service category.
III. Viral Load Analysis
ACTION ITEM: Review viral load analysis to identify any correlation between viral load suppression and service category.
IV. Old/New Business
V. Resource Sharing
VI. Review Agenda Items for Next Meeting
VII. Adjournment
Next Meeting Date: January 21, 2013
Broward Regional Health Planning Council, Inc. 200 Oakwood Lane, Suite 100 Hollywood, Florida 33020 T: (954) 561-9681 F: (954) 561-9685
T
(
9
5
4
)
5
6
1
.
9
6
8
1
F
(
9
5
4
)
5
6
3
4
.
9
6
8
5

COMMUNITY PARTNERSHIPS DIVISION Health Care Services Section 115 S Andrews Avenue, Room A300 • Fort Lauderdale, Florida 33301 • 954-357-5390 • FAX 954-357-5897
Broward County Board of County Commissioners Sue Gunzburger • Dale V.C. Holness • Kristin Jacobs • Chip LaMarca • Ilene Lieberman • Stacy Ritter • John E. Rodstrom, Jr. •Barbara Sharief • Lois Wexler
www.broward.org•
COMBINED QI NETWORK MEETING
July 16, 2013 at 2:00 P.M.
BRHPC, Conference Room
MEETING MINUTES
NETWORK MEMBERS PRESENT
Brad Gammell, Poverello
Kara Schickowski, Legal Aid
Madhurie Angie Maharaj, NBHD
Mike Ehren, BCHD
Natasha Markman, CIED
MEMBERS ABSENT
Mario DeSantis (HOPWA)
CLINICAL QUALITY
MANAGEMENT (CQM)
STAFF
Ariela Eshel
Rachele Solomon
GUESTS
Bonnie Majcher, BCHD
PART A GRANTEE
Kim Strong
Mary Beth Swanson
I. Call to Order
The meeting was called to order at 2:17 PM.
II. Welcome/Introductions
CQM Staff welcomed everyone and individual introductions were made.
III. Review and Approve Agenda
The Network reviewed and approved the July 16, 2013 Meeting Agenda and April 16, 2013 Meeting
Minutes via consensus.
IV. Health Literacy Quality Improvement Project (QIP) Development The Network completed the Network Activity “I Scream, You Scream We All Scream for Ice Cream”, a
short, validated tool for assessing Health Literacy. Members discussed their feelings about completing
the survey and its potential usefulness for assessing client Health Literacy. Members expressed concern
that clients may become frustrated if they are unable to read or do basic math. Members inquired if the
Health Literacy exercise is available in other languages; noted that the assessment is available in English
and Spanish. The Network suggested not translating the label to see how clients adapt when labels are
not in their native language. There was discussion on whether using an over the counter medicine label
would be more effective than the ice cream label. Members noted that the ice cream tool is a validated
tool that focuses on both health literacy and health numeracy.
The Network agreed to pilot the activity at their respective agencies. Members to pilot activity to 20
clients and agency staff beginning August 1, 2013 and ending September 2, 2013. There was a
discussion about collecting demographic information from participants. Staff to add demographics: age,
gender, race, ethnicity, and education level to the activity. Members suggested adding a question at the
end of the activity to gauge participants’ comfort level while participating in the activity. Staff to add

Page 2 of 2
the question “How comfortable did you feel doing this exercise?” at the end of the activity as well as a
drop down menu for participants to select agency affiliation for both staff and clients.
There was discussion on ways to introduce the health literacy assessment to clients; Members agreed
that a small introduction would be beneficial. Agency to provide questions and correct answers to
participants following the assessment. Once assessment is complete, report to be provided for each
service category. Staff to send ice cream label, instructions, and questions electronically to Network by
Friday July 19, 2013.
The Network reviewed the handout: Checklist for Patient Understanding (copy on file). There was a
discussion about possibly modifying the handout for each service category. Members were asked to
review the document and determine how they would recommend modifying the checklist for their
service category. Network to review handout and be prepared to discuss possible modifications at the
next meeting.
V. Data Review In+Care Campaign The Network reviewed the In+Care Campaign Measures Report (copy on file). Members were informed
of the Medical Case Management QIP to review data and identify clients at risk of being lost to care.
VI. Old/New Business
There was a discussion on how service category specific viral loads are run in Provide Enterprise (PE);
noted that service category specific viral loads will not be unduplicated. There was discussion on the
importance of establishing a community viral load. Staff to bring service category specific viral loads to
the next meeting.
VII. Resource Sharing
Network provided with a copy of PROACT’s modified DOT referral program information (copy on
file); Members asked to consider any clients that could benefit from this program. Staff to send
information to all QI Networks.
VIII. Review Agenda Items for Next Meeting
Standing Agenda Items
Health Literacy QIP Development
Viral Load Analysis
Checklist for Patient Understanding
IX. Next Meeting: October 15, 2013 at 2:00 PM
X. Adjournment: Meeting was adjourned at 3:45 PM

+
I Scream, You Scream, We All Scream
for Ice Cream
RESULTS

+ Health Literacy - The Newest Vital Sign

+ Score Sheet for the Newest Vital Sign
1. If you eat the entire container, how many calories will you eat?
Answer: 1,000 is the only correct answer
2. If you are allowed to eat 60 grams of carbohydrates as a snack, how much ice cream could you have?
Answer: Any of the following is correct: 1 cup (or any amount up to 1 cup), half the container. Note: If patient answers “two servings,” ask “How much ice cream would that be if you were to measure it into a bowl?”
3. Your doctor advises you to reduce the amount of saturated fat in your diet. You usually have 42 g of saturated fat each day, which includes one serving of ice cream. If you stop eating ice cream, how many grams of saturated fat would you be consuming each day?
Answer: 33 is the only correct answer
4. If you usually eat 2,500 calories in a day, what percentage of your daily value of calories will you be eating if you eat one serving?
Answer: 10% is the only correct answer
READ TO SUBJECT: Pretend that you are allergic to the following substances: penicillin, peanuts, latex gloves, and bee stings.
5. Is it safe for you to eat this ice cream?
Answer: No
6. (Ask only if the patient responds “no” to question 5): Why not?
Answer: Because it has peanut oil.

+ Score Interpretation
Number of correct answers: Tally up ‘Yes’ answers
Score of 0-1 suggests high likelihood (50% or more) of
limited literacy.
Score of 2-3 indicates the possibility of limited literacy.
Score of 4-6 almost always indicates adequate literacy.

+ All Respondents - % Correct
69.20%
68.70%
63.90%
64.90%
66.30%
Overall (N=172)
Question 1
Question 2
Question 3
Question 4
Question 5
1. How many calories will you eat? (1,000)
2. How much ice cream could you have? (1 cup/half a container)
3. How many grams of saturated fat would you be consuming each day? (33)
4. What percentage of your daily value of calories will you be eating? (10%)
5. Is it safe for you to eat this ice cream? (No)

+ Demographics
All Respondents (N=172)
Male 57%
Female 40%
Transgender 2%
Under 18 2%
18-24 7%
25-44 34%
45-64 51%
65+ 6%
Black 42%
White 44%
Other 14%
Hispanic 14%
Non-Hispanic 60%
Other 27%
8th Grade or Less 2%
Between 8th-12th Grade 40%
College 58%
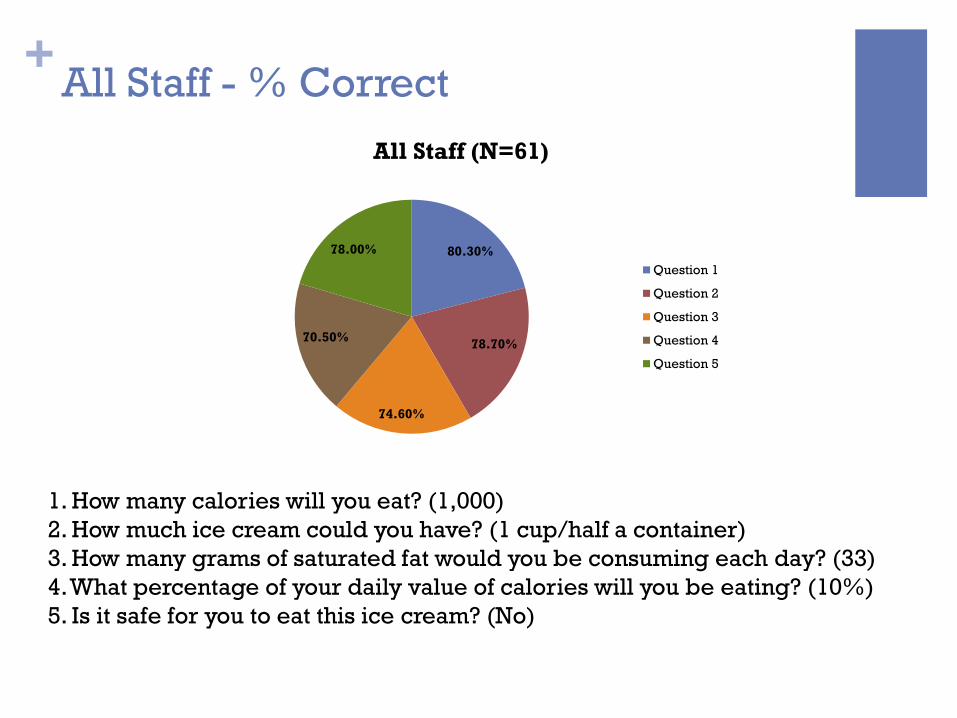
+ All Staff - % Correct
80.30%
78.70%
74.60%
70.50%
78.00%
All Staff (N=61)
Question 1
Question 2
Question 3
Question 4
Question 5
1. How many calories will you eat? (1,000)
2. How much ice cream could you have? (1 cup/half a container)
3. How many grams of saturated fat would you be consuming each day? (33)
4. What percentage of your daily value of calories will you be eating? (10%)
5. Is it safe for you to eat this ice cream? (No)

+ Demographics
All Staff (N=61)
Male 49%
Female 48%
Transgender 3%
Under 18 0%
18-24 9%
25-44 31%
45-64 46%
65+ 13%
Black 25%
White 62%
Other 13%
Hispanic 9%
Non-Hispanic 77%
Other 14%
8th Grade or Less 0%
Between 8th-12th Grade 13%
College 87%

+ All Clients - % Correct
61.80%
63.60%
54.60%
61.30%
60.00%
All Clients (N=111)
Question 1
Question 2
Question 3
Question 4
Question 5
1. How many calories will you eat? (1,000)
2. How much ice cream could you have? (1 cup/half a container)
3. How many grams of saturated fat would you be consuming each day? (33)
4. What percentage of your daily value of calories will you be eating? (10%)
5. Is it safe for you to eat this ice cream? (No)

+ Demographics
All Clients (N=111)
Male 62%
Female 37%
Transgender 2%
Under 18 3%
18-24 6%
25-44 35%
45-64 54%
65+ 2%
Black 51%
White 34%
Other 15%
Hispanic 17%
Non-Hispanic 50%
Other 33%
8th Grade or Less 3%
Between 8th-12th Grade 56%
College 41%

+
Clients and Staff
% Correct
and
Health Literacy Scores

+ Food Bank Providers and Clients
58.30%
66.70%
50.00%
58.30%
59.10%
FB Staff (N=24)
Question 1
Question 2
Question 3
Question 4
Question 5
60.00%
55.00%
50.00%
75.00%
75.00%
FB Clients (N=20)
Question 1
Question 2
Question 3
Question 4
Question 5
1. How many calories will you eat? (1,000)
2. How much ice cream could you have? (1 cup/half a container)
3. How many grams of saturated fat would you be consuming each day? (33)
4. What percentage of your daily value of calories will you be eating? (10%)
5. Is it safe for you to eat this ice cream? (No)

+ Food Bank Health Literacy Scores
10%
55%
35%
0%
10%
20%
30%
40%
50%
60%
Minimal Literacy Limited Literacy Adequate Literacy
FB Clients (N=20)
29%
25%
46%
0%
5%
10%
15%
20%
25%
30%
35%
40%
45%
50%
Minimal Literacy Limited Literacy Adequate Literacy
FB Staff (N=24)
• Score of 0-1 suggests high likelihood (50% or
more) of limited literacy.
• Score of 2-3 indicates the possibility of limited
literacy.
• Score of 4-6 almost always indicates adequate
literacy.

+ Food Bank Demographics
FB Client (N=20) FB Staff (N=24)
Male 85% 91%
Female 15% 9%
Transgender 0% 0%
Under 18 0% 0%
18-24 5% 0%
25-44 30% 8%
45-64 65% 58%
65+ 0% 33%
Black 55% 8%
White 35% 83%
Other 10% 8%
Hispanic 15% 13%
Non-Hispanic 55% 74%
Other 30% 13%
8th Grade or Less 0% 0%
Between 8th-12th Grade 45% 25%
College 55% 75%

+ CIED Providers and Clients
100%
90.90%
90.90%
72.70%
81.80%
CIED Staff (N=11)
Question 1
Question 2
Question 3
Question 4
Question 5
83.30%
90.90%
66.70%
75.00%
83.30%
CIED Client (N=12)
Question 1
Question 2
Question 3
Question 4
Question 5
1. How many calories will you eat? (1,000)
2. How much ice cream could you have? (1 cup/half a container)
3. How many grams of saturated fat would you be consuming each day? (33)
4. What percentage of your daily value of calories will you be eating? (10%)
5. Is it safe for you to eat this ice cream? (No)

+ CIED Health Literacy Scores
8%
25%
67%
0%
10%
20%
30%
40%
50%
60%
70%
80%
Minimal Literacy Limited Literacy Adequate Literacy
CIED Clients (N=12)
9%
0
91%
0%
10%
20%
30%
40%
50%
60%
70%
80%
90%
100%
Minimal Literacy Limited Literacy Adequate Literacy
CIED Staff (N=11)
• Score of 0-1 suggests high likelihood (50% or
more) of limited literacy.
• Score of 2-3 indicates the possibility of limited
literacy.
• Score of 4-6 almost always indicates adequate
literacy.

+ CIED Demographics
CIED Clients (N=12) CIED Staff (N=11)
Male 91% 18%
Female 0% 73%
Transgender 9% 9%
Under 18 0% 0%
18-24 0% 18%
25-44 58% 55%
45-64 42% 27%
65+ 0% 0%
Black 25% 27%
White 58% 46%
Other 17% 27%
Hispanic 8% 9%
Non-Hispanic 75% 64%
Other 17% 27%
8th Grade or Less 0% 0%
Between 8th-12th Grade 36% 9%
College 64% 91%

+ Pharmacy Providers and Clients
94.40%
83.30%
83.30%
83.30%
94.40%
Pharm Staff (N=18)
Question 1
Question 2
Question 3
Question 4
Question 5
56.90%
60.30%
51.40%
52.10%
49.30%
Pharm Clients (N=73)
Question 1
Question 2
Question 3
Question 4
Question 51. How many calories will you eat? (1,000)
2. How much ice cream could you have? (1 cup/half a container)
3. How many grams of saturated fat would you be consuming each day? (33)
4. What percentage of your daily value of calories will you be eating? (10%)
5. Is it safe for you to eat this ice cream? (No)
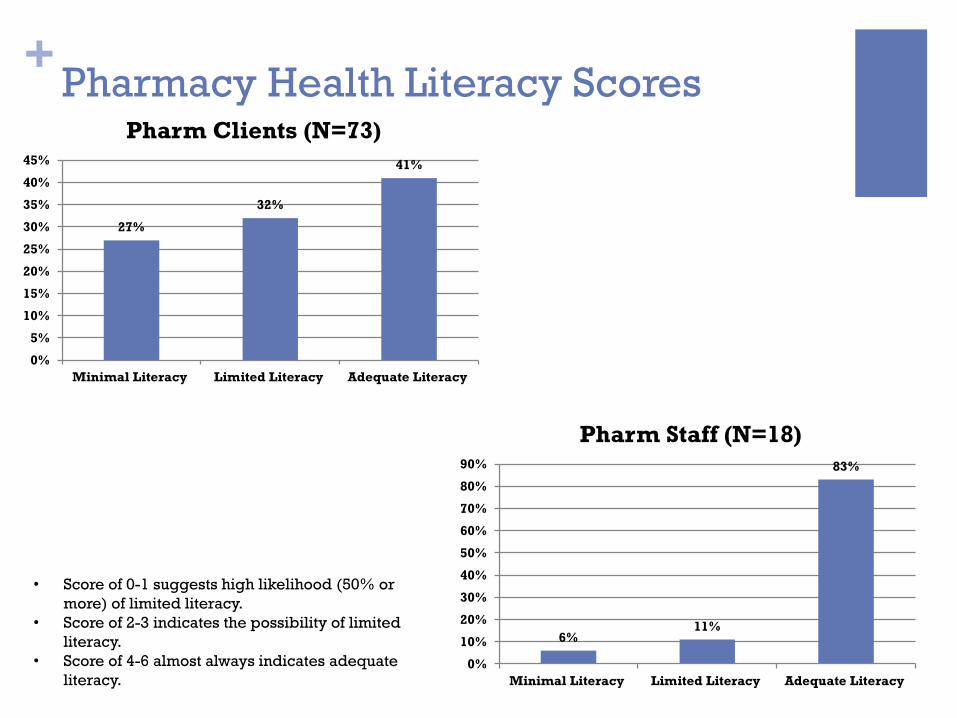
+ Pharmacy Health Literacy Scores
27%
32%
41%
0%
5%
10%
15%
20%
25%
30%
35%
40%
45%
Minimal Literacy Limited Literacy Adequate Literacy
Pharm Clients (N=73)
6% 11%
83%
0%
10%
20%
30%
40%
50%
60%
70%
80%
90%
Minimal Literacy Limited Literacy Adequate Literacy
Pharm Staff (N=18)
• Score of 0-1 suggests high likelihood (50% or
more) of limited literacy.
• Score of 2-3 indicates the possibility of limited
literacy.
• Score of 4-6 almost always indicates adequate
literacy.

+ Pharmacy Demographics
Pharm Client (N=73) Pharm Staff (N=18)
Male 47% 17%
Female 51% 78%
Transgender 1% 6%
Under 18 4% 0%
18-24 8% 11%
25-44 33% 28%
45-64 52% 61%
65+ 3% 0%
Black 56% 44%
White 30% 39%
Other 14% 17%
Hispanic 14% 6%
Non-Hispanic 45% 81%
Other 41% 13%
8th Grade or Less 4% 0%
Between 8th-12th Grade 66% 6%
College 30% 94%

+ Legal Aid Providers and Clients
87.50%
87.50%
100%
75.00%
87.50%
Legal Staff (N=8)
Question 1
Question 2
Question 3
Question 4
Question 5
83.30%
83.30%
83.30%
100%
83.30%
Legal Clients (N=6)
Question 1
Question 2
Question 3
Question 4
Question 5
1. How many calories will you eat? (1,000)
2. How much ice cream could you have? (1 cup/half a container)
3. How many grams of saturated fat would you be consuming each day? (33)
4. What percentage of your daily value of calories will you be eating? (10%)
5. Is it safe for you to eat this ice cream? (No)

+ Legal Aid Health Literacy Scores
0% 0%
100%
0%
10%
20%
30%
40%
50%
60%
70%
80%
90%
100%
Minimal Literacy Limited Literacy Adequate Literacy
Legal Clients (N=6)
0%
25%
75%
0%
10%
20%
30%
40%
50%
60%
70%
80%
Minimal Literacy Limited Literacy Adequate Literacy
Legal Staff (N=8)
• Score of 0-1 suggests high likelihood (50% or
more) of limited literacy.
• Score of 2-3 indicates the possibility of limited
literacy.
• Score of 4-6 almost always indicates adequate
literacy.

+ Legal Aid Demographics
Legal Client (N=6) Legal Staff (N=8)
Male 100% 50%
Female 0% 50%
Transgender 0% 0%
Under 18 0% 0%
18-24 0% 25%
25-44 33% 75%
45-64 67% 0%
65+ 0% 0%
Black 17% 25%
White 33% 75%
Other 50% 0%
Hispanic 67% 0%
Non-Hispanic 33% 100%
Other 0% 0%
8th Grade or Less 0% 0%
Between 8th-12th Grade 17% 0%
College 83% 100%

+ Summary and Discussion
All respondents:
Average 70% correct answers
58% college education
All Staff:
Average 76% correct answers
87% college education
All Clients:
Average 65% correct answers
56% 8-12 grade education
Largest difference in % answered correctly among Pharmacy staff and clients (87% vs.
54%)
Smallest difference in % answered correctly among Legal Aid staff and clients (87% and
86%)
Minimal literacy score highest among Food Bank staff and Pharmacy clients
Adequate literacy score highest among CIED staff and Legal Aid clients

NQC In+Care Retention Rates
1
IN+CARE CAMPAIGN RETENTION MEASURES
Gap Measure Percentage of patients, regardless of age, with a diagnosis of HIV/AIDS who did not have a medical visit with a provider with prescribing privileges in the last 6 months of the measurement year.
Medical Visit Frequency Percentage of patients, regardless of age, with a diagnosis of HIV/AIDS who had at least one medical visit with a provider with prescribing privileges in each 6-month period of the 24-month measurement period with a minimum of 60 days between medical visits.
Patients Newly Enrolled in Medical Care Percentage of patients, regardless of age, with a diagnosis of HIV/AIDS who were newly enrolled with a medical provider with prescribing privileges who had a medical visit in each of the 4-month periods in the measurement year.
Viral Load Suppression Percentage of patients, regardless of age, with a diagnosis of HIV/AIDS with a viral load less than 200 copies/mL at last viral load test during the measurement year.
DATA SUBMISSION DATES
Submission Due Date Measurement Year* 24 Month Measurement Period** 12/01/2011 10/01/2010 - 09/30/2011 10/01/2009 - 09/30/2011
02/01/2012 12/01/2010 - 11/30/2011 12/01/2009 - 11/30/2011
04/02/2012 02/01/2011 - 01/31/2012 02/01/2010 - 01/31/2012
06/01/2012 04/01/2011 - 03/31/2012 04/01/2010 - 03/31/2012
08/01/2012 06/01/2011 - 05/31/2012 06/01/2010 - 05/31/2012 10/01/2012 08/01/2011 - 07/31/2012 08/01/2010 - 07/31/2012
12/03/2012 10/01/2011 - 09/30/2012 10/01/2010 - 09/30/2012
02/01/2013 12/01/2011 - 11/30/2012 12/01/2010 – 11/30/2012
04/01/2013 02/01/2012 – 01/31/2013 02/01/2011 – 01/31/2013
06/03/2013 04/01/2012 – 03/31/2013 04/01/2011 – 03/31/2013
08/01/2013 06/01/2012 – 05/31/2013 06/01/2011 – 05/31/2013
10/01/2013 08/01/2012 – 07/31/2013 08/01/2011 – 07/31/2013
12/02/2013 10/01/2012 – 09/30/2013 10/01/2011 – 09/30/2013
*applies to the following measures: Gap Measure, Patients Newly Enrolled in Medical Care, and Viral Load Suppression ** applies to the Medical Visit Frequency measure

NQC In+Care Retention Rates
2
BROWARD COUNTY RATES
12.1.11 2.1.12 4.1.12 6.1.12 8.1.12 10.1.12 12.1.12 2.1.13 4.1.13 6.1.13 8.1.13 10.1.13
Gap Measure 30% 28% 22% 23% 23% 23% 22% 20% 19% 17% 18% 21%
Medical Visit Frequency 49% 47% 48% 49% 49% 51% 51% 52% 54% 56% 55% 55%
Patients Newly Enrolled in Medical Care
35% 44% 46% 41% 40% 47% 50% 53% 51% 54% 52% 46%
Viral Load Suppression 66% 67% 61% 61% 61% 62% 70% 70% 69% 68% 66% 71%

NQC In+Care Retention Rates
3
PART A BENCHMARK REPORT
GAP MEASURE
12.1.11 2.1.12 4.1.12 6.1.12 8.1.12 10.1.12 12.1.12 2.1.13 4.1.13 6.1.13 8.1.13 10.1.13
Broward 30% 28% 22% 23% 23% 23% 22% 20% 19% 17% 18% 21%
Average 16% 16% 15% 15% 14% 15% 15% 14% 14% 14% 17% 13%
Top 10% 3% 4% 3% 3% 3% 4% 3% 3% 3% 2% 2% 2%
Top 25% 6% 6% 6% 6% 6% 6% 6% 5% 5% 5% 4% 4%

NQC In+Care Retention Rates
4
PART A BENCHMARK REPORT
MEDICAL VISIT FREQUENCY
12.1.11 2.1.12 4.1.12 6.1.12 8.1.12 10.1.12 12.1.12 2.1.13 4.1.13 6.1.13 8.1.13 10.1.13
Broward 49% 47% 48% 49% 49% 51% 51% 52% 54% 56% 55% 55%
Average 63% 64% 63% 64% 65% 65% 65% 68% 69% 69% 66% 68%
Top 10% 93% 96% 93% 94% 94% 94% 94% 93% 95% 96% 94% 96%
Top 25% 85% 86% 86% 86% 86% 87% 88% 88% 89% 90% 91% 91%

NQC In+Care Retention Rates
5
PART A BENCHMARK REPORT
PATIENTS NEWLY ENROLLED IN MEDICAL CARE
12.1.11 2.1.12 4.1.12 6.1.12 8.1.12 10.1.12 12.1.12 2.1.13 4.1.13 6.1.13 8.1.13 10.1.13
Broward 35% 44% 46% 41% 40% 47% 50% 53% 51% 54% 52% 46%
Average 56% 58% 59% 60% 59% 55% 56% 58% 57% 52% 61% 62%
Top 10% 97% 98% 97% 94% 96% 100% 100% 96% 100% 100% 100% 100%
Top 25% 84% 84% 84% 85% 83% 89% 88% 80% 86% 88% 92% 88%

NQC In+Care Retention Rates
6
PART A BENCHMARK REPORT
VIRAL LOAD SUPPRESSION
12.1.11 2.1.12 4.1.12 6.1.12 8.1.12 10.1.12 12.1.12 2.1.13 4.1.13 6.1.13 8.1.13 10.1.13
Broward 66% 67% 61% 61% 61% 62% 70% 70% 69% 68% 66% 71%
Average 70% 70% 71% 72% 72% 72% 72% 72% 72% 72% 71% 73%
Top 10% 86% 87% 87% 87% 88% 88% 88% 87% 88% 88% 88% 89%
Top 25% 82% 83% 83% 83% 84% 84% 84% 84% 85% 85% 85% 86%

Table 20. Checklist for patient understanding
At the end of each office visit, a patient should be able to answer the following questions.
• What is my main problem?
• What do I need to do (about the problem)?
• Why is it important for me to do this?
• Where do I go for tests, medicine, and appointments?
• How should I take my medicine?
- When do I take it?- What will it do?- How do I know if it is working?- Whom and when do I call if I have questions?
• Other instructions
- What to do?- How to do it?- When to do it?
• Next steps
- When do I need to be seen again?- Do I have another appointment? If so, what is the date and time of the appointment? - Are there phone numbers to call?
�� Health literacy and patient safety: Help patients understand
} The Ask-Me-3 questions

Total
TOTAL 207 4% 1,128 22% 650 13% 3,132 61% 5,121
Female Total
Female Total 57 4% 406 27% 166 11% 884 58% 1,513
Black 52 4% 350 28% 132 11% 696 57% 1230
White 5 2% 52 19% 30 11% 184 68% 271
Other 0 0% 4 33% 4 33% 4 33% 12
Non-Hispanic 55 4% 375 27% 150 11% 796 58% 1,376
Hispanic 2 1% 31 23% 16 12% 88 64% 137
Male Total
Male Total 149 4% 715 20% 481 13% 2,231 62% 3,580
Black 79 5% 378 24% 196 12% 921 58% 1576
White 69 4% 326 17% 282 14% 1287 65% 1966
Other 1 3% 11 29% 3 8% 23 61% 38
Non-Hispanic 132 5% 592 21% 391 14% 1,756 61% 2,875
Hispanic 17 2% 123 17% 90 13% 475 67% 705
Transgender Male to Female Total
Transgender Male to Female Total 0 0% 7 28% 3 12% 15 60% 25
Black 0 0% 4 25% 3 19% 9 56% 16
White 0 0% 3 38% 0 0% 5 63% 8
Other 0 0% 0 0% 0 0% 1 100% 1
Non-Hispanic 0 0% 5 24% 3 14% 13 62% 21
Hispanic 0 0% 2 50% 0 0% 2 50% 4
Age Total
18-24 23 7% 142 42% 35 10% 140 41% 340
29-38 44 6% 240 31% 100 13% 391 50% 775
39-48 78 5% 356 23% 191 12% 933 60% 1,558
49-58 56 3% 301 16% 245 13% 1,226 67% 1,829
>/=59 6 1% 89 14% 79 13% 442 71% 619
Sexual Orientation Total
Bisexual 11 5% 61 25% 36 15% 135 55% 244
Heterosexual 115 4% 684 24% 332 12% 1,701 60% 2,834
Homosexual 80 4% 372 19% 276 14% 1,263 63% 1,992
Lesbian 0 0% 3 25% 2 17% 7 58% 12
Risk Total
Hemophila 1 6% 2 12% 3 18% 11 65% 17
Hetero 103 4% 635 24% 308 12% 1,612 61% 2,660
IDU 3 3% 24 23% 14 13% 63 61% 104
Mother 3 6% 24 48% 7 14% 16 32% 50
MSM 92 4% 418 19% 305 14% 1,387 63% 2,204
MSM/IDU 0 0% 8 32% 6 24% 11 44% 25
Transfusion 0 0% 3 14% 5 24% 13 62% 21
HIV Therapy Total
HAART 140 3% 747 18% 568 13% 2,799 66% 4,258
Dual 5 3% 32 20% 17 11% 107 66% 161
Single 2 4% 10 20% 6 12% 33 65% 51
None 58 10% 316 53% 56 9% 166 28% 596
Education Level Total
8th Grade or Less 16 4% 86 24% 40 11% 218 60% 363
Between 8th-12th Grade 132 4% 729 23% 407 13% 1,909 60% 3,177
College 59 4% 309 20% 203 13% 1,002 64% 1,574
Living Arrangement Total
Institution 3 7% 18 44% 3 7% 17 41% 41
Non-permanent 67 6% 320 29% 146 13% 583 52% 1,117
Permanent Housing 137 3% 782 20% 500 13% 2,526 64% 3,948
Literacy Total
Level 0- Illiterate 1 4% 6 26% 4 17% 12 52% 23
Level 1 - 4th Grade or Below 1 1% 17 21% 9 11% 52 65% 80
Level 2 - 5th-8th Grade 16 4% 80 22% 40 11% 232 63% 370
Level 3 - 9th-12th Grade 112 4% 600 23% 312 12% 1,533 60% 2,557
Level 4 - >12th Grade 76 4% 417 20% 284 14% 1,294 62% 2,072
HIV Stage Total
AIDS 0 0% 2 50% 0 0% 2 50% 4
HIV Indeterminate 32 6% 118 20% 74 13% 351 61% 576
HIV /AIDS Status Unknown 1 33% 1 33% 1 33% 0 0% 3
HIV Positive Not AIDS 35 3% 287 23% 157 13% 757 61% 1,239
Suppressed
Part A CIED Viral Load Anaylsis - 03/01/12 - 02/28/13 (n=5,121)
High VL Not Suppressed Suppressed Undetectable
High VL Not Suppressed Suppressed Undetectable
Suppressed
Not Suppressed Suppressed Undetectable
High VL
High VL Not Suppressed Suppressed Undetectable
Undetectable
Undetectable
High VL Not Suppressed Suppressed Undetectable
High VL Not Suppressed Suppressed Undetectable
Not Suppressed
High VL Not Suppressed Undetectable
High VL Not Suppressed Suppressed Undetectable
High VL Not Suppressed Suppressed
High VL Not Suppressed Suppressed Undetectable
High VL Not Suppressed Suppressed Undetectable
High VL

Total
TOTAL 72 4% 383 22% 216 13% 1,035 61% 1,706
Female Total
Female Total 21 4% 124 25% 55 11% 305 60% 505
Black 16 4% 107 27% 45 11% 233 58% 401
White 5 5% 17 17% 9 9% 72 70% 103
Other 0 0% 0 0% 1 100% 0 0% 1
Non-Hispanic 20 4% 118 25% 50 11% 277 60% 465
Hispanic 1 3% 6 15% 5 13% 28 70% 40
Male Total
Male Total 51 4% 256 21% 161 13% 725 61% 1,193
Black 24 5% 128 25% 67 13% 287 57% 506
White 26 4% 125 18% 94 14% 435 64% 680
Other 1 14% 3 43% 0 0% 3 43% 7
Non-Hispanic 46 5% 219 22% 142 14% 577 59% 984
Hispanic 5 2% 37 18% 19 9% 148 71% 209
Transgender Male to Female Total
Transgender Male to Female Total 0 0% 3 38% 0 0% 5 63% 8
Black 0 0% 2 33% 0 0% 4 67% 6
White 0 0% 1 50% 0 0% 1 50% 2
Non-Hispanic 0 0% 2 33% 0 0% 4 67% 6
Hispanic 0 0% 1 50% 0 0% 1 50% 2
Age Total
18-24 5 8% 25 40% 4 6% 28 45% 62
29-38 13 7% 53 28% 25 13% 96 51% 187
39-48 31 6% 141 27% 54 10% 290 56% 516
49-58 22 3% 129 18% 103 15% 455 64% 709
>/=59 1 0% 35 15% 30 13% 166 72% 232
Sexual Orientation Total
Bisexual 3 3% 24 26% 12 13% 54 58% 93
Heterosexual 37 4% 229 25% 105 11% 558 60% 929
Homosexual 32 5% 129 19% 95 14% 411 62% 667
Lesbian 0 0% 1 25% 1 25% 2 50% 4
HIV Stage Total
AIDS 11 5% 54 24% 27 12% 137 60% 229
HIV+ Not AIDS 49 5% 236 22% 136 13% 654 61% 1,075
Risk Total
Hemophila 1 20% 0 0% 1 20% 3 60% 5
Hetero 33 4% 219 25% 99 11% 534 60% 885
IDU 2 4% 12 24% 4 8% 31 63% 49
Mother 1 13% 1 13% 1 13% 5 63% 8
MSM 35 5% 143 20% 107 15% 448 61% 733
MSM/IDU 0 0% 6 50% 2 17% 4 33% 12
Transfusion 0 0% 1 13% 2 25% 5 63% 8
HIV Therapy Total
HAART 54 4% 281 19% 195 14% 912 63% 1,442
Dual 2 4% 11 20% 6 11% 37 66% 56
Single 0 0% 5 23% 1 5% 16 73% 22
None 15 9% 82 49% 13 8% 59 35% 169
Education Level Total
8th Grade or Less 6 6% 25 24% 6 6% 69 65% 106
Between 8th-12th Grade 55 5% 263 23% 144 13% 661 59% 1,123
College 11 2% 95 20% 66 14% 305 64% 477
Living Arrangement Total
Institution 2 15% 6 46% 0 0% 5 38% 13
Non-permanent 27 7% 114 30% 45 12% 198 52% 384
Permanent Housing 43 3% 263 20% 171 13% 832 64% 1,309
Literacy Total
Level 0- Illiterate 1 17% 1 17% 1 17% 3 50% 6
Level 1 - 4th Grade or Below 1 5% 6 32% 1 5% 11 58% 19
Level 2 - 5th-8th Grade 7 5% 30 22% 13 10% 85 63% 135
Level 3 - 9th-12th Grade 47 5% 217 24% 102 11% 526 59% 892
Level 4 - >12th Grade 16 2% 129 20% 98 15% 407 63% 650
High VL Not Suppressed Suppressed Undetectable
High VL Not Suppressed Suppressed Undetectable
High VL Not Suppressed Suppressed Undetectable
High VL Not Suppressed Suppressed Undetectable
High VL Not Suppressed Suppressed Undetectable
Undetectable
High VL Not Suppressed Suppressed Undetectable
High VL Not Suppressed Suppressed Undetectable
Not Suppressed Suppressed Undetectable
High VL Not Suppressed Suppressed Undetectable
High VL Not Suppressed Suppressed
High VL Not Suppressed Suppressed Undetectable
Part A Food Bank Viral Load Analysis - 03/01/12 - 02/28/13 (n=1,706)
High VL Not Suppressed Suppressed Undetectable
High VL

Total
TOTAL 9 12% 37 50% 7 9% 21 28 74
Female Total
Female Total 4 33% 6 50% 1 8% 1 8% 12
Black 4 33% 6 50% 1 8% 1 8% 12
Non-Hispanic 4 33% 6 50% 1 8% 1 8% 12
Black Non-Hispanic 4 33% 6 50% 1 8% 1 8% 12
Male Total
Male Total 5 8% 29 48% 6 10% 20 33% 60
Black 1 4% 11 48% 3 13% 8 35% 23
White 4 11% 18 49% 3 8% 12 32% 37
Non-Hispanic 5 10% 23 47% 5 10% 16 33% 49
Hispanic 0 0% 6 55% 1 9% 4 36% 11
Transgender Male to Female Total
Transgender Male to Female Total 0 0% 2 100% 0 0% 0 0% 2
White 0 0% 2 100% 0 0% 0 0% 2
Non-Hispanic 0 0% 1 100% 0 0% 0 0% 1
Hispanic 0 0% 1 100% 0 0% 0 0% 1
Age Total
18-24 1 6% 12 71% 0 0% 4 24% 17
29-38 4 22% 7 39% 3 17% 4 22% 18
39-48 4 17% 11 46% 1 4% 8 33% 24
49-58 0 0% 5 38% 3 23% 5 38% 13
>/=59 0 0% 2 100% 0 0% 0 0% 2
Sexual Orientation Total
Bisexual 1 17% 2 33% 1 17% 2 33% 6
Heterosexual 4 19% 12 57% 2 10% 3 14% 21
Homosexual 4 9% 21 47% 4 9% 16 36% 45
Risk Total
Hetero 4 19% 12 57% 2 10% 3 14% 21
IDU 0 0% 1 100% 0 0% 0 0% 1
MSM 5 10% 24 46% 5 10% 18 35% 52
HIV Therapy Total
HAART 2 6% 14 45% 3 10% 12 39% 31
Dual 0 0% 2 50% 1 25% 1 25% 4
Single 0 0% 0 0% 0 0% 2 100% 2
None 6 18% 19 58% 3 9% 5 15% 33
Education Level Total
8th Grade or Less 0 0% 2 100% 0 0% 0 0% 2
Between 8th-12th Grade 6 15% 20 49% 4 10% 11 27% 41
College 3 10% 15 48% 3 10% 10 32% 31
Living Arrangement Total
Non-permanent 4 13% 20 65% 1 3% 6 19% 31
Permanent Housing 5 12% 16 38% 6 14% 15 36% 42
Literacy Total
Level 2 - 5th-8th Grade 0 0% 1 100% 0 0% 0 0% 1
Level 3 - 9th-12th Grade 5 18% 14 50% 1 4% 8 29% 28
Level 4 - >12th Grade 4 9% 21 48% 6 14% 13 30% 44
HIV Stage Total
HIV/AIDS Status Unknown 1 7% 7 50% 2 14% 4 29% 14
HIV Positive Not AIDS 8 13% 30 50% 5 8% 17 28% 60
Suppressed Undetectable
Part A Outreach Viral Load Analysis - 03/01/12 - 02/28/13 (n=74)
High VL Not Suppressed Suppressed Undetectable
High VL Not Suppressed Suppressed
High VL Not Suppressed Suppressed Undetectable
High VL
High VL Not Suppressed Suppressed Undetectable
Not Suppressed
Undetectable
High VL Not Suppressed Suppressed Undetectable
High VL Not Suppressed Suppressed Undetectable
Not Suppressed Suppressed Undetectable
High VL Not Suppressed Suppressed Undetectable
High VL Not Suppressed Suppressed
Undetectable
High VL Not Suppressed Suppressed Undetectable
High VL Not Suppressed Suppressed Undetectable
High VL

Total
TOTAL 10 6% 37 23% 22 14% 92 57% 161
Female Total
Female Total 4 11% 10 26% 6 16% 18 47% 38
Black 1 4% 8 31% 4 15% 13 50% 26
White 3 25% 2 17% 2 17% 5 42% 12
Non-Hispanic 3 9% 9 28% 4 13% 16 50% 32
Hispanic 1 17% 1 17% 2 33% 2 33% 6
Male Total
Male Total 6 5% 27 22% 15 12% 74 61% 122
Black 5 11% 14 30% 7 15% 21 45% 47
White 1 1% 12 17% 8 11% 51 71% 72
Other 0 0% 1 33% 0 0% 2 67% 3
Non-Hispanic 4 5% 20 23% 12 14% 52 59% 88
Hispanic 2 6% 7 21% 3 9% 22 65% 34
Transgender Male to Female Total
Transgender Male to Female Total 0 0% 0 0% 1 100% 0 0% 1
Black 0 0% 0 0% 1 100% 0 0% 1
Non-Hispanic 0 0% 0 0% 1 100% 0 0% 1
Age Total
18-24 0 0% 0 0% 1 17% 5 83% 6
29-38 2 15% 4 31% 1 8% 6 46% 13
39-48 5 9% 16 30% 9 17% 24 44% 54
49-58 3 4% 15 20% 9 12% 49 64% 76
>/=59 0 0% 2 17% 2 17% 8 67% 12
Sexual Orientation Total
Bisexual 0 0% 2 33% 2 33% 2 33% 6
Heterosexual 8 11% 23 30% 11 14% 34 45% 76
Homosexual 2 3% 12 15% 9 12% 55 71% 78
Lesbian 0 0% 0 0% 0 0% 1 100% 1
Risk Total
Hemophila 0 0% 0 0% 0 0% 1 100% 1
Hetero 7 10% 23 32% 11 15% 32 44% 73
IDU 0 0% 0 0% 1 33% 2 67% 3
Mother 0 0 0 0% 0 0% 1 100% 1
MSM 2 0 13 16% 10 13% 55 69% 80
MSM/IDU 0 0 0 0% 0 0% 1 100% 1
HIV Therapy Total
HAART 6 4% 32 24% 18 13% 78 58% 134
Dual 0 0% 0 0% 1 11% 8 89% 9
Single 0 0% 1 100% 0 0% 0 0% 1
None 3 20% 4 27% 3 20% 5 33% 15
Education Level Total
8th Grade or Less 0 0% 4 80% 1 20% 0 0% 5
Between 8th-12th Grade 8 8% 26 25% 15 14% 55 53% 104
College 2 4% 7 13% 6 12% 37 71% 52
Living Arrangement Total
Institution 0 0% 1 50% 0 0% 1 50% 2
Non-permanent 5 14% 8 22% 9 25% 14 39% 36
Permanent Housing 5 4% 28 23% 13 11% 77 63% 123
Literacy Total
Level 1 - 4th Grade or Below 0 0% 1 100% 0 0% 0 0% 1
Level 2 - 5th-8th Grade 0 0% 3 60% 0 0% 2 40% 5
Level 3 - 9th-12th Grade 8 10% 21 26% 12 15% 40 49% 81
Level 4 - >12th Grade 2 3% 12 16% 10 14% 50 68% 74
HIV Stage Total
AIDS 2 10% 5 25% 2 10% 11 55% 20
HIV/AIDS Status Unknown 1 4% 6 21% 5 18% 16 57% 28
HIV Positive Not AIDS 7 6% 26 23% 15 13% 65 58% 113
Not Suppressed Suppressed Undetectable
High VL Not Suppressed Suppressed Undetectable
High VL Not Suppressed Suppressed Undetectable
Part A Legal Viral Load Analysis - 03/01/12 - 02/28/13 (n=161)
High VL Not Suppressed Suppressed Undetectable
High VL
High VL Not Suppressed Suppressed Undetectable
High VL Not Suppressed Suppressed Undetectable
High VL Not Suppressed Suppressed Undetectable
High VL Not Suppressed Suppressed Undetectable
Suppressed Undetectable
High VL Not Suppressed Suppressed Undetectable
High VL Not Suppressed Suppressed Undetectable
High VL Not Suppressed Suppressed Undetectable
High VL Not Suppressed

Total
TOTAL 88 4% 452 18% 353 14% 1,612 64% 2,508Female Total
Female Total 21 3% 173 21% 98 12% 514 64% 806
Black 21 3% 147 22% 79 12% 407 62% 654
White 0 0% 24 17% 17 12% 103 72% 144
Other 0 0% 2 25% 2 25% 4 50% 8
Non-Hispanic 20 3% 162 22% 91 12% 460 63% 733
Hispanic 1 1% 11 15% 7 10% 54 74% 73
Male Total
Male Total 67 4% 278 16% 254 15% 1,090 64% 1,692
Black 38 5% 157 21% 109 14% 451 60% 757
White 28 3% 119 13% 143 16% 630 68% 921
Other 1 7% 2 14% 2 14% 9 64% 14
Non-Hispanic 59 4% 225 17% 212 16% 814 62% 1,313
Hispanic 8 2% 53 14% 42 11% 276 73% 379
Transgender Male to Female Total
Transgender Male to Female Total 0 0% 1 10% 1 10% 8 80% 10
Black 0 0% 0 0% 1 14% 6 86% 7
White 0 0% 1 50% 0 0% 1 50% 2
Other 0 0% 0 0% 0 0% 1 100% 1
Non-Hispanic 0 0% 0 0% 1 11% 8 89% 9
Hispanic 0 0% 1 100% 0 0% 0 0% 1
Age Total
18-24 6 5% 45 36% 17 13% 58 46% 126
29-38 17 5% 89 25% 50 14% 196 56% 352
39-48 33 4% 148 18% 105 13% 540 65% 826
49-58 29 3% 135 15% 135 15% 630 68% 930
>/=59 3 1% 35 13% 46 17% 188 69% 274
Sexual Orientation Total
Bisexual 6 5% 27 21% 20 16% 72 57% 126
Heterosexual 48 3% 304 20% 200 13% 945 63% 1,499
Homosexual 33 4% 120 14% 128 15% 578 67% 859
Lesbian 0 0% 0 0% 2 29% 5 71% 7
Risk Total
Hemophila 1 11% 1 11% 2 22% 5 56% 9
Hetero 45 3% 282 20% 190 13% 903 64% 1,422
IDU 2 5% 6 14% 6 14% 30 68% 44
Mother 0 0% 8 42% 4 21% 7 37% 19
MSM 39 4% 144 15% 143 15% 649 66% 976
MSM/IDU 0 0% 6 35% 3 18% 8 47% 17
Transfusion 0 0% 2 18% 3 27% 6 55% 11
HIV Therapy Total
HAART 61 3% 341 16% 311 14% 1,482 67% 2,198
Dual 0 0% 9 15% 7 11% 45 74% 61
Single 1 4% 3 13% 2 9% 17 74% 23
None 26 12% 92 44% 32 15% 61 29% 211
Education Level Total
8th Grade or Less 9 5% 43 22% 27 14% 117 59% 199
Between 8th-12th Grade 55 3% 305 19% 228 14% 1,005 63% 1,593
College 24 3% 103 14% 98 14% 490 69% 715
Living Arrangement Total
Institution 1 5% 10 50% 2 10% 7 35% 20
Non-permanent 31 5% 146 24% 93 15% 344 56% 615
Permanent Housing 56 3% 296 16% 258 14% 1,258 67% 1,870
Literacy Total
Level 0- Illiterate 1 8% 2 15% 2 15% 8 62% 13
Level 1 - 4th Grade or Below 1 2% 11 24% 5 11% 28 61% 46
Level 2 - 5th-8th Grade 7 3% 37 18% 30 15% 128 63% 204
Level 3 - 9th-12th Grade 46 4% 260 20% 178 14% 809 63% 1,293
Level 4 - >12th Grade 33 3% 141 15% 138 15% 638 67% 950
HIV Stage Total
AIDS 11 4% 48 19% 38 15% 155 61% 253
HIV Indeterminate 1 50% 0 0% 1 50% 0 0% 2
HIV/AIDS Status Unknown 18 3% 119 18% 102 16% 412 63% 653
HIV Positive Not AIDS 58 4% 285 18% 212 13% 1,045 65% 1,600
Part A AIDS Pharmaceutical Assistance Viral Load Analysis - 03/01/12 - 02/28/13 (n=2,508)
High VL Not Suppressed Suppressed Undetectable
High VL Not Suppressed Suppressed Undetectable
High VL
Undetectable
High VL Not Suppressed Suppressed Undetectable
High VL Not Suppressed Suppressed Undetectable
Not Suppressed Suppressed Undetectable
High VL Not Suppressed Suppressed Undetectable
High VL Not Suppressed Suppressed
Undetectable
High VL Not Suppressed Suppressed Undetectable
High VL Not Suppressed Suppressed Undetectable
High VL
Not Suppressed Suppressed Undetectable
High VL Not Suppressed Suppressed Undetectable
High VL Not Suppressed Suppressed

Total
TOTAL 227 4% 1,210 22% 698 13% 3,279 61% 5,419
Female Total
Female Total 62 4% 430 27% 178 11% 918 58% 1,588
Black 53 85% 372 87% 141 79% 725 79% 81%
White 9 15% 54 13% 33 19% 188 20% 18%
Non-Hispanic 59 95% 398 93% 160 90% 825 90% 91%
Hispanic 3 5% 32 7% 18 10% 93 10% 9%
Male Total
Male Total 163 4% 770 20% 517 14% 2,343 62% 3,798
Black 87 53% 409 53% 209 40% 966 41% 44%
White 75 46% 350 45% 305 59% 1,353 58% 55%
Other 1 1% 11 1% 3 1% 24 1% 1%
Non-Hispanic 143 88% 643 84% 420 81% 1,850 79% 80%
Hispanic 20 12% 127 16% 97 19% 493 21% 19%
Transgender Total
Transgender Total 1 3% 10 33% 3 10% 16 53% 30
Black 1 100% 5 50% 3 100% 9 56% 60%
White 0 0% 5 50% 0 0% 6 38% 37%
Non-Hispanic 1 100% 6 60% 3 100% 14 0% 80%
Hispanic 0 0% 4 40% 0 0% 2 13% 20%
Age Total
18-24 24 11% 156 13% 36 5% 149 5% 7%
29-38 47 21% 257 21% 110 16% 410 13% 15%
39-48 84 37% 389 32% 204 29% 974 30% 30%
49-58 66 29% 314 26% 266 38% 1,283 39% 36%
>/=59 6 3% 94 8% 82 12% 463 14% 12%
Sexual Orientation Total
Bisexual 11 5% 69 6% 38 5% 148 5% 5%
Heterosexual 126 56% 729 60% 355 51% 1,776 54% 55%
Homosexual (MSM/WSW) 89 39% 403 33% 301 43% 1,328 41% 39%
Risk Total
Hemophila 1 0% 2 0% 3 0% 12 0% 0%
Hetero 114 50% 677 56% 331 47% 1,680 51% 52%
IDU 3 1% 24 2% 14 2% 71 2% 2%
Mother 3 1% 26 2% 7 1% 17 1% 1%
MSM 101 44% 454 38% 330 47% 1,454 44% 43%
MSM/IDU 0 0% 10 1% 6 1% 12 0% 1%
HIV Therapy Total
HAART 158 70% 800 66% 614 88% 2,926 90% 83%
Dual 5 2% 34 3% 17 2% 114 3% 3%
Single 2 1% 11 1% 6 1% 37 1% 1%
None 60 26% 341 28% 57 8% 174 5% 12%
Education Level Total
8th Grade or Less 19 8% 92 8% 42 6% 228 7% 7%
Between 8th-12th Grade 145 64% 787 65% 435 62% 1,996 61% 62%
College 63 28% 327 27% 221 32% 1,052 32% 31%
Living Arrangement Total
Institution 3 1% 23 2% 3 0% 17 1% 1%
Non-permanent 75 33% 348 29% 151 22% 625 19% 22%
Permanent Housing 149 66% 830 69% 543 78% 2,631 80% 77%
HIV Stage Total
AIDS 36 16% 134 11% 84 12% 370 11% 12%
HIV Indeterminate 1 0% 1 0% 1 0% 0 0% 0%
HIV/AIDS Status
Unkown
45 20% 311 26% 174 25% 791 24% 24%
HIV Not AIDS 145 64% 762 63% 439 63% 2,117 65% 64%
High VL Not Suppressed Suppressed Undetectable
High VL Not Suppressed Suppressed Undetectable
High VL Not Suppressed Suppressed Undetectable
High VL Not Suppressed Suppressed Undetectable
High VL Not Suppressed Suppressed Undetectable
High VL Not Suppressed Suppressed Undetectable
High VL Not Suppressed Suppressed Undetectable
High VL Not Suppressed Suppressed Undetectable
High VL Not Suppressed Suppressed Undetectable
Suppressed Undetectable
High VL Not Suppressed Suppressed Undetectable
Suppressed Detectable VL: Viral Load >50 and < / =200
Undetecetable VL: Viral Load is < / = 50
Not Suppressed VL: Viral Load >200 and < 100,000
High VL: Viral Load is > / = 100,000
High VL Not Suppressed
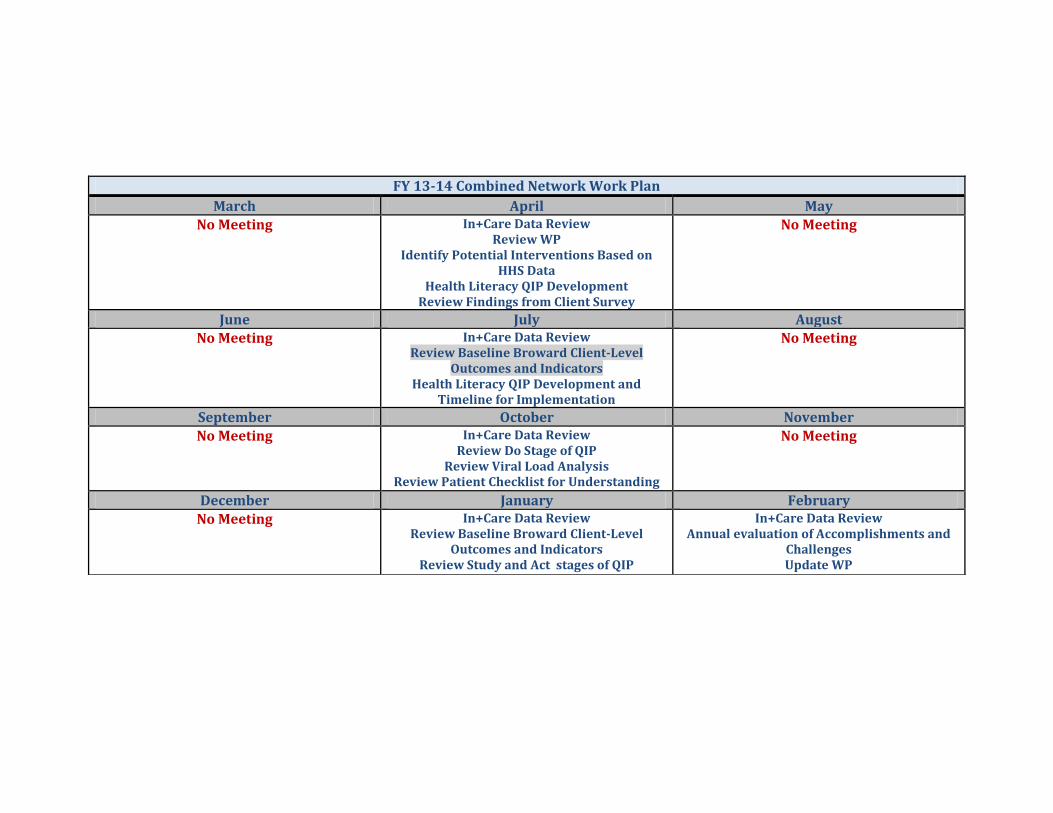
FY 13-14 Combined Network Work Plan
March April May
No Meeting
In+Care Data Review Review WP
Identify Potential Interventions Based on HHS Data
Health Literacy QIP Development Review Findings from Client Survey
No Meeting
June July August
No Meeting
In+Care Data Review Review Baseline Broward Client-Level
Outcomes and Indicators Health Literacy QIP Development and
Timeline for Implementation
No Meeting
September October November
No Meeting
In+Care Data Review Review Do Stage of QIP
Review Viral Load Analysis Review Patient Checklist for Understanding
No Meeting
December January February
No Meeting
In+Care Data Review Review Baseline Broward Client-Level
Outcomes and Indicators Review Study and Act stages of QIP
In+Care Data Review Annual evaluation of Accomplishments and
Challenges Update WP