combined outcomes measures - st. john's university · licensure examination pass rates exam...
TRANSCRIPT

REPOSITIONING THE STRATEGIC PLAN
2011-2014
Combined Outcomes
Measures
December 2012
APPENDIX: VALUE OF A ST. JOHN'S EDUCATIONINDICATORS/MEASURES
TABLE OF CONTENTS
1. QUALITY EDUCATION AND EXPERIENCE 4. GLOBAL AWARENESS/DIVERSITYa. Retention Rates a. Study Abroadb. Graduation Rates b. International Studentsc. Student and Alumni Perceptions c. Diversity Rankingsd. Licensure Examination Pass Rates 5. Financial Resourcese. Academic Rankings a. Net Assets/Endowmentf. Accreditation b. Net Tuition/Discountg. Assessment of the Core c. Strategic Revenues Growth
2. INTERNSHIPS, JOB PLACEMENT, AND FURTHER EDUCATION d. Debt Measuresa. Internships e. Enrollmentb Job Placement and Further Education f External Transfers/Very High Needs Studentsb. Job Placement and Further Education f. External Transfers/Very High Needs Students
3. MISSION / SERVICE / VALUES / ETHICS g Admissionsa. Academic Service Learning h. Financial Aidb. Vibrant Faith Community 6. INSTITUTIONAL ADVANCEMENTc. Student/Alumni Perceptions a. Gifts and Donorsd. Third Party Endorsements b. New Pledges/Athletics
c. Alumni Giving Rated. Alumni Donors/Graduate
7. Accreditation Updatea. Accreditation Update
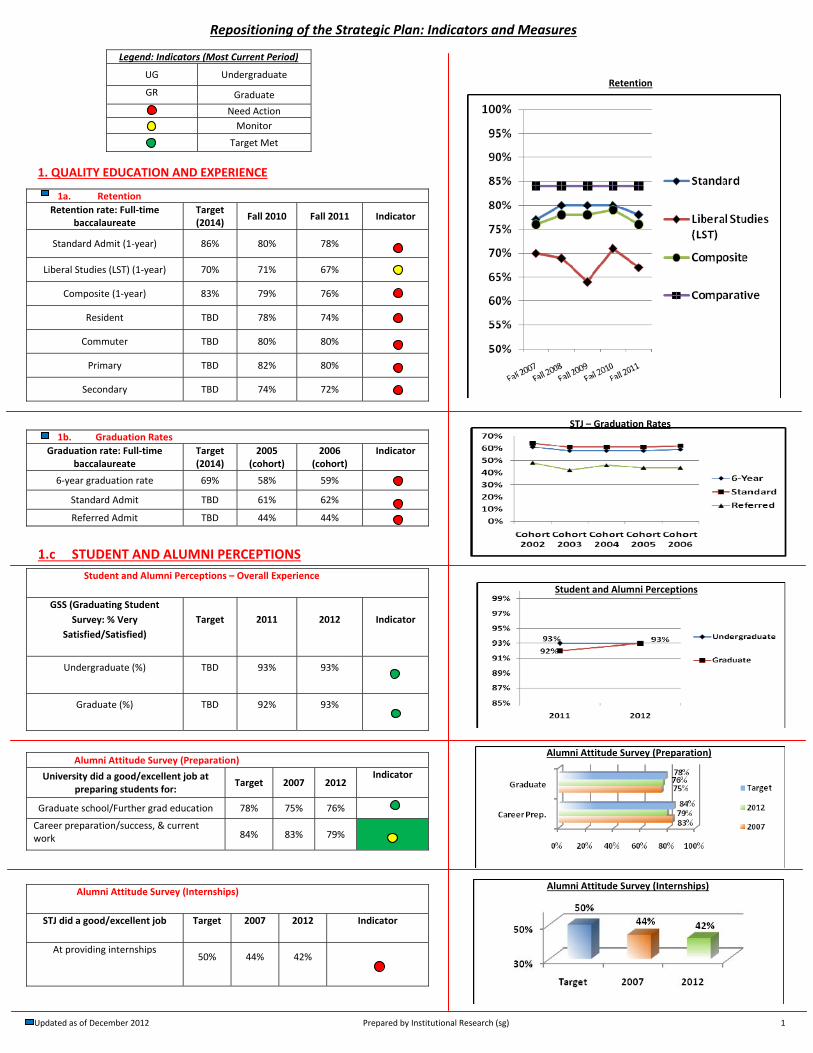
1a. Retention
Retention rate: Full‐time baccalaureate
Target (2014)
Fall 2010 Fall 2011 Indicator
Standard Admit (1‐year) 86% 80% 78%
Liberal Studies (LST) (1‐year) 70% 71% 67%
Composite (1‐year) 83% 79% 76%
Resident TBD 78% 74%
Commuter TBD 80% 80%
Primary TBD 82% 80%
Secondary TBD 74% 72%
1b. Graduation Rates
Graduation rate: Full‐time baccalaureate
Target (2014)
2005 (cohort)
2006(cohort)
Indicator
6‐year graduation rate 69% 58% 59%
Standard Admit TBD 61% 62%
Referred Admit TBD 44% 44%
Alumni Attitude Survey (Preparation)
University did a good/excellent job at preparing students for:
Target 2007 2012 Indicator
Graduate school/Further grad education 78% 75% 76%
Career preparation/success, & current work 84% 83% 79%
Alumni Attitude Survey (Internships)
STJ did a good/excellent job Target 2007 2012 Indicator
At providing internships 50% 44% 42%
Legend: Indicators (Most Current Period)
UG Undergraduate
GR Graduate
Need Action
Monitor
Target Met
Student and Alumni Perceptions – Overall Experience
GSS (Graduating Student
Survey: % Very
Satisfied/Satisfied)
Target 2011 2012 Indicator
Undergraduate (%) TBD 93% 93%
Graduate (%) TBD 92% 93%
Repositioning of the Strategic Plan: Indicators and Measures
1. QUALITY EDUCATION AND EXPERIENCE
1.c STUDENT AND ALUMNI PERCEPTIONS
Retention
Alumni Attitude Survey (Preparation)
Updated as of December 2012 Prepared by Institutional Research (sg) 1
Alumni Attitude Survey (Internships)
Student and Alumni Perceptions
STJ – Graduation Rates
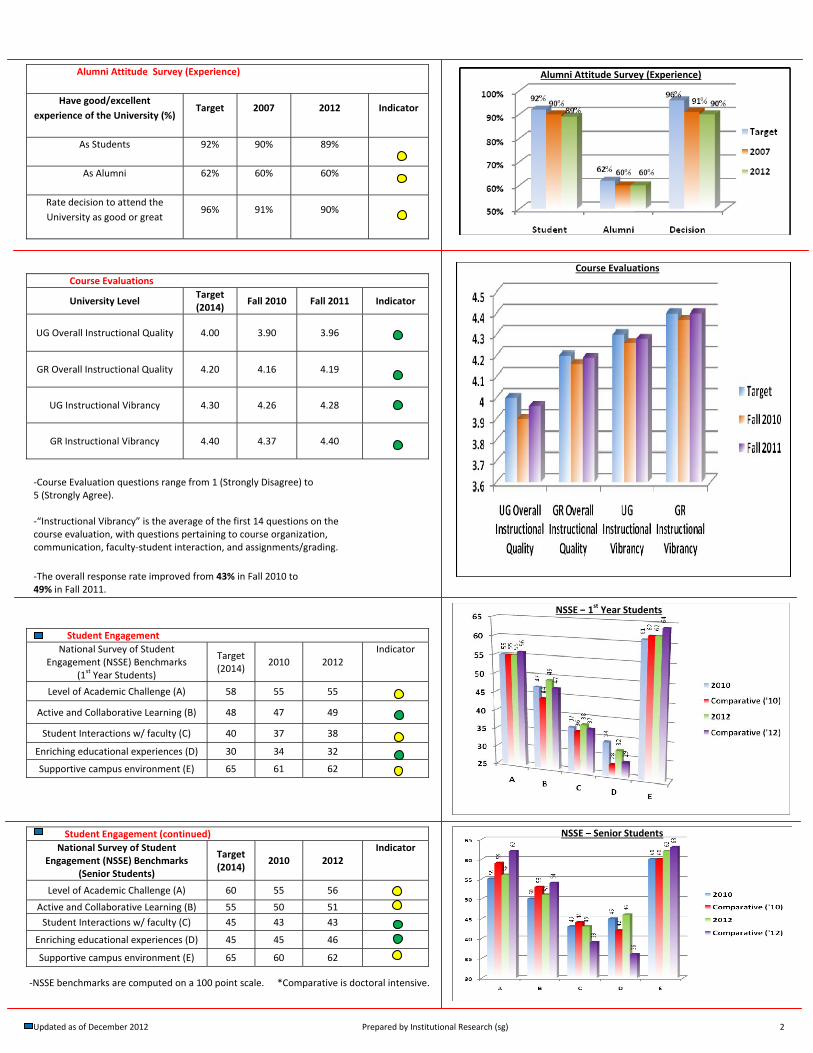
Course Evaluations
University Level Target (2014)
Fall 2010 Fall 2011 Indicator
UG Overall Instructional Quality 4.00 3.90 3.96
GR Overall Instructional Quality 4.20 4.16 4.19
UG Instructional Vibrancy 4.30 4.26 4.28
GR Instructional Vibrancy 4.40 4.37 4.40
‐Course Evaluation questions range from 1 (Strongly Disagree) to 5 (Strongly Agree). ‐“Instructional Vibrancy” is the average of the first 14 questions on the course evaluation, with questions pertaining to course organization, communication, faculty‐student interaction, and assignments/grading.
‐The overall response rate improved from 43% in Fall 2010 to 49% in Fall 2011.
Student Engagement
National Survey of Student Engagement (NSSE) Benchmarks
(1st Year Students)
Target (2014)
2010 2012 Indicator
Level of Academic Challenge (A) 58 55 55
Active and Collaborative Learning (B) 48 47 49
Student Interactions w/ faculty (C) 40 37 38
Enriching educational experiences (D) 30 34 32
Supportive campus environment (E) 65 61 62
Student Engagement (continued)
National Survey of Student Engagement (NSSE) Benchmarks
(Senior Students)
Target (2014)
2010 2012 Indicator
Level of Academic Challenge (A) 60 55 56
Active and Collaborative Learning (B) 55 50 51
Student Interactions w/ faculty (C) 45 43 43
Enriching educational experiences (D) 45 45 46
Supportive campus environment (E) 65 60 62
Alumni Attitude Survey (Experience)
Have good/excellent
experience of the University (%) Target 2007 2012 Indicator
As Students 92% 90% 89%
As Alumni 62% 60% 60%
Rate decision to attend the
University as good or great 96% 91% 90%
*Comparative is doctoral intensive.‐NSSE benchmarks are computed on a 100 point scale.
Alumni Attitude Survey (Experience)
Course Evaluations
NSSE – 1st Year Students
NSSE – Senior Students
Updated as of December 2012 Prepared by Institutional Research (sg) 2
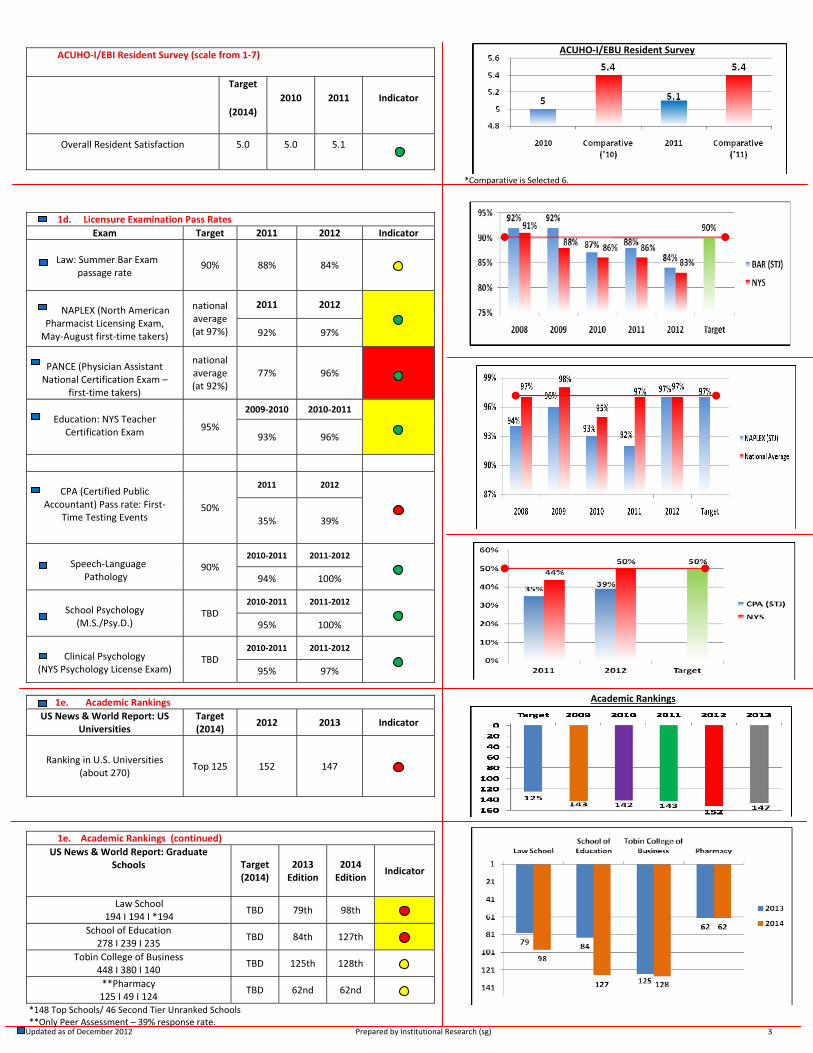
ACUHO‐I/EBI Resident Survey (scale from 1‐7)
Target
(2014)
2010 2011 Indicator
Overall Resident Satisfaction 5.0 5.0 5.1
1e. Academic Rankings
US News & World Report: US Universities
Target (2014)
2012 2013 Indicator
Ranking in U.S. Universities (about 270)
Top 125 152 147
1e. Academic Rankings (continued)
US News & World Report: Graduate Schools
Target (2014)
2013 Edition
2014 Edition
Indicator
Law School 194 I 194 I *194
TBD 79th 98th
School of Education 278 I 239 I 235
TBD 84th 127th
Tobin College of Business 448 I 380 I 140
TBD 125th 128th
**Pharmacy 125 I 49 I 124
TBD 62nd 62nd
1d. Licensure Examination Pass Rates
Exam Target 2011 2012 Indicator
Law: Summer Bar Exam
passage rate 90% 88% 84%
NAPLEX (North American
Pharmacist Licensing Exam, May‐August first‐time takers)
national average (at 97%)
2011 2012
92% 97%
PANCE (Physician Assistant National Certification Exam –
first‐time takers)
national average (at 92%)
77% 96%
Education: NYS Teacher
Certification Exam 95%
2009‐2010 2010‐2011
93% 96%
CPA (Certified Public
Accountant) Pass rate: First‐Time Testing Events
50%
2011 2012
35% 39%
Speech‐Language
Pathology 90%
2010‐2011 2011‐2012
94% 100%
School Psychology
(M.S./Psy.D.) TBD
2010‐2011 2011‐2012
95% 100%
Clinical Psychology
(NYS Psychology License Exam) TBD
2010‐2011 2011‐2012
95% 97%
*Comparative is Selected 6.
ACUHO‐I/EBU Resident Survey
Academic Rankings
Updated as of December 2012 Prepared by Institutional Research (sg) 3
*148 Top Schools/ 46 Second Tier Unranked Schools **Only Peer Assessment – 39% response rate.
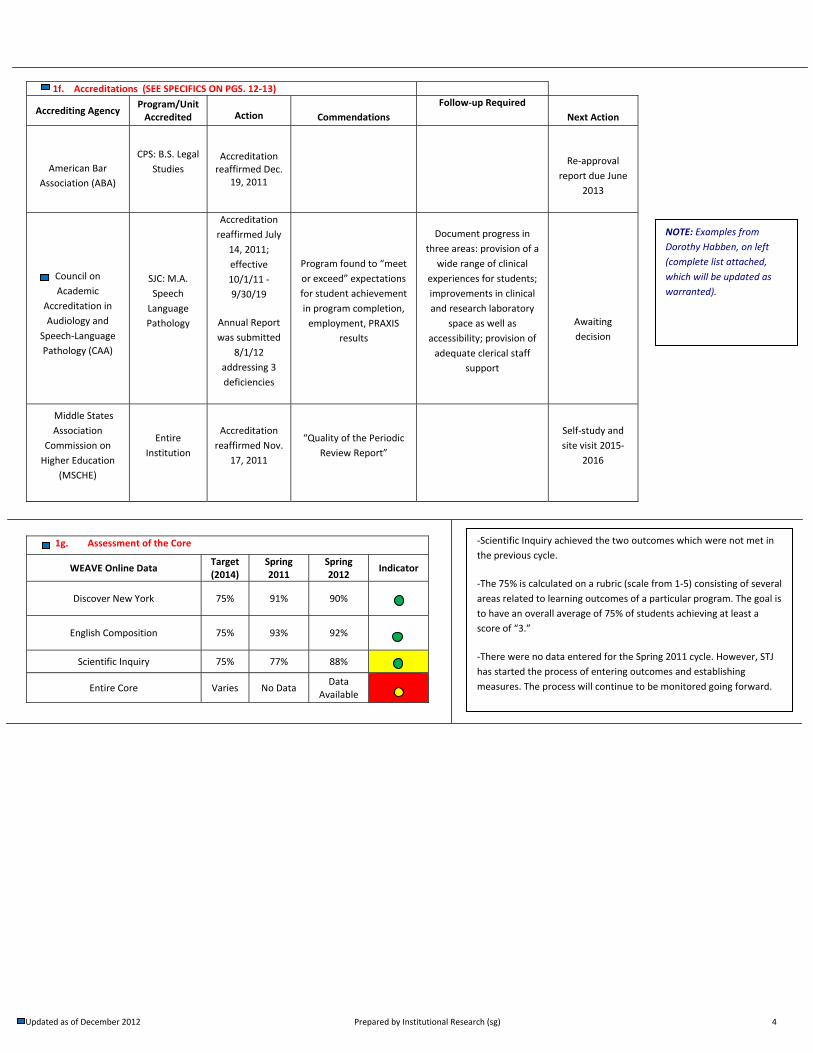
1f. Accreditations (SEE SPECIFICS ON PGS. 12‐13)
Accrediting Agency Program/Unit Accredited
Action
Commendations
Follow‐up Required Next Action
American Bar
Association (ABA)
CPS: B.S. Legal
Studies Accreditation reaffirmed Dec.
19, 2011
Re‐approval
report due June
2013
Council on
Academic
Accreditation in
Audiology and
Speech‐Language
Pathology (CAA)
SJC: M.A.
Speech
Language
Pathology
Accreditation
reaffirmed July
14, 2011;
effective
10/1/11 ‐
9/30/19
Annual Report
was submitted
8/1/12
addressing 3
deficiencies
Program found to “meet
or exceed” expectations
for student achievement
in program completion,
employment, PRAXIS
results
Document progress in
three areas: provision of a
wide range of clinical
experiences for students;
improvements in clinical
and research laboratory
space as well as
accessibility; provision of
adequate clerical staff
support
Awaiting
decision
Middle States
Association
Commission on
Higher Education
(MSCHE)
Entire
Institution
Accreditation
reaffirmed Nov.
17, 2011
“Quality of the Periodic
Review Report”
Self‐study and
site visit 2015‐
2016
1g. Assessment of the Core
WEAVE Online Data Target (2014)
Spring 2011
Spring 2012
Indicator
Discover New York 75% 91% 90%
English Composition 75% 93% 92%
Scientific Inquiry 75% 77% 88%
Entire Core Varies No Data Data
Available
NOTE: Examples from
Dorothy Habben, on left
(complete list attached,
which will be updated as
warranted).
‐Scientific Inquiry achieved the two outcomes which were not met in
the previous cycle.
‐The 75% is calculated on a rubric (scale from 1‐5) consisting of several
areas related to learning outcomes of a particular program. The goal is
to have an overall average of 75% of students achieving at least a
score of “3.”
‐There were no data entered for the Spring 2011 cycle. However, STJ
has started the process of entering outcomes and establishing
measures. The process will continue to be monitored going forward.
Updated as of December 2012 Prepared by Institutional Research (sg) 4
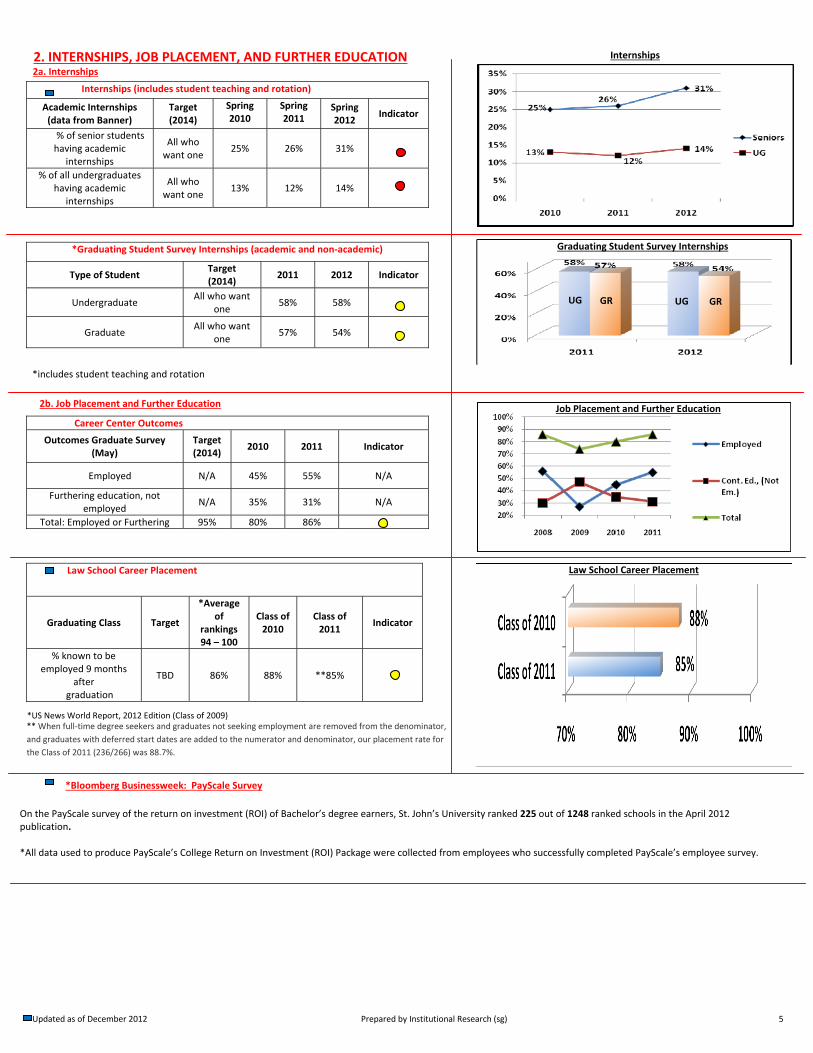
2. INTERNSHIPS, JOB PLACEMENT, AND FURTHER EDUCATION
Internships (includes student teaching and rotation)
Academic Internships (data from Banner)
Target (2014)
Spring 2010
Spring 2011
Spring 2012
Indicator
% of senior students having academic
internships
All who want one
25% 26% 31%
% of all undergraduates having academic
internships
All who want one
13% 12% 14%
*Graduating Student Survey Internships (academic and non‐academic)
Type of Student Target (2014)
2011 2012 Indicator
Undergraduate All who want
one 58% 58%
Graduate All who want
one 57% 54%
Career Center Outcomes
Outcomes Graduate Survey (May)
Target (2014)
2010 2011 Indicator
Employed N/A 45% 55% N/A
Furthering education, not employed
N/A 35% 31% N/A
Total: Employed or Furthering 95% 80% 86%
Law School Career Placement
Graduating Class Target
*Average of
rankings 94 – 100
Class of 2010
Class of 2011
Indicator
% known to be employed 9 months
after graduation
TBD 86% 88% **85%
*US News World Report, 2012 Edition (Class of 2009)
*includes student teaching and rotation
2a. Internships
2b. Job Placement and Further Education
Job Placement and Further Education
UG UGGR GR
Graduating Student Survey Internships
** When full‐time degree seekers and graduates not seeking employment are removed from the denominator,
and graduates with deferred start dates are added to the numerator and denominator, our placement rate for
the Class of 2011 (236/266) was 88.7%.
*Bloomberg Businessweek: PayScale Survey
On the PayScale survey of the return on investment (ROI) of Bachelor’s degree earners, St. John’s University ranked 225 out of 1248 ranked schools in the April 2012 publication. *All data used to produce PayScale’s College Return on Investment (ROI) Package were collected from employees who successfully completed PayScale’s employee survey.
Internships
Updated as of December 2012 Prepared by Institutional Research (sg) 5
Law School Career Placement
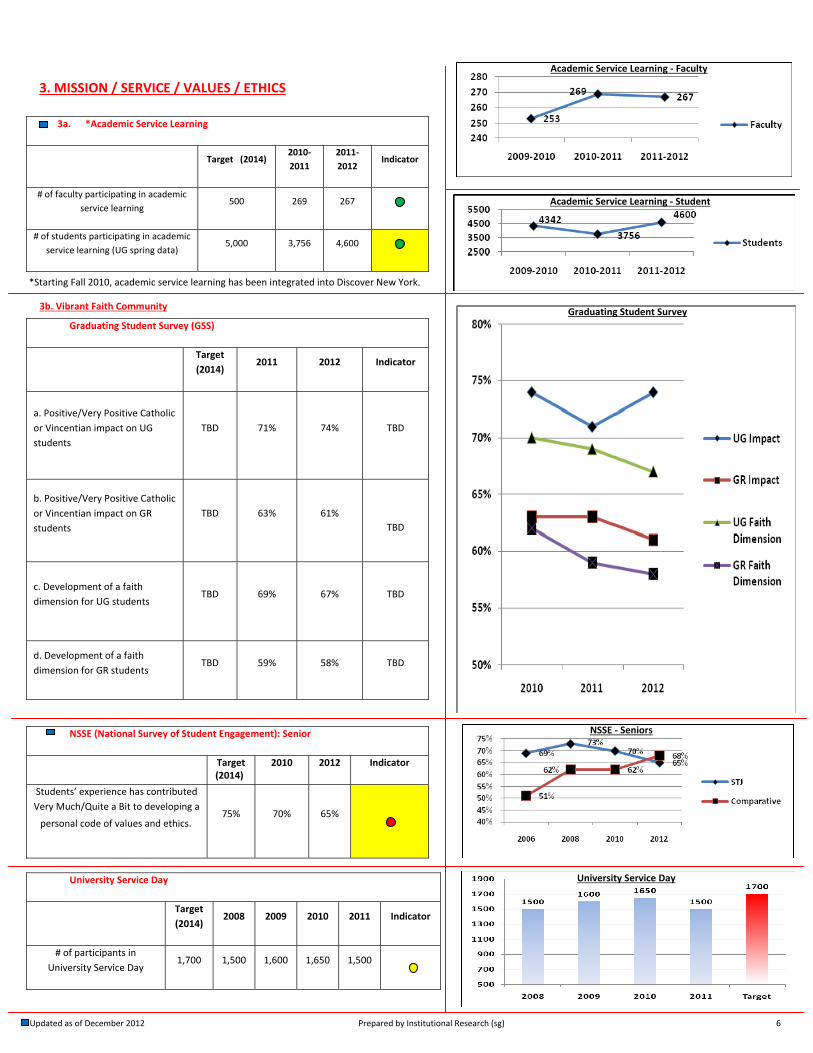
Graduating Student Survey (GSS)
Target
(2014) 2011 2012 Indicator
a. Positive/Very Positive Catholic
or Vincentian impact on UG
students
TBD 71% 74% TBD
b. Positive/Very Positive Catholic
or Vincentian impact on GR
students
TBD 63% 61%
TBD
c. Development of a faith
dimension for UG students TBD 69% 67% TBD
d. Development of a faith
dimension for GR students TBD 59% 58% TBD
NSSE (National Survey of Student Engagement): Senior
Target 2010 2012 Indicator
Students’ experience has contributed
Very Much/Quite a Bit to developing a
contributed to the development of a
personal code of values and ethics.
75% 70% 65%
3a. *Academic Service Learning
Target (2014) 2010‐
2011
2011‐
2012 Indicator
# of faculty participating in academic
service learning 500 269 267
# of students participating in academic
service learning (UG spring data) 5,000 3,756 4,600
University Service Day
Target
(2014) 2008 2009 2010 2011 Indicator
# of participants in
University Service Day 1,700 1,500 1,600 1,650 1,500
3. MISSION / SERVICE / VALUES / ETHICS
3b. Vibrant Faith Community
*Starting Fall 2010, academic service learning has been integrated into Discover New York.
(2014)
University Service Day
Graduating Student Survey
personal code of values and ethics.
Academic Service Learning ‐ Faculty
Academic Service Learning ‐ Student
NSSE ‐ Seniors
Updated as of December 2012 Prepared by Institutional Research (sg) 6
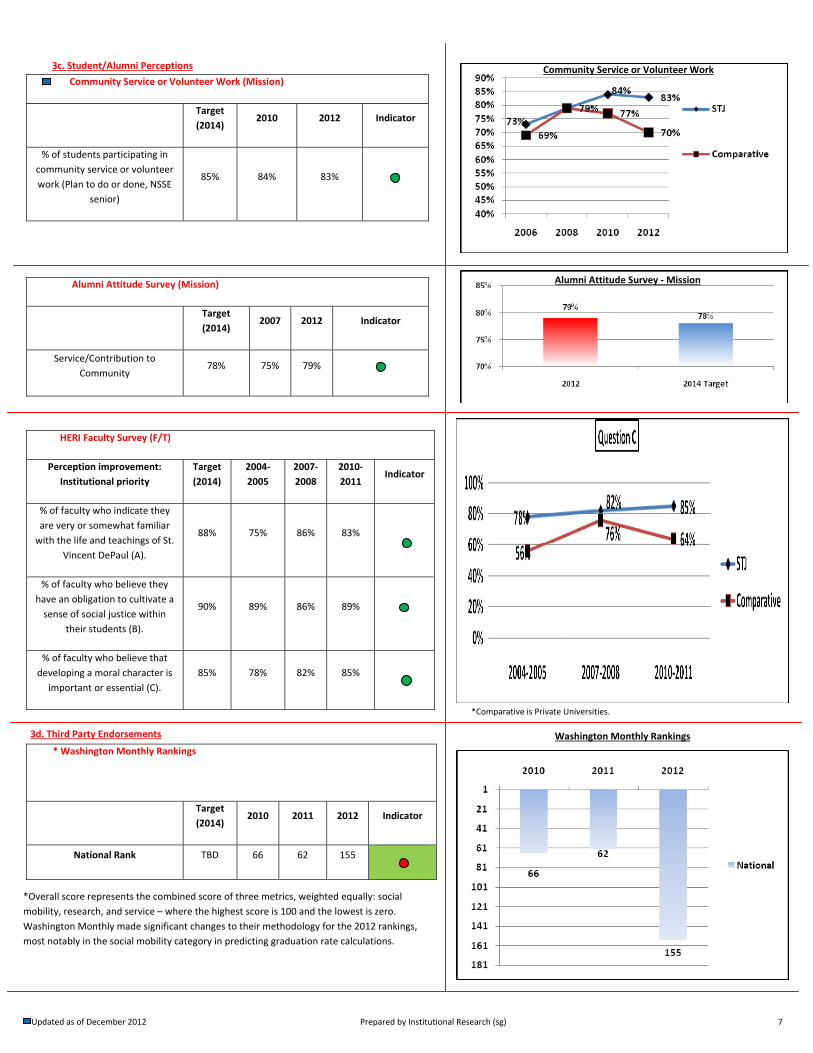
Alumni Attitude Survey (Mission)
Target
(2014) 2007 2012 Indicator
Service/Contribution to
Community 78% 75% 79%
HERI Faculty Survey (F/T)
Perception improvement:
Institutional priority
Target
(2014)
2004‐
2005
2007‐
2008
2010‐
2011 Indicator
% of faculty who indicate they
are very or somewhat familiar
with the life and teachings of St.
Vincent DePaul (A).
88% 75% 86% 83%
% of faculty who believe they
have an obligation to cultivate a
sense of social justice within
their students (B).
90% 89% 86% 89%
% of faculty who believe that
developing a moral character is
important or essential (C).
85% 78% 82% 85%
* Washington Monthly Rankings
Target
(2014) 2010 2011 2012 Indicator
National Rank TBD 66 62 155
Community Service or Volunteer Work (Mission)
Target
(2014) 2010 2012 Indicator
% of students participating in
community service or volunteer
work (Plan to do or done, NSSE
senior)
85% 84% 83%
*Comparative is Private Universities.
3c. Student/Alumni Perceptions
3d. Third Party Endorsements
Alumni Attitude Survey ‐Mission
*Overall score represents the combined score of three metrics, weighted equally: social
mobility, research, and service – where the highest score is 100 and the lowest is zero.
Washington Monthly made significant changes to their methodology for the 2012 rankings,
most notably in the social mobility category in predicting graduation rate calculations.
Community Service or Volunteer Work
Washington Monthly Rankings
Updated as of December 2012 Prepared by Institutional Research (sg) 7

4a. Study Abroad
# of students studying abroad Target (2014)
2010‐2011
*2011‐2012
Indicator
Undergraduate 1,350 530 577
Graduate 150 196 240
4b. International Students
International Students (Graduate and Undergraduate)
Target (2014)
2011 2012 Indicator
# of international students 1,500 1253 1291
% of international students 5.9% 6.1%
4c. Diversity Rankings/Endorsements
US News and World Report: Best Colleges
Target (2014)
2011 Edition
2012 Edition
2013Edition
Indicator
Most diverse national Universities
TBD 4th 3rd 4th
(tied)
5. FINANCIAL RESOURCES
5a. Financial Resources (Net Assets and Endowment – Business Affairs)
Target
(2014)
FY
2009
FY
2010
FY
2011
FY
2012
Indicator
Tuition Dependency 79% 81% 80% 82% 82%
Net Assets TBD $345m $347m $430m $433m Endowment (market
value) TBD $268m $303m $360m $350m
Endowment Return TBD ‐26.06 12.82 18.50 ‐3.40
Bond Ratings A3/A‐ A3/A‐ A3/A‐ A3/A‐ A3/A‐
5b. Financial Resources (Net tuition/discount – Business Affairs)
Target
(2014) FY10 FY11 FY12
Projected
FY13 Indicator
Net tuition revenue 366,000 317,995 338,339 350,263 350,841
Net tuition discount (overall)
36.1% 35.1% 35.0% 34.6% 35.0%
Net tuition discount (freshmen)
47.0% 54.3% 48.2% 46.8% 49.0%
Net tuition per student ($)
$20,626 $18,073 $18,709 $20,043 $20,556
4. Global Awareness/Diversity
One of the top 20 most diverse National Universities listed in the US
News and World Report 2013 Rankings of Ethnic Diversity.
Net Tuition Revenue ($)
Net Tuition Discount (overall)
Net Tuition Discount (Freshmen)
Updated as of December 2012 Prepared by Institutional Research (sg) 8
*2011‐2012 data is preliminary.
Study Abroad Students
International Students
Net Assets and Endowment
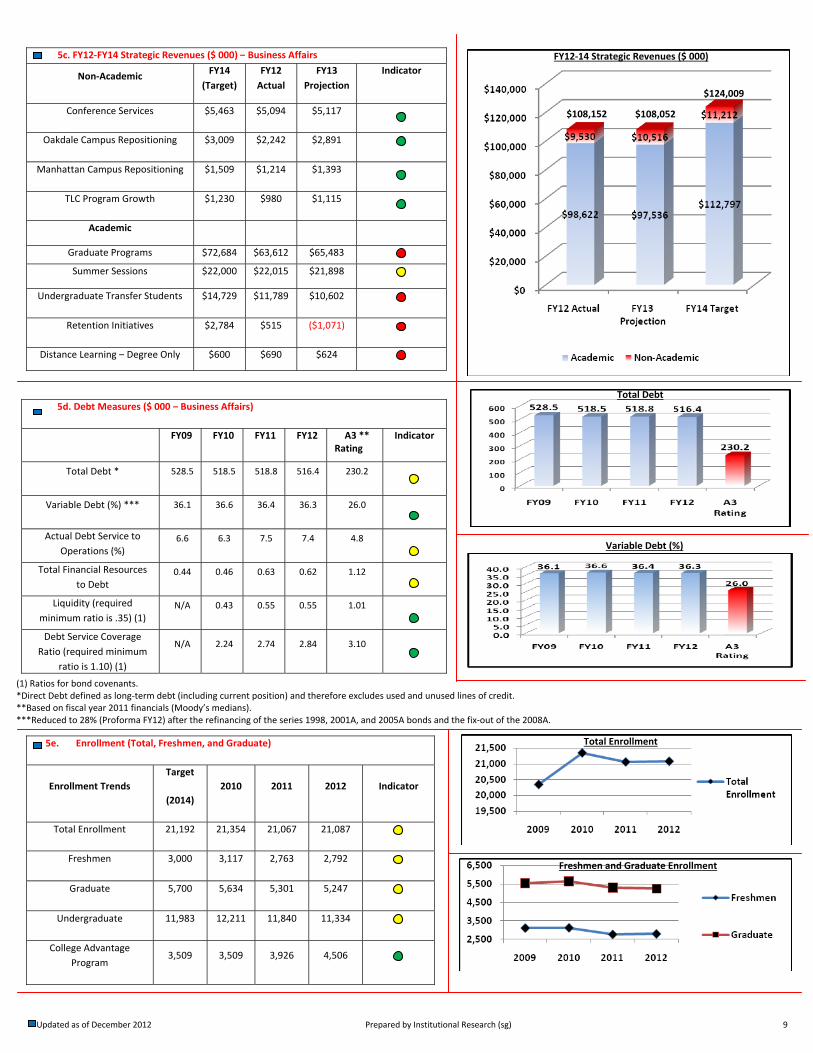
5c. FY12‐FY14 Strategic Revenues ($ 000) – Business Affairs
Non‐Academic FY14
(Target)
FY12
Actual
FY13
Projection
Indicator
Conference Services $5,463 $5,094 $5,117
Oakdale Campus Repositioning $3,009 $2,242 $2,891
Manhattan Campus Repositioning $1,509 $1,214 $1,393
TLC Program Growth $1,230 $980 $1,115
Academic
Graduate Programs $72,684 $63,612 $65,483
Summer Sessions $22,000 $22,015 $21,898
Undergraduate Transfer Students $14,729 $11,789 $10,602
Retention Initiatives $2,784 $515 ($1,071)
Distance Learning – Degree Only $600 $690 $624
5d. Debt Measures ($ 000 – Business Affairs)
FY09 FY10 FY11 FY12 A3 ** Indicator
Total Debt * 528.5 518.5 518.8 516.4 230.2
Variable Debt (%) *** 36.1 36.6 36.4 36.3 26.0
Actual Debt Service to
Operations (%) 6.6 6.3 7.5 7.4 4.8
Total Financial Resources
to Debt 0.44 0.46 0.63 0.62 1.12
Liquidity (required
minimum ratio is .35) (1) N/A 0.43 0.55 0.55 1.01
Debt Service Coverage
Ratio (required minimum
ratio is 1.10) (1)
N/A 2.24 2.74 2.84 3.10
5e. Enrollment (Total, Freshmen, and Graduate)
Enrollment Trends
Target
(2014)
2010 2011 2012 Indicator
Total Enrollment 21,192 21,354 21,067 21,087
Freshmen 3,000 3,117 2,763 2,792
Graduate 5,700 5,634 5,301 5,247
Undergraduate 11,983 12,211 11,840 11,334
College Advantage
Program 3,509 3,509 3,926 4,506
Rating
(1) Ratios for bond covenants. *Direct Debt defined as long‐term debt (including current position) and therefore excludes used and unused lines of credit. **Based on fiscal year 2011 financials (Moody’s medians). ***Reduced to 28% (Proforma FY12) after the refinancing of the series 1998, 2001A, and 2005A bonds and the fix‐out of the 2008A.
Total Debt
Variable Debt (%)
Updated as of December 2012 Prepared by Institutional Research (sg) 9
Total Enrollment
Freshmen and Graduate Enrollment
$108,152 $108,052
$124,009
FY12‐14 Strategic Revenues ($ 000)
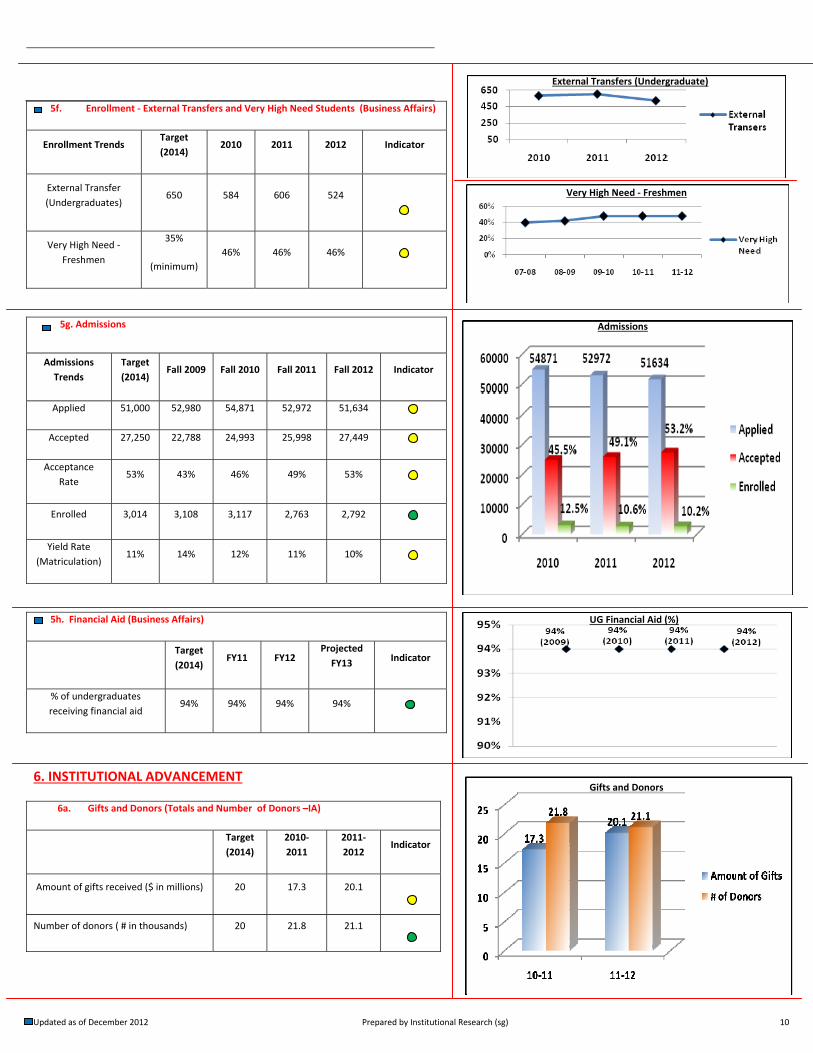
5f. Enrollment ‐ External Transfers and Very High Need Students (Business Affairs)
Enrollment Trends Target
(2014) 2010 2011 2012 Indicator
External Transfer
(Undergraduates) 650 584 606 524
Very High Need ‐
Freshmen
35%
(minimum)
46% 46% 46%
5g. Admissions
Admissions
Trends
Target
(2014) Fall 2009 Fall 2010 Fall 2011 Fall 2012 Indicator
Applied 51,000 52,980 54,871 52,972 51,634
Accepted 27,250 22,788 24,993 25,998 27,449
Acceptance
Rate 53% 43% 46% 49% 53%
Enrolled 3,014 3,108 3,117 2,763 2,792
Yield Rate
(Matriculation) 11% 14% 12% 11% 10%
5h. Financial Aid (Business Affairs)
Target
(2014) FY11 FY12
Projected
FY13 Indicator
% of undergraduates
receiving financial aid 94% 94% 94% 94%
6. INSTITUTIONAL ADVANCEMENT
6a. Gifts and Donors (Totals and Number of Donors –IA)
Target
(2014)
2010‐
2011
2011‐
2012 Indicator
Amount of gifts received ($ in millions) 20 17.3 20.1
Number of donors ( # in thousands) 20 21.8 21.1
Gifts and Donors
Updated as of December 2012 Prepared by Institutional Research (sg) 10
External Transfers (Undergraduate)
Admissions
Very High Need ‐ Freshmen
UG Financial Aid (%)
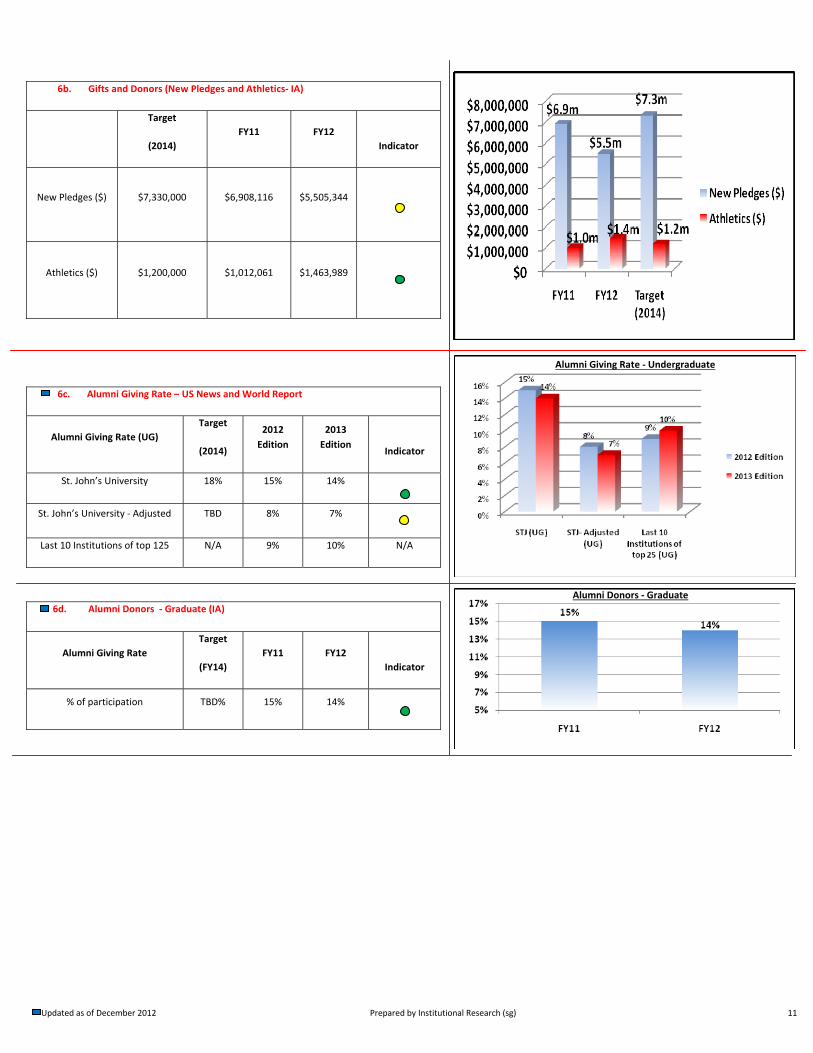
6b. Gifts and Donors (New Pledges and Athletics‐ IA)
Target
(2014)
FY11 FY12
Indicator
New Pledges ($) $7,330,000 $6,908,116 $5,505,344
Athletics ($) $1,200,000 $1,012,061 $1,463,989
6c. Alumni Giving Rate – US News and World Report
Alumni Giving Rate (UG)
Target
(2014)
2012
Edition
2013
Edition Indicator
St. John’s University 18% 15% 14%
St. John’s University ‐ Adjusted TBD 8% 7%
Last 10 Institutions of top 125 N/A 9% 10% N/A
6d. Alumni Donors ‐ Graduate (IA)
Alumni Giving Rate
Target
(FY14)
FY11 FY12
Indicator
% of participation TBD% 15% 14%
Alumni Donors ‐ Graduate
Updated as of December 2012 Prepared by Institutional Research (sg) 11
Alumni Giving Rate ‐ Undergraduate
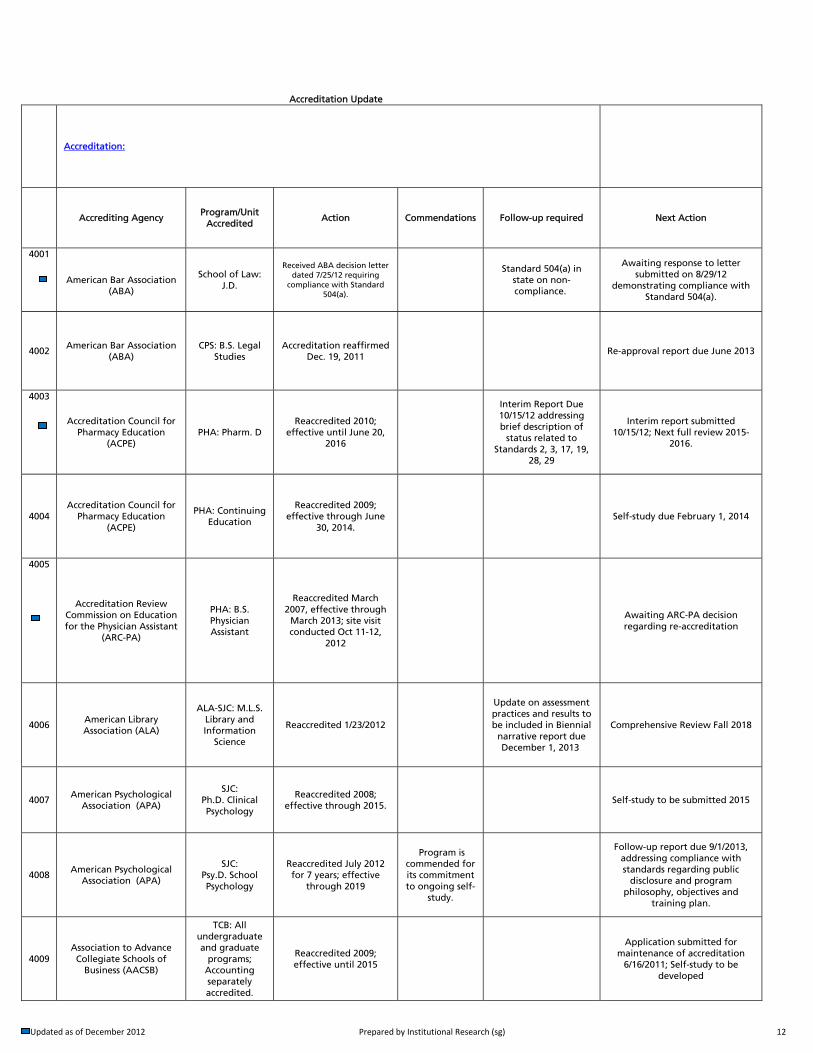
Accreditation Update
Accreditation:
Accrediting Agency Program/Unit
Accredited Action Commendations Follow-up required Next Action
4001
American Bar Association
(ABA)
School of Law: J.D.
Received ABA decision letter dated 7/25/12 requiring
compliance with Standard 504(a).
Standard 504(a) in state on non-compliance.
Awaiting response to letter submitted on 8/29/12
demonstrating compliance with Standard 504(a).
4002 American Bar Association
(ABA) CPS: B.S. Legal
Studies Accreditation reaffirmed
Dec. 19, 2011
Re-approval report due June 2013
4003
Accreditation Council for Pharmacy Education
(ACPE) PHA: Pharm. D
Reaccredited 2010; effective until June 20,
2016
Interim Report Due 10/15/12 addressing brief description of
status related to Standards 2, 3, 17, 19,
28, 29
Interim report submitted 10/15/12; Next full review 2015-
2016.
4004 Accreditation Council for
Pharmacy Education (ACPE)
PHA: Continuing Education
Reaccredited 2009; effective through June
30, 2014.
Self-study due February 1, 2014
4005
Accreditation Review Commission on Education for the Physician Assistant
(ARC-PA)
PHA: B.S. Physician Assistant
Reaccredited March 2007, effective through
March 2013; site visit conducted Oct 11-12,
2012
Awaiting ARC-PA decision regarding re-accreditation
4006 American Library Association (ALA)
ALA-SJC: M.L.S. Library and Information
Science
Reaccredited 1/23/2012
Update on assessment practices and results to be included in Biennial
narrative report due December 1, 2013
Comprehensive Review Fall 2018
4007 American Psychological
Association (APA)
SJC: Ph.D. Clinical Psychology
Reaccredited 2008; effective through 2015.
Self-study to be submitted 2015
4008 American Psychological
Association (APA)
SJC: Psy.D. School Psychology
Reaccredited July 2012 for 7 years; effective
through 2019
Program is commended for its commitment to ongoing self-
study.
Follow-up report due 9/1/2013, addressing compliance with standards regarding public
disclosure and program philosophy, objectives and
training plan.
4009 Association to Advance Collegiate Schools of
Business (AACSB)
TCB: All undergraduate and graduate
programs; Accounting separately accredited.
Reaccredited 2009; effective until 2015
Application submitted for maintenance of accreditation
6/16/2011; Self-study to be developed
Updated as of December 2012 Prepared by Institutional Research (sg) 12
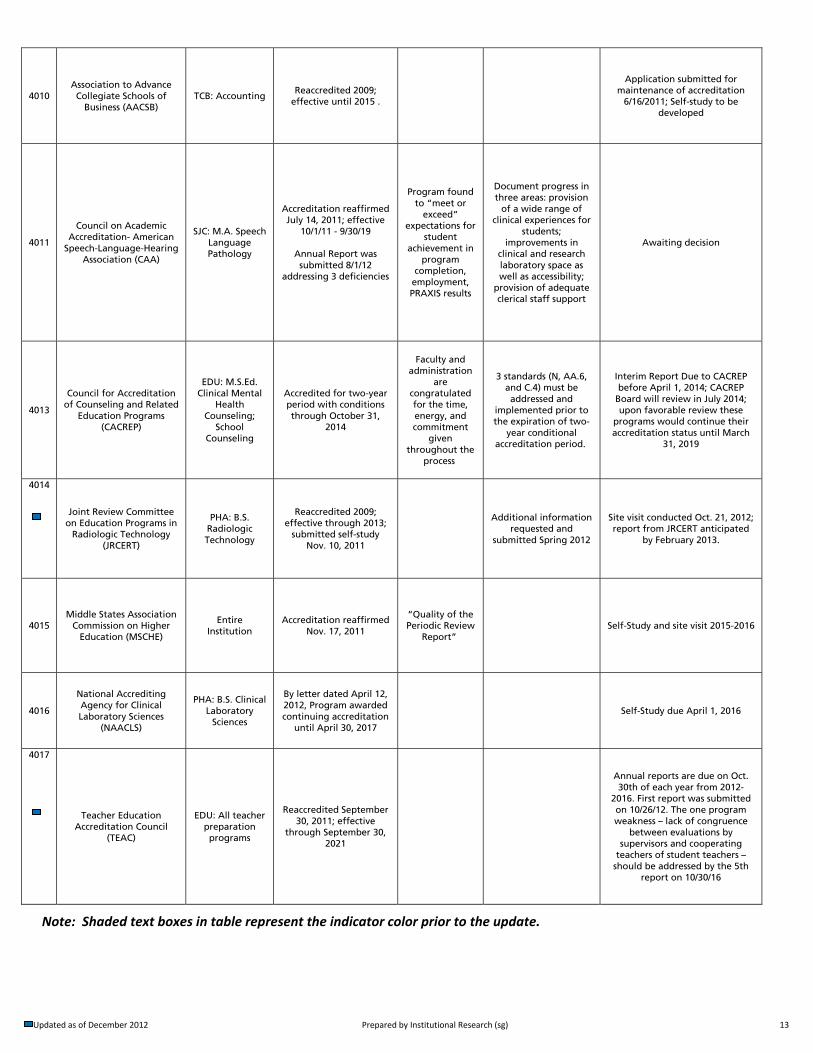
4010 Association to Advance Collegiate Schools of
Business (AACSB) TCB: Accounting
Reaccredited 2009; effective until 2015 .
Application submitted for maintenance of accreditation
6/16/2011; Self-study to be developed
4011
Council on Academic Accreditation- American
Speech-Language-Hearing Association (CAA)
SJC: M.A. Speech Language Pathology
Accreditation reaffirmed July 14, 2011; effective
10/1/11 - 9/30/19
Annual Report was submitted 8/1/12
addressing 3 deficiencies
Program found to “meet or
exceed” expectations for
student achievement in
program completion,
employment, PRAXIS results
Document progress in three areas: provision
of a wide range of clinical experiences for
students; improvements in
clinical and research laboratory space as well as accessibility;
provision of adequate clerical staff support
Awaiting decision
4013
Council for Accreditation of Counseling and Related
Education Programs (CACREP)
EDU: M.S.Ed. Clinical Mental
Health Counseling;
School Counseling
Accredited for two-year period with conditions through October 31,
2014
Faculty and administration
are congratulated for the time, energy, and commitment
given throughout the
process
3 standards (N, AA.6, and C.4) must be addressed and
implemented prior to the expiration of two-
year conditional accreditation period.
Interim Report Due to CACREP before April 1, 2014; CACREP
Board will review in July 2014; upon favorable review these
programs would continue their accreditation status until March
31, 2019
4014
Joint Review Committee on Education Programs in
Radiologic Technology (JRCERT)
PHA: B.S. Radiologic Technology
Reaccredited 2009; effective through 2013;
submitted self-study Nov. 10, 2011
Additional information
requested and submitted Spring 2012
Site visit conducted Oct. 21, 2012; report from JRCERT anticipated
by February 2013.
4015 Middle States Association
Commission on Higher Education (MSCHE)
Entire Institution
Accreditation reaffirmed Nov. 17, 2011
“Quality of the Periodic Review
Report” Self-Study and site visit 2015-2016
4016
National Accrediting Agency for Clinical Laboratory Sciences
(NAACLS)
PHA: B.S. Clinical Laboratory
Sciences
By letter dated April 12, 2012, Program awarded continuing accreditation
until April 30, 2017
Self-Study due April 1, 2016
4017
Teacher Education Accreditation Council
(TEAC)
EDU: All teacher preparation programs
Reaccredited September 30, 2011; effective
through September 30, 2021
Annual reports are due on Oct. 30th of each year from 2012-
2016. First report was submitted on 10/26/12. The one program weakness – lack of congruence
between evaluations by supervisors and cooperating
teachers of student teachers – should be addressed by the 5th
report on 10/30/16
Note: Shaded text boxes in table represent the indicator color prior to the update.
Updated as of December 2012 Prepared by Institutional Research (sg) 13