combined outcomes measures - st. john's university target 2012 2013 indicator first‐time j.d....
TRANSCRIPT

REPOSITIONING THE STRATEGIC PLAN
2011-2014
Combined Outcomes
Measures
December 2013

APPENDIX: VALUE OF A ST. JOHN'S EDUCATIONINDICATORS/MEASURES
TABLE OF CONTENTS
1. QUALITY EDUCATION AND EXPERIENCE 4. GLOBAL AWARENESS/DIVERSITYa. Retention Rates a. Study Abroadb. Graduation Rates b. International Studentsc. Student and Alumni Perceptions c. Diversity Rankingsd. Licensure Examination Pass Rates 5. Financial Resourcese. Academic Rankings a. Net Assets/Endowmentf. Accreditation b. Net Tuition/Discountg. Assessment of the Core c. Strategic Revenues Growth
2. INTERNSHIPS, JOB PLACEMENT, AND FURTHER EDUCATION d. Debt Measuresa. Internships e. Enrollmentb Job Placement and Further Education f External Transfers/Very High Needs Studentsb. Job Placement and Further Education f. External Transfers/Very High Needs Students
3. MISSION / SERVICE / VALUES / ETHICS g Admissionsa. Academic Service Learning h. Financial Aidb. Vibrant Faith Community 6. INSTITUTIONAL ADVANCEMENTc. Student/Alumni Perceptions a. Gifts and Donorsd. Third Party Endorsements b. New Pledges/Athletics
c. Alumni Giving Rated. Alumni Donors/Graduate
7. Accreditation Updatea. Accreditation Update

1a. Retention Rates: One‐Year
Full‐time baccalaureate: Freshmen
Target (2014)
Fall 2011 Fall 2012 Indicator
Standard Admit 86% 78% 80%
Liberal Studies (LST) 70% 67% 73%
Referred 70% 67% 73%
Composite 83% 76% 80%
Resident TBD 74% 79%
Commuter TBD 80% 80%
Primary TBD 80% 83%
Secondary TBD 72% 76%
1b.
Full‐time baccalaureate Target (2014)
2006 (cohort)
2007(cohort)
Indicator
Total 69% 59% 55%
Standard Admit TBD 62% 58%
Referred Admit TBD 44% 42%
Alumni Attitude Survey (Preparation)
University did a good/excellent job at preparing students for:
Target 2007 2012 Indicator
Graduate school/Further grad education 78% 75% 76%
Career preparation/success, & current work 84% 83% 79%
Alumni Attitude Survey (Internships)
SJU did a good/excellent job Target 2007 2012 Indicator
At providing internships 50% 44% 42%
Legend: Indicators (Most Current Period)
Need Action
Monitor
Target Met
Student and Alumni Perceptions – Overall Experience
GSS (Graduating Student
Survey: % Very
Satisfied/Satisfied)
Target 2012 2013 Indicator
Undergraduate (%) TBD 93% 93%
Graduate (%) TBD 93% 93%
Repositioning of the Strategic Plan: Indicators and Measures
1. QUALITY EDUCATION AND EXPERIENCE
1.c STUDENT AND ALUMNI PERCEPTIONS
Alumni Attitude Survey (Preparation)
Updated as of December 2013 Prepared by Institutional Research (sg) 1
Alumni Attitude Survey (Internships)
SJU – Graduation Rates
Student and Alumni Perceptions
Retention
Note: Shaded text boxes in the table represent the indicator color prior to the update.
Graduation Rates: Six‐Year

Course Evaluations
University Level Target (2014)
Fall 2011 Fall 2012 Indicator
UG Overall Instructional Quality 4.00 3.96 4.03
GR Overall Instructional Quality 4.20 4.19 4.20
UG Instructional Vibrancy 4.30 4.28 4.33
GR Instructional Vibrancy 4.40 4.40 4.43
Law School Overall Teaching Ability
4.00 4.38 4.45
‐Course Evaluation questions range from 1 (Strongly Disagree) to 5 (Strongly Agree). ‐“Instructional Vibrancy” is the average of the first 14 questions on the course evaluation, with questions pertaining to course organization, communication, faculty‐student interaction, and assignments/grading.
‐The overall response rate decreased from 49% in Fall 2011 to 47% in Fall 2012 (excluding the Law School).
Student Engagement
National Survey of Student Engagement (NSSE) Benchmarks
(1st Year Students)
Target (2014)
2010 2012 Indicator
Level of Academic Challenge (A) 58 55 55
Active and Collaborative Learning (B) 48 47 49
Student Interactions w/ faculty (C) 40 37 38
Enriching educational experiences (D) 30 34 32
Supportive campus environment (E) 65 61 62
Student Engagement (continued)
National Survey of Student Engagement (NSSE) Benchmarks
(Senior Students)
Target (2014)
2010 2012 Indicator
Level of Academic Challenge (A) 60 55 56
Active and Collaborative Learning (B) 55 50 51
Student Interactions w/ faculty (C) 45 43 43
Enriching educational experiences (D) 45 45 46
Supportive campus environment (E) 65 60 62
Alumni Attitude Survey (Experience)
Have good/excellent
experience of the University (%) Target 2007 2012 Indicator
As Students 92% 90% 89%
As Alumni 62% 60% 60%
Rate decision to attend the
University as good or great 96% 91% 90%
‐NSSE benchmarks are computed on a 100 point scale.
Alumni Attitude Survey (Experience)
NSSE – 1st Year Students
NSSE – Senior Students
Updated as of December 2013 Prepared by Institutional Research (sg) 2
Course Evaluations

ACUHO‐I/EBI Resident Survey (scale from 1‐7)
Target
(2014)
2011 2012 Indicator
Overall Resident Satisfaction 5.0 4.9 5.0
1e. Academic Rankings
US News & World Report: US Universities
Target (2014)
2013 2014 Indicator
Ranking in U.S. Universities (about 270)
Top 125 147 152
1e. Academic Rankings (continued)
US News & World Report: Graduate Schools
Target (2014)
2013 Edition
2014 Edition
Indicator
Law School 194 I 194 I *194
TBD 79th 98th
School of Education 278 I 239 I 235
TBD 84th 127th
Tobin College of Business 448 I 380 I 140
TBD 125th 128th
**Pharmacy 125 I 49 I 124
TBD 62nd 62nd
1d. Licensure Examination Pass Rates
Exam Target 2012 2013 Indicator
First‐time J.D. takers of July New
York bar exam 90% 83% 88%
NAPLEX (North American
Pharmacist Licensing Exam, May‐August first‐time takers)
national average (at 97%)
2012 2013
97% 93%
*PANCE (Physician Assistant National Certification Exam –
first‐time takers)
national average (at 94%)
96% 78%
Education: NYS Teacher
Certification Exam 95%
2010‐2011 2011‐2012
96% 93%
CPA (Certified Public
Accountant) Pass rate: First‐Time Testing Events
50%
2011 2012
35% 39%
Speech‐Language
Pathology 90%
2011‐2012 2012‐2013
100% 100%
School Psychology
(M.S./Psy.D.) TBD
2011‐2012 2012‐2013
100% 100%
Clinical Psychology
(NYS Psychology License Exam) TBD
2011‐2012 2012‐2013
97% 97%
*Comparative is Selected 6.
Academic Rankings
Updated as of December 2013 Prepared by Institutional Research (sg) 3
*148 Top Schools/ 46 Second Tier Unranked Schools **Only Peer Assessment – 39% response rate. Last assessed in 2012.
ACUHO‐I/EBU Resident Survey
Total Surveyed I Total Responded I Total Ranked
*PANCE is given multiple times over the year – final national average not available until January.

1f. Accreditations (SEE SPECIFICS ON PGS. 12‐13)
Accrediting Agency Program/Unit Accredited
Action
Commendations
Follow‐up Required Next Action
American Bar
Association (ABA)
CPS: B.S. Legal
Studies Accreditation reaffirmed Dec.
19, 2011
Self‐study report
submitted June
10, 2013. Site
visit anticipated
Fall 2013, after
which
reaccreditation
for 7 more years
anticipated to be
awarded in Feb.
2014.
Council on
Academic
Accreditation in
Audiology and
Speech‐Language
Pathology (CAA)
SJC: M.A.
Speech
Language
Pathology
Accreditation
reaffirmed July
14, 2011;
effective
10/1/11 ‐
9/30/19
Annual Report
was submitted
8/1/12
addressing 3
deficiencies
Program found to “meet
or exceed” expectations
for student achievement
in program completion,
employment, PRAXIS
results
CAA 1/2/13 response to 8/1/12 annual report
explains that next annual report due 8/1/13 must address two areas of partial non‐compliance (standard 1.7 and 2.0).
Annual report submitted
on 7/30/13.
Awaiting
approval of
annual report.
Middle States
Association
Commission on
Higher Education
(MSCHE)
Entire
Institution
Accreditation
reaffirmed Nov.
17, 2011
“Quality of the Periodic
Review Report”
Preparations
underway for
self‐study and
site visit 2015‐
16.
1g. Assessment of the Core
WEAVE Online Data Target (2014)
Spring 2012
Spring 2013
Indicator
Entire Core TBD TBD TBD
English Composition 75% 92% 92%
Scientific Inquiry 75% 88% 91%
Discover New York 75% 90% 87%
NOTE: Examples from
Dorothy Habben, on left
(complete list attached,
which will be updated as
warranted).
‐Scientific Inquiry achieved the two outcomes which were not met in
the previous cycle.
‐The 75% is calculated on a rubric (scale from 1‐5) consisting of several
areas related to learning outcomes of a particular program. The goal is
to have an overall average of 75% of students achieving at least a
score of “3.”
Updated as of December 2013 Prepared by Institutional Research (sg) 4

2. INTERNSHIPS, JOB PLACEMENT, AND FURTHER EDUCATION
Internships (includes student teaching and rotation)
*Academic Internships (data from Banner)
Target (2014)
Spring 2011
Spring 2012
Spring 2013
Indicator
% of senior students having academic
internships
All who want one
26% 31% 31%
% of all undergraduates having academic
internships
All who want one
12% 14% 15%
*Graduating Student Survey Internships (academic and non‐academic)
Type of Student Target (2014)
2012 2013 Indicator
Undergraduate All who want
one 58% 58%
Graduate All who want
one 54% 56%
Career Center Outcomes
Outcomes Graduate Survey (May)
Target (2014)
2011 2012 Indicator
Employed N/A 55% 58% N/A
Furthering education, not employed
N/A 31% 31% N/A
Total: Employed or Furthering 95% 86% 89%
* Law School Career Placement
Full time/long term bar passage required
or JD advantage Target
Class of 2011 (as
of 2/15/12)
Class of 2012 (as
of 2/15/13)
Class of 2013 (as
of 11/15/13)
Indicator
St. John’s University TBD 55% 61%
55%+10%
compared to
11/15/12
National Average 63% 66% TBD
Overall Employment
St. John’s University TBD 85% 78%
75%+18%
compared to
11/15/12
National Average 84% 82% TBD
*includes student teaching and rotation
2a. Internships
2b. Job Placement and Further Education
*Bloomberg Businessweek: PayScale Survey
On the PayScale survey of the return on investment (ROI) of Bachelor’s degree earners, St. John’s University ranked 225 out of 1486 ranked schools in the April 2013 publication. The rank did not change, but the number of ranked schools increased from 1248 in 2012 to 1486 om 2013. *All data used to produce PayScale’s College Return on Investment (ROI) Package were collected from employees who successfully completed PayScale’s employee survey.
Internships
Updated as of December 2013 Prepared by Institutional Research (sg) 5
Job Placement and Further Education
Graduating Student Survey Internships
UG UG GR GR
*Does not include 5th or 6
th year Pharm.D. students.
*Data based on ABA and submitted to US News and World Report.
Final Final Preliminary
Overall Employment

Graduating Student Survey (GSS)
Target
(2014) 2012 2013 Indicator
a. Positive/Very Positive Catholic
or Vincentian impact on UG
students
TBD 74% 75% TBD
b. Positive/Very Positive Catholic
or Vincentian impact on GR
students
TBD 61% 62%
TBD
c. Development of a faith
dimension for UG students TBD 67% 68% TBD
d. Development of a faith
dimension for GR students TBD 58% 54% TBD
NSSE (National Survey of Student Engagement): Senior
Target 2010 2012 Indicator
Students’ experience has contributed
Very Much/Quite a Bit to developing a
contributed to the development of a
personal code of values and ethics.
75% 70% 65%
3a. *Academic Service Learning
Target (2014) 2011‐
2012
2012‐
2013 Indicator
# of faculty participating in academic
service learning 300 267 260
# of students participating in academic
service learning (UG spring data) 5,000 4,600 4,790
University Service Day
Target
(2014) 2010 2011 2012 2013 Indicator
# of participants in
University Service Day 1,700 1,650 1,500 1,500 1,800
3. MISSION / SERVICE / VALUES / ETHICS
3b. Vibrant Faith Community
*Starting Fall 2010, academic service learning has been integrated into Discover New York.
(2014)
personal code of values and ethics.
Updated as of December 2013 Prepared by Institutional Research (sg) 6
Academic Service Learning ‐ Students
Academic Service Learning ‐ Faculty
Graduating Student Survey
University Service Day
NSSE ‐ Seniors
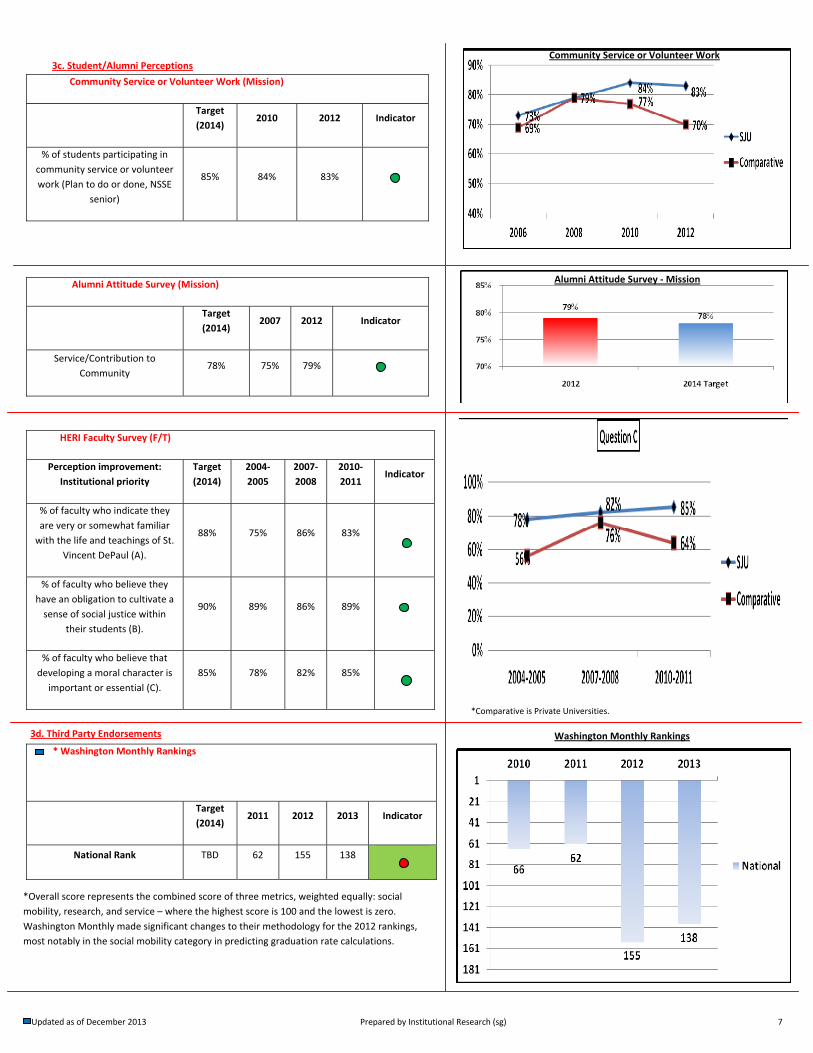
Alumni Attitude Survey (Mission)
Target
(2014) 2007 2012 Indicator
Service/Contribution to
Community 78% 75% 79%
HERI Faculty Survey (F/T)
Perception improvement:
Institutional priority
Target
(2014)
2004‐
2005
2007‐
2008
2010‐
2011 Indicator
% of faculty who indicate they
are very or somewhat familiar
with the life and teachings of St.
Vincent DePaul (A).
88% 75% 86% 83%
% of faculty who believe they
have an obligation to cultivate a
sense of social justice within
their students (B).
90% 89% 86% 89%
% of faculty who believe that
developing a moral character is
important or essential (C).
85% 78% 82% 85%
* Washington Monthly Rankings
Target
(2014) 2011 2012 2013 Indicator
National Rank TBD 62 155 138
Community Service or Volunteer Work (Mission)
Target
(2014) 2010 2012 Indicator
% of students participating in
community service or volunteer
work (Plan to do or done, NSSE
senior)
85% 84% 83%
*Comparative is Private Universities.
3c. Student/Alumni Perceptions
3d. Third Party Endorsements
Alumni Attitude Survey ‐Mission
*Overall score represents the combined score of three metrics, weighted equally: social
mobility, research, and service – where the highest score is 100 and the lowest is zero.
Washington Monthly made significant changes to their methodology for the 2012 rankings,
most notably in the social mobility category in predicting graduation rate calculations.
Washington Monthly Rankings
Updated as of December 2013 Prepared by Institutional Research (sg) 7
Community Service or Volunteer Work

4a. Study Abroad
*# of students studying abroad Target (2014)
2011‐2012
2012‐2013
Indicator
Undergraduate 1,350 575 546
Graduate 150 225 263
*Includes Rome campus and excludes visiting students.
4b. International Students
International Students (Graduate and Undergraduate)
Target (2014)
2012 2013 Indicator
# of international students 1,500 1291 1364
% of international students 6.1% 6.5%
4c. Diversity Rankings/Endorsements
US News and World Report: Best Colleges
Target (2014)
2012 Edition
2013 Edition
2014Edition
Indicator
Most diverse national Universities
TBD 3rd 4th
(tied)
2nd
(4‐way tie)
5. FINANCIAL RESOURCES
5a. Financial Resources (Net Assets and Endowment – Business Affairs)
Target
(2014)
FY
2010
FY
2011
FY
2012
FY
2013
Indicator
Tuition Dependency 81% 80% 82% 82% 81%
Net Assets ‐ $347m $430m $433m $497m Endowment (market
value) ‐ $262m $314m $328m $392m
Endowment Return ‐ 12.82% 18.50% ‐3.4% 18.5%
Bond Ratings A3/A‐ A3/A‐ A3/A‐ A3/A‐ A3/A‐
5b. Financial Resources (Net tuition/discount – Business Affairs)
Projected
FY15 FY11 FY12 FY13
Projected
FY14 Indicator
Net tuition revenue 361,200 338,339 350,263 352,566 354,600
Net tuition discount (overall)
36.0% 35.0% 34.6% 34.9% 35.7%
Net tuition discount (freshmen)
50.5% 48.2% 46.8% 49.0% 50.5%
Net tuition per student ($)
$21,524 $18,709 $20,043 $20,630 $21,137
4. Global Awareness/Diversity
Rutgers, The State University of New Jersey – Newark again ranked
number one. St. John’s tied for second with Andrews University,
Stanford University, and the University of Houston.
Updated as of December 2013 Prepared by Institutional Research (sg) 8
Net Assets and Endowment
Net Tuition Revenue ($)
Net Tuition Discount (overall)
Net Tuition Discount (freshmen)
($ 000)
Study Abroad Students
International Students
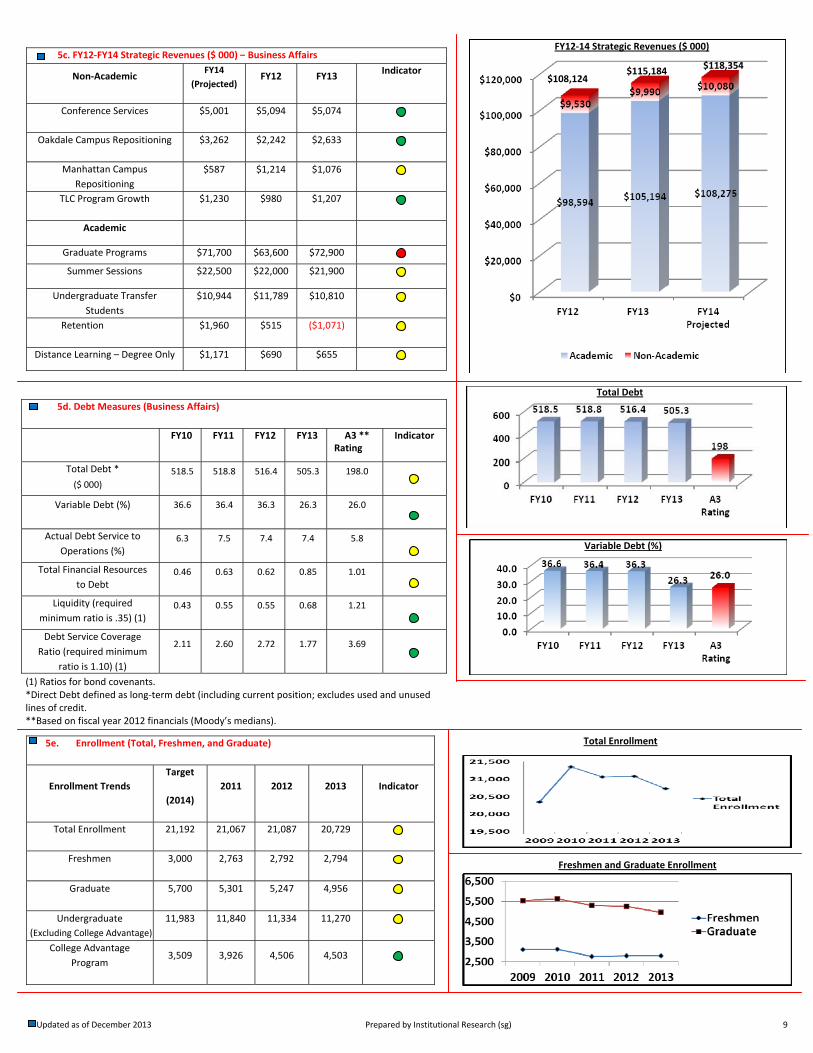
5c. FY12‐FY14 Strategic Revenues ($ 000) – Business Affairs
Non‐Academic FY14
(Projected) FY12 FY13
Indicator
Conference Services $5,001 $5,094 $5,074
Oakdale Campus Repositioning $3,262 $2,242 $2,633
Manhattan Campus
Repositioning
$587 $1,214 $1,076
TLC Program Growth $1,230 $980 $1,207
Academic
Graduate Programs $71,700 $63,600 $72,900
Summer Sessions $22,500 $22,000 $21,900
Undergraduate Transfer
Students
$10,944 $11,789 $10,810
Retention $1,960 $515 ($1,071)
Distance Learning – Degree Only $1,171 $690 $655
5d. Debt Measures (Business Affairs)
FY10 FY11 FY12 FY13 A3 ** Indicator
Total Debt * 518.5 518.8 516.4 505.3 198.0
Variable Debt (%) 36.6 36.4 36.3 26.3 26.0
Actual Debt Service to
Operations (%) 6.3 7.5 7.4 7.4 5.8
Total Financial Resources
to Debt 0.46 0.63 0.62 0.85 1.01
Liquidity (required
minimum ratio is .35) (1) 0.43 0.55 0.55 0.68 1.21
Debt Service Coverage
Ratio (required minimum
ratio is 1.10) (1)
2.11 2.60 2.72 1.77 3.69
5e. Enrollment (Total, Freshmen, and Graduate)
Enrollment Trends
Target
(2014)
2011 2012 2013 Indicator
Total Enrollment 21,192 21,067 21,087 20,729
Freshmen 3,000 2,763 2,792 2,794
Graduate 5,700 5,301 5,247 4,956
Undergraduate 11,983 11,840 11,334 11,270
College Advantage
Program 3,509 3,926 4,506 4,503
Rating
Updated as of December 2013 Prepared by Institutional Research (sg) 9
Total Enrollment
Freshmen and Graduate Enrollment
(Excluding College Advantage)
$108,124 $115,184
$118,354
FY12‐14 Strategic Revenues ($ 000)
(1) Ratios for bond covenants. *Direct Debt defined as long‐term debt (including current position; excludes used and unused lines of credit. **Based on fiscal year 2012 financials (Moody’s medians).
Total Debt
Variable Debt (%)
($ 000)

5f. Enrollment ‐ External Transfers and Very High Need Students (Business Affairs)
Enrollment Trends Target
(2014) 2011 2012 2013 Indicator
External Transfer
(Undergraduates) 650 606 524 576
Very High Need ‐
Freshmen
35%
(minimum)
48% 43% 43%
5g. Admissions
Admissions
Trends
Target
(2014) Fall 2010 Fall 2011 Fall 2012 Fall 2013 Indicator
Applied 51,000 54,871 52,972 51,634 51,207
Accepted 27,250 24,993 25,998 27,449 26,932
Acceptance
Rate 53% 46% 49% 53% 53%
Enrolled 3,000 3,117 2,763 2,792 2,794
Yield Rate
(Matriculation) 11% 12% 11% 10% 10%
5h. Financial Aid (Business Affairs)
Target
(2014)
Projected
FY14 FY12 FY13 Indicator
% of undergraduates
receiving financial aid N/A 97% 94% 97%
6. INSTITUTIONAL ADVANCEMENT
6a. Gifts and Donors (Totals and Number of Donors –IA)
Target
(2014)
2011‐
2012
2012‐
2013 Indicator
Amount of gifts received ($ in millions) 20 20.5 16
Number of donors ( # in thousands) 20 13.5 11.4
Updated as of December 2013 Prepared by Institutional Research (sg) 10
Admissions
Gifts and Donors
External Transfers (Undergraduate)
Very High Need ‐ Freshmen
UG Financial Aid (%)

6b. Gifts and Donors (New Pledges and Athletics‐ IA)
Target
(2014)
FY12 FY13
Indicator
New Pledges ($) $7,330,000 $5,704,580 $3,892,793
Athletics ($) $1,200,000 $1,529,961 $2,182,110
6c. Alumni Giving Rate – US News and World Report
Alumni Giving Rate (UG)
Target
(2014)
2012
Edition
2013
Edition
2014
Edition Indicator
St. John’s University 18% 8% 7% 6%
Last 10 Institutions of top 125 N/A 9% 10% 11% N/A
6d. Alumni Donors ‐ Graduate (IA)
Alumni Giving Rate
Target
(FY14)
FY12 FY13
Indicator
% of participation TBD 14% 6%
Alumni Donors ‐ Graduate
Updated as of December 2013 Prepared by Institutional Research (sg) 11
New Pledges and Athletics ‐ IA
Alumni Giving Rate ‐ Undergraduate

7. Accreditation Update
7a. Accreditation Update
Accrediting Agency Program/Unit
Accredited Action Commendations Follow-up required Next Action
4001
American Bar Association (ABA)
School of Law: J.D.
2/26/13 ABA decision letter in response to
8/29/12 Univ response affirms compliance with
Standard 504(a) and affirms accreditation.
4002 American Bar Association
(ABA) CPS: B.S. Legal Studies
Accreditation reaffirmed Dec. 19,
2011
Self-study report submitted June 10, 2013. Site visit
anticipated Fall 2013, after which reaccreditation for 7
more years anticipated to be awarded in Feb 2014.
4003 Accreditation Council for
Pharmacy Education (ACPE) PHA: Pharm. D
Reaccredited 2010, effective until June
20, 2016. 2/7/13 ACPE decision letter in
response to 10/12/12 interim report affirms accreditation status
and compliance (with monitoring for
Standards 17 and 29)
Monitoring Report submission deadline 10/15/14; Next full
review 2015-2016
4004 Accreditation Council for
Pharmacy Education (ACPE) PHA: Continuing
Education
Reaccredited 2009; effective through
June 30, 2014.
Self-study due February 1, 2014
4005
Accreditation Review Commission on Education for the Physician Assistant
(ARC-PA)
PHA: B.S. Physician Assistant
Site visit conducted Oct 11-12, 2012;
Continued accreditation status granted on 3/28/13, effective through
March 2020.
3/28/13 notice of continued
accreditation noted 6 areas of
noncompliance with the Standards and
required a response by 7/1/13; response was sent on 6/30/13.
Next scheduled program review date is approximately
March 2020. Change in degree form in preparation.
4006 American Library Association (ALA)
ALA-SJC: M.L.S. Library and
Information Science
Reaccredited 1/23/2012
Update on assessment practices
and results to be included in Biennial narrative report due December 1, 2013
Comprehensive Review Fall 2018
4007 American Psychological
Association (APA)
SJC: Ph.D. Clinical Psychology
Reaccredited 2008; effective through
2015. Self-study to be submitted 2015
4008 American Psychological
Association (APA)
SJC: Psy.D. School Psychology
Reaccredited July 2012 for 7 years; effective through
2019
Program is commended for its commitment to ongoing self-
study.
Follow-up report submitted 8/30/13,
addressing compliance with
standards regarding public disclosure and program philosophy,
objectives and training plan.
Awaiting approval of follow-up report
Updated as of December 2013 Prepared by Institutional Research (sg) 12

4009 Association to Advance
Collegiate Schools of Business (AACSB)
TCB: All undergraduate and graduate programs;
Accounting separately accredited.
Reaccredited 2009; effective until 2015
Draft self-study currently
undergoing internal review
4010 Association to Advance
Collegiate Schools of Business (AACSB)
TCB: Accounting Reaccredited 2009;
effective until 2015 . Self-study under development
4011
Council on Academic Accreditation- American
Speech-Language-Hearing Association (CAA)
SJC: M.A. Speech Language Pathology
Accreditation reaffirmed July 14,
2011; effective 10/1/11 - 9/30/19
Annual Report was submitted 8/1/12
addressing 3 deficiencies
Program found to “meet or
exceed” expectations for
student achievement in
program completion,
employment, PRAXIS results
CAA 1/2/13 response to 8/1/12 annual
report explains that next annual report
due 8/1/13 must address two areas of
partial non-compliance
(standard 1.7 and 2.0).
Annual report submitted on
7/30/13.
Awaiting approval of annual report.
4013
Council for Accreditation of Counseling and Related
Education Programs (CACREP)
EDU: M.S.Ed. Clinical Mental Health
Counseling; School Counseling
Accredited for two-year period with
conditions through October 31, 2014
Faculty and administration
are congratulated for the time, energy, and commitment
given throughout the
process
3 standards (N, AA.6, and C.4) must be addressed and
implemented prior to the expiration of two-year conditional
accreditation period.
Interim Report Due to CACREP before April 1, 2014; CACREP
Board will review in July 2014; upon favorable review these
programs would continue their accreditation status until March
31, 2019
4014
Joint Review Committee on Education Programs in Radiologic Technology
(JRCERT)
PHA: B.S. Radiologic Technology
Reaccredited in Sept. 2013 for 8 years, the maximum duration
that may be awarded by the Committee.
Projected date for interim report is fourth quarter of
2016.
Next site visit tentatively scheduled for the fourth
quarter of 2020.
4015 Middle States Association
Commission on Higher Education (MSCHE)
Entire Institution Accreditation
reaffirmed Nov. 17, 2011
“Quality of the Periodic Review
Report”
Preparations underway for self-study and site visit 2015-16.
4016
National Accrediting Agency for Clinical Laboratory Sciences
(NAACLS)
PHA: B.S. Clinical Laboratory Sciences
By letter dated April 12, 2012, Program
awarded continuing accreditation until
April 30, 2017
Self-Study due April 1, 2016
4017 Teacher Education
Accreditation Council (TEAC)
EDU: All teacher preparation programs
Reaccredited September 30, 2011;
effective through September 30, 2021
Annual reports are due on Oct 30th of each year from 2012-2016. First
report submitted on 10/30/12. The one weakness-lack of congruence bet. Evaluations by supervisors & cooperating
teachers of student teachers-addressed by 5th annual report
on 10/30/16.
2nd annual report is due Oct. 30, 2013.
Updated as of December 2013 Prepared by Institutional Research (sg) 13