combination of hargreaves method and linear...
TRANSCRIPT
Available online at www.sciencedirect.com
www.elsevier.com/locate/solener
Solar Energy 85 (2011) 2871–2880
Combination of Hargreaves method and linear regression asa new method to estimate solar radiation in Perlis, Northern Malaysia
I. Daut, M. Irwanto ⇑, Y.M. Irwan, N. Gomesh, N.S. Ahmad
School of Electrical System Engineering, Universiti Malaysia Perlis (UniMAP), Kangar 01000, Malaysia
Received 30 January 2011; received in revised form 18 July 2011; accepted 18 August 2011Available online 13 September 2011
Communicated by: Associate Editor Frank Vignola
Abstract
The best way to obtain the solar radiation data of a particular place of interest (POI) is to measure at the specific site continuously andaccurately over the long term. However, due to financial, maintenance, calibration requirement of the measuring equipment or institu-tional limitations, these data are absent, incomplete or inaccessible in most areas of the world. Based on meteorological data fromChuping Station, Perlis which is at Northern Malaysia, there were several missing data of solar radiation for the year 2007 and 2008.This paper presents a new method to estimate the solar radiation which is a combination of Hargreaves method and linear regression.Normally, both regression coefficients, a and b of the linear regression are found based on the measured data, but using the proposedmethod, both regression coefficients based on the Hargreaves method with the correlated parameter, x is the difference of daily temper-ature. This paper also presents the basic knowledge of Hargreaves method before the proposed method is implemented. As validation,those solar radiation data that are measured by Chuping Station for the year 2006 and by Electrical Energy and Industrial ElectronicSystem (EEIES) Cluster Station for the month of March–June 2011 and their estimated solar radiation data are compared and analyzedusing coefficient of residual mass (CRM), root mean squared error (RMSE), Nash–Sutcliffe equation (NSE) and percentage error (e).The statistical analysis of the average monthly measured solar radiation data for the past 26 years (1979–2006) is compared with theestimated solar radiation data for 3 years (2006–2008). The proposed method result shows that the value of CRM is closer to zero whichindicates that the proposed method is perfectly estimated, the values of RMSE are low value, this indicates that the method performswell, the value of NSE is closer to 1 which indicates that the estimated solar radiation match perfectly with the measured data taken forthe past 26 years, the value of e is closer to zero which indicates that the proposed method is acceptable and applicable.� 2011 Elsevier Ltd. All rights reserved.
Keywords: Solar radiation; Temperature; Hargreaves method; Linear regression; Statistic analysis
1. Introduction
Solar radiation is a primary driver for many physics,chemical and biology processes on the earth’s surface, andcomplete and accurate solar radiation data at a specificregion are of considerable significance for such researchand application fields as architecture, industry, agriculture,environment, hydrology, agrology, meteorology, limnology,oceanography, ecology and solar energy system (Wu et al.,
0038-092X/$ - see front matter � 2011 Elsevier Ltd. All rights reserved.
doi:10.1016/j.solener.2011.08.026
⇑ Corresponding author.E-mail address: [email protected] (M. Irwanto).
2007; Almorox and Hontoria, 2003). The solar radiationdata is the most important component to estimate outputof photovoltaic systems (Markvart, 1994; Itagaki et al.,2003; Mellit et al., 2007).
The best solar radiation data at the place of interestwould be that measured at this specific site continuouslyand accurately over the long term. However, due to finan-cial, maintenance, calibration requirement of the measur-ing equipment or institutional limitations, these data areabsent, incomplete or inaccessible in most areas of theworld (Wu et al., 2007; Almorox and Hontoria, 2003;Muneer et al., 2007; Yorukoglu and Celik, 2006).
2872 I. Daut et al. / Solar Energy 85 (2011) 2871–2880
Based on Meteorological Station in Chuping Perlis,Northern Malaysia, the solar radiation data was notrecorded on April 2007–December 2008. This seriously hin-ders the progress of much research that requires solar radia-tion as a key driving input, especially to estimate output ofphotovoltaic systems. Therefore, various methods have beenexplored in order to estimate, with reasonable accuracy, thesolar radiation from other available meteorological data.Hargreaves method (Almorox and Hontoria, 2003; Chine-ke, 2007; Bandyopadhyay et al., 2008; Gavalian et al.,2005), linear regression and its multiple (Inci and Emin,1998), linear regression analysis using the Angstrom-typerelationships (Luhanga and Andringga, 1990; Chun andLee, 1981) have been applied to estimate the solar radiation.
This paper presents a new method to estimate the solarradiation which is a combination of Hargreaves methodand linear regression. Normally, both regression coeffi-cients, a and b of linear regression are found based onthe measured data, but using the proposed method, bothregression coefficients based on the Hargreaves methodwith the correlated parameter, x is the daily difference oftemperature. This paper also presents the basic knowledgeof Hargreaves method before the proposed method isimplemented. As validation, those solar radiation data thatare measured by Chuping Station for the year 2006 and byElectrical Energy and Industrial Electronic System(EEIES) Cluster Station for the month of March–June2011 and their estimated solar radiation data are comparedand analyzed using coefficient of residual mass (CRM),root mean squared error (RMSE), Nash–Sutcliffe equation(NSE) and percentage error (e). The statistical analysis ofthe average monthly measured solar radiation data forthe past 26 years (1979–2006) is compared with the esti-mated solar radiation data for 3 years (2006–2008).
2. Data and methods
2.1. Climate data
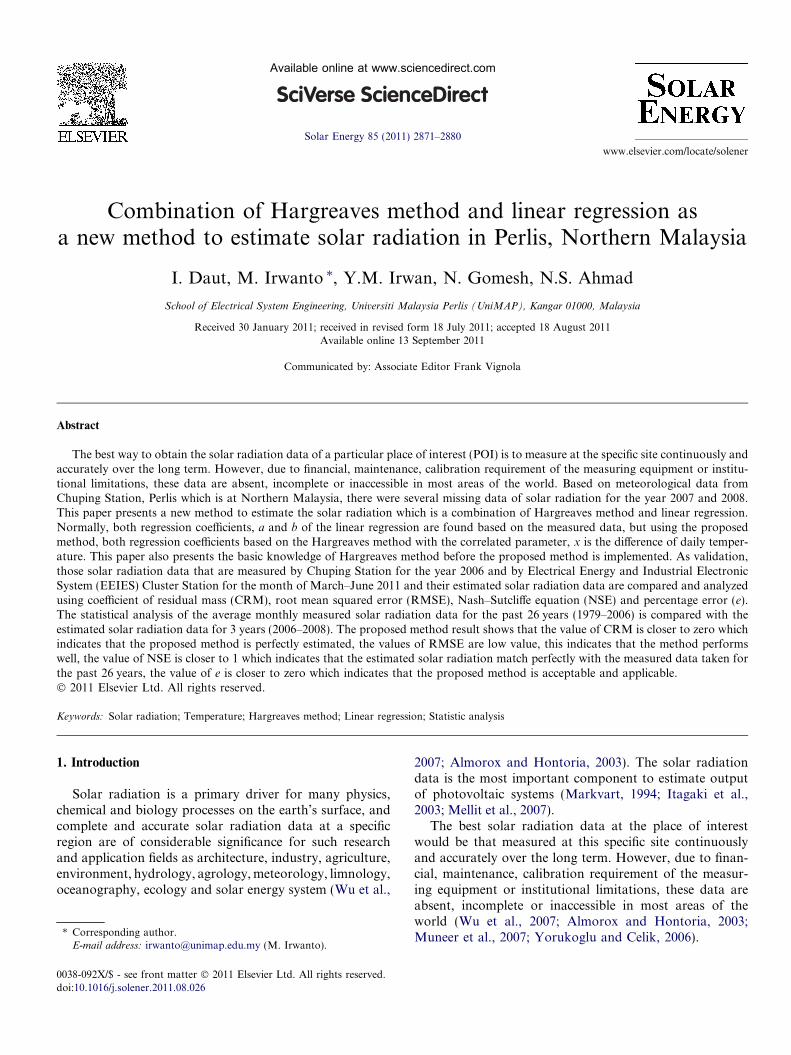
Based on Meteorological Station in Chuping, state ofPerlis, as shown in Fig. 1, Perlis (6� 290N, 100� 160E) hasabout 795 square kilometers land area, which is 0.24% ofthe total land area of Malaysia, with a population about204450 people (Yorukoglu and Celik, 2006). Perlis’s cli-mate is tropical monsoon. Its temperature is relatively uni-form within the range of 21–32 �C throughout the year.During the months of January–April, the weather is gener-ally dry and warm. Humidity is consistently high on thelowlands ranging between 82% and 86% per year. Theaverage rainfall per year is 2032–2540 mm and the wettestmonths are from May to December.
2.2. Data collection
The data collection of temperature and solar radiationare obtained from two weather stations. The first is Mete-orological Station in Chuping and the second is EEIES
Cluster Station in Kangar, Perlis, Northern Malaysia. Bothweather stations use Vantage Weather Station Pro2.
The Chuping Station is set to record hourly temperatureand solar radiation, from the hourly data can be calculatedthe daily data. They consist of daily solar radiation, maxi-mum, minimum and average temperature. The ChupingStation has a technical problem of solar radiation sensorfor the year 2007–2008, therefore the solar radiation cannot be recorded. The number of missing data and unit ofeach item for the year 2006–2008 is shown in Table 1.
Based on Table 1, it shows that there is no missing datafor the year 2006, while 9 and 12 months missing data ofsolar radiation for the year 2007 and 2008, respectively.Using the proposed method, the solar radiation for theyear 2007 and 2008 can be estimated.
EEIES Cluster Station is installed in front of a Clusterof Electrical Energy and Industrial Electronic System(EEIES), Universiti Malaysia Perlis (UniMAP), Kangar,Perlis, Northern Malaysia. The temperature and solar radi-ation are recorded every minute. For analyzing daily tem-perature and solar radiation, the data is observed on07.00 am to 07.00 pm to obtain the minimum, maximumand difference of temperature, and also taken the averagedaily solar radiation.
2.3. Hargreaves method
Hargreaves and Samani (1982) first suggested that thesolar radiation (Rs) can be estimated from the differencebetween maximum and minimum air temperature using asimple equation (Almorox and Hontoria, 2003; Chineke,2007; Bandyopadhyay et al., 2008):
Rs ¼ a � RaðT max � T minÞ0:5 ð1Þwhere Rs is in MJ m�2 d�1; Tmax and Tmin are daily maxi-mum and minimum air temperature, in �C, respectively, Ra
is extraterrestrial radiation, in MJ m�2 d�1 which is a func-tion of latitude and day of the year; and a is an empiricalcoefficient, the value of a to be 0.16 for interior regionsand 0.19 for coastal regions.
The value of Ra is given by
Ra ¼ ð1440=pÞ � SC �DF � ðcos / � cos d � sin W s þ W s
� sin / � sin dÞ ð2Þ
SC is solar constant (1367 W/m2 or 0.082 MJ m�2 min�1)DF is eccentricity correction factor of the earth’s orbit,
can be calculated by the expression:
DF ¼ 1:0þ 0:033 � cosð2 � p � ðJulian Day=365ÞÞ ð3Þ/ is latitude of the site, can be calculated by the
expression:
/ ¼ latitude � p=180 ð4Þd is solar declination, can be calculated by the
expression:
d ¼ ð23:45 � p=180Þ � sinð2 � p � ð284
þ Julian DayÞ=365Þ ð5Þ
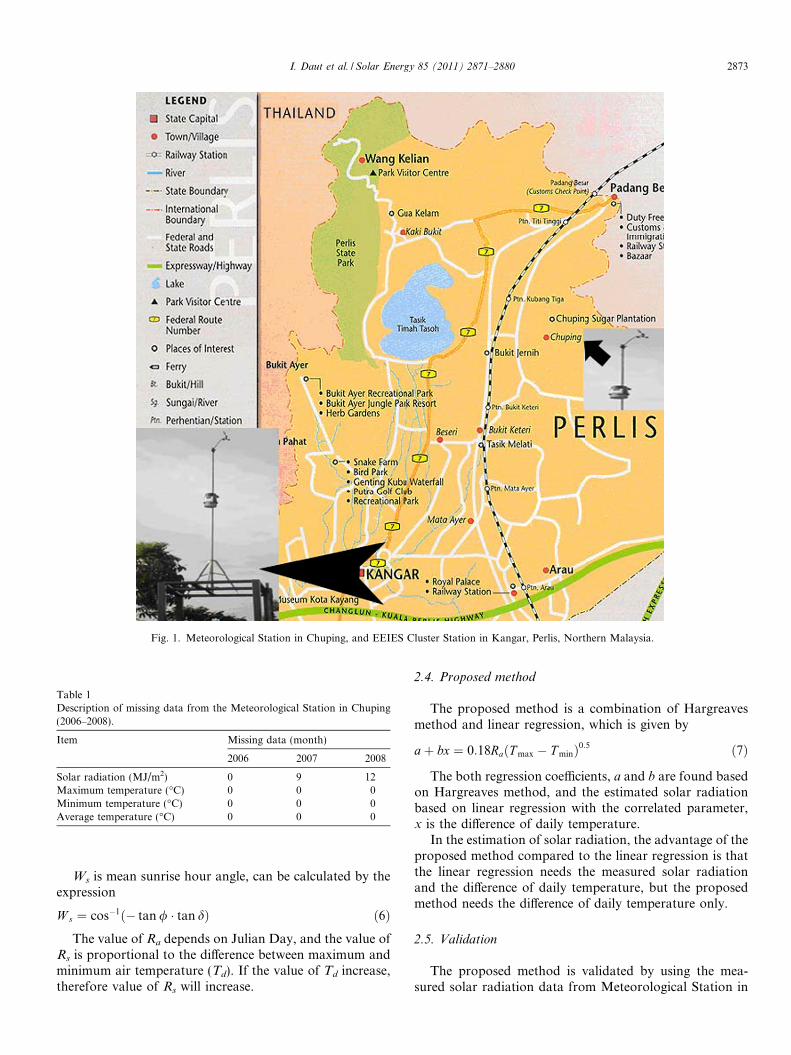
Fig. 1. Meteorological Station in Chuping, and EEIES Cluster Station in Kangar, Perlis, Northern Malaysia.
Table 1Description of missing data from the Meteorological Station in Chuping(2006–2008).
Item Missing data (month)
2006 2007 2008
Solar radiation (MJ/m2) 0 9 12Maximum temperature (�C) 0 0 0Minimum temperature (�C) 0 0 0Average temperature (�C) 0 0 0
I. Daut et al. / Solar Energy 85 (2011) 2871–2880 2873
Ws is mean sunrise hour angle, can be calculated by theexpression
W s ¼ cos�1ð� tan / � tan dÞ ð6ÞThe value of Ra depends on Julian Day, and the value of
Rs is proportional to the difference between maximum andminimum air temperature (Td). If the value of Td increase,therefore value of Rs will increase.
2.4. Proposed method
The proposed method is a combination of Hargreavesmethod and linear regression, which is given by
aþ bx ¼ 0:18RaðT max � T minÞ0:5 ð7Þ
The both regression coefficients, a and b are found basedon Hargreaves method, and the estimated solar radiationbased on linear regression with the correlated parameter,x is the difference of daily temperature.
In the estimation of solar radiation, the advantage of theproposed method compared to the linear regression is thatthe linear regression needs the measured solar radiationand the difference of daily temperature, but the proposedmethod needs the difference of daily temperature only.
2.5. Validation
The proposed method is validated by using the mea-sured solar radiation data from Meteorological Station in

2874 I. Daut et al. / Solar Energy 85 (2011) 2871–2880
Chuping for the year 2006 and for the past 26 years (1979–2006) and from EEIES Cluster Station in Kangar for themonth of March–June 2011. The validation of the methodis evaluated on the basic of the following statistical analy-sis. Then, the missing data of solar radiation for the year2007 and 2008 are estimated by using the method.
0 50 100 150 200 250 300 3500
5
10
15
20
25
30
35
40
Daily of the year
Tem
pera
ture
(deg
rees
C)
Minimum temperature Maximum temperature Difference of temperature
Fig. 2. Temperature throughout the year of 2006 recorded by ChupingStation in Perlis.
2.6. Statistical analysis
Daily estimated solar radiation (RSest) values were com-pared with measured (RSmea) values. To assess the predic-tive accuracy for daily solar radiation estimation, fourperformance indicator were used, namely, coefficient ofresidual mass (CRM), root mean squared error (RMSE),Nash–Sutcliffe equation (NSE) and percentage error (e)expressed as a percentage of the arithmetic mean of themeasured solar radiation (Almorox and Hontoria, 2003;Bandyopadhyay et al., 2008; Gavalian et al., 2005; Mengeset al., 2006; Chen et al., 2003, 2006; Supit and Kappel,1998; Prieto et al., 2009):
CRM ¼Pn
i¼1RSmea;i �Pn
i¼1RSest;iPni¼1RSmea;i
ð8Þ
where RSmea,i is the measured daily solar radiation at i day,RSest,i is the estimated daily solar radiation at i day, RSmea isthe average measured solar radiation and n is the day num-ber of estimated solar radiation.
CRM indicates overall under- or over estimation. Forperfect estimation, the value of CRM would be zero. Apositive value of CRM indicates the tendency of the esti-mation model to under – estimate the measured solar radi-ations, whereas, a negative CRM indicates a tendency toover-estimate the measured solar radiations.
RMSEð%Þ ¼
ffiffiffiffiffiffiffiffiffiffiffiffiffiffiffiffiffiffiffiffiffiffiffiffiffiffiffiffiffiffiffiffiPn
i¼1ðRSest;i�RSmea;iÞ2
n
r
RSmea� 100 ð9Þ
The RMSE is expressed as percentage to make it dimen-sionless, a lower value of it indicates better performance.
NSE ¼ 1�Pn
i¼1ðRSmea;i � RSest;iÞ2Pni¼1ðRSmea;i � RSmeaÞ2
ð10Þ
NSE is also known as coefficient of determination (R2),a model is more efficient when NSE is closer to 1 when allthe estimated solar radiations match perfectly with themeasured ones. A lower value (close to zero) of NSE indi-cates poor performance of the estimation model used and anegative value indicates that the estimated solar radiationsare worse than simply using measured mean.
eð%Þ ¼ RSmea;i � RSest;i
RSmea;i� 100 ð11Þ
A relative percentage error between �10% and +10% isconsidered acceptable. The mean percentage error can bedefined as the percentage deviation of the estimated andmeasured monthly average daily solar radiation.
3. Result and discussion
The data of temperature and solar radiation that arerecorded by Meteorological Station in Chuping for theyear 2006 and also for the past 26 years (1979–2006) andby EEIES Cluster Station in Kangar for the month ofMarch–June 2011 used to validate the measured and esti-mated data using three methods (Hargreaves, linear regres-sion and proposed method). The missing data of solarradiation for the year 2007 and 2008 are estimated usingthe three methods.
3.1. Temperature and solar radiation for the year 2006 inChuping Station and for the month of March–June 2011 in
EEIES Cluster Station
Solar radiation (Rs) is effected by the difference betweenmaximum and minimum air temperature (Td). Rs is pro-portional to Td, if the value of Td increase, so value of Rs
will increase. The temperature throughout the year of2006 recorded by Chuping Station is shown in Fig. 2.Based on the minimum temperature graph, its lowest andaverage value are 19.8 �C on 22 January and 24.31 �C.Based on the maximum temperature graph, its highestand average value are 36.8 �C on 12 March and 32.36 �C.Based on the difference of temperature graph (differencebetween maximum and minimum temperature), its lowest,highest and average value are 1.80 �C on 20 May, 13.20 �Con 22 January and 13 March and 8.04 �C.
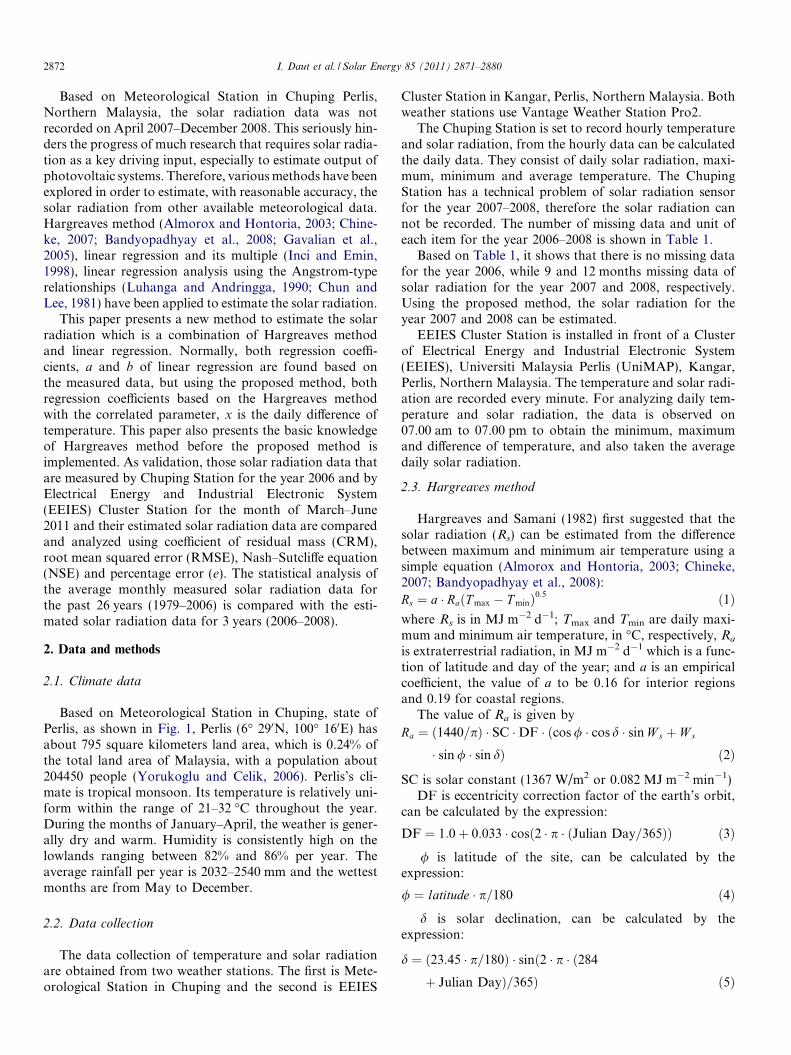
The temperature throughout the month of March–June2011 recorded by EEIES Cluster Station in Kangar, Perlisis shown in Fig. 3. Based on the minimum temperaturegraph, its lowest and average value are 19.8 �C on 22
60 80 100 120 140 160 1800
5
10
15
20
25
30
35
40
Daily of the year
Tem
pera
ture
(deg
rees
C)
Minimum temperature Maximum temperature Difference of temperature
Fig. 3. Temperature throughout the month of March–June 2011 recordedby EEIES Cluster Station in Kangar, Perlis.
Jan Feb Mar Apr May Jun Jul Aug Sep Oct Nov Dec0
5
10
15
20
25
30
35
Tem
pera
ture
(deg
rees
C)
Month of the year
Minimum temperature Maximum temperature Difference of temperature
Fig. 4. Monthly average temperature recorded by Chuping Station inPerlis for the year 2006.
Mar Apr May Jun0
5
10
15
20
25
30
35
Tem
pera
ture
(deg
rees
C)
Month of the year
Minimum temperature Maximum temperature Difference of temperature
Fig. 5. Monthly average temperature recorded by EEIES Cluster Stationin Kangar Perlis for the month of March–June 2011.
I. Daut et al. / Solar Energy 85 (2011) 2871–2880 2875
January and 24.31 �C. Based on the maximum temperaturegraph, its lowest and average value are 23.40 �C on 30March and 25.20 �C. Based on the difference of tempera-ture graph (difference between maximum and minimumtemperature), its lowest value is 0.80 �C on 30 May, atthe time a big flood happen in Perlis, the sky is very darkand rain fall dawn a long day, therefore the solar radiationis very low as shown in Fig. 7.
Monthly average temperatures recorded by ChupingStation in Perlis for the year 2006 is shown in Fig. 4. Thelowest minimum temperature is 23.55 �C in January. Thehighest maximum temperature is 34.32 �C in March. Thehighest temperature difference is 9.80 �C in March.
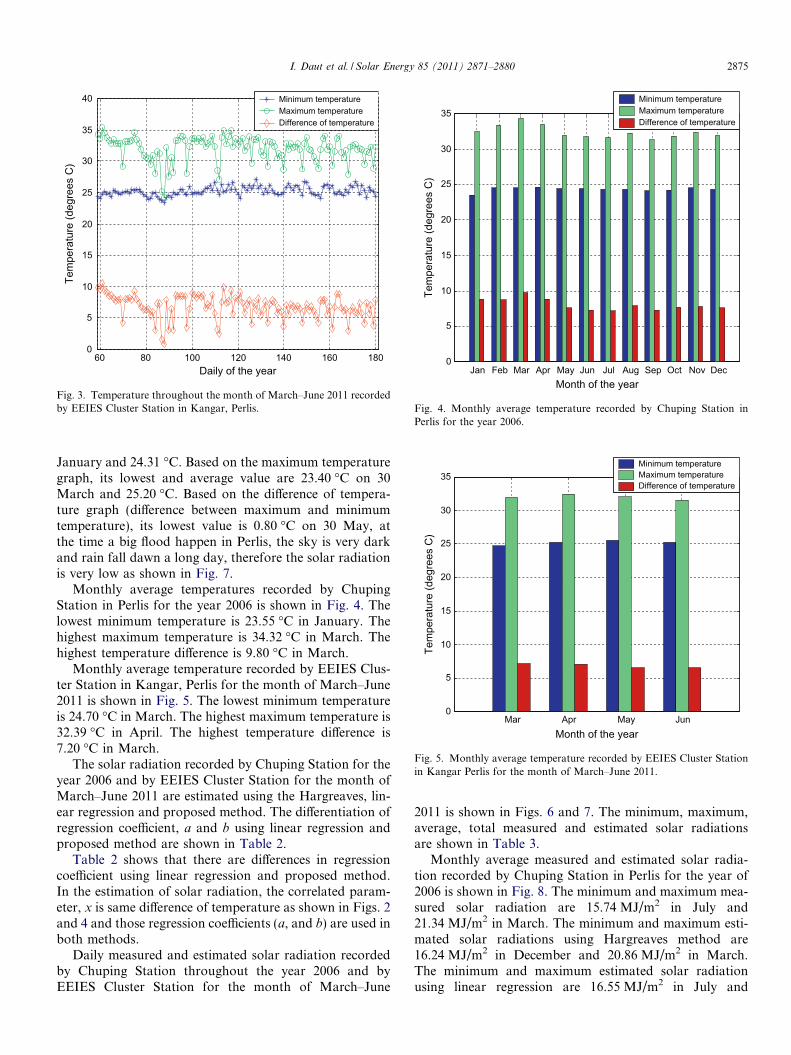
Monthly average temperature recorded by EEIES Clus-ter Station in Kangar, Perlis for the month of March–June2011 is shown in Fig. 5. The lowest minimum temperatureis 24.70 �C in March. The highest maximum temperature is32.39 �C in April. The highest temperature difference is7.20 �C in March.
The solar radiation recorded by Chuping Station for theyear 2006 and by EEIES Cluster Station for the month ofMarch–June 2011 are estimated using the Hargreaves, lin-ear regression and proposed method. The differentiation ofregression coefficient, a and b using linear regression andproposed method are shown in Table 2.
Table 2 shows that there are differences in regressioncoefficient using linear regression and proposed method.In the estimation of solar radiation, the correlated param-eter, x is same difference of temperature as shown in Figs. 2and 4 and those regression coefficients (a, and b) are used inboth methods.
Daily measured and estimated solar radiation recordedby Chuping Station throughout the year 2006 and byEEIES Cluster Station for the month of March–June
2011 is shown in Figs. 6 and 7. The minimum, maximum,average, total measured and estimated solar radiationsare shown in Table 3.
Monthly average measured and estimated solar radia-tion recorded by Chuping Station in Perlis for the year of2006 is shown in Fig. 8. The minimum and maximum mea-sured solar radiation are 15.74 MJ/m2 in July and21.34 MJ/m2 in March. The minimum and maximum esti-mated solar radiations using Hargreaves method are16.24 MJ/m2 in December and 20.86 MJ/m2 in March.The minimum and maximum estimated solar radiationusing linear regression are 16.55 MJ/m2 in July and

Table 2Regression coefficient.
Method Regression coefficient
a b
Chuping EEIES Cluster Chuping EEIES Cluster
Linear regression 2.733 6.147 1.91 1.465Proposed 8.297 7.224 1.226 1.451
0 50 100 150 200 250 300 3500
5
10
15
20
25
30
Daily of the year
Sola
r rad
iatio
n (M
J/m
.m)
Meteorological dataHargreaves method Linear regression Proposed method
Fig. 6. Daily solar radiation recorded by Chuping Station throughout theyear 2006.
60 80 100 120 140 160 1800
5
10
15
20
25
30
Daily of the year
Sola
r rad
iatio
n (M
J/m
.m)
Meteorological dataHargreaves model Linear regression Proposed model
Fig. 7. Daily solar radiation recorded by EEIES Cluster Stationthroughout the month of March–June 2011.
2876 I. Daut et al. / Solar Energy 85 (2011) 2871–2880
21.44 MJ/m2 in March. The minimum and maximum esti-mated solar radiation using proposed method are17.16 MJ/m2 in July and 20.31 MJ/m2 in March,respectively.
Monthly average measured and estimated solar radia-tion recorded by EEIES Cluster Station in Kangar, Perlisfor the month of March–June 2011 is shown in Fig. 9.The minimum and maximum measured solar radiationare 13.61 MJ/m2 in June and 18.87 MJ/m2 in April. Theminimum and maximum estimated solar radiations usingHargreaves method are 15.96 MJ/m2 in June and17.77 MJ/m2 in April. The minimum and maximum esti-mated solar radiation using linear regression are15.28 MJ/m2 in June and 16.69 MJ/m2 in March. The min-imum and maximum estimated solar radiation using pro-posed method are 16.27 MJ/m2 in June and 17.67 MJ/m2
in March, respectively.
3.2. Statistical analysis
The comparison of measured and estimated solar radia-tion from the daily measured temperature is expressed byCRM, RMSE, NSE and e, as shown in Table 4.
Table 4 shows that the values of CRM are closer to zero,they indicate that the methods are perfect estimation. The
value of CRM using Hargreaves and proposed methodshow negative value, they indicate that the tendencies ofthe estimation method to over-estimate the measured solarradiation. The values of RMSE are low value, this indicatesthat the method performs well. The values of NSE areabove 0.33. The values of e are around �1.678% and3.3%, they indicate that the estimation models are accept-able and applicable.
3.3. Temperature and solar radiation for the year 2007 and
2008
Using Hargreaves method, linear regression and pro-posed method, based on the difference between maximumand minimum air temperature, the solar radiation for theyear 2007 and 2008 can be estimated. The temperaturethroughout the year 2007 and 2008 in Perlis are shown inFigs. 10 and 11. Their lowest, highest and average valueof minimum, maximum and difference temperature areshown in Table 5. The higher maximum temperature willcause the higher solar radiation. Using Hargreavesmethod, linear regression and proposed method, the higherdifference between maximum and minimum air tempera-ture will cause the higher estimated solar radiation.
Daily estimated solar radiation throughout the year2007 and 2008 are shown in Figs. 12 and 13. The minimum,maximum, average and total estimated solar radiationsusing Hargreaves, linear regression and proposed methodare shown in Table 6.
Figs. 14 and 15 show the monthly average estimatedsolar radiation in Perlis for the year 2007 and 2008. Theminimum and maximum estimated solar radiation usingHargreaves, linear regression and proposed method areshown in Table 7.
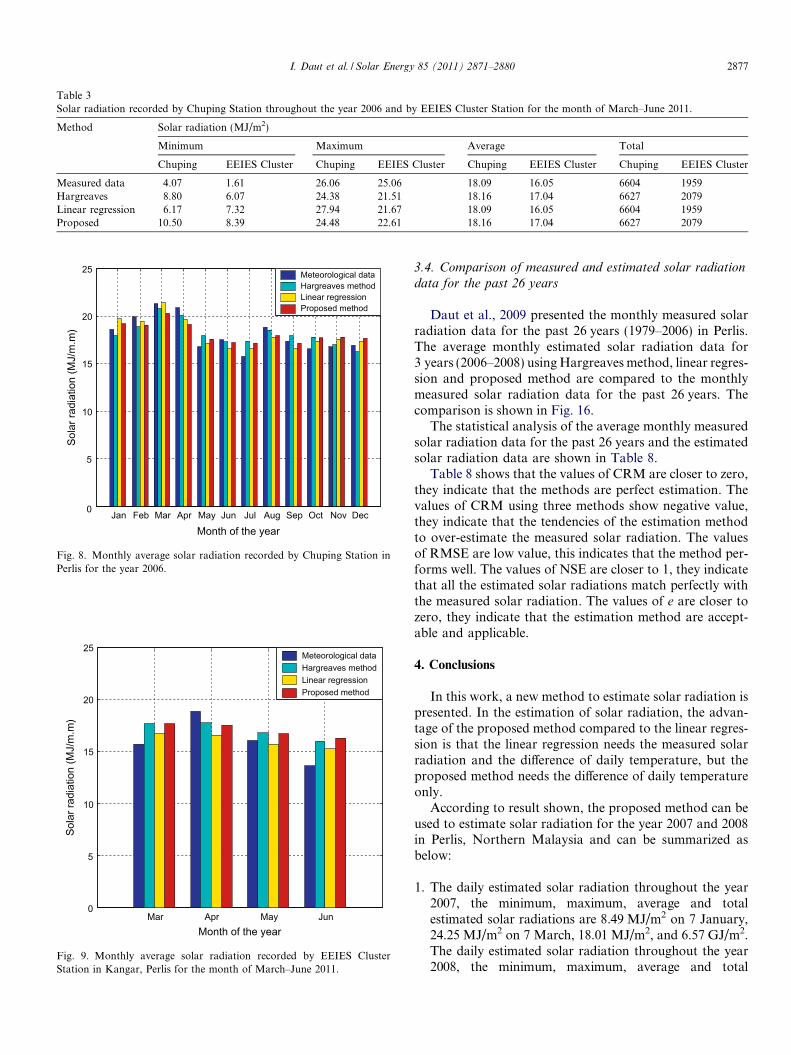
Table 3Solar radiation recorded by Chuping Station throughout the year 2006 and by EEIES Cluster Station for the month of March–June 2011.
Method Solar radiation (MJ/m2)
Minimum Maximum Average Total
Chuping EEIES Cluster Chuping EEIES Cluster Chuping EEIES Cluster Chuping EEIES Cluster
Measured data 4.07 1.61 26.06 25.06 18.09 16.05 6604 1959Hargreaves 8.80 6.07 24.38 21.51 18.16 17.04 6627 2079Linear regression 6.17 7.32 27.94 21.67 18.09 16.05 6604 1959Proposed 10.50 8.39 24.48 22.61 18.16 17.04 6627 2079
Jan Feb Mar Apr May Jun Jul Aug Sep Oct Nov Dec0
5
10
15
20
25
Sola
r rad
iatio
n (M
J/m
.m)
Month of the year
Meteorological dataHargreaves method Linear regression Proposed method
Fig. 8. Monthly average solar radiation recorded by Chuping Station inPerlis for the year 2006.
Mar Apr May Jun0
5
10
15
20
25
Sola
r rad
iatio
n (M
J/m
.m)
Month of the year
Meteorological dataHargreaves method Linear regression Proposed method
Fig. 9. Monthly average solar radiation recorded by EEIES ClusterStation in Kangar, Perlis for the month of March–June 2011.
I. Daut et al. / Solar Energy 85 (2011) 2871–2880 2877
3.4. Comparison of measured and estimated solar radiation
data for the past 26 years
Daut et al., 2009 presented the monthly measured solarradiation data for the past 26 years (1979–2006) in Perlis.The average monthly estimated solar radiation data for3 years (2006–2008) using Hargreaves method, linear regres-sion and proposed method are compared to the monthlymeasured solar radiation data for the past 26 years. Thecomparison is shown in Fig. 16.
The statistical analysis of the average monthly measuredsolar radiation data for the past 26 years and the estimatedsolar radiation data are shown in Table 8.
Table 8 shows that the values of CRM are closer to zero,they indicate that the methods are perfect estimation. Thevalues of CRM using three methods show negative value,they indicate that the tendencies of the estimation methodto over-estimate the measured solar radiation. The valuesof RMSE are low value, this indicates that the method per-forms well. The values of NSE are closer to 1, they indicatethat all the estimated solar radiations match perfectly withthe measured solar radiation. The values of e are closer tozero, they indicate that the estimation method are accept-able and applicable.
4. Conclusions
In this work, a new method to estimate solar radiation ispresented. In the estimation of solar radiation, the advan-tage of the proposed method compared to the linear regres-sion is that the linear regression needs the measured solarradiation and the difference of daily temperature, but theproposed method needs the difference of daily temperatureonly.
According to result shown, the proposed method can beused to estimate solar radiation for the year 2007 and 2008in Perlis, Northern Malaysia and can be summarized asbelow:
1. The daily estimated solar radiation throughout the year2007, the minimum, maximum, average and totalestimated solar radiations are 8.49 MJ/m2 on 7 January,24.25 MJ/m2 on 7 March, 18.01 MJ/m2, and 6.57 GJ/m2.The daily estimated solar radiation throughout the year2008, the minimum, maximum, average and total

Table 4Statistical analysis.
Method Statistical analysis
CRM RMSE NSE e (%)
Chuping EEIES Cluster Chuping EEIES Cluster Chuping EEIES Cluster Chuping EEIES Cluster
Hargreaves �0.0035 �0.0614 0.1725 0.2148 0.5118 0.3667 3.188 �1.678Linear regression 0 0 0.1625 0.2111 0.567 0.388 2.488 4.155Proposed �0.0035 �0.0614 0.1756 0.2199 0.4941 0.3362 3.328 �1.541
0 50 100 150 200 250 300 3500
5
10
15
20
25
30
35
40
Daily of the year
Tem
pera
ture
(deg
rees
C)
Minimum temperature Maximum temperature Difference of temperature
Fig. 10. Temperature throughout the year 2007 in Perlis.
0 50 100 150 200 250 300 3500
5
10
15
20
25
30
35
40
Daily of the year
Tem
pera
ture
(deg
rees
C)
Minimum temperature Maximum temperature Difference of temperature
Fig. 11. Temperature throughout the year 2008 in Perlis.
Table 5Temperature throughout the year 2007 and 2008 in Perlis.
Temperature (�C)
Minimum Maximum Difference
2007 2008 2007 2008 2007 2008
Lowest value 21.5 22.00 24.10 24.50 0.6 0.8Highest value 26.30 25.90 36.5 35.6 13.60 12.20Average value 24.29 23.88 32.22 31.83 7.93 7.94
0 50 100 150 200 250 300 3500
5
10
15
20
25
30
Daily of the year
Sola
r rad
iatio
n (M
J/m
.m)
Hargreaves methodLinear regressionProposed method
Fig. 12. Daily solar radiation throughout the year 2007.
2878 I. Daut et al. / Solar Energy 85 (2011) 2871–2880
estimated solar radiations are 8.58 MJ/m2 on 25 Novem-ber, 23.65 MJ/m2 on 22 February, 18.02 MJ/m2, and6.58 GJ/m2.
2. The comparison of measured and estimated solar radia-tion recorded by Chuping Station for the year of 2006and by EEIES Cluster Station for the month ofMarch–June 2011, the proposed method shows thatthe value of CRM is closer to zero, it indicates thatthe method is perfect estimation. The value of RMSEis low value, it indicates that the method has good per-formance. The value of e indicates that the proposedmethod is acceptable and applicable.
3. Using the statistical analysis of the measured solar radi-ation data for the past 26 years, the proposed methodshows that that the value of CRM is closer to zero, it

0 50 100 150 200 250 300 3500
5
10
15
20
25
30
Daily of the year
Sola
r rad
iatio
n (M
J/m
.m)
Hargreaves methodLinear regressionProposed method
Fig. 13. Daily solar radiation throughout the year 2008.
Table 6Daily solar radiation throughout the year 2007 and 2008 in Perlis.
Daily solar radiation (MJ/m2)
Hargreaves Linear regression Proposed
2007 2008 2007 2008 2007 2008
Minimum value 4.62 5.39 12.07 14.83 8.49 8.58Maximum value 24.55 22.76 22.58 20.04 24.25 23.65Average value 18.01 18.02 18.09 18.09 18.01 18.02Total value 6570 6580 6600 6600 6570 6580
Jan Feb Mar Apr May Jun Jul Aug Sep Oct Nov Dec0
5
10
15
20
25
Sola
r rad
iatio
n (M
J/m
.m)
Month of the year
Hargreaves methodLinear regressionProposed method
Fig. 14. Monthly average solar radiation in Perlis for the year 2007.
Jan Feb Mar Apr May Jun Jul Aug Sep Oct Nov Dec0
5
10
15
20
25
Sola
r rad
iatio
n (M
J/m
.m)
Month of the year
Hargreaves methodLinear regressionProposed method
Fig. 15. Monthly average solar radiation in Perlis for the year 2008.
Table 7Monthly average solar radiation in Perlis for the year 2007 and 2008.
Monthly average solar radiation (MJ/m2)
Hargreaves Linear regression Proposed
2007 2008 2007 2008 2007 2008
Minimum value 15.35 14.70 17.07 17.35 16.39 15.86Maximum value 21.12 20.42 19.75 18.60 20.63 9.48
Jan Feb Mar Apr May Jun Jul Aug Sep Oct Nov Dec0
5
10
15
20
25
Sola
r rad
iatio
n (M
J/m
.m)
Month of the year
The past 26 yearsHargreaves methodLinear regressionProposed method
Fig. 16. Comparison of the measured solar radiation data for the past26 years and estimated solar radiation data for 3 years.
I. Daut et al. / Solar Energy 85 (2011) 2871–2880 2879
indicates that the method is perfect estimation. Thevalue of RMSE is very low value, it indicates that the
method has very good performance. The value of NSEis closer to 1, it indicates that the estimated solar

Table 8Statistical analysis for the past 26 years.
Method Statistical analysis
CRM RMSE NSE e (%)
Hargreaves �0.002277 0.006694 0.8213 �0.1067Linear regression �0.003753 0.008558 0.708 �0.0015Proposed �0.002307 0.006758 0.8179 0.0183
2880 I. Daut et al. / Solar Energy 85 (2011) 2871–2880
radiation match perfectly with the measured solar radi-ation. The value of e is closer to zero, it indicates thatthe proposed method is acceptable and applicable.
Acknowledgment
This work was supported by Fundamental ResearchGrant Scheme (FRGS) 2010 and has been done by renew-able group of Electrical Energy and Industrial ElectronicSystem Cluster, Universiti Malaysia Perlis (UniMAP).
References
Almorox, J., Hontoria, C., 2003. Global solar radiation estimation usingsunshine duration in Spain. Energy Conversion & Management 45,1529–1535.
Bandyopadhyay, A., Bhadra, A., Raghuwanshi, N.S., Singh, R., 2008.Estimation of monthly solar radiation from measured air temperatureextreme. Agricultural and Forest Meteorology 148, 1707–1718.
Chen, R., Ersi, K., Yang, J., Lu, S., Zhao, W., 2003. Validation of fiveglobal radiation models with measured daily data in China. EnergyConversion & Management 45, 1759–1769.
Chen, R., Kang, E., Lu, L., 2006. New methods to estimate globalradiation based on meteorological data in China. Energy Conversion& Management 47, 2991–2998.
Chineke, T.C., 2007. Equation for estimating global solar radiation indata sparese regions. Renewable Energy 33, 827–831.
Chun, D.G.S., Lee, S.L., 1981. Solar radiation estimates in Malaysia.Solar Energy 26, 33–40.
Daut, I., Sembiring, M., Irwanto, M., Syafawati, N., Hardi, S., 2009.Solar Radiation Potential for Photovoltaic Power Generation Basedon Meteorological Data in Perlis. In: International Conference:Electrical Energy and Industrial Electronic Systems EEIES2009.
Gavalian, P., Lorite, I.J., Tornero, S., Berengena, J., 2005. Regionalcalibration of Hargreaves equation for estimating reference ET in asemiarid environment. Agricultural Water Management 81, 257–281.
Hargreaves, G.H., Samani, Z.A., 1982. Estimating potential evapotrans-piration. Journal of Irrigation and Drainage Engineering-ASCE 108(3), 225–230.
Inci, T.T., Emin, O., 1998. A study for estimating solar radiation in Elazigusing geographical and meteorological data. Energy Conversion &Management 40, 1577–1584.
Itagaki, A., Okamura, H.,Yamada, M., 2003. Preparation of meteoro-logical data set throughout Japan for suitable design of PV Systems.In: 3rd World Conference on Photovoltaic Energy Conversion., 2074–2077.
Luhanga, P.V.C., Andringga, J., 1990. Characteristics of solar radiation atSebele, Gaborone, Botswana. Solar Energy 44, 77–81.
Markvart, T., 1994. Solar Electricity. John Wiley & Sons, LTD, NewYork, pp. 5–19.
Mellit, A., Kalogirou, S.A., Shaari, S., Salhi, H., Arab, A.H., 2007.Methodology for predicting sequences of mean monthly clearnessindex and daily solar radiation data in remote areas application forsizing a stand-alone PV system. Renewable Energy 33, 1570–1590.
Menges, H.O., Ertekin, C., Sonmete, M.H., 2006. Evaluation of globalsolar radiation models for Konya, Turkey. Energy Conversion &Management 47, 3149–3173.
Muneer, T., Younes, S., Munawwar, S., 2007. Discourses on solarradiation modeling. Renewable and Sustainable Energy Reviews 11,551–602.
Prieto, J.I., Garcia, J.C.M., Garcia, D., 2009. Correlation between globalsolar irradiation and air temperature in Asturias, Spain. Solar Energy83, 1076–1085.
Supit, I., Kappel, R.V., 1998. A simple method to estimate globalradiation. Solar Energy 63, 147–159.
Wu, G., Lin, Y., Wang, T., 2007. Method and strategy for modeling dailyglobal solar radiation with measured meteorological data- a case studyin Nanchang station, China. Energy Conversion & Management 48,2447–2452.
Yorukoglu, M., Celik, A.N., 2006. A critical review on the estimation ofdaily global solar radiation from sunshine duration. Energy Conver-sion & Management 47, 2441–2450.