colorado legislative council staff may 2020 | economic revenue … · 2020-05-12 · meredith moon...
TRANSCRIPT

Colorado Legislative Council Staff
May 2020 | Economic & Revenue Forecast Update
May 12, 2020

May 2020 | Economic & Revenue Forecast Update
Contents
Executive Summary ........................................................................................................................................... 3
General Fund Budget Overview ...................................................................................................................... 5
General Fund Revenue .................................................................................................................................... 15
Cash Fund Revenue ......................................................................................................................................... 21
Economic Outlook ........................................................................................................................................... 29
Appendix: Historical Data .............................................................................................................................. 42
Contributors
Kate Watkins, Chief Economist
Marc Carey
Louis Pino
Greg Sobetski
Meredith Moon
Elizabeth Ramey
Debbie Grunlien
Special thanks to Jerry Schierkolk, David Williams, Dan Phillips, Suzanne Keim, and Cathy Eslinger.
Cover photos of the Colorado State Capitol, courtesy of Suzanne Keim.
Legislative Council Staff • State Capitol Building • Denver, Colorado 80203
(303) 866-3521 • [email protected] • http://leg.colorado.gov/EconomicForecasts Legislative Council Staff is the nonpartisan service agency of the Colorado General Assembly.

May 2020 Executive Summary Page 3
Executive Summary
This report presents the budget outlook based on current law and the May 2020 forecast update for
General Fund revenue, cash fund revenue, and TABOR forecasts. This document also includes
summaries of expectations for the U.S. and Colorado economies.
General Fund Budget Outlook
Figures from the Comprehensive Annual Financial Report indicate that the General
Fund ended FY 2018-19 with an 11.2 percent reserve, $448.3 million above the
7.25 percent statutory reserve. Revenue subject to TABOR exceeded the
Referendum C cap by $428.3 million, resulting in a TABOR refund in FY 2019-20. The
TABOR refund obligation will be returned to taxpayers via a temporary income tax
rate reduction for tax year 2019 in addition to fully funding local government
reimbursements for property tax exemptions.
The impacts of the COVID-19 pandemic and related economic contraction that began
in March will result in a significant decline in General Fund revenue over the last
three months of the fiscal year. As a result, an $895.8 million General Fund deficit is
expected at the end of FY 2019-20. This deficit assumes full funding of current law
obligations, including the 7.25 percent statutory reserve, and General Fund transfers
and appropriations, and does not account for changes in expenditures resulting from
the governor’s budget sequestration order. Any changes made to current law
obligations will impact the deficit amount. Revenue subject to TABOR is expected to
fall $1.3 billion below the Referendum C cap.
The economic contraction will reduce General Fund revenue further in FY 2020-21.
The General Assembly has yet to adopt a budget for FY 2020-21. Based on current
law obligations, including transfers and the required 7.25 percent statutory reserve,
if General Fund appropriations are held constant relative to FY 2019-20 levels, the
General Assembly is projected to have a $3.3 billion, or 25.3 percent, shortfall in
revenue. This amount represents the cumulative, two-year impact of revenue
declines, as the deficit from FY 2019-20 is carried over into FY 2020-21. In holding
FY 2019-20 appropriations constant, this amount does not account for any additional
shortfall resulting from the cost of inflation or caseload growth. Revenue subject to
TABOR is expected to fall below the Referendum C cap by $3.3 billion.
Risks to the forecast. The events that have unfolded over the past two months have dramatically
impacted the economy and state revenue. The economic and health policy landscape continue to
evolve and as a result, the General Fund budget faces an uncertain outlook with both upside and
downside risks to the forecast. The pace of the economic recovery in Colorado and nationally will
heavily influence revenue streams, including income and sales tax revenue. These two sources of
revenue have historically accounted for about 95 percent of General Fund revenue. Longer or
repeated periods of reduced economic activity to control the spread of COVID-19 will cause more
severe and longer lasting revenue impacts. Conversely, near-term development and distribution of a
COVID-19 therapy, a stronger than expected resumption of economic activity, and additional federal
fiscal and/or monetary policy support pose near-term upside risks to the forecast.
FY 2018-19
FY 2019-20
FY 2020-21
Unbudgeted
May 2020 Executive Summary Page 4
Cash Fund Revenue
Total cash fund revenue subject to TABOR in the current FY 2019-20 is expected to total $2.24 billion,
a decline of 7.9 percent from the prior year, and decline an additional 7.7 percent to total $2.07 billion
in FY 2020-21. The crude oil market rout, drop in travel activity due to COVID-19-related disruptions,
and closure of casinos will significantly slow collections from severance tax, transportation-related
revenue, and gaming revenue. As the economy improves and COVID-19-related restrictions ease,
collections will recover but remain below FY 2018-19 levels throughout the forecast period.
Unemployment Insurance Trust Fund insolvency. Unemployment insurance benefits paid have seen
an unprecedented increase during the COVID-19-related economic contraction and are expected to
reach $1.6 billion in FY 2019-20 and $2.5 billion in FY 2020-21. As a consequence, the state
Unemployment Insurance Trust Fund is expected to become insolvent by the end of the current fiscal
year, triggering the solvency surcharge beginning January 1, 2021.
Economic Outlook
The impacts of the COVID-19 pandemic and the related public health response of the past two months
have been widespread, leaving no part of the U.S. and Colorado economies untouched. Economic
activity began a steep decline in the first quarter of 2020 and is expected to deepen significantly in the
second quarter, reflecting the impacts of the COVID-19-related business closures, stay-at-home orders,
and travel restrictions. Phased reopening will give rise to a recovery throughout the remainder of the
calendar year—though ongoing restrictions, health concerns, and uncertainty will constrain growth.
Additionally, some business closures and job losses will be permanent, leaving a lasting mark on
economic activity.
The global oversupply of crude oil, met with the more recent COVID-19-related plummet in fuel
demand, has sent crude oil prices to unprecedented lows. As the U.S. oil and gas industry contracts,
upstream and downstream industry impacts are mounting, compounding the impacts of the
COVID-induced recession.
Unprecedented federal stimulus and monetary policy have helped to stabilize and soften the impact
of economic contraction. Yet, the strength of the recovery remains uncertain and dependent on an
effective means to isolate and contain COVID-19. This forecast assumes that a vaccine will not be
available for at least a year, necessitating ongoing social distancing restrictions. Gradual easing of
pervasive and strict March and April restrictions is expected, with more targeted localized
interventions in areas facing outbreaks. Widespread closures are not assumed in this forecast, but are
possible and could result in a more prolonged or protracted recession.
Near-term containment of COVID-19 and/or more rapid development of a vaccine or other treatment
pose upside risks to the outlook. Additional fiscal stimulus and a rise in crude oil prices pose
additional upside risks. Finally, the nation and Colorado are just beginning to reopen after several
weeks of shuttered business and consumer activity. The vibrancy of economic activity could resume
at a stronger pace than forecast, with more limited ripple effects from the shutdown and a more robust
rebound in economic growth. Discussion of the economic outlook begins on page 29, and summaries
of expectations for the U.S. and Colorado economies are presented, respectively, in Tables 14 and 15
on pages 40 and 41.

May 2020 General Fund Budget Overview Page 5
General Fund Budget Overview
This section presents the General Fund overview based on current law. A summary of the General
Fund overview is shown in Table 1. This section also presents expectations for the following:
The TABOR outlook (Table 2 and Figure 1);
statutory transfers to transportation and capital construction funds (Table 3);
General Fund transfers to the State Education Fund (Figure 2);
the disposition of fiscal policies dependent on revenue collections (Tables 4 and 5);
General Fund rebates and expenditures (Table 6); and
cash fund transfers to and from the General Fund (Table 7).
FY 2018-19
Based on the Comprehensive Annual Financial Report released by the Office of the State Controller,
the General Fund ended FY 2018-19 with an 11.2 percent reserve, $448.3 million higher than the
statutorily required 7.25 percent reserve. Revenue exceeded the Referendum C cap by $428.3 million,
resulting in a TABOR refund in FY 2019-20. The TABOR refund obligation is being returned to
taxpayers via a temporary income tax rate reduction for tax year 2019 only, in addition to fully funding
the senior homestead and disabled veteran property tax exemptions.
FY 2019-20
The impacts of the COVID-19 pandemic and related economic contraction that began in March will
result in a significant decline in General Fund revenue during the last three months of the fiscal year.
As a result, the General Fund is expended to end FY 2019-20 with an $895.8 million deficit. This deficit
assumes full funding of current law obligations, including the 7.25 percent statutory reserve, and
General Fund transfers and appropriations. Appropriation amounts incorporate expenditure impacts
from 2020 legislation signed into law to date, including supplemental packages (House Bill 20-1242
through House Bill 20-1249), House Bill 20-1019, House Bill 20-1261, and House Bill 20-1260, the
supplemental bill for school finance. Any other legislation enacted during the 2020 session that
impacts revenue, expenditures, or transfers in the current fiscal year will change the projected deficit
amount. The estimate of the budget deficit does not account for reductions in expenditures resulting
from Executive Order D 2020 050, which ordered state agencies to reduce FY 2019-20 expenditures by
$228.7 million. Additionally, it excludes revenue received from the state’s share of the Coronavirus
Relief Fund created in the federal CARES Act, as this revenue is not credited to the General Fund.
Relative to the March forecast, expectations for the FY 2019-20 year-end balance have been reduced
by $900.1 million. The difference primarily reflects downward revisions to General Fund revenue to
reflect the impact of COVID-19 on economic activity and revenue collections. Gross General Fund
revenue expectations were reduced by $892.8 million with reductions across all major revenue
streams.
FY 2020-21 (Unbudgeted)
Because a budget has not yet been enacted for FY 2020-21, Table 1 (line 20) shows the amount of
revenue available in FY 2020-21 relative to the amount budgeted to be spent or saved in FY 2019-20.
Based on this forecast, the General Assembly will face a $3.3 billion, or 25.3 percent, revenue shortfall
May 2020 General Fund Budget Overview Page 6
in FY 2020-21. This amount assumes current law obligations for FY 2020-21, including transfers and
rebates and expenditures (Table 1, lines 9 through 13). The $3.3 billion shortfall is cumulative over
the two-year period of FY 2019-20 and FY 2020-21, and reflects carrying the deficit from the ending
balance of FY 2019-20 into FY 2020-21. Any changes made to the budget for FY 2019-20 will carry
forward into FY 2020-21. In holding FY 2019-20 appropriations constant, this amount does not account
for any additional shortfall resulting from the cost of inflation or caseload growth.
Relative to the March forecast, gross General Fund revenue expectations for FY 2020-21 were reduced
by $2.42 billion reflecting the impact of the economic downturn on income and sales tax revenues.
Risks to the Forecast
The events that have unfolded over the past two months have dramatically impacted the economy
and state revenue. The economic and health policy landscape continue to evolve and as a result, the
General Fund budget faces an uncertain outlook with both upside and downside risks to the forecast.
The pace of the economic recovery in Colorado and nationally will heavily influence revenue streams,
including income and sales tax revenue. These two sources of revenue have historically accounted
for about 95 percent of General Fund revenue.
Longer or repeated periods of reduced economic activity to control the spread of COVID-19 will cause
more severe and longer lasting revenue impacts. Conversely, near-term development and
distribution of a COVID-19 vaccine, a stronger than expected resumption of economic activity, and
additional federal fiscal and/or monetary policy support pose near-term upside risks to the forecast.
TABOR Outlook
The state TABOR outlook is presented in Table 2 on page 8 and illustrated in Figure 1 on page 9, which
also provides a history of the TABOR limit base and the Referendum C cap.
FY 2018-19. State revenue subject to TABOR exceeded the Referendum C cap by $428.3 million in
FY 2018-19. After accounting for a small outstanding refund obligation attributable to underrefunds
of prior TABOR surpluses, the state is obligated to refund $428.5 million in the current FY 2019-20.
TABOR refunds are made to taxpayers first via property tax exemptions administered at the county
level. The remaining refund obligation triggered a temporary income tax rate reduction for 2019
income taxes on returns filed in 2020. The rate reduction refunds FY 2018-19 revenue that was
restricted in the General Fund to pay TABOR refunds, and does not reduce income tax revenue
credited to the General Fund for FY 2019-20 or subsequent years.
Forecast for FY 2019-20 through FY 2021-22. State revenue subject to TABOR is expected to fall short
of the Referendum C cap in all three years of the current forecast period, and the state will not incur
an obligation for TABOR refunds. As a result, no refunds to taxpayers are expected to be made via
property tax exemptions or refunds using the income tax form through tax year 2022. The state
obligation to reimburse counties for homestead exemptions for FY 2020-21 and FY 2021-22 will be paid
from General Fund revenue in those years, rather than restricted prior year TABOR surpluses.

May 2020 General Fund Budget Overview Page 7
Table 1 General Fund Overview
Dollars in Millions
FY 2018-19 FY 2019-20 FY 2020-21 FY 2021-22
Funds Available Actual Estimate Estimate Estimate
1 Beginning Reserve $1,366.0 $1,262.6 -$19.5 *
2 General Fund Revenue $12,564.6 $11,653.8 $10,306.6 $11,663.7
3 Transfers from Other Funds (Table 7) $38.0 $53.8 $0.7 $1.1
4 Total Funds Available $13,968.6 $12,970.2 $10,287.8 *
5 Percent Change 12.3% -7.1% -20.7% *
Expenditures Actual Budgeted Estimate Estimate
6 General Fund Appropriations Subject to Limit1 $11,230.5 $12,086.2 * *
7 Adjustments to Appropriations2 $28.2 * * *
8 TABOR Refund Obligation Under Art. X, §20, (7)(d)3 $428.5 $0.0 $0.0 $0.0
9 Rebates and Expenditures (Table 6) $249.8 $141.4 $317.9 $334.3
10 Transfers to Other Funds (Table 7) $219.8 $195.9 $222.8 $240.7
11 Transfers to the State Education Fund (SB 13-234 & SB 19-246) $25.0 $40.3 $0.0 $0.0
12 Transfers to Transportation Funds (Table 3) $495.0 $300.0 $50.0 $50.0
13 Transfers to Capital Construction Funds (Table 3) $180.5 $225.8 $20.0 $20.0
14 Total Expenditures $12,857.3 $12,989.7 * * 15 Percent Change 14.6% 1.0% * *
16 Accounting Adjustments4 $151.3 * * *
Reserve Actual Budgeted Estimate Estimate
17 Year-End General Fund Reserve $1,262.6 -$19.5 * * 18 Year-End Reserve as a Percent of Appropriations 11.2% -0.2% * *
19 Statutorily Required Reserve5 $814.2 $876.3 * *
20 Amount in Excess or (Deficit) of Statutory Reserve $448.3 -$895.8 * *
21 Excess Reserve as a Percent of Expenditures 3.5% -6.9% * *
Perspectives on FY 2020-21 (Unbudgeted) Estimate Estimate
Scenario: Hold FY 2019-20 Appropriations Constant6
22 Amount in Excess or (Deficit) of 7.25% Statutory Reserve -$3,285.4 *
23 As a Percent of Prior-Year Expenditures -25.3% *
Addendum Actual Estimate Estimate Estimate
24 Percent Change in General Fund Appropriations 7.6% 7.3% * *
25 5% of Colorado Personal Income Appropriations Limit $14,479.0 $15,537.7 $16,647.1 $17,664.4
26 Transfers to State Education Fund per Amendment 23 $692.8 $629.0 $544.5 $635.2 Totals may not sum due to rounding. * Not estimated.
1Includes bills signed into law to date, including the FY 2019-20 supplemental package, HB 20-1019, HB 20-1261, and HB 20-1246.
2FY 2018-19 overexpenditures for the Department of Health Care Policy and Financing pursuant to HB 20-1246.
3Pursuant to Section 24-75-201 (2), C.R.S., the TABOR refund obligation is required to be set aside during the year it is collected to be refunded in the following fiscal year.
4For FY 2018-19, assumes the 2019 Colorado Basic Financial Statements General Fund budgetary fund balance. Also reflects a $0.1 million underfunded for the FY 2014-15 TABOR surplus; this amount is restricted in the General Fund from FY 2014-15 revenue and required to be refunded with the FY 2018-19 TABOR surplus.
5The required reserve is calculated as a percent of operating appropriations, and is required to equal 7.25 percent in FY 2018-19 and each year thereafter. Pursuant to SB 18-276, certificates of participation are included in the statutory reserve requirement calculation beginning in FY 2018-19.
6This scenario holds appropriations in FY 2020-21 equal to appropriations in FY 2019-20 (line 6) to determine the total amount of money available relative to FY 2019-20 expenditures, net of the obligations in lines 7 through 13.

May 2020 General Fund Budget Overview Page 8
Table 2 TABOR Revenue Limit and Retained Revenue
Dollars in Millions
Actual FY 2018-19
Estimate FY 2019-20
Estimate FY 2020-21
Estimate FY 2021-22
TABOR Revenue 1 General Fund1 $12,350.4 $11,437.2 $10,078.7 $11,415.6
2 Cash Funds $2,438.0 $2,244.4 $2,070.4 $2,205.2
3 Total TABOR Revenue $14,788.4 $13,681.6 $12,149.2 $13,620.8
Revenue Limit
4 Allowable TABOR Growth Rate 4.8% 4.1% 3.1% 2.1% 5 Inflation (from Prior Calendar Year) 3.4% 2.7% 1.9% 1.2%
6 Population Growth (from Prior Calendar Year) 1.4% 1.4% 1.2% 0.9%
7 TABOR Limit Base2 $11,759.3 $12,241.5 $12,621.0 $12,404.3
8 Voter Approved Revenue Change (Referendum C) $2,600.7 $1,440.1 $0.0 $1,216.5
9 Total TABOR Limit / Referendum C Cap $14,360.1 $14,948.8 $15,412.3 $15,735.9 10 TABOR Revenue Above (Below) Referendum C Cap $428.3 ($1,267.3) ($3,263.1) ($2,115.1)
Retained/Refunded Revenue
11 Revenue Retained under Referendum C2 $2,600.7 $1,440.1 $0.0 $1,216.5
12 Fiscal Year Spending (revenue available to be spent or saved) $14,360.1 $13,681.6 $12,149.2 $13,620.8
13 Outstanding Underrefund Amount3 $0.1 14 Revenue Refunded to Taxpayers4 $428.5 $0.0 $0.0 $0.0
15 TABOR Reserve Requirement $430.8 $410.4 $364.5 $408.6 Totals may not sum due to rounding. 1General Fund revenue differs from the amount in the General Fund revenue summary because of accounting adjustments across TABOR boundaries. 2Revenue retained under Referendum C is referred to as "General Fund Exempt" in the budget. 3This amount is restricted in the General Fund as part of the TABOR refund obligation for FY 2014-15. 4Revenue above the Referendum C cap is required to be set aside during the year it is collected to be refunded in the following fiscal year. For example, excess revenue collected in FY 2018-19 was set aside in the budget for FY 2018-19 to be refunded in FY 2019-20 on tax returns for tax year 2019.

May 2020 General Fund Budget Overview Page 9
Figure 1 TABOR Revenue, TABOR Limit Base, and the Referendum C Cap
Dollars in Billions
Source: Office of the State Controller and Legislative Council Staff. f = Forecast. *The refund amount for FY 2018-19 differs from the surplus amount because it includes underrefunds and other adjustments to previous TABOR surpluses.
General Fund Transfers to Transportation and Capital Construction
Statutory transfers from the General Fund to transportation and capital construction funds are shown
in Table 3. In the General Fund overview shown in Table 1, these transfers are reflected on lines 12
and 13. Other noninfrastructure-related transfers to and from the General Fund are summarized in
Table 7, and shown on lines 3 and 10 of Table 1.
Table 3
Infrastructure Transfers from the General Fund Dollars in Millions
Transportation Funds 2018-19 2019-20 2020-21 2021-22
SB 18-001 $495.0 $200.0 $50.0 $50.0
SB 19-262 $100.0
Total $495.0 $300.0 $50.0 $50.0
Capital Construction Funds 2018-19 2019-20 2020-21 2021-22
HB 15-1344* $20.0 $20.0 $20.0
SB 17-262 $60.0 $60.0
HB 18-1006 $0.7 HB 18-1340 $119.8
HB 19-1250 $0.2 SB 19-172 $0.1
SB 19-214 $145.5
Total $180.5 $225.8 $20.0 $20.0
*Transfers are contingent upon requests made by the Capital Development Committee.
$7
$8
$9
$10
$11
$12
$13
$14
$15
$16
$17
Referendum C Five-Year Timeout
Period
Bars Represent Revenue Subject to TABOR
Referendum C Cap
TABOR Limit Base
Amounts Above/(Below) the Referendum C Cap:FY 2018-19: $428.3 million*FY 2019-20: ($1,267.3 million)FY 2020-21: ($3,263.1 million)FY 2021-22: ($2,115.1 million)
TABOR Surplus

May 2020 General Fund Budget Overview Page 10
General Fund contributions to transportation. Senate Bill 17-267, which authorized $1.88 billion in
certificates of participation (COPs) for transportation projects, requires General Fund appropriations
for COP-related lease payments beginning in FY 2018-19. Under current law, these General Fund
appropriations are expected to total $100 million annually by FY 2021-22. These appropriations are
included in line 6 of Table 1, and not included in Table 3.
Senate Bill 18-001 created one-time General Fund transfers for transportation of $495 million in
FY 2018-19 and $150 million in FY 2019-20. These amounts are apportioned to the State Highway
Fund, a new Multimodal Transportation Options Fund, and county and municipal governments.
Senate Bill 18-001 authorizes 20 years of additional transfers to the State Highway Fund set at
$50 million per year beginning in FY 2019-20. Additionally, Senate Bill 19-262 authorized a
$100 million transfer to the Highway Users Tax Fund in FY 2019-20 only.
State Education Fund
The Colorado Constitution requires the State Education Fund (SEF) to receive one-third of 1 percent
of taxable income. Money in the SEF is required to be used to fund kindergarten through twelfth
grade public education. In FY 2019-20, the State Education Fund is expected to receive $629 million
as a result of this requirement. Relative to the March 2019 forecast, this May forecast update
incorporates reduced expectations for taxable income attributable to COVID-19-related distortions in
the economy. As a result, relative to the March 2019 forecast, expectations for this SEF diversion were
reduced by $51.1 million in FY 2019-20, and by $143.3 million in FY 2020-21. Expectations for these
diversions and other SEF transfers under current law are shown in Figure 2.
Figure 2
Revenue to the State Education Fund Dollars in Millions
Source: Colorado State Controller’s Office and Legislative Council Staff forecast (f). *Includes transfers under SB 09-260 for FY 2008-09, SB 11-183 and SB 11-156 for FY 2011-12, HB 12-1338 for FY 2012-13 and FY 2013-14, and HB 14-1342 for FY 2014-15, and SB 19-246 for FY 2019-20. **One-third of 1 percent of federal taxable income is required to be dedicated to the State Education Fund under Article IX, Section 17 of the Colorado Constitution.
$340 $329 $371 $408 $486 $479 $520 $523 $540 $617 $693 $629 $545 $635 $121
$231 $59
$1,073
$79.7 $40.3
$0
$200
$400
$600
$800
$1,000
$1,200
$1,400
$1,600
$1,800
Other Transfers*
Senate Bill 13-234
Constitutionally Required**
$461$329
$371
$638 $545
$1,598
$625$548 $565
Transfer totals in bold
$642$718 $669
$545$635

May 2020 General Fund Budget Overview Page 11
In addition to the SEF diversion, the General Assembly has at different times authorized the transfer
of additional moneys from the General Fund to the SEF (see Table 1, line 11). General Fund transfers
to the SEF pursuant to Senate Bill 13-234, which have occurred annually since FY 2013-14, are
scheduled to end after FY 2018-19. The 2019 school finance act, Senate Bill 19-246, includes a one-time
$40.3 million General Fund transfer to the State Education Fund in FY 2019-20, after which only
constitutionally required diversions are scheduled under current law.
Fiscal Policies Dependent on Revenue Conditions
Contingent tax expenditures. Two state tax expenditures are “triggered” by certain state revenue
conditions. Table 4 summarizes the availability of these tax policies, each of which is described in
greater detail below.
The historic preservation income tax credit is available for tax years 2018 and 2019. The historic
preservation income tax credit is available for tax years 2018 and 2019 based on the December 2017
and December 2018 forecasts, respectively. These forecasts expected sufficient revenue to grow
appropriations by more than 6.0 percent in FY 2017-18 and FY 2018-19. This credit is repealed
beginning tax year 2020.
Partial refundability of the conservation easement tax credit is available for tax year 2019, but
is not expected to be available for tax years 2020, 2021, or 2022. The conservation easement
income tax credit is available as a nonrefundable credit in most years. In tax years when the state
refunds a TABOR surplus, taxpayers may claim an amount up to $50,000, less their income tax
liability, as a refundable credit. Because a TABOR surplus was collected in FY 2018-19, the credit
was partially refundable for tax year 2019. This forecast update does not expect a TABOR surplus
in each of FY 2019-20, FY 2020-21, and FY 2021-22. Therefore, partial refundablility of the credit
is not expected to be available for tax years 2020, 2021, or 2022.
Table 4
Availability of Tax Policies Dependent on Revenue Conditions
Fiscal Policy Availability Criteria Availability
Historic Property Preservation Income Tax Credit
(Section 39-22-514, C.R.S.)
Revenue reduction of less than $1.0 million per tax year*
December forecast immediately before the tax year when the credit becomes available that predicts sufficient General Fund revenue to grow General Fund appropriations by 6 percent.
Available in tax years 2018 and 2019. Repealed in tax year 2020.
Conservation Easement Tax Credit Partial Refundability
(Section 39-22-522 (5)(b)(II), C.R.S.)
Revenue reduction of about $5.0 million per tax year*
TABOR surplus. Available in tax year 2019 due to the FY 2018-19 TABOR surplus. Not expected to be available in tax years 2020, 2021, or 2022.
*Estimates may differ in future analyses.
Contingent transfers for affordable housing. House Bill 19-1322 created conditional transfers from
the Unclaimed Property Trust Fund (UPTF) to the Housing Development Grant Fund for affordable
housing projects. These transfers are continent based on the balance in the UPTF as of June 1 and the

May 2020 General Fund Budget Overview Page 12
Legislative Council Staff June 2021, 2022, and 2023 forecasts. For the fiscal year in which a relevant
forecast is published, if revenue subject to TABOR is projected to fall below a “cutoff” amount equal
to the projected Referendum C cap minus $30 million dollars, a transfer will be made. The transfer is
equal to the greater of $30 million, or the UPTF fund balance. As presented in Table 5, based on this
May forecast update, a transfer is expected for both FY 2020-21 and FY 2021-22 because revenue is
expected to be below the cutoff. However, the June 2021 and June 2022 forecasts will determine the
actual amount of this transfer. A forecast is not yet available for FY 2022-23.
Table 5
Availability of Transfers from the Unclaimed Property Tax Fund Under HB 19-1322
FY 2020-21
Estimate FY 2021-22
Estimate FY 2022-23
Estimate
1 Forecast that Determines Availability June 2021 June 2022 June 2023
2 Available UPTF Balance* $126.3 million $126.3 million
Forecast not yet
available.
3 Referendum C Cap $15,412.3 million $15,735.9 million
4 Transfer Cutoff (line 3 minus $30 million) $15,382.3 million $15,705.9 million
5 Revenue Subject to TABOR $12,149.2 million $13,620.8 million
6 Revenue Above or (Below) Cutoff ($3,233.1 million) ($2,085.1 million)
7 Transfer Amount** $30.0 million $30.0 million *The estimate of the available balance in the UPTF is based on the most recent five-year average. **Actual transfer amounts will depend on the UPTF fund balance and future forecast expectations.

May 2020 General Fund Budget Overview Page 13
Table 6 General Fund Rebates and Expenditures
Dollars in Millions
Category Actual
FY 2018-19 Percent Change
Estimate FY 2019-20
Percent Change
Estimate FY 2020-21
Percent Change
Estimate FY 2021-22
Percent Change
Senior and Veterans Property Tax Exemptions $145.9 10.3% $152.1 4.2% $163.6 7.5% $170.0 4.0%
TABOR Refund Mechanism1 -$39.5 -$152.1 $0.0 $0.0
Cigarette Rebate $9.4 -3.8% $9.4 0.2% $8.6 -7.8% $8.3 -3.7%
Old Age Pension Fund $86.8 -4.9% $83.0 -4.4% $92.0 10.9% $98.8 7.4%
Aged Property Tax and Heating Credit $5.5 13.0% $5.8 4.5% $9.1 56.4% $10.2 12.4%
Older Coloradans Fund $10.0 -60.0% $10.0 0.0% $10.0 0.0% $10.0 0.0%
Interest Payments for School Loans $7.4 48.3% $6.5 -11.9% $6.7 2.7% $6.9 3.0%
Firefighter Pensions $4.2 -3.4% $4.3 1.4% $4.4 2.7% $4.5 2.7%
Amendment 35 Distributions $0.8 -2.7% $0.8 -2.3% $0.7 -5.9% $0.7 -2.0%
Marijuana Sales Tax Transfer to Local Governments $19.3 11.5% $21.7 12.4% $22.8 5.2% $24.8 8.9%
Total Rebates and Expenditures $249.8 -14.1% $141.4 -43.4% $317.9 124.9% $334.3 5.2%
Totals may not sum due to rounding.
*Pursuant to SB 17-267, local government reimbursements for these property tax exemptions are the first TABOR refund mechanism used to meet the prior year's refund obligation.

May 2020 General Fund Budget Overview Page 14
Table 7 Cash Fund Transfers
Dollars in Millions
Transfers to the General Fund 2018-19 2019-20 2020-21 2021-22
HB 05-1262 Amendment 35 Tobacco Tax $0.8 $0.8 $0.7 $0.7
SB 13-133 & SB 18-191
Limited Gaming Fund $16.4 $0.0 $0.0 $0.4
SB 17-265 & SB 19-208
State Employee Reserve Fund
$23.0
HB 18-1338 Reduced Revenue Severance Tax Transfers $20.8
SB 19-158 Pet Animal Care and Facility Fund $0.01 $0.01 $0.01
SB 19-261 Unclaimed Property Trust Fund $30.0
Total Transfers to the General Fund $38.0 $53.8 $0.7 $1.1
Transfers from the General Fund 2018-19 2019-20 2020-21 2021-22
SB 11-047 Bioscience Income Tax Transfer to OEDIT $6.9 $6.4 $5.6 $6.6
SB 14-215 Marijuana Tax Cash Fund $125.0 $140.1 $147.4 $160.5
HB 14-10161 Procurement Technical Assistance Cash Fund $0.2 $0.2
SB 15-244 & SB 17-267
State Public School Fund $20.1 $24.5 $25.8 $28.1
HB 16-11612 Older Coloradans Fund & Veterans Grant Program Fund (conditional)
$16.9 $0.0
HB 16-1288 Industry Infrastructure Fund $0.3
SB 17-255 Technology Advancement and Emergency Fund $2.0
HB 18-1323 Pay For Success Contracts Pilot Program Funding $0.4 $0.5 $0.5 $0.4
HB 18-1338 Reduced Revenue Severance Tax Transfers $27.4
HB 18-1363 Recommendations Of Child Support Commission $0.04 $0.04 $0.04 $0.04
HB 18-1357 Behavioral Health Care Ombudsperson Parity Reports $0.01
HB 18-1423 Rural Fire Protection District Equipment Grants $0.3
SB 18-0163 Transitioning from Criminal & Juvenile Justice System $0.4 $0.0 $0.0 $0.0
SB 18-132 1332 State Waiver Catastrophic Health Plans $0.01
SB 18-280 Tobacco Litigation Settlement Cash Fund $20.0
HB 19-1026 Parks and Wildlife Fines $0.4 $0.4 $0.4
HB 19-1147 Traumatic Brain Injury Program $0.5
HB 19-1168 & HB 19-1245
Reinsurance Cash Fund $15.0 $40.0 $0.0
HB 19-1174, HB 19-1216, HB 19-1233, HB 19-1269, HB 19-1283
Division of Insurance Cash Fund for Out-of-Network Health Care Services, Insulin Prices, Investments in Primary Care, Mental Health Parity, and Disclosure of Insurance Liability Coverage
$0.3 $0.2 $0.2
HB 19-1245 Housing Development Grant Fund $8.0 $2.8 $44.4
Total Transfers from the General Fund $219.8 $195.9 $222.8 $240.7
Net General Fund Impact ($181.8) ($142.1) ($222.0) ($239.6) 1The transfer is contingent upon the receipt of at least $200,000 in gifts, grants, and donations by the relevant contractor. 2HB 16-1161 requires transfers to the Older Coloradans Fund (95%) and the Veterans Assistance Grant Program Cash Fund (5%) of any excess General Fund moneys set aside for reimbursements to local governments for the Senior Homestead and Disabled Veteran property tax exemptions.
3SB 18-016 transfers any unexpended Department of Public Safety appropriation for community corrections to a Department of Local Affairs cash fund for transitional offender housing. There were no unexpended appropriations for FY 2018-19 and no transfer was made. This forecast assumes that all future community corrections appropriations will be expended and that no transfer will be made in future years.

May 2020 General Fund Revenue Page 15
General Fund Revenue
This section presents the Legislative Council Staff outlook for General Fund revenue, the state’s
main source of funding for operating appropriations. Table 8 on page 20 summarizes General Fund
revenue collections for FY 2018-19 and projections for FY 2019-20 through FY 2021-22.
FY 2019-20. General Fund revenue collections are expected to decrease 7.2 percent during the current
fiscal year to total $11.7 billion. Expectations were reduced $892.8 million, or 7.1 percent, relative to
the March 2020 forecast. The downward revision is associated with significant downgrades to the
economic outlook for the remainder of 2020, including expectations for a deep recession. The
March forecast was published before the announcement of a statewide stay-at-home order and closure
of nonessential businesses, and did not anticipate the degree of lost consumer spending, wages, and
business incomes that have manifested to date. The sudden stop in economic activity will reduce sales
tax revenue and individual and corporate income tax revenue to a greater extent than expected in
March.
General Fund revenue expectations for FY 2019-20 exclude the amount the state received from the
federal government’s Coronavirus Relief Fund under the CARES Act, as this amount was not credited
to the General Fund.
FY 2020-21. Revenue collections are expected to fall 11.6 percent further from reduced FY 2019-20
levels and total $10.3 billion. Revenue expectations were reduced $2.4 billion, or 19.0 percent, relative
to the March 2020 forecast. The downward revision reflects expectations for a deep economic
recession during 2020 that will impact all revenue streams over the entire fiscal year.
FY 2021-22. Revenue is expected to rebound, increasing 13.2 percent in FY 2021-22 to total
$11.7 billion. The forecast anticipates growth from low levels as business and consumer activity begin
to recover after the recession.
Risks to the forecast. The outlook for revenue remains uncertain in light of the evolving COVID-19
crisis. This uncertainty poses significant upside and downside risks to the General Fund revenue
forecast. The pace at which economic activity resumes across the many impacted industries will affect
income and sales tax revenue, and longer periods of reduced activity will cause more permanent
closures and longer-term economic and revenue impacts. In contrast, development and distribution
of a vaccine for the virus pose upside risk, as does additional fiscal and/or monetary policy support
from the federal government to businesses, households, and state and local governments. Finally,
spring 2020 tax payment deadlines were delayed until July. This change will impact when revenue is
collected. Depending on how state accountants implement accrual adjustments for tax payments,
more (or less) revenue may be shifted into FY 2019-20 from FY 2020-21. This will not impact the total
amount collected over the two year period.
Expiring tax expenditures. This forecast estimates state revenue under current state and federal law.
Under current state law, certain tax expenditures available now are scheduled to expire within the
forecast period. Where applicable, the forecast includes upward adjustments to revenue projections
to account for the expiration of these tax expenditures.

May 2020 General Fund Revenue Page 16
Individual income tax. Individual income tax revenue is the largest source of General Fund revenue;
it accounted for just over 60 percent of FY 2018-19 revenue, net of the SEF diversion. Individual
income tax revenue is expected to decrease sharply, falling 7.3 percent in FY 2019-20 and 11.8 percent
in FY 2020-21, as discussed below.
FY 2019-20. Individual income tax revenue is expected to decline 7.3 percent, or $0.6 billion, to total
$7.6 billion. Relative to the March forecast, expectations for individual income tax revenue were
reduced by 7.7 percent, consistent with downgrades to expectations for wages and business income
during initial months of the COVID-19 crisis.
Income tax revenue will fall with significant decreases in wage withholding and estimated tax
payments for the period between March and June 2020. Taxes withheld from paychecks will decline
because employers have temporarily suspended operations, or permanently closed, in response to the
crisis. Estimated tax payments are made by taxpayers with nonwage income, such as business owners
and investors. These payments reflect taxpayer expectations for their tax liability for the full tax year,
which have fallen to zero for business owners who expect their businesses to incur losses during 2020.
The outlook for revenue remains uncertain even with actual collections data for ten months of the
fiscal year due to the severe economic downturn and changes in the timing of tax payments. Pursuant
to Governor Polis’ Executive Orders D 2020 010 and D 2020 040, the following income tax filing and
payment deadlines have been extended until July 15, 2020:
the deadline to file and pay income taxes for the 2019 tax year, which would otherwise have been
April 15, 2020;
the deadline to make estimated income tax payments for the first quarter of the 2020 tax year,
which would otherwise have been April 15, 2020; and
the deadline to make estimated income tax payments for the second quarter of the 2020 tax year,
which would otherwise have been June 15, 2020.
Because taxpayers may wait until July to file their returns or make estimated payments, significantly
less tax data are available now than at a similar point in a normal fiscal year. This complicates the
ability to isolate the revenue impacts of the economic downturn from filing distortions. For example,
the Department of Revenue reports that, through April, less than 381,000 individual taxpayers had
filed returns with balances due, compared with nearly 614,000 through April 2019. Many income tax
payments that would otherwise be made in April or June are being delayed into July, during
FY 2020-21. Because these payments reflect economic activity that occurred during FY 2019-20, state
accountants will shift them out of FY 2020-21 and into FY 2019-20 by means of an accrual adjustment.
FY 2020-21. Individual income tax revenue is expected to fall 11.8 percent further to total $6.7 billion,
consistent with expectations for declining wage, business, and investment income during the fiscal
year. Individual income tax revenue for both FY 2019-20 and FY 2020-21 is also expected to decrease
as a result of changes in the computation of taxable income under the federal CARES Act, discussed
in additional detail below.

May 2020 General Fund Revenue Page 17
For comparison, individual income tax revenue declined 17.9 percent between its peak in FY 2007-08
and its trough in FY 2009-10. This forecast assumes a similar decline of 18.2 percent between
FY 2018-19 and FY 2020-21. There are reasons to expect that the current recession could reduce income
tax revenue to a larger extent than the Great Recession did. For example, job losses during the present
recession have been more immediate and more significant than during the Great Recession. Revenue
is falling from tax years 2018 and 2019, when taxpayers accelerated economic activity in order to take
advantage of the federal tax cuts enacted in the Tax Cuts and Jobs Act of 2017. Additionally,
COVID-related losses are being compounded by a simultaneous collapse in oil prices, which has
historically suppressed income tax revenue associated with oil producers and a slew of downstream
industries.
The extent of revenue loss will ultimately depend on factors that are unknown at this time, like when
normal consumer activity will resume in many industries and whether and when a COVID-19 vaccine
can be developed and distributed. Grants and loans provided by the federal government may also
ameliorate a portion of the revenue decrease to the extent that they keep businesses from shuttering
permanently. For these reasons, the FY 2020-21 forecast contains significant risk to both the downside
and the upside.
FY 2021-22. Individual income tax revenue is projected to rebound significantly, rising 17.4 percent
to total $7.9 billion. The outlook for FY 2021-22 depends on whether the health and safety concerns
expected to limit economic activity have been overcome. This forecast assumes a return to
unconstrained economic behavior in FY 2021-22, but even under such a scenario, the recession will
have lasting impacts, keeping income tax revenue below FY 2018-19 levels. Depending on the
secondary impacts of the recession, and duration and severity of additional actions to contain
COVID-19, economic activity may be suppressed for a longer period of time, resulting in income tax
revenue below forecast.
CARES Act. President Trump signed the Coronavirus Aid, Relief, and Economic Security Act
(CARES Act) into law on March 27, 2020. The CARES Act includes several provisions expected to
affect state revenue, of which the largest are:
allowing the deduction of “excess” losses by non-corporate businesses that would otherwise
exceed a threshold established in the Tax Cuts and Jobs Act of 2017;
allowing net operating losses for individuals, estates, and trusts to be carried back for up to five
years, and delimiting the amount by which these losses may be used to reduce taxable income;
increasing the percentage of business interest income that is tax deductible; and
suspending required minimum distributions from retirement funds, allowing some retirees to let
their fund balances recover before making distributions and incurring tax liability.
The CARES Act is expected to reduce federal taxable income for tax years 2018 through 2020, thereby
reducing Colorado taxable income in each of those years. Taxpayers will be able to amend 2018 and
2019 tax returns in order to benefit from the additional deductions, which will reduce state income tax
revenue when the amended returns are processed and a portion of taxes are refunded to taxpayers.
Across all provisions, the CARES Act is preliminarily assessed as reducing Colorado individual

May 2020 General Fund Revenue Page 18
income tax revenue by $121 million for FY 2019-20 and $135 million for FY 2020-21; these estimates
are subject to change as more information becomes available.
TABOR refund mechanism. The FY 2018-19 TABOR surplus triggered a temporary income tax rate
reduction for tax year 2019. This TABOR refund mechanism temporarily reduces the state income tax
rate from 4.63 percent to 4.50 percent for one year only. The rate reduction refunds revenue collected
during FY 2018-19 that has been restricted in the General Fund to pay refunds required in FY 2019-20.
Corporate income tax. After reaching record levels in FY 2018-19, corporate income tax revenue will
decline in each of the next two fiscal years. In FY 2018-19, corporate income tax revenue totaled
$919.8 million, the highest level of collections in the state’s history. Revenue growth was primarily
driven by a strong economy, federal tax law changes that took effect in 2018, and a large audit
concluded by the Department of Revenue in 2019.
Corporate income tax revenue is expected to drop by 21.4 percent to $722.9 million in FY 2019-20 and
decline by an additional 38.1 percent to $447.6 million in FY 2020-21 as the global economic shock
caused by the COVID-19 pandemic and steep declines in oil prices ripple through the economy and
manifest in reduced payments.
Corporate income tax revenue is volatile, and the revenue stream has significant exposure to at least
two sectors that are expected to suffer significant hits: the oil and gas industry and the travel industry.
To the extent that economic performance falls short of expectations, corporate income tax revenue will
likewise be lower than forecast. This forecast expects an immediate reduction in corporate income tax
revenue in the last two months of the current fiscal year and weakness throughout calendar year 2020.
In addition, the extension of the tax deadline to July 15 will cause further distortions for corporate
income revenue. Compared with the March 2020 forecast, expectations for corporate income tax
collections were reduced $69.3 million in FY 2019-20 and $273.3 million in FY 2020-21.
Sales taxes. The 2.9 percent state sales tax is assessed on the purchase of goods, except those
specifically exempted, and a relatively small collection of services. Sales tax receipts are expected to
decrease 1.0 percent to total $3.0 billion during the current FY 2019-20, before experiencing an
8.6 percent drop in FY 2020-21, which would be the sharpest year-over-year decline in decades. A
5.3 percent rebound in growth is expected in FY 2021-22.
Sales tax receipts experienced strong growth fiscal year-to-date through February, largely attributable
to legislative changes in House Bill 19-1240 and House Bill 19-1245, before the statewide shut down
in mid-March. During March and April, based on national retail sales and personal consumption
expenditure data to date, consumer spending declined across most sectors except for essential goods,
home improvement spending, and online sales. The sectors facing the strongest headwinds moving
forward include food services, accommodation, travel, and entertainment industries, since large
gatherings are restricted indefinitely. Auto sales, which comprise the largest percent of sales tax
revenue, dipped by 50 percent nationally from March 1 to April 30. Retail locations face strict
restrictions on reopening, and spending will depend on consumer confidence related to both the virus
and economic conditions. Job losses, low inflation, and lower population growth will also constrain
sales tax collections through the forecast period.

May 2020 General Fund Revenue Page 19
Use taxes. The 2.9 percent state use tax is due when sales tax is owed, but is not collected at the point
of sale. Use tax revenue is largely driven by capital investment among manufacturing, energy, and
mining firms. Revenue is expected to fall during FY 2019-20 by 45.6 percent, before recovering with
8.6 percent growth in FY 2020-21 and 5.9 percent growth in FY 2021-22. Oil and gas industry capital
expenditures have been cut significantly, with many companies halting most new drilling for the year.
Legislative changes and the rules promulgated by the Department of Revenue to collect out-of-state
retail sales tax will gradually convert retail use tax collections, around 7 percent of total use tax
collections as of 2018, to sales tax collections. This trend will also put significant downward pressure
on use tax collections throughout the forecast period.

May 2020 General Fund Revenue Page 20
Table 8 General Fund Revenue Estimates
Dollars in Millions
Category Actual
FY 2018-19 Percent Change
Estimate FY 2019-20
Percent Change
Estimate FY 2020-21
Percent Change
Estimate FY 2021-22
Percent Change
Excise Taxes
1 Sales $3,054.0 4.4 $3,022.7 -1.0 $2,762.6 -8.6 $2,909.1 5.3
2 Use $345.5 11.5 $187.9 -45.6 $203.9 8.6 $215.9 5.9
3 Retail Marijuana Sales $193.2 14.9 $216.6 12.1 $227.9 5.2 $248.2 8.9
4 Cigarette $32.6 -5.8 $32.1 -1.6 $29.5 -7.8 $28.5 -3.7
5 Tobacco Products $22.3 35.8 $19.1 -14.5 $28.9 51.5 $25.3 -12.3
6 Liquor $48.3 3.9 $49.5 2.5 $48.2 -2.6 $50.8 5.4
7 Total Excise $3,695.9 5.5 $3,527.9 -4.5 $3,301.1 -6.4 $3,477.8 5.4
Income Taxes
8 Net Individual Income $8,247.0 8.8 $7,646.4 -7.3 $6,747.4 -11.8 $7,923.2 17.4
9 Net Corporate Income $919.8 17.6 $722.9 -21.4 $447.6 -38.1 $531.3 18.7
10 Total Income Taxes $9,166.8 9.7 $8,369.3 -8.7 $7,195.0 -14.0 $8,454.4 17.5
11 Less: Portion Diverted to the SEF -$692.8 12.3 -$629.0 -9.2 -$544.5 -13.4 -$635.2 16.7
12 Income Taxes to the General Fund $8,474.0 9.5 $7,740.3 -8.7 $6,650.5 -14.1 $7,819.2 17.6
Other Sources
13 Estate $0.0 NA $0.0 NA $0.0 NA $0.0 NA
14 Insurance $314.7 3.6 $320.8 1.9 $301.2 -6.1 $310.9 3.2
15 Pari-Mutuel $0.5 -1.7 $0.5 -9.3 $0.5 8.7 $0.5 -4.0
16 Investment Income $26.5 35.8 $26.9 1.6 $15.3 -43.2 $16.3 6.5
17 Court Receipts $4.2 -5.3 $3.8 -8.3 $3.7 -2.9 $4.3 16.2
18 Other Income $48.9 25.7 $33.7 -31.2 $34.3 2.0 $34.8 1.4
19 Total Other $394.7 -17.8 $385.6 -2.3 $355.1 -7.9 $366.8 3.3
20 Gross General Fund Revenue $12,564.6 7.2 $11,653.8 -7.2 $10,306.6 -11.6 $11,663.7 13.2
Totals may not sum due to rounding. NA = Not applicable. SEF = State Education Fund.

May 2020 Cash Fund Revenue Page 21
Cash Fund Revenue
Table 9 summarizes the forecast for cash fund revenue subject to TABOR. The largest revenue sources
are motor fuel taxes and other transportation-related revenue, gaming taxes, and severance taxes. The
end of this section also presents the forecasts for marijuana sales and excise tax, Federal Mineral Lease,
and unemployment insurance revenue. These forecasts are presented separately because they are not
subject to TABOR limitations.
FY 2018-19. Final figures from the Office of the State Controller indicate cash fund revenue subject to
TABOR totaled $2.44 billion in FY 2018-19, an increase of $133.7 million or 5.8 percent from the prior
fiscal year. The most significant increase was in severance tax collections, which grew by
$112.2 million, or 78.4 percent. The improvement in oil and gas production activity and in rising prices
aided taxes levied on the extraction of natural resources. Transportation-related revenue, the largest
source of cash fund revenue subject to TABOR, was flat, adding just over $500,000, as the pace of
economic expansion slowed.
Forecast for FY 2019-20 through FY 2021-22. Total cash fund revenue subject to TABOR in the current
FY 2019-20 is expected to total $2.24 billion, a decline of 7.9 percent from the prior year. The crude oil
market rout and drop in travel activity due to COVID-19-related disruptions that began to
meaningfully affect the state in early March are expected to impact several cash fund sources in the
current and following fiscal year. Specifically, revenue to transportation-related, gaming, and
severance cash funds are expected to decline in FY 2019-20 and FY 2020-21 before picking up in
FY 2021-22.
Transportation-related revenue subject to TABOR is expected to decrease 6.0 percent in FY 2019-20,
with most of the decrease attributable to falling motor fuel consumption between March and June of
2020. Transportation-related revenue will decline an additional 2.8 percent in FY 2020-21 before
growing by 4.0 percent in FY 2021-22. The forecast for TABOR revenue to transportation-related cash
funds is shown in Table 10.
The largest source of transportation-related revenue is the motor fuel excise tax credited to the
Highway Users Tax Fund (HUTF). Fuel tax remittances declined by 1.6 percent over the first nine
months of FY 2019-20, reflecting a modest decrease in the amount of fuel distributed between
June 2019 and February 2020. Taxes on fuel distributed between March 2020 and May 2020 have not
yet been recorded. Over this period, fuel taxes are expected to decline by 35 percent relative to
year-ago levels, based on severe decreases in vehicle traffic observed by the Colorado Department of
Transportation during the statewide stay-at-home order. Fuel tax collections will remain subdued
through 2020 as businesses remain closed, employees work remotely, and tourist visitations dry up.
Through the forecast period, fuel tax collections are expected to remain below FY 2018-19 levels as the
economy emerges from a deep recession.
Vehicle registration fees, which are also credited to the HUTF, exhibited distortions in FY 2018-19 and
FY 2019-20 following migration to the Division of Motor Vehicles’ new software system, DRIVES.
Registration fee revenue is expected to decline during FY 2020-21, consistent with fewer expected auto
sales. COVID-related travel restrictions are expected to devastate vehicle rentals, with the attendant

May 2020 Cash Fund Revenue Page 22
decline in daily vehicle rental fees driving large decreases in other HUTF receipts during FY 2019-20
and FY 2020-21.
The State Highway Fund (SHF) receives money primarily from HUTF allocations, interest earnings,
and local government matching grants. HUTF revenue is subject to TABOR when initially collected
but not double-counted for TABOR purposes when distributed to the SHF, and is for this reason
omitted from SHF revenue in Table 10. Following a March 2020 Attorney General opinion, local
government matching grants will not be accounted as subject to TABOR, reducing SHF revenue
shown in Table 10 for FY 2019-20 and subsequent years. Fewer HUTF allocations and local
government funds are expected to limit the SHF balance, reducing interest earnings in the fund
through the forecast period.
Other transportation cash fund revenue subject to TABOR is expected to decline in each of FY 2019-20
and FY 2020-21 before rebounding in FY 2021-22. Weaker collections are attributable to large expected
declines in aviation fuel excise tax revenue, which is subdued on both low oil prices and drastically
reduced demand, and on lower-than-expected registration-related fees. Revenue to the Statewide
Bridge Enterprise is not subject to TABOR and is shown as an addendum to Table 10.
Table 9
Cash Fund Revenue Subject to TABOR Dollars in Millions
Actual
FY 2018-19 Estimate
FY 2019-20 Estimate
FY 2020-21 Estimate
FY 2021-22 CAAGR*
Transportation-Related $1,275.9 $1,199.0 $1,165.3 $1,211.5 Percent Change 0.0% -6.0% -2.8% 4.0% -1.7%
Severance Tax $255.2 $140.4 $23.3 $54.4 Percent Change 78.4% -45.0% -83.4% 133.3% -40.3%
Gaming Revenue1 $107.0 $65.9 $69.4 $76.9 Percent Change 0.1% -38.4% 5.3% 10.8% -10.4%
Insurance-Related $22.6 $24.6 $19.8 $20.2 Percent Change 26.7% 9.0% -19.7% 2.3% -3.6%
Regulatory Agencies $78.8 $79.2 $77.7 $78.5 Percent Change -2.1% 0.5% -1.9% 1.1% -0.1%
Capital Construction-Related Interest2 $4.7 $6.2 $3.3 $2.2 Percent Change 1.6% 31.4% -47.7% -31.7% -22.3%
2.9% Sales Tax on Marijuana3 $10.8 $12.0 $12.2 $12.4
Percent Change -33.1% 11.8% 1.4% 1.8% 4.9%
Other Cash Funds $683.0 $717.1 $699.5 $749.1 Percent Change 3.5% 5.0% -2.5% 7.1% 3.1%
Total Cash Fund Revenue4 $2,438.0 $2,244.4 $2,070.4 $2,205.2 Subject to the TABOR Limit 5.8% -7.9% -7.7% 6.5% -3.3%
Totals may not sum due to rounding. *CAAGR: Compound average annual growth rate for FY 2018-19 to FY 2021-22. 1Gaming revenue in this table does not include Amendment 50 revenue because it is not subject to TABOR. 2Includes interest earnings to the Capital Construction Fund, the Controlled Maintenance Trust Fund, and transfers from certain enterprises. 3Includes revenue from the 2.9 percent sales tax collected from the sale of medical and retail marijuana. This revenue is subject to TABOR.

May 2020 Cash Fund Revenue Page 23
Table 10 Transportation Revenue by Source
Dollars in Millions
Actual
FY 2018-19 Estimate
FY 2019-20 Estimate
FY 2020-21 Estimate
FY 2021-22 CAAGR*
Highway Users Tax Fund (HUTF)
Motor and Special Fuel Taxes $654.9 $591.6 $586.4 $615.9 -2.0% Percent Change -0.1% -9.7% -0.9% 5.0%
Total Registrations $382.7 $401.0 $391.5 $397.7 1.3% Percent Change -0.2% 4.8% -2.4% 1.6%
Registrations $229.1 $236.9 $231.9 $235.6
Road Safety Surcharge $132.2 $140.8 $137.8 $140.0 Late Registration Fees $21.4 $23.2 $21.8 $22.1
Other HUTF Receipts1 $71.1 $63.9 $54.7 $61.5 -4.7% Percent Change 1.7% -10.1% -14.4% 12.4%
Total HUTF $1,108.7 $1,056.6 $1,032.6 $1,075.1 -1.0% Percent Change 0.1% -4.7% -2.3% 4.1%
State Highway Fund (SHF)2 $39.9 $29.7 $28.6 $23.7 -15.9% Percent Change -1.8% -25.5% -3.7% -17.2%
Other Transportation Funds $127.4 $112.7 $104.1 $112.7 -4.0% Percent Change -1.2% -11.5% -7.7% 8.2%
Aviation Fund3 $33.7 $26.9 $19.9 $27.5
Law Enforcement-Related4 $8.6 $8.5 $8.4 $8.3 Registration-Related5 $85.1 $77.3 $75.8 $76.9
Total Transportation Funds $1,275.9 $1,199.0 $1,165.3 $1,211.5 -1.7% Percent Change -0.1% -6.0% -2.8% 4.0%
Totals may not sum due to rounding.
*CAAGR: Compound average annual growth rate for FY 2018-19 to FY 2021-22.
1Includes daily rental fee, oversized overweight vehicle surcharge, interest receipts, judicial receipts, drivers' license fees, and other miscellaneous receipts in the HUTF.
2Includes only SHF revenue subject to TABOR. Beginning in FY 2019-20, SHF revenue subject to TABOR no longer includes des local government grants and contracts.
3Includes revenue from aviation fuel excise taxes and the 2.9 percent sales tax on the retail cost of jet fuel. 4Includes revenue from driving under the influence (DUI) and driving while ability impaired (DWAI) fines. 5Includes revenue from Emergency Medical Services registration fees, emissions registration and inspection fees, motorcycle and motor vehicle license fees, and POST Board registration fees.
Addendum: TABOR-Exempt FASTER Revenue
Actual
FY 2018-19 Estimate
FY 2019-20 Estimate
FY 2020-21 Estimate
FY 2021-22 CAAGR*
Bridge Safety Surcharge $116.2 $118.1 $119.4 $120.2 2.9% Percent Change 3.6% 1.6% 1.1% 0.7%
Note: Revenue to the Statewide Bridge Enterprise from the bridge safety surcharge is TABOR-exempt and therefore not included in the table above. It is included as an addendum for informational purposes.

May 2020 Cash Fund Revenue Page 24
Severance tax revenue, including interest earnings, totaled $255.2 million in FY 2018-19 and is
expected to total $140.4 million in FY 2019-20 before falling to $23.3 million in FY 2020-21. Severance
tax revenue is more volatile than other revenue sources due to the boom-bust nature of the oil and gas
sector and Colorado’s tax structure. The forecast for the major components of severance tax revenue
is shown in Table 11.
Severance tax collections from oil and natural gas totaled $235.7 million in FY 2018-19 and are forecast
to decline 45.6 percent in FY 2019-20 to $128.3 million based on year-to-date collections that reflect
activity in 2019. Oil and natural gas severance tax revenue will decline 90.6 percent in FY 2020-21 to
$12.1 million, as low oil prices will significantly constrain the U.S. oil and gas sector and result in
production cuts. Additionally, the ad valorem tax credit will reduce severance tax liabilities.
Table 11
Severance Tax Revenue Forecast by Source Dollars in Millions
Actual
FY 2018-19 Estimate
FY 2019-20 Estimate
FY 2020-21 Estimate
FY 2021-22 CAAGR*
Oil and Gas $235.7 $128.3 $12.1 $43.6 -43.0% Percent Change 86.8% -45.6% -90.6% 260.9% Coal $3.6 $2.6 $2.0 $1.9 -19.3% Percent Change -4.9% -28.0% -22.8% -5.4% Molybdenum and Metallics $2.4 $2.3 $1.7 $1.8 -9.5% Percent Change -15.0% -6.8% -24.3% 5.0%
Total Severance Tax Revenue $241.7 $133.1 $15.8 $47.2 -42.0% Percent Change 82.0% -44.9% -88.2% 199.5%
Interest Earnings $13.5 $7.2 $7.6 $7.2 -18.9% Percent Change 32.1% -46.5% 4.6% -4.9%
Total Severance Tax Fund Revenue $255.2 $140.4 $23.3 $54.4 -40.3% Percent Change 78.4% -45.0% -83.4% 133.3%
*CAAGR: Compound average annual growth rate for FY 2018-19 to FY 2021-22.
Global oil prices declined 24 percent on March 9, 2020, the second largest one-day decline on record
as Russia and Saudi Arabia abandoned supply levels to keep global oil supply balanced and moved
to capture market share. Following COVID-19 outbreaks and shutdowns across Asia and Europe,
U.S. states began implementing stay-at-home orders in the weeks following, significantly dampening
demand for oil. Transportation consumption accounts for about 70 percent of oil demand in the U.S.
With few people driving and air travel all but stopped, demand will remain low until activity resumes.
In a historic deal, the U.S. aligned with OPEC+ in agreeing to oil production cuts to respond to the
approximate 30 percent drop in global oil demand. With oil storage facilities nearing capacity, drilling
activity and production has slowed in Colorado, with wells being shut in and capital expenditures cut
significantly. Property taxes for 2019 have already been paid on near historic production levels, which
will reduce severance taxes to $0 for many oil wells in 2020 through the ad valorem credit. This
forecast is consistent with average Colorado oil prices of $30.60 per barrel in 2020 and $38.82 per barrel
in 2021. Natural gas prices are forecast at $1.95 per thousand cubic feet in 2020 and $2.66 per thousand
cubic feet in 2021.

May 2020 Cash Fund Revenue Page 25
It is unclear how far production of oil and natural gas will fall as a result of prolonged low oil prices.
Resumption of production will depend on demand increasing in both the U.S. and globally; however,
with most production going into storage this spring, prices will remain subdued through the forecast
period.
More information about the oil and gas severance tax can be found in the Legislative Council Staff
memo posted here: http://leg.colorado.gov/publications/effective-tax-rates-oil-and-natural-gas.
Coal severance tax revenue declined 4.9 percent in FY 2018-19 and will decline through the forecast
period as electricity generation continues to transition away from coal to renewable sources and
natural gas. Based on current year-to-date collections, coal severance taxes are expected to decline
28.0 percent in FY 2019-20 to $2.6 million and 22.8 percent to $2.0 million in FY 2020-21.
Metal and molybdenum mines are expected to pay $2.3 million in severance taxes on the value of
minerals produced in FY 2019-20 and $1.7 million in FY 2020-21. Mining activity at the two
molybdenum mines in Colorado, the Climax Mine outside Leadville and the Henderson Mine outside
Empire, is fairly constant when the mines are in operation.
Finally, interest earnings on severance tax revenue are expected to total $7.2 million in FY 2019-20 and
$7.6 million in FY 2020-21. Interest earnings in FY 2019-20 will be based on a higher average balance
in severance tax accounts following the passage of Senate Bill 19-016; however, lower severance tax
revenue will reduce this amount.
Limited gaming revenue forecasts include taxes, fees, and interest earnings collected in the Limited
Gaming Fund and the State Historical Fund. Most of this revenue is subject to TABOR. Revenue
attributable to Amendment 50, which expanded gaming beginning in FY 2009-10, is TABOR-exempt.
The state limited gaming tax is a graduated tax assessed on casino adjusted gross proceeds, the
amount of wagers collected less the amount paid to players in winnings, in the three state-sanctioned
gaming municipalities: Black Hawk, Central City, and Cripple Creek. Casinos on tribal lands in
southwestern Colorado are not subject to the state tax.
Limited gaming revenue subject to TABOR totaled $107.0 million in FY 2018-19 and is expected to
decline by 38.4 percent to $65.9 million in FY 2019-20 before growing 5.3 percent in FY 2020-21 and
10.8 percent in FY 2021-22. Colorado casinos were closed by executive order on March 17, 2020, and
currently have no reopen date set. This left casinos with no revenue for half of March and all of April,
and this forecast assumes that casinos will remain closed in May and partially reopen in June. Due to
the graduated tax system, casino revenue is typically taxed at higher rates toward the end of the year,
thus resulting in an outsized loss of gaming tax revenue for FY 2019-20. In FY 2020-21, casino activity
is expected to resume slowly at first, as limitations on large gatherings remain in place and
COVID-19-related health concerns persist.
By statutory formula, gaming tax revenue subject to TABOR cannot grow faster than 3.0 percent
annually, but growth in tax revenue is expected to be supplemented by higher fee and interest
earnings. Annual growth in gaming tax revenue that exceeds 3.0 percent is attributed to
Amendment 50 and exempt from TABOR. Years when total gaming tax revenue grows by more than
2.8 percent therefore result in disproportionately higher distributions of Amendment 50 revenue.

May 2020 Cash Fund Revenue Page 26
Sports betting was legalized in the state after the passage of House Bill 19-1327 in the 2019 legislative
session, as well as the passage of Proposition DD during the November 2019 election. It launched on
May 1; however, sports betting revenues face an uncertain near-term future with all professional
sports indefinitely suspended in the U.S. A forecast of sports betting revenue will be available in
future forecasts, once tax collections data for several months become available.
Revenue collected from sports betting activity will include licensing fees, set at between $1,200 and
$2,000 per operator and master license biannually, an operations fee, and tax revenue, which is set at
10 percent of casinos’ net sports betting proceeds. As voter approved revenue, sports betting tax
revenue will not be subject to the TABOR limit; however, the fee revenue will be subject to TABOR.
License fees collected through April total about $108,600. A Sports Betting Operations Fee was created
under the rules adopted by the Limited Gaming Commission to cover a portion of administrative
costs. The intent of the fee is to cover the remaining costs after license fees are paid, and will be set by
the commission before June 1st of each fiscal year.
Total marijuana tax revenue equaled $262.9 million in FY 2018-19, a 4.6 percent increase from the
prior year and the slowest growth in marijuana tax revenue since legalization. Marijuana tax
revenues will continue to grow at a slow pace through the forecast period reaching $303.5 million in
FY 2019-20 and $318.3 million in FY 2020-21. The majority of the revenue from the marijuana industry
is voter-approved revenue exempt from TABOR; however, the 2.9 percent state sales tax is included
in the state’s revenue limit. Tax revenue from marijuana sales is shown in Table 12.
The special sales tax is the largest marijuana
revenue source, and is taxed at a rate of 15 percent
of the retail price of marijuana. Special sales tax
revenue is expected to reach $216.6 million in FY
2019-20 and $227.9 million in FY 2020-21. The state
distributes 10 percent of the special sales tax to
local governments and retains the rest to be used in
the Marijuana Tax Cash Fund, the General Fund,
and the State Public School Fund. The excise tax is
the second largest source of marijuana revenue and
is dedicated to the BEST Fund for school
construction. The excise tax is expected to generate
$74.9 million in FY 2019-20 and $78.2 million in FY
2020-21.
The excise tax is based on the calculated or actual wholesale price of marijuana when it is transferred
from the cultivator to the retailer. There is considerable uncertainty about the calculated price due to
a lack of available information. The wholesale price bottomed out at $759 per pound of marijuana
flower in the fourth quarter of 2018 and has been steadily increasing each quarter before declining to
$1,164 per pound in the second quarter of 2020, as shown in Figure 3. The wholesale price is a
significant determinate of the excise tax revenue and it is not clear if the price will continue to increase
or fall, consistent with a downward trends from 2016 to 2019. The wholesale price remains as both
and upside and downside risk to the forecast.
$0
$500
$1,000
$1,500
$2,000
$2,500
Figure 3Calculated Average Wholesale Rate
Cost per Pound
2020Q2:$1,164
Source: Colorado Department of Revenue.

May 2020 Cash Fund Revenue Page 27
The 2.9 percent state sales tax rate applies to medical marijuana and marijuana accessories purchased
at a retail marijuana store. Medical marijuana sales tax revenue is expected generate $10.5 million in
FY 2019-20 and remain flat through the forecast period, generating $10.6 million in FY 2020-21 and
$10.6 million in FY 2021-22. Retail marijuana dispensaries will remit the state sales tax on marijuana
accessories totaling $1.2 million in FY 2019-20 and $1.3 million in FY 2020-21. Revenue from the
2.9 percent sales tax is deposited in the Marijuana Tax Cash Fund and is subject to TABOR.
Table 12
Tax Revenue from the Marijuana Industry Dollars in Millions
Actual
FY 2018-19 Estimate
FY 2019-20 Estimate
FY 2020-21 Estimate
FY 2021-22 CAAGR*
Proposition AA Taxes $252.2 $291.5 $306.1 $327.1 9.1%
Special Sales Tax $193.2 $216.6 $227.9 $248.2 8.7%
State Share of Sales Tax $173.9 $195.0 $205.1 $223.3
Local Share of Sales Tax $19.3 $21.7 $22.8 $24.8
15% Excise Tax $58.9 $74.9 $78.2 $79.0 10.2%
2.9 Sales Tax (Subject to TABOR) $10.8 $12.0 $12.2 $12.4 4.9% Medical Marijuana $9.4 $10.5 $10.6 $10.6 4.3%
Retail Marijuana $1.1 $1.2 $1.3 $1.4
Interest $0.3 $0.3 $0.3 $0.4
Total Taxes on Marijuana $262.9 $303.5 $318.3 $339.6 8.9% *CAAGR: Compound average annual growth rate for FY 2018-19 to FY 2021-22.
Federal Mineral Lease (FML) revenue is the state's portion of the money the federal government
collects from mineral production on federal lands. Collections are mostly determined by the value of
mineral production on federal land and royalty rates between the federal government and mining
companies. Since FML revenue is not deposited into the General Fund and is exempt from TABOR,
the forecast is presented separately from other sources of state revenue.
FML revenue totaled $113.8 million in FY 2018-19, a 31.5 percent increase as the state fulfills its
obligations for previous payments associated with canceled leases on the Roan Plateau. In FY 2019-20,
FML revenue is forecast to decrease 47.0 percent to $60.3 million. This decrease is attributable to a
royalty rate reduction granted by the Bureau of Land Management to the Colowyo coal mine in Routt
County, as well as lower oil and natural gas prices. This rate reduction was approved for several prior
years, causing the Department of Interior to refund revenue from prior years and will reduce
distributions to Colorado. Due to the crash in oil prices and subsequent production cuts, oil prices are
expected to remain around $30 per barrel during 2020 and just under $40 per barrel during 2021,
resulting in a decrease in royalties collected. Producers are cutting oil production due to lower prices,
which causes a drop in natural gas production as well. FML revenue will rebound gradually in the
last two years of the forecast to $66.3 million in FY 2020-21 and $82.2 million in FY 2021-22.
Forecasts for Unemployment Insurance (UI) Trust Fund revenue, benefit payments, and year-end
balance are shown in Table 13. Revenue to the UI Trust Fund has not been subject to TABOR since
FY 2009-10 and is therefore excluded from Table 13. Revenue to the Employment Support Fund,
which receives a portion of the UI premium surcharge, is subject to TABOR and is included in the
revenue estimates for other cash funds in Table 9.

May 2020 Cash Fund Revenue Page 28
UI benefits paid have seen an unprecedented increase during the COVID-19-related rapid economic
contraction and are expected to reach $1.7 billion in FY 2019-20, with $1.4 billion in the last quarter of
the fiscal year alone. As a consequence, the fund is expected to become insolvent by the end of the
fiscal year, triggering the solvency surcharge and a move to a higher premium rate schedule beginning
January 1, 2021. The forecast fund balances assume no federal borrowing, however, if the balance of
the UITF falls below zero, the state is federally required to borrow money from the federal UI Trust
Fund to cover required benefit payments. For states facing UI program insolvency, the Families First
Coronavirus Response Act, signed into law March 18, 2020, includes a provision to provide interest-
free federal loans, as well as funding for any extended state benefits that may be triggered by
deteriorating economic conditions. While these provisions are currently set to expire at the end of
2020, this forecast assumes full federal funding of any extended state benefits, consistent with
historical experience in prior recessions.
Benefits paid are expected to grow further in FY 2020-21 to $2.8 billion, as the effects of COVID-19
continue to reverberate throughout the economy, and many businesses remain shuttered or will
operate at reduced levels for much of the remainder of 2020. By FY 2021-22, benefits paid are expected
to fall back to $1.3 billion, as unemployment levels remain elevated during the economic recovery,
consistent with the usual delayed decline in unemployment rates following a recession.
Table 13 Unemployment Insurance Trust Fund
Revenues, Benefits Paid, and Fund Balance Dollars in Millions
Actual
FY 2018-19 Estimate
FY 2019-20 Estimate
FY 2020-21 Estimate
FY 2021-22 CAAGR*
Beginning Balance $922.3 $1,104.1 ($7.0) ($1,994.8)
Plus Income Received
UI Premium $523.0 $531.5 $692.0 $676.1 8.9%
Solvency Surcharge $0.0 $0.0 $147.2 $143.8
Interest $23.3 $21.1 $0.0 $0.0
Total Revenues $546.3 $552.6 $839.2 $819.9 14.5% Percent Change -6.0% 1.2% 51.9% -2.3%
Less Benefits Paid ($365.5) ($1,663.7) ($2,827.1) ($1,302.9) 52.8% Percent Change -8.2% 355.2% 69.9% -53.9%
Ending Balance $1,104.1 ($7.0) ($1,994.8) ($2,477.8)
Solvency Ratio
Fund Balance as a Percent of 0.87% -0.01% -1.36% -1.61% Total Annual Private Wages
Totals may not sum due to rounding. *CAAGR: Compound average annual growth rate for FY 2018-19 to FY 2021-22.

May 2020 Economic Outlook Page 29
Economic Outlook
Global, U.S., and Colorado economies faced a severe drop in economic activity in early 2020 as
countries spanning the globe enacted strict measures to slow the rapid spread of the disease caused
by the novel coronavirus (COVID-19). Swift and sweeping actions, including business closures, travel
restrictions, and stay-at-home orders crippled business activity, disrupted the global supply of goods
and services, and stunted consumer spending. In the U.S. and Colorado, these restrictions generally
began in late March, reaching into early May.
With the relaxation of these restrictions, economic activity is slowly coming back to life. Yet, the extent
of the economic damage and the duration of phased reopening remains unknown. The economic
landscape continues to evolve as businesses dramatically shift workflows, households reevaluate their
finances, and federal, state, and local governments seek new policies to both reopen economically
while at the same time tempering the spread of COVID-19.
The global oversupply of crude oil, met with the more recent COVID-19-related plummet in fuel
demand, has sent crude oil prices to unprecedented lows. As the U.S. oil and gas industry contracts,
upstream and downstream industry impacts are mounting, compounding the impacts of the
COVID-induced recession.
Federal aid, federal loan programs, and additional monetary policy easing will offer relief and
liquidity to households, businesses, and state and local governments. Even with this support, the
Colorado and U.S. economies will contract in 2020 at rates more severe than those experienced during
the Great Recession.
The shape of recovery. Economists often
reference the alphabet to describe the “shape”
and strength of an economic recovery. The
letters “V” (strong and rapid rebound), “U”
(more protracted recession and longer
recovery), and “W” (double-dip recession) are
used as the common alphabet of business
cycles.
The current recession and recovery,
however, may require a new vernacular, as
the exceedingly sharp drop in economic
activity has been unparalleled in recent
history. Figure 4 illustrates the anticipated
“square-root” shape of the recession and
recovery assumed in this forecast as measured
by the broadest indicator of aggregate
economic activity in the U.S., real gross
domestic product.
Figure 4 Real U.S. Gross Domestic Product
Dollars in Trillions
Source: U.S. Bureau of Economic Analysis and Legislative Council Staff projections, including projected 2020Q1 revisions. Real GDP is inflation-adjusted to chained 2012 levels and shown at seasonally adjusted annualized rates.
$14
$15
$16
$17
$18
$19
$20
200
7
200
8
200
9
201
0
201
1
201
2
201
3
201
4
201
5
201
6
201
7
201
8
201
9
202
0
202
1
202
2
Projected Growth
May 2020 Economic Outlook Page 30
A sharp decline that began in the first quarter of 2020 is expected to deepen significantly in the second
quarter, reflecting shutdown orders that spanned most states. Phased reopening is expected to give
way to a gradual rise in economic activity through the remainder of the calendar year. Yet, the effects
of the shutdown will continue to ripple through the economy well into the future. Many but not all
workers furloughed or laid off during the shutdown will regain employment as some businesses
downsize or fail to reopen. Ongoing uncertainty and health-related concerns, combined with the
economic blow of the shutdown, will constrain business investment, consumer activity, and the
strength of the job market throughout 2020 and well into 2021. Tables 14 and 15 on pages 40 and 41
present histories and expectations for other economic indicators for the U.S. and Colorado,
respectively.
Risks to the economic outlook. The location and extent of future COVID-19 outbreaks, the discovery
and distribution of an effective vaccine or therapeutic, and future public health actions present
unknowns that will play a central role in the economic recovery. This forecast assumes that an
effective vaccine will not be available for a year to 18 months, necessitating ongoing social distancing
restrictions. Gradual easing of the pervasive and strict March and April restrictions is expected, with
more targeted localized interventions in areas facing outbreaks. Widespread closures are not assumed
in this forecast, but are possible and could result in a more prolonged or protracted recession.
Near-term containment of COVID-19 and/or more rapid development of a vaccine or other treatment
pose upside risks to the outlook. Additional federal fiscal stimulus and a rise in crude oil prices pose
additional upside risks. Finally, the nation and Colorado are just beginning to reopen after several
weeks of shuttered business and consumer activity. The vibrancy of economic activity could resume
at a stronger pace than forecast, with more limited ripple effects from the shutdown and a more robust
rebound in economic growth.
Outlook for Economic Activity by Major Component
The most commonly cited estimate of total economic activity in the U.S. is real gross domestic product
(GDP), an estimate of the inflation-adjusted value of final goods and services. Advance data from the
U.S. Bureau of Economic Analysis suggests that U.S. GDP declined at an annualized rate of 4.8 percent
in the first quarter of 2020, ending the longest U.S. economic expansion on record. The first quarter
contraction reflects the start of statewide shutdowns intended to curb the spread of COVID-19 as well
as spillover effects from shutdowns elsewhere, particularly China. With shuttered businesses and
schools, and curbed travel, consumer spending and business investment deteriorated. More
prominent declines are expected in the second quarter of the year (Figure 4), reflecting shutdowns
throughout April and into early May, with a phased approach to reopening. Real GDP is expected to
rebound in the second half of the year, yet remain constrained as businesses and consumers respond
to the effects of the shutdown and ongoing uncertainty.
Real U.S. GDP is expected to decline 5.6 percent in 2020 as it endures and begins to recover from
a contraction during the first half of the year. The rate of decline is more than twice that
experienced during the Great Recession. Economic activity is expected to expand 4.8 percent in
2021 and rise an additional 3.8 percent in 2022.
Even after reopening, consumer spending will remain subdued. Consumer spending, as measured
by personal consumption expenditures and accounting for more than two-thirds of total economic

May 2020 Economic Outlook Page 31
output, dropped at an annualized rate of 7.6 percent in the first quarter of the year, the steepest plunge
since the second quarter of 1980. Although spending on nondurable products, such as food, cleaning
products, and paper products, jumped 6.9 percent from the prior quarter, expenditures on big-ticket
items such as cars, home appliances, and furniture dropped by 16.1 percent. In addition, cancelations
of sporting events, mandatory restaurant shutdowns, and suspensions of non-essential services such
as elective medical procedures and visits to salons resulted in a decline of 10.2 percent on spending of
services in the first quarter of the year, the steepest drop for this category in almost 70 years. The sharp
halt to consumer activity is expected to continue into the second quarter of the year amid ongoing
shutdowns and phased reopening, before rebounding in the second half of the year. However, job
losses, wage cuts, health concerns, and ongoing uncertainty will restrain consumer spending
throughout 2020.
Amid uncertainty and profit losses, business investment will falter. A slowing global economy and
trade uncertainty had already created challenges for many U.S. businesses before the spread of
COVID-19 to the U.S. The impact of COVID-19-related closures is not yet well known as surveys
struggle to keep up with rapidly changing economic circumstances. The shutdown has pushed cash
flow dependent industries to the brink of collapse. Bankruptcies are likely in the retail and leisure
and hospitality sectors, and many businesses will not reopen their doors. While some industries were
more affected than others, none have been untouched.
In the first quarter of 2020, total gross domestic business investment fell by 5.6 percent after declining
by 6.0 percent in the previous quarter. Business shutdowns and slowdowns have added to
uncertainty and forced many companies to reevaluate their expectations and capital expenditures.
Investment in business equipment plunged by 15.2 percent in the in the first quarter of the year, while
spending on nonresidential construction projects dropped by 8.6 percent over the same period.
Spending on residential housing jumped by an impressive 21 percent in the quarter, reflecting
increased home improvement activities at the start of the shutdown. Business investment will
deteriorate further in the second quarter of the year, reflecting shutdowns extending into May, and
ongoing business uncertainty. A rebound is expected in the second half of 2020.
Low demand and supply disruptions will saddle import and export activity. In the first quarter of
2020, U.S. exports declined by 8.7 percent, while imports dropped by a notable 15.3 percent over the
same period. The fall in both imports and exports reflect the supply-side constraints from shutdowns
across the globe. Coupled with supply disruptions, shutdowns have prompted a precipitous drop in
global demand for goods. Further, travel restrictions have brought the export of services to a
standstill. These disruptions will continue well into 2020.
Federal stimulus will partially offset declines in GDP. Government spending was relatively flat in
the first quarter of the year but is expected to rise in the near-term with the largest injection of federal
stimulus in U.S. history. The federal Families First Coronavirus Response Act and Coronavirus Aid,
Relief, and Economic Security Act (CARES) Act are projected to inject about $2 trillion in stimulus
between 2020 and 2025. The Families First and CARES Acts include direct payments to households,
expanded and extended unemployment insurance benefits, business assistance, health and education
spending, and tax cuts to households and businesses

May 2020 Economic Outlook Page 32
The vast majority of this stimulus will be spent in 2020 and 2021, as shown in Figure 5. Figure 5
contextualizes the magnitude of the boost from the federal stimulus relative to projected GDP, in
nominal terms. Based on these stimulus estimates and economic projections from this forecast, the
stimulus accounts for 8.5 percent of total GDP in 2020 and 2.3 percent of economic activity in 2021.
Even with the unprecedented stimulus, the U.S. economy is still projected to contract at higher rates
than experienced during the Great Recession.
State and local government spending is
expected to decline in spite of federal aid.
Federally and state-funded assistance programs,
including unemployment insurance, Medicaid,
and food assistance, will rise in 2020 with the
sharp jump in joblessness. Federal assistance
and loan support to state and local government
is expected to allow for continued state and local
administration of these programs to meet
elevated demand.
Yet, state and local governments are expected to
face significant revenue declines in 2020,
reflecting the abrupt drop in economy activity
associated with significant drops in tax
collections across most major revenue streams.
These declines will result in a pull-back in
spending across major state and local
government programs, such as education and
transportation, in order to meet balanced budget
requirements. Barring additional federal aid to
offset revenue shortfalls, sizable reductions in state and local government spending are likely to pose
a drag on GDP beginning in the second half of 2020.
How will Colorado fare relative to the nation? Like the nation, Colorado is expected to see a
significant decline in economic activity in 2020 based on COVID-19-related business closures and stay
at home orders. Additionally, the collapse in crude oil prices will stem growth in energy and related
activity, constricting economic growth further. Colorado’s industry composition in general shows
similarities with the nation as a whole. Yet, Colorado will face unique challenges with a higher energy
industry concentration relative to most other states, and a stronger reliance on tourism for many
leisure and hospitality industries. These impacts will be felt in some geographic areas of the state
more than others. In particular, energy-producing regions and mountain resort communities are
expected to be among the hardest hit in the state.
Labor Markets
March and April 2020 labor market indicators for both the U.S. and Colorado are daunting, marking
widespread job losses across industries during the shutdown. These indicators will improve in the
months ahead as the state and national economies slowly reopen. While many workers will regain
employment as businesses reopen, many will not as businesses continue to feel the impact of cautious
Figure 5 Contributions of Federal Stimulus to
U.S. GDP* Dollars in Trillions
Source: U.S. Bureau of Economic Analysis, Congressional Budget Office, and Legislative Council Staff projections (f). *Amount reflect nominal GDP, which is not adjusted for inflation.
$1.61
$0.45$0.13$0.06
$0$2$4$6$8
$10$12$14$16$18$20$22
2019 2020f 2021f
Families First Coronavirus Response ActCARES Act

May 2020 Economic Outlook Page 33
consumers and ongoing restrictions. Consistent with prior economic downturns, the labor market
recovery will lag the economic recovery in the years ahead.
U.S. nonfarm employment is expected to fall 6.3 percent in 2020 before resuming growth in 2021
at a modest pace of 2.0 percent. After reaching a historic low of 3.7 percent in 2019, the U.S.
unemployment rate is expected to rise to 11.3 percent in 2020, and to remain elevated at 7.8 percent
in 2021.
In Colorado, nonfarm employment is expected to decline by 6.1 percent in 2020 before beginning
a tepid recovery in 2021 with 1.3 percent growth. The Colorado unemployment rate is expected
to increase sharply from 2.8 percent in 2019 to 10.1 percent in 2020, before declining slightly in
2021 to 7.1 percent.
Unemployment has risen sharply. As the COVID-19 pandemic has brought the U.S. and Colorado
economies to a standstill, labor market conditions have deteriorated sharply. While under normal
conditions changes in unemployment rates are registered well after a recession has officially begun,
in the current context, business closures have had an immediate and already-measurable impact on
unemployment rates. These impacts are likely to be underestimated in current data given reporting
lags. With its high frequency of reporting, weekly initial unemployment claims, or claims filed to
establish benefit eligibility, can be considered a reliable leading economic indicator.
The U.S. unemployment rate rose from a historic low of 3.5 percent in February to 4.4 percent in March
and 14.7 percent in April. More than 30 million people have filed for unemployment in the U.S. since
early March, a historically unprecedented increase which is likewise reflected in statewide
unemployment claims, as shown in Figure 6.
The statewide unemployment rate, one of the
lowest in the nation at 2.5 percent in February,
rose to 4.5 percent in March, the 19th highest
rate among states and equal to that of New
York and Missouri. In Colorado, 365,492
people have filed initial unemployment claims
in the seven weeks from the week ending
March 21 to the week ending May 2, with a
weekly high of 104,217 for the week ending
April 11. This compares with 98,727 total
initial claims in 2019, and a weekly high of
7,749 initial claims the week of
January 9, 2010, in the wake of the Great
Recession.
Job losses are widespread. Employment losses at the national and state levels have been concentrated
in industries such as accommodation and food services; arts, entertainment and recreation; and other
services such as personal care, which were the first to be impacted by mandated closures and
social-distancing requirements. As shown in Figure 7, initial unemployment claims in Colorado as a
percent of total employment by industry exceed 20 percent for arts, entertainment and recreation as
Figure 6 Colorado Initial Unemployment Claims
Four-week Average, Thousands
Source: Colorado Department of Labor and Employment. Not seasonally adjusted.
0
10
20
30
40
50
60
70
2006 2008 2010 2012 2014 2016 2018 2020

May 2020 Economic Outlook Page 34
well as accommodation and food services. No industry has been immune, however, as employment
losses have been widespread.
The 10,048 new claims filed by workers in professional, scientific, and technical services accounts for
only 4.0 percent of employment in the industry, yet this industry was a key driver of job growth
through the expansion and could be a bellwether for more chronic impacts from COVID-19
disruptions. As the Safer-at-Home phases of Colorado’s pandemic response are implemented, and
local stay-at-home orders are lifted, new unemployment claims are expected to stabilize, and
employment to improve, albeit much more slowly than it has declined, as continued health concerns
plague the recovery of economic activity.
Figure 7
Colorado Initial Unemployment Claims by Industry
Source: Colorado Department of Labor and Employment. Claims from the week of March 7 through the week of April 25. Total employment by industry as of December 2019. Unemployment claims by industry do not reflect total unemployment claims due to data reporting issues.
Personal Income
The COVID-19-related shutdown is reducing household incomes for workers, business owners, and
investors, with impacts expected to ripple across the economy throughout the year ahead. The
immediate impacts of the crisis have been devastating for workers in the most profoundly affected
industries, including travel, leisure and hospitality, and retail trade. However, job losses and wage
reductions are weighing on all industries. Expanded unemployment insurance eligibility and benefits
under the federal CARES Act and Families First Act have provided partial wage replacement for many
workers who lost their jobs. In addition to workers, businesses owners and investors have also
suffered immediate losses in affected industries. Many businesses are not expected to reopen, leaving
a lasting impact on the economy and incomes.
Claims as a Share of
Number of Claims Industry Employment
65,463
35,380
33,936
16,742
15,554
14,141
11,614
10,048
9,824
7,738
7,313
5,962
5,418
3,466
3,329
2,371
2,037
1,967
Accommodation & Food Services
Retail Trade
Health Care & Social Assistance
Other Services
Arts, Entertainment & Recreation
Administrative & Support Services
Construction
Professional, Scientific & Technical Services
Manufacturing
Wholesale Trade
Transportation & Utilities
Real Estate
Educational Services
Information
Mining & Logging
Government
Management of Companies & Enterprises
Finance & Insurance
22.5%
12.8%
10.9%
14.8%
28.0%
8.7%
6.7%
4.0%
6.5%
7.0%
7.9%
14.1%
12.2%
4.7%
11.9%
0.5%
4.7%
1.7%

May 2020 Economic Outlook Page 35
In Colorado, personal income is projected to contract by 5.9 percent in 2020, a more significant
contraction than in any year during either of the past two recessions. On average, personal income
is expected to increase 2.0 percent in 2021 before rebounding at a stronger pace to grow 6.9 percent
in 2022.
Monetary Policy and Inflation
Near-term inflationary pressures are skewed to the downside for most goods and services. Across
the economy, the crisis has depleted both aggregate supply and aggregate demand, but weak demand
is expected to more than offset the price effects of supply constraints. The oil price crash places
significant downward pressure on energy prices and the transportation component of prices for most
goods. Potential for processing plant closures poses intermittent upside risk to food prices while the
spread of the coronavirus continues.
Headline inflation for U.S. urban consumers is expected to rise 1.1 percent in 2020 and 1.9 percent
in 2021. Similarly, headline inflation in the Denver-Aurora-Lakewood combined statistical area is
forecast at 1.2 percent in 2020 and 1.7 percent in 2021.
Leveraging new and existing tools of monetary policy. The Federal Reserve is utilizing its broad
arsenal of monetary policy tools in order to counteract the degree and extent of economic damage. At
emergency meetings in March, the Federal Open Market Committee (FOMC) voted to reduce the
target range for the federal funds rate to between 0.00 percent and 0.25 percent. Interest rates are
expected to remain at lower bound levels through the current forecast period.
In order to reduce longer-term interest rates, the Fed initiated a new round of asset purchases, or
“quantitative easing.” As of April 29, the Fed’s portfolio was measured at $6.7 trillion, up from
$4.2 trillion in late February. Through April, most additional purchases were of U.S. Treasury
securities, though the Fed announced plans to purchase additional mortgage-backed securities as
well. The recent $2.5 trillion infusion represents nearly 12 percent of nominal U.S. GDP for 2019.
Quantitative easing is intended to allow banks to keep ample credit available to prospective borrowers
at appropriately low interest rates.
In addition to keeping interest rates low, the Fed is providing direct credit facilities to businesses and
state and local governments in conjunction with the federal CARES Act. The largest of these lending
programs are:
primary and secondary market corporate credit facilities, which together are authorized to
purchase up to $750 billion in corporate debt;
the Main Street Lending Program, through which the Fed is authorized to purchase up to
$600 billion in debt to support small and medium-sized businesses; and
the municipal liquidity facility, through which the Fed is authorized to purchase up to $500 billion
in short-term debt from states, counties with populations of 500,000 or more, and municipalities
with populations of 250,000 or more.
Energy Markets
Energy industry activity collapsed in recent months, led by historically low crude oil prices that defied
logical expectations (Figure 8). The crude oil industry is faced with twin supply and demand shocks,

May 2020 Economic Outlook Page 36
resulting in an unprecedented drop in prices and storage nearing full capacity. Oil production in the
U.S. has begun to decline, with natural gas production falling in tandem. With oil prices hovering
around $20 per barrel, intermittently plunging to near zero, and supply exceeding demand during the
shutdown, recovery will depend on how quickly businesses reopen and the extent to which consumer
travel activity resumes.
At the beginning of March, Saudi Arabia and
Russia flooded the global market with oil, causing
prices to drop 24 percent overnight. As COVID-19
shutdowns went into effect across the world,
demand for gasoline and jet fuel declined
precipitously and has yet to recover. Forecasts for
oil prices vary but generally peg West Texas
Intermediate crude oil at around $30 per barrel
during 2020 before increasing to around $40 per
barrel in 2021. A slow recovery in prices is
expected as crude oil stocks are up 12.1 percent
year-over-year in the U.S. as of the week of April 24
and most shutdowns are still largely in place. More
efficient firms with lower per barrel breakeven
prices and those with price hedges through at least
2020 stand to fare better through this crisis;
however, many firms are overleveraged and may
be forced into bankruptcy.
Low demand will continue to plague prices, in spite of production cuts. Production cuts of up to
20 percent of global oil demand were agreed upon by OPEC+, and U.S. production has already started
to decline in response to the fall in demand. The U.S. Energy Information Agency (EIA) projects that
U.S. oil production will fall 3.8 percent in 2020 and 5.6 percent in 2021 over year-ago levels. The Baker
Hughes rig count for Colorado fell by over 60 percent since the beginning of March, leaving just 8 rigs
as of May 1. Demand is not expected to recover until the end of 2021, with prices and production
expected to follow suit. Since transportation uses comprise about 60 percent of oil use, any rebound
will be contingent upon workers resuming commutes, air travelers’ comfort with flying, and the
resumption of commercial and trade activity. Natural gas production will fall in concert with oil
production until demand ticks back up during the winter, pushing prices up toward the end of 2020.
Real Estate and Construction Activity
The U.S. and Colorado residential real estate markets started this year off strong, as a strong labor
market, low mortgage rates and slower price appreciation boosted home sales and new homebuilding
across many areas in the country. Housing indicators in April are expected to show an abrupt
slowdown in sales and inventories as shelter-in-place and shutdown restrictions hampered the ability
to show homes to potential buyers, prompting many sellers to remove their home listings. As
economies reopen, the residential housing market is expected to improve and remain relatively stable
as tight inventories and low mortgage rates are expected to support the market in spite of economic
uncertainty.
Figure 8 Crude Oil Price, West Texas Intermediate
Dollars per Barrel
Source: U.S. Energy Information Administration. Weekly average prices through May 9, 2020.
$0
$20
$40
$60
$80
$100
$120
$140
2008 2010 2012 2014 2016 2018 2020
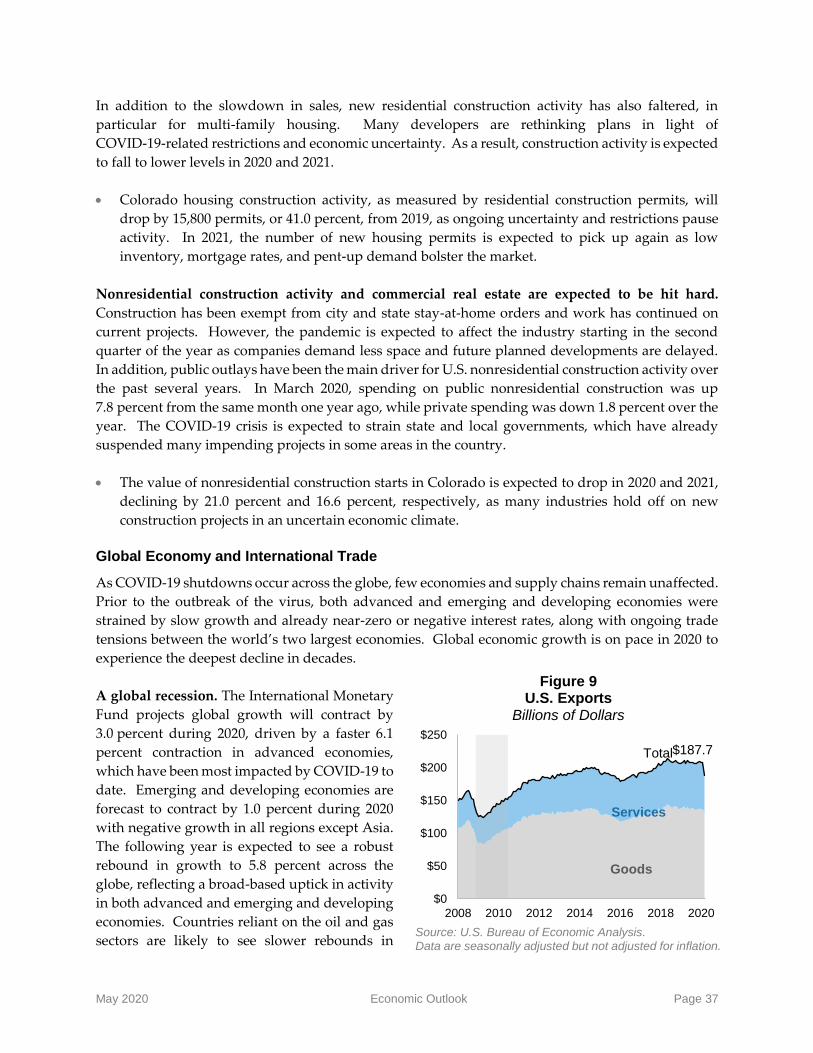
May 2020 Economic Outlook Page 37
In addition to the slowdown in sales, new residential construction activity has also faltered, in
particular for multi-family housing. Many developers are rethinking plans in light of
COVID-19-related restrictions and economic uncertainty. As a result, construction activity is expected
to fall to lower levels in 2020 and 2021.
Colorado housing construction activity, as measured by residential construction permits, will
drop by 15,800 permits, or 41.0 percent, from 2019, as ongoing uncertainty and restrictions pause
activity. In 2021, the number of new housing permits is expected to pick up again as low
inventory, mortgage rates, and pent-up demand bolster the market.
Nonresidential construction activity and commercial real estate are expected to be hit hard.
Construction has been exempt from city and state stay-at-home orders and work has continued on
current projects. However, the pandemic is expected to affect the industry starting in the second
quarter of the year as companies demand less space and future planned developments are delayed.
In addition, public outlays have been the main driver for U.S. nonresidential construction activity over
the past several years. In March 2020, spending on public nonresidential construction was up
7.8 percent from the same month one year ago, while private spending was down 1.8 percent over the
year. The COVID-19 crisis is expected to strain state and local governments, which have already
suspended many impending projects in some areas in the country.
The value of nonresidential construction starts in Colorado is expected to drop in 2020 and 2021,
declining by 21.0 percent and 16.6 percent, respectively, as many industries hold off on new
construction projects in an uncertain economic climate.
Global Economy and International Trade
As COVID-19 shutdowns occur across the globe, few economies and supply chains remain unaffected.
Prior to the outbreak of the virus, both advanced and emerging and developing economies were
strained by slow growth and already near-zero or negative interest rates, along with ongoing trade
tensions between the world’s two largest economies. Global economic growth is on pace in 2020 to
experience the deepest decline in decades.
A global recession. The International Monetary
Fund projects global growth will contract by
3.0 percent during 2020, driven by a faster 6.1
percent contraction in advanced economies,
which have been most impacted by COVID-19 to
date. Emerging and developing economies are
forecast to contract by 1.0 percent during 2020
with negative growth in all regions except Asia.
The following year is expected to see a robust
rebound in growth to 5.8 percent across the
globe, reflecting a broad-based uptick in activity
in both advanced and emerging and developing
economies. Countries reliant on the oil and gas
sectors are likely to see slower rebounds in
Figure 9 U.S. Exports
Billions of Dollars
Source: U.S. Bureau of Economic Analysis. Data are seasonally adjusted but not adjusted for inflation.
$187.7
$0
$50
$100
$150
$200
$250
2008 2010 2012 2014 2016 2018 2020
Goods
Services
Total

May 2020 Economic Outlook Page 38
economic activity, as low oil prices are expected to persist, dampening the outlook for the industry
even beyond 2021.
Global supply disruptions will change trade patterns. The often-abrupt countrywide shutdowns left
little time to plan for the widespread disruption to supply chains and international trade. After years
of strong growth, trade in goods last year saw a modest decline with the implementation of retaliatory
tariffs by the U.S. and China. Total U.S. exports saw their largest month-over-month decline in March
since the Great Recession, falling by almost 10 percent from February (Figure 9). The World Trade
Organization projects a decline in global trade of between 12.9 and 31.9 percent in 2020, reflecting the
significant uncertainty over the trajectory of the virus and how quickly countries will be able to
recover. U.S. exports may see additional headwinds. The U.S. dollar has gained in value against other
currencies as skittish investors have rushed to safe haven investments. During 2021, a recovery of
over 20 percent growth is expected, as renewed demand bolsters manufacturing activity and spending
on consumer goods.
Agriculture
COVID-19 has significantly dampened the outlook for agricultural producers, who are already in the
midst of a prolonged industry downturn. COVID-19-related slowdowns at meatpacking facilities
across the country have created supply chain bottlenecks, compounding demand shortfalls due to the
closing of schools and restaurants. Prices for most major farm commodities, including hogs, ethanol,
cattle, milk, corn, soybeans, and wheat, have declined. Both demand and supply conditions in the
months ahead are likely to continue to weigh on agricultural commodity prices. Prior to the
emergence of global economic developments related to COVID-19, growth in farm lending continued
to show signs of slowing. The stability of farm real estate values and the financial strength of farm
banks may be key sources of support for agriculture in the coming months. Much of the near-term
economic outlook is dependent on the trajectory of COVID-19, which shows recent signs of spreading
more into rural areas.
Livestock industries are facing new challenges. Livestock is a key sector at risk for continued
COVID-19-related economic distress. Production of poultry, beef, and pork has already slowed as a
key link in these supply chains, meatpacking plants, has proven especially vulnerable to the
pandemic. Virus outbreaks have led to temporary closures, including of one plant in Greeley. Other
plants face labor shortages; and many have had to slow production to maintain safer distances
between workers. While bottlenecks in meatpacking are amplified for the more concentrated and
vertically integrated poultry and pork industries, cattle producers are also feeling the impacts, as cattle
pile up on ranches and in feedlots. In the near term, ongoing supply chain disruptions are likely to
continue to depress cattle prices, while contributing to shortages of some meat cuts, especially ground
beef, along with higher retail prices for consumers.
Weather conditions cloud the outlook. The impacts of the pandemic have been compounded by poor
weather conditions in some parts of the state. A late deep freeze on the Western Slope in April led to
an almost complete loss of the key crops grown there, including peaches, apples, apricots, pears, and
cherries, the impacts of which are expected to reverberate statewide in the coming months.

May 2020 Economic Outlook Page 39
Summary
The impacts of the COVID-19 pandemic and the related public health response of the past two months
have been widespread, leaving no part of the U.S. and Colorado economies untouched. Economic
activity began a steep decline in the first quarter of 2020 and is expected to deepen significantly in the
second quarter, reflecting the impacts of the COVID-19-related business closures, stay-at-home orders,
and travel restrictions. Phased reopening will give rise to a recovery throughout the remainder of the
calendar year—though ongoing restrictions, health concerns, and uncertainty will constrain growth.
Additionally, some business closures and job losses will be permanent, leaving a lasting mark on
economic activity.
Unprecedented federal stimulus and monetary policy have helped to stabilize and soften the
economic impact of shutdowns. Yet, the strength of the recovery remains uncertain and dependent
on effective means to isolate and contain COVID-19.
Risks to the Forecast
Several factors could result in either stronger or weaker economic activity than forecast.
Downside. In addition to the near-term risks and uncertainty posed by the impacts of COVID-19, the
shutdown and current downturn may compound existing vulnerabilities in the financial system and
economy. This may result in a slower than expected recovery. Existing vulnerabilities include high
levels of corporate debt that pose risks to the financial system, and gaps in workforce skills and
training as well as income inequalities that will constrain the labor market and consumer activity
across a significant share of U.S. households. Additionally, the fiscal health of state and local
governments threatens to prolong the downturn, as it did during the Great Recession. The most
sizeable downside risk, however, is a resurgence of COVID-19, necessitating a return to shutdown
orders.
Upside. Several factors could result in a faster than expected recovery. COVID-19 may be contained
or a vaccination or other treatment distributed more quickly than expected, resulting in a rapid return
to pre-recessionary economic activity. Additional federal stimulus could further soften the impact of
the recession on businesses and state and local governments, stabilizing and boosting job growth. A
higher than expected rise in crude oil prices could stem the contraction of oil and gas industry activity.
Finally, the dramatic impact of the global pandemic, shutdown, and recession has resulted in new
ways of thinking about business activity. The technological and other innovations that will emerge
from this shift may offer new ideas and tools, boosting business and job prospects in the years to come.

May 2020 Economic Outlook Page 40
Table 14 National Economic Indicators
Calendar Years
2015
2016 2017 2018
Legislative Council Staff Forecast
2019 2020 2021 2022
Real GDP (Billions)1 $17,403.8 $17,688.9 $18,108.1 $18,638.2 $19,073.1 $18,005.0 $18,869.2 $19,586.2 Percent Change 2.9% 1.6% 2.4% 2.9% 2.3% -5.6% 4.8% 3.8%
Nonfarm Employment (Millions)2 141.8 144.3 146.6 148.9 150.9 141.4 144.3 148.7 Percent Change 2.1% 1.8% 1.6% 1.6% 1.4% -6.3% 2.0% 3.1%
Unemployment Rate2 5.3% 4.9% 4.3% 3.9% 3.7% 11.3% 7.8% 6.3%
Personal Income (Billions)1 $15,717.8 $16,121.2 $16,878.8 $17,819.2 $18,602.3 $17,393.2 $17,723.6 $18,769.3 Percent Change 4.8% 2.6% 4.7% 5.6% 4.4% -6.5% 1.9% 5.9%
Wage and Salary Income (Billions)1 $7,856.7 $8,083.5 $8,462.1 $8,888.5 $9,297.7 $8,711.9 $8,894.9 $9,393.0 Percent Change 5.1% 2.9% 4.7% 5.0% 4.6% -6.3% 2.1% 5.6%
Inflation2 0.1% 1.3% 2.1% 2.4% 1.8% 1.1% 1.9% 2.1%
Sources 1U.S. Bureau of Economic Analysis. Real gross domestic product (GDP) is adjusted for inflation. Personal income and wages and salaries not adjusted for inflation. 2U.S. Bureau of Labor Statistics. Inflation shown as the year-over-year change in the consumer price index for all urban areas (CPI-U).

May 2020 Economic Outlook Page 41
Table 15 Colorado Economic Indicators
Legislative Council Staff Forecast
Calendar Years 2015 2016 2017 2018 2019 2020 2021 2022
Population (Thousands, as of July 1)1 5,450.6 5,539.2 5,611.9 5,691.3 5,758.7 5,810.6 5,851.2 5,903.9 Percent Change 1.9% 1.6% 1.3% 1.4% 1.2% 0.9% 0.7% 0.9%
Nonfarm Employment (Thousands)2 2,541.2 2,601.2 2,660.2 2,727.5 2,785.8 2,615.9 2,649.9 2,747.9 Percent Change 3.2% 2.4% 2.3% 2.5% 2.1% -6.1% 1.3% 3.7%
Unemployment Rate2 3.9% 3.3% 2.8% 3.2% 2.8% 10.1% 7.1% 5.8%
Personal Income (Millions)3 $284,234 $289,581 $310,755 $332,943 $353,287 $332,443 $339,092 $362,489 Percent Change 4.8% 1.9% 7.3% 7.1% 6.1% -5.9% 2.0% 6.9%
Wage and Salary Income (Millions)3 $146,531 $151,016 $160,719 $170,115 $182,288 $171,715 $175,664 $186,556 Percent Change 5.7% 3.1% 6.4% 5.8% 7.2% -5.8% 2.3% 6.2%
Housing Permits (Thousands)1 31.9 39.0 40.7 42.6 38.6 22.8 28.4 33.9 Percent Change 11.1% 22.3% 4.4% 4.8% -9.4% -41.0% 24.7% 19.1%
Nonresidential Construction (Millions)4 $4,990.8 $5,989.0 $6,156.1 $8,096.3 $4,898.4 $3,869.8 $3,227.4 $3,937.4 Percent Change 14.7% 20.0% 2.8% 31.5% -39.5% -21.0% -16.6% 22.0%
Denver-Aurora-Lakewood Inflation5 1.2% 2.8% 3.4% 2.7% 1.9% 1.2% 1.7% 2.2% Sources 1U.S. Census Bureau. Residential housing permits are the number of new single and multi-family housing units permitted for building. 2U.S. Bureau of Labor Statistics. 3U.S. Bureau of Economic Analysis. Personal income and wages and salaries not adjusted for inflation. Forecast shown for 2019. 4F.W. Dodge. 5U.S. Bureau of Labor Statistics. Inflation shown as the year-over-year change in the consumer price index.

May 2020 Appendix Page 42
Appendix: Historical Data
National Economic Indicators
Calendar Years 2006 2007 2008 2009 2010 2011 2012 2013 2014 2015 2016 2017 2018 2019
GDP ($ Billions)1 $13,814.6 $14,451.9 $14,712.8 $14,448.9 $14,992.1 $15,542.6 $16,197.0 $16,784.9 $17,527.3 $18,224.8 $18,715.0 $19,519.4 $20,580.2 $21,427.7 Percent Change 6.0% 4.6% 1.8% -1.8% 3.8% 3.7% 4.2% 3.6% 4.4% 4.0% 2.7% 4.3% 5.4% 4.1%
Real GDP ($ Billions)1 $15,338.3 $15,626.0 $15,604.7 $15,208.8 $15,598.8 $15,840.7 $16,197.0 $16,495.4 $16,912.0 $17,403.8 $17,688.9 $18,108.1 $18,638.2 $19,073.1 Percent Change 2.9% 1.9% -0.1% -2.5% 2.6% 1.6% 2.2% 1.8% 2.5% 2.9% 1.6% 2.4% 2.9% 2.3%
Unemployment Rate2 4.6% 4.6% 5.8% 9.3% 9.6% 8.9% 8.1% 7.4% 6.2% 5.3% 4.9% 4.3% 3.9% 3.7%
Inflation2 3.2% 2.9% 3.8% -0.3% 1.6% 3.1% 2.1% 1.5% 1.6% 0.1% 1.3% 2.1% 2.4% 1.8%
10-Year Treasury Note3 4.8% 4.6% 3.7% 3.3% 3.2% 2.8% 1.8% 2.4% 2.5% 2.1% 1.8% 2.3% 2.9% 2.1%
Personal Income ($ Billions)1 $11,381.7 $12,007.8 $12,442.2 $12,059.1 $12,551.6 $13,326.8 $14,010.1 $14,181.1 $14,991.7 $15,717.8 $16,121.2 $16,878.8 $17,819.2 $18,602.3 Percent Change 7.4% 5.5% 3.6% -3.1% 4.1% 6.2% 5.1% 1.2% 5.7% 4.8% 2.6% 4.7% 5.6% 4.4%
Wage & Salaries ($ Billions)1 $6,057.0 $6,396.8 $6,534.3 $6,248.6 $6,372.1 $6,625.9 $6,927.5 $7,113.2 $7,475.2 $7,856.7 $8,083.5 $8,462.1 $8,888.5 $9,297.7 Percent Change 6.4% 5.6% 2.1% -4.4% 2.0% 4.0% 4.6% 2.7% 5.1% 5.1% 2.9% 4.7% 5.0% 4.6%
Nonfarm Employment (Millions)2 136.5 138.0 137.2 131.3 130.3 131.9 134.2 136.4 138.9 141.8 144.3 146.6 148.9 150.9 Percent Change 1.8% 1.1% -0.6% -4.3% -0.7% 1.2% 1.7% 1.6% 1.9% 2.1% 1.8% 1.6% 1.6% 1.4%
Sources 1U.S. Bureau of Economic Analysis. Real gross domestic product (GDP) is adjusted for inflation. Personal income and wages and salaries not adjusted for inflation. 2U.S. Bureau of Labor Statistics. Inflation shown as the year-over-year change in the consumer price index for all urban areas (CPI-U). 3Federal Reserve Board of Governors.

May 2020 Appendix Page 43
Colorado Economic Indicators
Calendar Years 2006 2007 2008 2009 2010 2011 2012 2013 2014 2015 2016 2017 2018 2019
Nonfarm Employment (Thousands)1 2,278.7 2,330.3 2,349.6 2,244.2 2,220.9 2,257.7 2,311.8 2,380.3 2,463.5 2,541.2 2,601.2 2,660.2 2,727.5 2,785.8 Percent Change 2.4% 2.3% 0.8% -4.5% -1.0% 1.7% 2.4% 3.0% 3.5% 3.2% 2.4% 2.3% 2.5% 2.1%
Unemployment Rate1 4.3% 3.7% 4.9% 7.3% 8.7% 8.4% 7.9% 6.9% 5.0% 3.9% 3.3% 2.8% 3.2% 2.8%
Personal Income ($ Millions)2 $189,476 $201,876 $208,738 $198,800 $205,372 $223,153 $237,142 $249,282 $271,308 $284,234 $289,581 $310,755 $332,943 $353,287 Percent Change 8.1% 6.5% 3.4% -4.8% 3.3% 8.7% 6.3% 5.1% 8.8% 4.8% 1.9% 7.3% 7.1% 6.1%
Per Capita Income ($)2 $40,140 $42,024 $42,689 $39,982 $40,682 $43,570 $45,659 $47,298 $50,711 $52,147 $52,278 $55,374 $58,500 $61,348 Percent Change 6.1% 4.7% 1.6% -6.3% 1.8% 7.1% 4.8% 3.6% 7.2% 2.8% 0.3% 5.9% 5.6% 4.9%
Wage & Salary Income ($ Millions)2 $105,649 $112,526 $116,710 $112,228 $113,670 $118,414 $124,947 $129,521 $138,626 $146,531 $151,016 $160,719 $170,115 $182,288 Percent Change 7.0% 6.5% 3.7% -3.8% 1.3% 4.2% 5.5% 3.7% 7.0% 5.7% 3.1% 6.4% 5.8% 7.2%
Retail Trade Sales ($ Millions)3 $70,437 $75,329 $74,760 $66,345 $70,738 $75,548 $80,073 $83,569 $90,653 $94,920 NA NA NA NA Percent Change 7.5% 6.9% -0.8% -11.3% 6.6% 6.8% 6.0% 4.4% 8.5% 4.7%
Residential Housing Permits4 38,343 29,454 18,998 9,355 11,591 13,502 23,301 27,517 28,698 31,871 38,974 40,673 42,627 38,633 Percent Change -16.4% -23.2% -35.5% -50.8% 23.9% 16.5% 72.6% 18.1% 4.3% 11.1% 22.3% 4.4% 4.8% -9.4%
Nonresidential Construction ($ Millions)5 $4,641 $5,259 $4,114 $3,354 $3,147 $3,923 $3,695 $3,624 $4,351 $4,991 $5,989 $6,156 $8,096 $4,898 Percent Change 8.6% 13.3% -21.8% -18.5% -6.2% 24.7% -5.8% -1.9% 20.1% 14.7% 20.0% 2.8% 31.5% -39.5%
Denver-Aurora-Lakewood Inflation1 3.6% 2.2% 3.9% -0.6% 1.9% 3.7% 1.9% 2.8% 2.8% 1.2% 2.8% 3.4% 2.7% 1.9%
Population (Thousands, July 1)4 4,720.4 4,803.9 4,889.7 4,972.2 5,047.3 5,121.1 5,192.6 5,269.0 5,350.1 5,450.6 5,539.2 5,611.9 5,691.3 5,758.7 Percent Change 1.9% 1.8% 1.8% 1.7% 1.5% 1.5% 1.4% 1.5% 1.5% 1.9% 1.6% 1.3% 1.4% 1.2%
NA = Not available. 1U.S. Bureau of Labor Statistics. Inflation shown as the year-over-year change in the consumer price index for Denver-Aurora-Lakewood metro area. 2U.S. Bureau of Economic Analysis. Personal income and wages and salaries not adjusted for inflation. 3Colorado Department of Revenue. Data are not available after 2015. 4U.S. Census Bureau. Residential housing permits are the number of new single and multi-family housing units permitted for building. 5F.W. Dodge.