collective bargaining highlights march 2013 - afimac
TRANSCRIPT

Page 1 Collective Bargaining Highlights March 2013
Collective Bargaining HighlightsMarch 2013
In This Issue Page
Agreements Settled in March 1Wage Settlements 2Wage Trends by Sector 3March Settlements 4 - 5Selected Settlement Summaries 6Major Negotiations Underway 18Consumer Price Index 18
Agreements Settled in March
each covering 150 or more employees. These agreements covered 42,122 employees, 89.7% of whom were in the private sector (37,792).
The overall average annual increase in base wage rates in March was 2.3% an increase from 2.2% reported in the previous month. In the public sector, 13 agreements were settled for an average annual base wage increase of 1.9%, an increase from 1.1% in February. In the private sector, 20 agreements were settled for an average annual base wage increase of 2.3%, a decrease from 2.8% reported in the previous month.
For settlements in the month of March, the industry with the highest average annual base wage increase was transportation, communications and utilities. The lowest average annual base wage increase was in manufacturing and health and social services. The average annual base wage increase in transportation, communications and utilities for one settlement was 2.7%, while in construction
settlements was 2.6%. Public administration reported an average annual base wage increase of 2.3% for seven settlements. Manufacturing and health and social services reported an average annual base wage increase of 1.3%
2.8
1.1
2.22.3
1.9
2.3
0.0
0.5
1.0
1.5
2.0
2.5
3.0
3.5
Private Sector Public Sector All Settlements
Per
cen
tag
e
Average Annual Base Wage Increase
February
March
For further information, contact: Collective Bargaining Information Services 400 University Avenue, 8th Floor Toronto ON M7A 1T7 Telephone: 416-326-1260 Facsimile: 416-326-1277 E-mail: [email protected]
Ministry of Labour
Dispute Resolution Services
At A Glance

Page 2 Collective Bargaining Highlights March 2013
Table 1: Wage Settlements Current Month, Current Three YearsMARCH ANNUAL
Agmts
EmplsAverage Annual
Increase 2011 2012Jan - Mar
2013
% % %
Private Sector 20 37,792 2.3 1.9 1.2 2.3
Public Sector 13 4,330 1.9 1.6 1.4 0.1
All Settlements 33 42,122 2.3 1.7 1.3 0.4
Table 2: Wage Settlements by Industry, Current Month, Current Three YearsMARCH ANNUAL
Agmts
EmplsAverage Annual
Increase 2011 2012Jan - Mar
2013Industries % % %
Primary 1 215 2.2 3.3 2.5 2.3Manufacturing 10 3,160 1.3 1.4 0.8 1.4Construction 5 27,400 2.6 1.3 1.9 2.6
Trade and Finance 2 6,417 1.8 1.3 1.0 1.8Transportation,Communications & Utilities 1 348 2.7 2.6 1.9 2.6Public Administration 7 2,137 2.3 2.2 1.4 0.3Education & Related Services - - - 1.8 1.2 0.0Health & Social Services 5 1,845 1.3 1.2 1.0 0.8Other Services 2 600 2.2 2.2 1.7 2.3All Settlements 33 42,122 2.3 1.7 1.3 0.4
Wage Settlements - March
Page 3 Collective Bargaining Highlights March 2013
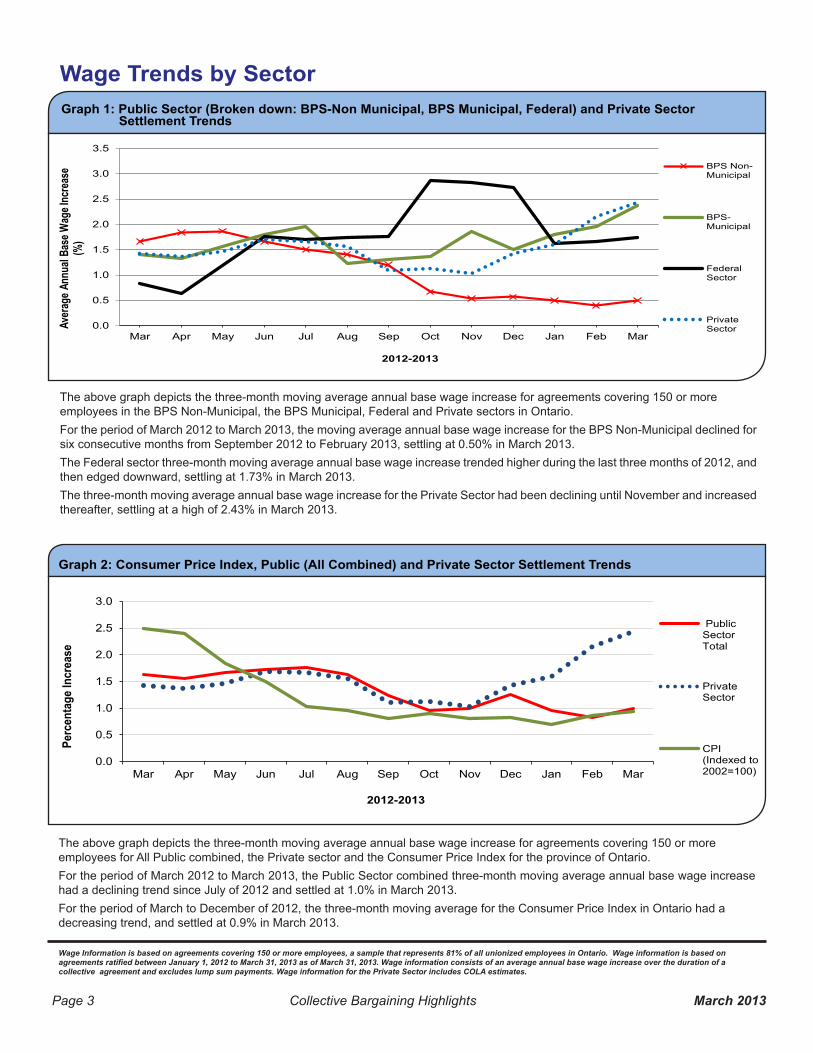
Graph 1: Public Sector (Broken down: BPS-Non Municipal, BPS Municipal, Federal) and Private Sector Settlement Trends
0.0
0.5
1.0
1.5
2.0
2.5
3.0
3.5
Mar Apr May Jun Jul Aug Sep Oct Nov Dec Jan Feb Mar
Aver
age A
nnua
l Bas
e Wag
e Inc
reas
e(%
)
2012-2013
BPS Non-Municipal
BPS-Municipal
FederalSector
PrivateSector
The above graph depicts the three-month moving average annual base wage increase for agreements covering 150 or more employees in the BPS Non-Municipal, the BPS Municipal, Federal and Private sectors in Ontario. For the period of March 2012 to March 2013, the moving average annual base wage increase for the BPS Non-Municipal declined for six consecutive months from September 2012 to February 2013, settling at 0.50% in March 2013. The Federal sector three-month moving average annual base wage increase trended higher during the last three months of 2012, and then edged downward, settling at 1.73% in March 2013.The three-month moving average annual base wage increase for the Private Sector had been declining until November and increased thereafter, settling at a high of 2.43% in March 2013.
Graph 2: Consumer Price Index, Public (All Combined) and Private Sector Settlement Trends
Wage Information is based on agreements covering 150 or more employees, a sample that represents 81% of all unionized employees in Ontario. Wage information is based on
collective agreement and excludes lump sum payments. Wage information for the Private Sector includes COLA estimates.
The above graph depicts the three-month moving average annual base wage increase for agreements covering 150 or more employees for All Public combined, the Private sector and the Consumer Price Index for the province of Ontario.For the period of March 2012 to March 2013, the Public Sector combined three-month moving average annual base wage increase had a declining trend since July of 2012 and settled at 1.0% in March 2013.For the period of March to December of 2012, the three-month moving average for the Consumer Price Index in Ontario had a decreasing trend, and settled at 0.9% in March 2013.
Wage Trends by Sector
0.0
0.5
1.0
1.5
2.0
2.5
3.0
Mar Apr May Jun Jul Aug Sep Oct Nov Dec Jan Feb Mar
Perc
enta
ge In
crea
se
2012-2013
PublicSectorTotal
PrivateSector
CPI(Indexed to2002=100)

Page 4 Collective Bargaining Highlights March 2013
Table 3: March Settlements
* including COLA clauses and/or COLA estimates1 excluding lump sum payments2
3
4 adjustments for skilled trades and selected groups5
Continued...
Employer Union Average Annual
Wage Incr.
1st 12
months
Approx. Number
of Empls.
Duration of Wage
ScheduleAgmt.Expiry
% % (Ontario) (months) Date
PrimaryUnited Steelworkers 2.2* 1.0 215 48 2017-02-28
Manufacturing
Arnprior Aerospace (production & maintenance)
Machinists 0.61,2 0.0 325 72 2019-03-06
Canadian General -Tower United Steelworkers 1.1*1 0.0 321 36 2016-02-28
Cargill (Watson Road Plant) Food & Commercial Workers
1.34 1.1 600 48 2016-12-31
General Dynamics Land System (Canada) (armoured vehicle)
Cdn Auto Workers 1.5*1 0.0 528 36 2016-03-24
Hitachi Construction Truck Manufacturing
Cdn Auto Workers 2.0 2.0 226 36 2016-02-23
Maple Leaf Consumer Foods Food & Commercial Workers
1.81,2 0.0 153 48 2017-03-30
Pilkington Glass of Canada United Steelworkers 0.0*2 0.0 238 36 2016-01-31
Premium Brands Operating LP (Kretschmar division)
Food & Commercial Workers
0.91 0.0 174 48 2015-12-01
Teamsters 2.14 1.9 315 60 2018-02-28
United Steelworkers 1.91 1.0 280 48 2017-03-31
Construction
Carpenters’ Employer Bargaining Agency (ICI)
Carpenters 2.5 2.6 12,000 36 2016-04-30
Electrical Trade Bargaining Agency (ICI) Electrical Workers 2.6 2.2 13,800 36 2016-04-30
Electrical Trade Bargaining Agency (communications)
Electrical Workers 2.6 2.2 250 36 2016-04-30
Electrical Trade Bargaining Agency (Non-ICI linework)
Electrical Workers 2.6 2.2 750 36 2016-04-30
Thunder Bay Construction Association Carpenters 2.8 2.8 600 36 2016-04-30
Trade & Finance
Brewer’s Retail (The Beer Store) (distribution/retail)
Food & Commercial Workers
1.8*1 1.7 6,000 36 2015-12-31
Sobeys (Milton Retail Support Centre) Food & Commercial Workers
2.4*5 3.9 417 108 2022-01-31
Transportation, Communications & Utilities
Powerstream (inside/outside) Cdn Public Empls 2.73 2.5 348 36 2016-03-31

Page 5 Collective Bargaining Highlights March 2013
Table 3: March Settlements (Cont’d)
* including COLA clauses and/or COLA estimates1 excluding lump sum payments4 adjustments for skilled trades and selected groups6 lump sum for selected groups
Employer Union Average Annual
Wage Incr.
1st 12
months
Approx. Number
of Empls.
Duration of Wage
ScheduleAgmt.Expiry
% % (Ontario) (months) Date
Public Administration
Corporation of the City of Brantford Cdn Public Empls 1.3 1.2 190 36 2015-03-31
Corporation of the City of Kitchener (outside)
Cdn Public Empls 1.4 1.2 230 35 2015-12-31
Corporation of the City of Vaughan 2.9 2.7 292 24 2012-12-31
Financial InstitutionsProfessional Institute 1.7 1.7 180 36 2014-03-31
Regional Municipality of Waterloo (works)
Cdn Public Empls 1.5 1.5 199 48 2016-12-31
Waterloo Regional Police Services Board (civilians)
Police Assn (Waterloo Regional)
2.8 2.7 288 36 2014-12-31
Waterloo Regional Police Services Board (uniform)
Police Assn (Waterloo Regional)
2.8 2.7 758 36 2014-12-31
Health & Social Services
Norfolk General Hospital (hospital/nursing home) (service/RPN)
Cdn Auto Workers 0.0 0.0 238 24 2014-03-31
Regional Municipality of Halton (Allendale/Creek Way Village/Post Inn Village)
Ont Public Service Empls 2.06 2.0 701 24 2013-05-31
Regional Municipality of Halton (emergency)
Ont Public Service Empls 2.2 2.5 184 36 2013-12-31
Villa Leonardo Gambin (Friuli Crt - LTC) Labourers 0.41 1.3 251 36 2014-12-31
Windsor Regional Hospital (paramedical/support/professional)
Ont Public Service Empls 1.21,4 2.5 471 24 2012-03-31
Other Services
Canadian Public Employees Union 2.4* 2.5 250 24 2013-12-31
G & K Services Canada Food & Commercial Workers
2.01 2.0 350 36 2015-12-31
Page 6 Collective Bargaining Highlights March 2013
Selected Settlement Summaries(Key monetary items based on available information)
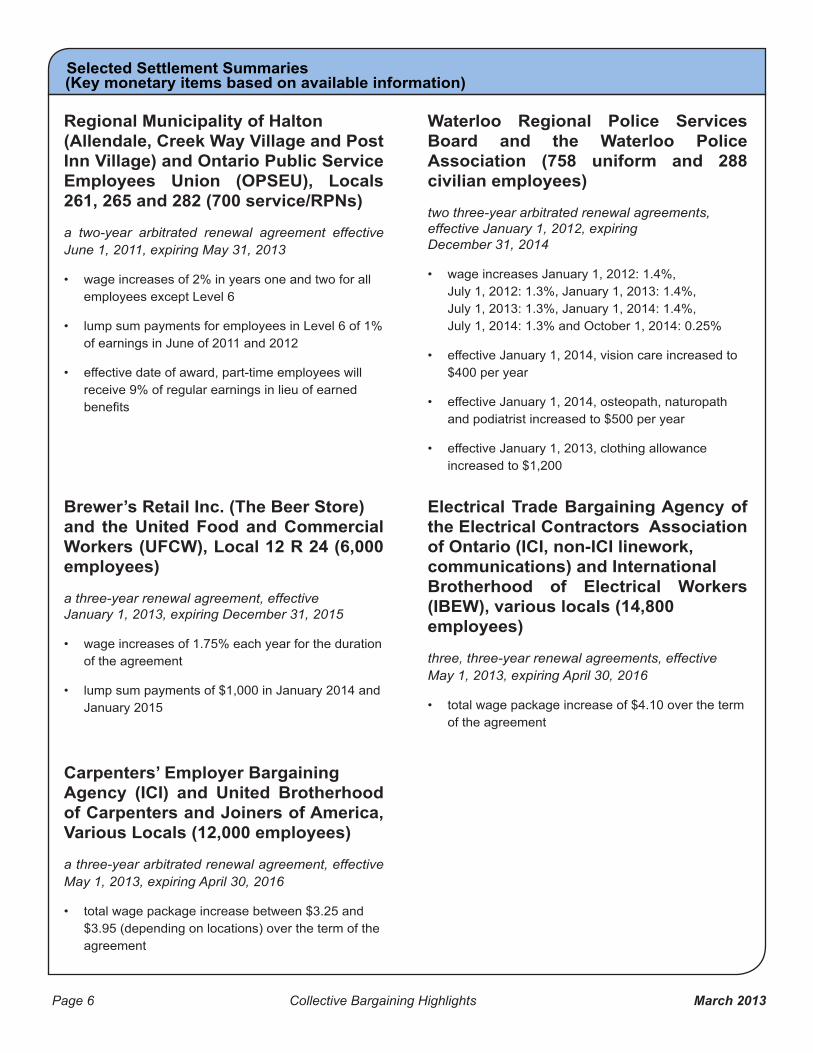
Regional Municipality of Halton (Allendale, Creek Way Village and Post Inn Village) and Ontario Public Service Employees Union (OPSEU), Locals 261, 265 and 282 (700 service/RPNs)
a two-year arbitrated renewal agreement effective June 1, 2011, expiring May 31, 2013
wage increases of 2% in years one and two for all employees except Level 6
lump sum payments for employees in Level 6 of 1% of earnings in June of 2011 and 2012
effective date of award, part-time employees will receive 9% of regular earnings in lieu of earned
Brewer’s Retail Inc. (The Beer Store) and the United Food and Commercial Workers (UFCW), Local 12 R 24 (6,000 employees)
a three-year renewal agreement, effective January 1, 2013, expiring December 31, 2015
wage increases of 1.75% each year for the duration of the agreement
lump sum payments of $1,000 in January 2014 and January 2015
Carpenters’ Employer Bargaining Agency (ICI) and United Brotherhood of Carpenters and Joiners of America, Various Locals (12,000 employees)
a three-year arbitrated renewal agreement, effective May 1, 2013, expiring April 30, 2016
total wage package increase between $3.25 and $3.95 (depending on locations) over the term of the agreement
Waterloo Regional Police Services Board and the Waterloo Police Association (758 uniform and 288 civilian employees)
two three-year arbitrated renewal agreements, effective January 1, 2012, expiring December 31, 2014
wage increases January 1, 2012: 1.4%, July 1, 2012: 1.3%, January 1, 2013: 1.4%, July 1, 2013: 1.3%, January 1, 2014: 1.4%, July 1, 2014: 1.3% and October 1, 2014: 0.25%
effective January 1, 2014, vision care increased to $400 per year
effective January 1, 2014, osteopath, naturopath and podiatrist increased to $500 per year
effective January 1, 2013, clothing allowance increased to $1,200
Electrical Trade Bargaining Agency of the Electrical Contractors Association of Ontario (ICI, non-ICI linework, communications) and International Brotherhood of Electrical Workers (IBEW), various locals (14,800 employees)
three, three-year renewal agreements, effective May 1, 2013, expiring April 30, 2016
total wage package increase of $4.10 over the term of the agreement

Page 7 Collective Bargaining Highlights March 2013
First Quarter 2013
more Ontario-based employees. These agreements covered 376,894 employees (Table 5), 84% of whom were in the public sector. By industry, the majority of employees were in education and related services (267,980), provincial government (34,714) and recreational services (12,000) (Table 8).
Wage Adjustments
annual increase of 0.4%, a decrease from 1.3% in
annual wage increase was 0.1%, compared to 1.2%
an average annual wage increase of 2.3%, up from
products (2.7%), construction and wholesale trade (2.6%), and transportation, electricity gas and water, management services and local government (2.4%). Annual wage adjustments for the industries with the highest concentration of employees averaged 0% in education and related services (267,980), 0% in provincial government (34,714) and 2.0% in recreational services (12,000).
(14,860) of all employees (Table 6) received average annual wage increases ranging from 1% to 1.9%, compared to 13.6% (51,329) who received average annual wage increases ranging from 2% to 2.9%. In the public sector, 1.9% (6,334) of employees were covered by agreements with average annual wage increases ranging from 1% to 1.9%, compared to 14.2% (8,526) of the private sector employees. In the private sector 80.2% (48,125) of employees received average annual wage increases ranging from 2% to 2.9%, compared to 1.0% (3,204) of public sector employees.
Of the total number of employees for whom
2013 (Table 10), 81.75% (308,098) were covered by two-year agreements. In the private sector, three-year agreements were the most common, covering 88.6% (53,165) of employees compared to 0.9% (550) of employees covered by two-year agreements. In the public sector, 97% (307,548) were covered by two-year agreements and 2.4% (7,585) by three-year agreements. Approximately 47.2% (2,937) of manufacturing employees and 7.9% (26,913) of non-manufacturing employees were covered by three-year agreements.
Negotiations
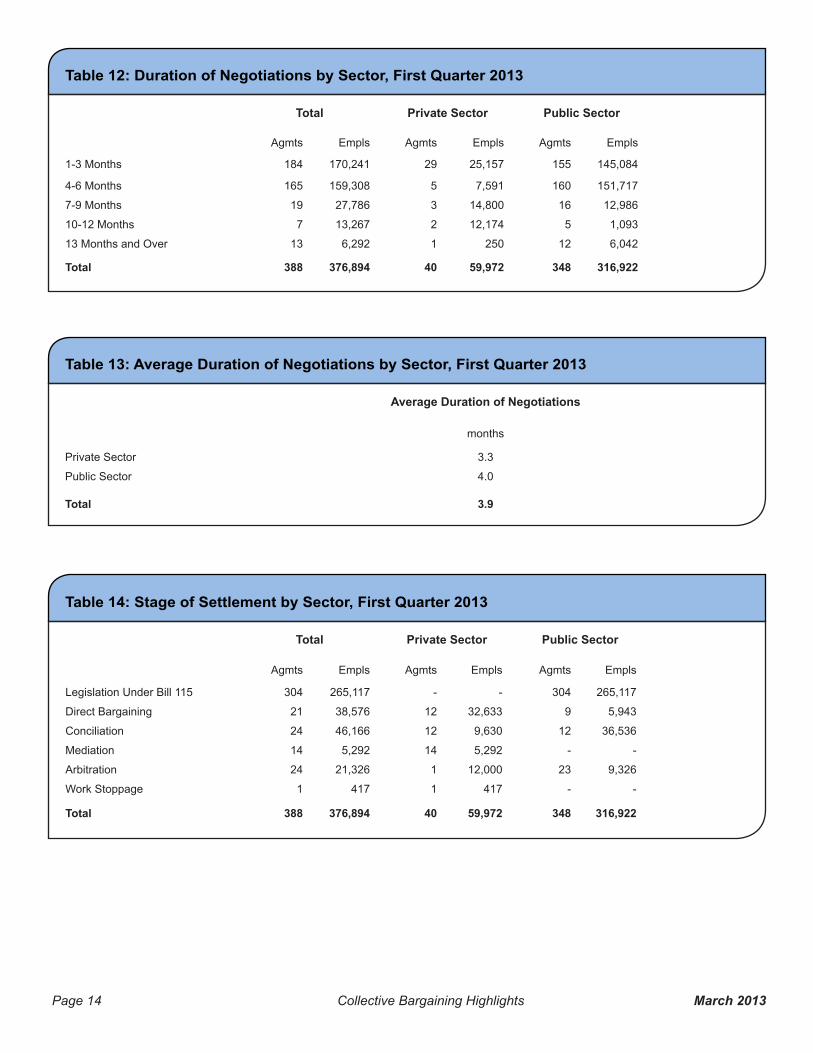
within 3.3 months from the start of negotiations, compared to 4.0 months in the public sector (Table 13).
2013, 21 agreements covering 10.2% (38,576) of employees were negotiated directly by the parties, compared to 38 agreements covering 13.6% (51,458) of employees reached with the assistance of conciliation or mediation. Twenty-four (24) agreements, covering 5.6% (21,326) of employees were settled by arbitration, and one (1) agreement was reached following a work stoppage (Table 14).
In the public sector, approximately 11.5% (36,536) of employees reached settlements with the assistance of conciliation or mediation, while 83.6% (265,117) were reached through legislation under Bill 115. In the private sector, 24.8% (14,922) reached agreements with the assistance of conciliation or mediation, compared to 54.4% (32,633) who settled by direct bargaining.
Page 8 Collective Bargaining Highlights March 2013
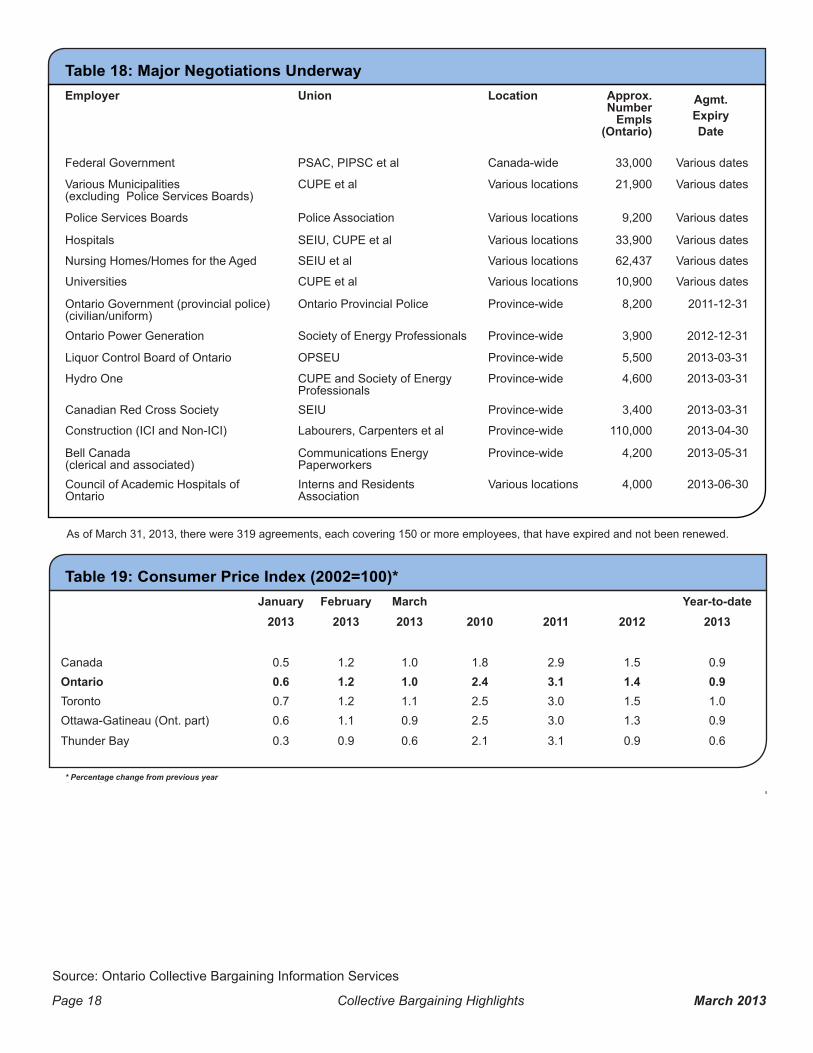
Upcoming BargainingMajor negotiations continuing into the second
municipalities, police services boards, hospitals, nursing homes and homes for the aged, universities, Hydro One, Ontario Power Generation and the Ontario Government (provincial police/civilian uniform).
Major agreements scheduled to expire during the
sector’s ICI and Non-ICI agreements, Bell Canada and the Council of Academic Hospitals of Ontario.
Work Stoppages
were reported under Ontario jurisdiction, compared to 16 reported for the same period in 2012. Work
involved 532 employees and resulted in 11,550 person-days lost, compared to 3,645 employees and 51,910 person-days lost reported during the same period in 2012 (Table 15 and 16).
From January to March 2013, two work stoppages were reported in the manufacturing sector, a decrease
comparison, the non-manufacturing sector reported three work stoppages compared to 11 reported during the same period in 2012. In the construction sector, no work stoppages were reported during the
2013, 0.00% of the estimated working time in Ontario was lost due to work stoppages (Table 16 and 17).

Page 9 Collective Bargaining Highlights March 2013
Table 4: Wage Trends - Last Three Years Average Annual Increase in Base Wage Rates and Consumer Price Index
Q12010
Q22010
Q32010
Q42010
Q12011
Q22011
Q32011
Q42011
Q12012
Q22012
Q32012
Q42012
Q12013
CPI 1.6 1.9 2.9 3.2 3.1 3.8 3.2 2.4 2.5 1.5 0.8 0.9 0.9all settlements 2.3 2.3 2.6 1.5 2.2 1.5 1.7 1.8 1.5 1.7 0.9 1.3 0.4
0.0
0.5
1.0
1.5
2.0
2.5
3.0
3.5
4.0
perc
enta
ge in
crea
se
Q12010
Q22010
Q32010
Q42010
Q12011
Q22011
Q32011
Q42011
Q12012
Q22012
Q32012
Q42012
Q12013
CPI 1.6 1.9 2.9 3.2 3.1 3.8 3.2 2.4 2.5 1.5 0.8 0.9 0.9public 2.2 2.3 2.0 1.8 2.2 1.4 1.7 1.6 1.6 1.7 1.0 1.2 0.1private 2.3 2.3 3.0 0.9 2.1 1.8 1.6 2.0 1.3 1.7 0.8 1.5 2.3
0.0
0.5
1.0
1.5
2.0
2.5
3.0
3.5
4.0
perc
enta
ge in
crea
se
2010, 2011 & 2012 wage data are based on agreements covering 150 or more employees
all settlements
CPI
public
CPI
private

Page 10 Collective Bargaining Highlights March 2013
Table 5: Average Annual Increases in Base Wage Rates by Sector (private and Public), First Quarter 2012 to First Quarter 2013
Table 6: Distribution of Average Annual Increases in Base Wage Rates by Sector (private and public), First Quarter 2013
All Agreements Agreements with COLA Agreements without COLA
Agmts Empls % Agmts Empls % Agmts Empls %
First Quarter 2012
Private Sector 44 24,736 1.3 6 1,528 1.5 38 23,208 1.3
Public Sector 77 36,854 1.6 - - - 77 36,854 1.6
All agreements 121 61,590 1.5 6 1,528 1.5 115 60,062 1.5
Second Quarter 2012
Private Sector 48 22,275 1.7 7 3,653 2.2 41 18,622 1.6
Public Sector 53 66,652 1.7 1 6,600 2.7 52 60,052 1.6
All agreements 101 88,927 1.7 8 10,253 2.6 93 78,674 1.6
Third Quarter 2012Private Sector 32 37,942 0.8 5 20,116 0.2 27 17,826 1.4
Public Sector 71 63,104 1.0 - - - 71 63,104 1.0
All agreements 103 101,046 0.9 5 20,116 0.2 98 80,930 1.1
Fourth Quarter 2012
Private Sector 31 14,966 1.5 4 1,809 0.4 27 13,157 1.6
Public Sector 49 61,424 1.2 1 18,620 1.4 48 42,804 1.1
All agreements 80 76,390 1.3 5 20,429 1.4 75 55,961 1.3
First Quarter 2013Private Sector 40 59,972 2.3 10 9,579 1.9 30 50,393 2.4
Public Sector 348 316,922 0.1 - - - 348 316,922 0.1
All agreements 388 376,894 0.4 10 9,579 1.9 378 367,315 0.4
All Agreements Private Sector Public Sector
Agmts Empls % Agmts Empls % Agmts Empls %
No Increase 323 307,533 81.5 3 873 1.4 320 306,660 96.7
0.1 - 0.9 Percent 7 2,194 0.5 4 1,470 2.4 3 724 0.2
1.0 - 1.9 Percent 24 14,860 3.9 9 8,526 14.2 15 6,334 1.9
2.0 - 2.9 Percent 33 51,329 13.6 23 48,125 80.2 10 3,204 1.0
5.0 - 5.9 Percent 1 978 0.2 1 978 1.6 - - -
All Agreements 388 376,894 100.0 40 59,972 100.0 348 316,922 100.0
Page 11 Collective Bargaining Highlights March 2013
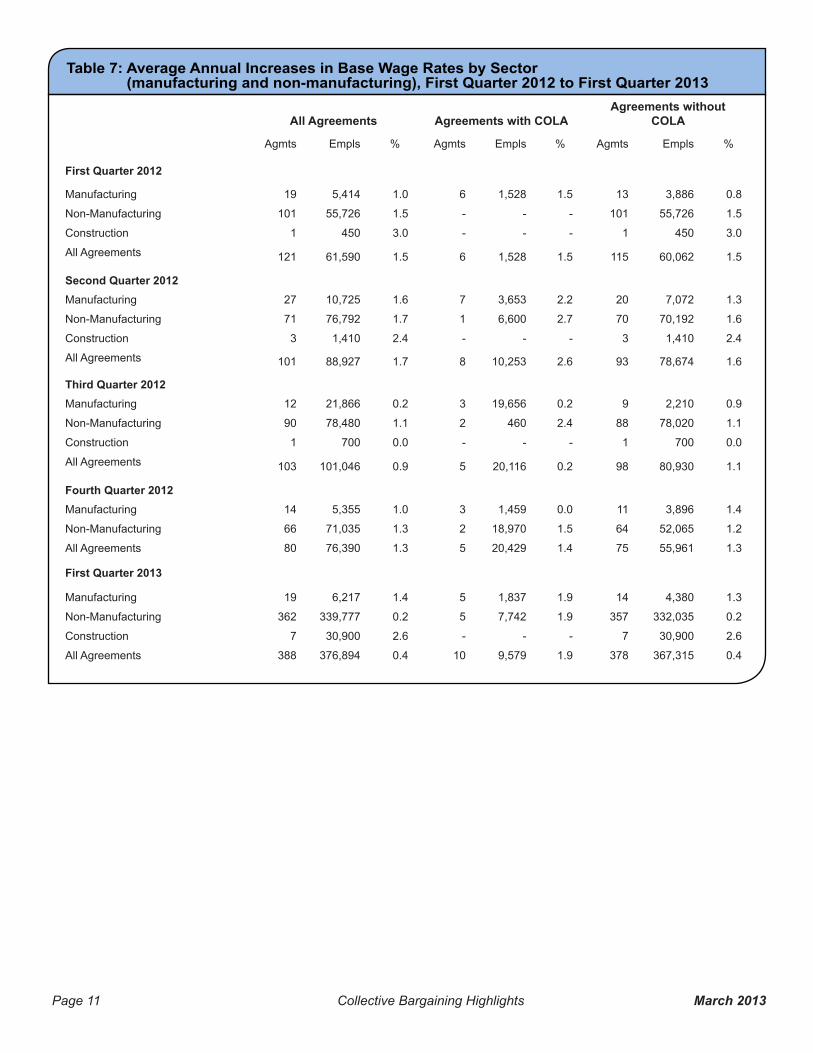
Table 7: Average Annual Increases in Base Wage Rates by Sector (manufacturing and non-manufacturing), First Quarter 2012 to First Quarter 2013
All Agreements Agreements with COLAAgreements without
COLA
Agmts Empls % Agmts Empls % Agmts Empls %
First Quarter 2012
Manufacturing 19 5,414 1.0 6 1,528 1.5 13 3,886 0.8
Non-Manufacturing 101 55,726 1.5 - - - 101 55,726 1.5
Construction 1 450 3.0 - - - 1 450 3.0
All Agreements 121 61,590 1.5 6 1,528 1.5 115 60,062 1.5
Second Quarter 2012Manufacturing 27 10,725 1.6 7 3,653 2.2 20 7,072 1.3
Non-Manufacturing 71 76,792 1.7 1 6,600 2.7 70 70,192 1.6
Construction 3 1,410 2.4 - - - 3 1,410 2.4
All Agreements 101 88,927 1.7 8 10,253 2.6 93 78,674 1.6
Third Quarter 2012Manufacturing 12 21,866 0.2 3 19,656 0.2 9 2,210 0.9
Non-Manufacturing 90 78,480 1.1 2 460 2.4 88 78,020 1.1
Construction 1 700 0.0 - - - 1 700 0.0
All Agreements 103 101,046 0.9 5 20,116 0.2 98 80,930 1.1
Fourth Quarter 2012Manufacturing 14 5,355 1.0 3 1,459 0.0 11 3,896 1.4
Non-Manufacturing 66 71,035 1.3 2 18,970 1.5 64 52,065 1.2
All Agreements 80 76,390 1.3 5 20,429 1.4 75 55,961 1.3
First Quarter 2013
Manufacturing 19 6,217 1.4 5 1,837 1.9 14 4,380 1.3
Non-Manufacturing 362 339,777 0.2 5 7,742 1.9 357 332,035 0.2
Construction 7 30,900 2.6 - - - 7 30,900 2.6
All Agreements 388 376,894 0.4 10 9,579 1.9 378 367,315 0.4

Page 12 Collective Bargaining Highlights March 2013
Table 8: Average Annual Increases in Base Wage Rates by Industry, First Quarter 2013
All Agreements Agreements with COLAAgreements without
COLAAgmts Empls % Agmts Empls % Agmts Empls %
Manufacturing
Food, Beverage 4 1,242 1.5 - - - 4 1,242 1.5
Rubber, Plastics 4 1,164 0.8 1 321 1.1 3 843 0.7
Textile 1 800 0.9 - - - 1 800 0.9
Primary Metals 2 430 2.3 1 150 3.0 1 280 1.9
Fabricated Metals 1 171 0.7 - - - 1 171 0.7
Machinery 1 226 2.0 - - - 1 226 2.0
2 853 1.2 1 528 1.5 1 325 0.6
Electrical Products 3 1,093 2.7 1 600 3.0 2 493 2.3
Non-Metallic Minerals 1 238 0.0 1 238 0.0 - - -
Total 19 6,217 1.4 5 1,837 1.9 14 4,380 1.3
Non-Manufacturing
Mining, Quarrying 2 1,075 2.3 2 1,075 2.3 - - -
Transportation 4 1,552 2.4 - - - 4 1,552 2.4
Storage 1 978 5.9 - - - 1 978 5.9
Electricity, Gas, Water 2 646 2.4 - - - 2 646 2.4
Wholesale Trade 2 657 2.6 1 417 2.4 1 240 3.0
Retail Trade 1 6,000 1.8 1 6,000 1.8 - - -
Finance, Insurance Carriers 1 174 1.5 - - - 1 174 1.5
Education & Related Services 306 267,980 0.0 - - - 306 267,980 0.0
Health & Social Services 21 8,112 0.7 - - - 21 8,112 0.7
Recreational Services 1 12,000 2.0 - - - 1 12,000 2.0
Management Services 1 180 2.4 - - - 1 180 2.4
Personal Services 1 350 2.0 - - - 1 350 2.0
Other Services 3 720 1.8 1 250 2.4 2 470 1.6
Federal Government 3 1,596 1.8 - - - 3 1,596 1.8
Provincial Government 3 34,714 0.0 - - - 3 34,714 0.0
Local Government 10 3,043 2.4 - - - 10 3,043 2.4
Total 362 339,777 0.2 5 7,742 1.9 357 332,035 0.2
Construction 7 30,900 2.6 - - - 7 30,900 2.6
All Industries 388 376,894 0.4 10 9,579 1.9 378 367,315 0.4

Page 13 Collective Bargaining Highlights March 2013
Table 9: Average Annual Increases in Base Wage Rates, All Industries, First Quarter 2013
Table 10: Average Annual Increases in Base Wage Rates by Duration and Sector, First Quarter 2013
Table 11: Average Annual Increases in Base Wage Rates by Duration (manufacturing and non-manufacturing), First Quarter 2013
All agreements Agreements with COLA Agreements without COLA
Agmts Empls % Agmts Empls % Agmts Empls %
Manufacturing 19 6,217 1.4 5 1,837 1.9 14 4,380 1.3
Non-Manufacturing 362 339,777 0.2 5 7,742 1.9 357 332,035 0.2
Construction 7 30,900 2.6 - - - 7 30,900 2.6
All Industries 388 376,894 0.4 10 9,579 1.9 378 367,315 0.4
All Agreements Private Sector Public Sector
Agmts Empls % Agmts Empls % Agmts Empls %
One-year agreements 1 174 1.5 1 174 1.5 - - -
Two-year agreements 327 308,098 0.0 2 550 2.0 325 307,548 0.0
Three-year agreements 38 60,750 2.3 21 53,165 2.4 17 7,585 1.3
Four-year agreements 17 6,034 1.7 11 4,245 1.7 6 1,789 1.7
Five-year agreements 3 1,096 2.2 3 1,096 2.2 - - -
Six-Year agreements 1 325 0.6 1 325 0.6 - - -
Nine-Year agreements 1 417 2.4 1 417 2.4 - - -
All Agreements 388 376,894 0.4 40 59,972 2.3 348 316,922 0.1
Manufacturing Non-Manufacturing Construction
Agmts Empls % Agmts Empls % Agmts Empls %
One-year agreements - - - 1 174 1.5 - - -
Two-year agreements - - - 327 308,098 0.0 - - -
Three-year agreements 10 2,937 1.7 21 26,913 1.9 7 30,900 2.6
Four-year agreements 7 2,640 1.1 10 3,394 2.1 - - -
Five-year agreements 1 315 2.1 2 781 2.3 - - -
Six-Year agreements 1 325 0.6 - - - - - -
Nine-Year agreements - - - 1 417 2.4 - - -
All Agreements 19 6,217 1.4 362 339,777 0.2 7 30,900 2.6
Page 14 Collective Bargaining Highlights March 2013
Table 12: Duration of Negotiations by Sector, First Quarter 2013
Table 13: Average Duration of Negotiations by Sector, First Quarter 2013
Table 14: Stage of Settlement by Sector, First Quarter 2013
Total Private Sector Public Sector
Agmts Empls Agmts Empls Agmts Empls
1-3 Months 184 170,241 29 25,157 155 145,084
4-6 Months 165 159,308 5 7,591 160 151,717
7-9 Months 19 27,786 3 14,800 16 12,986
10-12 Months 7 13,267 2 12,174 5 1,093
13 Months and Over 13 6,292 1 250 12 6,042
Total 388 376,894 40 59,972 348 316,922
Average Duration of Negotiations
months
Private Sector 3.3
Public Sector 4.0
Total 3.9
Total Private Sector Public Sector
Agmts Empls Agmts Empls Agmts Empls
Legislation Under Bill 115 304 265,117 - - 304 265,117
Direct Bargaining 21 38,576 12 32,633 9 5,943
Conciliation 24 46,166 12 9,630 12 36,536
Mediation 14 5,292 14 5,292 - -
Arbitration 24 21,326 1 12,000 23 9,326
Work Stoppage 1 417 1 417 - -
Total 388 376,894 40 59,972 348 316,922

Page 15 Collective Bargaining Highlights March 2013
Table 15: Work Stoppages, January - March 2012 and 2013
Table 16: Person-Days Lost, January - March 2012 and 2013
January - March 2013 January - March 2012
Manufacturing 2 5
Non-Manufacturing 3 11
Construction - -
All Industries 5 16
January - March 2013 January - March 2012
Manufacturing 3,410 24,420
Non-Manufacturing 8,140 27,490
Construction - -
All Industries 11,550 51,910
As of March 31, 2013, 2 work stoppages, covering a total of 56 employees were carried over to April 2013. (Data are collected for all work stoppages involving two or more employees under Ontario Jurisdiction.)

Page 16 Collective Bargaining Highlights March 2013
Table 17: Work stoppages Under Ontario Jurisdiction, 1988-March 2013
Year
Number of Work
Stoppages
Number of Employees
Involved
Number of Employees
Per Work Stoppage
Number of Person-Days
Lost
Number of Person-Days
Lost Per Employee
Involved
Average Duration of Work
Stoppages (Days Out)
Person-Days Lost as % of Estimated
Working Time
1988 180 62,082 345 1,362,150 21.9 35 0.12
1989 190 45,679 240 868,630 19.0 35 0.08
1990 218 81,022 372 2,957,640 36.5 43 0.26
1991 153 25,448 166 453,520 17.8 43 0.04
1992 121 38,160 315 577,710 15.1 39 0.05
1993 81 15,620 193 371,150 23.8 42 0.03
1994 130 25,456 196 488,320 19.2 34 0.05
1995 136 57,318 421 476,960 8.3 39 0.04
1996 135 216,917 1,607 1,914,900 8.8 39 0.16
1997 113 176,029 1,558 1,904,210 10.8 50 0.16
1998 156 69,411 445 1,060,990 15.3 38 0.09
1999 143 44,980 315 651,100 14.5 39 0.05
2000 146 55,267 379 649,730 11.8 39 0.05
2001 144 34,652 241 671,990 19.4 35 0.05
2002 117 66,572 569 1,510,580 22.7 40 0.11
2003 94 23,807 253 494,880 20.8 38 0.04
2004 99 20,952 212 486,840 23.2 37 0.03
2005 76 12,239 161 403,210 32.9 45 0.03
2006 70 30,240 432 394,600 13.0 48 0.03
2007 75 25,257 337 389,130 15.4 39 0.03
2008 64 19,118 299 281,770 14.7 48 0.02
2009 64 42,573 665 1,549,560 36.4 71 0.11
2010 56 10,711 191 704,630 65.8 71 0.05
2011 40 11,502 288 352,160 30.6 65 0.02
2012 135 65,982 489 200,600 3.0 13 0.01
2013 (Jan-Mar)* 5 532 106 11,550 21.7 35 0.00
* preliminary Source: Collective Bargaining Information Services, Dispute Resolution Services

Page 17 Collective Bargaining Highlights March 2013
Work Stoppages
0
50
100
150
200
250
Number of Work Stoppages
The number of work stoppages has a decreasing trend (Chart 1) from 1988 to 2011. The high was in 1990 with 218 Work Stoppages. The low in 2011 was 40. Roughly 50% of the numbers of work stoppages during 2012 were due to School Board
532 employees with 11,550 person-days lost in total.
* preliminary
Page 18 Collective Bargaining Highlights March 2013
Table 19: Consumer Price Index (2002=100)*
Table 18: Major Negotiations Underway
January February March Year-to-date2013 2013 2013 2010 2011 2012 2013
Canada 0.5 1.2 1.0 1.8 2.9 1.5 0.9Ontario 0.6 1.2 1.0 2.4 3.1 1.4 0.9Toronto 0.7 1.2 1.1 2.5 3.0 1.5 1.0Ottawa-Gatineau (Ont. part) 0.6 1.1 0.9 2.5 3.0 1.3 0.9
Thunder Bay 0.3 0.9 0.6 2.1 3.1 0.9 0.6
* Percentage change from previous yearSource: Statistics Canada
Information in this report is based on collective agreements covering 150 or more employees, a sample that represents 81% of unionized employees in Ontario. Wage data in this report are derived exclusively from information reported to Collective Bargaining Information Services. Data for the current month are preliminary. All percentage wage data are calculated on the base rate, weighted by the number of employees, and include cost-of-living adjustments
bargaining unit.
The Collective Bargaining Highlights may be reproduced and circulated freely. However, Collective Bargaining Information Services should be acknowledged as the source.
This document is available on the Ministry of Labour Website at http://www.labour.gov.on.ca/english/lr/pubs/index.php. For further information on this report or other services, please contact us at [email protected] or call 416-326-1260.
Cette publication est également disponible en français.
Employer Union Location Approx. Number
Empls (Ontario)
Agmt. Expiry Date
Federal Government PSAC, PIPSC et al Canada-wide 33,000 Various dates
Various Municipalities (excluding Police Services Boards)
CUPE et al Various locations 21,900 Various dates
Police Services Boards Police Association Various locations 9,200 Various dates
Hospitals SEIU, CUPE et al Various locations 33,900 Various dates
Nursing Homes/Homes for the Aged SEIU et al Various locations 62,437 Various dates
Universities CUPE et al Various locations 10,900 Various dates
Ontario Government (provincial police) (civilian/uniform)
Ontario Provincial Police Province-wide 8,200 2011-12-31
Ontario Power Generation Society of Energy Professionals Province-wide 3,900 2012-12-31
OPSEU Province-wide 5,500 2013-03-31
Hydro One CUPE and Society of Energy Professionals
Province-wide 4,600 2013-03-31
Canadian Red Cross Society SEIU Province-wide 3,400 2013-03-31
Construction (ICI and Non-ICI) Labourers, Carpenters et al Province-wide 110,000 2013-04-30
Bell Canada (clerical and associated)
Communications Energy Paperworkers
Province-wide 4,200 2013-05-31
Council of Academic Hospitals of Ontario
Interns and Residents Association
Various locations 4,000 2013-06-30
As of March 31, 2013, there were 319 agreements, each covering 150 or more employees, that have expired and not been renewed.
ISSN 1492-4323
Source: Ontario Collective Bargaining Information Services