collective action and community development evidence from self-help groups in rural india raj m...
TRANSCRIPT
COLLECTIVE ACTION AND COMMUNITY DEVELOPMENT
Evidence from Self-Help Groupsin Rural India
Raj M Desai Shareen Joshi
Georgetown University
Big Question
• Can external actors lower the barriers for collective action in poor communities?
• Why this matters:– Opportunity for collective action has intrinsic value– Also has instrumental value: poverty alleviation, political
change, etc. – Civil society can play a role in the design, implementation and
monitoring of policies
Outline
• Overview
• The intervention
• Program impact
• Policy implications
3
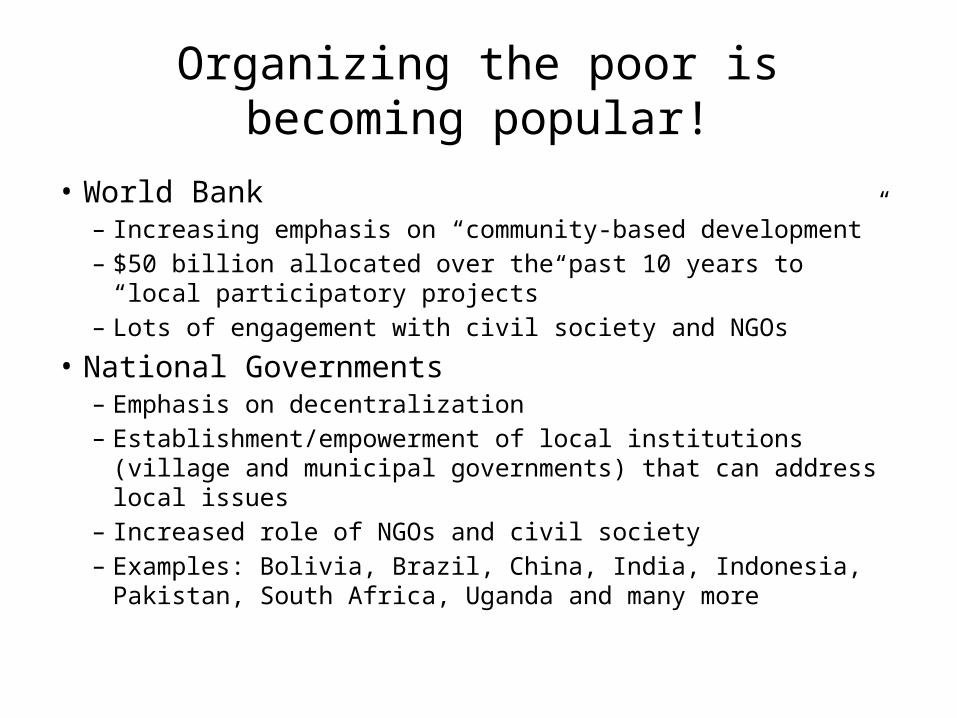
Organizing the poor is becoming popular!
• World Bank – Increasing emphasis on “community-based development”– $50 billion allocated over the past 10 years to “local
participatory projects”– Lots of engagement with civil society and NGOs
• National Governments– Emphasis on decentralization– Establishment/empowerment of local institutions (village and
municipal governments) that can address local issues – Increased role of NGOs and civil society– Examples: Bolivia, Brazil, China, India, Indonesia, Pakistan,
South Africa, Uganda and many more
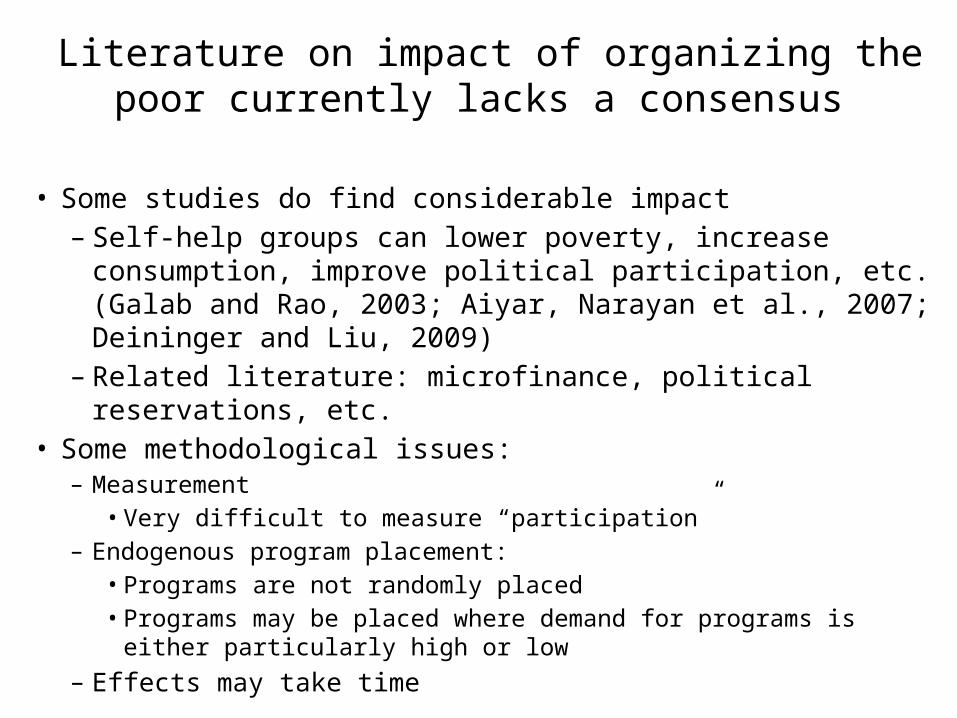
Literature on impact of organizing the poor currently lacks a consensus
• Some studies do find considerable impact– Self-help groups can lower poverty, increase consumption,
improve political participation, etc. (Galab and Rao, 2003; Aiyar, Narayan et al., 2007; Deininger and Liu, 2009)
– Related literature: microfinance, political reservations, etc.• Some methodological issues:
– Measurement• Very difficult to measure “participation”
– Endogenous program placement: • Programs are not randomly placed • Programs may be placed where demand for programs is either
particularly high or low
– Effects may take time
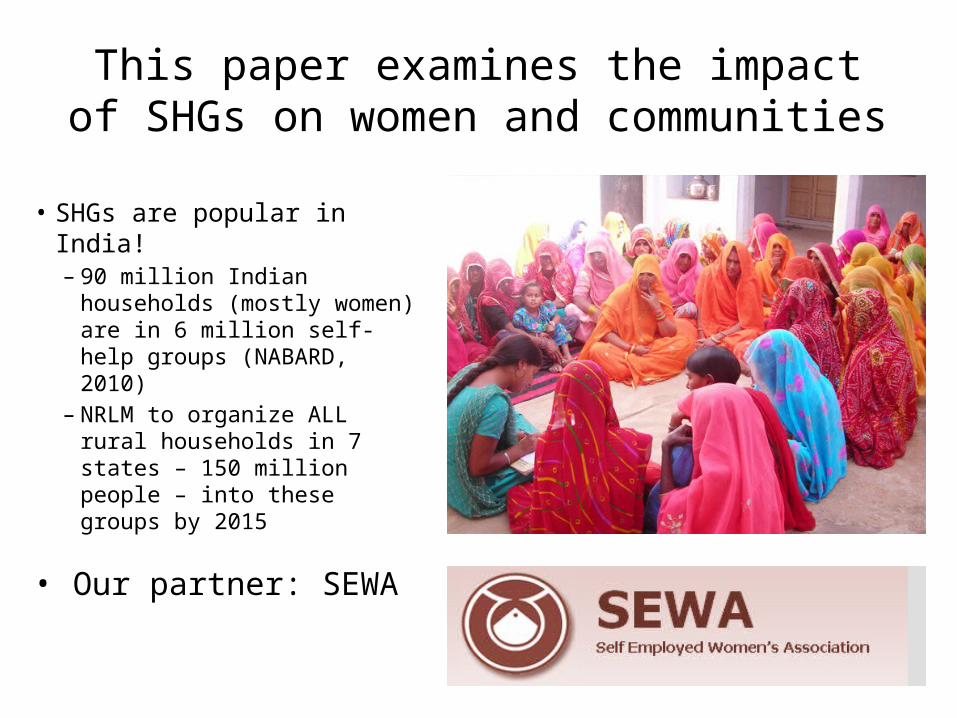
This paper examines the impact of SHGs on women and communities
• SHGs are popular in India! – 90 million Indian households
(mostly women) are in 6 million self-help groups (NABARD, 2010)
– NRLM to organize ALL rural households in 7 states – 150 million people – into these groups by 2015
• Our partner: SEWA
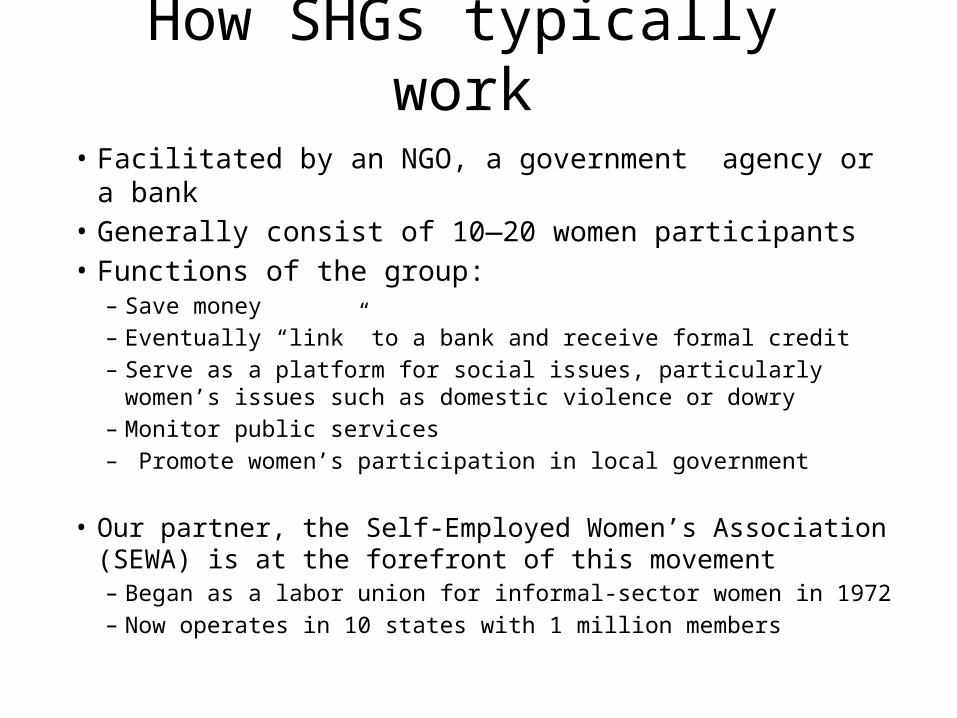
How SHGs typically work
• Facilitated by an NGO, a government agency or a bank • Generally consist of 10—20 women participants
• Functions of the group: – Save money– Eventually “link” to a bank and receive formal credit – Serve as a platform for social issues, particularly women’s issues such as
domestic violence or dowry – Monitor public services – Promote women’s participation in local government
• Our partner, the Self-Employed Women’s Association (SEWA) is at the forefront of this movement– Began as a labor union for informal-sector women in 1972– Now operates in 10 states with 1 million members
Outline
8
• Overview
• The intervention
• Program Impact
• Policy implications

Research Setting: Dungarpur, Rajasthan
• 65% of the population consists of “Scheduled Tribes”
• Per capita income = Rs. 12,474 (approx. $312) State average = Rs. 16,800(approx. $420)
• 21 percent of the population is estimated to live below the rural poverty line
• Our sample: female literacy is at 18%
• In 2004, included in Backward Districts Initiative
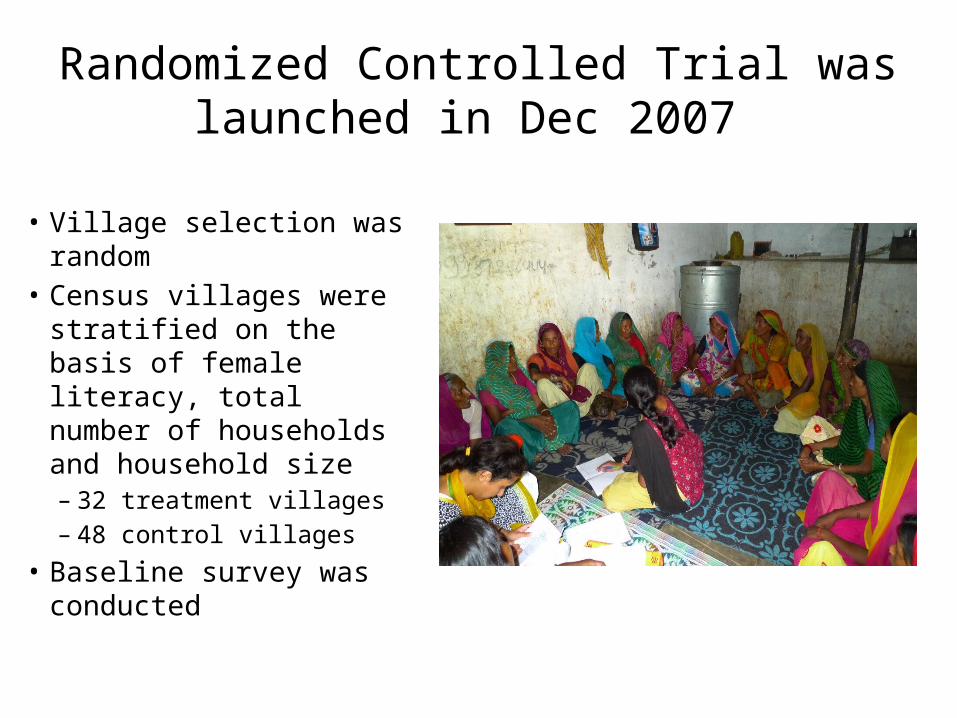
Randomized Controlled Trial was launched in Dec 2007
• Village selection was random
• Census villages were stratified on the basis of female literacy, total number of households and household size – 32 treatment villages – 48 control villages
• Baseline survey was conducted
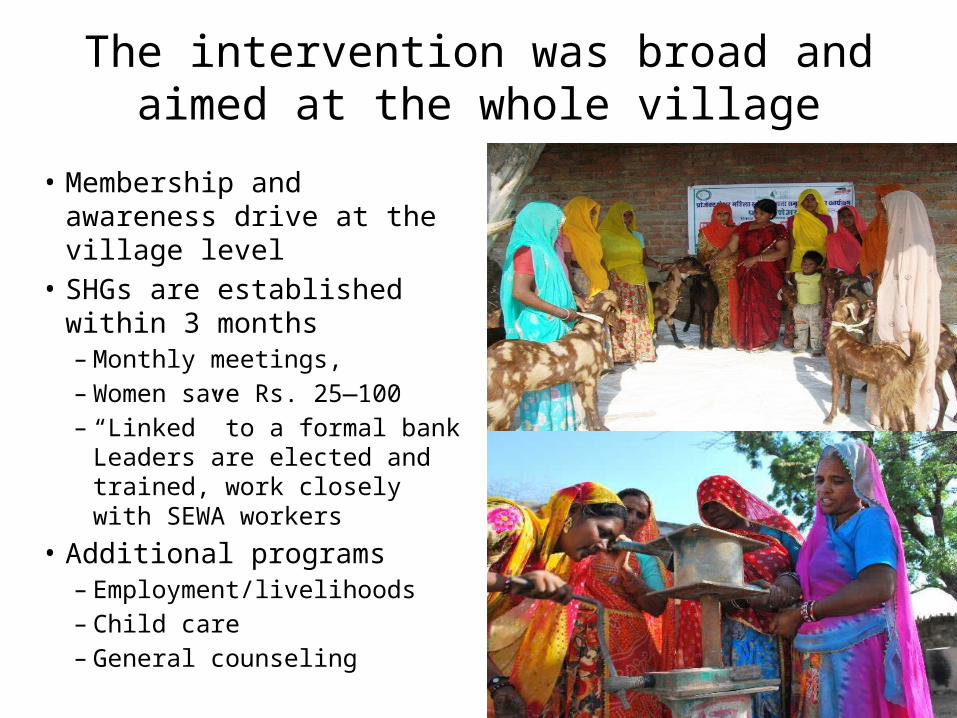
The intervention was broad and aimed at the whole village
• Membership and awareness drive at the village level
• SHGs are established within 3 months – Monthly meetings, – Women save Rs. 25—100– “Linked” to a formal bank
Leaders are elected and trained, work closely with SEWA workers
• Additional programs – Employment/livelihoods– Child care – General counseling
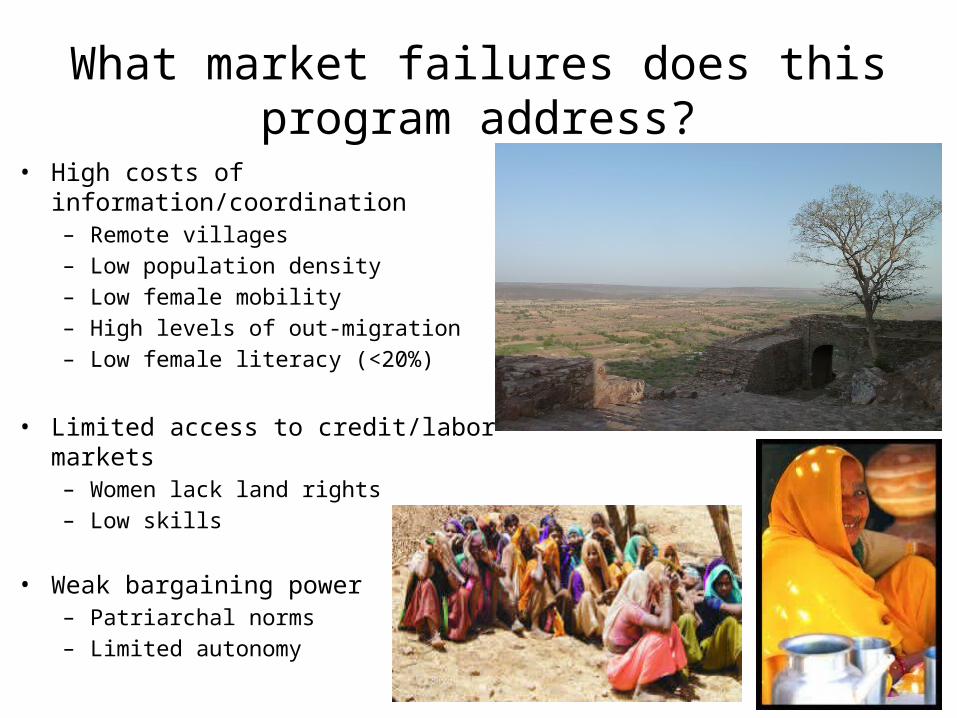
What market failures does this program address?
• High costs of information/coordination– Remote villages – Low population density– Low female mobility– High levels of out-migration– Low female literacy (<20%)
• Limited access to credit/labor markets – Women lack land rights – Low skills
• Weak bargaining power – Patriarchal norms– Limited autonomy
12

What does the NGO actually do?• Lower the costs of information and coordination:
– Limited mobility Highly localized networks– Create opportunities for repeated interaction– Joint decision-making (saving, investment, etc.) – Cooperative behavior emerges Collective action
• Access to labor and credit markets:– Access to savings – Access to credit– New livelihood creation opportunities
• Improve bargaining power:– Community level information campaigns– Arbitration of disputes between the women themselves– Improve women’s participation in community affairs – Important forms of support (filling of forms, links to government
institutions, etc.)
• Overview
• The intervention
• Program impact
• Policy implications
Outline
14
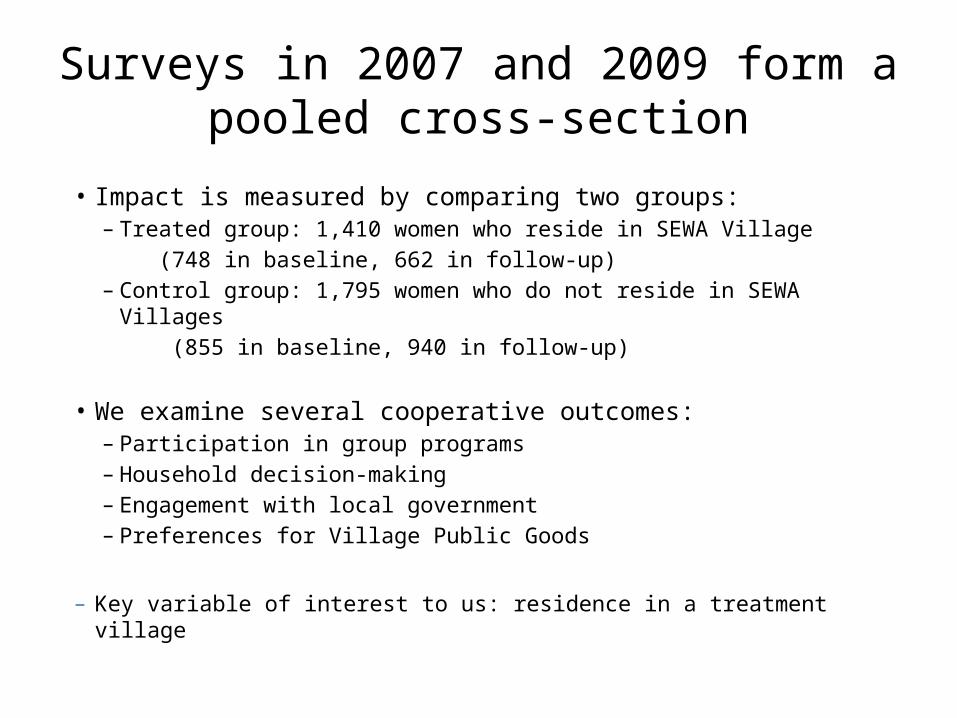
Surveys in 2007 and 2009 form a pooled cross-section
• Impact is measured by comparing two groups:– Treated group: 1,410 women who reside in SEWA Village
(748 in baseline, 662 in follow-up)– Control group: 1,795 women who do not reside in SEWA Villages
(855 in baseline, 940 in follow-up)
• We examine several cooperative outcomes:– Participation in group programs– Household decision-making– Engagement with local government– Preferences for Village Public Goods
– Key variable of interest to us: residence in a treatment village
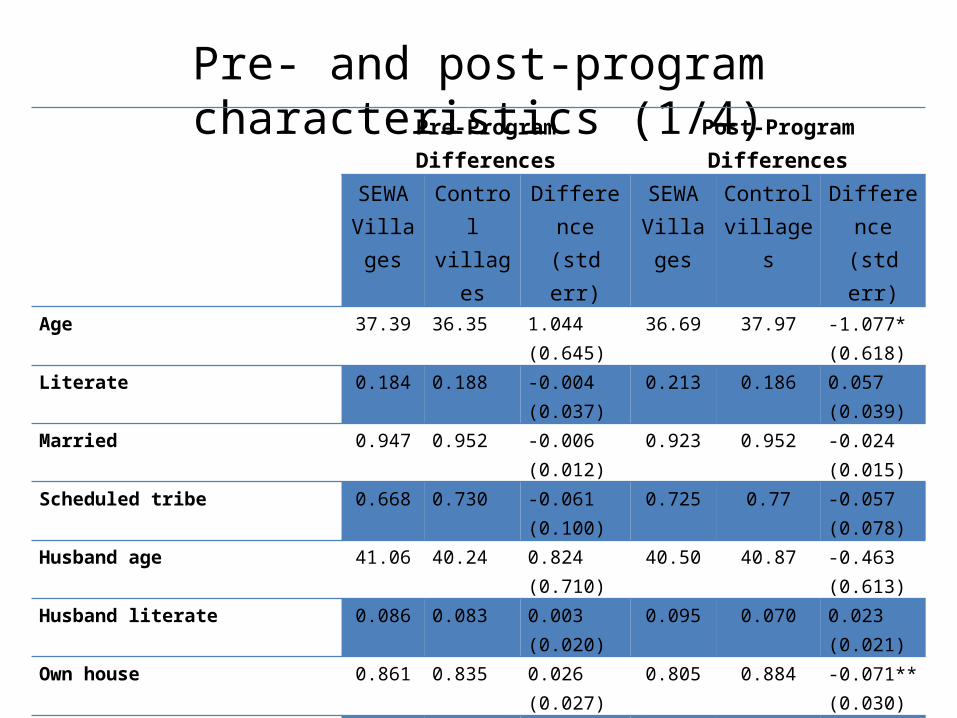
Pre- and post-program characteristics (1/4) Pre-Program Differences Post-Program Differences
SEWA Villages
Control villages
Difference(std err)
SEWA Villages
Control villages
Difference(std err)
Age
37.39 36.35 1.044 (0.645)
36.69 37.97
-1.077* (0.618)
Literate 0.184 0.188 -0.004 (0.037)
0.213 0.186 0.057 (0.039)
Married 0.947 0.952 -0.006 (0.012)
0.923 0.952 -0.024 (0.015)
Scheduled tribe 0.668 0.730 -0.061 (0.100)
0.725 0.77 -0.057 (0.078)
Husband age 41.06 40.24 0.824 (0.710)
40.50 40.87 -0.463 (0.613)
Husband literate 0.086 0.083 0.003 (0.020)
0.095 0.070 0.023 (0.021)
Own house 0.861 0.835 0.026 (0.027)
0.805 0.884 -0.071** (0.030)
Have own farm
0.900 0.891 0.009 (0.040)
0.835 0.874 -0.027 (0.051)
Kutcha house 0.667 0.746 -0.079 (0.071)
0.642 0.676 -0.039 (0.060)
Household has toilet 0.098 0.081 0.017 (0.036)
0.073 0.045 0.025 (0.028)
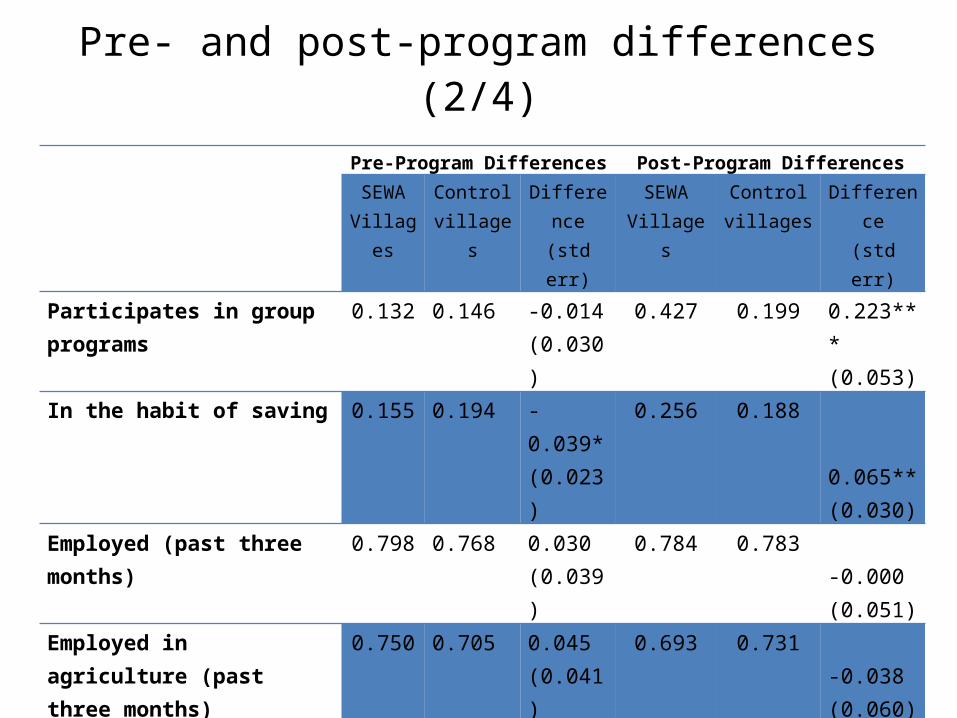
Pre- and post-program differences (2/4) Pre-Program Differences Post-Program Differences
SEWA Villages
Control villages
Difference(std err)
SEWA Villages
Control villages
Difference(std err)
Participates in group programs 0.132 0.146 -0.014 (0.030)
0.427 0.199 0.223*** (0.053)
In the habit of saving 0.155 0.194 -0.039* (0.023)
0.256 0.188 0.065** (0.030)
Employed (past three months) 0.798 0.768 0.030 (0.039)
0.784 0.783 -0.000 (0.051)
Employed in agriculture (past three months)
0.750 0.705 0.045 (0.041)
0.693 0.731 -0.038 (0.060)
Employed outside agriculture (past three months)
0.048 0.063 -0.015 (0.017)
0.091 0.053 0.038 (0.028)
Final say: children's schooling 0.092 0.087 0.006 (0.023)
0.130 0.055 0.067*** (0.019)
Final say: medical decisions 0.098 0.110 -0.012 (0.021)
0.131 0.061 0.063*** (0.021)
Final say: family-planning 0.018 0.055 -0.036** (0.014)
0.044 0.010 0.032** (0.012)
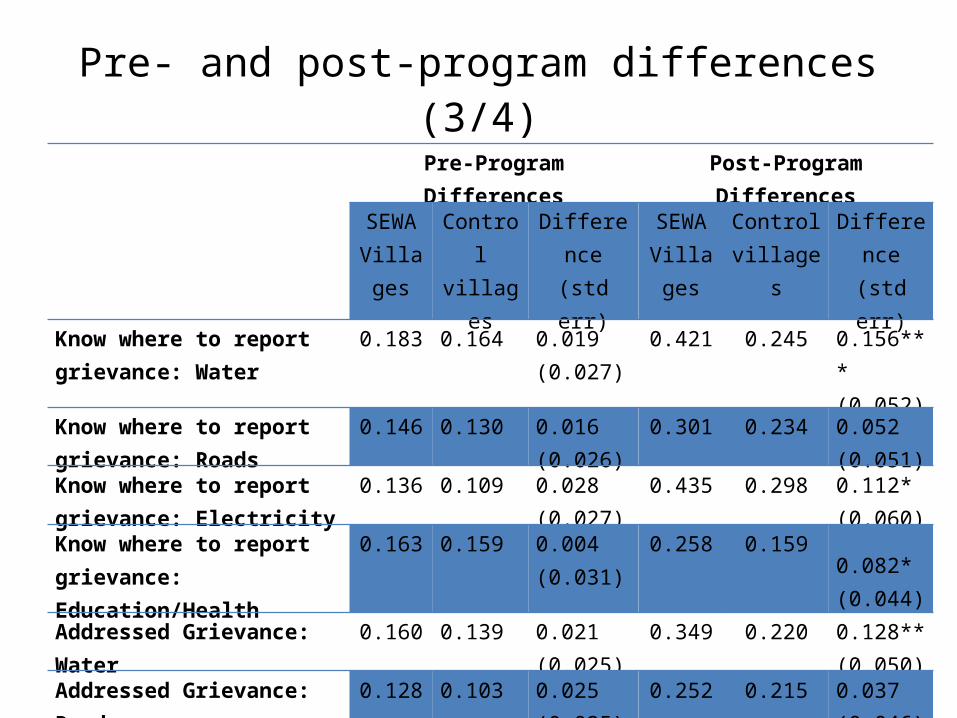
Pre- and post-program differences (3/4)
Pre-Program Differences Post-Program DifferencesSEWA
VillagesControl villages
Difference(std err)
SEWA Villages
Control villages
Difference(std err)
Know where to report grievance: Water
0.183 0.164 0.019 (0.027)
0.421 0.245 0.156*** (0.052)
Know where to report grievance: Roads
0.146 0.130 0.016 (0.026)
0.301 0.234 0.052 (0.051)
Know where to report grievance: Electricity
0.136 0.109 0.028 (0.027)
0.435 0.298 0.112* (0.060)
Know where to report grievance: Education/Health
0.163 0.159 0.004 (0.031)
0.258 0.159 0.082* (0.044)
Addressed Grievance: Water 0.160 0.139 0.021 (0.025)
0.349 0.220 0.128** (0.050)
Addressed Grievance: Roads 0.128 0.103 0.025 (0.025)
0.252 0.215 0.037 (0.046)
Addressed Grievance: Electricity 0.100 0.083 0.017 (0.021)
0.316 0.236 0.080 (0.048)
Addressed Grievance: Education/Health
0.086 0.091 -0.006 (0.024)
0.166 0.107 0.059* (0.033)
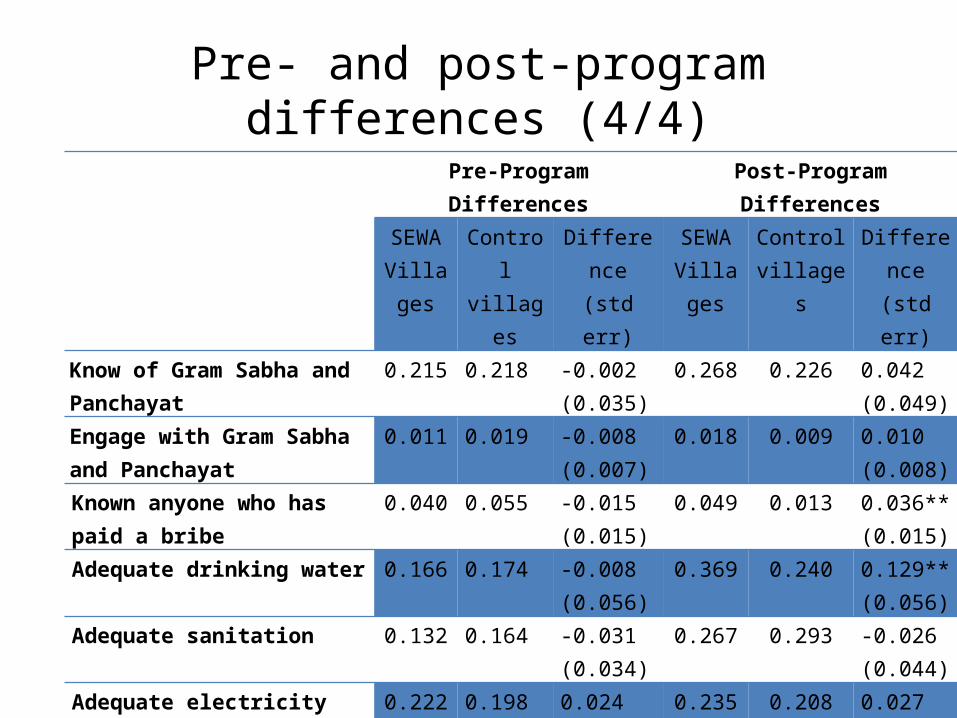
Pre- and post-program differences (4/4) Pre-Program Differences Post-Program Differences
SEWA Villages
Control villages
Difference(std err)
SEWA Villages
Control villages
Difference(std err)
Know of Gram Sabha and Panchayat
0.215 0.218 -0.002 (0.035)
0.268 0.226 0.042 (0.049)
Engage with Gram Sabha and Panchayat
0.011 0.019 -0.008 (0.007)
0.018 0.009 0.010 (0.008)
Known anyone who has paid a bribe
0.040 0.055 -0.015 (0.015)
0.049 0.013 0.036** (0.015)
Adequate drinking water 0.166 0.174 -0.008 (0.056)
0.369 0.240 0.129** (0.056)
Adequate sanitation 0.132 0.164 -0.031 (0.034)
0.267 0.293 -0.026 (0.044)
Adequate electricity 0.222 0.198 0.024 (0.054)
0.235 0.208 0.027 (0.049)
Adequate roads 0.179 0.221 -0.042 (0.055)
0.490 0.445 0.045 (0.057)
Adequate facilities for health, education
0.479 0.519 -0.041 (0.058)
0.781 0.716 0.065 (0.046)
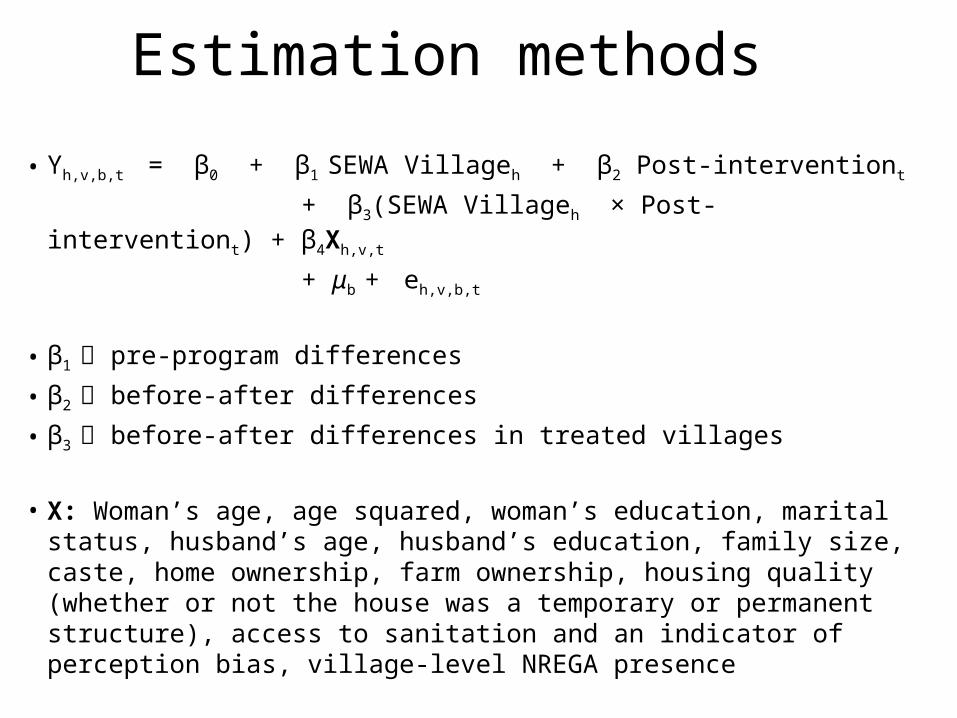
Estimation methods
• Yh,v,b,t = β0 + β1 SEWA Villageh + β2 Post-interventiont
+ β3(SEWA Villageh × Post-interventiont) + β4Xh,v,t
+ μb + eh,v,b,t
• β1 pre-program differences
• β2 before-after differences
• β3 before-after differences in treated villages
• X: Woman’s age, age squared, woman’s education, marital status, husband’s age, husband’s education, family size, caste, home ownership, farm ownership, housing quality (whether or not the house was a temporary or permanent structure), access to sanitation and an indicator of perception bias, village-level NREGA presence
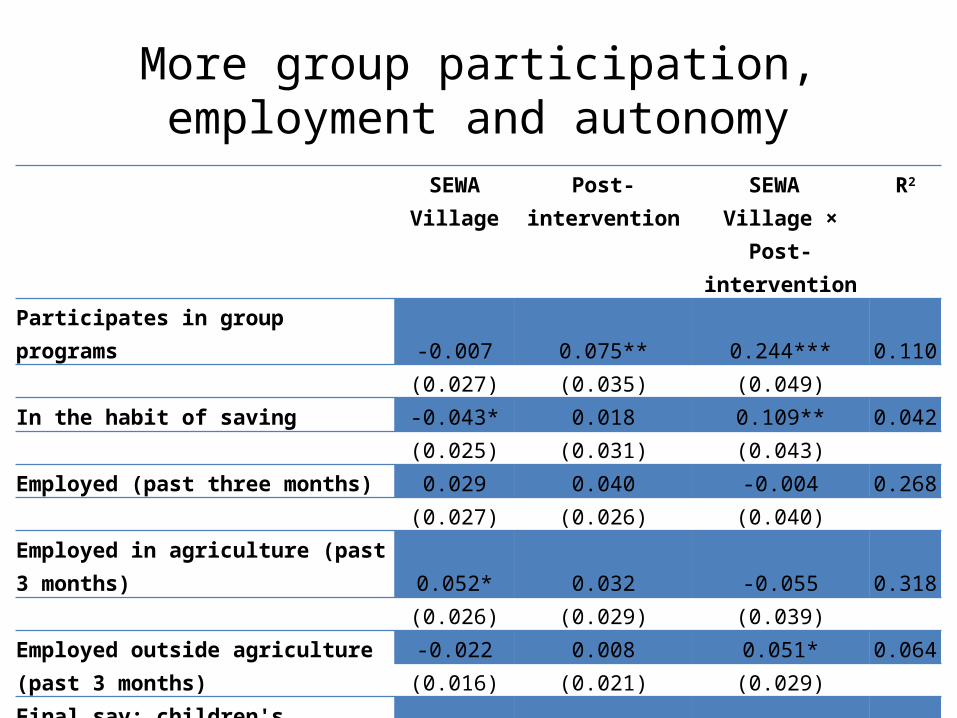
More group participation, employment and autonomy
SEWA Village
Post-intervention SEWA Village × Post-intervention
R2
Participates in group programs -0.007 0.075** 0.244*** 0.110(0.027) (0.035) (0.049)
In the habit of saving -0.043* 0.018 0.109** 0.042(0.025) (0.031) (0.043)
Employed (past three months) 0.029 0.040 -0.004 0.268 (0.027) (0.026) (0.040) Employed in agriculture (past 3 months) 0.052* 0.032 -0.055 0.318 (0.026) (0.029) (0.039) Employed outside agriculture (past 3 months)
-0.022 0.008 0.051* 0.064(0.016) (0.021) (0.029)
Final say: children's schooling 0.004 -0.019 0.047* 0.164(0.018) (0.015) (0.024)
Final say: medical decisions -0.018 -0.028 0.065** 0.138(0.017) (0.018) (0.027)
Final say: family-planning -0.034** -0.050*** 0.062*** 0.032(0.012) (0.015) (0.016)
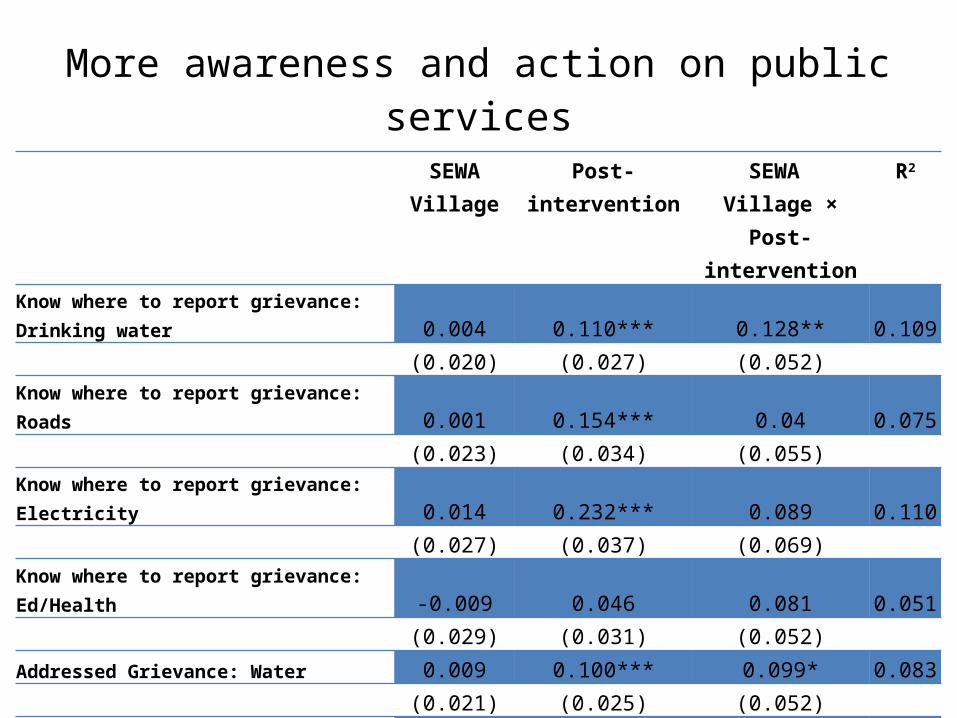
More awareness and action on public services
SEWA Village
Post-intervention SEWA Village × Post-intervention
R2
Know where to report grievance: Drinking water 0.004 0.110*** 0.128** 0.109(0.020) (0.027) (0.052)
Know where to report grievance: Roads 0.001 0.154*** 0.04 0.075(0.023) (0.034) (0.055)
Know where to report grievance: Electricity 0.014 0.232*** 0.089 0.110(0.027) (0.037) (0.069)
Know where to report grievance: Ed/Health -0.009 0.046 0.081 0.051(0.029) (0.031) (0.052)
Addressed Grievance: Water 0.009 0.100*** 0.099* 0.083(0.021) (0.025) (0.052)
Addressed Grievance: Roads 0.014 0.153*** 0.016 0.058(0.021) (0.031) (0.051)
Addressed Grievance: Electricity 0.013 0.183*** 0.068 0.077(0.023) (0.031) (0.058)
Addressed Grievance: Ed/Health -0.011 0.045 0.067 0.033 (0.025) (0.028) (0.042)
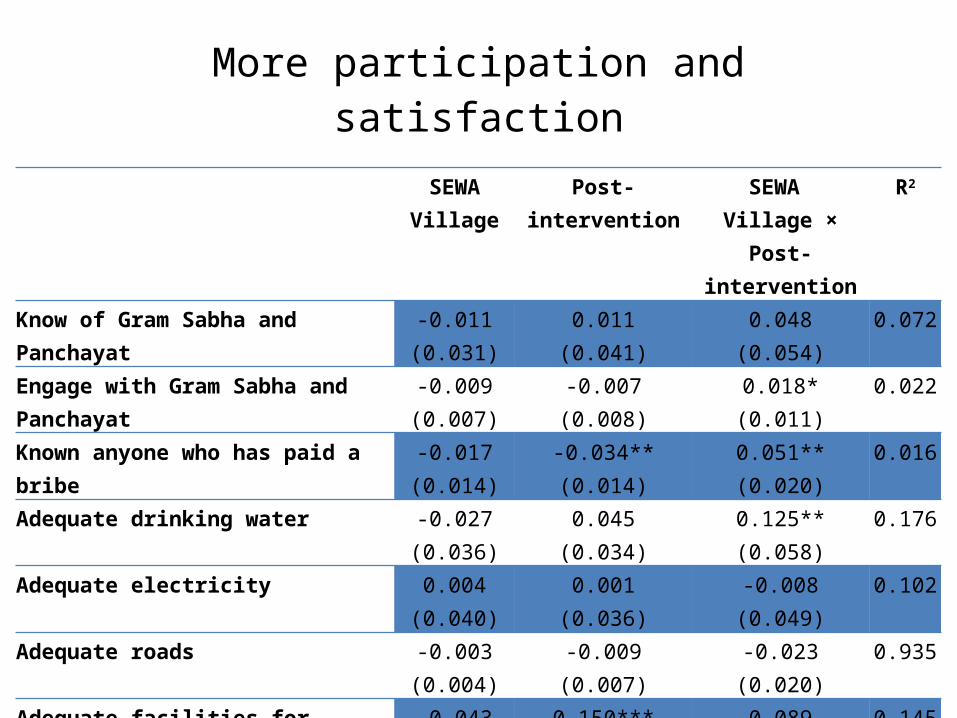
More participation and satisfactionSEWA Village
Post-intervention SEWA Village × Post-intervention
R2
Know of Gram Sabha and Panchayat -0.011(0.031)
0.011(0.041)
0.048(0.054)
0.072
Engage with Gram Sabha and Panchayat -0.009(0.007)
-0.007(0.008)
0.018*(0.011)
0.022
Known anyone who has paid a bribe -0.017(0.014)
-0.034**(0.014)
0.051**(0.020)
0.016
Adequate drinking water -0.027(0.036)
0.045(0.034)
0.125**(0.058)
0.176
Adequate electricity 0.004(0.040)
0.001(0.036)
-0.008(0.049)
0.102
Adequate roads -0.003(0.004)
-0.009(0.007)
-0.023(0.020)
0.935
Adequate facilities for health and education
-0.043(0.046)
0.150***(0.048)
0.089(0.067)
0.145
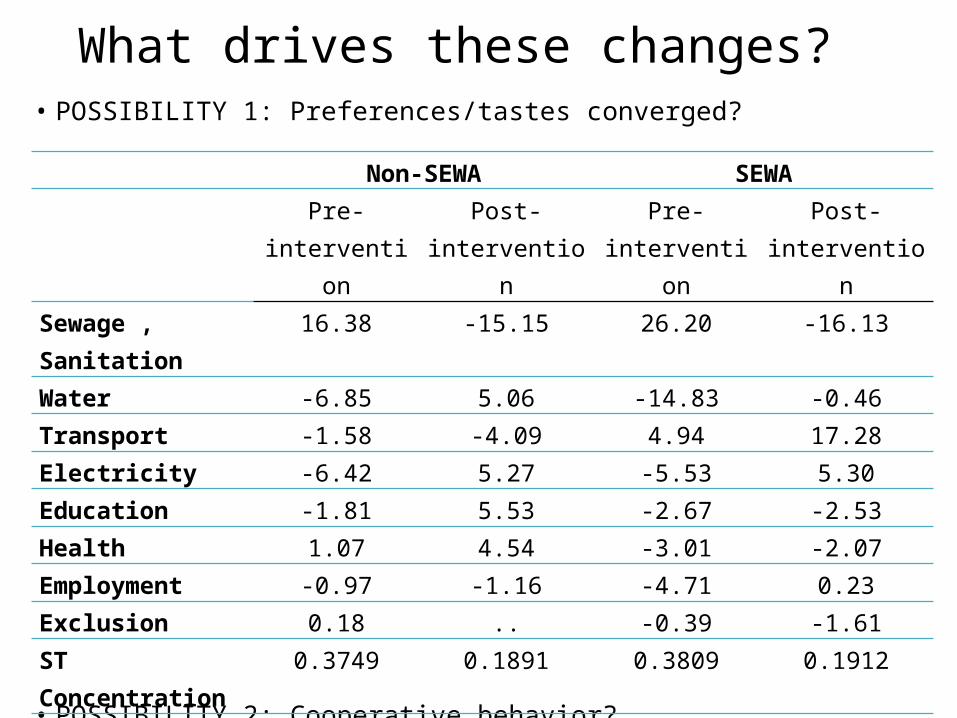
What drives these changes?• POSSIBILITY 1: Preferences/tastes converged?
• POSSIBILITY 2: Cooperative behavior?
Non-SEWA SEWAPre-
interventionPost-
interventionPre-
interventionPost-
interventionSewage , Sanitation 16.38 -15.15 26.20 -16.13Water -6.85 5.06 -14.83 -0.46Transport -1.58 -4.09 4.94 17.28Electricity -6.42 5.27 -5.53 5.30Education -1.81 5.53 -2.67 -2.53Health 1.07 4.54 -3.01 -2.07Employment -0.97 -1.16 -4.71 0.23Exclusion 0.18 .. -0.39 -1.61ST Concentration 0.3749 0.1891 0.3809 0.1912Non-ST Concentration
0.0865 0.1500 0.1085 0.1004
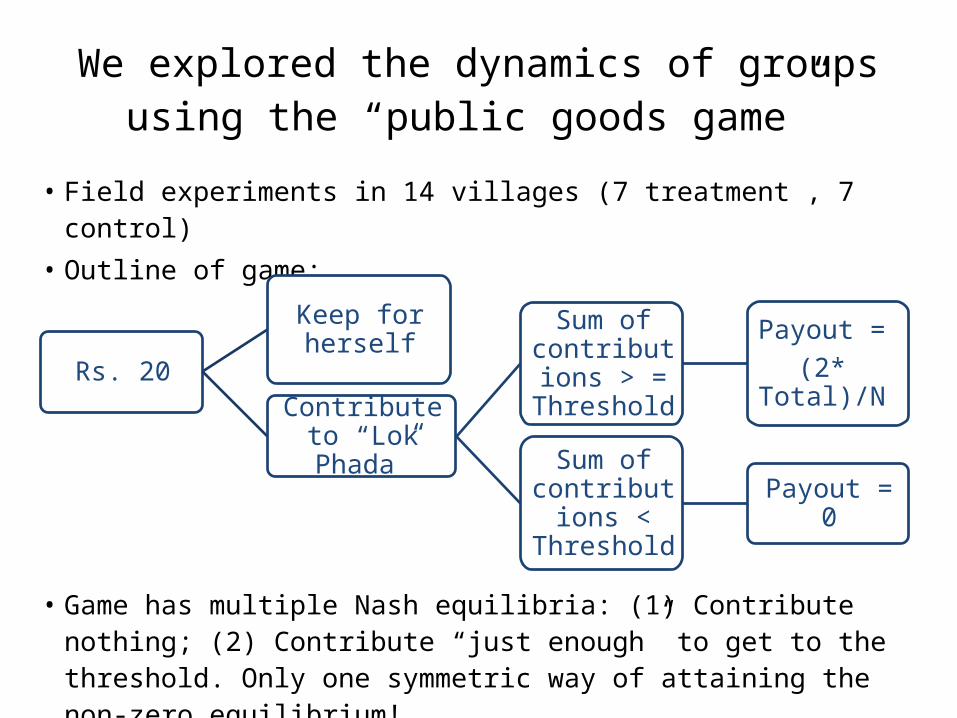
We explored the dynamics of groups using the “public goods game”
• Field experiments in 14 villages (7 treatment , 7 control) • Outline of game:
• Game has multiple Nash equilibria: (1) Contribute nothing; (2) Contribute “just enough” to get to the threshold. Only one symmetric way of attaining the non-zero equilibrium!
Rs. 20
Keep for herself
Contribute to “Lok Phada”
Sum of contributions > = Threshold
Payout = (2* Total)/N
Sum of contributions < Threshold
Payout = 0

Outcome Control Treatment
Number of rounds played 7 5.25
Number of players in each round 11 12
Fraction of rounds in which cooperation was achieved 50% 62%
Average contribution to the public good per round Rs. 13.50 Rs. 15.44
Average payout per round Rs. 12.93 Rs. 17.47
Average earnings (total game) Rs. 142.50 Rs. 127.50
Average of payouts per round – Payouts from Nash strategy of contributing 0 in each round
Rs. -3.8 Rs. 25.5
Average age 32.950 32.604
Average education 1.440 1.416
Average literate 0.233 0.313
Live with husband 0.883 0.937
Basic summary stats on the games:
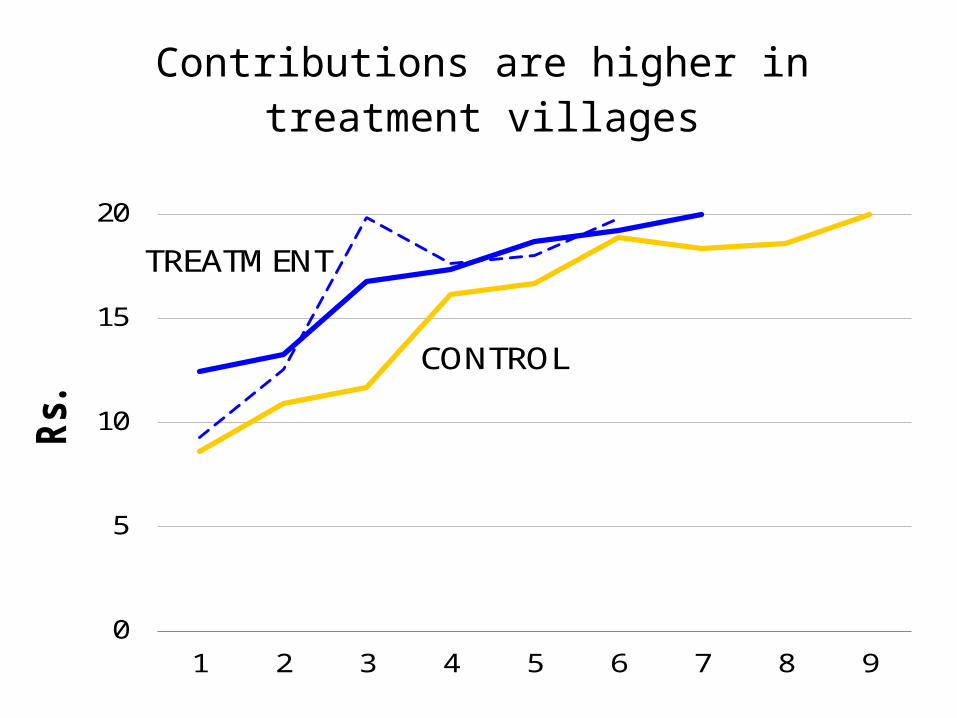
Contributions are higher in treatment villages
0
5
10
15
20
1 2 3 4 5 6 7 8 9
Rs.
TREATMENT
CONTROL
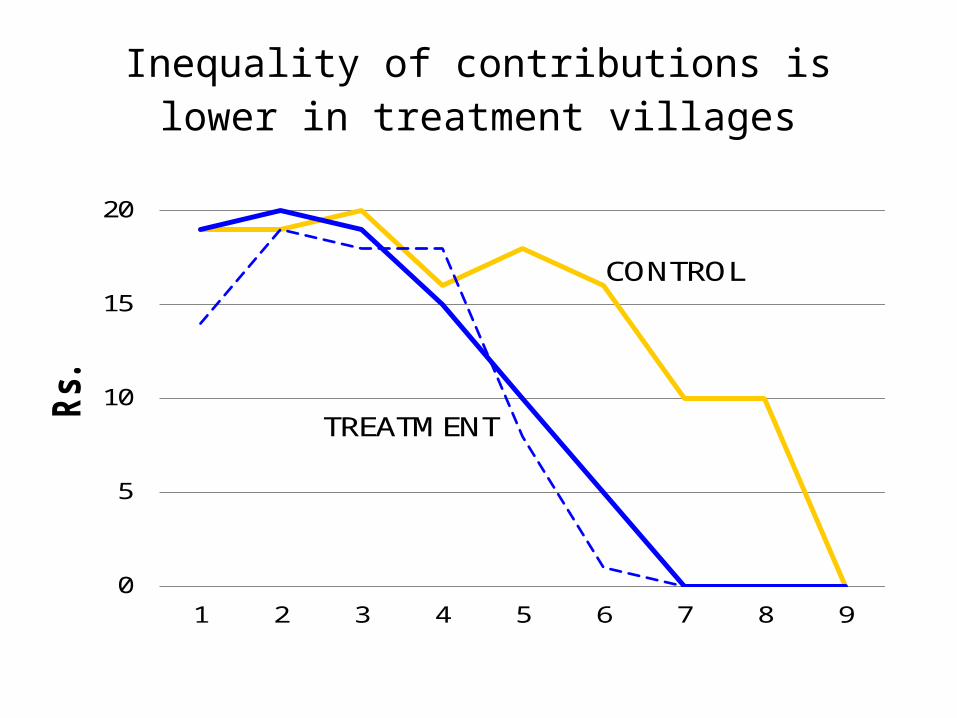
Inequality of contributions is lower in treatment villages
0
5
10
15
20
1 2 3 4 5 6 7 8 9
Rs.
TREATMENT
CONTROL
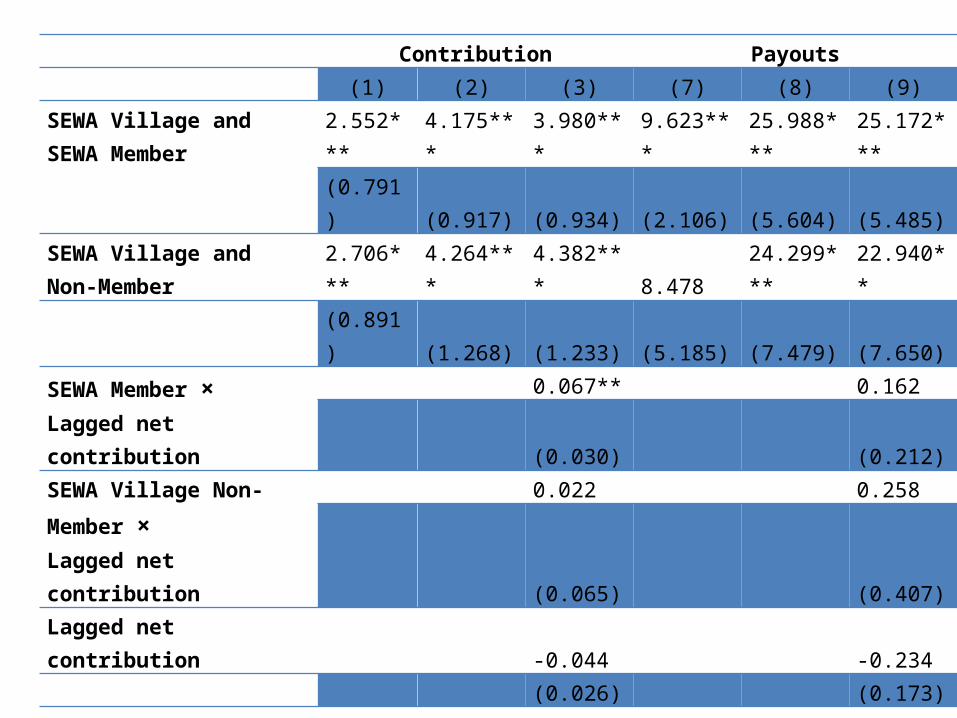
Contribution Payouts (1) (2) (3) (7) (8) (9)SEWA Village and SEWA Member
2.552*** 4.175*** 3.980*** 9.623*** 25.988*** 25.172***(0.791) (0.917) (0.934) (2.106) (5.604) (5.485)
SEWA Village and Non-Member 2.706*** 4.264*** 4.382*** 8.478 24.299*** 22.940** (0.891) (1.268) (1.233) (5.185) (7.479) (7.650)SEWA Member ×Lagged net contribution
0.067** 0.162 (0.030) (0.212)
SEWA Village Non-Member ×Lagged net contribution
0.022 0.258 (0.065) (0.407)
Lagged net contribution -0.044 -0.234 (0.026) (0.173)Threshold 0.015** 0.015*** -0.131*** -0.125*** (0.005) (0.005) (0.032) (0.029)Round 1.484*** 1.427*** 4.095*** 3.516*** (0.139) (0.138) (0.740) (0.766)Age -0.005 -0.004 0.098* 0.099* (0.025) (0.024) (0.046) (0.052)Literate 0.041 0.093 -0.194 0.023 (0.443) (0.417) (0.458) (0.370)R-squared 0.040 0.355 0.362 0.321 0.417 0.431N 860 860 860 860 860 860
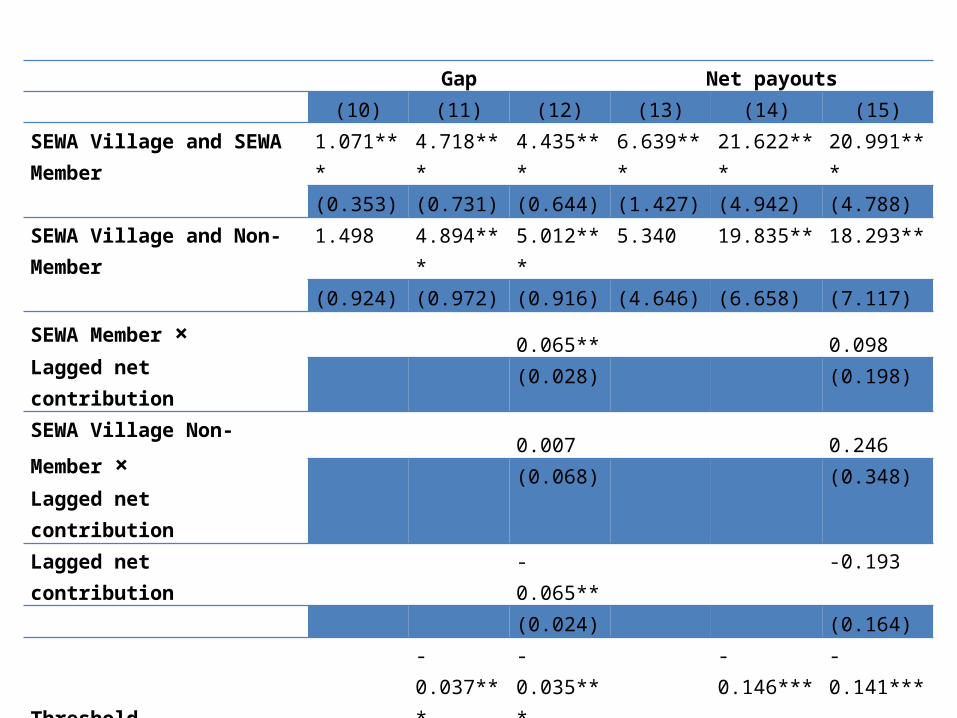
Gap Net payouts(10) (11) (12) (13) (14) (15)
SEWA Village and SEWA Member
1.071*** 4.718*** 4.435*** 6.639*** 21.622*** 20.991***(0.353) (0.731) (0.644) (1.427) (4.942) (4.788)
SEWA Village and Non-Member 1.498 4.894*** 5.012*** 5.340 19.835** 18.293**(0.924) (0.972) (0.916) (4.646) (6.658) (7.117)
SEWA Member ×Lagged net contribution 0.065** 0.098
(0.028) (0.198)SEWA Village Non-Member ×Lagged net contribution 0.007 0.246
(0.068) (0.348)Lagged net contribution -0.065** -0.193
(0.024) (0.164)Threshold -0.037*** -0.035*** -0.146*** -0.141***
(0.006) (0.005) (0.029) (0.026)Round 0.681*** 0.531** 2.754*** 2.226**
(0.194) (0.183) (0.704) (0.753)Age -0.002 0.000 0.101 0.101
(0.022) (0.020) (0.059) (0.066)Literate -0.233 -0.167 -0.135 0.032
(0.564) (0.530) (0.215) (0.279)R-squared 0.028 0.116 0.131 0.294 0.410 0.421N 860 860 860 860 860 860
Conclusions• Outsiders can indeed play a role in organizing poor rural women
– Lower the cost of information– Remove hurdles in coordination– Overcome barriers in credit and labor markets
• This has a broad impact on communities – Women’s autonomy– Financial transactions – Collective action/Participation in public life – Improvement in the delivery of public services – Satisfaction
• How it works: – SHG participation repeated interactions between women – NGO oversight incentives for cooperation, reduction of “free-
riding”, higher levels of trust and willingness to work together