the role of self-help groups in community … role of self-help groups in community development...
TRANSCRIPT
The Role of Self-Help Groups in Community
Development
Evidence from a Field Experiment in Rural India
Raj Desai and Shareen Joshi
Georgetown University
May 2010
Abstract
This paper explores the impact of participation in self-help groups (SHGs) on the well-being of women and their
communities. A randomized-control-trial framework is used to evaluate the impact of SHGs in 32 villages of
Dungarpur district of Rajasthan. These results suggest that in the first two years of their operation, SHGs had direct
and positive impacts on women’s savings, employment, participation in household decisions and participation in
local government. They also have ―spillover‖ effects on women who do not participate in the SHG but reside in the
same village that the SHGs operate. The post-program impacts are not attributable to pre-program differences in the
villages or the types of women who participated. The results confirm that SHGs can be a powerful instrument of
development policy. Moreover, placing women at the center of development policy can have far-reaching impact.

1
1. Introduction
In recent years, self-help groups (SHGs) and other types of community-based
organizations have been increasingly regarded as important instruments of development policy
(World Bank, 2002; Bardhan, 2002; Chen, Jhabwala, Kanbur and Richards, 2006).1 SHGs can be
broadly characterized as membership-based organizations whose members provide each other
with mutual support and attempt to achieve collective objectives using, in part, their own
contributions. One of the main distinguishing characteristics of these groups is the strong
emphasis on building social cohesion. This enables members to overcome social, economic, and
political differences and develop the collective strength to promote their collective interests
(Chen, Jhabwala, Kanbur and Richards, 2006).
Scholars and practitioners in the field of development have been attracted to SHGs for
two main reasons. First, the expansion of freedoms and creation of opportunities in marginalized
populations has intrinsic value and is one of the primary ―ends‖ of development (Sen, 2000).
Second, these groups are increasingly regarded as an important ―means‖ through which many
other development goals can be attained. Evidence from case-studies across the world suggests
that they achieve this by linking marginalized individuals to the state and to markets, lowering
risk, dissipate information barriers and/or increasing accountability (World Bank, 2002).2 Such
evidence however, is rarely based on scientific evaluations. Evidence based on randomized and
scientific evaluations of SHGs or even other community-based institutions are quite rare. Efforts
to measure impact are typically constrained by the non-random placement of programs, the non-
random assignment of individuals to groups and wide variations in the methods employed by
these organizations (Rao and Mansuri, 2004).
The SHG movement has been particularly strong in India. Official figures from India’s
National Bank for Agricultural and Rural Development (NABARD) – likely an underestimate of
the true number of self-help groups in India – suggest that at least 90 million Indian households
are currently organized into 6 million self-help groups (NABARD, 2010). Indian SHGs are
typically established by facilitating agencies that include NGOs, the Indian government, formal
sector banks (including private banks) and federations of SHGs themselves (Basu and
1The World Bank defines Community-based Development (CBD) and Community-driven Development (CDD) as a
process of development in which communities and community-groups have direct control over key project
decisions, including management and investment of funds (Chapter 9, World Bank, 2002). 2 This is a summary of Chapter 9 entitled ―of the World Bank’s Poverty Reduction Strategy Paper Sourcebook.

2
Srivastava, 2005; Bhatia, 2007; NABARD, 2010). These groups have not only helped groups
with organization, but also with the supported SHGs by the introduction of innovative financial
instruments, investment opportunities and the provision of education and training (Basu and
Srivastava, 2006; Chen et al, 2006; Nair, 2005). 3
The precise impact of such initiatives however, remains poorly understood. In one of the
few examples of rigorous evaluations, Deininger and Liu (2009) study the impact of a large-scale
intervention in the Southern state of Andhra Pradesh. Unbanked villagers were organized into
SHGs. Second-tier institutions were also created at the village-level to aid groups with credit,
insurance and interactions with the private-sector and were given ―seed‖ capital to aid them in
these efforts. While the program was not randomly placed, the authors use methods such as
propensity score matching to compare participants and non-participants and find that 2.5 years of
exposure to the program was associated with improvements in consumption, nutritional intake,
and asset accumulation. While this paper makes an important contribution in understanding the
impact of such groups, it is not clear that the results can be generalized to the rest of India, where
the SHG-movement has a much shorter history and levels of participation are significantly
lower.4 Moreover, the paper evaluates only one type of SHG out of many possible models. More
studies are required, of other types of groups and in other states of India (Bhatia, 2007).
This paper extends the literature on the effectiveness of SHGs by evaluating an SHG
program in the Dungarpur district of the North-Western state of Rajasthan. The state has levels
of SHG prevalence that are one-quarter of those seen in Andhra Pradesh or for that matter most
of Southern India.5 The evaluation is conducted in partnership with the Self-Employed Women’s
Association (SEWA) of India, a woman-focused NGO that aims provides over 1 million poor
women with improved opportunities for saving, investment, employment, education and life-
3 A famous example of this is the case of this is the SHG-bank Linkage Program, which attempts to provide formal-
sector credit and financing services to informal groups, particularly in rural areas. Launched in 1992 by the National
Bank for Agriculture and Rural Development, this program supported micro-finance institutions through training
and capacity building, grant assistance, equity/capital support and the provision of 100% refinance for loans that
supported microfinance activities (NABARD, 2010). The 1992 pilot envisaged linking of just 500 SHGs to banks.
By the end of March 1994, 620 SHGs had been linked to banks. The success of the pilot led to its transformation
into the SHG bank linkage program and in less than one decade this became one of the biggest micro-finance
projects in the world. Over 10% of credit to rural areas of India is now channeled through this program. 4 Andhra Pradesh accounts for 26.2 per cent of the total SHGs and 38.1 per cent of the total loans disbursed in India
as a whole (Bhatia, 2007). 5 While Rajasthan has the highest prevalence of SHGs in the Northern states of India, it accounts for only 4.4 per
cent of the SHGs and just 2.1 per cent of the total loans disbursed (Bhatia, 2007).
3
skills training. SEWA used its deep understanding of contextual conditions in this region to
design suitable SHGs. It organized 450 randomly selected women into a total of 32 village-based
SHGs since 2007. We examine the impact of this effort using a comprehensive randomized-
controlled trial (RCT) which identifies clear treatment and control groups and compares them
before the intervention and then two years later.
Our results confirm that participation in the carefully designed and implemented SHG
program had private as well as social returns. Participating women saved more, were more likely
to have bank accounts and were more likely to participate in the management of their savings.
They were also more knowledgeable about credit opportunities and more likely to take loans.
They are also more likely to have a greater say in household decisions regarding children’s
education and health. Participating women were more likely to take advantage of key
government programs and know which authorities to report grievances about government
services such as water/sanitation, roads, electricity supply and educational and health services.
There is also evidence that some of these benefits spilled over into the greater village
community. Women who resided in the same village as the SHG, including those who did not
participate in the SHGs, experienced an increase in decision-making authority within the
household.
These results have some major policy implications. First, the results confirm that when
SHG programs are implemented well, with careful consideration of contextual factors, they can
promote collective action in marginalized communities be valuable instruments of development
policy. Second, the results confirm that placing women at the center of development policy can
have far-reaching impact. This result is now well-established for investments in education and
health (Schultz, 1995; 2001a, 2001b; Buvinic and King, 2007). We show that other types of
investments – such as the opportunity to form networks and take collective action – can also
have positive effects on women as well as their broader communities.
2. Background and Data
Dungarpur is located close to the Southern border of the state of Rajasthan in North India.
The total population of Dungarpur is approximately 1.1 million and its population density is one
of the highest of Rajasthan’s rural areas, at 284 people per square-kilometer (Census of India,

4
2001). The population is largely composed of scheduled caste and scheduled tribes.6 The rural
population has traditionally relied on three major sources of subsistence: gathering from the local
forests, animal husbandry and seasonal agriculture. Growing levels of deforestation in recent
years however, have prompted many to turn to settled agriculture. The proportion of the
population engaged in agriculture (cultivators and agricultural laborers) stands at about 76 per
cent (Census of India, 2001). Levels of poverty however, remain high and per-capita income
remains low. In 2004-05 the per capita income of Dungarpur stood at Rs. 12,474 (approximately
$312) compared to state average of Rs. 16,800 (approximately, $420) (Government of India,
2009). 21 percent of the population is estimated to live below the rural poverty line (Government
of India, 2009).
Dungarpur’s gender profile has some interesting contrasts. It is one of the only districts of
Rajasthan, perhaps even North-West India, where the female-male sex-ratio is relatively close to
the biologically ―normal‖, at 1,019 women for every 1,000 men. Yet the total fertility rate (TFR)
and infant mortality rate (IMR) however, are higher than the Indian and the Rajasthan average, at
4 and 112 respectively (Census of India, 2001). The female labor-force participation rate of
Dungarpur is almost double the Indian average, at 44.7 per cent (Census of India, 2001).7 Yet
more than half of all female-workers report that they are ―marginal workers‖, one of the poorest
paid in rural India.
Overall human development in Dungarpur remains one of the weakest in the state of
Rajasthan, which is already one of the lowest in India (Government of India, 2009). With the
overall literacy of 48 per cent in 2001 (up from 19 per cent in 1981 and 31 per cent in 1991)
Dungarpur still continued to be at the bottom in the ranking of districts with respect to its
educational indicators. Only half as many women are literate than men: male and female literacy
rates, stand at 66 and 31 per cent, respectively (Census of India, 2001). The district is also third
from the bottom on indicators of health and income (Government of India, 2009).
In 2004, the Indian Planning Commission included Dungarpur in its ―Backward Districts
Initiative‖ which aimed to address the problems of low agricultural productivity, unemployment,
and to fill critical gaps in physical and social infrastructure through the efforts of both the central
6 65 percent of Dungarpur’s population belongs to the ST group, with the highest concentration in the South of the
district. The dominant tribe here is that of the Bhils. This tribe’s occupancy in the Aravalli range (one of the oldest
mountain ranges in the world) is said to date back to 4000 BC (Government of India, 2009). 7 A higher female labor-force participation rate than average is typical of India’s tribal regions.

5
and state-level government interventions.89
Part of the district’s development strategy was to
invite into its borders an NGO with an excellent history of working in neighboring state of
Gujarat, the Self-Employed Women’s Association (SEWA). The organization has a membership
of over 1 million women in 7 states of India. The members are largely poor and self-employed
female workers who seek economic, social, and professional self-reliance. Members are provided
technical training, are connected with marketing organizations and larger businesses, and are
enabled to purchase agricultural inputs collectively at lower prices. SEWA largely accomplishes
these goals with the formation of SHGs that help women improve access to credit, increase
savings, and provide for community-based social services such as health and childcare for their
members. SEWA also intends to support participants in SHGs as well as the broader village
community in becoming active in village affairs, standing for local elections, and taking action to
address social or community issues (abuse of women, the dowry system, educational quality, and
maternal health). These self-help groups can also serve as intermediaries for the poor, enabling
them to enter more effective cooperative agreements with larger corporations (domestic and
multinational) as potential business partners.
SEWA began a rollout of its rural integrated development pilot project in Dungarpur
district in late 2007. All villages on the census listing for the Dungarpur district were stratified
according to average female literacy rate, total number of households, and average household
size. From these strata, 32 villages were randomly selected for the SEWA pilot, 48 villages
selected as ―control‖ villages (80 villages in total) for the evaluation. A group of 500 women in
the SEWA villages were randomly invited to participate in SEWA’s SHG program. 442 of these
women accepted the offer and went on to participate in the SHG program. The ―treatment‖ given
to SEWA members in the two subsequent years included the following:
Formation of SHGs that consisted of groups of 10—20 women with an elected leader.
Each member is required to save money on a regular basis and the collected saving
money is given as loan to members on a rotating basis (usually once a month). The entire
transaction is transparent and properly audited.
8 The identification of backward districts within a State has been made on the basis of an index of backwardness
comprising three parameters with equal weights to each: (i) value of output per agricultural worker; (ii) agriculture
wage rate; and (iii) percentage of SC/ST population of the districts. 9 A sum of Rs. 15.00 crore per year (approximately $3 million) will be provided to each of the districts for a period
of three years i.e. a total of Rs. 45.00 crore (approximately $9 million) per district.

6
The Membership Education program: This is the most basic and introductory program of
SEWA that is intended to create a sense of unity and direction, and an understanding of
collective action among SEWA members.
Training and Capacity Building: This program aims to build capacity of the SHG leaders
(through reflection meetings, exposure trips, lateral learning), and build capacity by
developing skills such as management of the group, maintaining accounts, writing reports
etc.
A baseline survey was carried out by the Wolfensohn Center for Development at the Brookings
Institution in November and December of 2007 shortly before women were organized into the
SHGs. Two years later, in late 2009, the same research team conducted a follow-up study.
Following RCT methodology, the survey was designed compare the participants in SEWA’s
programs with a control group consisting of women who are not participating in SEWA’s
programs, both in the targeted villages as well as in villages that are not part of the SEWA pilot.
The new sample thus contained three separate groups of women:
Treatment Sample: All 442 women who were scheduled to participate in SEWA’s programs
in the 32 SEWA-pilot villages in the Dungarpur district;
Control Sample A: An additional sample of between 358 women in these same villages who
are not participants in SEWA’s program;
Control Sample B: An additional sample of approximately 802 female-households in 48
other villages that are not part of the SEWA-Dungarpur pilot. These villages are drawn from
the same census frame from which pilot villages are selected, and these villages may have
other SHGs (besides SEWA) operating.
The baseline survey together with the endline survey thus formed a pooled cross-section
that could be used to evaluate the program. The survey collected data on income, savings, labor
force participation, agricultural operations and credit arrangements. The survey also focused on
political-economic issues such as whether SHG membership changes the relationship of SEWA
members with local government officials and whether membership in SEWA increases political
awareness and participation by SEWA members in the village. In the rest of this paper, we use
the terms ―treatment group‖, ―SEWA members‖, ―participation in SHGs‖ and ―participation in
SEWA SHGs‖ interchangeably to refer to the treated sample.

7
4. Analysis and Results
We seek to explore the impact of the treatment program on the treated individuals and
villages in which treated individuals resided. We are interested in five areas of impact:
1. Saving and Financial Decision Making: One of the primary benefits of participation in a
SHG is the opportunity to save regularly, access formal savings institutions and participate in
the management of these savings. We would thus expect treated individuals to be more likely
to report that they save regularly, be more likely to have their own bank accounts and make
deposits into these accounts. We define dummy variables accordingly – saving regularly and
owning a bank account and making deposits into these accounts.
2. Access to credit: A corollary of participation in SHGs is an improvement in a woman’s
access to credit. Since the project is perhaps too early in its implementation to directly
improve women’s access to credit, we examine whether participation in an SHG leads to
greater awareness of credit opportunities by defining a simple dummy variable that takes
value 1 if a woman knows of any programs in the local area that give loans to women so they
can start or expand a business of their own, and 0 otherwise. We also examine actual credit
obtained by examining a dummy variable that takes value 1 if a woman has taken a loan in
the preceding five years and 0 otherwise.
3. Employment: While SHGs were not directly provided with employment opportunities during
the time-frame under consideration here, one of SEWAs foremost goals is to improve
women’s employment prospects as well as the wages that they are paid. We explore just
three simple employment measures – whether or not a woman is employed, whether or not
she is self-employed, and whether or not she participates in the NREG program.10
4. Decision-making within the household: Improvement in access to economic opportunity can
influence a woman’s bargaining position within the household (Schultz, 2001a). We do not
have data on spending patterns that allow us to test whether women gained more control over
resources, but women were asked about their participation in key household decisions: their
ability to make a Final say in matters of keeping children in school, medical decisions and
10
The Mahatma Gandhi National Rural Employment Guarantee (NREG) Scheme is an Indian job guarantee scheme,
enacted by legislation on August, 2005. The scheme provides a legal guarantee for one hundred days of employment
in every financial year to adult members of any rural household willing to do public work-related unskilled manual
work at the statutory minimum wage (http://nrega.nic.in/).
8
family-planning. We define dummy variables that take value 1 if the woman participates in
these decisions and 0 if she does not participate at all.
5. Participation in local government: As mentioned earlier, SEWA supported SHGs are
intended to promote participation in the broader village community, participation in local
elections, and take action to address social or community issues. While two years is perhaps
too short of a time-frame to expect many of these outcomes, we would at the least expect
women to know about their local political institutions such as the Gram Panchayat and would
also expect them to have better knowledge of where to report certain types of grievances.11
We explore women’s knowledge of where to report five types of grievances:
water/sanitation, road conditions, electricity supply, education services and health services.
These are well-known as the key areas where service delivery in rural India has seen
significant failures and mismanagement.
Descriptive Statistics
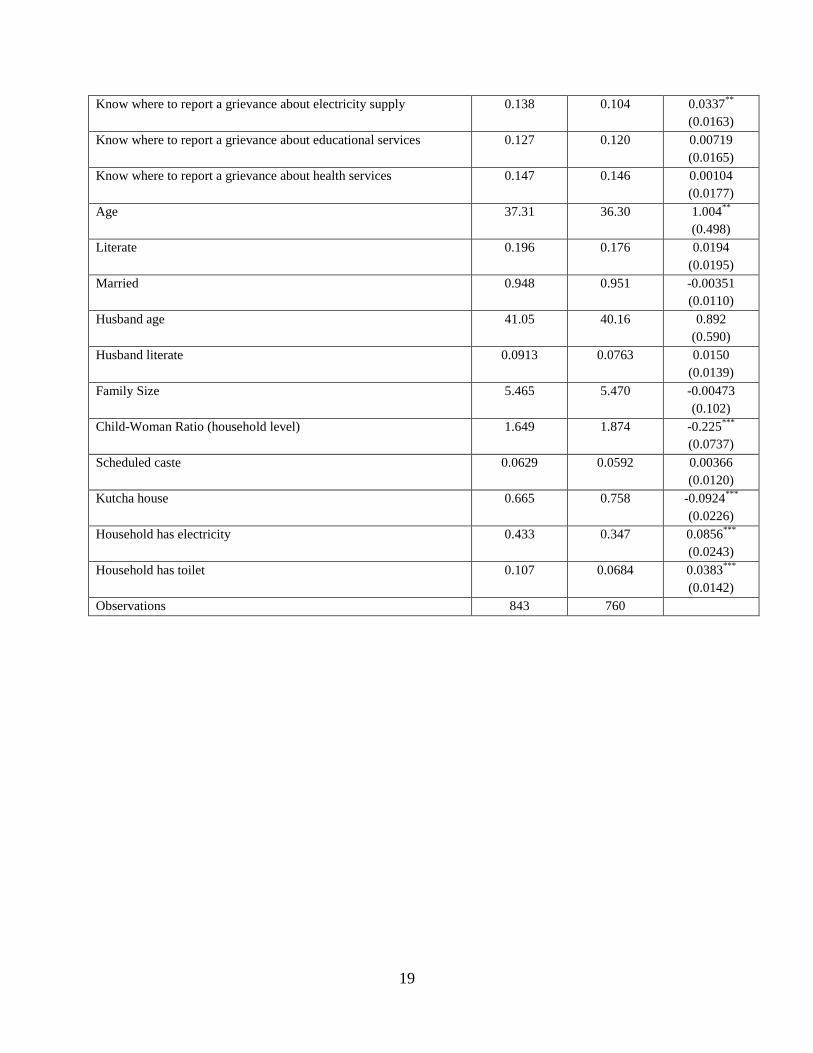
Establishment of a causal relationship between the SEWA program implemented in late
2007 and the observed outcomes in 2009 requires an analysis of the pre-program differences
between treatment and control villages. If for example, the two areas differ in characteristics that
are associated with improvements in socio-economic well-being before or after the program was
established in 2007, estimates of the SEWA program could be biased. Our first objective
therefore, is to compare some basic outcomes in the treatment villages as well as the two sets of
control villages before the SEWA programs were introduced. This information is presented in
Table 1.12
The estimates indicate that the villages do not systematically differ with respect to any
of the outcomes that of interest to us in this paper. There is no evidence that the treatment
villages had more SHGs prior to the arrival of SEWA. There is also no systematic difference in
11
The Gram Panchayat is the local governing body of a village or small town in India. It is the foundation of India’s
system of grass-roots governance. It is generally composed of 7 to 31 members and performs functions such as the
resolution of local disputes, the implementation of development schemes for the village, the establishment of
primary health centers and primary schools, arrangements for clean drinking water, drainage, construction and repair
of roads, development of SEWA Memberall-scale industries and opening of cooperative societies.
The Gram Sabha is composed of all men and women in the village who are above 18 years of age. Meetings of the
Gram Sabha are usually convened several times a year. In Rajasthan they are typically held twice a year. The agenda
typically includes the annual budget, the development schemes for the village, and where necessary, individual
difficulties or grievances of the people of a village. The Gram Sabha plays a critical role in holding government
institutions, particularly local Panchayat members, accountable. 12
Note that the two sets of controls villages are included as one major group because there was no SEWA presence
to distinguish them in 2007.

9
women’s schooling, labor-force participation or involvement in SHGs prior to the program.
There is however, evidence that SEWA villages have better infrastructure than non-SEWA
villages, with a greater proportion of households reporting electricity, toilets and use of pucca
building materials. SEWA villages also appear to have more women who already know about
where to report two particular types of grievances (water and electricity). This could be driven by
a difference in the types of services (or delivery systems) in the two types of villages. It could
also be driven by the quality of local governance. We address this issue by including village-
level fixed effects in all the regressions performed in the analysis, controlling for socio-economic
status by including controls for the variables where we observe the differences, and finally,
considering a broad set of dependent variables for each category of outcomes.
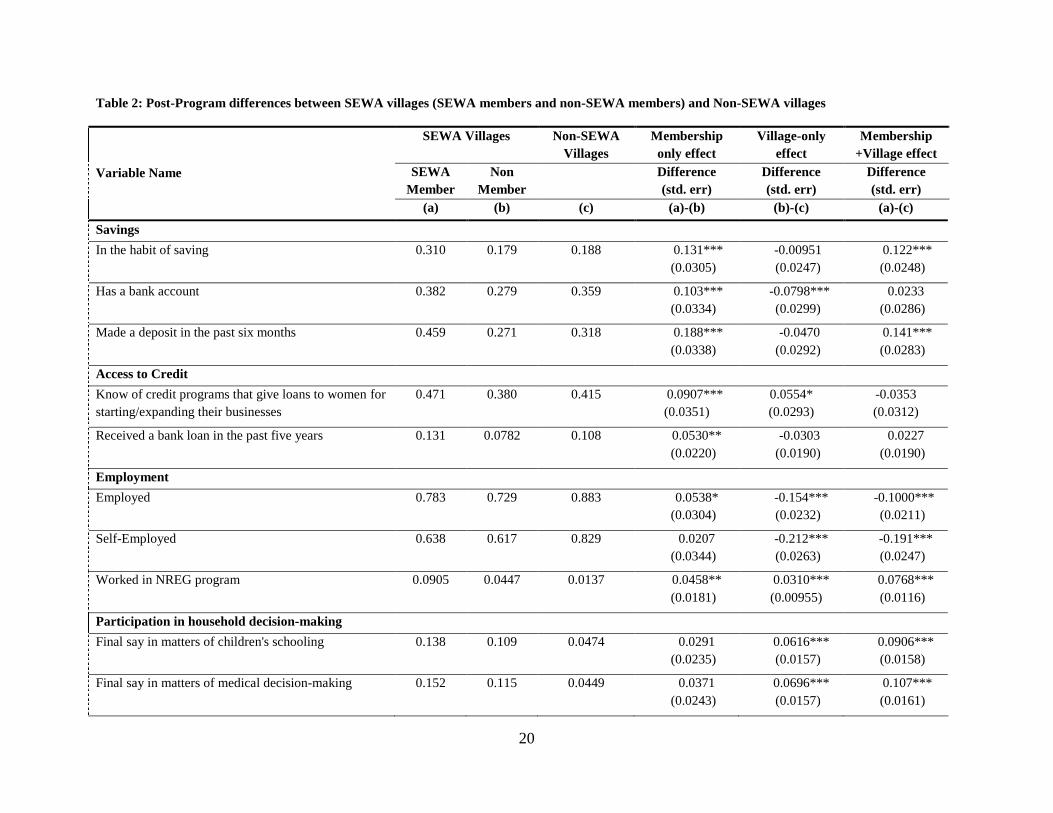
The second step of our analysis involves the simple tabulation of differences between the
three groups of households after the intervention was conducted. We define three groups of
households – (a) SHG members in villages in which SEWA was active; (b) Non-SHG members
in villages in which SEWA was active; and (c) Non-SEWA villages. The means of various
outcome variables are presented in Table 2. The difference between (a) and (b) provides the
unconditional average impact of SEWA membership for households who reside in SEWA
villages. We call this the ―SHG membership effect‖. It captures a household’s private benefits
from participation in a SHG by comparing these housesholds with other households in the same
village who did not participate in the SHG. The results in Table 2 suggest that the private returns
associated with SEWA membership are most significant for financial outcomes such as the
tendency to save, make deposit into bank accounts and manage savings. There is also a
beneficial effect of membership on employment and participation in the Indian government’s
National Rural Employment Guarantee (NREG) program. There is little-to-no effect on
participation in local government institutions but a large and significant effect on knowledge of
how to address grievances about water/sanitation, road conditions, electricity, educational
services and health services.
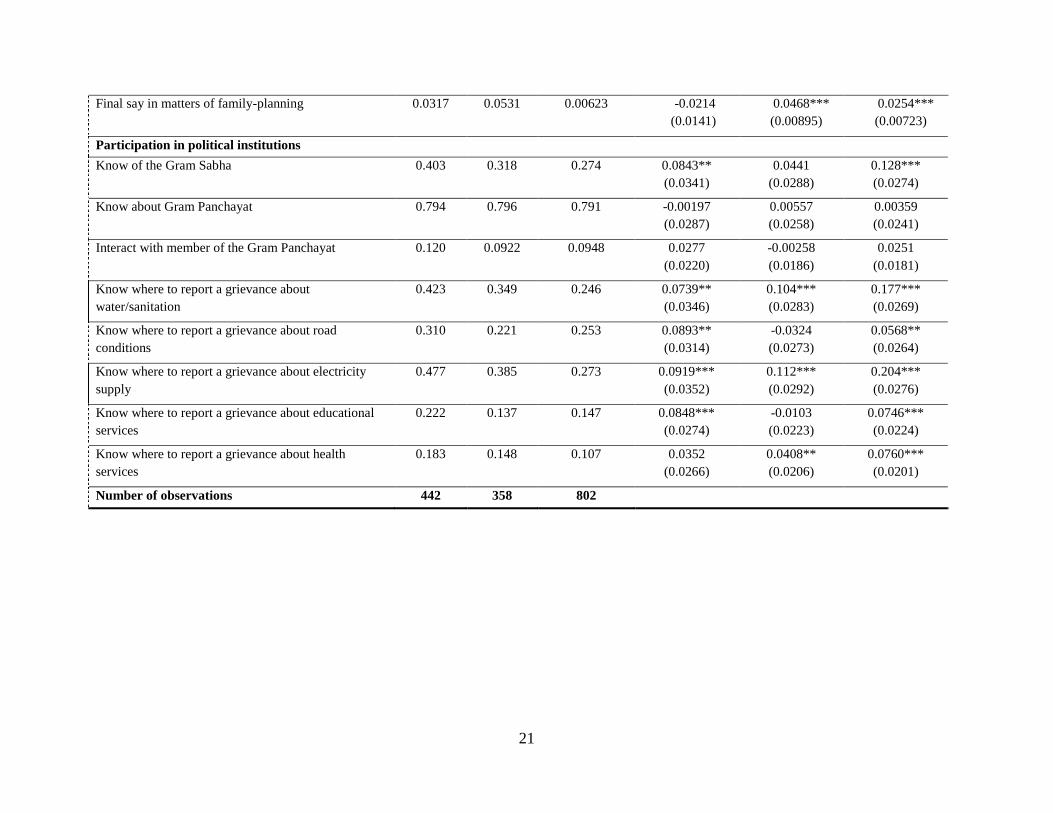
The difference between (b) and (c) provides the unconditional average impact of having
SHGs in the village for households who did not directly participate in these groups. We call this
the ―village spillover effect‖ since it focuses entirely on non-members and provides an estimate
of the village-level ―spillovers‖ of SHGs. The evidence on these village-spillover effects is
mixed. For non-members, the presence of SHGs in the village has little effect on savings

10
behaviors, or the likelihood of receiving a loan. But there is a positive effect on the knowledge
of receiving a loan, a modest effect on participation in the NREG program and a modest effect
on participation in local political institutions. There is a significant positive impact on
participation in household decision-making and the knowledge of where to report grievances
regarding water/sanitation, electricity and health services. Non-SHG members in treated villages
were more likely to report a greater say in matters of children’s education, medical decision-
making and the use of family-planning. Some types of outcomes however, were actually weaker
than in the control villages. Compared to villages where there was no program at all, non-SHG
members in treated villages were less likely to manage their savings themselves or with their
spouses. They were also less likely to be employed, self-employed or cultivate their own land.
This however could be driven by the fact that women who were highly motivated to save,
participate in the labor-force and participate in local governance in fact participated in the SHG
program, which was not offered in the control villages.
The table also presents the difference between (a) and (c), which is the combined effect
of SHG membership and residence in a SEWA village. This is a measure of the private as well as
the social returns from participating in SHGs compared to villages which receives no treatment
at all. This overall effect is presented in the final column of Table 2. Note that the overall effect
is simply a combination of the two above-described effects. We turn now to a more rigorous
evaluation of these differences.
Regression Results
Simple aggregate estimates of the program’s effect on households can be derived from a
regression of the following form:
Yhvt = β0 + β1 SEWA Memberh + β2 SEWA Villagev + β4X + μv + ejt
h=1,2,…, 1602 for households, v = 1, 2, ..., 38, for villages, t=2007, 2009
where Yhvt is the outcome of interest for household h in village v in time period t, SEWAMember
takes value 1 if the woman interviewed in h is a member of SEWA, SEWA Village takes value 1
if the village is a village in which SEWA is present, X is a vector of control variables, μv is a
village-specific fixed-effect and ejt is the error. We use this specification primarily because it

11
captures both types of randomized interventions – selection of SEWA villages and selection of
SHG members within villages – with simplicity. Control variables include measures of a
woman’s age, literacy, marital status, husband’s age and literacy, family size, the child-woman
ratio (dependency ratio for a woman), a dummy for belonging to a scheduled-caste, a dummy for
home-ownership, a dummy for a kutcha (lack of solid) housing structure and a dummy for the
presence of a toilet. We exclude measures of income and assets out of concerns of endogeneity.
We also include a dummy variable that takes value 1 if the household was in the endline survey
and 0 in the baseline survey. Results are discussed below. We group them based on the type of
outcome that is being considered.
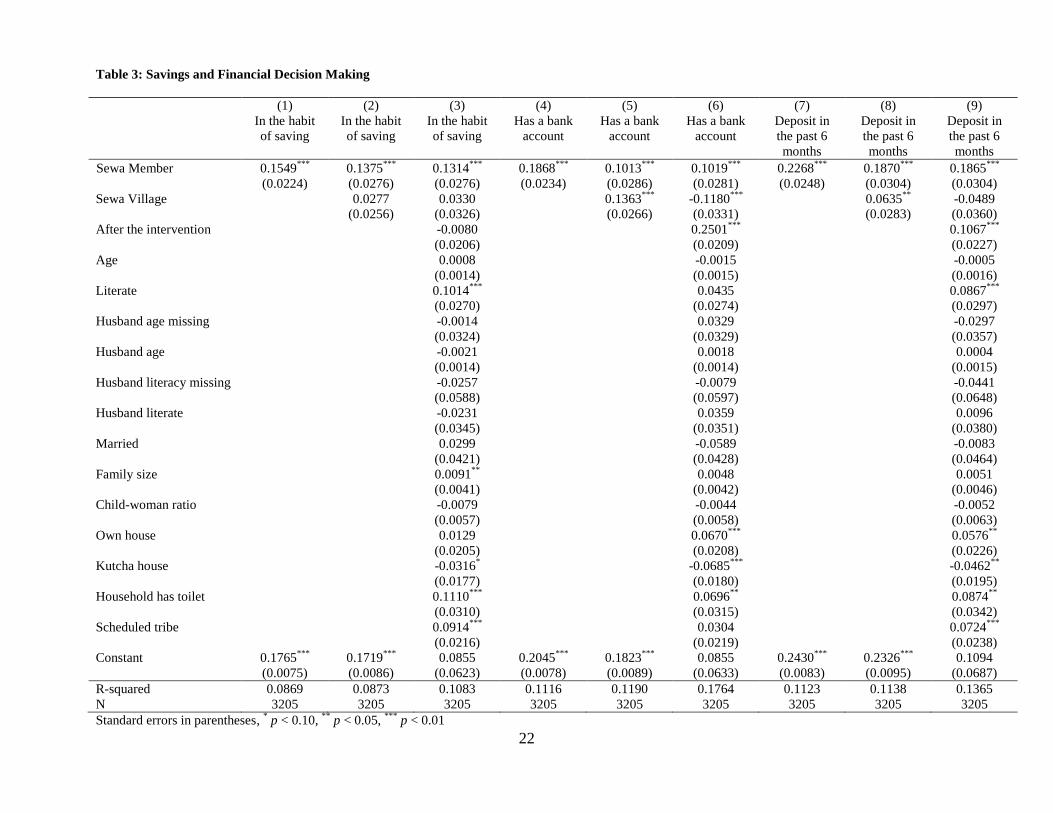
Saving and Financial Decision-Making (Error! Reference source not found.): The
positive and significant coefficient of the SEWA Member dummy, in both the regressions with
controls and those without, suggests that relative to non-members, SEWA members are 13
percent more likely save, 10 percent more likely to have bank accounts and 19 percent more
likely to make deposits into their accounts within the six months preceding the survey. All these
estimates are statistically significant at the 1% level. The broader effects of the program at the
village level – as measured by the variable SEWA Village – are also positive and statistically
significant for ownership of bank accounts and deposits into the bank accounts. In the regression
for the variable ―Deposit in the past 6 months‖, the coefficient for SEWA Village, is however
about one-third the magnitude that of SEWA Member. We interpret this as evidence that while
non-participants in SEWA villages may gain access to the means to save, and they are even more
likely than SEWA members to open bank accounts, but their actual savings do not increase as
significantly as the SEWA members. These benefits are restricted to members of the SHG
groups.
Access to Credit (Error! Reference source not found.): We have already shown (Table 1)
that prior to the entrance of SEWA, women in the treatment and control villages did not differ in
any statistically significant way with respect to their knowledge and access to credit. The results
in Error! Reference source not found. however, suggest that the treatment had significant effects.
Regression results further confirm that SEWA members were about 8 percent more likely to
know of their opportunities for credit in the local area and 6 percent more likely to have been
recipients of a bank loan, and this effect is statistically significant at the 1% level. There is no

12
broad village-level effect. Women who resided in SEWA villages but did not participate in the
program received no statistically significant benefit in terms of either knowledge or the receipts
of loans. We infer from this that access to credit remains concentrated among women who are
members of these groups and the knowledge of credit opportunities does not easily diffuse
beyond the group.
Employment (Table 5): Participation in SEWA’s SHGs does not seem to have any
positive effect on the likelihood of members reporting that they are employed or self-employed.
In results not shown here, we also find no evidence that members are more likely to cultivate
their own farms. The village-level spillover effect with respect to these employment measures is
puzzlingly negative and statistically significant.13
It is interesting to observe that SEWA
membership is associated with a 4 percent greater likelihood of being employed by the
government-led NREG scheme, even though overall employment in the scheme declined
between 2007 and 2009. This may suggest that SHG members are more aware of employment
opportunities offered through this program, and are better able to benefit from government
services.14
The village-level effect of this program is not statistically significant. Interestingly,
female literacy is associated with neither increased employment nor with an increased effect at
the level of the individual or the village. This is possibly driven by the fact that job-opportunities
for women in this area are limited to unskilled labor and the returns to literacy are quite low in
the labor market.
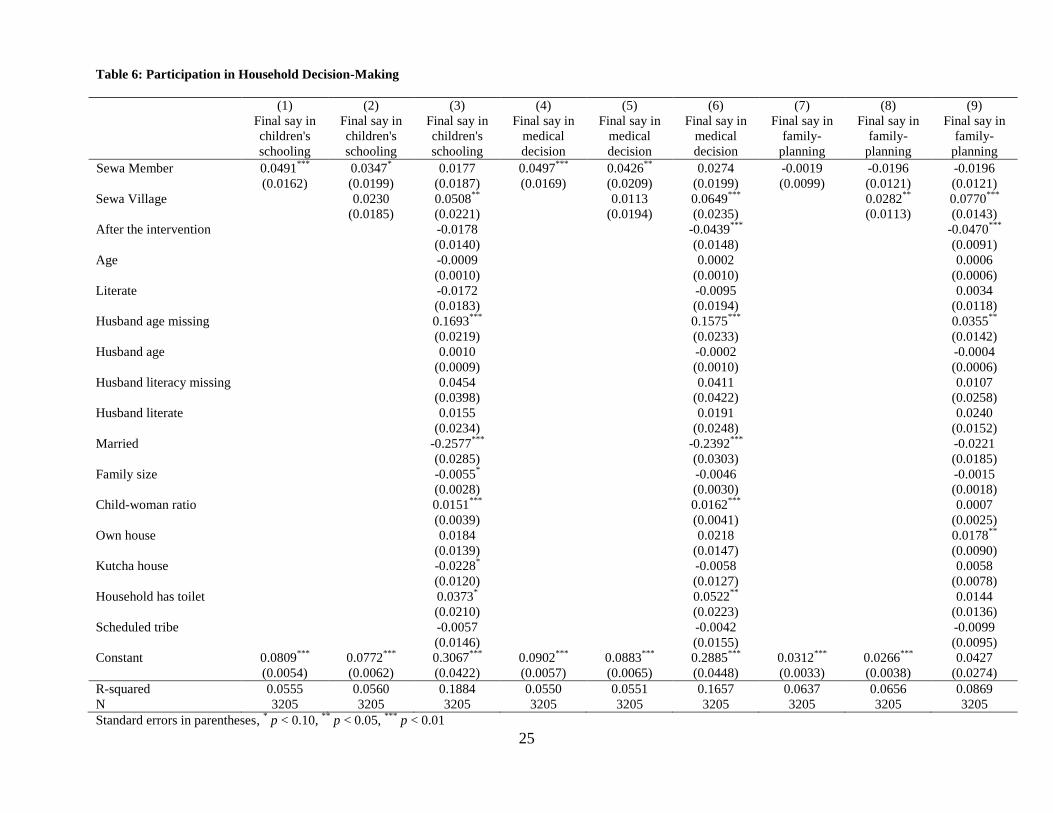
Participation in Household Decision-Making (Error! Reference source not found.): Note
that that participation in SHGs is associated with increases in decision-making authority in two
of the three indicators, but the effect diminishes with the inclusion of control variables in even
those cases. Interestingly, we also observe a village-level effect that is positive and statistically
13
One possible explanation for this could have also been an increase in participation in SEWA’s vocational training
programs in the village. Individuals who were not invited to participate in SHGs may have been more inclined to
participate in these programs, resulting in a lowering of their labor supply. We explore this more carefully in future
work and in upcoming field visits. 14
An alternative explanation of the increased participation by SEWA participants in the NREG scheme is that there
is non-random placement of the NREG program and they are concentrated in the same villages as the SEWA
programs, perhaps as a result of better infrastructure in these villages. Our regressions include village-level fixed
effects and thus capture village-level characteristics that remained unchanged over time. If some SEWA villages
experienced improvements in infrastructure during the two years of the study, and were more likely to benefit from
government programs, the observed relationship may be upward biased and thus spurious. Our evidence suggests
that there was no deliberate effort by the government to prioritize implementation of NREG over SEWA villages. In
fact the program was implemented simultaneously in the entire district. In future work we plan to explore this more
carefully. For now we simply highlight the possibility that the presence of SHGs in SEWA villages may have led to
an improvement in the implementation of the same NREG scheme that was in place in all the districts villages.

13
significant for all three measures. The coefficient for the variable SEWA Village is positive and
statistically significant at the 1 percent level, indicating that women who reside in SEWA
villages were 5—8 percent more likely to participate in key household decisions regardless of
whether or not they participated in SHGS. One explanation of this finding is that the presence of
SHGs that are backed by a major NGO can increase the salience of issues such as female
empowerment in the community and trigger subtle changes in attitude. The coefficients of the
control variables illustrate that women’s literacy and socio-economic status has at best a weak
impact on these measures of well-being. Again, this is perhaps suggestive of the fact that SEWA
SHGs are structured to target women who are poor and are designed to be impactful in these
circumstances.
Participation in Local Government (Table 7 and Table 8): We begin by focusing on
women’s awareness of the most salient of the local government institutions in rural India: The
Gram Sabha and Gram Panchayat. We also examine the likelihood of their interaction with a
Panchayat member. Regression results are presented in Error! Reference source not found.. Note
that the coefficient for SEWA Member is positive and significant in the regression of knowledge
of the Gram Sabha. Women who are members of SEWA SHGs are about 10% more likely to
know about Gram Sabhas than non-members. There is however, no statistically discernible
impact of participation on knowledge of the Gram Panchayat (columns 4—6) or interaction with
its members (columns 7—9). The main reason for this could of course be that knowledge of the
Gram Panchayat was already very high (in excess of 70 percent) prior to the intervention.
Knowledge of the Gram Sabha, a much more recent institution, was a lot lower (around 30
percent in all the villages). It is also interesting to note that literate women are more likely to
know about both entities and are also more likely to interact with Panchayat members.
Interestingly, there is no village-level effect on knowledge of any of these indicators.
In another measure of women’s participation in local government, we explore women’s
knowledge of where to report five types of grievances: water/sanitation, road conditions,
electricity supply, education services and health services. We expect SEWA membership to have
direct as well as spillover effects. Indeed, the results confirm this. SEWA membership is
associated with a 6—15% increase in the likelihood of knowing where to report a grievance on
any of these matters, and the results are statistically significant in all cases. Table 8 presents
regressions on a measure that is defined as the sum of all five grievance measures. Results
14
confirm that SEWA membership has a positive and significant effect on women’s scores. There
is however, no evidence in this case of a broad village effect. The variable SEWA Village
remains statistically insignificant. This suggests that specific types of knowledge – such as
knowledge of credit or knowledge of where to report grievances – are likely concentrated within
SHGs and may take longer than the time-span of this study to diffuse into the community.
Overall the results suggest that participation in SHGs was associated with some
significant effects both at the level of participants, as well as the broader level of the village. The
effects we observe are much smaller than Deininger and Liu (2009), but we attribute this to the
fact that SHGs we study here were significantly different. Moreover, SHGs were far less
prevalent before the intervention and the area has lower levels of socio-economic development,
higher levels of gender inequality and worse indicators of governance than Southern India
(United Nations, 2000; 2010). SHGs in this environment may simply take longer to have impact.
6. Conclusion
This paper explores the impact of participation in SHGs on a variety of measures of
women’s well-being. With the help of the Self-Employed Women’s Association (SEWA) of
India, women in the Dugarpur district of Rajasthan were organized into SHGs in late 2007. Two
years later, participants were surveyed, along with women in two control groups, to examine the
impact of participation. Control groups included non-participants in the same village at the SHGs
as well as women in villages where there were no SHGs. Comparisons between these groups
suggest that SHGs had several effects. Participating women saved more, were more likely to
have bank accounts and were more likely to participate in the management of their savings. They
were also more knowledgeable about credit opportunities and more likely to take loans. They are
also more likely to have a greater say in household decisions, participate in government
programs and know which authorities to report grievances about government services such as
water/sanitation, roads, electricity supply and educational and health services. There is also
evidence that some of these benefits spilled over into the greater village community. Women
who resided in the same village as the SHG, including those who did not participate in the SHGs,
experienced an increase in decision-making authority within the household.
These results have two major policy implications. First, they confirm that SHGs – when
appropriately designed with a careful consideration of local conditions -- can indeed promote
collective action at the local level. Second, the results confirm that placing women at the center

15
of development policy has broad benefits. The opportunity to form groups and take collective
action is of course valuable in its own right, but it also has instrumental value in its tendency to
spill over into the community.

16
References
1. Alesina, Alberto and Eliana La Ferrara, 2000, "Participation in Heterogeneous
Communities," The Quarterly Journal of Economics, MIT Press, vol. 115(3), pages 847-
904, August.
2. Bardhan, Pranab, 2002, ―Decentralization of government and development‖, Journal of
Economic Perspectives, Vol 16, No. 4, pp. 185—205.
3. Basu, P. and P. Srivastava. 2005. "Scaling-up Microfinance for India's Rural Poor."
World Bank Policy Research Working Paper 3646. Washington, DC: World Bank.
4. Bhatia, Navin, 2007, ―Revisiting bank-linked Self Help Groups (SHGs) - A study of
Rajasthan State‖, Reserve Bank of India Occasional Papers Vol. 28, No. 2, Monsoon
2007.
5. Buvinic M. and E. King, 2007, ―Smart Economics‖, Finance and Development, Volume
44, Number 2,
6. Chen, Martha, Renana Jhabvala, Ravi Kanbur and Carol Richards, 2006, Membership
Based Organizations of the Poor: Concepts, Experience and Policy, Routledge
7. Deininger, K. and Y. Liu, 2009, "Economic and social impacts of self-help groups in
India," World Bank Policy Research Working Paper. Washington, DC: World Bank.
8. Garikipati, S., 2008, "The impact of lending to women on hosuehold vulnerability and
women's empowerment: Evidence from India," World Development forthcoming.
9. Government of India, 2009, District Human Development Report: Dungarpur, By
Government of Rajasthan and Institute of Development Studies, Jaipur
10. La Ferrara, Eliana, 2003, "Kin Groups and Reciprocity: A Model of Credit Transactions
in Ghana," American Economic Review, American Economic Association, vol. 93(5),
pages 1730—1751.

17
11. Mansuri , Ghazala and Vijayendra Rao, 2004, ―Community Based (and Driven)
Development: A Critical Review,‖ The World Bank Research Observer, vol. 19, no. 1,
pp. 1-39
12. Nair, A, 2005, "Sustainability of microfinance self help groups in India: would federating
help?" World Bank Policy Research Working Paper 3516. Washington, DC: World Bank.
13. Rao, Vijayendra, and Ana Maria Ibanez, 2005, ―The Social Impact of Social Funds In
Jamaica: A "Participatory Econometric" Analysis of Participation, Targeting, and
Collective Action in Community-Driven Development‖, Journal of Development Studies,
Vol. 41, Number 5, pp: 788-838.
14. Rao, Vijayendra, 2005, ―Symbolic Public Goods and the Coordination of Collective
Action: A Comparison of Local Development in India and Indonesia," Chapter 10 in
Pranab Bardhan and Isha Ray (edited) The Contested Commons: Conversations Between
Economists and Anthropologists, Blackwell Publishing Ltd, 2008
15. Schultz, T. Paul, 1995, Investments in Women’s Human Capital, University of Chicago
Press.
16. Schultz, T. Paul, 2001a, ―Women's Role in the Agricultural Household Bargaining and
Human Capital Investments‖ In: Agricultural and Resource Economics Handbook, Vol.
1.
17. Schultz, T. Paul, 2001b, Why Governments Should Invest More to Educate Girls, World
Development, 30(2): 207-225.
18. NABARD, 2010, The State of Microfinance in India, Available at: http://nabard.org/
(Accessed on April 5th
, 2010)
19. United Nations Development Program, 2000, Human Development in South Asia: The
Gender Question, Oxford University Press.
20. World Bank, 2002, A Sourcebook for Poverty Reduction Strategy Papers, Volumes 1 and
2, Edited by Jeni Klugman.

18
Table 1: Pre-program differences between SEWA Villages and Non-SEWA Villages
SEWA
Villages
Non-SEWA
Villages
Difference
(se)
Participation in any type of membership based-organization that
holds regular meetings
0.132 0.149 -0.0170
(0.0173)
In the habit of saving 0.163 0.191 -0.0283
(0.0190)
Has a bank account 0.123 0.101 0.0221
(0.0158)
Made a deposit in the past 6 months 0.210 0.193 0.0165
(0.0201)
Manage savings (either alone or with husband) 0.216 0.199 0.0172
(0.0203)
Know of credit programs that give loans to women for starting or
expanding their businesses
0.240
0.237 0.00278
(0.0213)
Received a bank loan in the past 5 years 0.0759 0.0921 -0.0162
(0.0138)
Employed 0.821 0.800 0.0209
(0.0196)
Self-Employed 0.700 0.714 -0.0146
(0.0228)
Cultivate own farm 0.714 0.696 0.0181
(0.0228)
Worked in NREG program 0.117 0.0776 0.0398***
(0.0149)
Final say in matters of children's schooling 0.0913 0.0868 0.00450
(0.0143)
Final say in matters of medical decision-making 0.0973 0.112 -0.0146
(0.0153)
Final say in matters of family-planning 0.0225 0.0553 -0.0327***
(0.00954)
Know of the Gram Sabha 0.399 0.405 -0.00669
(0.0245)
Ever attended Gram Sabha 0.0439 0.0368 0.00705
(0.00987)
Know about Gram Panchayat 0.706 0.703 0.00318
(0.0228)
Know a particular member of the Gram Panchayat 0.380 0.355 0.0243
(0.0241)
Interact with Gram Panchayat members 0.102 0.109 -0.00719
(0.0154)
Know where to report a grievance about water/sanitation 0.190 0.154 0.0359*
(0.0189)
Know where to report a grievance about road conditions 0.147 0.126 0.0208
(0.0172)
19
Know where to report a grievance about electricity supply 0.138 0.104 0.0337**
(0.0163)
Know where to report a grievance about educational services 0.127 0.120 0.00719
(0.0165)
Know where to report a grievance about health services 0.147 0.146 0.00104
(0.0177)
Age 37.31 36.30 1.004**
(0.498)
Literate 0.196 0.176 0.0194
(0.0195)
Married 0.948 0.951 -0.00351
(0.0110)
Husband age 41.05 40.16 0.892
(0.590)
Husband literate 0.0913 0.0763 0.0150
(0.0139)
Family Size 5.465 5.470 -0.00473
(0.102)
Child-Woman Ratio (household level) 1.649 1.874 -0.225***
(0.0737)
Scheduled caste 0.0629 0.0592 0.00366
(0.0120)
Kutcha house 0.665 0.758 -0.0924***
(0.0226)
Household has electricity 0.433 0.347 0.0856***
(0.0243)
Household has toilet 0.107 0.0684 0.0383***
(0.0142)
Observations 843 760
20
Table 2: Post-Program differences between SEWA villages (SEWA members and non-SEWA members) and Non-SEWA villages
Variable Name
SEWA Villages Non-SEWA
Villages
Membership
only effect
Village-only
effect
Membership
+Village effect
SEWA
Member
Non
Member
Difference
(std. err)
Difference
(std. err)
Difference
(std. err)
(a) (b) (c) (a)-(b) (b)-(c) (a)-(c)
Savings
In the habit of saving
0.310 0.179 0.188 0.131***
(0.0305)
-0.00951
(0.0247)
0.122***
(0.0248)
Has a bank account
0.382 0.279 0.359 0.103***
(0.0334)
-0.0798***
(0.0299)
0.0233
(0.0286)
Made a deposit in the past six months
0.459 0.271 0.318 0.188***
(0.0338)
-0.0470
(0.0292)
0.141***
(0.0283)
Access to Credit
Know of credit programs that give loans to women for
starting/expanding their businesses
0.471 0.380 0.415 0.0907***
(0.0351)
0.0554*
(0.0293)
-0.0353
(0.0312)
Received a bank loan in the past five years
0.131 0.0782 0.108 0.0530**
(0.0220)
-0.0303
(0.0190)
0.0227
(0.0190)
Employment
Employed
0.783 0.729 0.883 0.0538*
(0.0304)
-0.154***
(0.0232)
-0.1000***
(0.0211)
Self-Employed
0.638 0.617 0.829 0.0207
(0.0344)
-0.212***
(0.0263)
-0.191***
(0.0247)
Worked in NREG program
0.0905 0.0447 0.0137 0.0458**
(0.0181)
0.0310***
(0.00955)
0.0768***
(0.0116)
Participation in household decision-making
Final say in matters of children's schooling 0.138 0.109 0.0474 0.0291
(0.0235)
0.0616***
(0.0157)
0.0906***
(0.0158)
Final say in matters of medical decision-making 0.152 0.115 0.0449 0.0371
(0.0243)
0.0696***
(0.0157)
0.107***
(0.0161)
21
Final say in matters of family-planning
0.0317 0.0531 0.00623 -0.0214
(0.0141)
0.0468***
(0.00895)
0.0254***
(0.00723)
Participation in political institutions
Know of the Gram Sabha
0.403 0.318 0.274 0.0843**
(0.0341)
0.0441
(0.0288)
0.128***
(0.0274)
Know about Gram Panchayat
0.794 0.796 0.791 -0.00197
(0.0287)
0.00557
(0.0258)
0.00359
(0.0241)
Interact with member of the Gram Panchayat
0.120 0.0922 0.0948 0.0277
(0.0220)
-0.00258
(0.0186)
0.0251
(0.0181)
Know where to report a grievance about
water/sanitation
0.423 0.349 0.246 0.0739**
(0.0346)
0.104***
(0.0283)
0.177***
(0.0269)
Know where to report a grievance about road
conditions
0.310 0.221 0.253 0.0893**
(0.0314)
-0.0324
(0.0273)
0.0568**
(0.0264)
Know where to report a grievance about electricity
supply
0.477 0.385 0.273 0.0919***
(0.0352)
0.112***
(0.0292)
0.204***
(0.0276)
Know where to report a grievance about educational
services
0.222 0.137 0.147 0.0848***
(0.0274)
-0.0103
(0.0223)
0.0746***
(0.0224)
Know where to report a grievance about health
services
0.183 0.148 0.107 0.0352
(0.0266)
0.0408**
(0.0206)
0.0760***
(0.0201)
Number of observations 442 358 802
22
Table 3: Savings and Financial Decision Making
(1) (2) (3) (4) (5) (6) (7) (8) (9)
In the habit
of saving
In the habit
of saving
In the habit
of saving
Has a bank
account
Has a bank
account
Has a bank
account
Deposit in
the past 6
months
Deposit in
the past 6
months
Deposit in
the past 6
months
Sewa Member 0.1549***
(0.0224)
0.1375***
(0.0276)
0.1314***
(0.0276)
0.1868***
(0.0234)
0.1013***
(0.0286)
0.1019***
(0.0281)
0.2268***
(0.0248)
0.1870***
(0.0304)
0.1865***
(0.0304)
Sewa Village
0.0277
(0.0256)
0.0330
(0.0326)
0.1363***
(0.0266)
-0.1180***
(0.0331)
0.0635**
(0.0283)
-0.0489
(0.0360)
After the intervention
-0.0080
(0.0206)
0.2501***
(0.0209)
0.1067***
(0.0227)
Age
0.0008
(0.0014)
-0.0015
(0.0015)
-0.0005
(0.0016)
Literate
0.1014***
(0.0270)
0.0435
(0.0274)
0.0867***
(0.0297)
Husband age missing
-0.0014
(0.0324)
0.0329
(0.0329)
-0.0297
(0.0357)
Husband age
-0.0021
(0.0014)
0.0018
(0.0014)
0.0004
(0.0015)
Husband literacy missing
-0.0257
(0.0588)
-0.0079
(0.0597)
-0.0441
(0.0648)
Husband literate
-0.0231
(0.0345)
0.0359
(0.0351)
0.0096
(0.0380)
Married
0.0299
(0.0421)
-0.0589
(0.0428)
-0.0083
(0.0464)
Family size
0.0091**
(0.0041)
0.0048
(0.0042)
0.0051
(0.0046)
Child-woman ratio
-0.0079
(0.0057)
-0.0044
(0.0058)
-0.0052
(0.0063)
Own house
0.0129
(0.0205)
0.0670***
(0.0208)
0.0576**
(0.0226)
Kutcha house
-0.0316*
(0.0177)
-0.0685***
(0.0180)
-0.0462**
(0.0195)
Household has toilet
0.1110***
(0.0310)
0.0696**
(0.0315)
0.0874**
(0.0342)
Scheduled tribe
0.0914***
(0.0216)
0.0304
(0.0219)
0.0724***
(0.0238)
Constant 0.1765***
(0.0075)
0.1719***
(0.0086)
0.0855
(0.0623)
0.2045***
(0.0078)
0.1823***
(0.0089)
0.0855
(0.0633)
0.2430***
(0.0083)
0.2326***
(0.0095)
0.1094
(0.0687)
R-squared 0.0869 0.0873 0.1083 0.1116 0.1190 0.1764 0.1123 0.1138 0.1365
N 3205 3205 3205 3205 3205 3205 3205 3205 3205
Standard errors in parentheses, * p < 0.10,
** p < 0.05,
*** p < 0.01

23
Table 4: Access to credit
(1) (2) (3) (4) (5) (6)
Know of programs
that give loans to
women
Know of programs
that give loans to
women
Know of programs
that give loans to
women
Received a bank
loan in the past 5
years
Received a bank
loan in the past 5
years
Received a bank
loan in the past 5
years
Sewa Member 0.1991***
(0.0255)
0.0908***
(0.0313)
0.0755**
(0.0311)
0.0667***
(0.0166)
0.0581***
(0.0204)
0.0559***
(0.0206)
Sewa Village
0.1727***
(0.0291)
0.0182
(0.0367)
0.0137
(0.0190)
0.0097
(0.0243)
After the intervention
0.1531***
(0.0232)
0.0005
(0.0154)
Age
-0.0010
(0.0016)
0.0008
(0.0011)
Literate
0.1448***
(0.0303)
0.0211
(0.0201)
Husband age missing
-0.0312
(0.0364)
-0.0257
(0.0241)
Husband age
0.0001
(0.0016)
-0.0004
(0.0010)
Husband literacy missing
0.0152
(0.0661)
0.0002
(0.0438)
Husband literate
-0.0431
(0.0388)
0.0690***
(0.0257)
Married
-0.0236
(0.0474)
-0.0195
(0.0314)
Family size
0.0064
(0.0047)
0.0050
(0.0031)
Child-woman ratio
0.0061
(0.0065)
-0.0001
(0.0043)
Own house
0.0119
(0.0230)
0.0063
(0.0153)
Kutcha house
-0.0422**
(0.0199)
-0.0266**
(0.0132)
Household has toilet
0.0453
(0.0349)
-0.0074
(0.0232)
Scheduled tribe
0.0995***
(0.0243)
0.0099
(0.0161)
Constant 0.3030***
(0.0085)
0.2748***
(0.0097)
0.1728**
(0.0701)
0.0866***
(0.0055)
0.0843***
(0.0064)
0.0645
(0.0465)
R-squared 0.1503 0.1598 0.1901 0.0811 0.0813 0.0911
N 3205 3205 3205 3205 3205 3205
Standard errors in parentheses. * p < 0.10,
** p < 0.05,
*** p < 0.01

24
Table 5: Employment
(1) (2) (3) (4) (5) (6) (7) (8) (9)
Employed Employed Employed Self-
Employed
Self-
Employed
Self-
Employed
Worked in
NREG
program
Worked in
NREG
program
Worked in
NREG
program
Sewa Member -0.0271
(0.0216)
0.0433
(0.0265)
0.0310
(0.0264)
-0.0477*
(0.0249)
0.0102
(0.0306)
0.0089
(0.0305)
-0.0141
(0.0141)
0.0447***
(0.0172)
0.0429**
(0.0173)
Sewa Village
-0.1123***
(0.0247)
-0.1671***
(0.0312)
-0.0924***
(0.0285)
-0.1833***
(0.0361)
-0.0939***
(0.0160)
-0.0183
(0.0204)
After the intervention
0.0594***
(0.0197)
0.0916***
(0.0228)
-0.0738***
(0.0129)
Age
-0.0020
(0.0014)
-0.0040**
(0.0016)
-0.0001
(0.0009)
Literate
-0.0247
(0.0257)
-0.0438
(0.0298)
-0.0039
(0.0168)
Husband age missing
-0.0522*
(0.0309)
-0.0441
(0.0358)
0.0248
(0.0202)
Husband age
0.0023*
(0.0013)
0.0042***
(0.0015)
0.0008
(0.0009)
Husband literacy missing
0.0369
(0.0561)
-0.0256
(0.0650)
-0.0477
(0.0367)
Husband literate
-0.0345
(0.0329)
-0.0580
(0.0382)
-0.0075
(0.0216)
Married
-0.0045
(0.0402)
0.0682
(0.0466)
-0.0195
(0.0263)
Family size
0.0044
(0.0040)
0.0056
(0.0046)
-0.0029
(0.0026)
Child-woman ratio
-0.0005
(0.0055)
-0.0083
(0.0064)
0.0121***
(0.0036)
Own house
0.0442**
(0.0195)
0.0432*
(0.0226)
0.0318**
(0.0128)
Kutcha house
0.0010
(0.0169)
-0.0058
(0.0196)
-0.0088
(0.0111)
Household has toilet
-0.1900***
(0.0296)
-0.1489***
(0.0343)
-0.0349*
(0.0194)
Scheduled tribe
0.0781***
(0.0206)
0.0460*
(0.0239)
0.0223*
(0.0135)
Constant 0.8197***
(0.0072)
0.8380***
(0.0082)
0.7174***
(0.0595)
0.7245***
(0.0083)
0.7396***
(0.0095)
0.5770***
(0.0689)
0.0722***
(0.0047)
0.0875***
(0.0054)
0.0548
(0.0389)
R-squared 0.1027 0.1086 0.1417 0.1148 0.1177 0.1460 0.1246 0.1342 0.1540
N 3205 3205 3205 3205 3205 3205 3205 3205 3205
Standard errors in parentheses, * p < 0.10,
** p < 0.05,
*** p < 0.01
25
Table 6: Participation in Household Decision-Making
(1) (2) (3) (4) (5) (6) (7) (8) (9)
Final say in
children's
schooling
Final say in
children's
schooling
Final say in
children's
schooling
Final say in
medical
decision
Final say in
medical
decision
Final say in
medical
decision
Final say in
family-
planning
Final say in
family-
planning
Final say in
family-
planning
Sewa Member 0.0491***
(0.0162)
0.0347*
(0.0199)
0.0177
(0.0187)
0.0497***
(0.0169)
0.0426**
(0.0209)
0.0274
(0.0199)
-0.0019
(0.0099)
-0.0196
(0.0121)
-0.0196
(0.0121)
Sewa Village
0.0230
(0.0185)
0.0508**
(0.0221)
0.0113
(0.0194)
0.0649***
(0.0235)
0.0282**
(0.0113)
0.0770***
(0.0143)
After the intervention
-0.0178
(0.0140)
-0.0439***
(0.0148)
-0.0470***
(0.0091)
Age
-0.0009
(0.0010)
0.0002
(0.0010)
0.0006
(0.0006)
Literate
-0.0172
(0.0183)
-0.0095
(0.0194)
0.0034
(0.0118)
Husband age missing
0.1693***
(0.0219)
0.1575***
(0.0233)
0.0355**
(0.0142)
Husband age
0.0010
(0.0009)
-0.0002
(0.0010)
-0.0004
(0.0006)
Husband literacy missing
0.0454
(0.0398)
0.0411
(0.0422)
0.0107
(0.0258)
Husband literate
0.0155
(0.0234)
0.0191
(0.0248)
0.0240
(0.0152)
Married
-0.2577***
(0.0285)
-0.2392***
(0.0303)
-0.0221
(0.0185)
Family size
-0.0055*
(0.0028)
-0.0046
(0.0030)
-0.0015
(0.0018)
Child-woman ratio
0.0151***
(0.0039)
0.0162***
(0.0041)
0.0007
(0.0025)
Own house
0.0184
(0.0139)
0.0218
(0.0147)
0.0178**
(0.0090)
Kutcha house
-0.0228*
(0.0120)
-0.0058
(0.0127)
0.0058
(0.0078)
Household has toilet
0.0373*
(0.0210)
0.0522**
(0.0223)
0.0144
(0.0136)
Scheduled tribe
-0.0057
(0.0146)
-0.0042
(0.0155)
-0.0099
(0.0095)
Constant 0.0809***
(0.0054)
0.0772***
(0.0062)
0.3067***
(0.0422)
0.0902***
(0.0057)
0.0883***
(0.0065)
0.2885***
(0.0448)
0.0312***
(0.0033)
0.0266***
(0.0038)
0.0427
(0.0274)
R-squared 0.0555 0.0560 0.1884 0.0550 0.0551 0.1657 0.0637 0.0656 0.0869
N 3205 3205 3205 3205 3205 3205 3205 3205 3205
Standard errors in parentheses, * p < 0.10,
** p < 0.05,
*** p < 0.01

26
Table 7: Participation in Local Governance
(1) (2) (3) (4) (5) (6) (7) (8) (9)
Know of the
Gram Sabha
Know of the
Gram Sabha
Know of the
Gram Sabha
Know of
Gram
Panchayat
Know about
Gram
Panchayat
Know about
Gram
Panchayat
Interact with
Panchayat
members
Interact with
Panchayat
members
Interact with
Panchayat
members
Sewa Member 0.0530**
(0.0270)
0.0942***
(0.0332)
0.0946***
(0.0328)
0.0492**
(0.0232)
-0.0126
(0.0285)
-0.0195
(0.0286)
0.0257
(0.0173)
0.0262
(0.0213)
0.0180
(0.0214)
Sewa Village
-0.0657**
(0.0308)
0.0521
(0.0388)
0.0986***
(0.0265)
0.0237
(0.0338)
-0.0008
(0.0198)
0.0275
(0.0252)
After the intervention
-0.1258***
(0.0245)
0.0711***
(0.0214)
-0.0268*
(0.0160)
Age
0.0008
(0.0017)
-0.0003
(0.0015)
0.0026**
(0.0011)
Literate
0.1789***
(0.0320)
0.0862***
(0.0279)
0.0752***
(0.0209)
Husband age missing
0.0062
(0.0385)
-0.0017
(0.0335)
0.0319
(0.0250)
Husband age
0.0011
(0.0017)
0.0019
(0.0014)
-0.0003
(0.0011)
Husband literacy
missing
0.0972
(0.0699)
0.0644
(0.0609)
-0.0184
(0.0455)
Husband literate
-0.0558
(0.0410)
0.0172
(0.0357)
0.0008
(0.0267)
Married
0.0701
(0.0501)
-0.0466
(0.0436)
0.0307
(0.0326)
Family size
0.0068
(0.0049)
0.0053
(0.0043)
-0.0037
(0.0032)
Child-woman ratio
0.0032
(0.0068)
0.0015
(0.0060)
0.0082*
(0.0044)
Own house
-0.0321
(0.0243)
-0.0268
(0.0212)
-0.0325**
(0.0158)
Kutcha house
-0.0980***
(0.0210)
-0.0548***
(0.0183)
-0.0321**
(0.0137)
Household has toilet
0.0445
(0.0369)
0.0037
(0.0321)
-0.0731***
(0.0240)
Scheduled tribe
-0.0251
(0.0257)
-0.0065
(0.0223)
0.0196
(0.0167)
Constant 0.3534***
(0.0090)
0.3641***
(0.0103)
0.2912***
(0.0741)
0.7417***
(0.0078)
0.7257***
(0.0089)
0.7019***
(0.0646)
0.0997***
(0.0058)
0.0999***
(0.0066)
0.0225
(0.0482)
R-squared 0.0908 0.0921 0.1331 0.1730 0.1767 0.1939 0.0714 0.0714 0.0858
N 3205 3205 3205 3205 3205 3205 3205 3205 3205
Standard errors in parentheses, * p < 0.10,
** p < 0.05,
*** p < 0.01

27
Table 8: Knowledge of whom to approach regarding grievances
(1) (2) (3)
Grievance Index Grievance Index Grievance Index
Sewa Member 0.1370***
0.0677***
0.0635***
(0.0168) (0.0206) (0.0203)
Sewa Village 0.1105***
0.0270
(0.0191) (0.0240)
After the intervention 0.0837***
(0.0151)
Age 0.0012
(0.0011)
Literate 0.0829***
(0.0198)
Husband age missing 0.0601**
(0.0238)
Husband age -0.0019*
(0.0010)
Husband literacy missing 0.0749*
(0.0431)
Husband literate 0.0207
(0.0253)
Married 0.0414
(0.0309)
Family size 0.0059*
(0.0030)
Child-woman ratio -0.0020
(0.0042)
Own house -0.0418***
(0.0150)
Kutcha house -0.0238*
(0.0130)
Household has toilet 0.1017***
(0.0228)
Scheduled tribe 0.0047
(0.0158)
Constant 0.1749***
0.1569***
0.1161**
(0.0056) (0.0064) (0.0458)
R-squared 0.1232 0.1325 0.1766
N 3205 3205 3205
Standard errors in parentheses, * p < 0.10,
** p < 0.05,
*** p < 0.01