collaborative equity & diversity planning equity commitment leadership collaboration ...
TRANSCRIPT

Collaborative Equity & Diversity Planning
Equity Commitment Leadership Collaboration Integrity
Presented by
Lane ESD Equity Advisory Committee Members

Collaborative Equity & Diversity Planning
Equity Commitment Leadership Collaboration Integrity
Let’s look at the data…
• Student Demographics
• Student Achievement
• Impact Beyond K12
Why is this important?
Equity Commitment Leadership Collaboration Integrity
Why is this important?
Student Demographics

Percentage of All StudentsOregon Public Schools
83.7
2.68.1
3.6 2.1
69.1
3
16.8
4.7
0102030405060708090
White African American Hispanic Asian/PacificIslander
Native American
1997-1998 2007-2008
Source: Oregon Statewide Report Card 2007-2008
Equity Commitment Leadership Collaboration Integrity

Percentage Change in 10 Years Oregon Public Schools
Total Enrollment by Ethnicity
-13.4
18.9
117.7
38
7
-20
0
20
40
60
80
100
120
140
White AfricanAmerican
Hispanic Asian/PacificIslander
NativeAmerican
1997-98 to 2007-08
Source: Oregon Statewide Report Card 2007-2008
Equity Commitment Leadership Collaboration Integrity

Percentage Increase in 10 Years Oregon Public Schools
Special Education, English Language Learners and Economically Disadvantaged
14.2
405
37.7
050
100150200250300350400450
SpecialEducation
English languageLearners
Free/ReducedLunch
Percent Change 1997-98 to 20007-08Source: Oregon Statewide Report Card 2007-2008
Equity Commitment Leadership Collaboration Integrity

As of the 2007-2008 school year …
there were just under 68,000 Oregon public school students for whom English is not their language of origin.
Source: Oregon State Report card 2007-2008
Equity Commitment Leadership Collaboration Integrity

2008 Oregon K-12 top 50 languages in order of highest number of speakers:
Source: Oregon State Report card 2007-2008
EnglishSpanishRussianVietnameseFantiChinese KoreanUkrainianSomaliRomanianDualaHmongChuukeseArabic
JapaneseMarshalleseTagalogGalleganLaoThaiHindiGeezPersianHebrewSamoanOromoFrenchTelugu
GermanTurkishBosnianPunjabiChechenNorth American IndianBurmesePortugueseAmharicUrduDravidianAustralian languagesKarenSouth American Indian
Equity Commitment Leadership Collaboration Integrity

Percent Minority EnrollmentLane County Districts 2001/2009
0
5
10
15
20
25
Eu
ge
ne
Sp
rin
gfi
eld
Be
the
l
So
uth
La
ne
Ju
nc
tio
n C
ity
Fe
rn R
idg
e
Siu
sla
w
Ple
as
an
t H
ill
Ma
ple
ton
Ma
rco
la/C
row
Bla
ch
ly
Mc
ke
nzi
e
Oa
kri
dg
e/L
ow
ell
Cre
sw
ell
2001-02 2008-09
Equity Commitment Leadership Collaboration Integrity
While generally minority enrollment increased…
5 rural districts experienced a decrease in minority enrollment

Minority Students and TeachersOregon Public Schools
1997-2008
16.3
28.9
3.9 5.3
0
5
10
15
20
25
30
35
1997-1998 2007-08
Percent Minority Students Percent Minority Teachers
Source: Oregon Statewide Report Card 2007-2008
Equity Commitment Leadership Collaboration Integrity

Equity Commitment Leadership Collaboration Integrity
Why is this important?
Student Achievement

Oregon Reading: Grade 3Percent Meeting State Standards
88
7570
9079
87
0
20
40
60
80
100
White AfricanAmerican
Hispanic Asian/PacificIslander
AmericanIndian/Alaska
Multi-ethnic
Reading 2007-08
Source: Oregon Statewide Report Card 2007-2008
Equity Commitment Leadership Collaboration Integrity

Oregon Math: Grade 3Percent Meeting State Standards
82
63 60
85
66
78
0102030405060708090
White AfricanAmerican
Hispanic Asian/PacificIslander
AmericanIndian/Alaska
Multi-ethnic
Math 2007-08
Source: Oregon Statewide Report Card 2007-2008
Equity Commitment Leadership Collaboration Integrity

Oregon Math: Grade 10Percent Meeting State Standards
57
2530
68
36
52
0
10
20
30
40
50
60
70
80
White AfricanAmerican
Hispanic Asian/PacificIslander
AmericanIndian/Alaska
Multi-ethnic
Math 2007-08
Source: Oregon Statewide Report Card 2007-2008
Equity Commitment Leadership Collaboration Integrity

Oregon Reading: Grade 10Percent Meeting State Standards
71
40 39
67
53
63
0
10
20
30
40
50
60
70
80
White AfricanAmerican
Hispanic Asian/PacificIslander
AmericanIndian/Alaska
Multi-ethnic
Reading 2007-08
Source: Oregon Statewide Report Card 2007-2008
Equity Commitment Leadership Collaboration Integrity

Oregon Writing: Grade 10Percent Meeting State Standards
61
3733
63
42
57
0
10
20
30
40
50
60
70
White AfricanAmerican
Hispanic Asian/PacificIslander
AmericanIndian/Alaska
Multi-ethnic
Writing 2007-08
Source: Oregon Statewide Report Card 2007-2008
Equity Commitment Leadership Collaboration Integrity
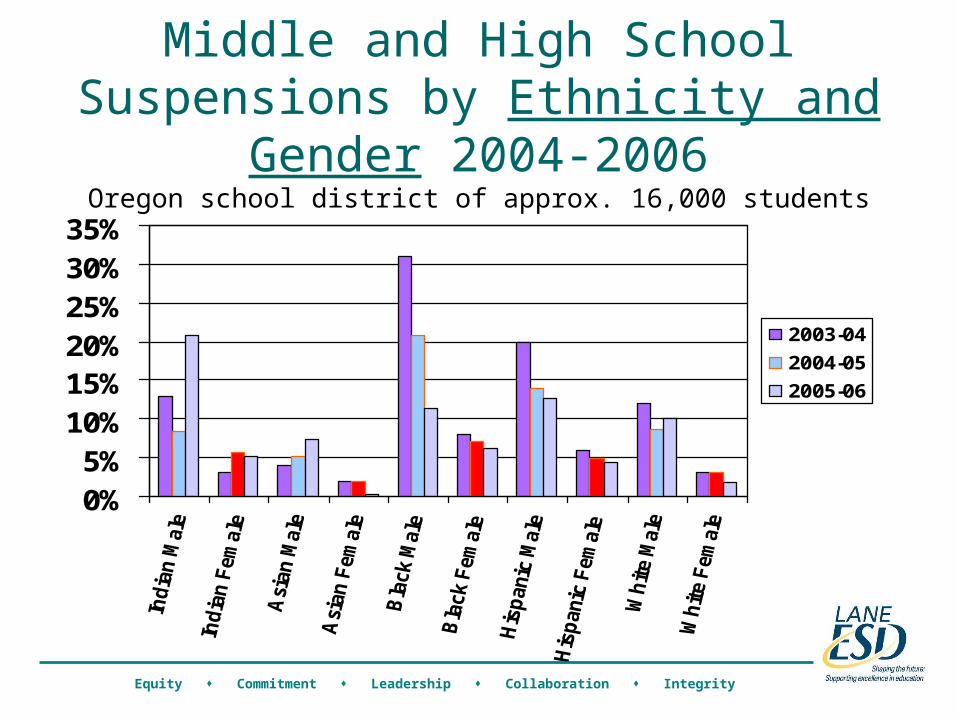
Middle and High School Suspensions by
Ethnicity and Gender 2004-2006Oregon school district of approx. 16,000 students
0%5%
10%15%20%25%30%35%
2003-04
2004-05
2005-06
Equity Commitment Leadership Collaboration Integrity

Middle and High School Suspensions* by Ethnicity 2005-2008
Oregon school district of approx. 16,000 students
*Suspensions defined as out of school suspensions or suspensions pending expulsion.
18Equity Commitment Leadership Collaboration Integrity

2008 Oregon SAT scores
400
450
500
550
600
CriticalReading
Math Writing
White Mexican American
African American Asian American
American IndianSource: Oregon Statewide Report Card 2007-08
Equity Commitment Leadership Collaboration Integrity

Disproportionate representation in TAG Enrollment – Oregon 2007
Percent of TAG students
Percent of All students
White 79.9 69.1Hispanic 5.3 16.8Native American 1.0 2.1Asian/Pacific Islander
8.5 4.7
African American 4.6 3.0Economically disadvantaged
18.3 42.7Source: Oregon State Report card 2007-2008
Equity Commitment Leadership Collaboration Integrity

Percent of Total Enrollment per Ethnicity in Special Education, Oregon 2007-08
19.1
9
22.625.3
11
0
5
10
15
20
25
30
Native American Asian/PacificIslander
AfricanAmerican
Hispanic White
2007-2008Source: Oregon Statewide Report Card 2007-2008 and 2007-2008 IDEA Data Childcount
Equity Commitment Leadership Collaboration Integrity

Graduation Rates by EthnicityOregon 2006-07
71.7
87.2
68.1 64.4
84.8
0
20
40
60
80
100
Native American Asian PacificIslander
AfricanAmerican
Hispanic White
2006-2007Source: Oregon Statewide Report Card 2007-2008
Equity Commitment Leadership Collaboration Integrity

Equity Commitment Leadership Collaboration Integrity
Why is this important?
Impact Beyond K12

100%
44%
62%60%
89%
62%
46%43%
0%
10%
20%
30%
40%
50%
60%
70%
80%
90%
100%
White Only Hispanic Black AIAN Asian NHOPI Other Two or more
Pe
rce
nt
of
Wh
ite
On
ly
Source: U.S. Census Bureau 2005 American Community Survey
Equity Commitment Leadership Collaboration Integrity
Oregon Per Capita Income as Percent of White Only Per Capita Income
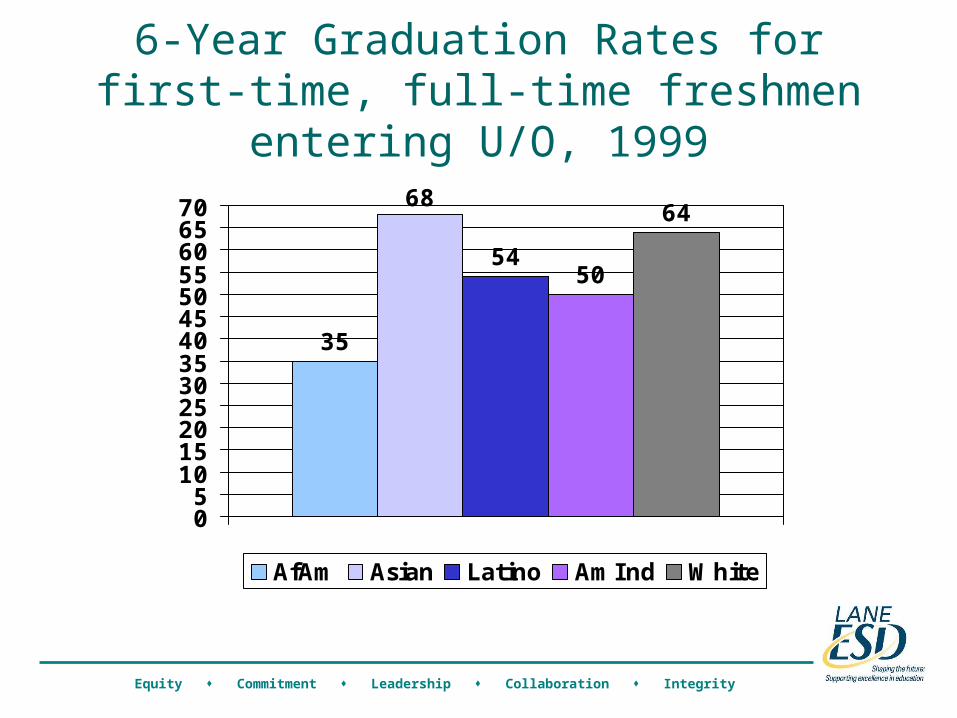
6-Year Graduation Rates for first-time, full-time freshmen entering U/O, 1999
35
68
5450
64
05
10152025303540455055606570
AfAm Asian Latino AmInd White
Equity Commitment Leadership Collaboration Integrity

410
3,188
1,419
487
3,042
1,261
0
500
1,000
1,500
2,000
2,500
3,000
3,500
White AfricanAmerican
Latino
20002006
Incarceration Rates for Male Prisoners Sentenced to More Than One Year in
State or Federal Prison
Source: U.S Dept. of Justice, Bureau of Justice Statistics Bulletin “Prisoners in 2006”
Equity Commitment Leadership Collaboration Integrity
per 10,000 of total US population as of January 1, 2007

Collaborative Equity & Diversity Planning
Equity Commitment Leadership Collaboration Integrity
So….
What’s Happening at Lane ESD and Within Lane County?

Equity Commitment Leadership Collaboration Integrity
What’s Happening… Core Values
Equity
Commitment
Leadership
Collaboration
Integrity
– Hired an Equity Specialist – Formed Equity Committees
• Internal • External
– Created an Equity Plan– Implementing Plan
Lane ESD’s journey …

Hired an Equity Specialist
Equity Commitment Leadership Collaboration Integrity
Position created to…
Accommodate existing professional development needs within the ESD and component districts.
Initially the primary services were to the largest component district

Formed Equity Committees
Equity Commitment Leadership Collaboration Integrity
Equity Advisory Committee (EAC) – “External” Committee
– Membership including community members, representatives from higher education and K12.
– Brings a breadth and depth of experience to advise Lane ESD on Equity Issues.
See “Equity Advisory Committee” on Page 2 of the ESD’s Equity Plan

Equity Commitment Leadership Collaboration Integrity
Internal Committee– Membership includes Lane ESD’s Superintendent,
Executive Management and Equity Specialist
– Provides a “communication hub” to and from the Equity Advisory Committee (EAC)
– Develops strategies for internal staff development
See “Equity Advisory Committee” on Page 2 of the ESD’s Equity Plan
Formed Equity Committees

Created an Equity Plan
Equity Commitment Leadership Collaboration Integrity
Plan Development
– Multi-year Plan – Currently in Phase 1
– Developed jointly by the Equity Advisory Committee and Lane ESD’s Internal Committee
– Focus in Phase 1 – Leadership Development on Equity Issues

Created an Equity Plan
Equity Commitment Leadership Collaboration Integrity
GoalLane ESD is committed to help increase the capacity of our
component districts to implement research-based best practices for all students, thereby eliminating gaps in student achievement and disproportionate representation in special
services, discipline and graduation rates based on race, ethnicity and socio-economic status.
See “Goal” on Page 3 of the ESD’s Equity Plan

Created an Equity Plan
Equity Commitment Leadership Collaboration Integrity
Goal
Multi-Year Plan
Alignment with Local Service Plan
Emphasis on Equitable Education
Leadership Focus
See “Goal” on Page 3 of the ESD’s Equity Plan

Created an Equity Plan
Equity Commitment Leadership Collaboration Integrity
Focus - Phase 1
-District Leadership Development-ESD Staff Development-Integration into ESD’s delivery of Professional Development -Development of Equitable Education Resource Materials -Expanded Opportunities for Community Partnerships
See “Objectives” on Page 3 of the ESD’s Equity Plan

Created an Equity Plan
Equity Commitment Leadership Collaboration Integrity
Developed Common Language
- Multicultural- Student Achievement- Equitable Education
Refer to “Definition of Terms” on Page 8 of the ESD’s Equity Plan

Implementing Plan
Equity Commitment Leadership Collaboration Integrity
- Integration with Consolidation Improvement Plan- Executive Leadership Development
- ESD Leadership Development- Administrator’s Academy- Administrator’s Continuing Education Series
- State Leadership in Race & Ethnicity Guidelines - Language Minority Initiative- Biliteracy Conference

Collaborative Equity & Diversity Planning
Equity Commitment Leadership Collaboration Integrity
So….
We’re Continuing our Journey…
We have much to learn…
And the journey will never be complete!
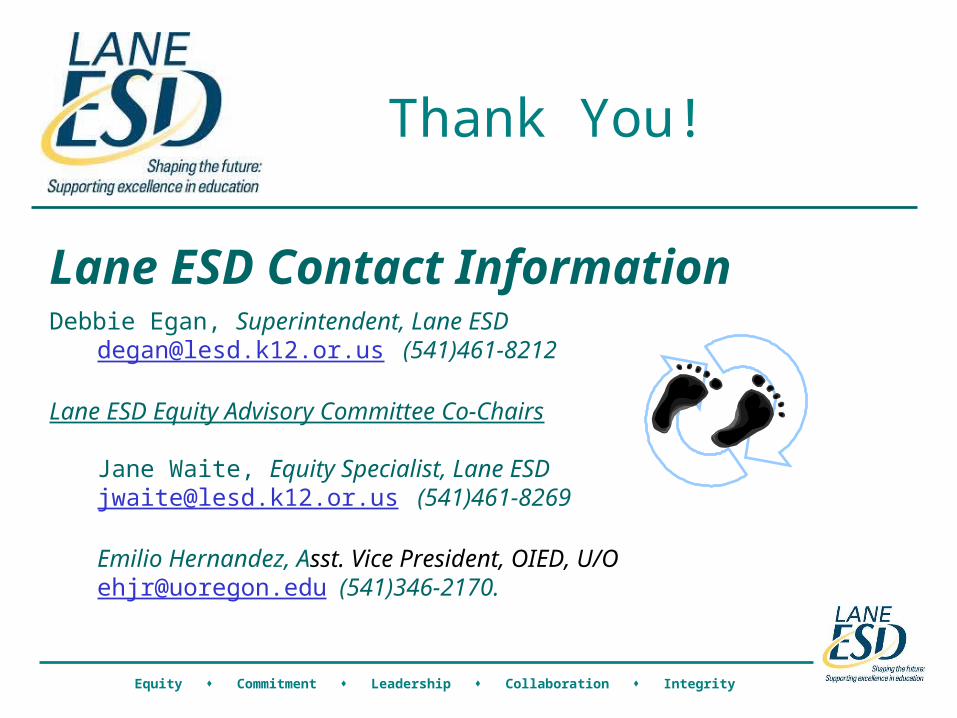
Thank You!
Equity Commitment Leadership Collaboration Integrity
Lane ESD Contact InformationDebbie Egan, Superintendent, Lane ESD
[email protected] (541)461-8212
Lane ESD Equity Advisory Committee Co-Chairs
Jane Waite, Equity Specialist, Lane ESD [email protected] (541)461-8269
Emilio Hernandez, Asst. Vice President, OIED, U/O [email protected] (541)346-2170.
For Discussion…
Equity Commitment Leadership Collaboration Integrity
What are some of the possible factors that lead to the academic achievement gap between African American, Latino, Native American, and economically disadvantaged students and their White and Asian peers.
What strategies do you currently use or could you use that would lead to more predicable outcomes for these students?

For Discussion…
Equity Commitment Leadership Collaboration Integrity
Name and discuss as many reasons you can think of for the disproportionate rate that Latino, African American and Native American children are suspended as a disciplinary action.
What are the academic, social and emotional results of suspensions, especially repeated suspensions?
Now discuss alternatives to suspension and strategies to close the discipline gap with your peers. Be prepared to share your results with the large group.

For Discussion…
Equity Commitment Leadership Collaboration Integrity
What is the connection between Instructional Leadership and closing the gaps between the demographic groups that we have looked at today?
Discuss this connection and describe some strategies you are using now or could use that would improve the quality and impact of your Instructional Leadership on outcomes for students.

For Discussion…
Equity Commitment Leadership Collaboration Integrity
Why is cultural fluency based in educational equity principles a critical leadership skill for school administrators?
Please discuss this in-depth with your peers and come up with some scenarios where cultural fluency skills in administration would make a difference in outcomes for students.

For Discussion…
Equity Commitment Leadership Collaboration Integrity
Name and discuss as many reasons you can think of for why Latino, African American and Native American children are identified for Special Education at rates up to 3 times higher than other student groups.
What are the academic, social and emotional implications of initial mis-identification and the inappropriate entrenchment of students in Special Education?
What are some strategies for eliminating mis-identification and entrenchment. Please discuss and be prepared to share your results with the large group.