cognitive therapy - rehacom.com · please read the entire instruction manual before trying to...
TRANSCRIPT
Screening:Visual Scanning
Cognitive therapy
www.rehacom.com

Cognitive therapy
by Hasomed GmbH
This manual contains information about using the RehaComtherapy system.
Our therapy system RehaCom delivers tested methodologiesand procedures to train brain performance.RehaCom helps patients after stroke or brain trauma with theimprovement on such important abilities like memory, attention,concentration, planning, etc.
Since 1986 we develop the therapy system progressive. It is ouraim to give you a tool which supports your work by technicalcompetence and simple handling, to support you at clinic andpractice.
User assistance information:
Please find help on RehaCom website of your country. In case ofany questions contact us via e-mail or phone (see contactinformation below).
CAUTION Risk of misdiagnosis. Screening for use of RehaCom only. Use standardized tests for diagnostic.
Germany / Europe / Worldw ide:
HASOMED GmbH
Paul-Ecke-Str. 1
D-39114 Magdeburg
Tel: +49 (391) 610 7645
w w w .rehacom.com
USA:
Pearson Clinical Assessment
19500 Bulverde Road, Suite 201
San Antonio, TX 78259-3701
Phone: 1-888-783-6363
w w w .pearsonclinical.com/RehaCom

I
© 2018 HASOMED GmbH
Contents
Dear user,please read the entire instruction manual before trying to operate RehaCom.It's unsafe to start using RehaCom without reading this manual.This manual includes lots of advice, supporting information and hints in order to reachthe best therapy results for the patients.
Table of contents
Disorders of the visual field 1Part 1
................................................................................................................................... 51 Therapy
Description of the test 8Part 2
................................................................................................................................... 91 Instruction
................................................................................................................................... 122 Additional data/instructions
................................................................................................................................... 123 Testing
................................................................................................................................... 134 Data analysis
Bibliography 18Part 3
Index 19

1 Visual Scanning
© 2018 HASOMED GmbH
1 Disorders of the v isual field
The first step in visual information perception under natural conditions is to gain anoverview of the current environment or "stimulus pattern." This "first look" contains aglobal coding of the outside world in the form of a coarsely structured scene,meaning that it already includes the essential information on the spatial structure ofthe scene as the basis for finding and processing relevant stimuli (e.g. objects orpersons - see Fig. 1). The "relevance" of stimuli can be driven either externally by theconspicuousness of a stimulus (or bottom-up activation) or internally by the viewer’sintentions (or top down activation). Usually it is a combination or interaction ofexternally and internally controlled processes, because prior knowledge of thecurrent or expected environment and also intentions are practically always given.
An overview is obtained through the global processing of a scene. Theneurobiological basis for that is represented by modules of the dorsal visualprocessing path, whereby the (right-sided) posterior parietal cortex might play aprominent role (Hochstein & Ahissar, 2002).
Fig. 1: Global and local visual information processing
When getting the overview of a scene, a person can find an object (target stimulus)easily and independently from the number of additional existing stimuli in the scene(distractors) if the difference between the two stimulus classes is sufficiently large.This is an example of parallel search. In general, one glance is enough to quicklydiscover the target stimulus, because it is easily discernible from the other stimuli. Incontrast, a serial search mode is required in case the target stimulus and thedistractors are similar (Müller, 2003). The attention field must be decreasedaccordingly, and the search time increases according to the number of distractors.The parallel search mode can thus be rated as a form of global processing, and theserial mode as form of local visual information processing.
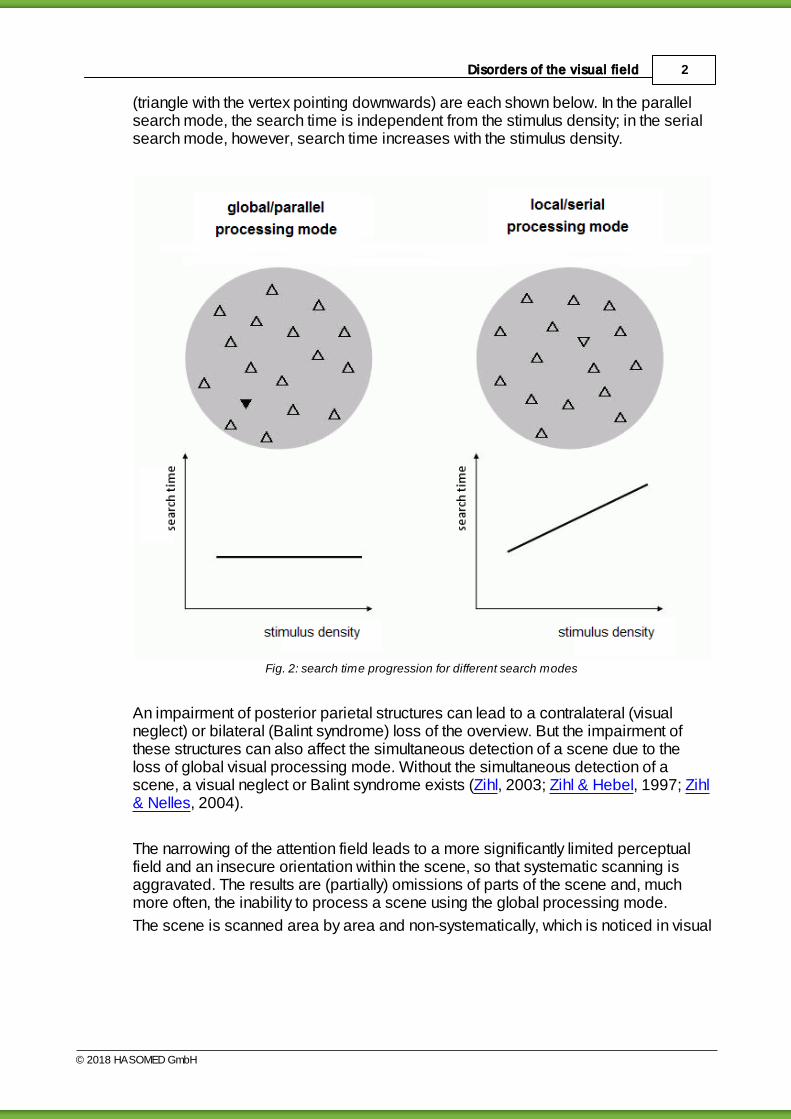
Fig. 2 shows an example of scenes in which the global/parallel or the local/serialprocessing mode is applied. The resulting search times for the target stimulus
2Disorders of the visual field
© 2018 HASOMED GmbH
(triangle with the vertex pointing downwards) are each shown below. In the parallelsearch mode, the search time is independent from the stimulus density; in the serialsearch mode, however, search time increases with the stimulus density.
Fig. 2: search time progression for different search modes
An impairment of posterior parietal structures can lead to a contralateral (visualneglect) or bilateral (Balint syndrome) loss of the overview. But the impairment ofthese structures can also affect the simultaneous detection of a scene due to theloss of global visual processing mode. Without the simultaneous detection of ascene, a visual neglect or Balint syndrome exists (Zihl, 2003; Zihl & Hebel, 1997; Zihl& Nelles, 2004).
The narrowing of the attention field leads to a more significantly limited perceptualfield and an insecure orientation within the scene, so that systematic scanning isaggravated. The results are (partially) omissions of parts of the scene and, muchmore often, the inability to process a scene using the global processing mode.
The scene is scanned area by area and non-systematically, which is noticed in visual

3 Visual Scanning
© 2018 HASOMED GmbH
search tests as a very distinct "slowdown" in reaction times. The true cause for thesignificantly increased reaction time is the complex eye movement patterns that thepatient uses to locate the target stimuli (Zihl, 2000).
Another very common cause for the loss of the overview are homonymous visualfield deficits. In this case, the visual-sensory basis for the simultaneous holisticdetection of the current environment is no longer given. The restriction of theoverview is caused mainly by a narrowing of the attention field. Also, the completeprocessing and cognition of scenes, objects, faces, words, and numbers arehampered.
The uni- or bilateral limitation of the overview especially affects the reading capabilityif the holistic capturing of text material (words, numbers), which is essential forcontinuous and fluent text processing, is no longer possible due to the loss ofparafoveal visual field areas (Zihl, 1995). Depending on the side of the parafovealvisual field loss, patients experience difficulties in finding the beginning or the end ofthe line or a word. The process of capturing and processing a text is then usuallyinterrupted or even canceled. By adding (more or less successfully) words to apartially processed text, the patient usually tries to give the incomplete and partiallyincorrect processed text a meaning (Zihl & Nelles, 2004). Usually both the readingspeed and the reading accuracy are reduced. Even more striking are the difficultiesin processing the numbers, because a control or correction guided by the context israrely possible here. The changes in information processing resulting from thenarrowing of the attention field are also manifested in the eye movement patterns(Zihl & Hebel, 1997).
Homonymous visual field disorders are the most common type of cerebral visualfield disorder, with approximately 75% of all cerebral visual disorder. About 60% ofthe affected people have a reduced overview and approximately 80% have animpaired reading performance - in most cases both are present. Because it cannotbe expected that the visual field loss will spontaneously regress or that a patient willbe able to spontaneously adapt to the vision loss, treatment to reduce the everydaydisability is highly recommended. The acquisition of oculomotor compensatorystrategies (replacement of the visual field by eye movement) has proven to be anefficient, ecologically valid and from cost perspective inexpensive method oftreatment. Oculomotor compensatory strategies can be achieved by systematictraining (Zihl, 2000; Zihl & Nelles, 2004).
Fig. 3 shows a reading excercise of patients with left-sided (LS) or right-sided (RS)parafoveal visual field loss. Note the various omissions and additions, withinterruptions marked using three periods (…).
A headed echelon dispute among the animals developed, which of them was

4Disorders of the visual field
© 2018 HASOMED GmbH
probably the very best. To settle this worthless dispute, the horse said, we want to
appoint the human to be the referee. The human is not affected at all by the echelon
dispute and can therefore judge unbiased and impartial.
LS: A headed echelon dispute ... was among the animals, which of them was the best.
To settle the worthy ... worthless dispute, the horse said, we want to ... appoint an human
to be the judge. The human is not affected at all by the dispute ... echelon dispute and
can therefore judge biased ... unbiased and impartial.
RS: A headed echelon ... echelon dispute among the animals developed, which of them
is ... was probably the very best. To settle this worth ... worthless dispute ... we, the horse
said, .. we want to appoint the human to be the referee ... as the referee. The human is
not ... not affected at all ... by the echelon ... dispute and can therefore judge un ... biases
... without bias and impart ... ial.
Fig. 3: Reading extracts of patients with left-sided (LS) or right-sided (RS) parafoveal visual field loss.
Diagnostics
Homonymous visual field losses can only be determined validly by means ofstandardized perimetric procedures. Other means of testing only allow a roughestimate of the loss. The overview can be checked with the aid of so-calledscreening tests (e.g. cross-out tests, number-connection tests, trail marking tests),where, in addition to the search time, the search strategy (e.g. systematic orunsystematic sequence of the processed characters) should also be determined.For the determination of the reading performance, standardized reading tests withdefined font size and defined length are suitable. For monitoring (e.g. comparison ofbefore and after therapy), parallel forms are required. For the classification of thereading performance, age and educational background have to be considered aswell.
For the appropriate usage of modules to capture the visual search and readingperformance, the following exclusion criteria have to be heeded: insufficient visualacuity, reduced contrast vision, aphasia, pure/sheer alexia, visual neglect,insufficient attention and memory performance, double vision, disorders ofconvergence and accommodation. If an additional peripheral induced visualimpairment (visual field, visual acuity, color vision) is suspected or in case of aninsufficient optical correction, an ophthalmologic examination should be arranged(see Zihl, 2006).
5 Visual Scanning
© 2018 HASOMED GmbH
1.1 Therapy
The main goals of the therapy are (re-)acquisition of a sufficient and rapid overviewand a sufficient reading capability.
A specific approach is required because:
the underlying coping processes are different, and
different eye movement patterns have to be learned as a compensatory strategy.
The goal for the improvement of the overview is to simultaneously increase visualscanning speed when scanning templates and simultaneously improve or maintainhigh accuracy (preferably no omissions) even for complex scenes (e.g. whencombining global and local processing).
The goal for the improvement of the reading capability is to increase reading speedand decrease reading errors.
For both functions, with an increasing difficulty of the task, an increasingapproximation to real scenes or the real reading conditions occurs and thus efficientcompensatory strategies are learned and established as routines. The primaryobjective for the training is to safely establish efficient oculomotor compensatorystrategies for the overview, visual exploration, and reading. Transferring the newlylearned routines to different conditions of everyday life in which different influentialfactors (e.g. tension, pressure to perform) come into play, has to take place in thesesituations.
A critical factor for the efficient acquisition of the described compensatory strategiesis the approach that has to be taught to the patient. Basically the approach is to get aglobal overview before focusing on detailed local analysis. This should thereforedisplay the basic objective of the training and become a secure routine during thecourse of the training phase.
For the exploration training this means that gaining a global overview shouldalways precede the local analysis. The patient should first gain an overview ascompletely as possible before he/she scans a scene for details. This is done bymeans of large changes of sight that should be carried out systematically, e.g. by thelargest possible eye movement to the left and then to the right, regardless of the sideof the loss. In doing so, it is essential to make sure that the eye movement precedesthe head movement, otherwise the eye movement will be insufficient for developingefficient compensatory strategies. The decisive factor is thus the direction of viewand not the direction of the head.

6Disorders of the visual field
© 2018 HASOMED GmbH
Fig. 4: Eye movements of a patient with hemianopsia
Figure 4 shows a side by side comparison of the eye movements for a healthyperson and for a patient with hemianopsia who is going through exploration trainingand reading therapy. The eye movement pattern of the patient before (P-before) andafter (P-after) the exploration training to improve the overview (left: scanning of asimple dot pattern), as well as before and after the reading practice (right: reading ofa short text with 30 words in 5 lines) can be seen. The exploration training (visualsearch task) was started 7 weeks after the onset of the hemianopsia; the trainingfrequency was about 9 sessions, 45 minutes each. The reading practice wasrealized after the exploration training - it included 16 sessions, 45 minutes each.Note the systematic scanning of the stimulus pattern and fewer points of fixation(dots) and saccades after the exploration training, as well as the "normalization" ofthe reading movement after the reading practice, especially regarding the fixationduration (longer duration illustrated by arrows in P-before). After the readingpractice, numerous regressive saccades (illustrated by arrows in P-after) werefound, meaning the patient’s focus is led back to an already read word or word part.
Search times in the exploration task: N: 7.4 s, P-before: 24.6 s, P-after: 11.2 s (noomissions before and after the training).
Reading: N: 172 words per minute (wpm), P-before: 64 wpm, P-after: 137 wpm.The follow-up after 8 weeks showed similar results for the exploration task. The

7 Visual Scanning
© 2018 HASOMED GmbH
reading capability was 156 wpm (the patient was asked to read regularly at homeand to continue to practice the new reading strategy).

8Description of the test
© 2018 HASOMED GmbH
2 Description of the test
For the Visual Scanning screening module, the patient is supposed to detect aspecific character (referred to as target stimulus) in a field of other characters(referred to as distractors) on the screen. In the test, the target stimulus is the letter"E," while the letter "F" is used for all distractors. If a target stimulus is present, theleft arrow has to be pressed. If no target stimulus is present, the right arrow has to bepressed.
The screening module begins with instructions and a short exercise of 10 items,helping the patient understand what to do. The exercise can be repeated if needed.
After the exercise, the screening module continues with the test, which consists of 10tasks with 20 items each. The tasks are divided into two sets: the first 5 tasks useparallel search mode, the last ones use serial search mode.
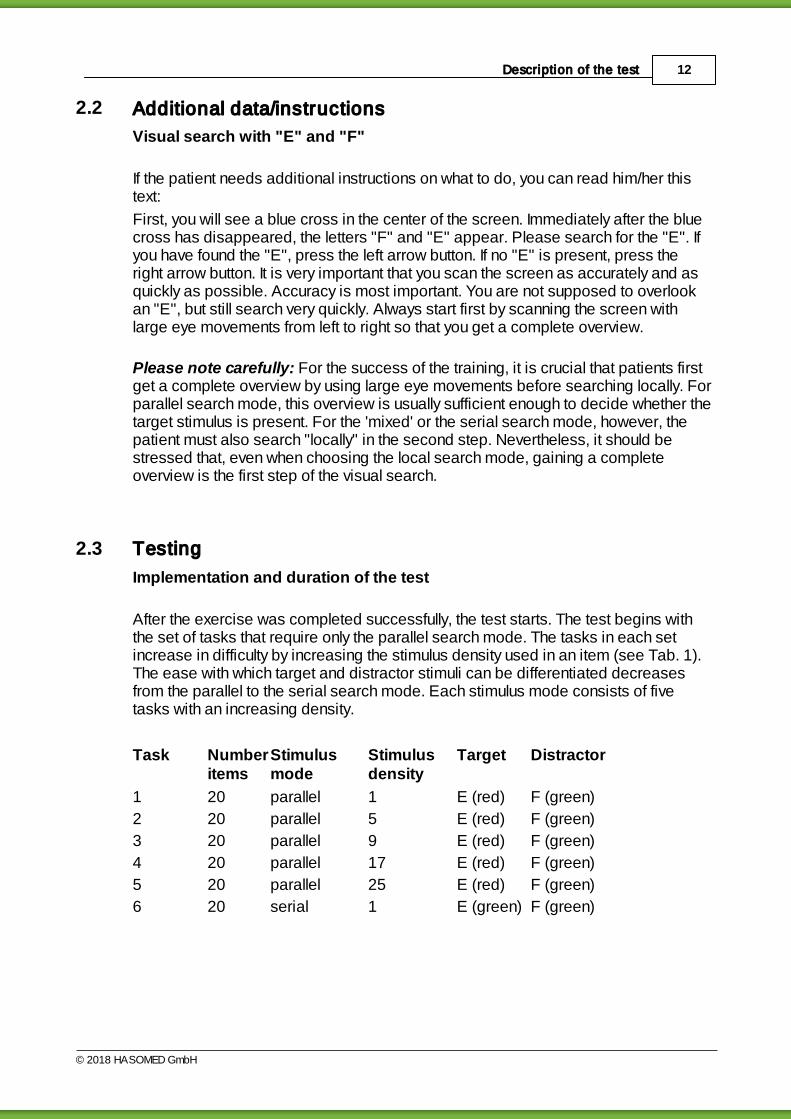
Before every item, an interstimulus interval consisting of a black screen with a bluecross is shown for a short time (see Fig. 5). The patient shall focus on the crossduring the interval.
Fig. 5: Interstimulus interval
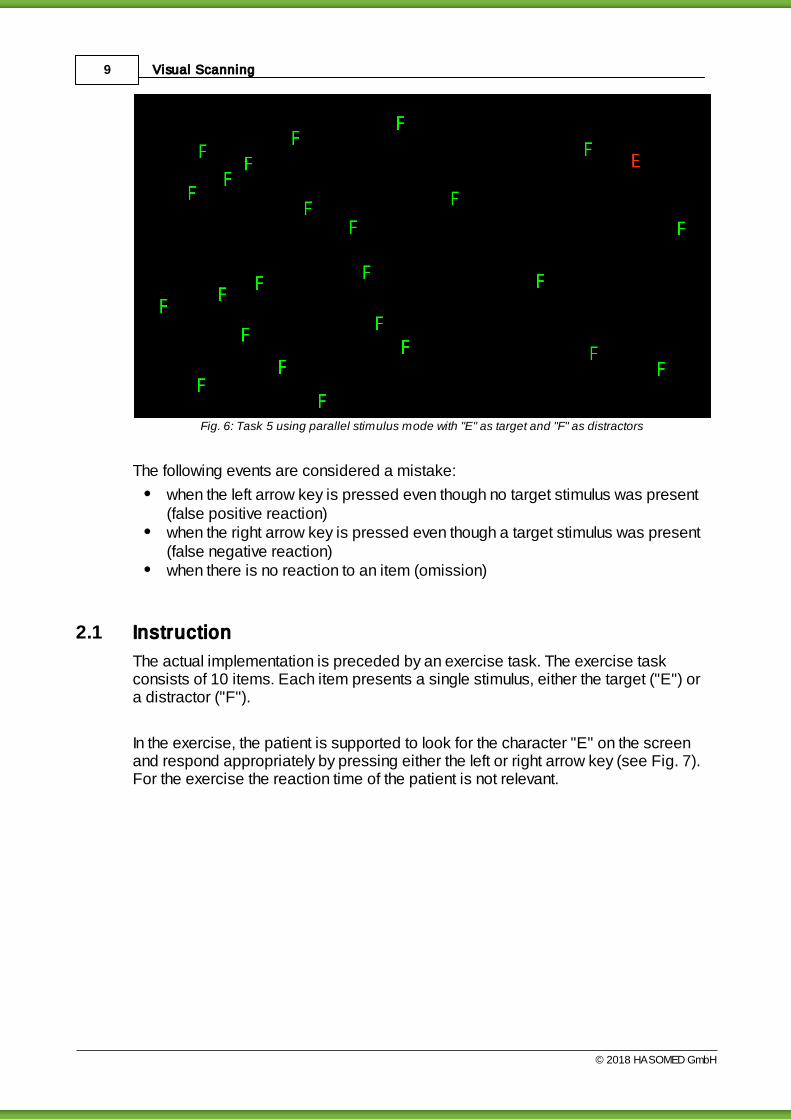
After the interval, the item’s stimuli are displayed on the screen. For each set oftasks in the test, the number of distractors increases. (see Fig. 6)
9 Visual Scanning
© 2018 HASOMED GmbH
Fig. 6: Task 5 using parallel stimulus mode with "E" as target and "F" as distractors
The following events are considered a mistake:
when the left arrow key is pressed even though no target stimulus was present(false positive reaction)when the right arrow key is pressed even though a target stimulus was present(false negative reaction)when there is no reaction to an item (omission)
2.1 Instruction
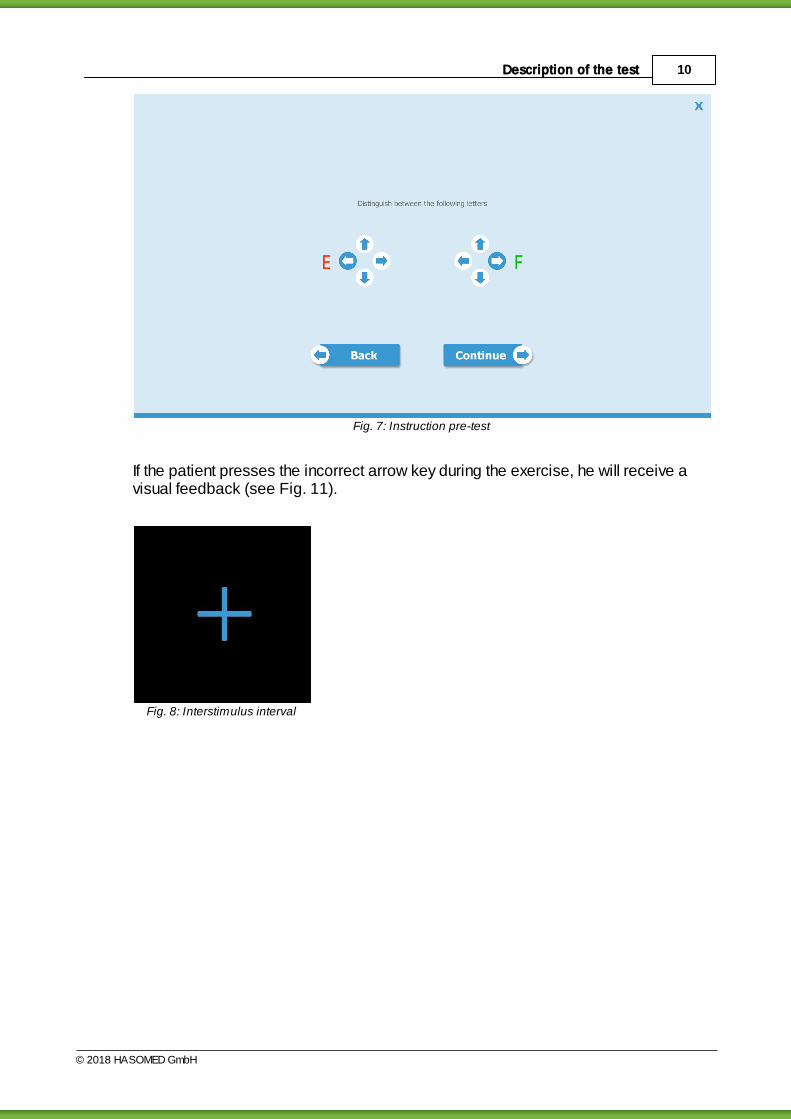
The actual implementation is preceded by an exercise task. The exercise taskconsists of 10 items. Each item presents a single stimulus, either the target ("E") ora distractor ("F").
In the exercise, the patient is supported to look for the character "E" on the screenand respond appropriately by pressing either the left or right arrow key (see Fig. 7).For the exercise the reaction time of the patient is not relevant.
10Description of the test
© 2018 HASOMED GmbH
Fig. 7: Instruction pre-test
If the patient presses the incorrect arrow key during the exercise, he will receive avisual feedback (see Fig. 11).
Fig. 8: Interstimulus interval

11 Visual Scanning
© 2018 HASOMED GmbH
Fig. 9: Target stimulus
Fig. 10: Distractor
Fig. 11: Feedback after wrongreaction during the exercise
After finishing the exercise, the patient has the option to repeat it. Else the test willstart. During the test, there are no messages when the patient responds to an itemincorrectly.
12Description of the test
© 2018 HASOMED GmbH
2.2 Additional data/instructions
Visual search with "E" and "F"
If the patient needs additional instructions on what to do, you can read him/her thistext:
First, you will see a blue cross in the center of the screen. Immediately after the bluecross has disappeared, the letters "F" and "E" appear. Please search for the "E". Ifyou have found the "E", press the left arrow button. If no "E" is present, press theright arrow button. It is very important that you scan the screen as accurately and asquickly as possible. Accuracy is most important. You are not supposed to overlookan "E", but still search very quickly. Always start first by scanning the screen withlarge eye movements from left to right so that you get a complete overview.
Please note carefully: For the success of the training, it is crucial that patients firstget a complete overview by using large eye movements before searching locally. Forparallel search mode, this overview is usually sufficient enough to decide whether thetarget stimulus is present. For the 'mixed' or the serial search mode, however, thepatient must also search "locally" in the second step. Nevertheless, it should bestressed that, even when choosing the local search mode, gaining a completeoverview is the first step of the visual search.
2.3 Testing
Implementation and duration of the test
After the exercise was completed successfully, the test starts. The test begins withthe set of tasks that require only the parallel search mode. The tasks in each setincrease in difficulty by increasing the stimulus density used in an item (see Tab. 1).The ease with which target and distractor stimuli can be differentiated decreasesfrom the parallel to the serial search mode. Each stimulus mode consists of fivetasks with an increasing density.
Task Numberitems
Stimulusmode
Stimulusdensity
Target Distractor
1 20 parallel 1 E (red) F (green)
2 20 parallel 5 E (red) F (green)
3 20 parallel 9 E (red) F (green)
4 20 parallel 17 E (red) F (green)
5 20 parallel 25 E (red) F (green)
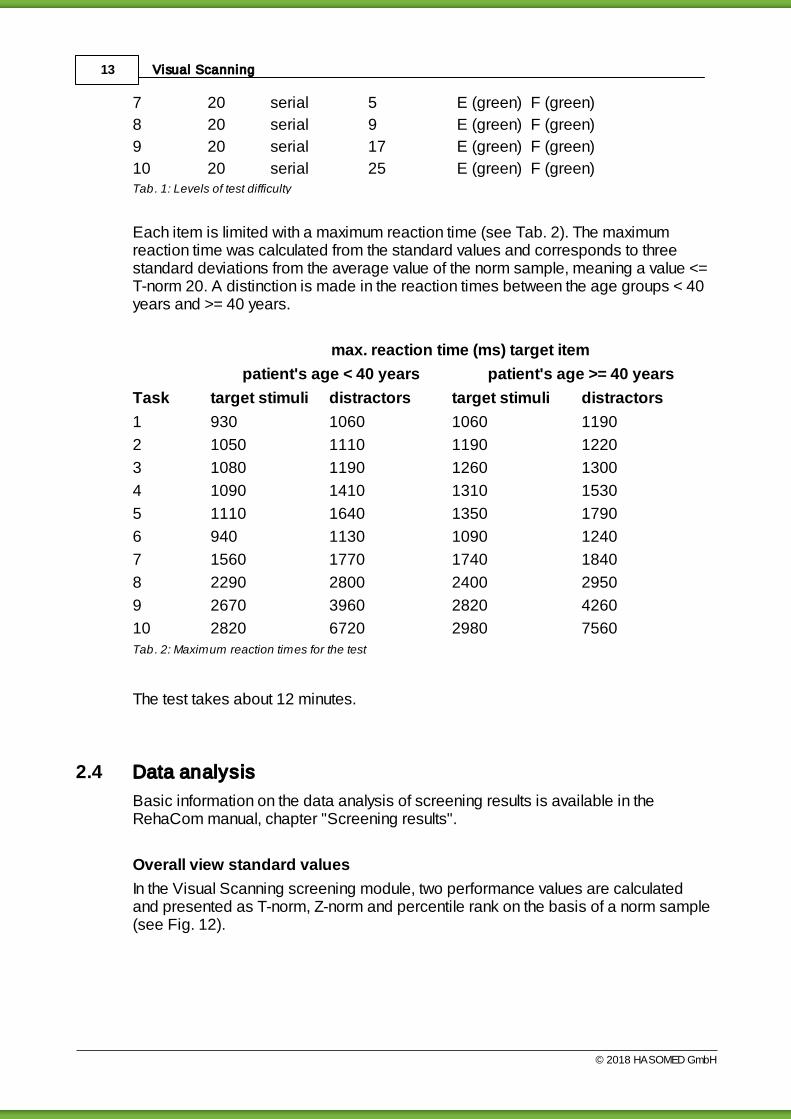
6 20 serial 1 E (green) F (green)
13 Visual Scanning
© 2018 HASOMED GmbH
7 20 serial 5 E (green) F (green)
8 20 serial 9 E (green) F (green)
9 20 serial 17 E (green) F (green)
10 20 serial 25 E (green) F (green)Tab. 1: Levels of test difficulty
Each item is limited with a maximum reaction time (see Tab. 2). The maximumreaction time was calculated from the standard values and corresponds to threestandard deviations from the average value of the norm sample, meaning a value <=T-norm 20. A distinction is made in the reaction times between the age groups < 40years and >= 40 years.
max. reaction time (ms) target item
patient's age < 40 years patient's age >= 40 years
Task target stimuli distractors target stimuli distractors
1 930 1060 1060 1190
2 1050 1110 1190 1220
3 1080 1190 1260 1300
4 1090 1410 1310 1530
5 1110 1640 1350 1790
6 940 1130 1090 1240
7 1560 1770 1740 1840
8 2290 2800 2400 2950
9 2670 3960 2820 4260
10 2820 6720 2980 7560Tab. 2: Maximum reaction times for the test
The test takes about 12 minutes.
2.4 Data analysis
Basic information on the data analysis of screening results is available in theRehaCom manual, chapter "Screening results".
Overall view standard values
In the Visual Scanning screening module, two performance values are calculatedand presented as T-norm, Z-norm and percentile rank on the basis of a norm sample(see Fig. 12).
14Description of the test
© 2018 HASOMED GmbH
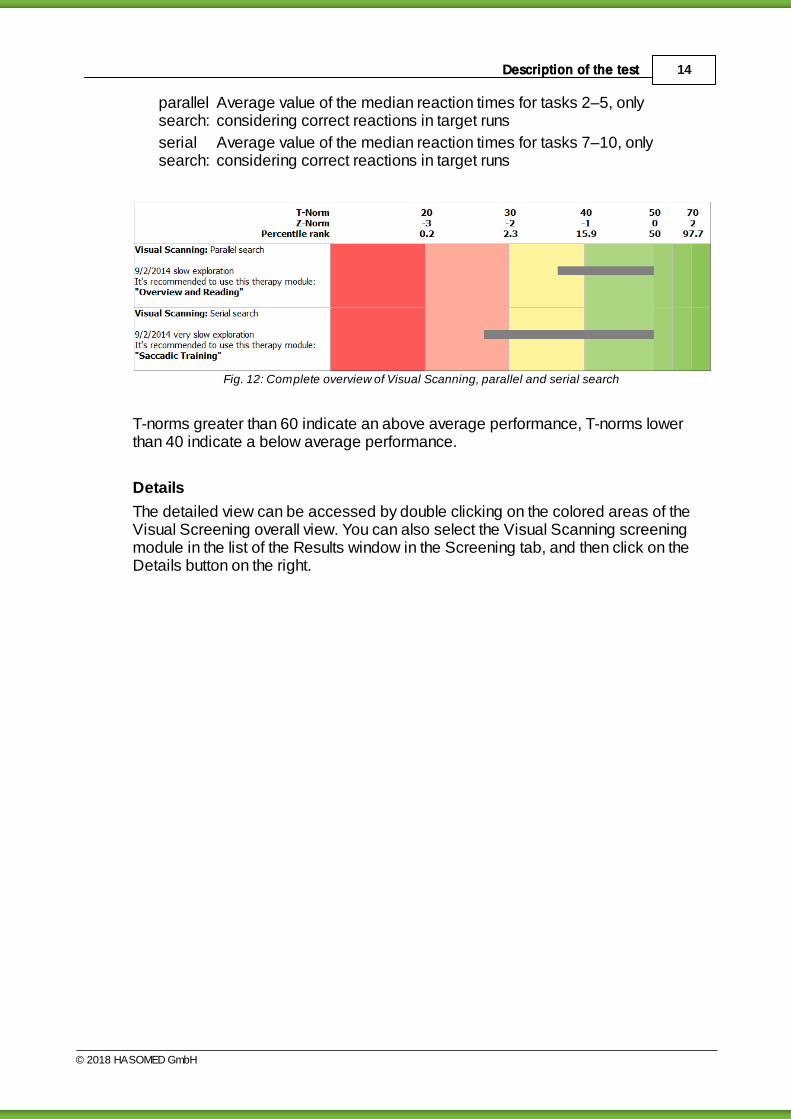
parallelsearch:
Average value of the median reaction times for tasks 2–5, onlyconsidering correct reactions in target runs
serialsearch:
Average value of the median reaction times for tasks 7–10, onlyconsidering correct reactions in target runs
Fig. 12: Complete overview of Visual Scanning, parallel and serial search
T-norms greater than 60 indicate an above average performance, T-norms lowerthan 40 indicate a below average performance.
Details
The detailed view can be accessed by double clicking on the colored areas of theVisual Screening overall view. You can also select the Visual Scanning screeningmodule in the list of the Results window in the Screening tab, and then click on theDetails button on the right.
15 Visual Scanning
© 2018 HASOMED GmbH
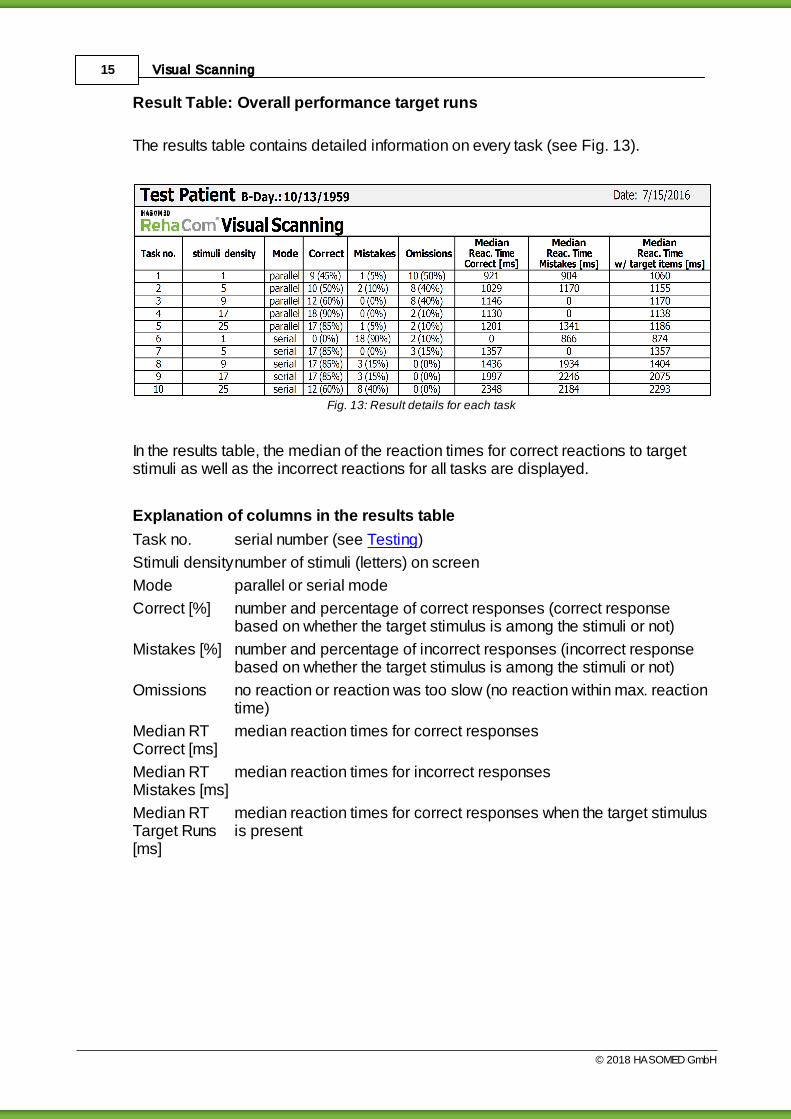
Result Table: Overall performance target runs
The results table contains detailed information on every task (see Fig. 13).
Fig. 13: Result details for each task
In the results table, the median of the reaction times for correct reactions to targetstimuli as well as the incorrect reactions for all tasks are displayed.
Explanation of columns in the results table
Task no. serial number (see Testing)
Stimuli densitynumber of stimuli (letters) on screen
Mode parallel or serial mode
Correct [%] number and percentage of correct responses (correct responsebased on whether the target stimulus is among the stimuli or not)
Mistakes [%] number and percentage of incorrect responses (incorrect responsebased on whether the target stimulus is among the stimuli or not)
Omissions no reaction or reaction was too slow (no reaction within max. reactiontime)
Median RTCorrect [ms]
median reaction times for correct responses
Median RTMistakes [ms]
median reaction times for incorrect responses
Median RTTarget Runs[ms]
median reaction times for correct responses when the target stimulusis present

16Description of the test
© 2018 HASOMED GmbH
Bar chart: course reactions
Fig. 14 contains the number of correct reactions and the omissions for each task.
Fig. 14: Side-by-side comparison of correct reactions and omissions per task
In Fig. 14, the median reaction times for the correct and incorrect reactions in eachtask are displayed.
Fig. 15: Side-by-side comparison of median reaction times for correct reactions and for mistakes per task
The data for all items with a target stimulus is provided for each quadrant of thescreen (see Fig. 16). The data is further divided between the parallel and serialstimulus mode.

17 Visual Scanning
© 2018 HASOMED GmbH
Fig. 16: Data displayed in quadrants
18Bibliography
© 2018 HASOMED GmbH
3 Bibliography
Hochstein, S., & Ahissar, M. (2002). View from the top: Hierarchies and reversehierarchies in the visual system. Neuron, 36, 791–804.
Müller, H. (2003) Funktionen und Modelle der selektiven Aufmerksamkeit. In H.-O.Karnath & P. Thier (eds.), Neuropsychologie (pp. 245–267). Berlin, Germany:Springer.
Zihl, J. (1995). Eye movement patterns in hemianopic dyslexia. Brain, 118, 891–912.
Zihl, J. (2000). Rehabilitation of visual disorders after brain injury. Hove, England:Psychology Press.
Zihl, J. (2003) Zerebrale Blindheit und Gesichtsfeldausfälle. In H.-O. Karnath & P.Thier (eds.), Neuropsychologie (pp. 73–83). Berlin, Germany: Springer.
Zihl, J. (2006). Zerebrale Sehstörungen. In H.-O. Karnath, W. Hartje, & W. Ziegler(eds.), Kognitive Neurologie (pp. 1–18). Stuttgart, Germany: Thieme.
Zihl, J., & Hebel, N. (1997). Patterns of oculomotor scanning in patients withunilateral posterior parietal or frontal lobe damage. Neuropsychologia, 35, 893–906.
Zihl, J., & Nelles, G. (2004). Rehabilitation von zerebralen Sehstörungen. In G. Nelles(ed.), Neurologische Rehabilitation, (pp. 129–140). Stuttgart, Germany: Thieme.

Visual Scanning19
© 2018 HASOMED GmbH
Index
- A -additional data 12
attention field 1
- B -Balint- syndrome 1
barchart 13
basic information 1
bibliography 18
blue cross 8, 9, 12
button 8
- C -character 8, 9
combination 1
compensatory strategies 1
compensatory strategy 5
complete overview 12
coping process 1
critical factor 5
- D -data analysis 13
deflector 1
description of the test 8
details 13
diagnostics 1
distractor 1, 8
duration 12
- E -exclusion criteria 1
exercise 9, 12
exploration training 5
eye movement pattern 1
eye movements 12
eye saccades 5
- F -first look 1
- G -global processing 1
- H -head movement 5
holistic capturing 1
holistic detection 1
- I -implementation 9, 12
information perception 1
information processing 1
instruction 9
instructions 12
interaction 1
interstimulus interval 8, 9
- L -limitation 1
- M -max. reaction time 12
median RT 13
mistakes 9, 13
monitoring 1
- N -narrowing 1
non target 8
non-target 12
non-target run 9
norm sample 13
note 12
number 8
Index 20
Manual release date: 05.07.2018
- O -omissions 13
orientation 1
overall view 13
overview 1, 5
- P -parallel 12
parallel search 13
parallel search mode 1
percentile ranks 13
perceptual field 1
pop out 1
pre-test 9
processing mode 1
processing path 1
- R -rapid overview 5
reaction time 9
reading accuracy 1
reading capability 1, 5
reading performance 1
reading practice 5
reading speed 1
relevance 1
restriction 1
result Table 13
- S -scan 12
scanning 1
scanning speed 5
search strategy 1
search time 1
serial 12
serial search 13
serial search mode 1
slowdown 1
stimuli density 13
stimulus density 1
stimulus modes 12
stimulus pattern 1
- T -target 8, 12
target run 9
target stimulus 1, 8, 9
task 8
testing 12
text processing 1
therapy 5
time requirement 1
T-norm 13
- V -variation 8
varieties 8
visual field areas 1
visual field defect 1
visual information perception 1
visual neglect 1
visual scanning 5
visual search 12
visual search test 1
- Z -Z-norm 13