code of practice for research data usage metrics release 1 · code of practice for research data...
TRANSCRIPT

1
Code of Practice for Research Data Usage Metrics Release 1 Martin Fenner1, Daniella Lowenberg2, Matt Jones3, Paul Needham4, Dave Vieglais5, Stephen
Abrams2, Patricia Cruse1 and John Chodacki2 on behalf of the Make Date Count Project
1 DataCite, Hannover, Germany 2 California Digital Library, Oakland, CA, USA 3 National Center for Ecological Analysis and Synthesis, Santa Barbara, CA, USA 4 Cranfield University, Cranfield, United Kingdom 5 Biodiversity Research Institute, University of Kansas, Lawrence, KS, USA Corresponding author:
Martin Fenner1, email: [email protected]
Funding Disclosure:
This work was funded by a grant from the Alfred P. Sloan Foundation. This funding body had no
role in the design of the report, or in writing the manuscript.
Abstract The Code of Practice for Research Data Usage Metrics standardizes the generation and
distribution of usage metrics for research data, enabling for the first time the consistent and
credible reporting of research data usage. This is the first release of the Code of Practice and the
recommendations are aligned as much as possible with the COUNTER Code of Practice Release
5 that standardizes usage metrics for many scholarly resources, including journals and books.
With the Code of Practice for Research Data Usage Metrics data repositories and platform
providers can report usage metrics following common best practices and using a standard report
format. This is an essential step towards realizing usage metrics as a critical component in our
understanding of how publicly available research data are being reused. This complements
ongoing work on establishing best practices and services for data citation.
PeerJ Preprints | https://doi.org/10.7287/peerj.preprints.26505v1 | CC BY 4.0 Open Access | rec: 11 Feb 2018, publ: 11 Feb 2018
2
Executive Summary Usage metrics for research data are seen as an important indicator of impact by researchers and
other stakeholders (Costas, Meijer, Zahedi, & Wouters, 2013, Kratz & Strasser, 2015), second
only to data citations. They currently can’t fill that role due to the lack of standardization on how
usage metrics should be collected and reported.
The Code of Practice for Research Data Usage Metrics standardizes the generation and
distribution of usage metrics for research data. This enables data repositories and platform
providers to produce consistent and credible usage metrics for research data, and helps data
repositories, libraries, funders and other stakeholders to understand and demonstrate the reuse of
research data.
This is the first release of the Code of Practice for Research Data Usage Metrics. The
recommendations are aligned as much as possible with the COUNTER Code of Practice Release
5 (COUNTER Code of Practice Release 5, 2017) that standardizes usage metrics for many
scholarly resources, including journals and books. Many definitions, processing rules, and
reporting recommendations apply to research data in the same way as they apply to other
scholarly resources.
The dataset (a collection of data published or curated by a single agent) is the content item for
which we report usage in terms of investigations (i.e. how many times metadata are accessed)
and requests (i.e. how many times data are retrieved, a subset of all investigations).
Investigations and requests for components of the dataset can be reported in the same way as
other scholarly resources under COUNTER Code of Practice Release 5, in that the total number
of investigations or requests are summed across the components of a given dataset. Sessions
allow the differentiation between total investigations and requests of a dataset (in which all
accesses are summed) and unique investigations and requests (in which accesses are only
counted once per dataset if they are within a unique user-session), aligned with the reporting for
content items in COUNTER Code of Practice Release 5.
Some aspects of the processing and reporting of usage data are unique to research data, and the
Code of Practice for Research Data Usage Metrics thus at times needs to deviate from the
COUNTER Code of Practice Release 5 and specifically address them. This starts with the main
use cases for data usage metrics reporting: subscription access to research data is uncommon,
therefore breaking down the usage data by institution accessing the research data is less relevant.
PeerJ Preprints | https://doi.org/10.7287/peerj.preprints.26505v1 | CC BY 4.0 Open Access | rec: 11 Feb 2018, publ: 11 Feb 2018
3
While there is interest in understanding the geographic distribution of investigations and requests
to research data, these usage data can be reported at a coarser granularity (by country rather than
by institution) and can be aggregated and openly shared.
COUNTER Code of Practice Release 5 focusses usage reporting on human users and filters out
all known robots, crawlers, and spiders. While the same exclusion list should be applied to
research data, there is significant legitimate usage in which humans employ scripts and other
automated tools in the normal course of research. The Code of Practice for Research Data Usage
Metrics defines how usage metrics from these automated tools used can be reported.
Versioning is much more common and complex with research data compared to most other
scholarly resources, and the Code of Practice for Research Data Usage Metrics addresses this.
We recommend reporting usage metrics for each specific version, as well as the combined usage
for all versions. This first release of the Code of Practice for Research Data Usage Metrics will
not fully address the particular challenges associated with reporting usage for dynamically
changing datasets.
Research data can be retrieved in a wide variety of file formats, different from text-based
scholarly resources. For the Code of Practice for Research Data Usage Metrics we will not
break down requests by file format. We will include the data volume transferred as part of the
reporting, since the variations are much greater than for other scholarly resources. Reporting
request data transfer volume in addition to the number of requests and investigations also helps
with understanding differences between data repositories with regards to how data are packaged
and made available for retrieval.
The Code of Practice for Research Data Usage Metrics enables the reporting of usage metrics
by different data repositories following common best practices, and thus is an essential step
towards realizing usage metrics to facilitate understanding how publicly available research datas
are being reused. This complements ongoing work on establishing best practices and services for
data citation (Burton, Fenner, Haak, & Manghi, 2017).
PeerJ Preprints | https://doi.org/10.7287/peerj.preprints.26505v1 | CC BY 4.0 Open Access | rec: 11 Feb 2018, publ: 11 Feb 2018
4
Conventions This Code of Practice for Research Data is implemented using the following convention:
The keywords “MUST”, “MUST NOT”, “REQUIRED”, “RECOMMENDED”, and
“OPTIONAL” in this document are to be interpreted as described in RFC 2119 (“RFC 2119:
Key words for use in RFCs to Indicate Requirement Levels,” 1997).
Note that the force of these words is modified by the requirement level of the document in which
they are used.
1. “MUST” (or “REQUIRED”) means that the definition is an absolute requirement of the
specification.
2. “MUST NOT” means that the definition is an absolute prohibition of the specification.
3. “RECOMMENDED” means that there may be valid reasons in certain circumstances to
ignore a particular item, but the full implications should be understood and carefully
weighed before choosing a different course.
4. “NOT RECOMMENDED” means that there may be valid reasons in certain
circumstances when the particular behaviour is acceptable or even useful, but the full
implications should be understood, and the case carefully weighed before implementing
any behavior described with this label.
Content providers implementing the Code of Practice for Research Data Usage Metrics who feel
they have a valid disagreement with a requirement of the code are requested to contact the
authors and ask for clarification on interpretation of the code.
Terms appearing in italics represent variables that will be replaced with appropriate values at
implementation time, for example “Error_Number : Error_Description” might resolve to “3040 :
Partial Usage Available”.
PeerJ Preprints | https://doi.org/10.7287/peerj.preprints.26505v1 | CC BY 4.0 Open Access | rec: 11 Feb 2018, publ: 11 Feb 2018

5
1. Introduction This is the first version of a Code of Practice for Research Data. The purpose of this report is to
enable data repositories and platform providers to produce consistent, comparable, and credible
usage metrics for research data. This first release of the Code of Practice for Research Data
Usage Metrics has been kept intentionally narrow in scope to focus on the dataset level and
avoid creating unnecessary hurdles to adoption.
1.1. General Information
1.1.1 Purpose The purpose of the Code of Practice for Research Data Usage Metrics is to facilitate the
recording, exchange, and interpretation of online usage data by establishing open standards and
protocols for the provision of content-provider-generated usage statistics that are consistent,
comparable, and credible.
1.1.2 Scope This Code of Practice for Research Data Usage Metrics is aligned with the COUNTER Code of
Practice Release 5 and provides a framework for recording and exchanging online usage
statistics for research data at an international level. It covers the following areas: data elements to
be measured; definitions of these data elements; content and format of usage reports;
requirements for data processing; and guidelines to avoid duplicate counting.
1.1.3 Relationship to COUNTER Code of Practice Release 5 Developed by members from the research data management community (RDM) in close
coordination with COUNTER, this Code of Practice for Research Data follows the COUNTER
Code of Practice Release 5 (COUNTER Code of Practice Release 5, 2017) recommendations as
much as possible (where relevant) and deviates from them only when necessary.
There are different use cases and practices between research data and the majority of scholarly
resources. For example, research data does not need to be reported at the institutional level, but
geographic aggregation may be important. Another significant difference is the need for
aggregation of usage across components for all versions of a dataset. It is common practice for
research data to be versioned, and we recommend reporting the usage data for each specific
version and the combined usage for all versions.
PeerJ Preprints | https://doi.org/10.7287/peerj.preprints.26505v1 | CC BY 4.0 Open Access | rec: 11 Feb 2018, publ: 11 Feb 2018
6
The first release of the Code of Practice for Research Data Usage Metrics only describes
reporting of usage at the dataset level. For future releases, reporting usage statistics for dataset
components will be considered based on community feedback. Following the COUNTER Code
of Practice Release 5, standard usage statistics are not reported by format distribution, e.g., no
separate numbers for downloads in CSV and XLSX formats.
Download volume (i.e., file size) can be reported. There are widely varying practices in the
research data community regarding the granularity and structure of datasets, components, and
collections. Reporting download volume makes it easier to compare usage for research data
packaged into datasets with different granularity.
Geolocation information and country are reported, but not IP addresses. For large countries (e.g.
United States) reporting at the state or province level may be enabled. Reporting of geolocation
information helps to better understand usage for the same datasets hosted in multiple locations,
and for datasets where usage is dependent upon the location of the user, e.g., datasets describing
research in a particular geolocation.
Usage metrics are reported for each specific version of a dataset, as well as the combined usage
for all versions. Usage metrics are only reported for individual datasets. In this version of the
Code of Practice for Research Data Usage Metrics the is no report format for reporting usage for
collections of datasets, for example all datasets in a data repository.
1.1.4 Strategy The Code of Practice for Research Data Usage Metrics will evolve in response to the demands
of the international library, data management, and content provider communities. The Code of
Practice for Research Data Usage Metrics is continually under review; feedback on its scope
and application are actively sought from all interested parties.
1.1.5 Governance The Code of Practice for Research Data Usage Metrics is developed by the Make Data Count
project (Make Data Count, 2017), in close collaboration with Counter Online Metrics
(COUNTER) (Project COUNTER, 2002), a non-profit organization that maintains the
COUNTER Code of Practice.
PeerJ Preprints | https://doi.org/10.7287/peerj.preprints.26505v1 | CC BY 4.0 Open Access | rec: 11 Feb 2018, publ: 11 Feb 2018

7
1.1.6 Definitions This Code of Practice for Research Data Usage Metrics provides definitions of data elements
and other terms that are relevant not only to the usage reports specified in this document, but also
to other reports that content providers may wish to generate. Every effort has been made to use
existing COUNTER, ISO, NISO, etc. definitions where appropriate, and these sources are cited
(see References and Appendix A). The following key definitions are used by the Code of
Practice for Research Data Usage Metrics:
● Dataset: An aggregation of data, published or curated by a single agent, and available for
access or download in one or more formats, with accompanying metadata (Dekkers &
Isaac, 2018). A dataset is a subtype of a COUNTER content item. Synonymous term:
data package.
● Component: Part of the data available for a dataset that can be accessed or downloaded
individually. Aligns with a COUNTER component. Synonymous terms: data file, data
granule.
● Collection: A curated aggregation of datasets. Related terms: catalog, repository.
● Version: Multiple versions of a dataset are defined as significant changes to the content
and/or metadata, associated with changes in one or more components, and that would
result in changes to fixity attributes of the components.
1.1.7 Versions The Code of Practice for Research Data Usage Metrics will be extended and upgraded as
necessary, based on input from the communities it serves. Future versions might be integrated
into the COUNTER Code of Practice. A continuous maintenance process will allow the Code of
Practice for Research Data Usage Metrics to evolve over time minimizing the need for major
version changes.
1.1.8 Auditing and Code of Practice for Research Data Usage Metrics Compliance No content provider following the Code of Practice for Research Data Usage Metrics has been
audited at the time of this first release of the Code of Practice for Research Data Usage Metrics.
While we expect the auditing process for research data usage reporting to be similar to audits in
PeerJ Preprints | https://doi.org/10.7287/peerj.preprints.26505v1 | CC BY 4.0 Open Access | rec: 11 Feb 2018, publ: 11 Feb 2018
8
the context of the COUNTER Code of Practice Release 5, it is not yet known which
organizations are willing to perform audits according to the Code of Practice for Research Data
Usage Metrics, and how these audits differ from COUNTER Code of Practice Release 5 audits.
For these reasons audits for research data usage reporting according to the Code of Practice for
Research Data Usage Metrics are not required at this point in time.
1.1.9 Privacy and User Confidentiality Statistical reports or data that reveal information about individual users will not be released or sold
by content providers without the permission of that individual user, the consortium, and its member
institutions (ICOLC Guidelines for Statistical Measures of Usage of Web-Based Information
Resources (1998, revised 2001, 2006), 2006).
1.1.10 Relationship to other Standards, Protocols and Codes The Code of Practice for Research Data Usage Metrics builds on several existing industry
initiatives and standards that address content provider-based online performance measures. In
addition to the COUNTER Code of Practice this includes the Scholix Metadata Schema for the
Exchange of Scholarly Communication Links (Burton et al., 2017) and the NISO Alternative
Assessment Metrics Project (NISO RP-25-2016: Outputs of the NISO Alternative Assessment
Metrics Project, 2016).
Where appropriate, definitions of data elements and other terms from these sources have been
used in this Code of Practice for Research Data Usage Metrics, and these are identified in
Appendix A.
1.2 Changes from Previous Versions This is the first release of the Code of Practice for Research Data Usage Metrics.
PeerJ Preprints | https://doi.org/10.7287/peerj.preprints.26505v1 | CC BY 4.0 Open Access | rec: 11 Feb 2018, publ: 11 Feb 2018

9
2. Overview This section provides an overview of the scope of the Code of Practice for Research Data Usage
Metrics.
Section 3 Technical Implementation of Reports introduces the REQUIRED reports, describes
the common format shared by all reports, and defines the report attributes and their values.
Section 4 Reports provides detailed specifications for each report. Use this section to understand
what elements are included in each report.
Section 5 Delivery of Reports outlines the options a content provider MUST provide to enable
customers to access their reports.
Section 6 Logging Usage describes various options used for logging usage transactions.
Section 7 Processing Rules for Underlying Data discusses topics such as which return codes to
count, double-click filtering, calculating unique datasets accessed in a session, robots and
internet crawlers, and machine access.
Section 8 SUSHI for Automated Report Harvesting offers a more in-depth description of the
REQUIRED SUSHI support.
PeerJ Preprints | https://doi.org/10.7287/peerj.preprints.26505v1 | CC BY 4.0 Open Access | rec: 11 Feb 2018, publ: 11 Feb 2018

10
3. Technical Specifications for Reports
3.1 Reports for Libraries and Data Centers
3.1.1 Master Reports Master Reports include all relevant metrics and attributes; they are intended to be customizable
through the application of filters and other configuration options, allowing users to create a
report specific to their needs. The Dataset Master Report used in the Code of Practice for
Research Data Usage Metrics are shown in Table 3.1, along with its Report ID, Report Name
and Host Types who are expected to provide these reports (see Section 3.3.1 for details on Host
Types).
Table 3.1: Master Reports
Report_ID Report_Name Details Host Types MUST be provided
DSR Dataset Master
Report
A granular customizable report
showing activity at the level of the dataset that allows the user to apply
filters and select configuration
options.
Repository
Data Repository
3.2 Formats for Reports Code of Practice for Research Data Usage Metrics reports can be delivered in tabular form or as
machine-readable JSON file via the SUSHI protocol. The tabular form MUST be a tab-
separated-value Unicode text file. The machine-readable format MUST comply with the
Research Data SUSHI API Specification (See Section 8).
All reports have the same layout and structure. Note that the Research Data SUSHI API
Specification includes the same elements with the same or similar names; therefore,
understanding the tabular reports translates to an understanding of what is REQUIRED in reports
retrieved via SUSHI.
All reports have a header. In tabular reports, the header is separated from the body with a blank row.
Beneath that is the body of the report with column headings. The contents of the body will vary by
report. All of this is discussed in more detail below.
PeerJ Preprints | https://doi.org/10.7287/peerj.preprints.26505v1 | CC BY 4.0 Open Access | rec: 11 Feb 2018, publ: 11 Feb 2018

11
3.2.1 Report Header The first 10 rows of a tabular report contain the header, and the 11th row is always blank. The
COUNTER Code of Practice Release 5 rows Institution_Name and Institution_ID are not used.
The header information is presented as a series of name-value pairs, with the names appearing in
Column A and the corresponding values appearing in Column B. All tabular reports have the same
names in Column A. Column B entries will vary by report.
Table 3.2: Report Header Elements
Element Name Description of value to provide Example
Report_Name The name of the report as it appears in Sections 3.1 and 3.2 of this document.
Must be Dataset Report.
Dataset Report
Report_ID The unique identifier for the reports that
is used in SUSHI requests.
dsr-12hd-zt65
Release The Code of Practice for Research Data
Usage Metrics release this report
complies with. Must be RD1.
RD1
Metric_Types A semicolon-space ("; ") delimited list of
metric types requested for this report.
Note that even though a Metric Type
was requested, it might not be included in the body of the report if no report
items had usage of that type.
Unique_Dataset_Investigations;
Unique_Dataset_Requests
Report_Filters A series of zero or more report filters applied on the reported usage, excluding
metric types (which appear in a separate
row). Typically, a report filter affects the
amount of usage reported. Entries
appear in the form of
“filter_Name=filter_Value” with multiple
filter name-value pairs separated with a
semicolon-space (“; “) and multiple filter values for a single filter name separated
Access_Method=Regular; Access_Method=Machine
PeerJ Preprints | https://doi.org/10.7287/peerj.preprints.26505v1 | CC BY 4.0 Open Access | rec: 11 Feb 2018, publ: 11 Feb 2018

12
by the vertical pipe (“|”) character.
Report_Attributes A series of zero or more report attributes
applied to the report. Typically, a report
attribute affects how the usage is
presented but does not change the
numbers. Entries appear in the form of
“attribute_name=attribute_value” with
multiple attribute name-value pairs
separated with a semicolon-space (”; ”)
and multiple attribute values for a single
attribute name separated by the vertical
pipe (“|”) character.
Attributes_To_Show=Access_Method
Exceptions An indication of some difference
between the usage that was created and
the usage that is being presented in the
report. The format for the exception values are: “Error_No:
Exception_Description” (Data). The
Error_No and Exception_Description
MUST match values provided in Table
B.1 of Appendix B. The data is
OPTIONAL.
Note that for tabular reports, only the
limited set of exceptions where usage is returned will apply.
3040: Partial Data Returned (request
was for 2016-01-01 to 2016-12-31;
however, usage is only available to
2016-08-30).
3040: Partial Data Returned
Reporting_Period The date range for the usage
represented in the report, in the form of: “begin_date=yyyy-mm-dd”;
“end_date=yyyy-mm-dd”. Should
conform with ISO 8601 (ISO 8601:2004
- Data elements and interchange
formats, 2004). The begin_date MUST be the first day
begin_date=2016-01-01;
end_date=2016-08-30
PeerJ Preprints | https://doi.org/10.7287/peerj.preprints.26505v1 | CC BY 4.0 Open Access | rec: 11 Feb 2018, publ: 11 Feb 2018
13
of the month, whereas the end_date can
be the last day of the month for a
complete monthly report, or any other day in the month for a partial monthly
report (See Section 3.3.7)
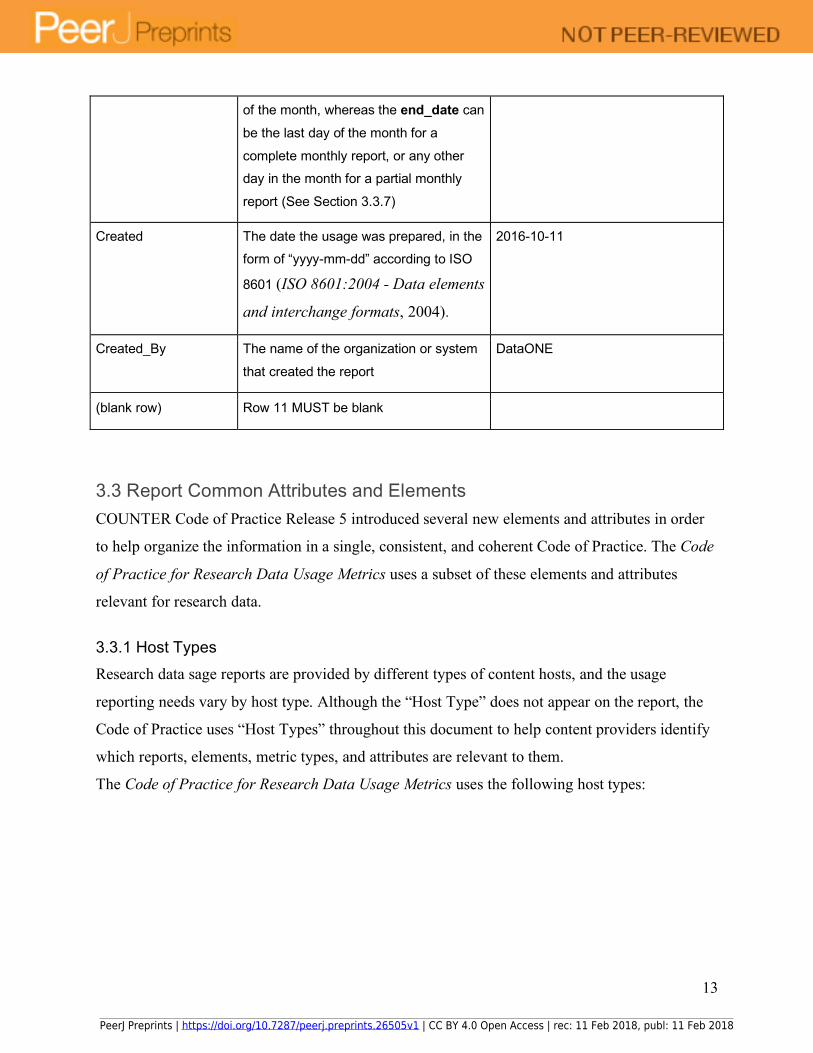
Created The date the usage was prepared, in the form of “yyyy-mm-dd” according to ISO
8601 (ISO 8601:2004 - Data elements
and interchange formats, 2004).
2016-10-11
Created_By The name of the organization or system
that created the report
DataONE
(blank row) Row 11 MUST be blank
3.3 Report Common Attributes and Elements COUNTER Code of Practice Release 5 introduced several new elements and attributes in order
to help organize the information in a single, consistent, and coherent Code of Practice. The Code
of Practice for Research Data Usage Metrics uses a subset of these elements and attributes
relevant for research data.
3.3.1 Host Types Research data sage reports are provided by different types of content hosts, and the usage
reporting needs vary by host type. Although the “Host Type” does not appear on the report, the
Code of Practice uses “Host Types” throughout this document to help content providers identify
which reports, elements, metric types, and attributes are relevant to them.
The Code of Practice for Research Data Usage Metrics uses the following host types:
PeerJ Preprints | https://doi.org/10.7287/peerj.preprints.26505v1 | CC BY 4.0 Open Access | rec: 11 Feb 2018, publ: 11 Feb 2018

14
Table 3.3: List of Host Types
Host Type Category Description Example
Repository A repository that hosts multiple research output types including research data. Institutional
repositories are typically in this category.
Figshare
Data Repository A research data repository hosting only research
data. Disciplinary repositories are typically in this
category.
CDL Dash,
Dryad Digital
Repository
3.3.2 Data Types The COUNTER Code of Practice Release 5 reports scholarly information in many ways. These
major groupings are referred to as Data Types. Only the Dataset Data Types are used by the
Code of Practice for Research Data Usage Metrics. Reporting of collections is restricted to pre-
set collections that are defined like databases.
Table 3.4: List of Data Types
Data Type Description Host Types Reports (Abbrev)
Dataset A dataset Repository
Data Repository
DSR
3.3.4 Metric types The following metric types are defined to enable reporting. There is no significant difference to
the COUNTER Code of Practice Release 5.
Investigations and Requests of Items and Titles
This group of Metric Types represents activities where datasets were retrieved (Requests) or
information about a dataset (e.g. metadata) was examined (Investigations). Any user activity
that can be attributed to a Dataset will be considered an Investigation, including downloading
or viewing the Dataset. Requests are limited to user activity related to retrieving or viewing the
Dataset itself.
PeerJ Preprints | https://doi.org/10.7287/peerj.preprints.26505v1 | CC BY 4.0 Open Access | rec: 11 Feb 2018, publ: 11 Feb 2018

15
Total_Dataset, Unique_Dataset
The metric types that begin with Total_ mean that if a dataset was accessed multiple times in a
user session, the metric would increase by the number of times the Dataset was accessed (minus
any adjustments for double-clicks).
Unique_Dataset metrics help eliminate the effect different styles of user interface may have on
usage counts. If the same dataset was accessed multiple times in a given user session, the
corresponding metric can only increase by 1 to simply indicate that the dataset was accessed in
the session.
Table 3.5: List of Metric Types
Metric Type Description Host Type Reports
Total_Dataset_Investigations Total number of times a Dataset or
information related to a Dataset was
accessed and the data volume in
megabytes that was transferred.
Double click filters are applied to these
transactions. Investigations (counts
and volume) are reported for each version of the Dataset and for the
cumulative total across versions.
Repository
Data Repository
DSR
Unique_Dataset_Investigations Number of datasets investigated in
unique user-sessions. If investigations
for multiple components of the same
Dataset occur in the same user-
session, there MUST be only one “unique” activity counted for that
Dataset. Investigations (counts and
volume) are reported for each version
of the Dataset and for the cumulative
total across versions.
Repository
Data Repository
DSR
Total_Dataset_Requests Total number of times a Dataset was retrieved (the content was accessed or
downloaded in full or a section of it)
Repository Data Repository
DSR
PeerJ Preprints | https://doi.org/10.7287/peerj.preprints.26505v1 | CC BY 4.0 Open Access | rec: 11 Feb 2018, publ: 11 Feb 2018

16
and the data volume in megabytes that
was transferred. Double-click filters
applied. Requests (counts and volume)
are reported for each version of the Dataset and for the cumulative total
across versions.
Unique_Dataset_Requests Number and data volume of Datasets
requested in unique user-sessions. If
requests for multiple components of
the same Dataset occur in the same
user-session, there MUST be only one “unique” activity counted for that
Dataset. Requests (counts and
volume) are reported for each version
of the Dataset and for the cumulative
total across versions.
Repository
Data Repository
DSR
3.3.5 Access Methods In order to track content usage by machines, and to keep that usage separate from regular usage
by humans, the Access_Method attribute is used.
Table 3.6: List of Access Methods
Access_Method Description Host Type Reports
Regular Refers to activities on a platform or content host
that represent typical user behavior.
Repository
Data Repository
DSR
Machine Refers to activities on a platform or content host
that represent typical machine behavior. This
includes only legitimate machine access and
excludes internet robots and crawlers (see
Section 7.8).
Repository
Data Repository
DSR
PeerJ Preprints | https://doi.org/10.7287/peerj.preprints.26505v1 | CC BY 4.0 Open Access | rec: 11 Feb 2018, publ: 11 Feb 2018

17
3.3.6 Year of Publication (YOP) Analyzing collection usage by the age of the content is also desired. The “YOP” usage attribute
represents year of publication.
Table 3.7: Year of Publication Formatting
YOP Description Host Type Reports
yyyy The Year of Publication for the item as a four-digit
year. If the year of publication is not known, use a
value of 0001.
Repository
Data Repository
DSR
3.3.7 Partial Monthly Reports The Reporting_Period can end before the last day of the month, in which case the report for that
month will be partial. This enables incremental updates of usage reporting during the course of a
month. These incremental updates always replace the previous report for that month. Reporting
of usage broken down by day is not supported in this release of the Code of Practice for
Research Data Usage Metrics.
3.3.7 Zero Usage Inclusion of zero-usage reporting for everything, including unsubscribed content, could make
reports unmanageably large.
• For tabular reports
o Omit any row where the Reporting Period Total would be zero.
o If the Reporting Period Total is >0, but usage for an included month is zero, set
the cell value for that month to 0.
• For SUSHI version of reports
o Omit any Instance element with a count of zero.
o Omit Performance elements that don’t have at least one Instance element.
o Omit ReportItems elements that don’t have at least one Performance element.
PeerJ Preprints | https://doi.org/10.7287/peerj.preprints.26505v1 | CC BY 4.0 Open Access | rec: 11 Feb 2018, publ: 11 Feb 2018
18
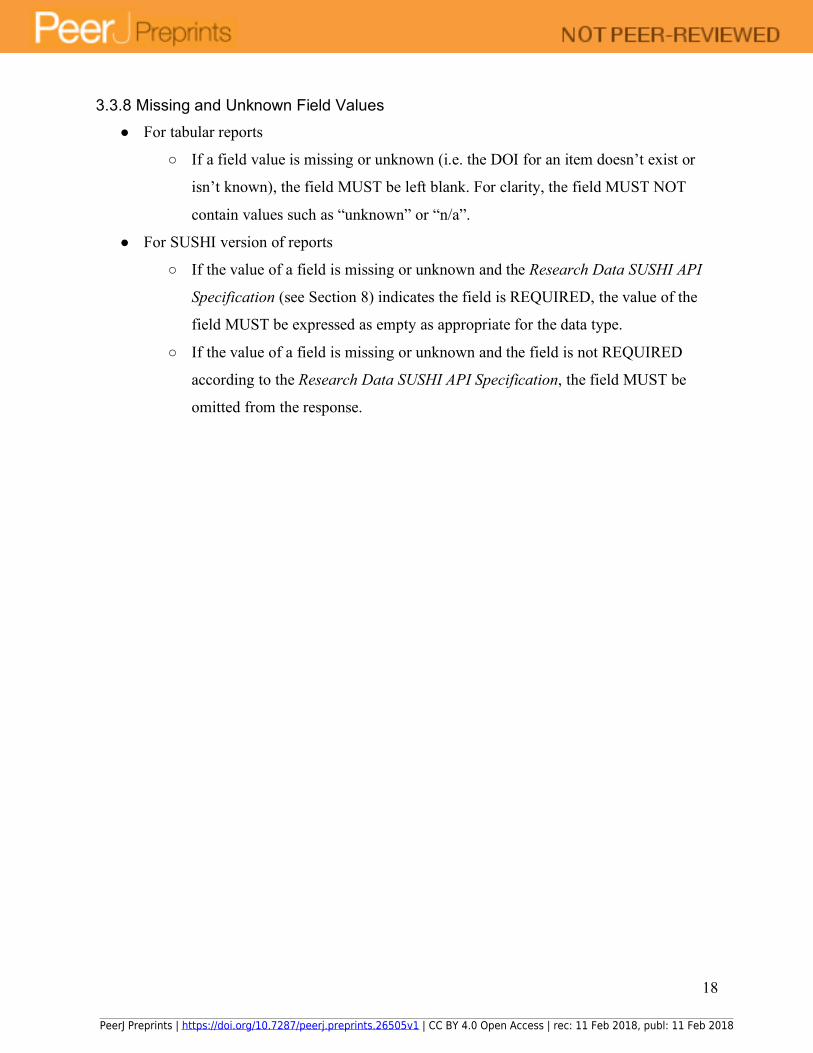
3.3.8 Missing and Unknown Field Values ● For tabular reports
○ If a field value is missing or unknown (i.e. the DOI for an item doesn’t exist or
isn’t known), the field MUST be left blank. For clarity, the field MUST NOT
contain values such as “unknown” or “n/a”.
● For SUSHI version of reports
○ If the value of a field is missing or unknown and the Research Data SUSHI API
Specification (see Section 8) indicates the field is REQUIRED, the value of the
field MUST be expressed as empty as appropriate for the data type.
○ If the value of a field is missing or unknown and the field is not REQUIRED
according to the Research Data SUSHI API Specification, the field MUST be
omitted from the response.
PeerJ Preprints | https://doi.org/10.7287/peerj.preprints.26505v1 | CC BY 4.0 Open Access | rec: 11 Feb 2018, publ: 11 Feb 2018

19
4. Reports
4.1 Dataset Reports Dataset reports provide a summary of activity related to a dataset and provide a means of
evaluating the reuse of that dataset.
Table 4.1: Dataset Master Report and Standard Views
Report_ID Report_Name Details Host Types
DSR Dataset Master Report
A granular, customizable report showing activity at the level of the Dataset that allows the user to
apply filters and select other configuration
options.
Repository Data Repository
4.1.1 Report Header Table 4.2 shows the header details for the Dataset Master Report which contain additional filters
and breakdowns beyond those included in the standard COUNTER reports, and are reported at
the Dataset level, and its Standard Views.
For the tabular reports, elements MUST appear in the exact order shown, and spelling, casing
and punctuation of labels (Column A) and fixed data elements such as report names (Column B)
MUST match exactly. The SUSHI version of the report MUST comply with the Report_Header
definition in the Research Data SUSHI API Specification (see Section 8). Entries in the table
appearing in italics describe the values to include.
Table 4.2: Header for Dataset Master Report and Standard Views
Row Label for Tabular Report (column A)
Value for Tabular Report (column B)
1 Report_Name Dataset Master Report
2 Report_ID DSR
3 Release RD1
4 Metric_Types Semicolon-space delimited list of metric types included in the
report
PeerJ Preprints | https://doi.org/10.7287/peerj.preprints.26505v1 | CC BY 4.0 Open Access | rec: 11 Feb 2018, publ: 11 Feb 2018

20
5 Report_Filters Semicolon-space delimited list of filters applied to the data to
generate the report
6 Report_Attributes Semicolon-space delimited list of report attributes applied to
the data to generate the report
7 Exceptions Any exceptions that occurred in generating the report, in the
format “Error_Number: Error_Description”
8 Reporting_Period Date range requested for the report in the form of “yyyy-mm-
dd” to “yyyy-mm-dd”. The “dd” of the from-date is 01. The “dd”
of the to-date can be the last day of the to- month, or another
day of the to-month, in which case the reporting with be partial
for that month.
9 Created Date the report was run in the format of “yyyy-mm-dd”
10 Created_By Name of organization or system that generated the report
11 (blank) (blank)
4.1.2 Column Headings/Elements When applicable, the following elements MUST appear in the tabular report in the order they
appear in Table 4.3. For guidance on how these fields appear in the JSON format, refer to the
Research Data SUSHI API Specification (see Section 8).
Table 4.3: Column Headings/Elements for Dataset Master Report and Standard Views
Field Name (Tabular) DSR
Dataset_Title M
Publisher M
Publisher_ID M
Creators O
Publication_Date O
Dataset_Version O
PeerJ Preprints | https://doi.org/10.7287/peerj.preprints.26505v1 | CC BY 4.0 Open Access | rec: 11 Feb 2018, publ: 11 Feb 2018
21
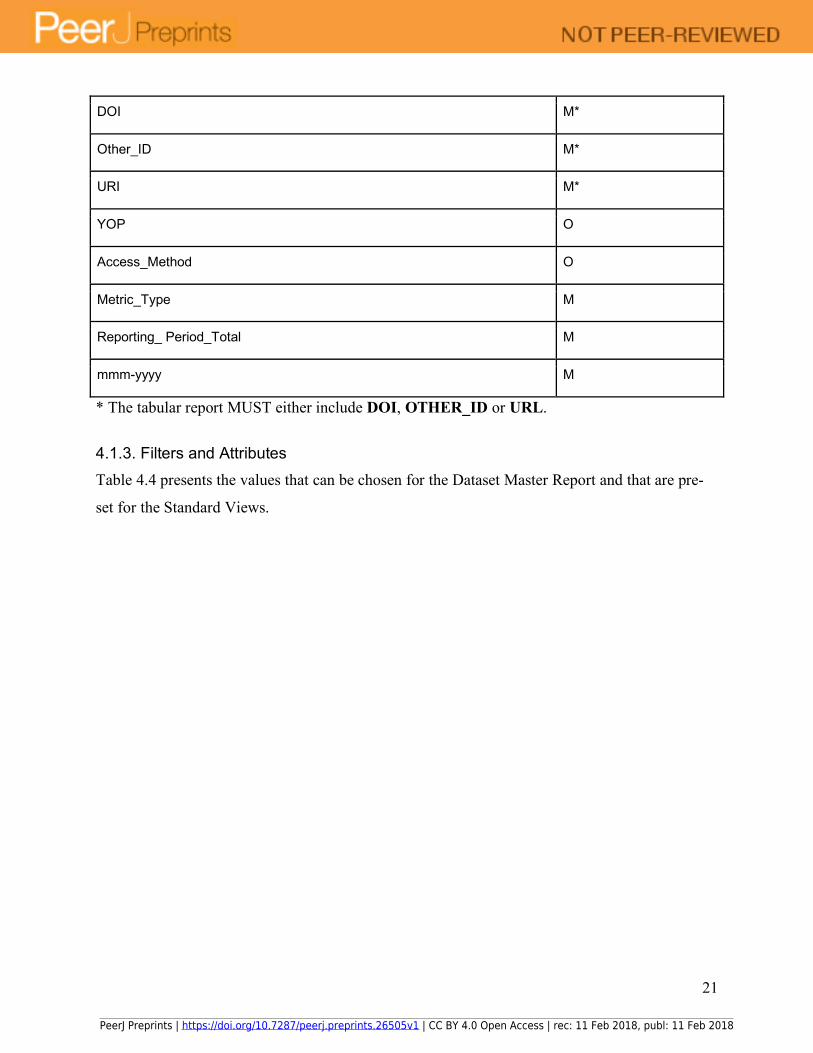
DOI M*
Other_ID M*
URI M*
YOP O
Access_Method O
Metric_Type M
Reporting_ Period_Total M
mmm-yyyy M
* The tabular report MUST either include DOI, OTHER_ID or URL.
4.1.3. Filters and Attributes Table 4.4 presents the values that can be chosen for the Dataset Master Report and that are pre-
set for the Standard Views.
PeerJ Preprints | https://doi.org/10.7287/peerj.preprints.26505v1 | CC BY 4.0 Open Access | rec: 11 Feb 2018, publ: 11 Feb 2018

22
Table 4.4: Filters/Attributes for Item Master Report and Standard Views
Filter/Attribute DSR
YOP All years, a specific year, or a range of years. Use
“0001” for unknown.
Access_Method One or all of:
– Regular
– Machine
Version Either “All” or a specific version, e.g. “1.3”.
Metric_Type One or more of:
– Total_Dataset_Investigations
– Total_Dataset_Requests
– Unique_Dataset_Investigations
– Unique_Dataset_Requests
Exclude_Monthly_Details Either “True” or “False”.
If a filter is applied to a column that doesn’t show on the report, usage for all selected attribute values
is summed and the totals are presented in the report.
PeerJ Preprints | https://doi.org/10.7287/peerj.preprints.26505v1 | CC BY 4.0 Open Access | rec: 11 Feb 2018, publ: 11 Feb 2018

23
5. Delivery of Reports Content providers MUST make tabular versions of reports available from an
administrative/reporting site. All reports provided by the content provider MUST also be
available via SUSHI protocols. Delivery requirements are:
● Reports MUST be provided in both of the following formats:
○ Tab Separated Value (TSV) file that can be easily imported into spreadsheet
programs such as Microsoft Excel without loss or corruption of data.
○ JSON formatted in accordance with the Research Data SUSHI API Specification
(Research Data SUSHI API Specification, 2018).
● Each report MUST be delivered as a separate file to facilitate automated processing of
usage reports.
● Tabular reports MUST be made available through a website.
○ The website MAY be password-controlled.
○ Email alerts MAY be sent when data is updated.
○ The report interface MUST provide filter and configuration options for the Master
Reports that apply to the content provider.
○ The report interface MUST offer all Standard Views that apply to the content
provider’s host type(s) and Standard View options MUST automatically apply the
REQUIRED filter and configuration options and not allow the user to alter the
filters or configuration options except for the usage begin and end dates.
○ The date range fields on the user interface SHOULD default to the latest month
with complete usage. For example, if the current date is 15 May 2019 and April
usage has been processed, the begin date would default to 01 April 2019 and the
end date would default to 30 April 2019. If the April usage has not yet been
processed, the start and end dates would default to 01 March 2019 to 31 March
2019. If the May usage has already been processed partially, the begin date would
default to 01 April 2019 and the end date would default to the date until which
usage has been processed, e.g. 10 May 2019.
○ Master Reports must include the option to Exclude_Monthly_Details. When
selected, the monthly columns are excluded from the report (only
ReportingPeriod Totals appear). Note: this option is NOT available for reports
PeerJ Preprints | https://doi.org/10.7287/peerj.preprints.26505v1 | CC BY 4.0 Open Access | rec: 11 Feb 2018, publ: 11 Feb 2018

24
retrieved via SUSHI; however, SUSHI does offer a Granularity Report Attribute
that allows usage to be retrieved with a granularity of month, year, or totals.
● Reports MUST be provided monthly.
● Data MUST be updated within 1 month of the end of the reporting period.
● Usage MAY be processed for the entire month before usage for that month is included in
reports. If usage for a full given month is not yet available, partial usage for that month
MAY be returned.
● A minimum of the current year plus the prior most recent 24 months of usage data MUST
be available, or the period that reports have been generated according to the Code of
Practice for Research Data Usage Metrics if that period is shorter than 24 months.
● The reports MUST allow the customer the flexibility to specify a date range, in terms of
months, within the most recent 24-month period. Where no date range is specified, the
default MUST be calendar year and calendar-year-to-date reports for the current year.
● Reports MUST be available for harvesting via the SUSHI protocol within 1 month of the
end of the reporting period.
PeerJ Preprints | https://doi.org/10.7287/peerj.preprints.26505v1 | CC BY 4.0 Open Access | rec: 11 Feb 2018, publ: 11 Feb 2018
25
6. Logging Usage Usage data can be generated in a number of ways, with two common approaches:
● Log file analysis, which reads log files containing web server transaction records
● Page tagging, which uses JavaScript to notify a third-party server when a page is
rendered by a web browser.
Each of these approaches has advantages and disadvantages, summarized below.
6.1 Log File Analysis Advantages of log file analysis over page tagging include:
● Web servers normally produce log files, so the raw data are already available. No
changes to the website are required.
● The data is on the organization’s own servers in a standard rather than proprietary format.
This makes it easy for an organization to switch analysis programs later, use several
different programs, and analyze historical data with a new program.
● Log files contain information on visits from search engine spiders. Although these MUST
NOT be reported as part of user activity, it is useful information for search engine
optimization.
● Log files require no additional DNS lookups. Thus, there are no external server calls
which can slow page load speeds or result in uncounted page views.
● The web server reliably records every transaction it makes, including items such as
content generated by scripts, and does not rely on the visitor’s browser.
6.2 Page Tagging The main advantages of page tagging over log file analysis are:
● Counting is activated by opening the page, not requesting it from the server. If a page is
cached it will not be counted by the server. Cached pages can account for a significant
proportion of page views.
● Data is gathered via a component (tag) in the page, usually written in JavaScript, in
conjunction with a server backend to manipulate and store the data in a database allowing
complete control over how the data is represented.
PeerJ Preprints | https://doi.org/10.7287/peerj.preprints.26505v1 | CC BY 4.0 Open Access | rec: 11 Feb 2018, publ: 11 Feb 2018

26
● The script may have access to additional information on the web client user that was not
sent in the query.
● Page tagging can report on events that do not involve a request to the web server.
● Page tagging is available to companies who do not have access to their own web servers.
● The page-tagging service manages the process of assigning cookies to visitors; with log
file analysis, the server must be configured to do this.
● Log file analysis is almost always performed in-house. Page tagging can be done in-
house but is more often provided as a third-party service. The cost differences between
these two models can also be a consideration.
PeerJ Preprints | https://doi.org/10.7287/peerj.preprints.26505v1 | CC BY 4.0 Open Access | rec: 11 Feb 2018, publ: 11 Feb 2018

27
7. Processing Rules for Underlying Reporting Data Usage data for usage report generation should ensure that only intended usage is recorded and
that all requests not intended by the user are excluded.
Because the way usage records are generated can differ across platforms, it is impractical to
describe all the possible filters and techniques used to clean up the data. This Code of Practice
therefore specifies only the requirements to be met by data used for building usage reports.
7.1 Return codes Return codes in this Code of Practice for Research Data Usage Metrics are not different from
the specifications in the COUNTER Code of Practice Release 5. Successful and valid requests
MUST be counted. Successful requests are those with specific HTTP status codes indicating
successful retrieval of the content (200 and 304). HTTP status codes are defined and maintained
by IETF (Fielding & Reschke, 2014).
7.2 Double-click Filtering The intent of double-click filtering is to prevent over-counting which may occur when a user
clicks the same link multiple times in succession, e.g. when frustrated by a slow internet
connection. Double-click filtering applies to all metric types. The double-click filtering rule is as
follows:
A "double-click" is defined as repeated access to a web accessible resource by the same user
within a session, within a time period. Double-clicks on a link by the same user within a 30-
second period MUST be counted as one action. For the purposes of the Code of Practice for
Research Data Usage Metrics, the time window for a double-click on any page is set at a
maximum of 30 seconds between the first and second mouse clicks. For example, a click at
10.01.00 and a second click at 10.01.29 would be considered a double-click (one action); a click
at 10.01.00 and a second click at 10.01.35 would count as two separate single clicks (two
actions).
A double-click may be triggered by a mouse-click or by pressing a refresh or back button. When
two actions are made for the same URL within 30 seconds the first request MUST be removed
and the second retained.
PeerJ Preprints | https://doi.org/10.7287/peerj.preprints.26505v1 | CC BY 4.0 Open Access | rec: 11 Feb 2018, publ: 11 Feb 2018

28
Any additional requests for the same URL within 30 seconds (between clicks) MUST be treated
identically: always remove the first and retain the second.
There are different ways to track whether two requests for the same URL are from the same user
and session. These options are listed in order of increasing reliability, with Option 4 being the
most reliable.
1. If the user is identified only through their IP address, that IP combined with the browser’s
user-agent (presented in the HTTP header) MUST be used to trace double-clicks.
Multiple users on a single IP address with the same browser user-agent can occasionally
lead to separate clicks from different users being logged as a double-click from one user.
This will only happen if the multiple users are clicking on exactly the same content
within a few seconds of each other. One-hour slices MUST be used as sessions.
2. When a session cookie is implemented and logged, the session cookie MUST be used to
identify double-clicks.
3. When a user cookie is available and logged, the user cookie MUST be used to identify
double-clicks.
4. When an individual has logged in with their own profile, their username MUST be used
to trace double-clicks.
7.3 Counting Unique Datasets Some metric types count the number of unique items that had a certain activity, such as a
Unique_Dataset_Requests or Unique_Dataset_Investigations.
For the purpose of metrics, a dataset is the typical unit of content being accessed by users. The
dataset MUST be identified using a unique identifier such as a DOI, regardless of format.
The rules for calculating the unique dataset counts are as follows:
Multiple activities qualifying for the metric type in question representing the same dataset and
occurring in the same user-sessions MUST be counted as only one “unique” activity for that
dataset.
A "User Session" is defined as activity by a user in a period of one hour. It may be identified in
any of the following ways: by a logged session ID + transaction date, by a logged user ID (if
users log in with personal accounts) + transaction date + hour of day (day is divided into 24 one-
PeerJ Preprints | https://doi.org/10.7287/peerj.preprints.26505v1 | CC BY 4.0 Open Access | rec: 11 Feb 2018, publ: 11 Feb 2018
29
hour slices), by a logged user cookie + transaction date + hour of day, or by a combination of IP
address + user agent + transaction date + hour of day.
To allow for simplicity in calculating User Sessions when a session ID is not explicitly tracked,
the day will be divided into 24 one-hour slices and a surrogate session ID will be generated by
combining the transaction date + hour time slice + one of the following: user ID, cookie ID, or IP
address + user agent. For example, consider the following transaction:
● Transaction date/time: 2017-06-15 13:35
● IP address: 192.1.1.168
● User agent: Mozilla/5.0
● Generated session ID: 192.1.1.168|Mozilla/5.0|2017-06-15|13
The above surrogate session ID does not provide an exact analogy to a session. However,
statistical studies show that the result of using such a surrogate session ID results in unique
counts are within 1– 2 % of unique counts generated with actual sessions.
7.4 Attributing Usage when Item Appears in More Than One Database Content providers that offer databases where a given dataset is included in multiple databases
MUST attribute the Investigations and Requests metrics to just one database. They could use a
consistent method of prioritizing databases or pick the database randomly.
7.5 Internet Robots and Crawlers The intent is to exclude web robots and spiders but include usage by humans accessing content
through a scripting language or automated tool, whether interactively or standalone.
Web robots and crawlers intended for search indexing and related applications SHOULD be
excluded via the application of a blacklist of known user agents for these robots. This blacklist
MUST NOT include general purpose user agents that are commonly used by researchers (e.g.,
python, curl, wget, and Java), and the blacklist will be maintained as a subset of the COUNTER
Code of Practice Release 5 list of internet robots and crawlers (COUNTER-Robots, 2017).
Generally, user agents reflecting programmatic access to specific datasets will not be included in
the blacklist.
Usage counts by scripted and automated processes MUST NOT be excluded unless they can
demonstrably be shown to originate from a blacklisted agent, such as an IP address of a known
PeerJ Preprints | https://doi.org/10.7287/peerj.preprints.26505v1 | CC BY 4.0 Open Access | rec: 11 Feb 2018, publ: 11 Feb 2018

30
search agent. New or unknown user agents SHOULD be counted unless there is demonstrable
evidence that they represent solely a web indexing agent.
7.6 Machine Access Many researchers access and analyze data using scripts or automated tools, especially large data
sets, and excluding those uses would be inaccurate and bias the counts. The Access_Method of
type Machine is used to distinguish this kind of access.
7.6.1 Principles for reporting usage ● The Code of Practice for Research Data Usage Metrics does not record machine use
itself, as most of this activity takes place after a dataset has been downloaded. All we can
do is track the count of datasets downloaded using machines.
● Usage associated with machine access activity MUST be tracked by assigning an
Access_Method of Machine.
● Usage associated with machine activity MUST be reported using the Dataset Master
Report by identifying such usage as “Access_Method=Machine”.
7.6.2 Detecting machine activity For the purpose of reporting usage according to the Code of Practice for Research Data Usage
Metrics, machine access does not require prior permission and/or the use of specific endpoints or
protocols. This is in contrast to the COUNTER Code of Practice Release 5.
The distinction between legitimate machine use and robot or web crawler traffic is made based
on the user agent (see Section 7.5).
PeerJ Preprints | https://doi.org/10.7287/peerj.preprints.26505v1 | CC BY 4.0 Open Access | rec: 11 Feb 2018, publ: 11 Feb 2018
31
8. SUSHI for Automated Report Harvesting Content providers MUST support automatic harvesting of reports via the SUSHI protocol as
described in the NISO SUSHI Protocol (ANSI/NISO Z39.93-2014: Standardized Usage Statistics
Harvesting Initiative (SUSHI) Protocol, 2014) and the Research Data SUSHI API Specification
(Research Data SUSHI API Specification, 2018).
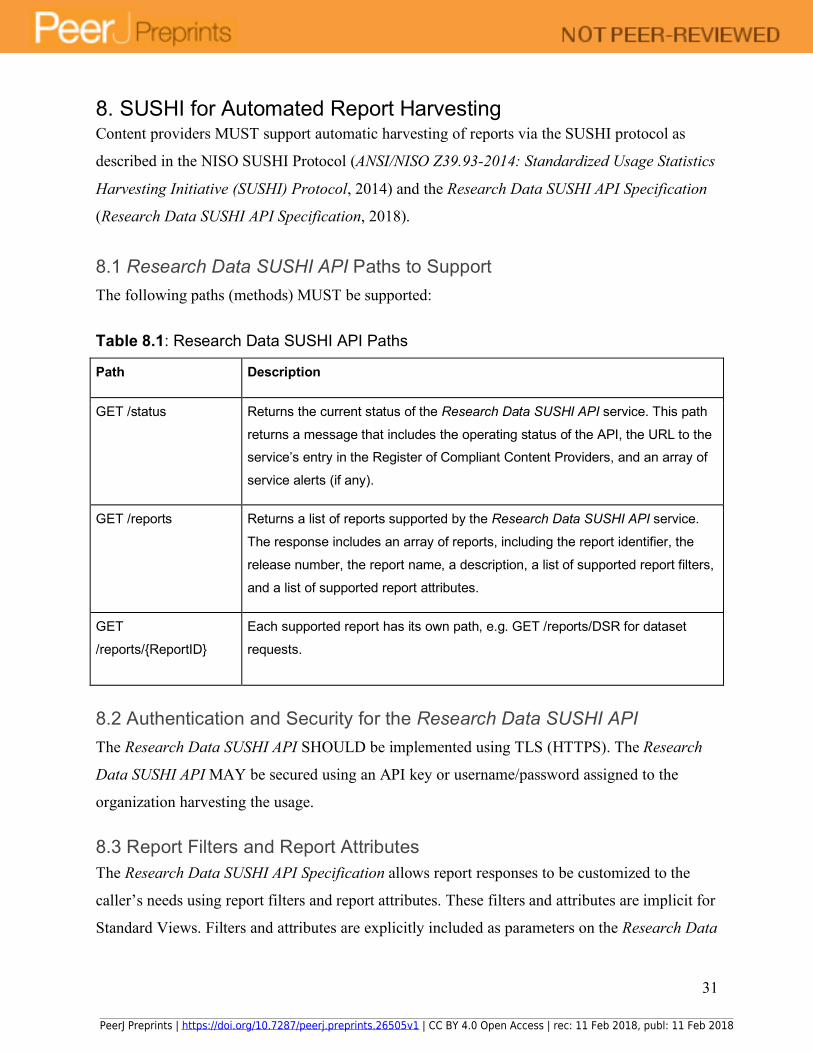
8.1 Research Data SUSHI API Paths to Support The following paths (methods) MUST be supported:
Table 8.1: Research Data SUSHI API Paths
Path Description
GET /status Returns the current status of the Research Data SUSHI API service. This path
returns a message that includes the operating status of the API, the URL to the service’s entry in the Register of Compliant Content Providers, and an array of
service alerts (if any).
GET /reports Returns a list of reports supported by the Research Data SUSHI API service.
The response includes an array of reports, including the report identifier, the
release number, the report name, a description, a list of supported report filters,
and a list of supported report attributes.
GET
/reports/{ReportID}
Each supported report has its own path, e.g. GET /reports/DSR for dataset
requests.
8.2 Authentication and Security for the Research Data SUSHI API The Research Data SUSHI API SHOULD be implemented using TLS (HTTPS). The Research
Data SUSHI API MAY be secured using an API key or username/password assigned to the
organization harvesting the usage.
8.3 Report Filters and Report Attributes The Research Data SUSHI API Specification allows report responses to be customized to the
caller’s needs using report filters and report attributes. These filters and attributes are implicit for
Standard Views. Filters and attributes are explicitly included as parameters on the Research Data
PeerJ Preprints | https://doi.org/10.7287/peerj.preprints.26505v1 | CC BY 4.0 Open Access | rec: 11 Feb 2018, publ: 11 Feb 2018
32
SUSHI API request for Master Reports. Refer to (Research Data SUSHI API Specification, 2018)
for the list of filters and attributes supported by the various reports.
8.4 Research Data SUSHI API Errors and Exceptions Implementations of the Research Data SUSHI API MUST comply with the warnings, exceptions
and errors described in the Research Data SUSHI API Specification. See Appendix B.
8.5 SUSHI Service Limits The content provider MUST NOT place limits on the SUSHI service (such as requests per day or
amount of data transferred) that would prevent users from retrieving reports.
PeerJ Preprints | https://doi.org/10.7287/peerj.preprints.26505v1 | CC BY 4.0 Open Access | rec: 11 Feb 2018, publ: 11 Feb 2018
33
Acknowledgements The authors want to thank Tasha Mellins-Cohen, Amber Budden, Kristian Garza and Christopher
Jones for helpful discussions of the manuscript.
References ANSI/NISO Z39.93-2014: Standardized Usage Statistics Harvesting Initiative (SUSHI) Protocol.
(2014). Retrieved from http://www.niso.org/standards-committees/sushi
Burton, A., Fenner, M., Haak, W., & Manghi, P. (2017). Scholix Metadata Schema for Exchange
of Scholarly Communication Links. Zenodo. https://doi.org/10.5281/zenodo.1120265
Costas, R., Meijer, I., Zahedi, Z., & Wouters, P. (2013). The Value of Research Data -Metrics for
datasets from a cultural and technical point of view. A Knowledge Exchange Report. Retrieved
from http://www.knowledge-exchange.info/event/value-reseach-data-metrics
COUNTER Code of Practice Release 5. (2017). Retrieved from
https://www.projectcounter.org/code-of-practice-five-sections/abstract/
COUNTER-Robots: Official list of user agents that are regarded as robots/spiders by
COUNTER. (2017). Retrieved from https://github.com/atmire/COUNTER-Robots
Dekkers, A., & Isaac, A. (2018). Data Catalog Vocabulary (DCAT) 1.1. Retrieved from
https://w3c.github.io/dxwg/dcat/
Fielding, R., & Reschke, J. (2014). RFC7231: Hypertext Transfer Protocol (HTTP/1.1):
Semantics and Content. Retrieved from https://tools.ietf.org/html/rfc7231
ICOLC Guidelines for Statistical Measures of Usage of Web-Based Information Resources
(1998, revised 2001, 2006). (2006). Retrieved from http://icolc.net/statement/guidelines-
statistical-measures-usage-web-based-information-resources-1998-revised-2001-0
ISO 8601:2004 - Data elements and interchange formats. (2004). Retrieved from
https://www.iso.org/standard/40874.html
Kratz, J. E., & Strasser, C. (2015). Making data count. Scientific Data, 2, 150039.
https://doi.org/10.1038/sdata.2015.39
Make Data Count. (2017). Retrieved from https://makedatacount.org/
NISO RP-25-2016: Outputs of the NISO Alternative Assessment Metrics Project. (2016).
Retrieved from http://www.niso.org/publications/niso-rp-25-2016-outputs-niso-alternative-
assessment-metrics-project
PeerJ Preprints | https://doi.org/10.7287/peerj.preprints.26505v1 | CC BY 4.0 Open Access | rec: 11 Feb 2018, publ: 11 Feb 2018

34
Project COUNTER. (2002). Retrieved from https://www.projectcounter.org/
Research Data SUSHI API Specification. (2018). Retrieved from
https://app.swaggerhub.com/apis/COUNTER/researchdata-sushi_1_0_api/1.0.0
RFC 2119: Key words for use in RFCs to Indicate Requirement Levels. (1997). Retrieved from
https://www.ietf.org/rfc/rfc2119.txt
PeerJ Preprints | https://doi.org/10.7287/peerj.preprints.26505v1 | CC BY 4.0 Open Access | rec: 11 Feb 2018, publ: 11 Feb 2018
35
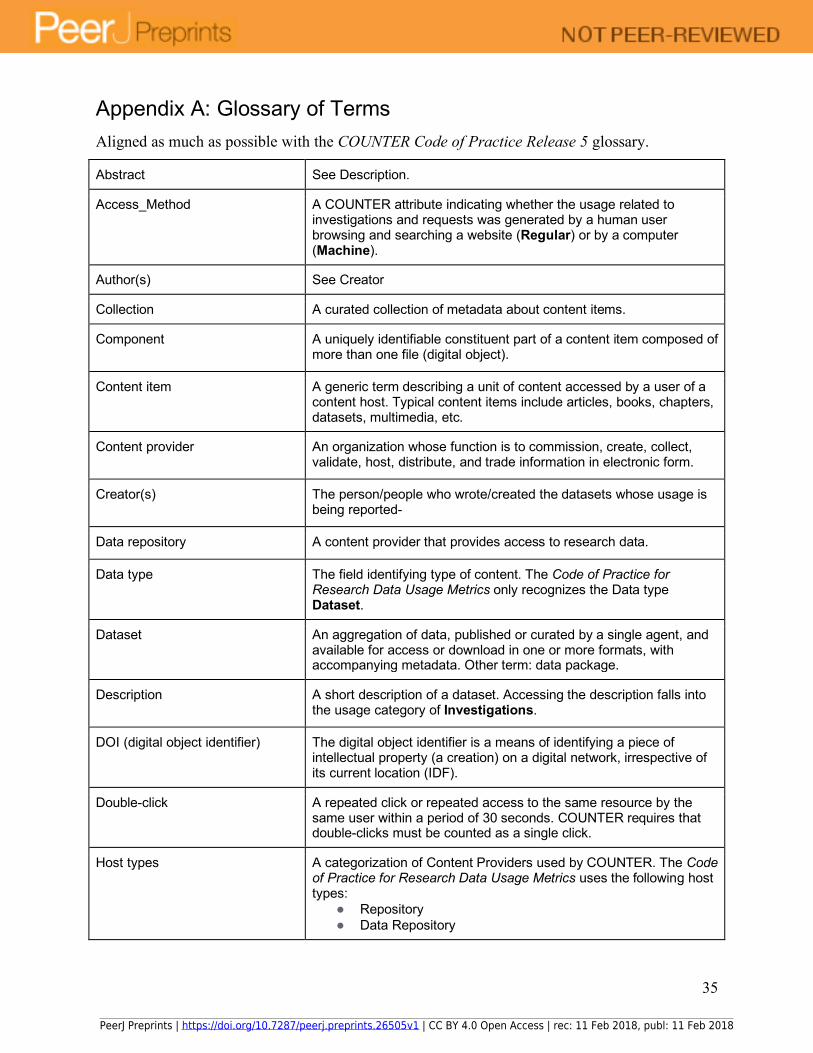
Appendix A: Glossary of Terms Aligned as much as possible with the COUNTER Code of Practice Release 5 glossary.
Abstract See Description.
Access_Method A COUNTER attribute indicating whether the usage related to investigations and requests was generated by a human user browsing and searching a website (Regular) or by a computer (Machine).
Author(s) See Creator
Collection A curated collection of metadata about content items.
Component A uniquely identifiable constituent part of a content item composed of more than one file (digital object).
Content item A generic term describing a unit of content accessed by a user of a content host. Typical content items include articles, books, chapters, datasets, multimedia, etc.
Content provider An organization whose function is to commission, create, collect, validate, host, distribute, and trade information in electronic form.
Creator(s) The person/people who wrote/created the datasets whose usage is being reported-
Data repository A content provider that provides access to research data.
Data type The field identifying type of content. The Code of Practice for Research Data Usage Metrics only recognizes the Data type Dataset.
Dataset An aggregation of data, published or curated by a single agent, and available for access or download in one or more formats, with accompanying metadata. Other term: data package.
Description A short description of a dataset. Accessing the description falls into the usage category of Investigations.
DOI (digital object identifier) The digital object identifier is a means of identifying a piece of intellectual property (a creation) on a digital network, irrespective of its current location (IDF).
Double-click A repeated click or repeated access to the same resource by the same user within a period of 30 seconds. COUNTER requires that double-clicks must be counted as a single click.
Host types A categorization of Content Providers used by COUNTER. The Code of Practice for Research Data Usage Metrics uses the following host types:
● Repository ● Data Repository
PeerJ Preprints | https://doi.org/10.7287/peerj.preprints.26505v1 | CC BY 4.0 Open Access | rec: 11 Feb 2018, publ: 11 Feb 2018

36
Internet robot, crawler, spider An identifiable, automated program or script that visits websites and systematically retrieves information from them, often to provide indexes for search engines rather than for research. Not all programs or scripts are classified as robots.
Investigation A category of COUNTER metric types that represent a user accessing information related to a dataset (i.e. a description or detailed descriptive metadata) or the content of the dataset itself.
Log file analysis A method of collecting usage data in which the web server records all of its transactions.
Machine A category of COUNTER Metric Types that represents a machine accessing content, e.g. a script written by a researcher. This does not include robots, crawlers and spiders.
Master reports Reports that contain additional filters and breakdowns beyond those included in the standard COUNTER reports.
Metadata A series of textual elements that describes a content item but does not include the item itself. For example, metadata for a dataset would typically include publisher, a list of names and affiliations of the creators, the title and description, and keywords or other subject classifications.
Metric types, Metric_Type An attribute of COUNTER usage that identifies the nature of the usage activity.
ORCID (Open Researcher and Contributor ID)
An international standard identifier for individuals (i.e. authors) to use with their name as they engage in research, scholarship, and innovation activities.
Persistent Identifier (PID) Globally unique identifier and associated metadata for research data, or other entities (articles, researchers, scholarly institutions) relevant in scholarly communication.
Platform An interface from an aggregator, publisher, or other online service that delivers the content to the user and that counts and provides the COUNTER usage reports.
Provider ID A unique identifier for a Content Provider and used by discovery services and other content sites to track usage for content items provided by that provider.
Publication date, Publication_Date An optional field in COUNTER item reports and Provider Discovery Reports. The date of release by the publisher to customers of a content item.
Publisher An organization whose function is to commission, create, collect, validate, host, distribute and trade information online and/or in printed form.
Regular A COUNTER Access_Method. Indicates that usage was generated by a human user browsing/searching a website, rather than by a computer.
PeerJ Preprints | https://doi.org/10.7287/peerj.preprints.26505v1 | CC BY 4.0 Open Access | rec: 11 Feb 2018, publ: 11 Feb 2018
37
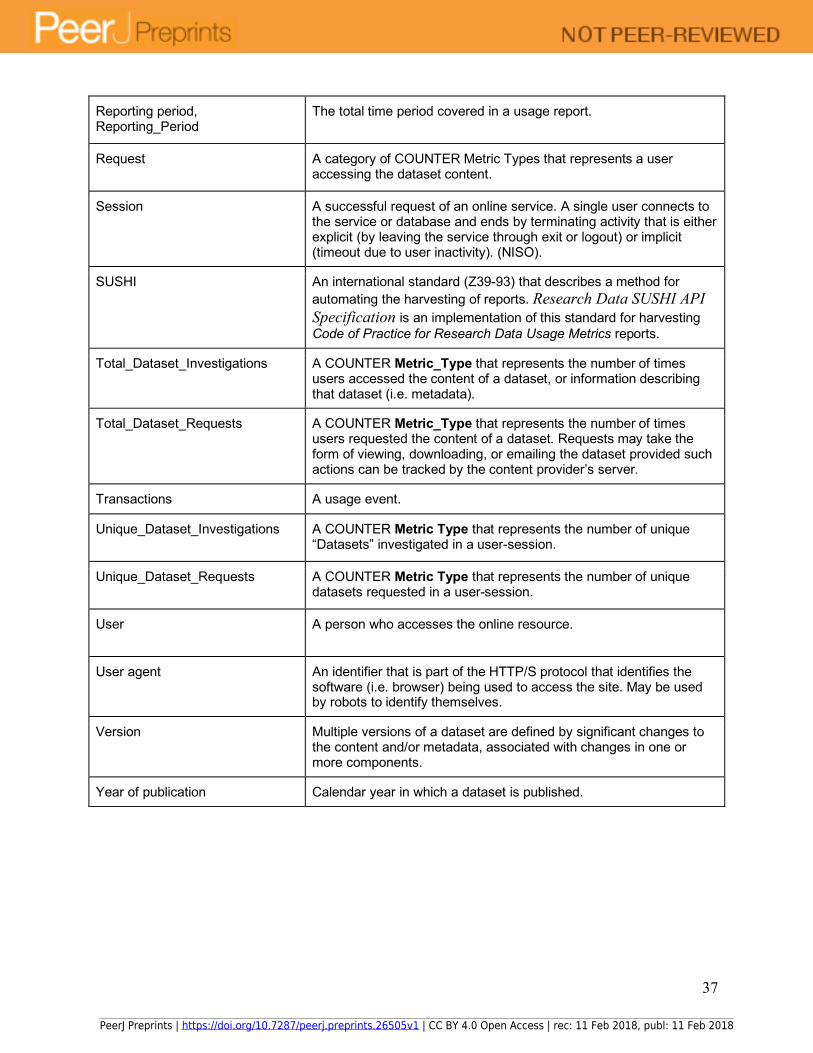
Reporting period, Reporting_Period
The total time period covered in a usage report.
Request A category of COUNTER Metric Types that represents a user accessing the dataset content.
Session A successful request of an online service. A single user connects to the service or database and ends by terminating activity that is either explicit (by leaving the service through exit or logout) or implicit (timeout due to user inactivity). (NISO).
SUSHI An international standard (Z39-93) that describes a method for automating the harvesting of reports. Research Data SUSHI API Specification is an implementation of this standard for harvesting Code of Practice for Research Data Usage Metrics reports.
Total_Dataset_Investigations A COUNTER Metric_Type that represents the number of times users accessed the content of a dataset, or information describing that dataset (i.e. metadata).
Total_Dataset_Requests A COUNTER Metric_Type that represents the number of times users requested the content of a dataset. Requests may take the form of viewing, downloading, or emailing the dataset provided such actions can be tracked by the content provider’s server.
Transactions A usage event.
Unique_Dataset_Investigations A COUNTER Metric Type that represents the number of unique “Datasets” investigated in a user-session.
Unique_Dataset_Requests A COUNTER Metric Type that represents the number of unique datasets requested in a user-session.
User A person who accesses the online resource.
User agent An identifier that is part of the HTTP/S protocol that identifies the software (i.e. browser) being used to access the site. May be used by robots to identify themselves.
Version Multiple versions of a dataset are defined by significant changes to the content and/or metadata, associated with changes in one or more components.
Year of publication Calendar year in which a dataset is published.
PeerJ Preprints | https://doi.org/10.7287/peerj.preprints.26505v1 | CC BY 4.0 Open Access | rec: 11 Feb 2018, publ: 11 Feb 2018

38
Appendix B: Handling Errors and Exceptions As a rule, the structure of the SUSHI response will be governed by the SUSHI schema; therefore,
any error conditions that can be reported will be specified within the SUSHI response. The
following is a definition from the Research Data SUSHI API Specification that shows the format
of the exception. "SUSHI_errorModel": { "type": "object", "description": "Generalized format for presenting errors and exceptions.", "required": ["code", "severity", "message"], "properties": {" code": { "type": "integer", "format": "int32", "description": "Error number.See table of errors.", "example": 3040 }, "severity": { "type": "string", "description": "Severity of the error.", "example": "Warning", "enum": ["Warning", "Fatal", "Debug", "Info"] }, "message": { "type": "string", "description": "Text describing the error.", "example": "Partial Data Returned." }, "helpURL": { "type": "string", "description": "URL describing error details." }, "data": { "type": "string", "description": "Additional data provided to clarify the error.", "example": "Usage data has not been processed for all months." } } }
As indicated in the JSON code above, multiple exceptions can be returned, and the exceptions
have the following elements:
● code: is a numeric exception number that identifies the exception. See table B.1 for
values.
● severity: indicates if the exception is one of:
PeerJ Preprints | https://doi.org/10.7287/peerj.preprints.26505v1 | CC BY 4.0 Open Access | rec: 11 Feb 2018, publ: 11 Feb 2018

39
○ Fatal: unable to complete the transaction. The problem is with the service and
may be temporary and a retry could be successful. No report is returned.
Example: service busy.
○ Error: unable to complete the transaction. The problem is with the request such
that a retry will not be successful unless the request or other configuration details
change. No report is returned. Example: Requestor not authorized.
○ Warning: The transaction can be completed, but not all requested information
could be returned. Examples: “Usage Not Ready for Requested Data; Partial Data
Returned”
○ Debug: reserved for use by developers as a means of providing additional data
about the request or response to the calling application.
● message: textual description of the exception. For exception codes > 999 the message
must exactly match column 1 in table B.1.
● data: additional optional data that further describes the error. Example: for the Partial
Data Returned exception, the “data” could state “You requested 2017-01-01 to 2016-12-
31; however, only 2017-01-01 to 2017-06-30 were available.”
● helpurl: an optional variable that includes the URI to a help message that explains the
exception in more detail.
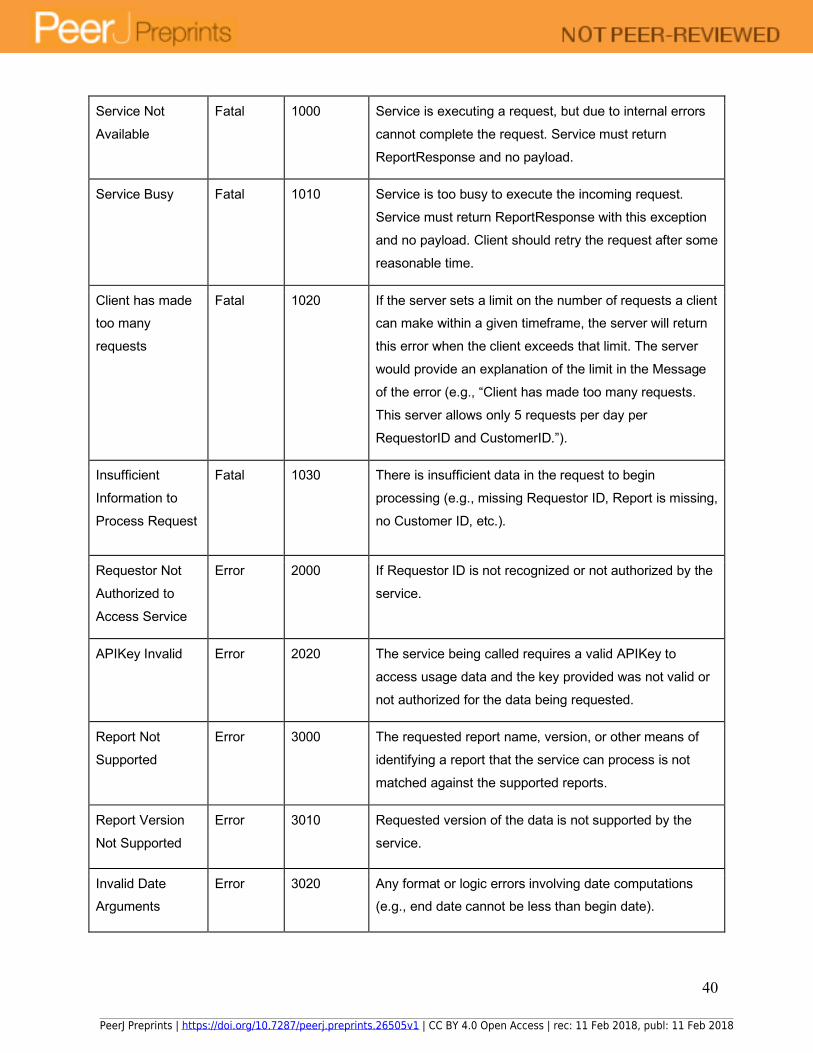
Table B.1 provides a list of possible exceptions that may occur for Research Data SUSHI API
reports.
Table B.1: SUSHI Exceptions
Exception (message)
Severity Exception Number (code)
Invocation Conditions
Info or
Debug
Info
Debug
0 Any. These messages will never be standardized, and
service providers can design them as they see fit.
Warnings Warning 1-999 Any. This range is reserved for the use of service
providers to supply their own custom warnings.
PeerJ Preprints | https://doi.org/10.7287/peerj.preprints.26505v1 | CC BY 4.0 Open Access | rec: 11 Feb 2018, publ: 11 Feb 2018
40
Service Not
Available
Fatal 1000 Service is executing a request, but due to internal errors
cannot complete the request. Service must return
ReportResponse and no payload.
Service Busy Fatal 1010 Service is too busy to execute the incoming request.
Service must return ReportResponse with this exception
and no payload. Client should retry the request after some
reasonable time.
Client has made too many
requests
Fatal 1020 If the server sets a limit on the number of requests a client can make within a given timeframe, the server will return
this error when the client exceeds that limit. The server
would provide an explanation of the limit in the Message
of the error (e.g., “Client has made too many requests.
This server allows only 5 requests per day per
RequestorID and CustomerID.”).
Insufficient
Information to
Process Request
Fatal 1030 There is insufficient data in the request to begin
processing (e.g., missing Requestor ID, Report is missing,
no Customer ID, etc.).
Requestor Not
Authorized to
Access Service
Error 2000 If Requestor ID is not recognized or not authorized by the
service.
APIKey Invalid Error 2020 The service being called requires a valid APIKey to
access usage data and the key provided was not valid or
not authorized for the data being requested.
Report Not
Supported
Error 3000 The requested report name, version, or other means of
identifying a report that the service can process is not
matched against the supported reports.
Report Version
Not Supported
Error 3010 Requested version of the data is not supported by the
service.
Invalid Date Arguments
Error 3020 Any format or logic errors involving date computations (e.g., end date cannot be less than begin date).
PeerJ Preprints | https://doi.org/10.7287/peerj.preprints.26505v1 | CC BY 4.0 Open Access | rec: 11 Feb 2018, publ: 11 Feb 2018

41
No Usage
Available for
Requested Dates
Error 3030 Service did not find any data for the date range specified.
Usage Not Ready
for Requested
Dates
Error,
Warning
3031 Service has not yet processed the usage for one or more
of the requested months, if some months are available
that data should be returned. The exception should
include the months not processed in the additional data
element.
Partial Data
Returned
Warning 3040 Request could not be fulfilled in its entirety. Data that was
available was returned.
Parameter Not
Recognized in
this Context
Warning 3050 Request contained one or more parameters that are not
recognized by the Server in the context of the report being
serviced. The server should list the Name of unsupported
filter in the Message element of the Exception.
Note: The server is expected to ignore unsupported
parameters and continue to process the request, returning
data that is available without the parameter being applied.
Invalid
ReportFilter
Value
Warning,
Error
3060 Request contained one or more Filter values in the
ReportDefinition that are not supported by the Server. The
server should list the Name of unsupported filter values in
the Message element of the Exception.
Note: The server is expected to ignore unsupported filters
and continue to process the request, returning data that is
available without the filter being applied.
Incongruous
ReportFilter
Value
Warning,
Error
3061 A filter element includes multiple values in a pipe-
delimited list; however, the supplied values are not all of
the same scope.
PeerJ Preprints | https://doi.org/10.7287/peerj.preprints.26505v1 | CC BY 4.0 Open Access | rec: 11 Feb 2018, publ: 11 Feb 2018
42
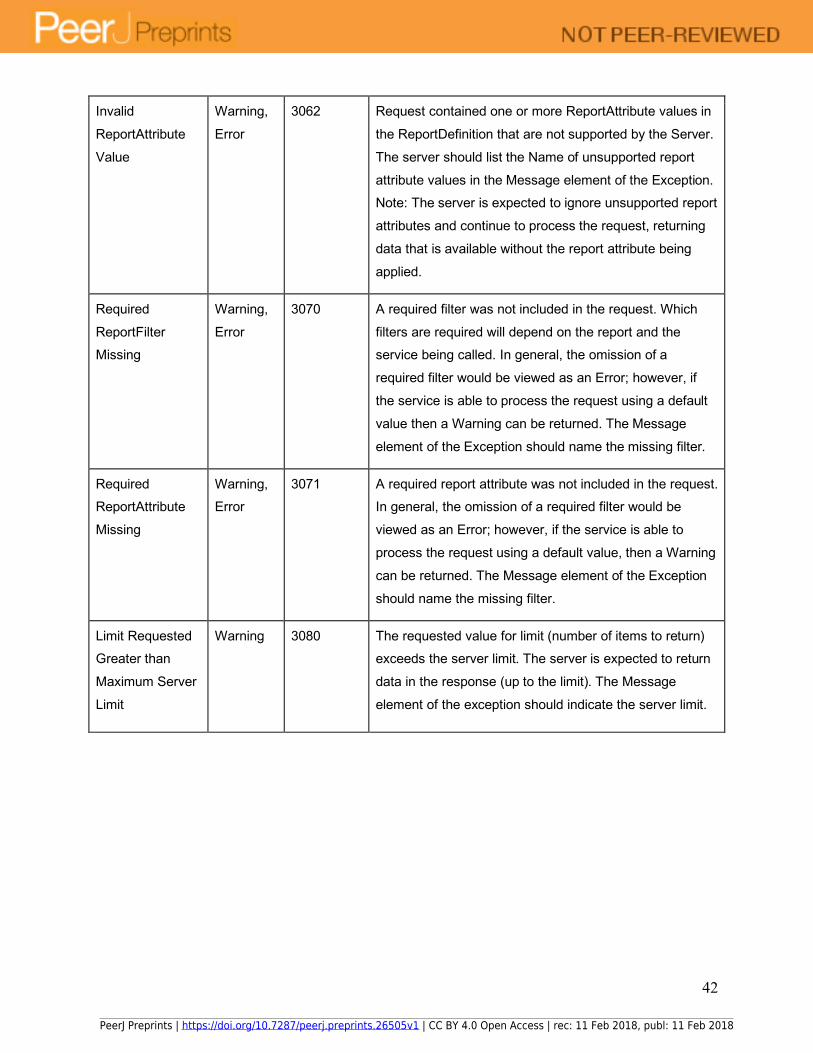
Invalid
ReportAttribute
Value
Warning,
Error
3062 Request contained one or more ReportAttribute values in
the ReportDefinition that are not supported by the Server.
The server should list the Name of unsupported report
attribute values in the Message element of the Exception. Note: The server is expected to ignore unsupported report
attributes and continue to process the request, returning
data that is available without the report attribute being
applied.
Required
ReportFilter Missing
Warning,
Error
3070 A required filter was not included in the request. Which
filters are required will depend on the report and the service being called. In general, the omission of a
required filter would be viewed as an Error; however, if
the service is able to process the request using a default
value then a Warning can be returned. The Message
element of the Exception should name the missing filter.
Required ReportAttribute
Missing
Warning, Error
3071 A required report attribute was not included in the request. In general, the omission of a required filter would be
viewed as an Error; however, if the service is able to
process the request using a default value, then a Warning
can be returned. The Message element of the Exception
should name the missing filter.
Limit Requested Greater than
Maximum Server
Limit
Warning 3080 The requested value for limit (number of items to return) exceeds the server limit. The server is expected to return
data in the response (up to the limit). The Message
element of the exception should indicate the server limit.
PeerJ Preprints | https://doi.org/10.7287/peerj.preprints.26505v1 | CC BY 4.0 Open Access | rec: 11 Feb 2018, publ: 11 Feb 2018

43
Note 1: An Error does not interrupt completion of the transaction (in the sense of a programmatic failure),
although it may not return the expected report for the reason that is identified. A Fatal exception does not
complete the transaction; the problem may be temporary and a retry could be successful.
Note 2: Optional response: Service may respond with the additional exception of Info level and include additional information in the message. For example, if the client is requesting data for a date range where
the begin date is before what the service offers, the service might include a HelpURL that can provide
more information about supported dates.
Note 3: If multiple exceptions are discovered, each exception should be returned in its own element.
Note 4: Clarifying details about an exception (e.g., the filter that was missing or deemed invalid should be
added to the Data element or Message element of the exception so that the caller knows what to correct).
Note 5: If the caller gets the baseURL, the version, or method wrong, the expectation is that they will
receive an HTTP 404 error since the specified path is not valid.
PeerJ Preprints | https://doi.org/10.7287/peerj.preprints.26505v1 | CC BY 4.0 Open Access | rec: 11 Feb 2018, publ: 11 Feb 2018