cobem-2017-0601 dynamic response analysis of …
TRANSCRIPT
24th ABCM International Congress of Mechanical EngineeringDecember 3-8, 2017, Curitiba, PR, Brazil
COBEM-2017-0601DYNAMIC RESPONSE ANALYSIS OF STEEL CATENARY RISERS
UNDER THE INFLUENCE OF AN INTERNAL SLUG FLOWJoseph Arthur Meléndez VásquezNational Institute for Space Research - [email protected]
Juan Pablo Julca AvilaFederal University of ABC - [email protected]
Abstract. Slug flow through marine risers is a frequent phenomenon that occurs during the production of oil and gas.The dynamic nature of the slug flow induces time-dependent forces on the steel catenary riser, thus affecting its structuraldynamic response. The purpose of this work is a two-dimensional analysis of the structural dynamic response of steelcatenary risers under the influence of an internal slug flow. To accomplish this goal, a computational tool is developed.The spatial discretization of the riser is performed using beam finite elements and the corotational approach is used forthe two-dimensional formulation of the beam element. The beam elements have a linear elastic behaviour and they aresubmitted to large displacements, although with small deformations. The incremental-iterative Newton-Raphson schemefor follower loads is used to solve the equilibrium equations in static and dynamic analysis. Time domain numericalintegration is performed using the constant average acceleration method. The slug flow is viewed as a single-phase fluidwith variable density, which is modelled by a periodic function. It has been found that variations in slug flow frequencieshas a higher impact on the response amplitude of the top tension at higher values of liquid mass flow.
Keywords: structural dynamic response, large displacements, corotational formulation, slug flow.
1. INTRODUCTION
In oil and gas exploration and production operations in deep and ultra-deep water, steel catenary risers (SCRs) arewidely used to connect a subsea pipeline to a deep water floating or fixed oil production platform. Because their highresistance to external and internal pressures when exposed at great depths, SCRs have become the primary candidates tobe used with floating production platforms in future ultra-deep water operations of the oil and gas industry.
The internal fluid moving inside the riser is a mixture of oil, gas, and water, and it is exposed to different conditionsof pressure and temperature that enable the formation of emulsions, hydrates, and waxes. These characteristics make themodelling of the internal fluid a highly complex task. When a two-phase fluid, composed of gas and liquid, flows upwardin a riser, the two phases may distribute in a variety of flow patterns. In this work, the slug flow is considered as the patternof the internal fluid.
In order to understand the effect produced by the slug flow on the dynamics of risers, analytical and experimentalworks were performed in the last years. Patel and Seyed (1989) proposed a simplified one-dimensional model based onthe sinusoidal behaviour of the internal fluid density along the riser. Valdivia (2008) carried out an experimental study, inwhich a silicone pipe was used with an internal fluid composed of water and air. Ortega (2015) used a computational toolto predict the development of the slug flow using a lagrangian tracking model (LASSI).
2. TWO-DIMENSIONAL FORMULATION FOR BEAMS
For the two-dimensional formulation of beams, the corotational approach, formulated by Yaw (2009) has been used.The beam element is considered as a structure that performs two types of movement, translation and rotation; after that, itsuffers deformations caused by its internal forces.
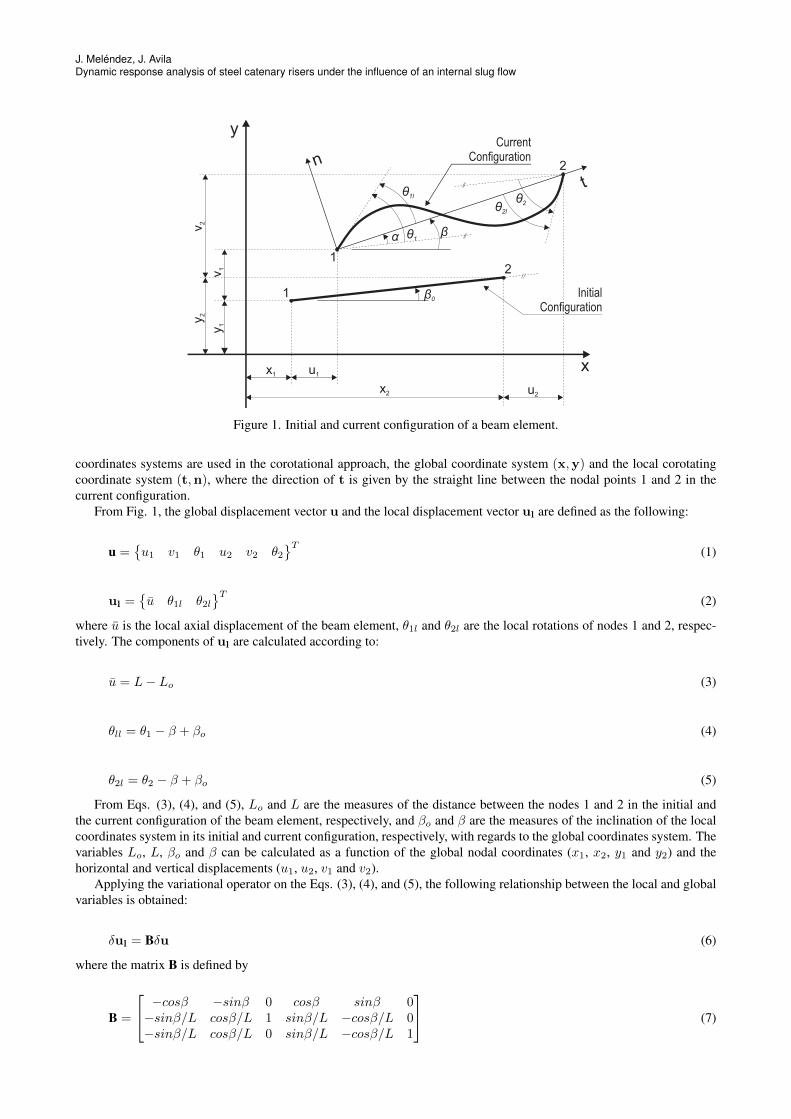
From Fig. 1, the beam element in its initial configuration is defined by the global nodal coordinates (x1, y1) for node 1,and (x2, y2) for node 2. In its current configuration, the node number 1 of the beam element is defined by (x1+u1, y1+v1)and θ1, and the node number 2 is defined by (x2 + u2, y2 + v2) and θ2, where u1 and v1 are the horizontal and verticaldisplacement of node 1, respectively, u2 and v2 are the horizontal and vertical displacement of node 2, and θ1 and θ2 arethe rotation angles of the nodes number 1 and 2, respectively, which are measured starting from its initial position. Two
J. Meléndez, J. AvilaDynamic response analysis of steel catenary risers under the influence of an internal slug flow
x1 u1
x2 u2
y1
v1
y 2v
2
α θ1
θ1l θ2θ2l
β
β0Initial
Configuration
CurrentConfiguration
x
y
t
n
1
12
2
Figure 1. Initial and current configuration of a beam element.
coordinates systems are used in the corotational approach, the global coordinate system (x,y) and the local corotatingcoordinate system (t,n), where the direction of t is given by the straight line between the nodal points 1 and 2 in thecurrent configuration.
From Fig. 1, the global displacement vector u and the local displacement vector ul are defined as the following:
u ={u1 v1 θ1 u2 v2 θ2
}T(1)
ul ={u θ1l θ2l
}T(2)
where u is the local axial displacement of the beam element, θ1l and θ2l are the local rotations of nodes 1 and 2, respec-tively. The components of ul are calculated according to:
u = L− Lo (3)
θll = θ1 − β + βo (4)
θ2l = θ2 − β + βo (5)
From Eqs. (3), (4), and (5), Lo and L are the measures of the distance between the nodes 1 and 2 in the initial andthe current configuration of the beam element, respectively, and βo and β are the measures of the inclination of the localcoordinates system in its initial and current configuration, respectively, with regards to the global coordinates system. Thevariables Lo, L, βo and β can be calculated as a function of the global nodal coordinates (x1, x2, y1 and y2) and thehorizontal and vertical displacements (u1, u2, v1 and v2).
Applying the variational operator on the Eqs. (3), (4), and (5), the following relationship between the local and globalvariables is obtained:
δul = Bδu (6)
where the matrix B is defined by
B =
−cosβ −sinβ 0 cosβ sinβ 0−sinβ/L cosβ/L 1 sinβ/L −cosβ/L 0−sinβ/L cosβ/L 0 sinβ/L −cosβ/L 1
(7)
24th ABCM International Congress of Mechanical Engineering (COBEM 2017)December 3-8, 2017, Curitiba, PR, Brazil
2.1 Calculus of the tangent stiffness matrix of a beam element
The amount of virtual work performed by the acting forces on the beam element in the global and local coordinatessystems is equivalent, and thus, the following relationship is valid:
δuTq = δulTql (8)
Substituting Eq. (6) in the right side of Eq. (8), the following equation, that relates the local force vector and the globalforce vector, is obtained:
q = BTql (9)
where q and ql are the vectors of global and local internal forces acting on the beam element, respectively. The vector oflocal internal forces contains the axial force N , which is considered constant along the beam element, and the local endmoments M1 and M2, acting on the nodal points 1 and 2, respectively. The vector of local forces is given by:
ql ={N M1 M2
}T(10)
where its components N , M1 and M2 are computed as:
N =EAu
Lo(11)
{M1
M2
}=
2EI
Lo
[2 11 2
]{θ1lθ2l
}(12)
where E is the modulus of elasticity and I is the second moment of area of the cross section of a beam element. Byapplying the variational operator to Eq. (9) and some mathematical manipulations, the tangent stiffness matrix kt for abeam element is obtained:
kt = BTClB +
(N
L
)zzT +
(M1 + M2
L2
)(rzT + zrT
)(13)
where Cl, z, and r are defined by:
Cl =EA
L0
1 0 00 4r2 2r2
0 2r2 4r2
(14)
z =[sinβ − cosβ 0 − sinβ cosβ 0
]T(15)
r =[− cosβ − sinβ 0 cosβ sinβ 0
]T(16)
where A is the cross-sectional area of the beam element, and r is the radius of gyration, which is defined as r =√I/A.
2.2 Local displacements of a beam element
The local displacements considered for a point P of the beam element are the local transverse displacement w and thelocal rotation θl. The local transverse displacement w is approximated using the conventional cubic polynomial, beingthe values of w zero at the two ends. Thus, w and θl would be expressed as
w =
(s− 2s2
L+s3
L2
)θ1l +
(−s
2
L+s3
L2
)θ2l (17)
θl =dw
ds=
(1− 4s
L+
3s2
L2
)θ1l +
(−2s
L+
3s2
L2
)θ2l (18)
From Eq. (17) and Eq. (18), s is the local coordinate in the tangential direction, and L is the length of the beamelement in the current configuration (see Fig. 1).
J. Meléndez, J. AvilaDynamic response analysis of steel catenary risers under the influence of an internal slug flow
3. ACTING LOADS ON A STEEL CATENARY RISER
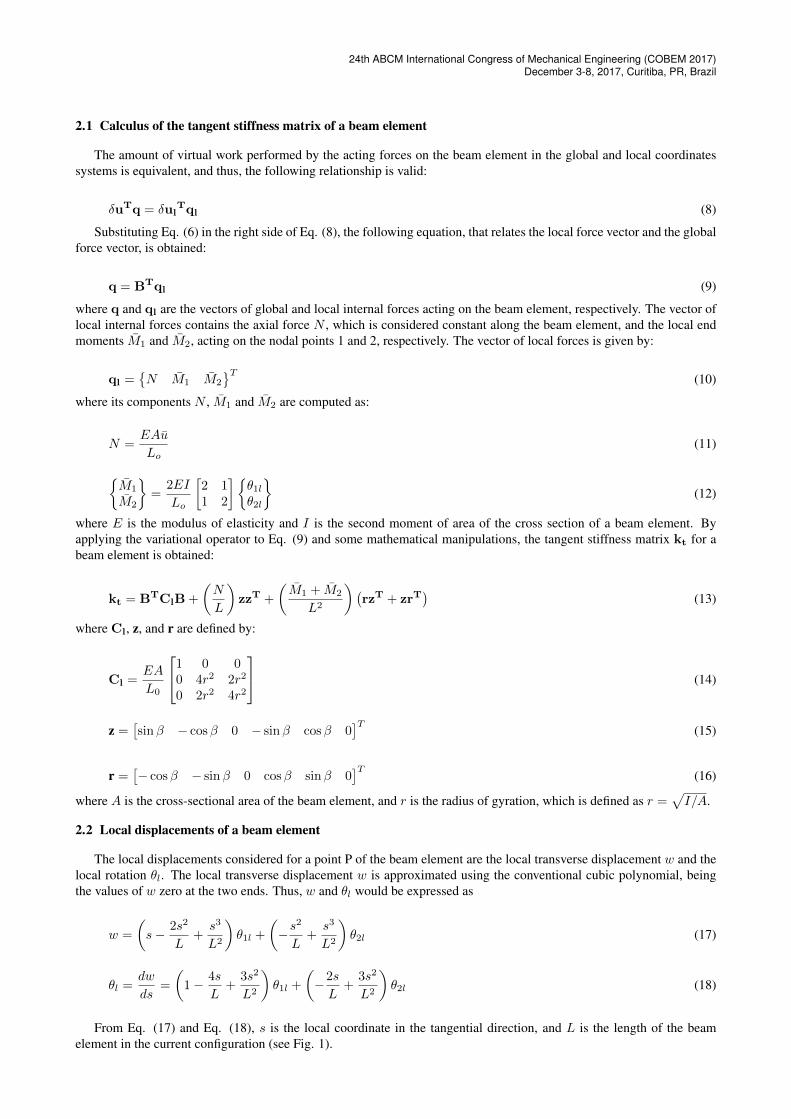
The acting loads on an element of SCR are shown in Fig. 2.
Ta
T +dTa a
M+dMV+dV
T+dTw w
VTw M
pe
pi
Ffn
Ffn
Wr
M+dMV+dV
VM
Fft
Ffn
Wa
Fm Fm
(a) (b)
Figure 2. (a) Acting loads over an element of SCR. (b) Equivalent forces system acting over an element of SCR.
• pe is the external pressure due to the seawater, and pi is the internal pressure due to the internal fluid.
• Tw is the true wall tension, V is the shear force, and M is the bending moment.
• Ffn and Fft are the acting forces due to the internal fluid in the normal and tangential direction to the riser elementaxis, respectively.
• Fm is the force due to the current. The force caused by the current is calculated using the Morison equation, forwhich the normal component approach is used. The normal component approach considers that the normal forcesto the SCR element are the predominant ones, whereas the tangential forces are not taken into account.
• Wr is the own weight of the riser.
Figure 2(b) shows an equivalent forces system, where Ta is the apparent tension acting on the riser, and Wa is theapparent weight of the riser. The procedure to obtain the equivalent forces system has been performed by Chucheepsakulet al. (2003).
3.1 Apparent tension
In a production riser, fluids act internally and externally, generating hydrostatic, static, and dynamic pressures. Theconcept of apparent tension is proposed by Chucheepsakul et al. (2003) with the purpose of represent the combined effectof the external and internal pressures and the true wall tension acting on an element of riser. The apparent tension, Ta,and the true wall tension, Tw, are related by means of the following equation:
Ta = Ta t = [Tw + 2ν (peAe − piAi)] t (19)
where ν is the Poisson’s coefficient, while Ae and Ai are the external and internal area of the transversal section of theriser, respectively. If the internal fluid is flowing with a velocity v, the following relationship is obtained:
Ta = Ta t =[Tw + 2ν
(peAe − piAi − ρfv2Ai
)]t (20)
where ρf is the density of the internal fluid.
3.2 Apparent weight
The concept of apparent weight is used to represent the combined effect of the weight of the riser and the buoyancyforces owing to the external and internal fluids acting on the riser (Sparks, 1984). Considering a differential element of
24th ABCM International Congress of Mechanical Engineering (COBEM 2017)December 3-8, 2017, Curitiba, PR, Brazil
length ds, the apparent weight of the riser element (wads) can be calculated by adding the Archimedian upthrust owingto the seawater (ρwAegds) and the weight of the contained fluid (ρfAegds) to the true weight of the pipe (wrds). Then,the following relationship is obtained:
wa = wr + ρfAig − ρwAeg (21)
where wa and wr are the apparent weight and the true weight of the riser per unit of length, respectively, ρf is the densityof the internal fluid, and ρw is the density of the seawater.
3.3 Loads due to the internal fluid
Consider a fluid finite system moving with a local velocity V and acceleration a. The force applied by the internalfluid on the riser element can be calculated as
dFf = −a.dm (22)
where Ff is the force vector owing to the dynamics of the internal fluid and dm is a differential element of the fluidmass. From Eq. (22) and using dm = ρfAids, the force owing to the internal fluid per unit of length of riser, ff , can becalculated as
ff = −ρfAia (23)
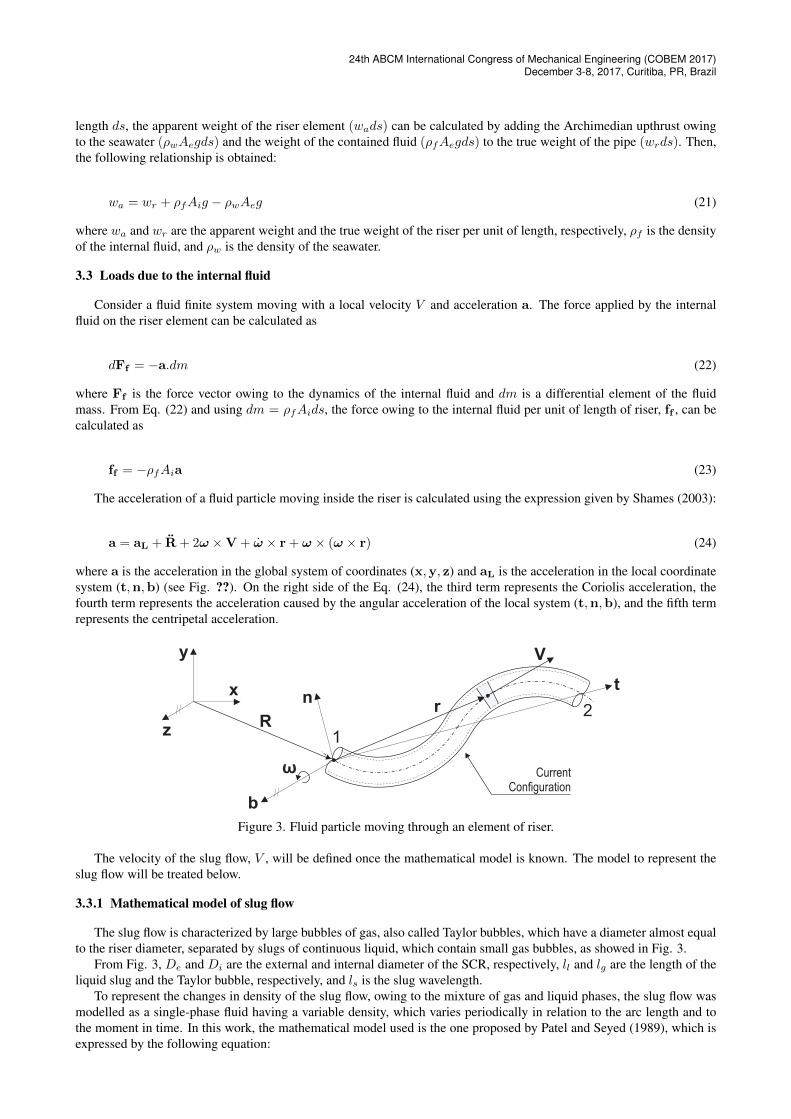
The acceleration of a fluid particle moving inside the riser is calculated using the expression given by Shames (2003):
a = aL + R + 2ω ×V + ω × r + ω × (ω × r) (24)
where a is the acceleration in the global system of coordinates (x,y, z) and aL is the acceleration in the local coordinatesystem (t,n,b) (see Fig. ??). On the right side of the Eq. (24), the third term represents the Coriolis acceleration, thefourth term represents the acceleration caused by the angular acceleration of the local system (t,n,b), and the fifth termrepresents the centripetal acceleration.
x
y
z
tn
b
Rr
V
ω CurrentConfiguration
1
2
Figure 3. Fluid particle moving through an element of riser.
The velocity of the slug flow, V , will be defined once the mathematical model is known. The model to represent theslug flow will be treated below.
3.3.1 Mathematical model of slug flow
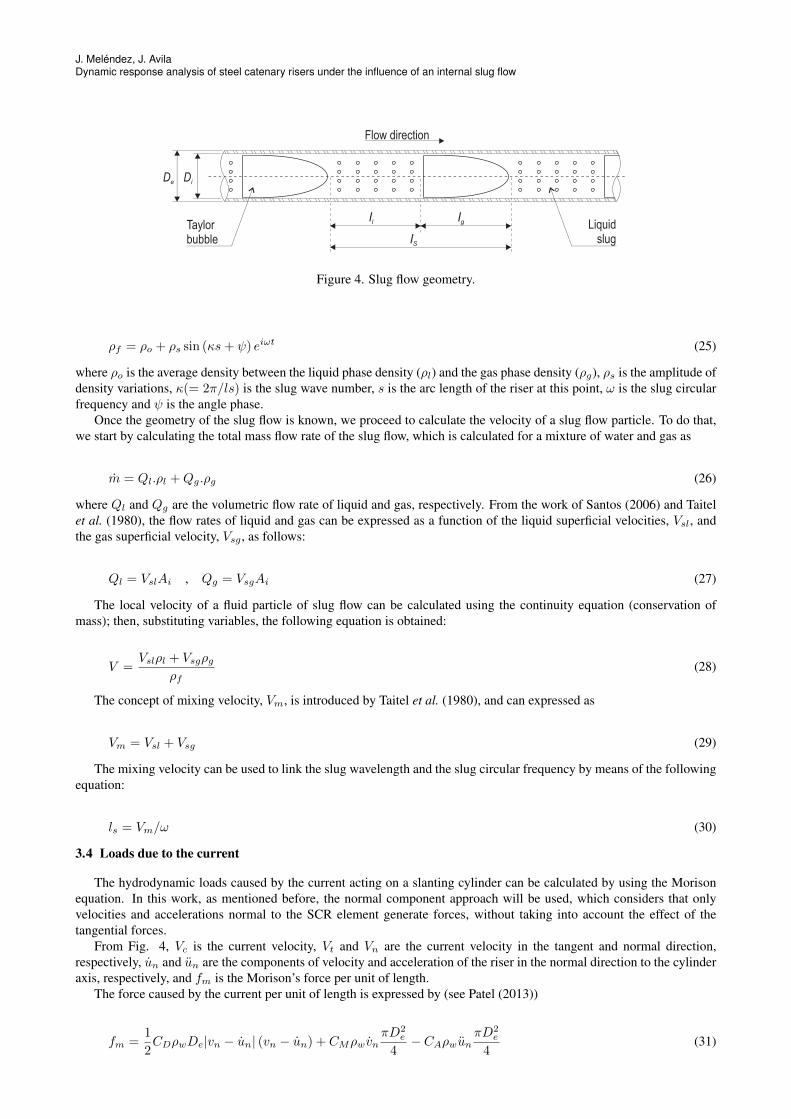
The slug flow is characterized by large bubbles of gas, also called Taylor bubbles, which have a diameter almost equalto the riser diameter, separated by slugs of continuous liquid, which contain small gas bubbles, as showed in Fig. 3.
From Fig. 3, De and Di are the external and internal diameter of the SCR, respectively, ll and lg are the length of theliquid slug and the Taylor bubble, respectively, and ls is the slug wavelength.
To represent the changes in density of the slug flow, owing to the mixture of gas and liquid phases, the slug flow wasmodelled as a single-phase fluid having a variable density, which varies periodically in relation to the arc length and tothe moment in time. In this work, the mathematical model used is the one proposed by Patel and Seyed (1989), which isexpressed by the following equation:
J. Meléndez, J. AvilaDynamic response analysis of steel catenary risers under the influence of an internal slug flow
lgll
lS
Liquidslug
Taylorbubble
Flow direction
Figure 4. Slug flow geometry.
ρf = ρo + ρs sin (κs+ ψ) eiωt (25)
where ρo is the average density between the liquid phase density (ρl) and the gas phase density (ρg), ρs is the amplitude ofdensity variations, κ(= 2π/ls) is the slug wave number, s is the arc length of the riser at this point, ω is the slug circularfrequency and ψ is the angle phase.
Once the geometry of the slug flow is known, we proceed to calculate the velocity of a slug flow particle. To do that,we start by calculating the total mass flow rate of the slug flow, which is calculated for a mixture of water and gas as
m = Ql.ρl +Qg.ρg (26)
where Ql and Qg are the volumetric flow rate of liquid and gas, respectively. From the work of Santos (2006) and Taitelet al. (1980), the flow rates of liquid and gas can be expressed as a function of the liquid superficial velocities, Vsl, andthe gas superficial velocity, Vsg , as follows:
Ql = VslAi , Qg = VsgAi (27)
The local velocity of a fluid particle of slug flow can be calculated using the continuity equation (conservation ofmass); then, substituting variables, the following equation is obtained:
V =Vslρl + Vsgρg
ρf(28)
The concept of mixing velocity, Vm, is introduced by Taitel et al. (1980), and can expressed as
Vm = Vsl + Vsg (29)
The mixing velocity can be used to link the slug wavelength and the slug circular frequency by means of the followingequation:
ls = Vm/ω (30)
3.4 Loads due to the current
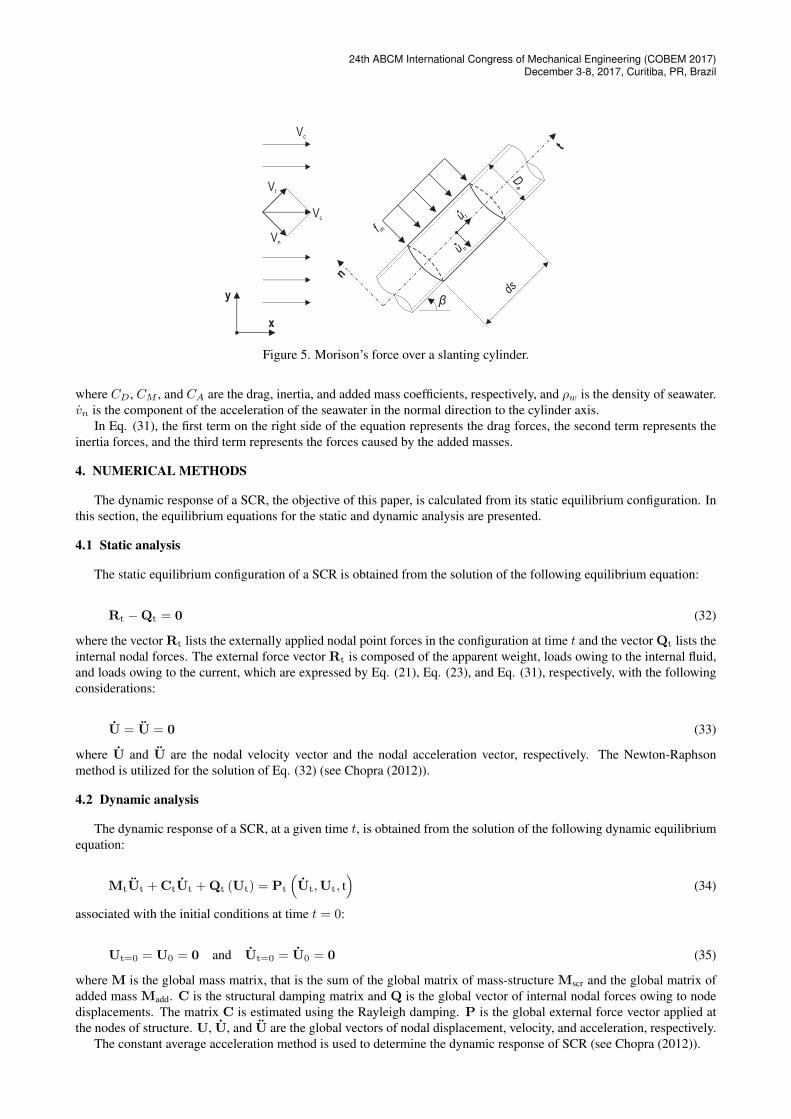
The hydrodynamic loads caused by the current acting on a slanting cylinder can be calculated by using the Morisonequation. In this work, as mentioned before, the normal component approach will be used, which considers that onlyvelocities and accelerations normal to the SCR element generate forces, without taking into account the effect of thetangential forces.
From Fig. 4, Vc is the current velocity, Vt and Vn are the current velocity in the tangent and normal direction,respectively, un and un are the components of velocity and acceleration of the riser in the normal direction to the cylinderaxis, respectively, and fm is the Morison’s force per unit of length.
The force caused by the current per unit of length is expressed by (see Patel (2013))
fm =1
2CDρwDe|vn − un| (vn − un) + CMρwvn
πD2e
4− CAρwun
πD2e
4(31)
24th ABCM International Congress of Mechanical Engineering (COBEM 2017)December 3-8, 2017, Curitiba, PR, Brazil
De
ds
x
y
n
tVc
Vc
Vt
Vn
f m
u n
u t
β
Figure 5. Morison’s force over a slanting cylinder.
where CD, CM , and CA are the drag, inertia, and added mass coefficients, respectively, and ρw is the density of seawater.vn is the component of the acceleration of the seawater in the normal direction to the cylinder axis.
In Eq. (31), the first term on the right side of the equation represents the drag forces, the second term represents theinertia forces, and the third term represents the forces caused by the added masses.
4. NUMERICAL METHODS
The dynamic response of a SCR, the objective of this paper, is calculated from its static equilibrium configuration. Inthis section, the equilibrium equations for the static and dynamic analysis are presented.
4.1 Static analysis
The static equilibrium configuration of a SCR is obtained from the solution of the following equilibrium equation:
Rt −Qt = 0 (32)
where the vector Rt lists the externally applied nodal point forces in the configuration at time t and the vector Qt lists theinternal nodal forces. The external force vector Rt is composed of the apparent weight, loads owing to the internal fluid,and loads owing to the current, which are expressed by Eq. (21), Eq. (23), and Eq. (31), respectively, with the followingconsiderations:
U = U = 0 (33)
where U and U are the nodal velocity vector and the nodal acceleration vector, respectively. The Newton-Raphsonmethod is utilized for the solution of Eq. (32) (see Chopra (2012)).
4.2 Dynamic analysis
The dynamic response of a SCR, at a given time t, is obtained from the solution of the following dynamic equilibriumequation:
MtUt + CtUt + Qt (Ut) = Pt
(Ut,Ut, t
)(34)
associated with the initial conditions at time t = 0:
Ut=0 = U0 = 0 and Ut=0 = U0 = 0 (35)
where M is the global mass matrix, that is the sum of the global matrix of mass-structure Mscr and the global matrix ofadded mass Madd. C is the structural damping matrix and Q is the global vector of internal nodal forces owing to nodedisplacements. The matrix C is estimated using the Rayleigh damping. P is the global external force vector applied atthe nodes of structure. U, U, and U are the global vectors of nodal displacement, velocity, and acceleration, respectively.
The constant average acceleration method is used to determine the dynamic response of SCR (see Chopra (2012)).
J. Meléndez, J. AvilaDynamic response analysis of steel catenary risers under the influence of an internal slug flow
5. NUMERICAL RESULTS
In this section will be shown the numerical results obtained for the top tension applied in a SCR of real dimensions.The top tension was calculated for several values of slug flow frequencies, as well as for several values of the gaseousphase density. The geometric characteristics and mechanical properties of the SCR used in the simulations are listed inTab. 1.
Table 1. Geometric characteristics and mechanical properties of the simulated riser.
Properties of simulated riser ValuesRiser length (m) 450External diameter (m) 0.40Internal diameter (m) 0.36Effective weight (kN/m) 0.59Elasticity modulus (GN/m2) 206Bending stiffness (kN.m2) 8900Poisson’s coefficient 0.5Damping ratio (%) 1
In this work, we consider that the riser is immersed in still water, in other words, with a current velocity equal to zero.For this reason, in the calculation of the dynamic response, only the drag force and the forces caused by the added massesfrom Eq. (31) are considered.
In the model simulations, the internal fluid will be represented as a mixture of water and gas. The density of water is998 kg/m3. In the case of the gaseous phase, air is used and we consider that the gas behaves as an ideal gas, which ispressurized between 2000 and 5000 psi and operates at a temperature of 298 K. The density of the gaseous phase will beconsidered to have a value of 200 kg/m3. An average production capacity of the riser of 180000 BPD (barrels per day)is taken into consideration to estimate the values of the liquid and gas mass flows.
The depth of the sea is 300 meters with a density of 1025 kg/m3. For the present calculations, the drag and theadded masses coefficients of the sea were considered as 0.7 and 1.0, respectively. To determine the static configuration, ahorizontal force of 80 kN was applied to the top.
In the present analysis several cases are considered. It is important to point out that in every simulated case, the slugflow frequency was considered constant along the riser and at every moment in time. In the numerical simulations asimulation time of 500 s was considered.
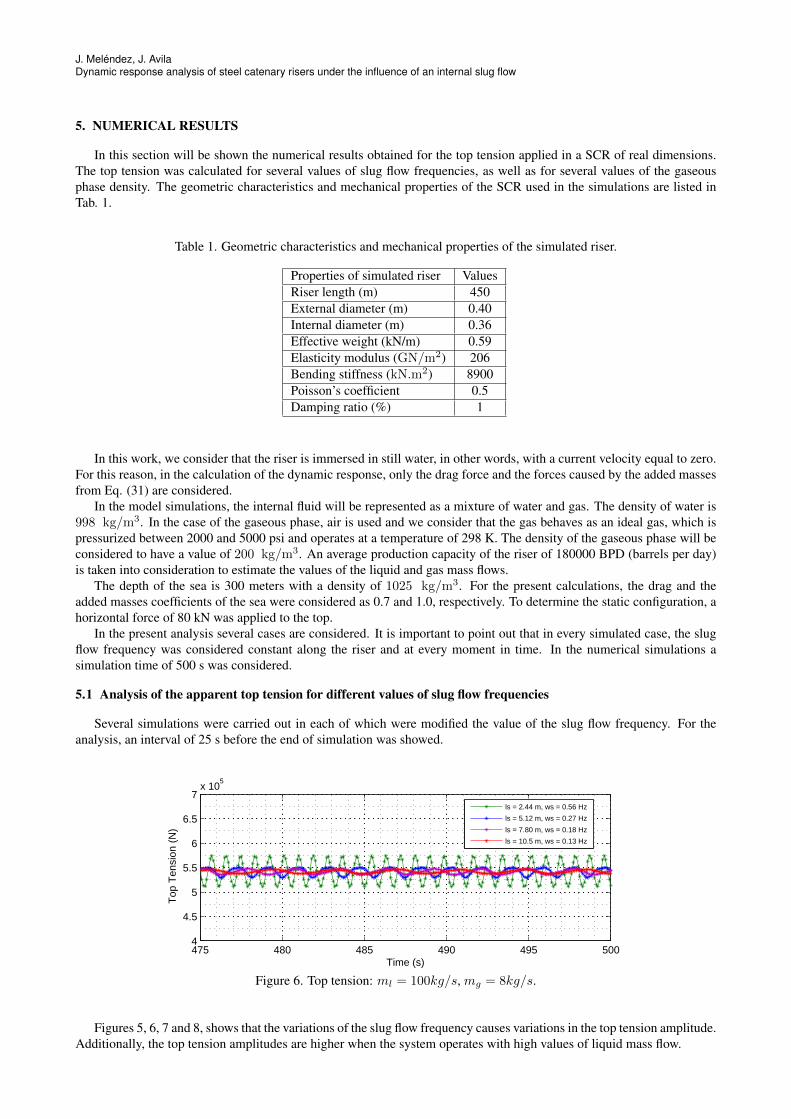
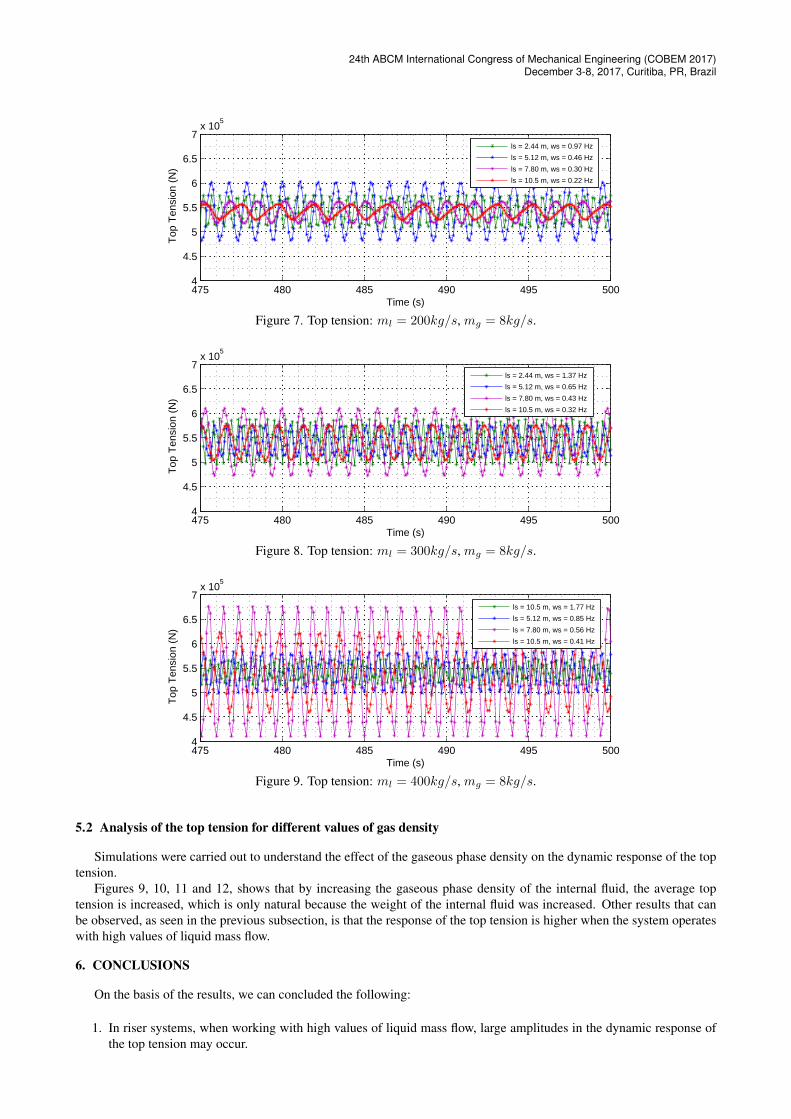
5.1 Analysis of the apparent top tension for different values of slug flow frequencies
Several simulations were carried out in each of which were modified the value of the slug flow frequency. For theanalysis, an interval of 25 s before the end of simulation was showed.
475 480 485 490 495 5004
4.5
5
5.5
6
6.5
7x 10
5
Time (s)
Top
Ten
sion
(N
)
ls = 2.44 m, ws = 0.56 Hz
ls = 5.12 m, ws = 0.27 Hz
ls = 7.80 m, ws = 0.18 Hz
ls = 10.5 m, ws = 0.13 Hz
Figure 6. Top tension: ml = 100kg/s, mg = 8kg/s.
Figures 5, 6, 7 and 8, shows that the variations of the slug flow frequency causes variations in the top tension amplitude.Additionally, the top tension amplitudes are higher when the system operates with high values of liquid mass flow.
24th ABCM International Congress of Mechanical Engineering (COBEM 2017)December 3-8, 2017, Curitiba, PR, Brazil
475 480 485 490 495 5004
4.5
5
5.5
6
6.5
7x 10
5
Time (s)
Top
Ten
sion
(N
)
ls = 2.44 m, ws = 0.97 Hz
ls = 5.12 m, ws = 0.46 Hz
ls = 7.80 m, ws = 0.30 Hz
ls = 10.5 m, ws = 0.22 Hz
Figure 7. Top tension: ml = 200kg/s, mg = 8kg/s.
475 480 485 490 495 5004
4.5
5
5.5
6
6.5
7x 10
5
Time (s)
Top
Ten
sion
(N
)
ls = 2.44 m, ws = 1.37 Hz
ls = 5.12 m, ws = 0.65 Hz
ls = 7.80 m, ws = 0.43 Hz
ls = 10.5 m, ws = 0.32 Hz
Figure 8. Top tension: ml = 300kg/s, mg = 8kg/s.
475 480 485 490 495 5004
4.5
5
5.5
6
6.5
7x 10
5
Time (s)
Top
Ten
sion
(N
)
ls = 10.5 m, ws = 1.77 Hz
ls = 5.12 m, ws = 0.85 Hz
ls = 7.80 m, ws = 0.56 Hz
ls = 10.5 m, ws = 0.41 Hz
Figure 9. Top tension: ml = 400kg/s, mg = 8kg/s.
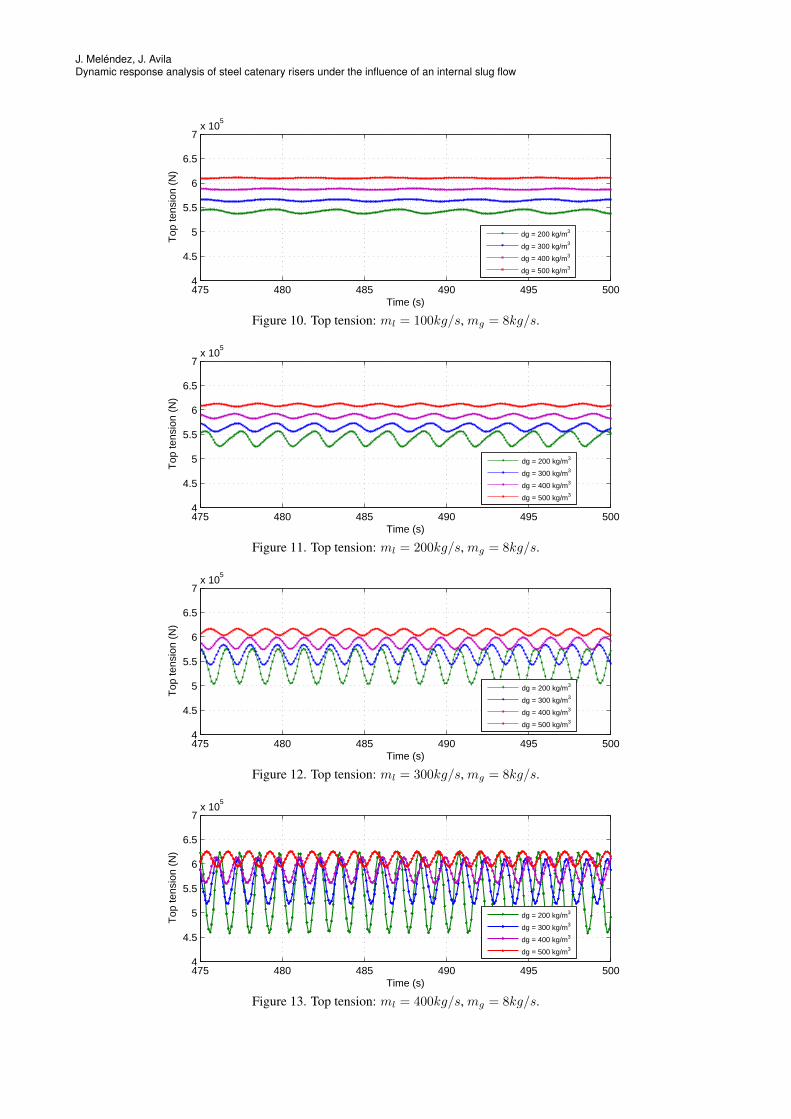
5.2 Analysis of the top tension for different values of gas density
Simulations were carried out to understand the effect of the gaseous phase density on the dynamic response of the toptension.
Figures 9, 10, 11 and 12, shows that by increasing the gaseous phase density of the internal fluid, the average toptension is increased, which is only natural because the weight of the internal fluid was increased. Other results that canbe observed, as seen in the previous subsection, is that the response of the top tension is higher when the system operateswith high values of liquid mass flow.
6. CONCLUSIONS
On the basis of the results, we can concluded the following:
1. In riser systems, when working with high values of liquid mass flow, large amplitudes in the dynamic response ofthe top tension may occur.
J. Meléndez, J. AvilaDynamic response analysis of steel catenary risers under the influence of an internal slug flow
475 480 485 490 495 5004
4.5
5
5.5
6
6.5
7x 10
5
Time (s)
Top
tens
ion
(N)
dg = 200 kg/m3
dg = 300 kg/m3
dg = 400 kg/m3
dg = 500 kg/m3
Figure 10. Top tension: ml = 100kg/s, mg = 8kg/s.
475 480 485 490 495 5004
4.5
5
5.5
6
6.5
7x 10
5
Time (s)
Top
tens
ion
(N)
dg = 200 kg/m3
dg = 300 kg/m3
dg = 400 kg/m3
dg = 500 kg/m3
Figure 11. Top tension: ml = 200kg/s, mg = 8kg/s.
475 480 485 490 495 5004
4.5
5
5.5
6
6.5
7x 10
5
Time (s)
Top
tens
ion
(N)
dg = 200 kg/m3
dg = 300 kg/m3
dg = 400 kg/m3
dg = 500 kg/m3
Figure 12. Top tension: ml = 300kg/s, mg = 8kg/s.
475 480 485 490 495 5004
4.5
5
5.5
6
6.5
7x 10
5
Time (s)
Top
tens
ion
(N)
dg = 200 kg/m3
dg = 300 kg/m3
dg = 400 kg/m3
dg = 500 kg/m3
Figure 13. Top tension: ml = 400kg/s, mg = 8kg/s.
24th ABCM International Congress of Mechanical Engineering (COBEM 2017)December 3-8, 2017, Curitiba, PR, Brazil
2. In a real riser occur constant variations in the amplitude of the top tension, because the slug flow frequency variesconstantly along the riser.
7. ACKNOWLEDGEMENTS
The authors gratefully acknowledge the financial support by the Coordination for the Improvement of Higher Educa-tion Personnel (CAPES) and the National Institute for Space Research (INPE). The authors are also grateful to the FederalUniversity of ABC (UFABC) for the use of their facilities for carrying out this work.
8. REFERENCES
Chopra, A.K., 2012. Dynamics of structures: theory and applications to earthquake engineering. Prentice-Hall, 4thedition.
Chucheepsakul, S., Monprapussorn, T. and Huang, T., 2003. “Large strain formulations of extensible flexible marinepipes transporting fluid”. Journal of Fluids and Structures, Vol. 17, No. 2, pp. 185–224.
Ortega, A., 2015. Dynamic response of flexible risers due to unsteady slug flow. Ph.D. thesis, Norwegian University ofScience and Technology, Norway.
Patel, M. and Seyed, F., 1989. “Internal flow-induced behaviour of flexible risers”. Engineering Structures, Vol. 11, No. 4,pp. 266–280.
Patel, M.H., 2013. Dynamics of offshore structures. Butterworth-Heinemann.Santos, E., 2006. Estudo do escoamento bifásico em risers em movimento na produção maritima de petroleo em aguas
profundas. Master’s thesis, State University of Campinas, São Paulo.Shames, I., 2003. Mechanics of fluids. McGraw-Hill New York, 4th edition.Sparks, C., 1984. “The influence of tension, pressure and weight on pipe and riser deformations and stresses”. Transac-
tions of the ASME. Journal of Energy Resources Technology, Vol. 106, No. 1, pp. 46–54.Taitel, Y., Bornea, D. and Dukler, A., 1980. “Modelling flow pattern transitions for steady upward gas-liquid flow in
vertical tubes”. AIChE Journal, Vol. 26, No. 3, pp. 345–354.Valdivia, P., 2008. Estudo experimental e numerico da dinamica de movimento de riser em catenaria com escoamento
interno. Master’s thesis, State University of Campinas, São Paulo.Yaw, L., 2009. “2d corotational beam formulation”.
9. RESPONSIBILITY NOTICE
The following text, properly adapted to the number of authors, must be included in the last section of the paper:The author(s) is (are) the only responsible for the printed material included in this paper.