coarse-grained modeling of the calcium, sodium, magnesium
TRANSCRIPT

Coarse-Grained Modeling of The Calcium, Sodium,Magnesium And Potassium Cations InteractingWith ProteinsAgnieszka Gabriela Lipska ( [email protected] )
University of Gdansk: Uniwersytet Gdanski https://orcid.org/0000-0002-8390-8473Anna Maria Antoniak
University of Gdansk: Uniwersytet GdanskiPatryk Wesołowski
Intercollegiate Faculty of Biotechnology of the University of Gdańsk and the Medical University ofGdańsk: Miedzyuczelniany Wydzial Biotechnologii Uniwersytetu Gdanskiego i Gdanskiego UniwersytetuMedycznegoAlan Warszawski
Intercollegiate Faculty of Biotechnology of the University of Gdańsk and the Medical University ofGdańsk: Miedzyuczelniany Wydzial Biotechnologii Uniwersytetu Gdanskiego i Gdanskiego UniwersytetuMedycznegoSergey A Samsonov
University of Gdansk: Uniwersytet GdanskiAdam Kazimierz Sieradzan
University of Gdansk: Uniwersytet Gdanski
Research Article
Keywords: proteins, metal ions, UNRES force �eld, protein-ion binding
Posted Date: November 16th, 2021
DOI: https://doi.org/10.21203/rs.3.rs-1079923/v1
License: This work is licensed under a Creative Commons Attribution 4.0 International License. Read Full License
Coarse-grained modeling of the calcium, sodium,
magnesium and potassium cations interacting
with proteins
Agnieszka G. Lipska ,∗,† Anna M. Antoniak,†,¶ Patryk Wesołowski,‡,¶ Alan
Warszawski,‡ Sergey A. Samsonov ,† and Adam K.Sieradzan †
†Faculty of Chemistry, University of Gdansk, Wita Stwosza 63, 80-308 Gdansk, Poland
‡Intercollegiate Faculty of Biotechnology of UG i MUG, Abrahama 58 80-307 Gdansk, Poland
¶Contributed equally to this work
E-mail: [email protected]
Phone: +48585235350
1
Abstract2
Metal ions play important biological roles e.g.: activation or deactivation of enzy-3
matic reactions and signal transduction. Moreover, they can stabilize protein structure,4
or even be actively involved in the protein folding process. Therefore, accurate treat-5
ment of the ions is crucial to model and investigate biological phenomena properly.6
In this work the coarse-grained UNRES (UNited RESidue) force field was extended7
to include the interactions between proteins and four alkali or alkaline earth metal8
cations of biological significance, i.e. calcium, magnesium, sodium and potassium. Ad-9
ditionally, chloride anions were introduced as counter-ions. Parameters were derived10
from all-atom simulations and incorporate water in an implicit manner. The new force11
field was tested on the set of the proteins and was able to reproduce the ion-binding12
preferences.13
1

Keywords14
proteins, metal ions, UNRES force field, protein-ion binding15
Introduction16
Approximately 40 % of the protein structures deposited in the Protein Data Bank (PDB)17
contain one or more ions.1 In some cases these ions were introduced artificially to enable18
structure determination, nevertheless most of them play important biological roles e.g.:19
structure stabilization, activation/deactivation of enzymatic reactions and signal transduc-20
tion.2 Therefore, accurate treatment of the ions is crucial to model biological phenomena21
properly.22
The most abundant ions in proteins structures from the PDB are Zn2+, Mg2+ and23
Ca2+. They have significant effect on the protein folding, stabilize the structure and are an24
integral part of numerous enzymes.3 If the cell environment is taken into account Na+ and25
K+ are the metal ions with the highest concentration. They take part in signal transduction.26
Alkali and alkaline earth metal ions have a relatively straightforward pattern of inter-27
actions, in contrast to, for example, transition-metal cations, that form coordinate chemical28
bonds with protein side-chain atoms. Therefore Mg2+, Ca2+, Na+ and K+ are going to be29
the main subject of this work.30
These ions have different interaction preferences for coordinating groups that can be31
summarized as follows: for Ca2+ Asp, Glu, Asn, Gln and oxygen from the main chain, for32
Mg2+ Asp, Glu and oxygen from the main chain, and for K+ and Na+ oxygen from the33
main chain. In case of the two last ions the interactions are almost entirely electrostatic but34
the coordination geometry is essential.135
The average concentration of these ions in free state in blood plasma are: 145 mM,4 436
mM,5 1.5 mM6 and 1.8 mM7 for Na+, K+, Mg2+, Ca2+ respectively. Disturbed homeostasis37
of these macroelements can lead to many disorders and diseases, such as: insomnia, anxiety,38
2

urolithiasis or cardiac arrhythmia.8 Moreover, there is evidence that altered Mg2+ and Ca2+39
homeostasis may be related to the progression of neurodegenerative diseases associated40
with intrinsically disordered proteins (IDP): Alzheimer’s disease and Parkinson’s disease.941
While investigating the protein-ion interactions, especially when one aims to obtain42
information about the dynamics, the use of the methods based on the all-atom force43
fields seems to be appropriate. The extensive review about metal ion modeling has been44
published,10 it covers various strategies in quantum mechanics, classical and polarizable45
force field methods. Generally, three ion models are frequently used: nonbonded, bonded46
and with dummy atoms. Those representations are used in many common software47
like: AMBER,11–14 CHARMM,15 and GROMOS.16 Unfortunately, the use of all-atom (AA)48
methods require high computational power, especially because most ion-binding proteins49
are often large multichain subunits. In this regard, coarse-grained (CG) models can be50
a good alternative. However, introduction of metal ions is a challenging task and this51
issue is often dismissed in CG representations. In one of the most popular CG force field52
MARTINI ions are represented as a Q type particle (charged interaction site).17 In case of53
single-atom ions the first hydration shell is considered as a part of CG representation. The54
MARTINI ion model is only qualitatively accurate and the force field itself is unable to55
model protein folding events.17,1856
Another example is SIRAH force field19,20 developed to treat proteins with explicit rep-57
resentation of water (WT4) composed by four linked beads and represents 11 tetrahedrally-58
coordinated water molecules.21 Hydrated ions: Na+, K+, Ca2+ and Cl− are also considered59
explicitly, each extended ion particle comprising the actual ion and 6 water molecules cor-60
responding to the first hydration shell.20,21 It has been used in the simulations of natively61
unfolded proteins and protein aggregation and has the ability to capture ionic strength62
effects.63
The coarse-grained UNited RESidue (UNRES)22–24 force field was already successfully64
extended to treat calcium-protein interactions25 by deriving the interactions of the ion65
3

with Asp, Glu, Asn and Gln side-chains and the peptide group. For the side-chains that do66
not interact with calcium specifically, simple excluded-volume potentials were introduced.67
The parameters of the potentials were obtained from potential-energy surfaces of model68
system: Ca2+-acetate, Ca2+-propionate, Ca2+-acetamide, Ca2+-propionamide, and Ca2+-69
N-methylacetamide systems calculated by using ab inito molecular quantum mechanics70
at the Restricted Hartree-Fock (RHF) level with the 6-31G(d,p) basis set. It should be71
noted that those calculations were performed in vacuo and obtained potentials of mean72
force (PMFs) were divided by water dielectric constant. Thus, these potentials do not73
incorporate interactions with solvent and cover only the interactions only with carbonyl74
groups.75
In this article we extended the UNRES force field to investigate the interactions between76
proteins and four alkali and alkaline earth metals of biological significance, i.e. calcium,77
magnesium, sodium and potassium. Additionally the parameters for chloride ion were78
also included. The neutrality of the system is not necessary while performing simulations79
with the UNRES force field but in case when one wants to represent the environment more80
accurately, especially under high ionic strength, they can be required.81
The method of deriving the potentials was modified with regards to the one previously82
used for the calcium ion.25 The following two modifications were introduced. First,83
the new potentials were derived to incorporate interactions with solvent in an implicit84
manner and therefore the AA force field was used. Second, we considered all amino-acid85
side-chains and peptide group. Hence the corresponding modifications of the calcium86
ion-protein interaction center potentials were also recalculated. Introduced potentials have87
been tested based on the known structures of proteins with bound metal ions.88
4

Methods89
UNRES force field90
In the coarse-grained UNRES model22–24 a polypeptide chain is described by two geometry91
points per residue namely: Cα atom and the geometrical center of each side-chain (SC).92
Moreover, there are two types of interaction sites: peptide group (p), which is positioned93
halfway between consecutive Cα atoms and geometrical center of a side-chain. The peptide94
groups are modeled with spheres whereas side-chains are ellipsoids of revolution along95
the longer axis (Fig. 1). It should be noted that the Cα atom is not a center of interaction and96
acts only as a geometric center. The effective energy function is represented by restricted97
free energy (RFE) or potential of mean force (PMF) of a given conformation ensemble98
restricted to coarse-grained conformation defined by Cα and SC atoms and is expressed by99
(eq. 1):26100
U = wSC ∑i<j
USCiSCj+ wSCp ∑
i 6=j
USCi pj+ wVDW
pp ∑i<j−1
UVDWpi pj
+ welpp f2(T) ∑
i<j−1Uel
pi pj
+ wtor f2(T)∑i
Utor(γi, θi, θi+1) + wb ∑i
Ub(θi) + wrot ∑i
Urot(θi, αSCi, βSCi
)
+ wbond ∑i
Ubond(di) + w(3)corr f3(T)U
(3)corr + w
(3)turn f3(T)U
(3)turn + Uion−ion + Uion−prot
(1)
where the U′s are energy terms, θi is the backbone virtual-bond angle between three101
consecutive Cα atoms, γi is the backbone virtual-bond-dihedral angle between four con-102
secutive Cα atoms, αi and βi are the angles defining the location of the center of the united103
side-chain of residue i (Fig. 1) with respect to Cαi−1, Cα
i and Cαi+1 plane, di is the length of104
the ith virtual bond, which is either a Cα · · ·Cα virtual bond or Cα · · · SC virtual bond.24,251 105
Each energy term is multiplied by an appropriate weight, wx, and the terms corre-106
sponding to factors of order higher than 1 are additionally multiplied by the respective107
5

temperature factors that were introduced in paper22 and which reflect the dependence of108
the first generalized cumulant term in those factors on temperature, as discussed in refs 22109
and 27. The factors fn are defined by (eq 2).110
fn(T) =ln [exp(1) + exp(−1)]
ln{
exp[
(T/T◦)n−1]
+ exp[
− (T/T◦)n−1]} (2)
where T◦ = 300 K.111
The term USCiSCjrepresents the mean free energy of the hydrophobic (hydrophilic) in-112
teractions between the side chains, which implicitly contains the contributions from the in-113
teractions of the side chain with the solvent. The term USCi pjdenotes the excluded-volume114
potential of the side-chain – peptide-group interactions. The peptide-group interaction po-115
tential is split into two parts: the Lennard-Jones interaction energy between peptide-group116
centers (UVDWpi pj
) and the average electrostatic energy between peptide-group dipoles (Uelpi pj
);117
the second of these terms accounts for the tendency to form backbone hydrogen bonds118
between peptide groups pi and pj. The terms Utor, Ub, Urot, and Ubond are the virtual-bond-119
dihedral angle torsional terms, virtual-bond angle bending terms, side-chain rotamer, and120
virtual-bond-deformation terms, respectively; these terms account for the local properties121
of the polypeptide chain. The term U(3)corr represent correlation or multibody contributions122
from the coupling between backbone-local and backbone-electrostatic interactions, and the123
term U(3)turn are correlation contributions involving 3 consecutive peptide groups; they are,124
therefore, termed turn contributions. The term Uion−ion represents the ion-ion interactions125
with parameters as in our previous work25 (charge of each ion was adjusted appropriately).126
The term Uion−prot represents the ion-polypeptide-chain interactions (details of obtaining127
and verifying this term are described in the next parts of this paper).128
6
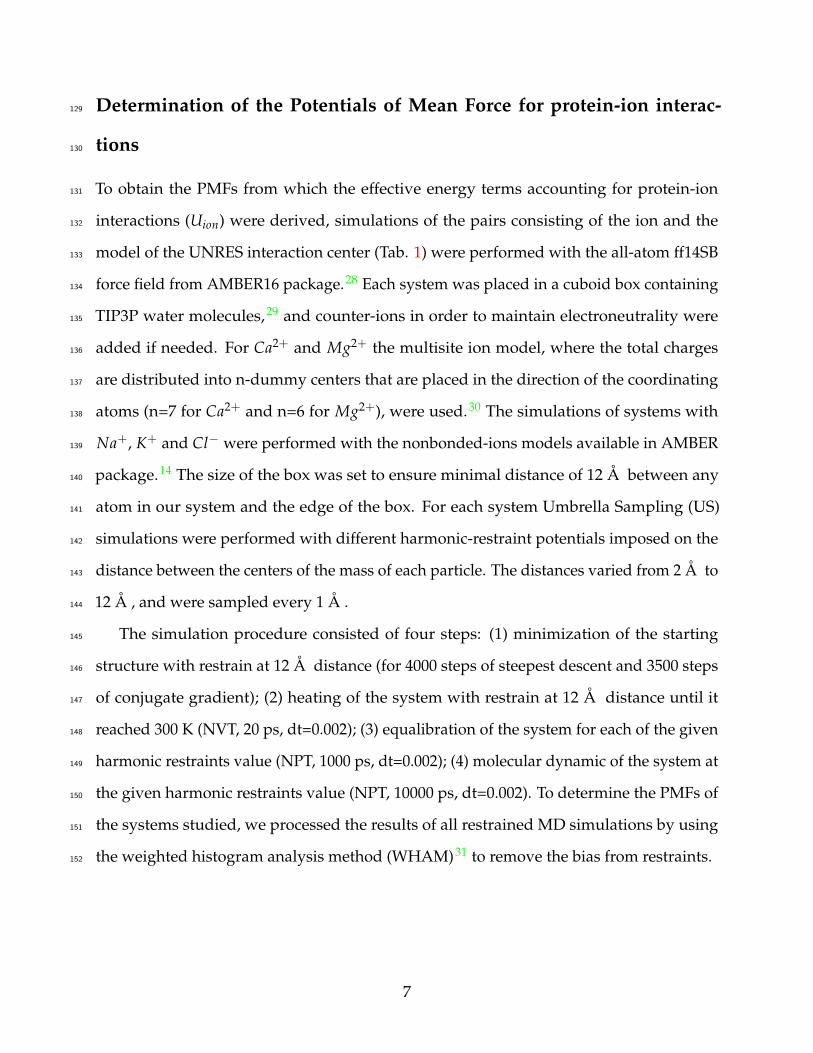
Determination of the Potentials of Mean Force for protein-ion interac-129
tions130
To obtain the PMFs from which the effective energy terms accounting for protein-ion131
interactions (Uion) were derived, simulations of the pairs consisting of the ion and the132
model of the UNRES interaction center (Tab. 1) were performed with the all-atom ff14SB133
force field from AMBER16 package.28 Each system was placed in a cuboid box containing134
TIP3P water molecules,29 and counter-ions in order to maintain electroneutrality were135
added if needed. For Ca2+ and Mg2+ the multisite ion model, where the total charges136
are distributed into n-dummy centers that are placed in the direction of the coordinating137
atoms (n=7 for Ca2+ and n=6 for Mg2+), were used.30 The simulations of systems with138
Na+, K+ and Cl− were performed with the nonbonded-ions models available in AMBER139
package.14 The size of the box was set to ensure minimal distance of 12 Å between any140
atom in our system and the edge of the box. For each system Umbrella Sampling (US)141
simulations were performed with different harmonic-restraint potentials imposed on the142
distance between the centers of the mass of each particle. The distances varied from 2 Å to143
12 Å , and were sampled every 1 Å .144
The simulation procedure consisted of four steps: (1) minimization of the starting145
structure with restrain at 12 Å distance (for 4000 steps of steepest descent and 3500 steps146
of conjugate gradient); (2) heating of the system with restrain at 12 Å distance until it147
reached 300 K (NVT, 20 ps, dt=0.002); (3) equalibration of the system for each of the given148
harmonic restraints value (NPT, 1000 ps, dt=0.002); (4) molecular dynamic of the system at149
the given harmonic restraints value (NPT, 10000 ps, dt=0.002). To determine the PMFs of150
the systems studied, we processed the results of all restrained MD simulations by using151
the weighted histogram analysis method (WHAM)31 to remove the bias from restraints.152
7

Analytical expressions for the energy of interaction of ions with153
polypeptide chain154
The two types of the UNRES interaction sites cover the 19 amino-acids (as Gly has no155
side-chain) and the peptide group. They can be divided into three categories, taking into156
account their physicochemical properties that are responsible for the nature of interaction157
with the ions: charged interaction sites (Asp, Glu, Arg, Lys), polar interaction sites (peptide158
group, Ser, Thr, Asn, Gln, Cys, His, Tyr) and hydrophobic sites (Ala, Val, Ile, Leu, Met, Phe,159
Trp, Pro). Hereby, the following three combinations of analytical expressions for energy160
interaction of ions with polypeptide chain were used.161
For the interactions of the ion with the charged sites, both negatively and positively,162
the following expression were used:163
Echarged−ion = EGB + ∆Fcav + Eel + egb (3)
where EGB is the van der Waals energy term for two ellipsoids expressed as the Gay-Berne-164
type potential, ∆Fcav is the cavity term which accounts for the difference between the free165
energy of hydratation of the side-chain-ion pair and the sum of the free energies of the166
isolated components, Eel is Coulombic term, and egb is generalized Born potential.167
The expression for the ion-polar sites interactions is defined by:168
Epolar−ion = EGB + ∆Fcav + Epol + Ecp (4)
where Epol is the polarization energy, and Ecp is charged-polar term.169
For the hydrophobic group the expression is defined by:170
Ehydro f obic−ion = EGB + ∆Fcav (5)
The general analytical expressions with which the effective energy of the interactions171
8
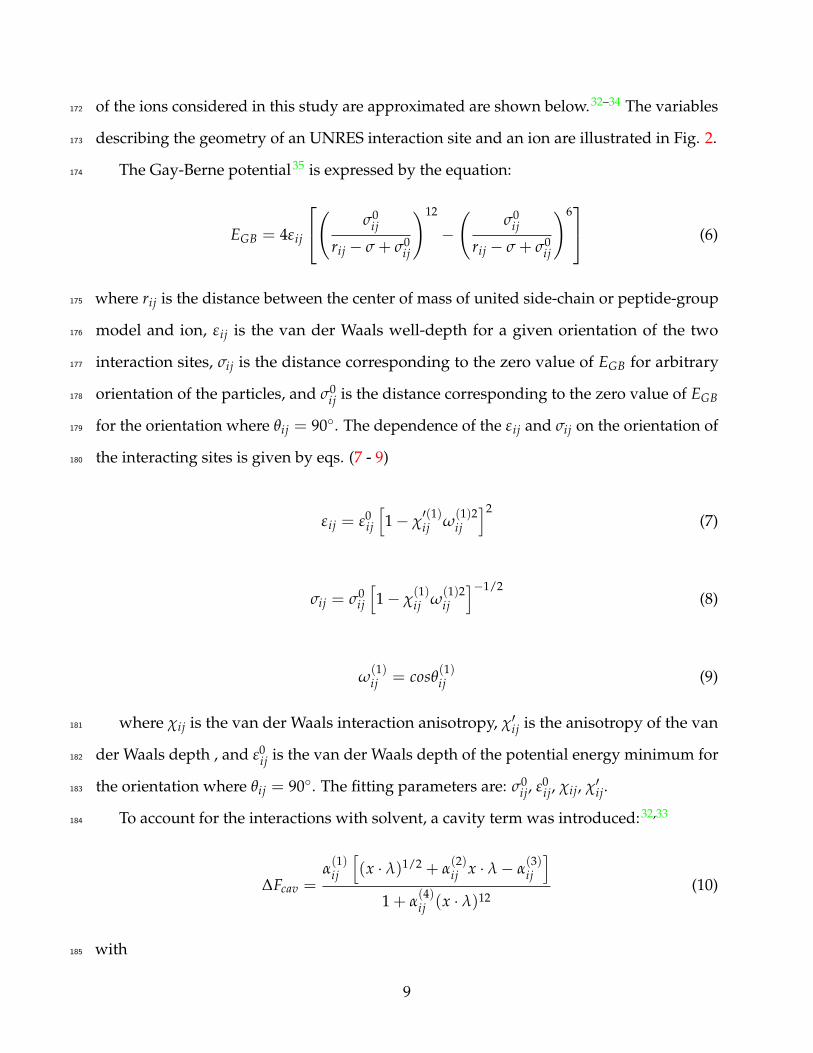
of the ions considered in this study are approximated are shown below.32–34 The variables172
describing the geometry of an UNRES interaction site and an ion are illustrated in Fig. 2.173
The Gay-Berne potential35 is expressed by the equation:174
EGB = 4εij
(
σ0ij
rij − σ + σ0ij
)12
−
(
σ0ij
rij − σ + σ0ij
)6
(6)
where rij is the distance between the center of mass of united side-chain or peptide-group175
model and ion, εij is the van der Waals well-depth for a given orientation of the two176
interaction sites, σij is the distance corresponding to the zero value of EGB for arbitrary177
orientation of the particles, and σ0ij is the distance corresponding to the zero value of EGB178
for the orientation where θij = 90◦. The dependence of the εij and σij on the orientation of179
the interacting sites is given by eqs. (7 - 9)180
εij = ε0ij
[
1 − χ′(1)ij ω
(1)2ij
]2(7)
σij = σ0ij
[
1 − χ(1)ij ω
(1)2ij
]−1/2(8)
ω(1)ij = cosθ
(1)ij (9)
where χij is the van der Waals interaction anisotropy, χ′ij is the anisotropy of the van181
der Waals depth , and ε0ij is the van der Waals depth of the potential energy minimum for182
the orientation where θij = 90◦. The fitting parameters are: σ0ij, ε0
ij, χij, χ′ij.183
To account for the interactions with solvent, a cavity term was introduced:32,33184
∆Fcav =α(1)ij
[
(x · λ)1/2 + α(2)ij x · λ − α
(3)ij
]
1 + α(4)ij (x · λ)12
(10)
with185
9

x =rij
√
σ2i + σ2
j
(11)
λ =[
1 − χ′′(1)ij ω
(1)2ij
]1/2(12)
where α(1)ij , α
(2)ij , α
(3)ij , and α
(4)ij are coefficients, σ2
i and σ2j are the deviation of the186
Gaussian distribution of the solute density for particles i and j, respectively, and χ′′(1)ij is187
the anisotropy pertaining to the cavity term. The fitting parameters are: α(1)ij , α
(2)ij , α
(3)ij , α
(4)ij ,188
χ′′(1)ij and σ =
√
σ2i + σ2
j .189
The polarization energy originated in the deformation of the charge distribution of the190
side-chain or peptide group by the ion is expressed by the equation:191
Epol = 332( 1
ǫin−
1ǫout
)( αpolji
fGB(r′
ji)
)4(13)
with fGB being the generalized Born function:36192
fGB(r′
ji) =
√
√
√
√r′2ji + aiajexp
(
−r′2ji
4aiaj
)
(14)
where the coefficient 322 is there to express the energies in kcal/mol, ǫin and ǫout are the193
effective dielectric constant of the "inside" of the interacting particles and the solvent (equal194
to 80 for water), respectively, αpolji is the polarizability of the nonpolar part of the particle i,195
ai and aj are the Born radii of particles i and j, and r′
ji is the distance between the interacting196
"head" of a side chain or peptide group and ion. The fitting parameters are: ai, ǫin, αpolji and197
dhead.198
The generalized Born term is expressed by equation:199
egb = 332qiqjD
fGB(r′
ji)(15)
10

with200
D =1
ǫin−
exp(−κ fGB(r′
ji))
ǫout(16)
where κ is Debay screening length. The fitting parameters are: κ and ai, ǫin and dhead.201
The Coulombic term is expressed by the equation:202
Eel = 332( q1q2
ǫinr′ij
)
(17)
where q1 and q2 are the charges of particles i and j, respectively. The fitting parameters are:203
ǫin and dhead.204
The charged-polar term is expressed by equation:34205
Ecp = w⊥ ·q · cos θij
r′2ij
− w‖ ·q2 · sin θij
2
r′4ij
(18)
where w⊥ and w‖ are fitting parameters, and r′
ij is a distance between the ion and the center206
of the amphiphilic head group of side-chain or peptide-group. The fitting parameters are:207
w⊥, w‖ and dhead.208
The approximate analytical expressions for ion-interaction-site energy functions were209
fitted to the PMF calculated numerically for each ion-interaction-site system by means of210
a nonlinear least-squares Marquardt method. The similar procedure was used before in211
introducing the potentials for protein-DNA interaction into UNRES force field34 Subse-212
quently, the obtained expressions were compatibly added to the already existing UNRES213
energy function.214
11

Verification of the protein-ion potentials215
Simulation procedures216
The developed coarse-grained model of polypeptide-ion interaction was tested to predict217
the ion-binding sites on five proteins listed in Tab. 2.218
A set of multiplexed replica exchange simulations (MREMD)37 were performed in219
temperatures 260 K, 272 K, 279 K, 284 K, 288 K, 291 K, 294 K, 298 K, 308 K, 322 K, 341 K,220
370 K. The temperature set was adjusted with the algorithm developed by Trebst et al.38221
which maximizes the walk of replicas in temperature. For each temperature 4 replicas222
were calculated. Every simulation took 10 mln steps with a time step equal to 4.89 fs. The223
periodic boundary conditions39 were used with the cubic boxes edges length equal to224
150 Å. The simulations were started from the experimental structures from the Protein225
Data Base (PDB) - including the position of ions. This starting point is sufficient because226
the MREMD allows to enhance probing of the conformation space and ions are able to227
dissociate and bound again to the protein. For analysis, only the second half of trajectories228
were considered. During the simulation temperatures were exchanged between trajectories229
every 10000 steps, therefore to obtain the correct ensemble properties reweighing was230
performed with the bin-less Weighted Histogram Analysis Method (WHAM), which was231
implemented in UNRES and described in earlier work.22 Subsequently, the five most232
populated clusters were obtained with the use of Ward’s minimum variance method40 in233
the temperature 280 K.234
The simulations in higher ion concentrations were performed for the systems where235
ions dissociate permanently after starting from the PDB structure. It was the case for two236
proteins: 2Z2K and 5E56, and used concentrations were 55 mM and 70 mM respectively.237
For this test counter-ions were used but the rest of the procedure was the same as the one238
described above.239
In the last test association binding constants of Ca2+, Mg2+, Na+ and K+ to the α-240
12

lactalbumin were computed and compared to experimental values. For this purpose the241
molecular dynamic simulations were performed for the 1F6S41 protein with the ion (Ca2+,242
Mg2+, Na+ or K+) bound in the native position. The 200 independent trajectories were run243
at 293 K, each last for 5 mln steps with time step equal to 4.89 fs. The periodic boundary244
conditions were the same as in two other tests.245
Analysis246
For simulations starting from the experimental structure the following analysis was per-247
formed. First, the representative structure for each cluster (the conformation with the248
lowest RMSD to cluster average structure) was determined and the TM-score was calcu-249
lated in order to check its quality.250
Subsequently, the distances averaged over all structures for ion from its starting place-251
ment for every cluster were calculated. Normalized histograms of those distances were252
also prepared.253
Moreover, the contact maps for ions and particular amino acid side-chains averaged254
over all structures were prepared for each cluster and compared with the corresponding255
experimental structure. The scoring function (Si,j) for the contact between any Cα atoms256
and ion (di,j) is defined as follows:42257
Si,j =
0 for di,j > 12
12−di,j4 for 8 ≤ di,j ≤ 12
1 for di,j < 8
(19)
Root-mean square fluctuation (RMSF) was used to analyze the fluctuation of Cα atoms258
in each cluster. As a reference structure the cluster representative was taken.259
For simulations with higher ion concentration the cluster representatives were also260
verified by TM-score. Then the radial distribution function (RDF) for the distances between261
13

ions and protein were calculated.262
In order to calculate the binding constants the concentration of unbound states as a263
function of time averaged over all 200 trajectories were calculated for each system. An264
unbound state was defined as a structure where ions were further than 8 Å from any Cα265
atom of the protein. Subsequently, function expressed by eq. 20 was fitted with the use of266
the nonlinear least-squares (NLLS) Marquardt-Levenberg algorithm43 implemented in the267
GNUPLOT program (http://www.gnuplot.info).268
[E](t) = 2[E]0k−1
(
1 − exp(−tW)
k−1(1 − exp(−tW)) + W(1 + exp(−tW))
)
(20)
where E[t] is the concentration of unbound ion and W is expressed by:269
W =√
k2−1 + 4k1k−1[E]0 (21)
The eq. 20 is derived based on the method used in.44270
Results and discussion271
Obtained Potentials of Mean Force and fitted functions272
The PMFs, fitted analytical energy functions and parameters are presented in SI (Fig. SI273
1-15 and Tab SI 1-3). The strongest interactions appeared for the systems containing ions:274
Ca2+ and Mg2+, and side-chain models for: Asp, Glu (Fig. SI 3A-D and Fig. SI 6A-D).275
This is reasonable as there is the strongest Coulombic interaction for oppositely charged276
molecules. Those two ions strongly interact also with Asn, Gln and the peptide-group277
models (Fig. SI 2 G-J,O-P and Fig. SI 5 G-J,O-P). For K+ and Na+ the strongest interaction278
is observed for Asp and Glu side-chain models (Fig. SI 9 A-D and Fig. SI 12 A-D). As279
in case of Ca2+ and Mg2+ the strongest interactions are observed for oppositely charged280
14

molecules. The next strongest interactions are for the peptide-group model (Fig. SI 8 O-P281
and Fig. SI 11 O-P), Asn and Gln models (Fig. SI 8 G-J and Fig. SI 11 G-J) and weaker for282
His model (Fig. SI 8 K-L and Fig. SI 11 K-L). For all metal ions also weak interactions for283
Ser model (Fig. SI 2 A-B, Fig. SI 5 A-B, Fig. SI 8 A-B, Fig. SI 11 A-B) and Thr model (Fig. SI284
2 C-D, Fig. SI 5 C-D, Fig. SI 8 C-D,and Fig. SI 11 C-D) were observed. Those patterns are285
mostly in agreement with the information collected from the PDB analysis.1 As for Cl−286
the interactions are observed for Arg and Ser models only (Fig. SI G-H and Fig. SI 14 A-B)287
but because of their weak character they are represented by even weaker CG potentials.288
Simulations on the test proteins set289
Probabilities and population sizes of each cluster, TM-score for cluster representative and290
average ion displacement are presented in Tab. 3. The probabilities and population sizes of291
each cluster represent satisfactory distribution of obtained structures. The TM-score shows292
that at least one cluster in each system has in about the same fold (the value is greater than293
∼ 0.5).294
Normalized histograms of distances between the predicted ion placement and the one295
in the native structure are in Fig. 3. As assumed, even for the metal ions that strongly296
interact with the protein, the ion was able to dissociate from the molecule during the297
simulation (panels A and B). Whereas for the rest of the ions the broader distances are298
represented (panels C, D and E) indicating weaker interactions.299
The contact maps for ion-protein interactions (Fig. 4) and structures (Fig. 5) are300
presented for proteins 6EKG, 4AQO and 4RJ9 because only for those systems contacts301
occur (Fig. 3).302
The best prediction of ion placement was determined for 4AQO protein with Ca2+,303
especially for the third and fifth clusters with average ion displacements 6.52 Å and 2.99304
Å , respectively (Tab. 3). The quality of predicted binding sites can be verified based on305
contact maps (Fig. 4) where the prediction of the amino-acid side-chains that interact with306
15

Ca2+ is in very good agreement with the experimental data. Moreover, the structure of the307
representative of the cluster with the best prediction (cluster III, based on contact maps)308
compared with the experimental structure is presented in Fig. 5.309
Mg2+- binding protein (6EKG) strongly interacts with ion (Fig. 3) but based on average310
ion displacements (Tab. 3) and contact maps (Fig. 4) the predicted binding sites are311
different from the experimental one. The best prediction is the structure form cluster IV312
and is presented in Fig. 5.313
High-quality prediction was also obtained for K+ (4RJ9) but only in the least populated314
cluster. For this protein the maps for two K+ were shown in Fig. 4 where weak but correct315
contacts can be observed. The best prediction (the structure form cluster V) is presented in316
Fig. 5.317
The worst predictions were obtained for the interactions with Na+ and Cl− (proteins318
5E56 and 2Z2K, respectively), where ion dissociate from the protein and do not bind to the319
protein again (Fig. 3 D and E).320
RMSF plots are presented in SI (Fig. SI 16). Shaded areas indicate the amino acid321
residues that are in contact with the ion in the native structure. The lowest fluctuations are322
observed for 5E56 protein (Fig SI 16 D) meaning the structures in each cluster are the most323
similar to each other. For the rest of the systems fluctuations are higher but still showing324
the similarities in each cluster. Only for 4AQO protein the highest fluctuations can be325
observed for the region where ion bounds.326
The results from simulations in high ion concentration are presented in Fig 6 A. It327
can be seen that neither Cl− nor Na+ interact with protein. For comparison RDF for the328
simulations that were started from the experimental structures (low ion concentrations)329
were calculated for Ca2+ and K+ (Fig 6 B). The strong interactions with both ions can be330
observed.331
The plots of concentration of unbound states of bovine α-lactalbumin as a function332
of time and curves (eq. 20) fitted to those data are in Fig SI 16. The calculated and333
16

experimental equilibrium binding constant are in Tab 4. Despite the fact that qualitatively334
binding affinities are not reproduced the tendency of binding affinity is in agreement for335
the simulations and experiment with the strongest binding for Ca2+ then Mg2+, Na+ and336
K+, respectively.337
Conclusions338
The new approach to simulate the protein-ion interactions in a CG representation was339
reported in this work. We implemented Ca2+, Mg2+, Na+, K+ and Cl− within the formal-340
ism of the physics-based UNRES model. Parameters were derived from AA simulations341
and incorporate water in an implicit manner. It is important to remember that the results342
can be at best of the same quality as the ones obtained by the method used to derive the343
new potentials.344
We were able to predict the binding site of Ca2+, Mg2+ and K+ and the strongest345
interaction were observed for Ca2+ and Mg2+. As for the simulations of Na+ and Cl− no346
interactions with protein were observed. Based on the PDB analysis1 Na+ (and to some347
extend K+) with water molecules around often appear in the bulk solvent in the crystal348
structure, or with a small number of protein oxygen atoms around them. The interactions349
are likely to be very labile and would not be expected to persist in the solution,1 and our350
simulations reflect that.351
Moreover, we were able to reproduce the experimental tendency of binding of the352
metal ions to bovine α-lactalbumin that again verified the strongest affinity for Ca2+ and353
Mg2+.354
Therefore, the new potentials allow to represent approximate interaction sites for Ca2+,355
Mg2+ and K+. They also can be applied to reproduce the labile interaction pattern for Na+356
and K+.357
17

Supplementary information358
The supplementary information contains the PMFs, fitted analytical energy function,359
parameters, plots of RMSF of Cα atoms in each cluster for protein test set and plots of360
concentration of unbound structures of 1F6S and metal ions over time with fitted kinetic361
curves.362
Declarations363
Competing Interests:364
The authors declare no competing interests365
Funding366
The funding for this work was obtained from the National Science Centre (Poland): UMO-367
2016/21/N/ST4/03154 (to AGL).368
Availability of data and material369
The datasets generated during and analysed during the current study are available from370
the corresponding author on reasonable request.371
Code availability372
The code is available through GIT: git://mmka.chem.univ.gda.pl/unres4 as UCGM branch373
Authors’ contributions374
AGL gave the main idea, performed the AA simulation, fitted the analytical expressions for375
K+, performed and analyzed the test of the method, and prepared the manuscript. AMA376
18

fitted the analytical expressions for Cl− and Na+. PW fitted the analytical expressions for377
Ca2+ an helped with the Introduction section of the manuscript. AW fitted the analytical378
expressions for Mg2+. SAS helped with the AA simulations. AKS helped with implantation379
into UNRES software, performed the analysis for kinetic constants and helped with the380
rest of data analysis. All authors read and revised the final version of the manuscript.381
Acknowledgement382
The funding for this work was obtained from the National Science Centre (Poland): UMO-383
2016/21/N/ST4/03154 (AGL). Computational resources were provided by (a) the In-384
formatics Center of the Metropolitan Academic Network (IC MAN) in Gdansk, and (b)385
the Interdisciplinary Center for Mathematical and Computer Modeling in Warsaw (ICM),386
grant GA76-18 (c) our 682-processor Beowulf cluster at the Faculty of Chemistry, University387
of Gdansk.388
References389
(1) Harding, M. M.; Nowicki, M. W.; Walkinshaw, M. D. Metals in protein struc-390
tures: a review of their principal features. Crystallogr. Rev. 2010, 16, 247–302, DOI:391
10.1080/0889311X.2010.485616.392
(2) Rosenzweig, A. C. Metallochaperones: bind and deliver. Chem. Biol. 2002, 9, 673–677,393
DOI: 10.1016/S1074-5521(02)00156-4.394
(3) Dudev, T.; Lim, C. Principles governing Mg, Ca, and Zn binding and selectivity in395
proteins. Chem. Rev. 2003, 103, 773–788, DOI: 10.1021/cr020467n.396
(4) Kumar, S.; Berl, T. Sodium. The Lancet 1998, 352, 220–228, DOI:397
10.1016/S0140-6736(97)12169-9.398
19

(5) Pratt, P. F. Potassium. Methods of Soil Analysis: Part 2 Chemical and Microbiological399
Properties 1965, 9, 1022–1030, DOI: 10.2134/agronmonogr9.2.c20.400
(6) Jahnen-Dechent, W.; Ketteler, M. Magnesium basics. Clin. Kidney J. 2012, 5, i3–i14, DOI:401
10.1093/ndtplus/sfr163.402
(7) Bushinsky, D. A.; Monk, R. D. Calcium. The Lancet 1998, 352, 306–311, DOI:403
10.1016/S0140-6736(97)12331-5.404
(8) Sigel, A.; Sigel, H.; Sigel, R. K. Interrelations between essential metal ions and human405
diseases; Springer, 2013; Vol. 13.406
(9) Breydo, L.; Uversky, V. N. Role of metal ions in aggregation of intrinsically disor-407
dered proteins in neurodegenerative diseases. Metallomics 2011, 3, 1163–1180, DOI:408
10.1039/c1mt00106j.409
(10) Li, P.; Merz Jr, K. M. Metal ion modeling using classical mechanics. Chem. Rev. 2017,410
117, 1564–1686, DOI: 10.1021/acs.chemrev.6b00440.411
(11) Li, P.; Roberts, B. P.; Chakravorty, D. K.; Merz Jr, K. M. Rational design of particle412
mesh Ewald compatible Lennard-Jones parameters for+ 2 metal cations in explicit413
solvent. J. Chem. Theory Comput. 2013, 9, 2733–2748, DOI: 10.1021/ct400146w.414
(12) Li, P.; Merz Jr, K. M. Taking into account the ion-induced dipole interaction in415
the nonbonded model of ions. J. Chem. Theory Comput. 2014, 10, 289–297, DOI:416
10.1021/ct400751u.417
(13) Li, P.; Song, L. F.; Merz Jr, K. M. Parameterization of highly charged metal ions418
using the 12-6-4 LJ-type nonbonded model in explicit water. J. Phys. Chem. B 2015, 119,419
883–895, DOI: 10.1021/jp505875v.420
(14) Li, P.; Song, L. F.; Merz Jr, K. M. Systematic parameterization of monovalent ions421
20

employing the nonbonded model. J. Chem. Theory Comput. 2015, 11, 1645–1657, DOI:422
10.1021/ct500918t.423
(15) MacKerell Jr, A. D.; Bashford, D.; Bellott, M.; Dunbrack Jr, R. L.; Evanseck, J. D.;424
Field, M. J.; Fischer, S.; Gao, J.; Guo, H.; Ha, S., et al. All-atom empirical potential425
for molecular modeling and dynamics studies of proteins. J. Phys. Chem. B 1998, 102,426
3586–3616, DOI: 10.1021/jp973084f.427
(16) Scott, W. R.; Hünenberger, P. H.; Tironi, I. G.; Mark, A. E.; Billeter, S. R.; Fen-428
nen, J.; Torda, A. E.; Huber, T.; Krüger, P.; van Gunsteren, W. F. The GROMOS429
biomolecular simulation program package. J. Phys. Chem. A 1999, 103, 3596–3607,430
DOI: 10.1021/jp984217f.431
(17) Marrink, S. J.; Risselada, H. J.; Yefimov, S.; Tieleman, D. P.; De Vries, A. H. The432
MARTINI force field: coarse grained model for biomolecular simulations. J. Phys. Chem.433
B 2007, 111, 7812–7824, DOI: 10.1021/jp071097f.434
(18) Marrink, S. J.; Corradi, V.; Souza, P. C.; Ingolfsson, H. I.; Tieleman, D. P.; Sansom, M. S.435
Computational modeling of realistic cell membranes. Chem. Rev. 2019, 119, 6184–6226,436
DOI: 10.1021/acs.chemrev.8b00460.437
(19) Darré, L.; Machado, M. R.; Brandner, A. F.; González, H. C.; Ferreira, S.; Pantano, S.438
SIRAH: a structurally unbiased coarse-grained force field for proteins with aqueous439
solvation and long-range electrostatics. J. Chem. Theory Comput. 2015, 11, 723–739, DOI:440
10.1021/ct5007746.441
(20) Machado, M. R.; Barrera, E. E.; Klein, F.; Sóñora, M.; Silva, S.; Pantano, S. The SIRAH442
2.0 force field: altius, fortius, citius. J. Chem. Theory Comput. 2019, 15, 2719–2733, DOI:443
10.1021/acs.jctc.9b00006.444
(21) Darré, L.; Machado, M. R.; Dans, P. D.; Herrera, F. E.; Pantano, S. Another coarse grain445
21

model for aqueous solvation: WAT FOUR? J. Chem. Theory Comput. 2010, 6, 3793–3807,446
DOI: 10.1021/ct100379f.447
(22) Liwo, A.; Khalili, M.; Czaplewski, C.; Kalinowski, S.; Ołdziej, S.; Wachucik, K.;448
Scheraga, H. A. Modification and optimization of the united-residue (UNRES) potential449
energy function for canonical simulations. I. Temperature dependence of the effective450
energy function and tests of the optimization method with single training proteins. J.451
Phys. Chem. B 2007, 111, 260–285, DOI: 10.1021/jp065380a.452
(23) Voth, G. In Coarse-Graining of Condensed Phase and Biomolecular Systems, 1st ed.; Voth, G.,453
Ed.; CRC Press, Taylor & Francis Group, 2008; Chapter 1, pp 1–4.454
(24) Liwo, A. et al. A unified coarse-grained model of biological macromolecules based455
on mean-field multipole-multipole interactions. J. Mol. Model. 2014, 20, 2306, DOI:456
10.1007/s00894-014-2306-5.457
(25) Khalili, M.; Saunders, J. A.; Liwo, A.; Ołdziej, S.; Scheraga, H. A. A united residue458
force-field for calcium–protein interactions. Protein Sci. 2004, 13, 2725–2735, DOI:459
10.1110/ps.04878904.460
(26) Liwo, A.; Sieradzan, A. K.; Lipska, A. G.; Czaplewski, C.; Joung, I.; Zmudzinska, W.;461
Hałabis, A.; Ołdziej, S. A general method for the derivation of the functional forms of462
the effective energy terms in coarse-grained energy functions of polymers. III. Determi-463
nation of scale-consistent backbone-local and correlation potentials in the UNRES force464
field and force-field calibration and validation. J. Chem. Phys. 2019, 150, 155104, DOI:465
10.1063/1.5093015.466
(27) Shen, H.; Liwo, A.; Scheraga, H. A. An improved functional form for the temperature467
scaling factors of the components of the mesoscopic UNRES force field for simula-468
tions of protein structure and dynamics. J. Phys. Chem. B 2009, 113, 8738–8744, DOI:469
10.1021/jp901788q.470
22

(28) Case, D. A.; Betz, R.; Cerutti, D.; Cheatham Iii, T.; Darden, T.; Duke, R.; Giese, T.;471
Gohlke, H.; Goetz, A.; Homeyer, N., et al. AMBER 2016. University of California, San472
Francisco 2016, 810.473
(29) Jorgensen, W. L.; Chandrasekhar, J.; Madura, J. D.; Impey, R. W.; Klein, M. L. Compar-474
ison of simple potential functions for simulating liquid water. J. Chem. Phys. 1983, 79,475
926–935, DOI: 10.1063/1.445869.476
(30) Saxena, A.; Sept, D. Multisite ion models that improve coordination and free energy477
calculations in molecular dynamics simulations. J. Chem. Theory Comput. 2013, 9, 3538–478
3542, DOI: 10.1021/ct400177g.479
(31) Kumar, S.; Bouzida, D.; Swendsen, R. H.; Kollman, P. A.; Rosenberg, J. M. The480
weighted histogram analysis method for free-energy calculations on biomolecules. I.481
The method. J. Comput. Chem. 1992, 13, 1011–1021, DOI: 10.1002/jcc.540130812.482
(32) Makowski, M.; Liwo, A.; Maksimiak, K.; Makowska, J.; Scheraga, H. A. Simple483
physics-based analytical formulas for the potentials of mean force for the interaction of484
amino acid side chains in water. 2. Tests with simple spherical systems. J. Phys. Chem. B485
2007, 111, 2917–2924, DOI: 10.1021/jp065917k.486
(33) Makowski, M.; Sobolewski, E.; Czaplewski, C.; Liwo, A.; Ołdziej, S.; No, J. H.; Scher-487
aga, H. A. Simple Physics-Based Analytical Formulas for the Potentials of Mean Force488
for the Interaction of Amino Acid Side Chains in Water. 3. Calculation and Parameteri-489
zation of the Potentials of Mean Force of Pairs of Identical Hydrophobic Side Chains. J.490
Phys. Chem. B 2007, 111, 2925–2931, DOI: 10.1021/jp065918c.491
(34) Yin, Y.; Sieradzan, A. K.; Liwo, A.; He, Y.; Scheraga, H. A. Physics-based potentials for492
coarse-grained modeling of protein–DNA interactions. J. Chem. Theory Comput. 2015,493
11, 1792–1808, DOI: 10.1021/ct5009558.494
23

(35) Gay, J. G.; Berne, B. J. Modification of the overlap potential to mimic a linear site-site495
potential. J. Chem. Phys. 1981, 74, 3316–3319, DOI: 10.1063/1.441483.496
(36) Still, W. C.; Tempczyk, A.; Hawley, R. C.; Hendrickson, T. Semianalytical treatment of497
solvation for molecular mechanics and dynamics. J. Am. Chem. Soc. 1990, 112, 6127–6129,498
DOI: 10.1021/ja00172a038.499
(37) Czaplewski, C.; Kalinowski, S.; Liwo, A.; Scheraga, H. A. Application of multiplexing500
replica exchange molecular dynamics method to the UNRES force field: tests with α501
and α + β proteins. J. Chem. Theory Comput. 2009, 5, 627–640, DOI: 10.1021/ct800397z.502
(38) Trebst, S.; Troyer, M.; Hansmann, U. H. Optimized parallel tempering simulations of503
proteins. J. Chem. Phys. 2006, 124, 174903, DOI: 10.1063/1.2186639.504
(39) Sieradzan, A. K. Introduction of periodic boundary conditions into UNRES force field.505
J. Comput. Chem. 2015, 36, 940–946, DOI: 10.1002/jcc.23864.506
(40) Späth, H. Cluster Analysis Algorithms; Halsted Press; New York, 1980.507
(41) Chrysina, E. D.; Brew, K.; Acharya, K. R. Crystal structures of apo-and holo-bovine508
α-lactalbumin at 2.2-Å resolution reveal an effect of calcium on inter-lobe interactions.509
J. Biol. Chem. 2000, 275, 37021–37029, DOI: 10.1074/jbc.M004752200.510
(42) Peng, X.; Sieradzan, A. K.; Niemi, A. J. Thermal unfolding of myoglobin511
in the Landau-Ginzburg-Wilson approach. Phys. Rev. E 2016, 94, 062405, DOI:512
10.1103/PhysRevE.94.062405.513
(43) Marquardt, D. W. An algorithm for least-squares estimation of nonlinear parameters.514
J. Soc. Ind. Appl. Math 1963, 11, 431–441, DOI: 10.1137/0111030.515
(44) Spodzieja, M.; Kuncewicz, K.; Sieradzan, A.; Karczynska, A.; Iwaszkiewicz, J.; Ces-516
son, V.; Wegrzyn, K.; Zhukov, I.; Maszota-Zieleniak, M.; Michielin, O., et al. Disulfide-517
24

linked peptides for blocking BTLA/HVEM binding. Int. J. Mol. Sci. 2020, 21, 636, DOI:518
10.3390/ijms21020636.519
(45) Eckhard, U.; Schönauer, E.; Brandstetter, H. Structural basis for activity regulation520
and substrate preference of clostridial collagenases G, H, and T. J. Biol. Chem. 2013, 288,521
20184–20194, DOI: 10.1074/jbc.M112.448548.522
(46) Quax, T. E.; Altegoer, F.; Rossi, F.; Li, Z.; Rodriguez-Franco, M.; Kraus, F.; Bange, G.;523
Albers, S.-V. Structure and function of the archaeal response regulator CheY. Proc. Natl.524
Acad. Sci. U.S.A. 2018, 115, E1259–E1268, DOI: 10.1073/pnas.1716661115.525
(47) Yung, Y.-L.; Cheung, M.-Y.; Miao, R.; Fong, Y.-H.; Li, K.-P.; Yu, M.-H.; Chye, M.-L.;526
Wong, K.-B.; Lam, H.-M. Site-directed mutagenesis shows the significance of interac-527
tions with phospholipids and the G-protein OsYchF1 for the physiological functions of528
the rice GTPase-activating protein 1 (OsGAP1). J. Biol. Chem. 2015, 290, 23984–23996,529
DOI: 10.1074/jbc.M115.655639.530
(48) Marshall, J. D.; Heeke, D. S.; Rao, E.; Maynard, S. K.; Hornigold, D.; McCrae, C.;531
Fraser, N.; Tovchigrechko, A.; Yu, L.; Williams, N., et al. A novel class of small molecule532
agonists with preference for human over mouse TLR4 activation. PLoS One 2016, 11,533
e0164632, DOI: 10.1371/journal.pone.0164632.534
(49) Selvaraj, M.; Roy, S.; Singh, N.; Sangeetha, R.; Varshney, U.; Vijayan, M. Structural535
plasticity and enzyme action: crystal structures of Mycobacterium tuberculosis peptidyl-536
tRNA hydrolase. J. Mol. Biol. 2007, 372, 186–193, DOI: 10.1016/j.jmb.2007.06.053.537
(50) Putignano, V.; Rosato, A.; Banci, L.; Andreini, C. MetalPDB in 2018: a database of538
metal sites in biological macromolecular structures. Nucleic Acids Res. 2018, 46, D459–539
D464, DOI: 10.1093/nar/gkx989.540
(51) Berman, H. M.; Westbrook, J.; Feng, Z.; Gilliland, G.; Bhat, T. N.; Weissig, H.;541
25

Shindyalov, I. N.; Bourne, P. E. The protein data bank. Nucleic Acids Res. 2000, 28,542
235–242, DOI: 10.1093/nar/28.1.235.543
(52) Permyakov, E. A.; Morozova, L. A.; Burstein, E. A. Cation binding effects on the pH,544
thermal and urea denaturation transitions in α-lactalbumin. Biophys. Chem. 1985, 21,545
21–31, DOI: 10.1016/0301-4622(85)85003-1.546
26

Figure legends547
Fig. 1. The UNRES model of polypeptide chains. The interaction sites are peptide-group548
centers (p), and side-chain centers (SC) attached to the corresponding α-carbons. The549
geometry of the chain can be described by virtual-bond lengths, backbone virtual-550
bond angles θi, backbone virtual-bond-dihedral angles γi, and the angles αi and βi551
that describe the location of a side chain with respect to the coordinate frame defined552
by Cαi−1, Cα
i and Cαi , Cα
i+1. Reprinted with permission from Zaborowski, Bartłomiej, et553
al. "A maximum-likelihood approach to force-field calibration." J. Chem. Inf. Model.554
55.9 (2015): 2050-2070. Copyright 2015 American Chemical Society.555
Fig. 2. The model of the interaction of the UNRES interaction site (particle i) and ion556
(particle j) where: dhead is the distance from the center of particle i and the interacting557
head of it, rij is the distance between the center of the particle i and particle j, rij558
is the unit vector along the rij distance, uij is the unit vector along the long axis of559
particle i, θij is the angle between vector uij and vector rij, r′
ji is the distance between560
the interacting "head" of a side chain and ion.561
Fig. 3. Normalized histograms of distances between the predicted ion placement and the562
one in the native structure for: (A) 4AQO, (B) 6EKG, (C) 4RJ9, (D) 5E56 and (E) 2Z2K.563
Results from the simulations started from the experimental structure.564
Fig. 4. Contact maps for ions and particular amino acid side-chains averaged over all565
structures in clusters in comparison with the contact maps for the native structure.566
Fig. 5. The experimental structures (cartoon representation, grey) and the predicted coarse-567
grained models (sicks representation, red) for three out of five tested proteins. Ions568
are represented as spheres. The predicted models are the representatives of the569
best cluster. The distances between predicted ion placement and the one in the570
native structure are in the brackets. Results from the simulations started from the571
27

experimental structure.572
Fig. 6. RDF values (A) obtained from simulations under high ionic strength for interactions573
between Cl− (2Z2k, blue line) and Na+ (5E56, red line); and (B) from simulations574
under low ionic strength for interactions between Ca2+ (4AQO, blue line) and K+575
(4RJ9, red line).576
28

Table 1: Models of UNRES interaction centers.
Interaction site modelpeptide group N-methylacetamide
Ala ethanePro n-propaneVal isobutene
Leu/Ile isopentanePhe ethylbenzeneMet methyl propyl sulfideTrp indoleAsp propionate anionGlu butyrate anionLys n-pentylamine cationArg 1-butylgaunidine cationSer etanolTyr 4-ethylphenolThr 2-propanolHis 5-ethylimidazoleCys ethyl sulfideAsn ethanamideGln proanamide
29

Table 2: Test set proteins
PDB ID sequence length ions amino-acid side-chains interacting with ion ref4AQO 86 Ca2+ Asn1, Lys2, Asp29, Asp31, Asp70 a 45
6EKG 121 Mg2+ Asp10, Asp55, Val57 a 46
4RJ9 161 K+, K+ 1: Arg18, Asp77, 2: Asp24, Asp70, Lys71 a 47
5E56 116 Na+ Phe60, Tyr63, Cys66 a 48
2Z2K 180 Cl− His43, Lys44, Arg45 b 49
a binding site found by MetalPDB server,50 b binding site found by rcsb.org51577
578
30
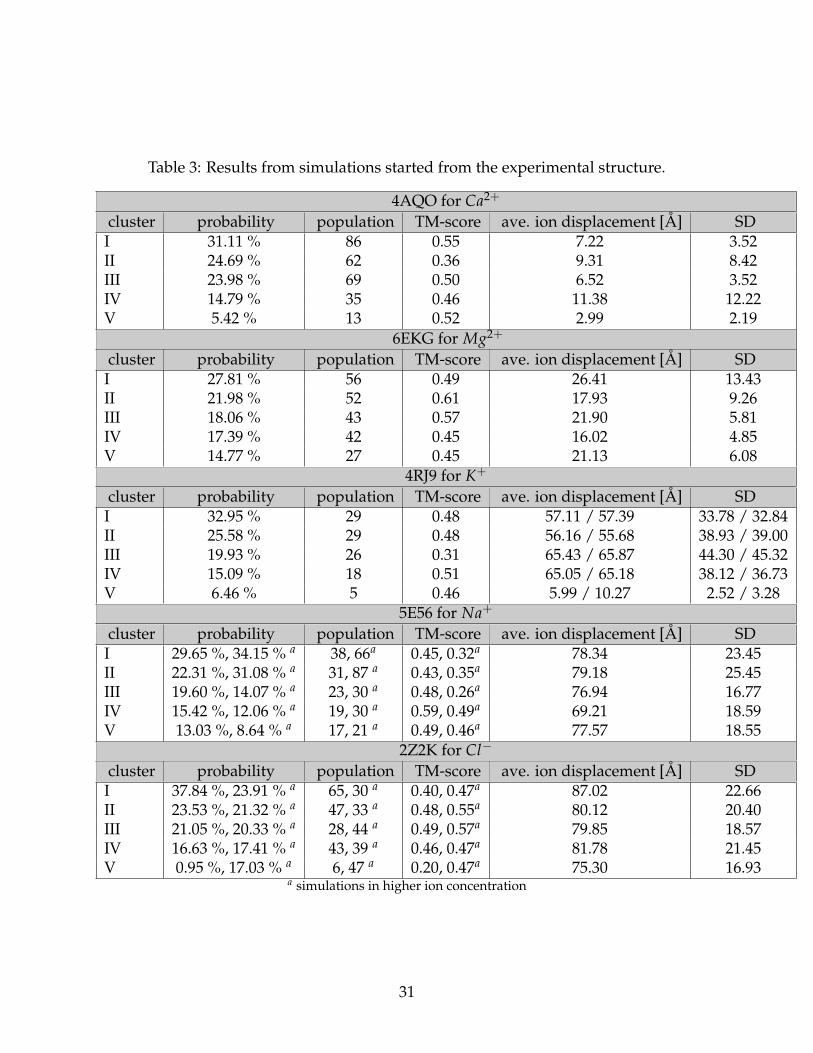
Table 3: Results from simulations started from the experimental structure.
4AQO for Ca2+
cluster probability population TM-score ave. ion displacement [Å] SDI 31.11 % 86 0.55 7.22 3.52II 24.69 % 62 0.36 9.31 8.42III 23.98 % 69 0.50 6.52 3.52IV 14.79 % 35 0.46 11.38 12.22V 5.42 % 13 0.52 2.99 2.19
6EKG for Mg2+
cluster probability population TM-score ave. ion displacement [Å] SDI 27.81 % 56 0.49 26.41 13.43II 21.98 % 52 0.61 17.93 9.26III 18.06 % 43 0.57 21.90 5.81IV 17.39 % 42 0.45 16.02 4.85V 14.77 % 27 0.45 21.13 6.08
4RJ9 for K+
cluster probability population TM-score ave. ion displacement [Å] SDI 32.95 % 29 0.48 57.11 / 57.39 33.78 / 32.84II 25.58 % 29 0.48 56.16 / 55.68 38.93 / 39.00III 19.93 % 26 0.31 65.43 / 65.87 44.30 / 45.32IV 15.09 % 18 0.51 65.05 / 65.18 38.12 / 36.73V 6.46 % 5 0.46 5.99 / 10.27 2.52 / 3.28
5E56 for Na+
cluster probability population TM-score ave. ion displacement [Å] SDI 29.65 %, 34.15 % a 38, 66a 0.45, 0.32a 78.34 23.45II 22.31 %, 31.08 % a 31, 87 a 0.43, 0.35a 79.18 25.45III 19.60 %, 14.07 % a 23, 30 a 0.48, 0.26a 76.94 16.77IV 15.42 %, 12.06 % a 19, 30 a 0.59, 0.49a 69.21 18.59V 13.03 %, 8.64 % a 17, 21 a 0.49, 0.46a 77.57 18.55
2Z2K for Cl−
cluster probability population TM-score ave. ion displacement [Å] SDI 37.84 %, 23.91 % a 65, 30 a 0.40, 0.47a 87.02 22.66II 23.53 %, 21.32 % a 47, 33 a 0.48, 0.55a 80.12 20.40III 21.05 %, 20.33 % a 28, 44 a 0.49, 0.57a 79.85 18.57IV 16.63 %, 17.41 % a 43, 39 a 0.46, 0.47a 81.78 21.45V 0.95 %, 17.03 % a 6, 47 a 0.20, 0.47a 75.30 16.93
a simulations in higher ion concentration
31

Table 4: The experimental apparent equilibrium constants for the binding of metal ionsto bovine α-lactalbumin at 20 C (Kapp) and calculated association and dissociation rateconstants (k1, k−1) and binding equlibrium constant (Ka).
k1 k−1 Ka Kapp[M−1]52
Ca2+ 0.6875 0.0038 179.0364 108.6
Mg2+ 0.7210 0.0042 169.0007 2000Na+ 0.4997 0.4884 1.0231 100K+ 0.4996 0.6184 0.8080 8
32

579
Figure 1580
33

581
Figure 2582
34

0
0.01
0.02
0.03
0.04
0.05
0.06
0.07
0.08
0 5 10 15 20 25 30 35 40 45
prob
abili
ty
distances [Å] A
0
0.01
0.02
0.03
0.04
0.05
0.06
0.07
0.08
10 15 20 25 30 35 40 45 50 55 60 65
prob
abili
ty
distances [Å] B583
0
0.01
0.02
0.03
0.04
0.05
0.06
0.07
0.08
0 10 20 30 40 50 60 70 80 90 100 110 120 130
prob
abili
ty
distances [Å] C
0
0.01
0.02
0.03
0.04
0.05
0.06
0.07
0.08
10 20 30 40 50 60 70 80 90 100 110 120
prob
abili
ty
distances [Å] D584
0
0.01
0.02
0.03
0.04
0.05
0.06
0.07
0.08
20 30 40 50 60 70 80 90 100 110 120 130
prob
abili
ty
distances [Å] E585
Figure 3586
35

0 20 40 60 80 100 120
native
cluster 1
cluster 2
cluster 3
cluster 4
cluster 5
6EKG
0 10 20 30 40 50 60 70 80
4AQO
0.0
0.2
0.4
0.6
0.8
1.0
0 20 40 60 80 100 120 140 160residue number
native
cluster 1
cluster 2
cluster 3
cluster 4
cluster 5
4RJ9 a
0 20 40 60 80 100 120 140 160residue number
4RJ9 b
0.0
0.2
0.4
0.6
0.8
1.0
587
Figure 4588
36

589
590
Figure 5591
37

0
0.2
0.4
0.6
0.8
1
1.2
1.4
0 10 20 30 40 50 60 70 80
g(r)
distance [Å]
2Z2K5E56
A592
0
50
100
150
200
250
300
350
400
450
0 10 20 30 40 50 60 70 80
g(r)
distance [Å]
4AQO4RJ9
B593
Figure 6594
38

Supplementary Files
This is a list of supplementary �les associated with this preprint. Click to download.
SI.pdf