co2 reduction potential of sustainable urban … reduction potential of sustainable urban transport...
TRANSCRIPT

Deutsche Gesellschaft fürTechnische Zusammenarbeit (GTZ) GmbHGerman Technical Cooperation
GTZ Sustainable Urban Transport ProjectKantor Bappeda Surabaya, Ruang Prambanan,
Jl. Pacar No.8 Surabaya 60272, Indonesia Tel 62-31-5353770; alt. 9982484 Fax 62-31 5353770; Alt. 5319287
[email protected]; http://www.sutp.org
CO2 Reduction Potential of Sustainable Urban Transport Measures in Surabaya
July 2001, Surabaya

GTZ’s Sustainable Urban Transport Project (SUTP) in Surabaya aims to work with related agencies and the people of Surabaya to devise and implement
policies toward environmentally, economically, and socially sustainable transport in the city.
This will result in a range of “local” economic (enhanced investment climate), social (poverty reduction) and environmental (cleaner air)
benefi ts, and will also contribute to a stabilisation of “global” carbon dioxide emissions from Surabaya’s transport sector. The project is hoped to provide a model of how to reduce such emissions from the transport sector
in large cities in developing countries.
GTZ SUTP has embarked on an integrated program, including – working closely with the City Government – development of sustainable transport
policies, design and implementation of a public awareness campaign, technical measures to reduce vehicle emissions, enhanced air quality
management capability, adoption of appropriate fi scal instruments and transport demand management measures, improvement of conditions for
non-motorized transport and pedestrians, elaboration of an effective inspection & maintenance and roadworthiness program, promotion of the use of CNG, a public transport demonstration route including regulatory
and institutional reforms to be applied nationally if successful, and dissemination of international experiences.
GTZ SUTP commenced in Surabaya in 1998 and is due to fi nish in 2001.

Deutsche Gesellschaft fürTechnische Zusammenarbeit (GTZ) GmbHGerman Technical Cooperation
GTZ Sustainable Urban Transport ProjectKantor Bappeda Surabaya, Ruang Prambanan,
Jl. Pacar No.8 Surabaya 60272, Indonesia Tel 62-31-5353770; alt. 9982484 Fax 62-31 5353770; Alt. 5319287
[email protected]; http://www.sutp.org
GTZ Sustainable Urban Transport ProjectKantor Bappeda Surabaya, Ruang Prambanan,
Jl. Pacar No.8 Surabaya 60272, Indonesia Tel 62-31-5353770; alt. 9982484
Fax 62-31 5353770 [email protected]; http://www.sutp.org
CO2 Reduction Potential of Sustainable Urban Transport Measures in Surabaya
Dino Teddyputra, July 2001
The fi ndings, interpretations and conclusions expressed in this report are based on information gathered by GTZ SUTP and its consultants from reliable sources. GTZ does not, however, guarantee the accuracy or completeness of information in this report, and GTZ cannot be held
responsible for any errors, omissions or losses which emerge from the use of this information.
For further information:

3
TABLE OF CONTENTS
1 EXECUTIVE SUMMARY .........................................................................................5
2 INTRODUCTION ..................................................................................................17
3 METHODOLOGY.................................................................................................19
4 DETAIL CALCULATIONS .....................................................................................24
4.1 CO2 EMISSIONS 2000 AND ITS PROJECTION FOR 2010 .........................................24 4.1.1 CALCULATION OVERVIEW....................................................................................24 4.1.2 CALCULATING TOTAL FUEL CONSUMPTION AND CO2 EMISSIONS BASED ON
FUEL SALES 2000 ..............................................................................................25 4.1.3 CALCULATING FUEL CONSUMPTION BY VEHICLE TYPE FOR 2000 BASED ON
TRAFFIC DATA....................................................................................................27 4.1.4 CALCULATING CO2 EMISSIONS BY VEHICLE TYPE FOR 2000 ..................................34 4.1.5 FUEL CONSUMPTION AND CO2 EMISSIONS PROJECTION FOR 2010 ........................35
4.2 RETROFITTING MICROBUSES (ANGKOTS) WITH CNG SYSTEMS..............................39 4.2.1 SCENARIO 1: 30% OF ANGKOTS USE CNG ..........................................................39 4.2.2 SCENARIO 2: 50% OF ANGKOTS USE CNG ..........................................................41
4.3 RETROFIT FROM 25% TO 50% OF TAXIS WITH CNG-SYSTEMS..............................41
4.4 IMPROVEMENT OF PUBLIC TRANSPORT SYSTEM ..................................................42
4.5 TRANSPORT DEMAND MANAGEMENT (TDM) .......................................................48
4.6 IMPROVEMENTS FOR NON-MOTORIZED TRANSPORT..............................................56
5 BIBLIOGRAPHY..................................................................................................59

4
Acknowledgements The Sustainable Urban Transport Project conducted by the Municipality of Surabaya and the German Agency for Technical Cooperation and Development (GTZ) commissioned this study to estimate the CO2 emissions reduction potentials of selected measures developed by the project. The author would like to express his gratitude to the project staff, especially Mr. Karl Fjellstrom from the project office in Surabaya, Indonesia for providing comprehensive input data necessary for the calculations, editorial corrections, and especially his extensive guidance, without which it would have been impossible to bring this report to this state. Also, the author would like to thank Ms. Inne for her assistance and efforts in collecting and providing input data. The author is grateful to Mr. Manfred Breithaupt (GTZ headquarters in Eschborn, Germany) and Mr. Axel Friedrich (German Environmental Protection Agency Umweltbundestamt in Berlin, Germany) for their extensive direction, especially in the preliminary versions of this report. Special thanks as well to Mr. Reinhard Kolke (Umweltbundestamt Berlin, Germany) for his support, especially in providing the conversion factors and ensuring the consistency and the plausibility of the calculations. Last, but not least, the author would like to express his appreciation to his wife, Jennifer Anderson, for her editing assistance and for her understanding regarding the time spent in the evenings and on weekends for the preparation of this report, which was conducted on top of the author's other work. Dino Teddyputra Consultant for Transportation Planning and Engineering Tel. +1 (650) 565-8843 Fax. +1 (530) 618-5041 E-Mail: [email protected] Editor’s comments Mr. Reinhard Kolke provided an expert peer review of this report. Mr. Lee Schipper provided some helpful comments and suggestions.

GTZ SUTP, July 2001 CO2 Emission Reduction Potenttial of SUTP Measures
5
1 EXECUTIVE SUMMARY (a) The purpose of this report
The purpose of this report is to calculate the potential of CO2 reduction from the road
transportation sector achievable through measures proposed by the Sustainable
Urban Transportation Project (SUTP) in Surabaya. The SUTP, established in
partnership between the Municipality of Surabaya and the German Agency for
Development Cooperation (GTZ), is developing options to reduce carbon dioxide
(CO2) emissions from the transportation sector in Surabaya.
The calculations in this report are basically divided in two parts. In the first part, the
importance of reducing CO2 emissions is discussed, and the possible CO2
emissions in 2010 are estimated for the case if no counter measures are taken
(Business As Usual scenario). In the next part of the report, the potential of each
measure in reducing CO2 emissions is calculated.
(b) Methodology
To ensure the plausibility of the input data, calculations of the CO2 emissions were
conducted based on the fuel sales figures and on the traffic data, and crosschecks
(between the results of the two approaches) were performed. The fuel sales figures
were provided by Pertamina (the state-owned fuel supplier), and the traffic data was
extracted from the reports of the extensive studies conducted previously in the frame
of the Surabaya Integrated Transportation Network Project (SITNP). Furthermore, in
order to ensure comparability and usability of the estimation results (e.g. to be used
later when calculating provincial or national CO2 emissions), the Guidelines for
National Greenhouse Gas Inventories were used wherever applicable. The
guidelines, which were issued by the Intergovernmental Panel on Climate Change
(IPCC) contain estimation methodologies that are internationally recognized to be
used as a reference when constructing and reporting national inventories of CO2
emissions and other greenhouse gas emissions.

GTZ SUTP, July 2001 CO2 Emission Reduction Potenttial of SUTP Measures
6
(c) CO2 emissions from fuels sold in 2000
In Surabaya the following amounts of fuels were sold in year 2000:
Type of Fue l2000
(L per m onth)2000
(L per year)Ga soline 30,000,000 360,000,000Die se l 14,000,000 168,000,000CNG* 840,500 10,086,000*CNG is sold in "Liters gasoline-equivalent" by Pertamina Source: Rifky Hardijanto, UPPDN V Pertamina, Fjellstrom by phone 05-Jan-01
This is equal to CO2 emissions of approximately:
Type of Fuel2000
(kg per year)Gasoline 838,800,000 Diesel 440,160,000 CNG 4,841,280
Total 1,283,801,280 The CO2 emissions in the year 2000 were calculated directly by multiplying the fuel
consumption figures with the corresponding CO2 emission factors.
Using the traffic data it was possible to break down the CO2 emissions to different
categories of vehicle types. The following table shows the fuel consumption and the
corresponding CO2 emissions in 2000, distinguished by vehicle category based on
their fuel type. The vehicle categories include private car, motorcycle and public
transport vehicles. The latter category consists of minibus/angkots, taxis and city
buses.
2000 Fue l Consum ption CO2 Em issions
[Lite rs] [kg]Priva te ca rs (ga soline ) 192,387,405 448,262,654M otorcycle s (ga soline ) 99,692,595 232,283,746Public tra nsport
Angkots (gsln) 46,080,000 107,366,400Angkots (CNG) 0 0
Ta x is (gsln) 21,840,000 50,887,200Ta x is (CNG) 6,960,000 13,084,800
Buse s (Die se l) 6,500,000 17,030,000Othe r Die se l Ve hicle s 161,500,000 423,130,000
Othe r CNG Ve hicle s 3,126,000 5,876,8801,297,921,680Tota l

GTZ SUTP, July 2001 CO2 Emission Reduction Potenttial of SUTP Measures
7
In total, there were approximately 1,297 kilotons of CO2 emitted from the road
transport sector in Surabaya in 2000. Private cars emitted the biggest share, which
accounted more than 448 kilotons of CO2. The second biggest share was from the
vehicle category "Other Diesel Vehicles", followed by motorcycles with more than 232
kilotons of CO2 emissions.
(d) Fuel consumption and CO2 emissions projection for 2010 (Business As Usual Scenario)
According to the SITNP forecast, trips by car, motorcycle and public transport will
grow by 29.5%, 27.3% and 26.6% respectively over 15 years from 1995 to 2010. The
increase of number of trips will not only result in higher traveled kilometers, and thus
in higher total fuel consumption, but also in more congestions due to the fact that
currently some city's road links are already heavily loaded or even overloaded.
According to the calculations based on the speed pattern 2010 that was forecast by
SITNP, these congestion effects would increase the fuel consumption further by
approximately 15%.
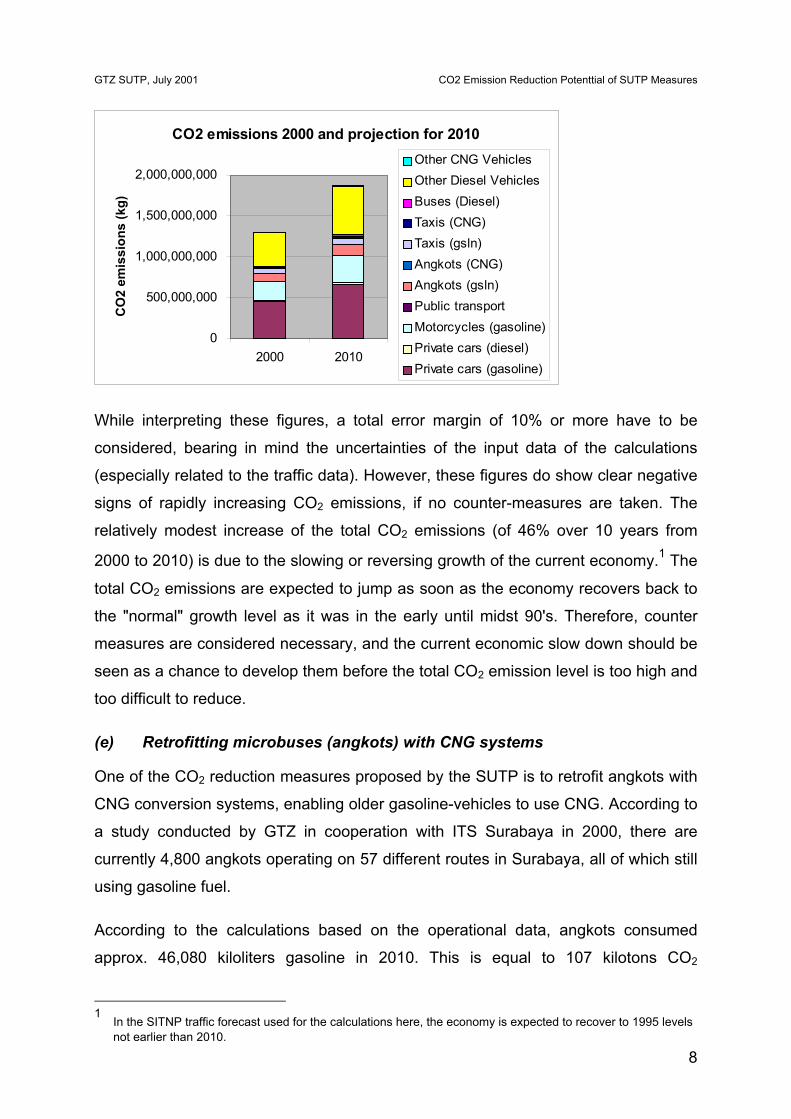
According to the calculations, the total CO2 emissions will increase by approximately
46% from 2000 to 2010, from approx. 1,300 kilotons to approx. 1,900 kilotons. The
break down of the CO2 emissions by vehicle type can be seen in the following table
and diagram:
CO2 Em issions (kg) 2000 2010Priva te ca rs (ga soline ) 448,262,654 664,522,596Priva te ca rs (die se l) 9,493,508 14,073,558M otorcycle s (ga soline ) 232,283,746 338,496,865Public tra nsport
Angkots (gsln) 107,366,400 132,714,734Angkots (CNG) 0 0
Ta x is (gsln) 50,887,200 73,747,905Ta x is (CNG) 13,084,800 18,963,051
Buse s (Die se l) 17,030,000 23,124,907Othe r Die se l Ve hicle s 413,636,492 599,459,681
Othe r CNG Ve hicle s 5,876,880 8,517,026Tota l 1,297,921,680 1,873,620,323
GTZ SUTP, July 2001 CO2 Emission Reduction Potenttial of SUTP Measures
8
CO2 emissions 2000 and projection for 2010
0
500,000,000
1,000,000,000
1,500,000,000
2,000,000,000
2000 2010
CO
2 em
issi
ons
(kg)
Other CNG VehiclesOther Diesel VehiclesBuses (Diesel)Taxis (CNG)Taxis (gsln)Angkots (CNG)Angkots (gsln)Public transportMotorcycles (gasoline)Private cars (diesel)Private cars (gasoline)
While interpreting these figures, a total error margin of 10% or more have to be
considered, bearing in mind the uncertainties of the input data of the calculations
(especially related to the traffic data). However, these figures do show clear negative
signs of rapidly increasing CO2 emissions, if no counter-measures are taken. The
relatively modest increase of the total CO2 emissions (of 46% over 10 years from
2000 to 2010) is due to the slowing or reversing growth of the current economy.1 The
total CO2 emissions are expected to jump as soon as the economy recovers back to
the "normal" growth level as it was in the early until midst 90's. Therefore, counter
measures are considered necessary, and the current economic slow down should be
seen as a chance to develop them before the total CO2 emission level is too high and
too difficult to reduce.
(e) Retrofitting microbuses (angkots) with CNG systems
One of the CO2 reduction measures proposed by the SUTP is to retrofit angkots with
CNG conversion systems, enabling older gasoline-vehicles to use CNG. According to
a study conducted by GTZ in cooperation with ITS Surabaya in 2000, there are
currently 4,800 angkots operating on 57 different routes in Surabaya, all of which still
using gasoline fuel.
According to the calculations based on the operational data, angkots consumed
approx. 46,080 kiloliters gasoline in 2010. This is equal to 107 kilotons CO2
1 In the SITNP traffic forecast used for the calculations here, the economy is expected to recover to 1995 levels
not earlier than 2010.

GTZ SUTP, July 2001 CO2 Emission Reduction Potenttial of SUTP Measures
9
emissions. If 30% of these angkots used CNG instead of gasoline, the total CO2
emissions would decrease from 107 kilotons by 6,220 tons, to 101kilotons, which
represents a reduction of around 6%. This reduction of CO2 emissions is caused by
the fact that the same energy amount of CNG would only emit 20% less CO2 of the
same energy amount of gasoline if burned through combustion process. If 50% of
angkots would use CNG, their total CO2 emissions can be reduced by around 10%
from 107 kilotons to 97 kilotons.
(f) Retrofitting from 25% to 50% of taxis with cng systems
Another technical measure to reduce CO2 proposed by SUTP is to increase the
share of CNG taxis to 50%. According to the Statistical Year Book Surabaya 2000,
there were in 1999 2,750 taxis operating in the city. According to Taxi Zebra, there
are currently 800 operating taxis in Surabaya that are equipped with CNG converters.
The Taxi Company Taxi Zebra owns all these taxis. The rest of the taxis (1,950 taxis)
are currently using gasoline.
According to the calculation result, the total amount of CO2 emissions would
decrease by around 4% (or by 2,898 tons) from 68 kilotons to 65 kilotons, if the
number of taxis using CNG is increased from around 25% to 50%, assuming the
same operating conditions (the same average daily fuel consumption and the same
number of operating days).
(g) Improvement of public transport system
Besides the technical measures discussed above, SUTP also proposes measures
that are based on modal shifts towards more efficient transportation mode (such as
public transport) or pollution free transportation mode (such as non-motorized
modes). These measures are harder to implement successfully, however they
promise greater CO2 reduction impacts.
One of these measures is the improvement of the public transportation system which
includes city buses and angkots. An improved public transportation system will have
a better image, and be faster, more reliable, comfortable, and secure, thus becoming
more attractive, so that more trips will be conducted by bus and a smaller proportion
of trips will be made with individual motorized vehicles.

GTZ SUTP, July 2001 CO2 Emission Reduction Potenttial of SUTP Measures
10
According to the GTZ staff, bus improvement measures could increase the share of
public transport to 40% in 2010, instead of 34.3% as forecast by SITNP. This modal
shift would lead to more trips on city buses and angkots, and thus basically will lead
to increased emissions of those vehicles. This effect however will be more than
compensated by fewer trips that otherwise would be conducted by car or motorcycle.
Furthermore, there is even less CO2 emissions are expected from the public
transport vehicles due to the bus prioritization program which is an integral part of the
public transport improvement measures.
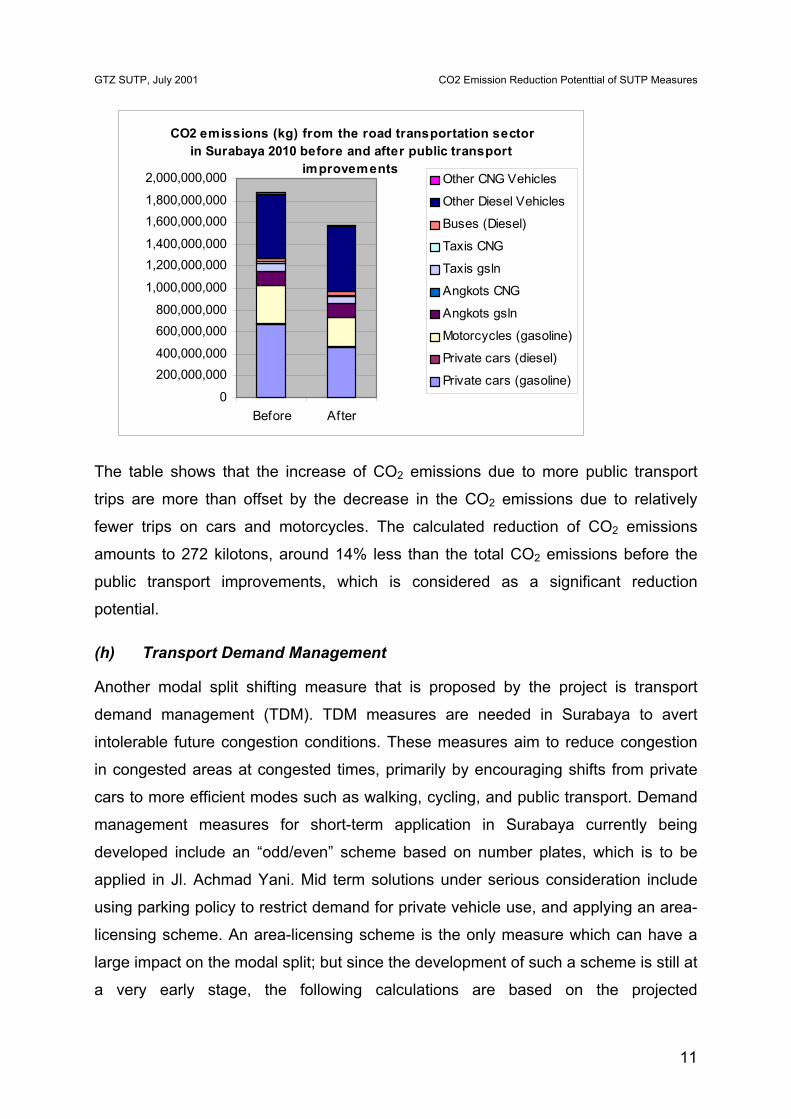
The following table and diagram summarize the calculation results: the reduction of
CO2 emissions by vehicle type before and after public transport improvements. The
CO2 emissions were calculated directly from the fuel consumption using the fuel-
specific conversion factors.
CO2 e m issions 2010
[kg] Be fore Afte r
Priva te ca rs (ga soline ) 664,522,596 459,883,668Priva te ca rs (die se l) 14,073,558 10,553,519M otorcycle s (ga soline ) 338,496,865 257,456,478
Angkots gsln 132,714,734 131,305,193Angkots CNG 0 0
Ta x is gsln 73,747,905 64,423,195Ta x is CNG 18,963,051 16,565,357
Buse s (Die se l) 23,124,907 23,842,000Othe r Die se l Ve hicle s 599,459,681 599,459,681Othe r CNG Ve hicle s 8,517,026 8,517,026
Tota l 1,873,620,323 1,572,006,117
Be fore a nd a fte r public tra nsport im prove m e nts
Publ
ic
tran
spor
t
GTZ SUTP, July 2001 CO2 Emission Reduction Potenttial of SUTP Measures
11
CO2 emissions (kg) from the road transportation sector in Surabaya 2010 before and after public transport
improvements
0
200,000,000400,000,000
600,000,000800,000,000
1,000,000,000
1,200,000,0001,400,000,000
1,600,000,0001,800,000,000
2,000,000,000
Before After
Other CNG Vehicles
Other Diesel Vehicles
Buses (Diesel)
Taxis CNG
Taxis gsln
Angkots CNG
Angkots gsln
Motorcycles (gasoline)
Private cars (diesel)
Private cars (gasoline)
The table shows that the increase of CO2 emissions due to more public transport
trips are more than offset by the decrease in the CO2 emissions due to relatively
fewer trips on cars and motorcycles. The calculated reduction of CO2 emissions
amounts to 272 kilotons, around 14% less than the total CO2 emissions before the
public transport improvements, which is considered as a significant reduction
potential.
(h) Transport Demand Management
Another modal split shifting measure that is proposed by the project is transport
demand management (TDM). TDM measures are needed in Surabaya to avert
intolerable future congestion conditions. These measures aim to reduce congestion
in congested areas at congested times, primarily by encouraging shifts from private
cars to more efficient modes such as walking, cycling, and public transport. Demand
management measures for short-term application in Surabaya currently being
developed include an “odd/even” scheme based on number plates, which is to be
applied in Jl. Achmad Yani. Mid term solutions under serious consideration include
using parking policy to restrict demand for private vehicle use, and applying an area-
licensing scheme. An area-licensing scheme is the only measure which can have a
large impact on the modal split; but since the development of such a scheme is still at
a very early stage, the following calculations are based on the projected

GTZ SUTP, July 2001 CO2 Emission Reduction Potenttial of SUTP Measures
12
implementation of more modest TDM measures, including the odd/even scheme and
tighter parking policy.
It is expected that the share of public transport in the modal split would increase after
successful implementation of transport demand management measures. The
increase of public transport share in the modal split varies depending on the intensity
of the traffic restraint effects of the measures. In the following calculations, the CO2
emissions are calculated using the share of public transport in the modal split of 40%,
45% or even 50% depending on whether medium, heavy or extreme traffic restraint
is applied, as shown in the following tables. The calculation results are later
compared to the BAU scenario, which has the share of public transport in the modal
split of 35%.
Public Transport (Bus) Private cars/motorbikes Traffic restraint
40% 60% Medium45% 55% Heavy50% 50% Extreme
The TDM measures will result in lower trips by car and motorcycle compared to the
"average scenario" without TDM. Less cars and motorcycles also mean less load for
the city's road network which in turn will reduce the congestion effects. Considering
the currently already high volume/capacity ratio in some road links, it is not expected
that these congestion effects can be totally eliminated by solely increasing the share
of public transport to 40% - 50%. Thus the congestion effects will still persist in these
scenarios, but they would lead to higher fuel consumption by a factor of lower than
15% (as calculated in the scenario without bus improvement in the chapter 4.1).
Accurate calculation to determine the congestion factor can only be calculated by
testing the network load using a computerized traffic model such as that was built by
SITNP. For the purpose of the CO2 calculations here, it is assumed that the
congestion factor is 4.0%. Public transport vehicles, such as city buses, angkots and
taxis, however will not be affected by congestion due to prioritization measures in the
frame of public transport improvements.
The following table and diagram summarize the calculated reductions of CO2
emissions by vehicle type before and after the TDM measures for the three scenarios
with medium, heavy and extreme traffic-restraints. The CO2 emissions were

GTZ SUTP, July 2001 CO2 Emission Reduction Potenttial of SUTP Measures
13
calculated directly from the fuel consumption using the fuel-specific conversion
factors.
CO2 e m issions 2010 (in kg)
BAU sce na rio - w ithout TDM
Afte r TDM w ith m e dium tra ffic-
re stra int
Afte r TDM w ith he a vy tra ffic-
re stra int
Afte r TDM w ith e x tre m e tra ffic-
re stra intPriva te ca rs (ga soline ) 580,500,137 445,324,967 387,577,865 329,830,763Priva te ca rs (die se l) 12,294,092 10,219,422 8,894,228 7,569,034M otorcycle s (ga soline ) 295,697,208 249,306,086 233,645,498 217,984,910
Angkots gsln 115,934,239 131,305,193 152,555,143 173,805,092Angkots CNG 0 0 0 0
Ta x is gsln 64,423,195 64,423,195 64,423,195 64,423,195Ta x is CNG 16,565,357 16,565,357 16,565,357 16,565,357
Buse s (Die se l) 20,200,986 23,842,000 29,904,680 35,899,240Othe r Die se l Ve hicle s 523,663,799 523,663,799 523,663,799 523,663,799Othe r CNG Ve hicle s 7,440,130 7,440,130 7,440,130 7,440,130
Tota l 1,636,719,144 1,472,090,150 1,424,669,895 1,377,181,520
Publ
ic
tran
spor
t
CO2 emissions (kg) from transportation sector in Surabaya 2010
before and after TDM with medium, heavy or extreme traffic restraints
0
200,000,000
400,000,000
600,000,000
800,000,000
1,000,000,000
1,200,000,000
1,400,000,000
1,600,000,000
1,800,000,000
BAUscenario- w ithout
TDM
AfterTDM w ithmediumtraff ic-restraint
AfterTDM w ith
heavytraff ic-restraint
AfterTDM w ithextremetraff ic-
restraint
Other CNG Vehicles
Other Diesel Vehicles
Buses (Diesel)
Taxis CNG
Taxis gsln
Angkots CNG
Angkots gsln
Motorcycles (gasoline)
Private cars (diesel)
Private cars (gasoline)
The calculated CO2 emissions reduction through TDM measures would decrease
from approximately 1,637 kilotons by 10%, 13% or 16%, respectively, depending on
the intensity of the traffic restraints measures (medium, heavy or extreme traffic
restraint).
(i) Improvements for non-motorized transport
The improvements of NMT would encourage emissions-free transport modes for trips
conducted on foot, by bike or by becak (rickshaw). The emission reduction effects
can be achieved through substitution of motorized trips by non-motorized trips. Since
NMT trips are, by nature, mostly conducted for short distances, it is highly expected
that non-motorized ones will substitute only short-distance motorized trips. Therefore

GTZ SUTP, July 2001 CO2 Emission Reduction Potenttial of SUTP Measures
14
it is assumed that this substitution effect only applies to short-distance motorized
trips, which here are defined as trips with an average length of 3 km. In reality, NMT
improvements that mainly aim at short distance trips, do encourage longer non-
motorized trips, too. But the effects on the longer trips are very limited, because most
of the times they are significantly lower than the impacts affecting the short trips.
Given the poor conditions of NMT facilities, which are to be seen as the major
constraint for NMT in Surabaya, and the fact that the urban mixed land-use pattern
that is ideal for non-motorized trips, it is believed that the level of substitutable
motorized trips is very high. In the center areas of city (e.g. Kedungdoro and
Rungkut), is believed that more than 50% of the motorized trips are substitutable. For
the purpose of that calculations here, the substitution rate is set lower to 30%
citywide, which means that the improvement of NMT facilities would lead that 30% of
short-motorized trips to be substituted by non-motorized trips.
The following table shows the modal split of short distance trips (average 3 km)
based on the NMT surveys survey conducted by GTZ in cooperation with
ITDP/LPIST in 2000.
M ode M oda lsplit sha re
Fue l consum ption (liter per person.trip)
walk 40% -becak 7% -bike 3% -angkot 17% 0.04m otorcyc le 33% 0.11Car 1% 0.58 Source of modal split: Improving NMT facilities in Surabaya, GTZ/ITDP 2000
If the NMT improvements citywide would lead to a reduction of short distance
motorized trips by 30% as mentioned above, then it would lead to a following modal
split:
M ode M oda lsplit sha re
walk 50%becak 14%bike 11%angkot 12%m otorcyc le 23%Car 1%

GTZ SUTP, July 2001 CO2 Emission Reduction Potenttial of SUTP Measures
15
This would reduce the fuel consumption of short trips by motorcycle, angkot and car
proportionally by 8,800 kiloliters gasoline and 34 kiloliters diesel, which is in total
equal to CO2 emissions of approximately 20 kilotons.
(j) Summary table of impact of measures in travelled kilometres
The table on the following page shows the reductions of travelled motorised
kilometres achievable by different measures.
(k) Cost effectiveness of the measures
Preliminary assessment of the cost-effectiveness of the measures show that
although relatively harder to implement successfully, measures that are mainly based
on modal split changes – in particular promoting more efficient, less polluting modes
such as public transport and non-motorised transport – have a significantly higher
cost effectiveness compared to technical measures or measures that rely very much
on expensive infrastructure improvements. Obviously, this is due to both the higher
CO2 reduction potentials and lower costs. Clearly, emissions reductions gained by
expensive technology retrofits can be offset by even small shifts in the modal share,
and conversely even small shifts in the modal split can achieve significant CO2
reductions.

GTZ SUTP, July 2001 CO2 Emission Reduction Potenttial of SUTP Measures
16
Scenarios2000 2010 2010 2010
Status quo Status quo Improvement of
Vehicle Type (BAU) estimates projection public transport Medium traffic-restraint
Heavy traffic-restraint
Extreme traffic-restraint
Private cars (gasoline) 1,420,402,680 2,491,416,899 1,837,755,725 1,837,755,725 1,599,446,456 1,361,137,186 2,474,646,972Private cars (diesel) 28,987,810 46,924,017 37,505,219 37,505,219 32,641,764 27,778,310 46,581,774Motorcycles (gasoline) 2,347,046,485 3,172,716,826 2,572,075,009 2,572,075,009 2,410,505,719 2,248,936,430 3,009,279,498
Angkots gsln 460,800,000 497,571,840 563,541,602 563,541,602 654,743,101 745,944,600 491,875,929Angkots CNG n.a. n.a. n.a. n.a. n.a. n.a. n.a.
Taxis gsln 218,400,000 276,494,400 276,494,400 276,494,400 276,494,400 276,494,400 276,494,400Taxis CNG 69,600,000 88,113,600 88,113,600 88,113,600 88,113,600 88,113,600 88,113,600
Buses (Diesel) 16,250,000 19,275,750 22,750,000 22,750,000 28,535,000 34,255,000 19,275,750Other Diesel Vehicles n.c. n.c. n.c. n.c. n.c. n.c. n.c.Other CNG Vehicles n.c. n.c. n.c. n.c. n.c. n.c. n.c.
Total 4,561,486,975 6,592,513,332 5,398,235,555 5,398,235,555 5,090,480,040 4,782,659,525 6,406,267,923n.c. = not calculatedn.a. = not applicable
Traveled kilometers
Transport Demand Management2010
Improvement of Non Motorized Transport
Publ
ic
tran
spor
t

GTZ SUTP, July 2001 CO2 Emission Reduction Potenttial of SUTP Measures
17
2 INTRODUCTION The Sustainable Urban Transportation Project (SUTP), established in partnership
between the Municipality of Surabaya and the German Agency for Development
Cooperation (GTZ), is developing options to reduce carbon dioxide (CO2) emissions
from the transportation sector in Surabaya. The measures developed were based on
a comprehensive strategy assessment. They are ranging from measures focusing on
minimizing trip generations without restricting access (e.g. integration of land-use
planning and transportation planning), measures enhancing efficiency of transport
operations (e.g. transport demand management, improvements of bus system and
fostering non-motorized transport), technical measures (such as promoting the use of
CNG) and other supporting measures (such as a public awareness campaign and
institutional reform). The measures developed are in varying stages of
implementation.
Estimating the impacts of these measures, assuming the measures are implemented,
in reducing CO2 emissions is the objective of this report. Some measures have a
direct impact on CO2 emissions, while others are of a supplementary and enabling
nature, making it possible for the emission reductions to occur, but not directly
attributable to any emissions. A public awareness campaign, for example, is
essential for the successful implementation of transport demand management
measures, and moderate institutional reforms are essential for successful
implementation of public transport improvements. Therefore while such activities –
public awareness raising and so on – are an important and essential part of the GTZ
SUTP project activities, they do not have any CO2 reduction impact attributable to
them per se. Their impact is only an enabling one, making the other measures
possible. These “enabling” characteristic means that no CO2 reduction is attributed to
these measures in this report.
CO2 cannot be filtered and reduced by exhaust gas after treatment. Every process of
burning fossil fuels causes CO2 emissions. Other than exhaust gas emissions the
reduction of CO2 depends highly on (1) the carbon content of the fuel used (2) the
specific fuel consumption of vehicles, (3) the modal split and (4) the specific vehicle
mileage traveled. While the first and second strategy is a technology approach, the

GTZ SUTP, July 2001 CO2 Emission Reduction Potenttial of SUTP Measures
18
third and fourth approach focuses on traffic management. As it is simpler to quantify
the technology approach and their effects on CO2-reduction (in terms of numbers,
technical requirements or approaches and their reduction potentials), it is not the
case in quantifying the CO2 reduction impacts from traffic management measures. In
general, traffic management measures have higher potential of an immediate CO2-
reduction than those based on the technological approach, but their successful
implementation depends highly on a number of conditions, e.g. necessary to make
the modal shift and a reduction of vehicle mileage traveled attractive.

GTZ SUTP, July 2001 CO2 Emission Reduction Potenttial of SUTP Measures
19
3 METHODOLOGY In order to ensure comparability and usability of the estimation results (e.g. to be
used when calculating provincial or national CO2 emissions), the Guidelines for
National Greenhouse Gas Inventories2 were used wherever applicable. The
guidelines, which were issued by the Intergovernmental Panel on Climate Change
(IPCC) contain estimation methodologies to be used as a reference when
constructing and reporting national inventories of CO2 emissions and other
greenhouse gas emissions such as CH4, N2O, NOx and CO. The IPCC Guidelines
also include a number of “default” assumptions and data for use in the estimation of
greenhouse gas emissions. This default information however is included primarily to
provide users with a starting point when developing their national calculations. Thus
its usability for such detailed calculations as conducted in this report is limited, and
more accurate local information or data is used instead, if they are available and
applicable. Otherwise assumptions are used as described.
In the calculations, the CO2 emissions reduction impacts are derived directly from the
fuel usage by using the conversion factors (see the following flowchart diagram). This
is in line with the basis of methodology of the IPCC Guidelines in estimating CO2
emissions using an internationally accepted approach by accounting for the carbon in
fuels supplied to an economic sector, such as transportation. This approach is
simple, yet accurate, since CO2 emissions are primarily dependent on the carbon
content of the fuel consumed. It can only be used to estimate the total CO2 emissions
based on the fuel supply at a given time period, thus on a highly aggregated level in
contrast to detailed calculations (e.g. by breaking down to different kinds of
consumers in transport such as motorbikes, passenger cars, buses, taxis, trucks).
This approach is applied in calculating the total CO2 emissions based on the fuel sold
in Surabaya for the year 2000. On the one hand the average specific fuel
consumption of the different vehicle types in different transport modes have to be
2 The Reference Manual in the IPCC Guidelines provides a compendium of information on methods for
estimation of emissions for a broader range of greenhouse gases and a complete list of source types for each.
It summarizes a range of possible methods for many source types. It also provides summaries of the scientific
basis for the inventory methods recommended and gives extensive references to the technical literature.

GTZ SUTP, July 2001 CO2 Emission Reduction Potenttial of SUTP Measures
20
estimated, because the required disaggregated fuel sales data (e.g. fuel sales by
vehicle type) is not available for Surabaya; on the other hand the estimations and
overall results can be cross checked with the fuel supply data at a given time period.
For measures which have an effect on the use of specific vehicle types, such as
angkots, taxis and buses, it is necessary as a check on the fuel consumption data to
break the total fuel consumption down by vehicle type separately by deriving it from
the traffic data. This is conducted by using simplified traffic forecasting methods (e.g.
by using average values and generalizations.).
Flowchart: Basic methodology of check based on modal split and trip-making characteristics
FuelConsumption
CO2emissions
Emission factors
Modal Split
The CO2 emission reduction potential caused by each measure of the SUTP project
cannot be estimated directly using the methodology as described in the IPCC
Guidelines. The impacts of the measures on the reduction of fuel usage have to be
calculated by using the traffic forecasting methods. Each measure proposed by the
SUTP project involves different mechanisms in reducing the fuel usage. This is for
example the case for estimating the impacts of modal-split changes (such as are
caused by certain traffic management measures) or the impacts of non-motorized
transport improvements on CO2 emissions. Appropriate traffic forecasting
methodology is developed for each measure separately. Each chapter in this report
contains detailed descriptions of the traffic forecasting methodologies used to
estimate the CO2 emissions reduction impacts of the selected measures. The
overview to the calculation methodologies used in this report is shown in the
following flowchart diagram. Comparing the results of the calculations that are based
on these two methodologies (CO2 from economic sectors and CO2 from traffic
forecasting methodologies) would provide some possibility to cross check, since they
would ideally produce the same results.

GTZ SUTP, July 2001 CO2 Emission Reduction Potenttial of SUTP Measures
21
Surabaya has been exhaustively studied. International consultant reports on
transport, beginning with a public transport study in 1978 and culminating with a
major World Bank transport sector project from 1993 – 1998 (SITNP) and the GTZ
SUTP project (ongoing), have resulted in a large store of available data and reports.
Therefore while there remains inherent uncertainty making emission reduction
calculations, the calculations in this report are able to be based on more complete
and accurate data than would usually be the case with a city in a developing country.
The limitations of the available data added to the complexity and decreased the
precision of the calculation. Some data needed for the calculations in this report was
not available (e.g. average trip length data), and thus has to be replaced by a set of
assumptions. The main assumptions and estimations were agreed upon with the
GTZ team. These assumptions were often necessary, but whenever possible data
was taken from existing reports. The sources of available data and the assumptions
and other estimations used for the calculations are specifically noted in each chapter,
where the step-by-step calculations for each measure are described. Traffic data
(that is used as input for the calculation here) was mainly obtained from the
Surabaya Integrated Transportation Network Project Reports published (full
reference is given at each relevant part of the calculations), which were based on two
separate household surveys. Actual fuel sales figures were used to calculate the total
CO2 emissions. To test the plausibility of the data, cross checks were conducted
whenever possible by comparing the calculation results derived from the traffic
figures with those from the fuel sales figures. Since these calculations are rough
estimations based on data collected with different methods and in different years, an
error margin of more than 10% is possible. In an effort to minimize the error margin,
conservative assumptions were in general made.

GTZ SUTP, July 2001 CO2 Emission Reduction Potenttial of SUTP Measures
22
AngkotOperational Data
FuelConsumption of
Taxis2
Methodology for CO2 Emissions Caculation
TaxiOperational Data
FuelConsumption of
Angkot
Total gasolineconsumption of
both car andmotorcycle
Total gasolineconsumption ofMotorvehicles
Specific fuelconsumption of
Car
2Specific fuel
consumption ofMotorcycle
Modal Split1995
Trip data by trippurpose 1995
Average trip length bymode and purpose 1995
Traveled km byvehicle type andtrip purpose 1995
Traffic growth rate data(1995 - ..)
Accumulativegrowth
1995-2000
Modal Split2000
Traveled km byvehicle type andtrip purpose 2000
Gasolineconsumptionshare factor
Car/Motorcycle
Gasolineconsumption of
Car andMotorcycle
CNG-TaxiOperational Data
DieselConsumption of
Buses
2BusOperational Data
CNGConsumption of
Taxis
DieselConsumption ofother Diesel-Veh.
CO2 emissionsof DieselVehicles
CO2 emissionsof CNGVehicles
CO2 emissionsof car andmotorcycle
Fuel Sales Databy fuel type
CO2emissions of
Angkot
CO2emissions of
Taxis
CO2 emissionsby vehicle type
in Surabaya
DieselEmission factor
CNGEmission factor
CO2 Emissionsby fuel type
CO2 Emission factorsby fuel type Cross check
GasolineEmission factor
Input data Computed output for further calculation Calculation results

GTZ SUTP, July 2001 CO2 Emission Reduction Potenttial of SUTP Measures
23
For further general studies on CO2 emissions from the transportation sectors and
methods for calculating CO2 emissions, the following literature is recommended:
• Schipper L. et al: Driving a Bargain? Using Indicators to Keep Score on the Transport - Environment-Greenhouse Gas Linkages, 2000
• MEET: Calculating transport emissions and energy consumption - Part A. Road Transport, 2000
• ADB: Strategy for the use of Market-Based Instruments, 1997 • Report of an international roundtable organized by PTRC Education and
Research Service Ltd.: Evaluation of Environmental Effects of Transport, The Hague, The Netherlands, 19-20 June 1995
• ECMT (European Conference of Ministers of Transport): CO2 Emissions from Transport, 1997
• Organisation for Economic Co-Operation and Development (OECD): Motor Vehicle Pollution Reduction strategies beyond 2010, 1995
• International Institute For Energy Conservation: Assessment of Transportation Growth in Asia and Its Effects on Energy Usage, Environment and traffic Congestion, August 1991
• Michelis L. (OECD): Sustainable Transport Policies : CO2 Emissions From Road Vehicles Policies and Measures for Common Action, Working Paper 1 July 1996
• Second Report Submitted by the Enquete Commission “Protecting the Earth’s Atmosphere” of the 12th German Bundestag: MOBILITY AND CLIMATE, Developing Environmentally Sound Transport Policy Concepts, 1994
• European Academy of the Urban Environment Berlin: Environmentally Compatible Urban Transport and Traffic, 1996
All of the above literature is available at the GTZ-SUTP project office in Surabaya.

GTZ SUTP, July 2001 CO2 Emission Reduction Potenttial of SUTP Measures
24
4 DETAIL CALCULATIONS 4.1 CO2 EMISSIONS 2000 AND ITS PROJECTION FOR 2010
4.1.1 CALCULATION OVERVIEW The objective of the calculations in this chapter is to estimate the CO2 emissions from
the road transportation sector in Surabaya for the year 2000, and it's projection for
the year 2010, each differentiated by vehicle type. The calculations of CO2 emissions
for the year 2000 comprises of the following steps:
Step 1: Calculating the total CO2 emissions based on the fuel sales 2000 Step 2: Calculating fuel consumption by vehicle type for 2000
• Calculating total fuel consumption and CO2 emissions based on fuel sales (by vehicle type)
• Calculating gasoline consumption by taxis and minibuses/angkots • Calculating gasoline consumption by cars and motorcycles • Calculating CNG consumption by Taxis and other vehicles • Calculating diesel consumption by city buses and other vehicles
Step 3: Calculating CO2 emissions by vehicle type for 2000 The projection of CO2 emissions for 2010 can be calculated in two ways. One
possibility is to directly project the historical fuel sales figures to the year 2010 and
convert them into CO2 emissions. Alternatively, one could project the fuel
consumption indirectly for the year 2010 by projecting the traffic growth of each
transport mode (private car, motorcycle, microbus, city bus and taxis), and then
convert the fuel consumption figures into CO2 emissions. Even though simpler and
more straightforward, the first method would result in less accurate estimations due
to the fact that many determining factors for fuel consumption would be left
unconsidered. This includes, for example, the change of the traffic pattern resulting
from the different growth rates of different vehicle types that have different specific
fuel consumption. In contrast, the second calculation method can take account of
significant traffic factors. Furthermore, by using the second method one also takes
advantage of the fact that detailed traffic forecasts already exist for Surabaya as a
result from a computer based traffic modeling conducted in the frame of the World
Bank funded SITNP project in 1998. Because of these advantages, it is decided to
use the second method to estimate the CO2 emissions for 2010.

GTZ SUTP, July 2001 CO2 Emission Reduction Potenttial of SUTP Measures
25
The calculation starts with the calculation of the total CO2 emissions based on the
fuel sale figures, which also will be used to cross check, the calculated CO2
emissions by vehicle type.
4.1.2 CALCULATING TOTAL FUEL CONSUMPTION AND CO2 EMISSIONS BASED ON FUEL SALES 2000
In Surabaya the following amounts of fuels were sold in year 2000:
Type of Fue l2000
(L per m onth)2000
(L per year)Ga soline 30,000,000 360,000,000Die se l 14,000,000 168,000,000CNG* 840,500 10,086,000*CNG is sold in "Liters gasoline-equivalent" by Pertamina Source: Rifky Hardijanto, UPPDN V Pertamina, Fjellstrom by phone 05-Jan-01
For the purposes of this inventory, it was assumed that all fuels sold are used in road
transportation vehicles only. This assumption introduces only a small degree of error
and allows a separate, simplified analysis of alternatively fuelled vehicles in the other
measure-related calculations in this report.
The methodology used to calculate CO2 emissions is outlined in the IPCC Guidelines
for National Greenhouse Gas Inventories. Fuel combustion CO2 emissions depend
upon the amount of fuel consumed, the carbon content of the fuel and the fraction of
the fuel oxidized. The estimation process can be divided into six steps that lead to
figures for CO2 emissions from fuel combustion:
1. Estimate consumption of fuels by fuel/product type.
2. Convert the fuel data to a common energy unit (TJ), if necessary.
3. Calculate the total carbon content of the fuels by using carbon emission factors
for each fuel type.
4. Calculate the amount of carbon stored in products for long periods of time.
5. Account for carbon not oxidized during combustion (the combustion process
considers a 100% oxidation into CO2).
6. Convert emissions of carbon to full molecular weight of CO2.
For the energy content factors and carbon emission coefficients as needed for the
calculation in the steps 1 and 2 average fuel data are used to estimate the total
carbon content of the fuels. The resulting conversion factors [kg CO2 per Liter fuel]
GTZ SUTP, July 2001 CO2 Emission Reduction Potenttial of SUTP Measures
26
consider stoichiometric calculations. Another calculation from fuel sold (data given in
Liter) to convert the fuel data to an energy unit in Terra Joule, and calculating the
total carbon content of the fuels using carbon emission factors for each fuel type in
specific are not necessary. Step 1 and 2 are substituted by converting directly fuel
sale figures to estimated CO2 emissions. The formula for calculating the total CO2
emissions can be expressed as:
CO2 Emissions [kg] = Total amount of fuel sold [L] * Conversion factor [kg/Liter] This simplification contained in the formula, which implies that fuel sale figures
represent the apparent fuel consumption in Surabaya in the calculation time period,
assumes that:
1) The effect of fuel exports and fuel imports are neutral to the total amount of
fuel consumption in Surabaya.
2) There is zero effect of the fuel supply and fuel consumption on the fuel stock
changes. This means that the amount of the fuel stored is constant, or the
entire amount of fuel sold is consumed within the same calculation period.
3) The entire amount of fuel sold is consumed in the road transportation (no
fugitive loss), and the entire carbon contents in the fuel are oxidized fully
through the combustion process (oxidation rate = 100%).
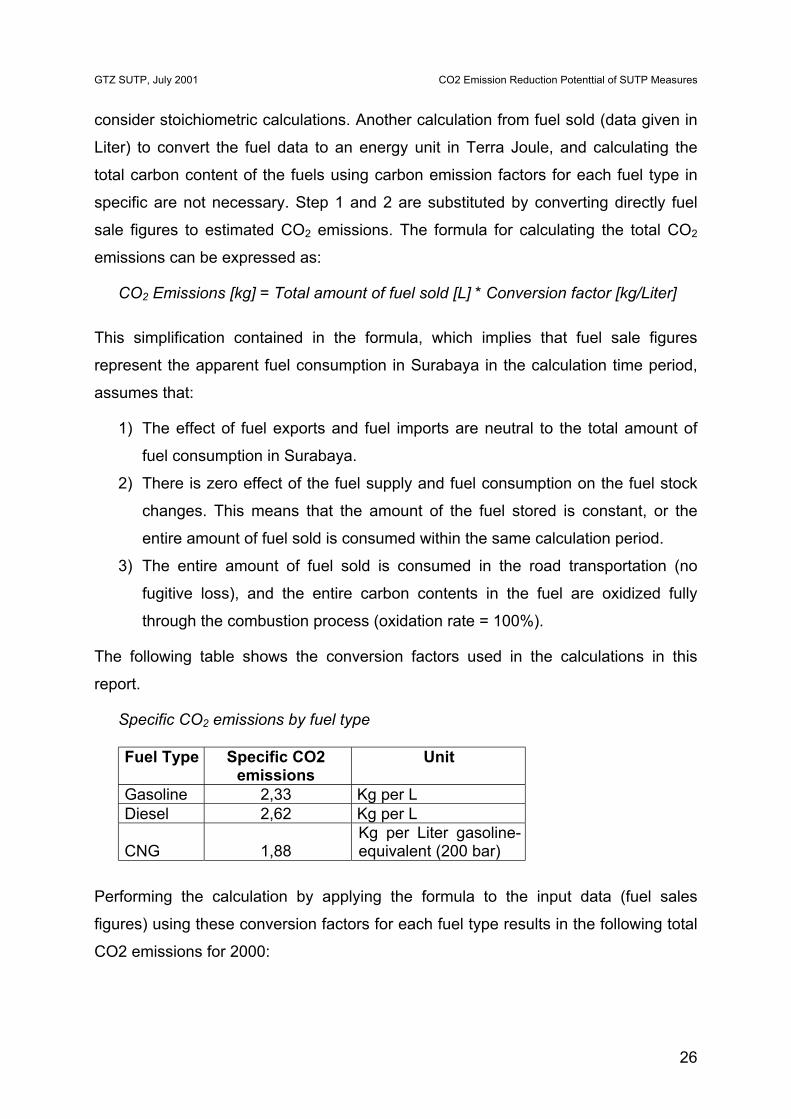
The following table shows the conversion factors used in the calculations in this
report.
Specific CO2 emissions by fuel type Fuel Type
Specific CO2 emissions
Unit
Gasoline 2,33 Kg per L Diesel 2,62 Kg per L
CNG 1,88 Kg per Liter gasoline-equivalent (200 bar)
Performing the calculation by applying the formula to the input data (fuel sales
figures) using these conversion factors for each fuel type results in the following total
CO2 emissions for 2000:

GTZ SUTP, July 2001 CO2 Emission Reduction Potenttial of SUTP Measures
27
Type of Fue l2000
(kg per year)Ga soline 838,800,000 Die se l 440,160,000 CNG 18,961,680
Tota l 1,297,921,680 In the calculation performed above, uncertainty is caused not only by the
simplification of the methodology, but also by the assumptions used, and - in the first
place - by the input data. Because of these many factors, the confidence level cannot
be determined accurately. The generalization contained in the conversion factors
alone ignores the fact that there is considerable variation in the carbon and energy
content by weight of fuels depending on the type and origin of the fuels. According to
IPCC, this can vary within a 10% range depending on the country where fuel is
consumed (see IPCC 1997). Therefore the accumulative error margin in the
calculations in this report can amount to more than 10%, which is normal for such
calculations and still within the acceptable range for the purpose of this report.
4.1.3 CALCULATING FUEL CONSUMPTION BY VEHICLE TYPE FOR 2000 BASED ON TRAFFIC DATA
In order to improve accuracy and to allow the calculation of CO2 emission reduction
potential caused by different measures, it is necessary to sub-divide road
transportation into numerous sub-sectors, as emissions and traffic conditions are
related to vehicle type and modal splits. For the purpose of this report, it is useful to
distinguish different vehicle types in Surabaya depending on the fuel type they use
and how the are affected by the proposed emission reduction measures:
1) Private cars (gasoline) 2) Motorcycles (gasoline) 3) Public transport
• Minibus/Angkots (gasoline) • Minibus/Angkots (CNG) – approximately 12 seated capacity • Taxis (gasoline) • Taxis (CNG) • Buses (Diesel) – approx. 50 seated capacity
4) Other Diesel Vehicles 5) Other CNG Vehicles

GTZ SUTP, July 2001 CO2 Emission Reduction Potenttial of SUTP Measures
28
(l) Calculating gasoline consumption by taxis and minibuses/angkots
Since no disaggregated fuel sales data is available, the fuel consumption of each
vehicle type has to be calculated indirectly from the traffic data. For
minibuses/angkots and taxis, yearly gasoline consumption can be calculated by
multiplying the total number in Surabaya with the average daily fuel consumption and
the number of operational days in a year. Data for the total number of angkots in
1999 was available in the Surabaya Statistical Handbook 2000. The daily fuel
consumption and the number of their operational days are assumed to be 30 liter per
day per angkot and 320 operational days per year, respectively. These assumptions
are based on the information obtained by the consultant through interviews with
numerous angkot drivers and the two angkot associations in 1999, and were
confirmed in GTZ SUTP project staff interviews by phone in May 2001 (data from
Nurhadi, Kopatas). The data for the total number of taxis were obtained from the
Surabaya Statistical Handbook 2000. The daily average fuel consumption data was
obtained from the taxi companies Taxi Zebra and verified by interviewing numerous
taxi drivers. The number of operational days per year is set to be 320 days according
to information from Taxi Zebra. The following tables show the fuel consumption by
angkot and by taxi in 2000:
A. Gasoline consumption by Angkots (for the year 2000)4,800 units
Average daily fuel consumption 30 Liter/dayNumber of operational days per year 320 days/yearYearly total fuel consumption of angkots 46,080,000 Liter
B. Gasoline consumption by Taxis (2000)1,950 units
Average daily fuel consumption 35 Liter/dayNumber of operational days per year 320 days/yearYearly total fuel consumption of Taxis 21,840,000 Liter
Total number of angkots
Total number of Taxis
In sum, angkots and taxis consumed 67,920,000 Liters of the total of 360,000,000
Liters gasoline sold in 2000 in Surabaya. Therefore the angkots and taxis consume
approximately 20 % of the total gasoline consumption, which is a considerable share
to the CO2-emissions from gasoline vehicles and motorbikes/-cycles.
(m) Calculating gasoline and diesel consumption by cars and motorcycles
According to the calculations above, the remaining of 292,080,000 Liters
(approximately 80%) gasoline was available for other gasoline vehicles, which

GTZ SUTP, July 2001 CO2 Emission Reduction Potenttial of SUTP Measures
29
practically are comprised only of cars and motorcycles. Assuming that there were no
other gasoline vehicles, the amount of the gasoline consumed by cars and
motorcycles depends on their consumption share, which again depends on their
traveled kilometers [km] and their specific fuel consumption [km/l]. While specific
consumption can be assumed to 8 km/l (12.5 l/100km) and 25 km/l (4 l/100km) for
car and motorcycle respectively, based on consultant's interviews with numerous car
and motorcycle users in Surabaya, it is not easy to find out their traveled kilometers
[km]. Fortunately, some traffic data was available from the SITNP reports, from which
these traveled kilometers can be derived through some calculation steps. These data
are vehicular trips 1995 (source: SITNP Study Report C2, 1998), trip shares by
purpose 1995 (Source: SITNP Study Report 9 1996, same data can be found also in
the SITNP Study Report C2, 1998) and average length [km] of home-based trips by
mode and purpose 1995. The following tables show an overview of all of these data:
C2-1. Input da ta : Da ily ve hicula r trips by m ode 1995 (source: S ITNP S tudy Report C2, 1998)
M ode & purpose Ve hicula r TripsHom e based - car 428,523Non-hom e based - car 254,168Cordon - car 72,642Hom e based m otorcyc le 1,048,257Non-home based motorcyc le 70,074Cordon - m otorcyc le 77,799
C2-2. Input da ta : Hom e ba se d trips by purpose 1995 (Source: S ITNP S tudy Report 9, 1996)hom e-W ork 38%hom e-Education 25%hom e-Others 16%
C2-3. Input da ta : Ave ra ge le ngth (km ) of hom e ba se d trips by m ode a nd purpose 1995(Source: S ITNP Report 9, 1996 based on S ITNP and SSKLL hom e interviews)
Ca r M otorcycleW ork 9.2 7.07Educa tion 6.23 6.67Othe r 7.25 5.51 Since the average trip length data is broken down by trip purpose, it is necessary to
consider the share of the trip purposes. The traveled kilometers [km] can be
calculated using the following formula:
Traveled kilometers ab [km] = Average Trip length ab [km/trip] * trip share a [%] * modal split b [trips]
GTZ SUTP, July 2001 CO2 Emission Reduction Potenttial of SUTP Measures
30
Where: a = trip purpose (work, education, others, non-home-based) b = transport mode (car, motorcycle, public transport)
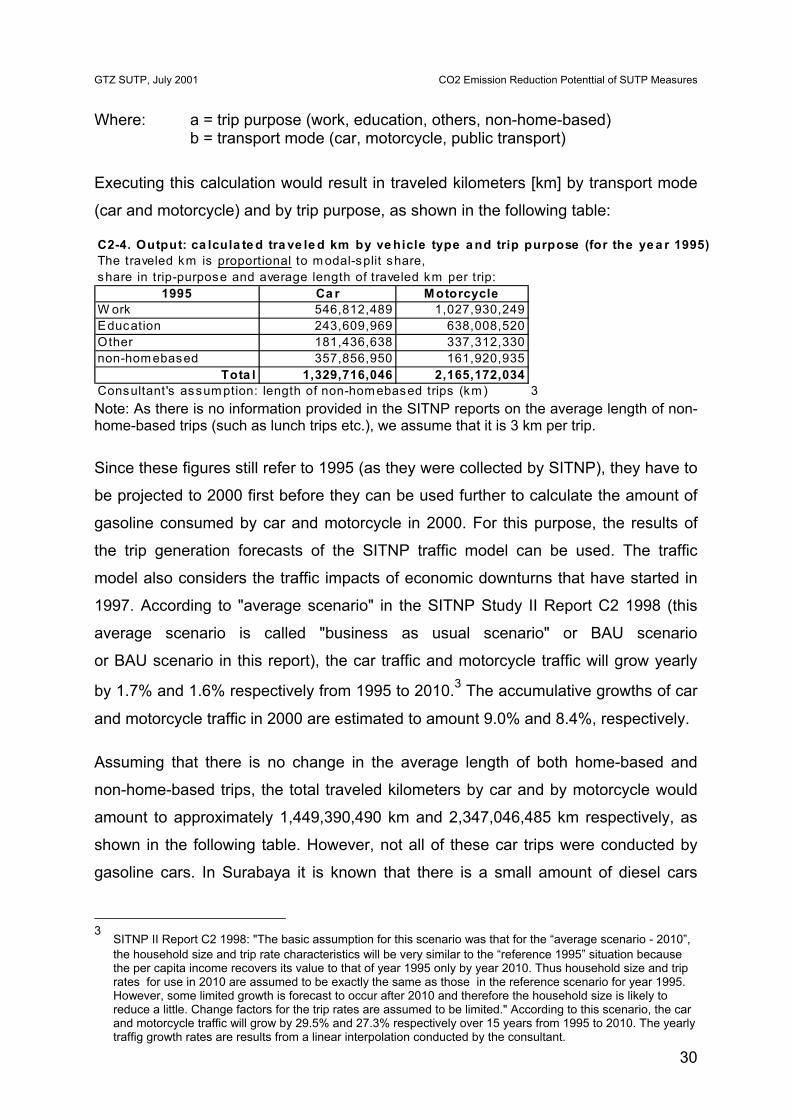
Executing this calculation would result in traveled kilometers [km] by transport mode
(car and motorcycle) and by trip purpose, as shown in the following table:
C2-4. Output: ca lcula te d tra ve le d km by ve hicle type a nd trip purpose (for the ye a r 1995)The traveled km is proportional to m odal-split share, share in trip-purpose and average length of traveled km per trip:
1995 Ca r M otorcycleW ork 546,812,489 1,027,930,249Education 243,609,969 638,008,520Other 181,436,638 337,312,330non-hom ebased 357,856,950 161,920,935
Tota l 1,329,716,046 2,165,172,034Consultant's assum ption: length of non-hom ebased trips (km ) 3 Note: As there is no information provided in the SITNP reports on the average length of non-home-based trips (such as lunch trips etc.), we assume that it is 3 km per trip.
Since these figures still refer to 1995 (as they were collected by SITNP), they have to
be projected to 2000 first before they can be used further to calculate the amount of
gasoline consumed by car and motorcycle in 2000. For this purpose, the results of
the trip generation forecasts of the SITNP traffic model can be used. The traffic
model also considers the traffic impacts of economic downturns that have started in
1997. According to "average scenario" in the SITNP Study II Report C2 1998 (this
average scenario is called "business as usual scenario" or BAU scenario
or BAU scenario in this report), the car traffic and motorcycle traffic will grow yearly
by 1.7% and 1.6% respectively from 1995 to 2010.3 The accumulative growths of car
and motorcycle traffic in 2000 are estimated to amount 9.0% and 8.4%, respectively.
Assuming that there is no change in the average length of both home-based and
non-home-based trips, the total traveled kilometers by car and by motorcycle would
amount to approximately 1,449,390,490 km and 2,347,046,485 km respectively, as
shown in the following table. However, not all of these car trips were conducted by
gasoline cars. In Surabaya it is known that there is a small amount of diesel cars
3 SITNP II Report C2 1998: "The basic assumption for this scenario was that for the “average scenario - 2010”,
the household size and trip rate characteristics will be very similar to the “reference 1995” situation because the per capita income recovers its value to that of year 1995 only by year 2010. Thus household size and trip rates for use in 2010 are assumed to be exactly the same as those in the reference scenario for year 1995. However, some limited growth is forecast to occur after 2010 and therefore the household size is likely to reduce a little. Change factors for the trip rates are assumed to be limited." According to this scenario, the car and motorcycle traffic will grow by 29.5% and 27.3% respectively over 15 years from 1995 to 2010. The yearly traffig growth rates are results from a linear interpolation conducted by the consultant.

GTZ SUTP, July 2001 CO2 Emission Reduction Potenttial of SUTP Measures
31
operating in the city (their share is assumed to be around 2%, according to an
interview on July 4, 2001 by a GTZ staff Karl Fjellstrom with a staff from city's
Department of Transportation).
C2-4. Output: ca lcula te d tra ve le d km by ve hicle type s a nd trip purpose (for the ye a r 2000)The traveled km is proportional to m odal-split share, trip-purpose share and average length of traveled km per trip:
2000 (proje cte d from 1998
da ta ) Ca r M otorcycleW ork 596,025,613 1,114,276,389Education 265,534,866 691,601,236Other 197,765,936 365,646,566non-hom ebased 390,064,076 175,522,294
Tota l 1,449,390,490 2,347,046,485 Now we have the total traveled kilometers [km] and the specific gasoline
consumption [km/l] of both car and motorcycle for 2000. The total gasoline
consumption can be calculated by subtracting the total traveled kilometers by 2%,
and dividing the result by the specific gasoline consumption [km/l]. This calculation
leads to a total gasoline consumption of 271,432,194 Liters in 2000 for both car and
motorcycle as shown the following table:
D1. Output: Ca lcula te d ga soline consum ption [Lite rs]of ca rs a nd m otorcycle s (for the ye a r 2000) - ba se d on tra ffic da ta
2000 (proje cte d from 1998
da ta )Ga soline
Consum ption [L]Die se l
Consum ption [L]Ca rs 177,550,335 3,623,476Motorcycle s 93,881,859 n/a
Tota l 271,432,194 3,623,476 To test how reliable the traffic data is to be used to calculate the gasoline
consumption, a crosscheck is conducted. The previous calculations based on the fuel
sales figures leads to the total gasoline consumption (by car and motorcycle) of
292,080,000 Liters in 2000, while the above calculation (based on the projected
traffic data) leads to a total gasoline consumption of 271,432,194 Liters. This is only
a small discrepancy of around 7%, which indicates that the two independent input
data sources (fuel sales figures from Pertamina, the state-owned fuel supplier, and
the projected traffic data from SITNP) are of high consistency considering the error
margins of the calculations here.
In order to calculate the impacts of modal split changes on CO2 emissions it is
important to have a reliable traffic data (traveled km, number of trips, length of each
trip, specific fuel consumption) that is consistent in terms of both absolute values of

GTZ SUTP, July 2001 CO2 Emission Reduction Potenttial of SUTP Measures
32
each vehicle mode and relative values among vehicle modes.4 To ensure this
consistency another crosscheck is conducted here by comparing the gasoline
consumptions of car and motorcycle as calculated in the table above (solely based
on projected traffic data by using the absolute values of traveled km) with the
gasoline consumptions that are calculated from the fuel sales figures by using the
relative ratio between the traveled kilometers by car and the traveled kilometers by
motorcycle.
In conjunction with the specific fuel consumption of car and motorcycle, this relative
ratio has to be melted into a "consumption share factor", which represents the
consumption shares of car or motorcycle. The consumption share factor itself is
proportional to the traveled kilometers and is inversely proportional to the specific fuel
consumption, a relationship which arithmetically can be expressed in the following
formula:
Consumption share factor ≈ traveled kilometers [km] / specific fuel consumption [km/l]
Executing this calculation will result in a consumption share factor for cars and
motorcycles. This means that the remaining 292,080 kilo-liters (unused by taxis and
angkots) were consumed for car and motorcycle trips. This is summarized in the
following table:
D2. Output: Ca lcula te d ga soline consum ption [Lite rs] of ca rs a nd m otorcycle s (for the ye a r 2000) - ba se d on fue l sa le s figure sThe cons um ption s hare facto rs repres ent the am ount o f gas o line cons um ed by each veh icle type .The consumption share f ac tor of a vehic le type is proportional to the traveled km and is inversely proportional to the s pecific fue l cons um ption. The actua l fue l cons um ption is p roportiona l to the s hare facto rs .
Fue l Consum ptionin figures in % [L]
Ca rs 181,173,811 65.9% 192,387,405 M otorcycle s 93,881,859 34.1% 99,692,595
Tota l 100.0% 292,080,000
Consum ption-sha re fa ctors
Comparing the results of the two calculations verifies their consistency as shown in
the following table (with discrepancy of only approximately 7%), and therefore, both
the gasoline sales figures and the traffic data can be used for further calculations in
the next chapters of this report.
4 The reason for this is that there is a possibility that the traffic data can be accurate in term of relative values

GTZ SUTP, July 2001 CO2 Emission Reduction Potenttial of SUTP Measures
33
D3. Output: Ca lcula te d ga soline consum ption [Lite rs] for the ye a r 2000Projec tion Fuel Consumption Fuel Consumptionfrom 1998 data based on S ITNP based on Pertam ina
traffic data [L] sales figures [L]Ca rs 192,387,405 177,550,335 Motorcycle s 99,692,595 93,881,859
Tota l 292,080,000 271,432,194 Calculating CNG consumption by Taxis and other vehicles Similar to the calculation of gasoline consumption by angkot or taxi as conducted
above, the CNG consumption of taxis is calculated directly from their operational
data. The assumptions on the number of operational days in a year and the daily fuel
consumption of CNG are also based on the information obtained from the Taxi
Zebra. Taxi Zebra is still now the only Taxi Company in Surabaya that operates taxis
equipped with CNG converters. Their CNG-fleet consists of 800 units. Based on
these assumptions, the total CNG consumption by taxis in Surabaya was 6,960 kilo-
liters gasoline-equivalent in 2000. The following table summarizes this calculation:
800 unitsAverage daily CNG consumption 29 Liter/dayNumber of operational days per year 300 days/yearYe a rly tota l fue l consum ption of Ta x is 6,960,000 Lite r ga soline -e quiva le nt
Total number of Tax is
The CNG consumption by other CNG vehicles can be calculated as the difference
between the CNG consumed by the Taxis and the total of 10,086,000 Liters gasoline-
equivalent CNG sold in Surabaya in 2000. This amounts to 3,126,000 Liters
gasoline-equivalent CNG. However, this number should be interpreted cautiously.
According to CNG supplier Pertamina, there are only less than 150 CNG vehicles
officially registered in Surabaya in 2000, that belong to the category "other CNG
vehicles". These are mainly private cars. Because of their small number (compared
to 800 CNG taxis) and their low traveled km, it is believed that their actual CNG
consumption is much less than the calculation result. In addition a lot of the CNG was
used for the industrial processes and/or was exported out of Surabaya, apart from
losses during loading/unloading for storage and other distribution activities.
(among modes), but inaccurate in term of their absolute values (or vice versa), even though they lead to the same/similar results (here, the total gasoline consumption).

GTZ SUTP, July 2001 CO2 Emission Reduction Potenttial of SUTP Measures
34
Calculating diesel consumption by city buses and other vehicles The total diesel consumption by city buses is also obtained from the operational data.
With their total number of 250 units (both the state operator Damri and private bus
companies), they consumed 6,500 kiloliters diesel in total in 2000, assuming that
they travel 65,000 km that year with a specific fuel consumption of 2,5 km/Liter. This
calculation is summarized in the following table:
Total number of buses (Damri and private) 250 unitsAverage Yearly km traveled by each bus 65,000 km/year
2.5 km/LiterYe a rly tota l Die se l consum ption 6,500,000 Lite rSpec ific fuel consumption
According to Pertamina, there were in sum 168,000 kiloliters diesel sold in Surabaya
in 2000. If the city buses consumed 6,500 kiloliters of diesel that year, then other
diesel vehicles consumed 161,500 kiloliters. To this category belong trucks, tractors
and other diesel utility vehicles etc. However, this high number is hard to verify since
many other diesel vehicles (especially trucks) are going across the city borders.
Similar to the other calculations, while interpreting the amount of diesel consumed by
other vehicle, it is likely that this number also includes amounts of diesel that went
lost through leakages, or that are not used by road vehicles in Surabaya (e.g.
production process by the small scale industries in Surabaya).
4.1.4 CALCULATING CO2 EMISSIONS BY VEHICLE TYPE FOR 2000 The CO2 emissions in the year 2000 were calculated directly by multiplying the fuel
consumption figures with the corresponding CO2 emission factors. The following
table shows the fuel consumption and the corresponding CO2 emissions,
distinguished by vehicle category based on their fuel type. The vehicle categories
include private car, motorcycle and public transport vehicles. The latter category
consists of minibus/angkots, taxis and city buses.

GTZ SUTP, July 2001 CO2 Emission Reduction Potenttial of SUTP Measures
35
2000 Fue l Consum ption CO2 Em issions [Lite rs] [kg]
Priva te ca rs (ga soline ) 192,387,405 448,262,654Priva te ca rs (die se l) 3,623,476 9,493,508M otorcycle s (ga soline ) 99,692,595 232,283,746Public tra nsport
Angkots (gsln) 46,080,000 107,366,400Angkots (CNG) 0 0
Ta x is (gsln) 21,840,000 50,887,200Ta x is (CNG) 6,960,000 13,084,800
Buse s (Die se l) 6,500,000 17,030,000Othe r Die se l Ve hicle s 157,876,524 413,636,492
Othe r CNG Ve hicle s 3,126,000 5,876,8801,297,921,680Tota l
In total, there were approximately 1,298 kilotons of CO2 emitted from the road
transport vehicle use in Surabaya in 2000. Private cars emitted the biggest share,
which accounted more than approx. 450 kilotons of CO2 (from gasoline and diesel
private cars). The second biggest share was from the vehicle category "Other Diesel
Vehicles" (this however, to be interpreted with special caution - s. note above),
followed by motorcycles with more than approx. 230 kilotons of CO2 emissions.
At a first sight, these numbers suggest that CO2 emission reduction measures should
be aiming at private cars, motorcycles and trucks, rather than minibus/angkots, taxis
and buses, which are public transport vehicles (that because of many other reasons
should be encouraged anyway). Although technical CO2 reduction measures aiming
at angkots, taxis and buses are relatively easier and faster to implement successfully,
their reduction effects however can be easily wiped out by unfavorable modal split
changes towards more use of private motorized vehicles (cars and motorcycles).
Therefore, although measures aiming at modal shifts toward more public transport
use are harder to implement, they should remain one of the main objectives to be
considered in the city's long-term transport development programs.
4.1.5 FUEL CONSUMPTION AND CO2 EMISSIONS PROJECTION FOR 2010 The projection of CO2 emissions for 2010 will be calculated from the projected fuel
consumption, which is again, calculated from the projected traffic volume for 2010. In
the calculation, it is assumed that the energy content and the composition of the fuels
in 2010 will be the same as those in 1995, so that the same conversion factors can
be used. Further, it is also assumed, that the average trip length of each vehicle type
will stay the same as they were in 1995, so that the traffic increase projected for 2010

GTZ SUTP, July 2001 CO2 Emission Reduction Potenttial of SUTP Measures
36
will solely be caused by the increase of vehicle trips, and not by the length of each
trip. Furthermore it is assumed, that the specific fuel consumption of the vehicles will
also be constant, because the impact of the technological improvement in regard of
fuel efficiency is weighed as insignificant. This is seen as realistic if one considers the
extremely high share of older fleet vehicles, as it is common in developing countries.
Under these assumptions, it then can be concluded that the fuel consumption will rise
proportionally with the increase of traffic volume, until the city's road network capacity
is reached. According to the SITNP traffic forecasts however, the maximum capacity
of many parts in the city's road network will be reached and overloaded, so that
congestions will occur which would lead to higher fuel consumptions. (Several major
road links in Surabaya are already overloaded.) This effect will also be considered in
the calculations.
Since the available citywide trips data was only the trips data from the surveys
conducted by SITNP in 1995, this will be used as the basis for the following
calculations.
(n) The traffic growth for 2010
Forecasts for the traffic growth 2010 have been made by SITNP in 1998 with
revisions considering the impacts of the ongoing economic crisis. As mentioned
previously, according to the "average scenario", trips by car, motorcycle and public
transport will grow by 29.5%, 27.3% and 26.6% respectively over 15 years from 1995
to 2010 (see SITNP Study II Report C2, 1998).
(o) Calculating the fuel consumption and the associated CO2 emissions
The increase of number of trips results, under the assumptions mentioned above, to
a proportional increase of traveled kilometers, which translates to a proportional
increase in fuel consumption in 2010. Additional fuel consumption due to congestion
effects has to be considered. According to the SITNP forecasts, the extent of heavily
loaded and overloaded road links can be seen to rise by 2010. The distribution of
these congestion effects are summarized in the following table:

GTZ SUTP, July 2001 CO2 Emission Reduction Potenttial of SUTP Measures
37
SpeedRange PCU PCU(kph) Hours (% ) Hours (% )0 - 10 375 2 4,117 8
10 - 15 216 1 2,717 515 - 20 1,066 6 5,457 1020 - 25 3,168 17 9,100 1725 - 30 3,529 19 10,335 2030 - 35 3,223 17 6,138 1235 - 40 3,303 18 5,150 1040 - 50 1,930 10 2,885 550 - 60 503 3 2,522 5
> 60 1,368 7 4,544 8Tota ls 18,681 100 52,964 100
1995 S ITNP I 2010 Average
Source: SITNP Study Report C2, 1998 The distribution of PCU hours (Private Car Units hours) by speed range has to be
translated to changes in the specific fuel consumption. In reality, fuel consumption
doesn't only depend on the average speed, but also on other factors such as driving
cycles and vehicle type. For the purpose of the calculations in this report however,
this is conducted by using simplified relationship between average speed and
specific fuel consumption. The following diagram shows this empirical relationship.
Diagram: Empirical relationship between average speed and fuel consumption
Source: Merkblatt ueber Luftverunreinigungen an Strassen, Forschungsgesellschaft fuer Strasenverkehr, Bonn 1992 Because the effects of congestion on fuel consumption increases are different for
every speed category (depending on changes in their share of PCU hours [%]), the
calculation has to be done for each category separately, whereas the specific fuel

GTZ SUTP, July 2001 CO2 Emission Reduction Potenttial of SUTP Measures
38
consumption is weighed with their percentage share for each speed category for
1995 and 2010 (see columns 3 and 4 in the following table). Their changes in 2010
are calculated in the last column. The congestion factor (which represents the fuel
consumption increase due to congestion effects) is then calculated by adding up all
of these 1995-2010 changes, and comparing the total sum to the 1995 value. This
leads to a congestion factor of approximately 15% (rounded up from 14,47), as
shown in the following table:
Average Spec ific fuel W eighed speed Consum ption Changes[km /h] [L/100km ] 1995 2010 1995-2010
5 27.50 55.00 220.00 165.0012.5 14.00 14.00 70.00 56.0017.5 12.50 75.00 125.00 50.0022.5 11.25 191.25 191.25 0.0027.5 9.70 184.30 194.00 9.7032.5 9.40 159.80 112.80 -47.0037.5 9.00 162.00 90.00 -72.0042.5 8.00 80.00 40.00 -40.0055.0 7.50 22.50 37.50 15.0065.0 6.50 45.50 52.00 6.50
989.35 1132.55 143.2014.47%Conge stion fa ctor
Tota l
W eighed spec ific fuel consum ptions [% .L/100km ]
The following table shows the projected fuel consumption and the associated CO2
emissions by vehicle type (congestion effect is considered):
2010 Fue l Consum ption CO2 Em issions [Lite rs] [kg]
Priva te ca rs (ga soline ) 285,202,831 664,522,596Priva te ca rs (die se l) 5,371,587 14,073,558M otorcycle s (ga soline ) 145,277,624 338,496,865Public tra nsport
Angkots (gsln) 56,959,113 132,714,734Angkots (CNG) 0 0
Ta x is (gsln) 31,651,461 73,747,905Ta x is (CNG) 10,086,729 18,963,051
Buse s (Die se l) 8,826,300 23,124,907Othe r Die se l Ve hicle s 228,801,405 599,459,681
Othe r CNG Ve hicle s 4,530,333 8,517,0261,873,620,323Tota l
According to the calculations performed above, private cars will lead in term of fuel
consumption and the associated CO2 emissions compared to the other vehicle
categories, followed by "Other Diesel Vehicles" and motorcycles. The total calculated
CO2 emissions in 2010 would be approx. 1,874 kilotons.
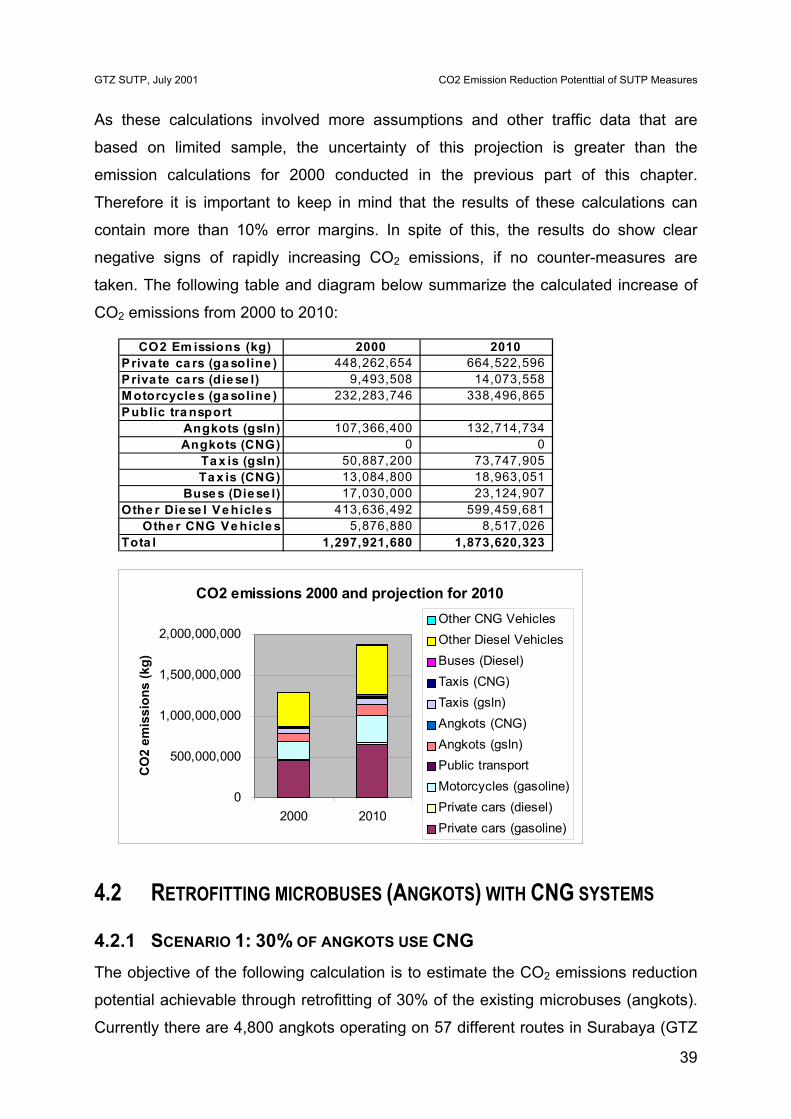
GTZ SUTP, July 2001 CO2 Emission Reduction Potenttial of SUTP Measures
39
As these calculations involved more assumptions and other traffic data that are
based on limited sample, the uncertainty of this projection is greater than the
emission calculations for 2000 conducted in the previous part of this chapter.
Therefore it is important to keep in mind that the results of these calculations can
contain more than 10% error margins. In spite of this, the results do show clear
negative signs of rapidly increasing CO2 emissions, if no counter-measures are
taken. The following table and diagram below summarize the calculated increase of
CO2 emissions from 2000 to 2010:
CO2 Em issions (kg) 2000 2010Priva te ca rs (ga soline ) 448,262,654 664,522,596Priva te ca rs (die se l) 9,493,508 14,073,558M otorcycle s (ga soline ) 232,283,746 338,496,865Public tra nsport
Angkots (gsln) 107,366,400 132,714,734Angkots (CNG) 0 0
Ta x is (gsln) 50,887,200 73,747,905Ta x is (CNG) 13,084,800 18,963,051
Buse s (Die se l) 17,030,000 23,124,907Othe r Die se l Ve hicle s 413,636,492 599,459,681
Othe r CNG Ve hicle s 5,876,880 8,517,026Tota l 1,297,921,680 1,873,620,323
CO2 emissions 2000 and projection for 2010
0
500,000,000
1,000,000,000
1,500,000,000
2,000,000,000
2000 2010
CO
2 em
issi
ons
(kg)
Other CNG VehiclesOther Diesel VehiclesBuses (Diesel)Taxis (CNG)Taxis (gsln)Angkots (CNG)Angkots (gsln)Public transportMotorcycles (gasoline)Private cars (diesel)Private cars (gasoline)
4.2 RETROFITTING MICROBUSES (ANGKOTS) WITH CNG SYSTEMS
4.2.1 SCENARIO 1: 30% OF ANGKOTS USE CNG The objective of the following calculation is to estimate the CO2 emissions reduction
potential achievable through retrofitting of 30% of the existing microbuses (angkots).
Currently there are 4,800 angkots operating on 57 different routes in Surabaya (GTZ

GTZ SUTP, July 2001 CO2 Emission Reduction Potenttial of SUTP Measures
40
- ITS/Atok 2000), all of which still using gasoline fuel. The total gasoline consumed in
2000 by these angkots is estimated from the operational data. Since there was no
data on the number of angkots by route, the length of routes and the average daily
trip lengths available to do accurate calculations, estimations have to be used for the
operational data. These estimations were based on reliable sources including
interviews with angkot owners, angkot drivers and the associations of angkot owners
in 1999 and 2001.
It is estimated that the average daily fuel consumption of angkot is 30 liters of
gasoline in average, and that the angkots were operating for 320 days out of 365
days in the year 2000. The following table shows the total gasoline consumption and
the associated CO2 emissions of angkots in 2000, based on the estimations used.
Total number of angkots 4,800 UnitsAverage daily gasoline consumption 30 Liters/dayNumber of operational days per year 320 days/yearTotal gasoline consumption of Angkots in 2000 46,080,000 LitersCO2 emissions from Angkots in 2000 107,366,400 kg
If 30% of these angkots used CNG instead of gasoline, the total CO2 emissions
would decrease from 107,366 tons by 6,220 tons, to 101,145 tons, which represents
a reduction of around 6%. These results were reached by assuming that the angkots
have the same number of operating days and the same amount of specific fuel
consumption (in terms of liter gasoline-equivalent) before and after the retrofit. This
reduction of CO2 emissions is caused by the fact that the same energy amount of
CNG would only emit 20% less CO2 of the same energy amount of gasoline if burned
through combustion process, as shown by the conversion factors. The following
tables show the calculation of fuel consumption and the associated CO2 emissions
for the scenario that 70% using gasoline and 30% using CNG:
Gasoline consumption by 70% of AngkotsTotal number of angkots 3,360 UnitsAverage daily gasoline consumption 30 Liters/dayNumber of operational days per year 320 days/yearTotal gasoline consumption of Angkots 32,256,000 LitersCO2 emissions from Angkots 75,156,480 kg
CNG consumption by 30% of Angkots w ith CNG systemsTotal number of angkots 1,440 UnitsAverage daily gasoline consumption 30 Liters/dayNumber of operational days per year 320 days/yearTotal CNG consumption of Angkots 13,824,000 Liters gasoline-eq. at 200 barCO2 emissions from CNG Angkots 25,989,120 kg

GTZ SUTP, July 2001 CO2 Emission Reduction Potenttial of SUTP Measures
41
4.2.2 SCENARIO 2: 50% OF ANGKOTS USE CNG The calculation for the scenario 2, assuming that 50% of the angkots are using CNG,
is based on the same methodology and the same assumptions as the scenario 1
performed above. The results of the calculations show that the total CO2 emissions
could be reduced by around 10% from 107,366 tons to 96,998 tons, as summarized
in the following tables:
Gasoline consumption by 50% of AngkotsTotal number of angkots 2,400 UnitsAverage daily gasoline consumption 30 Liters/dayNumber of operational days per year 320 days/yearTotal gasoline consumption of Angkots 23,040,000 LitersCO2 emissions from Angkots 53,683,200 kg
CNG consumption by 50% of Angkots w ith CNG systemsTotal number of angkots 2,400 UnitsAverage daily gasoline consumption 30 Liters/dayNumber of operational days per year 320 days/yearTotal CNG consumption of Angkots 23,040,000 Liters gasoline-eq. at 200 barCO2 emissions from CNG Angkots 43,315,200 kg
4.3 RETROFIT FROM 25% TO 50% OF TAXIS WITH CNG-SYSTEMS The objective of the following calculation is to estimate the CO2 emissions reduction
potential achievable by increasing the share of CNG taxis to 50%. According to the
Statistical Year Book Surabaya 2000, there were in 1999 2,750 taxis operating in the
city. According to Taxi Zebra, there are currently 800 operating taxis in Surabaya that
are equipped with CNG converters. The Taxi Company Taxi Zebra owns all these
taxis. The rest of the taxis (1,950 taxis) are currently using gasoline.
The total gasoline and CNG consumed in 2000 by these taxis is estimated from the
operational data. Since there was no detail record of daily fuel consumption and the
daily traveled km available, estimations based on interviews with reliable sources are
used to calculate on average daily fuel consumption and the number of operating
days are used for the calculations of the taxis' fuel consumption in 2000. The
estimations on the average daily fuel consumption and number of operating days by
gasoline and CNG taxis are obtained from the taxi company Taxi Zebra, verified with
direct interviews with the taxi drivers of various operators. The following table shows

GTZ SUTP, July 2001 CO2 Emission Reduction Potenttial of SUTP Measures
42
the calculated total fuel consumption and the associated CO2 emissions of taxis in
2000, based on the estimations used:
Gasoline consumption by tax is 2000Number of gasoline taxis 1,950 UnitsAssumption: Average daily fuel consumption 35 Liters/dayAssumption: Number of operational days per year 320 days/yearYearly tota l fue l consumption of Taxis 21,840,000 LitersCO2 emissions from gasoline Taxis 50,887,200 kg
CNG consumption by tax is (Taxi Zebra fleet)Number of CNG Taxis 800 UnitsAverage daily CNG consumption 35 Liters/dayAssumption: Number of operational days per year 320 days/yearYearly tota l fue l consumption of Taxis 8,960,000 Liters gasoline-equivalent at 200 barCO2 emissions from CNG Taxis 16,844,800 kg
Assuming the same operating conditions (the same average daily fuel consumption
and the same number of operating days), the amount of CO2 emissions would
decrease by around 4% (or by 2,898 tons) from 67,732 tons to 64,834 tons, if the
number of taxis using CNG is increased from around 25% to 50%. The following
tables show the calculations of the total fuel consumed and the associated CO2
emissions for both gasoline and CNG taxis, after the number of CNG taxis is
increased to 50% through retrofit measure.
Gasoline consumption by TaxisAssumption: Number of gasoline taxis 1,375 UnitsAssumption: Average daily fuel consumption 35 Liters/dayAssumption: Number of operational days per year 320 days/yearYearly tota l fue l consumption of Taxis 15,400,000 Lite rsCO2 emissions from gasoline Taxis 35,882,000 kg
CNG consumption by tax is (Taxi Zebra fleet and additiona l CNG tax is)Assumption: Number of CNG Taxis 1,375 UnitsAssumption: Average daily CNG consumption 35 Liters/dayAssumption: Number of operational days per year 320 days/yearYearly tota l fue l consumption of Taxis 15,400,000 Liters gasoline-equivalent at 200 barCO2 emissions from CNG Taxis 28,952,000 kg
4.4 IMPROVEMENT OF PUBLIC TRANSPORT SYSTEM An improved public transportation system will have a better image, and be faster,
more reliable, comfortable, and secure, thus becoming more attractive, so that more
trips will be conducted by bus and a smaller proportion of trips will be made with
individual motorized vehicles. The CO2 emissions reduction potential achievable
through successful improvements of the city bus system in Surabaya will be reached

GTZ SUTP, July 2001 CO2 Emission Reduction Potenttial of SUTP Measures
43
through a change in modal split, which will be reflected by a modal shift from
motorized trips on individual vehicles in favor of public transport.
(a) Modal split
The change in modal split will also have a positive effect on the fuel consumption
pattern of the entire motorized fleet in the city, and thus also positive impacts in terms
of CO2 emissions. Therefore, the amount of CO2 emissions estimated here is derived
from the modal-split changes considering both increased fuel consumption by bus
(caused by more bus trips), and decreased fuel consumption by motorized individual
traffic (car and motorcycle).
As forecast by SITNP, the modal split for 2010 in the average scenario is as follows:
Car Motorcycle Public Transport Tota lSHARE IN % 19.6% 46.1% 34.3% 100%Source: SITNP Study Report C2, 1998 According to the GTZ staff, bus improvement measures could increase the share of
public transport to 40% in 2010, instead of 34.3% as forecast by SITNP.
Furthermore, it is assumed that the modal shift wouldn't cause a change in the total
number of trips of 2010, and that the modal shift in favor of public transport is caused
by the same number of people who otherwise would go by car or motorcycle. This
means that the modal shares of car and motorcycle decrease by the same factor,
namely by 2.85% each, leading to a modal distribution of trips as shown in the
following table:
Ca r Motorcycle Public Tra nsport Tota lSHARE IN % 16.8% 43.3% 40.0% 100%
This modal split change leads to a relative reduction of car trips and motorcycle trips
by 12.9% and 6.7%, respectively, as shown in the following table. These reduction
factors will be needed later for the calculation of the total gasoline consumption of car
and motorcycle.
Be fore (2010) Afte r (2010) Re duction (trips/da y)
Re la tive re duction (in %)
Trips by cars 392,278 335,238 57,040 - 12.9%Trips by Motorcyc les 922,654 865,614 57,040 - 6.7%

GTZ SUTP, July 2001 CO2 Emission Reduction Potenttial of SUTP Measures
44
(b) Calculating gasoline consumption by angkot
It is expected that a part of the additional public transport passengers would use
angkots, which is for the calculation here assumed to be 30% of the total additional
ridership, as estimated by GTZ staff. The other 70% additional passengers would
take bus.
According to the SITNP projections (Study Report C2 1998), the total number of
public transport passengers would increase to 688,098 passengers per day if the
share of public transport in the modal split were maintained at 34.3%. This means
that the total number of public transport passenger would increase to approximately
800,600 passengers if the share of public transport in the modal split increases to
40.0%. In other words, there are 112,700 additional passengers are expected if the
modal share of public transport is increased from 34.3% to 40.0%. And if 30% of this
additional ridership goes by angkots, the total angkot capacity should be increased to
accommodate additional 33,800 passengers. According to the same SITNP report, in
1995, there were around 4,500 angkots serving 151,684 passengers per day. This
means, the total number of angkots has to be increased to around 5,870 to maintain
the same capacity-related level of service. Higher number of angkots increases their
total gasoline consumption. Assuming the same operational characteristics (average
daily fuel consumption and number of operational day per year), the total gasoline
consumption of angkots in 2010 would increase to 56,400 kiloliters, as shown in the
following table:
5,870 unitsAverage daily fuel consumption 30 Liter/dayNum ber of operational days per year 320 days/yearYe a rly tota l fue l consum ption of a ngkots 56,354,160 Lite r
Total num ber of angkots 2010
(c) Calculating the total traveled kilometers
The next step is to calculate the traveled vehicle kilometers. It is assumed that the
length of the trips previously conducted by motorized vehicles, and are now by bus,
stays the same. Obviously, this is in reality not the case, since bus systems are
always associated with fixed routes that don't always represent direct origin-
destination links for the passengers, and thus are more likely to cause longer trips

GTZ SUTP, July 2001 CO2 Emission Reduction Potenttial of SUTP Measures
45
than would be conducted by individual vehicle.5 However, taking these effects into
account in the calculation would necessitate at least a sophisticated multi-modal
traffic model that includes the modeling of the public transport supply side and based
on a highly disaggregated origin-destination matrix. Such a traffic model is not
available in Surabaya.
The calculation of the total traveled kilometers and the total fuel consumption, which
is derived on the traffic data, is based on the same methodology as previously
performed for the BAU scenario in the calculation of traveled kilometers for 2000 in
subchapter 4.1.3 of this report. Using the new modal split reached by bus
improvements, and the same input data provided in the SITNP reports for the share
of trips (by purpose) and the average trip length (by transport mode and trip
purpose), the total traveled kilometers by car and motorcycle in 2010 after the bus
improvement would grow as shown in the following table:
2010 Car MotorcycleTrave led km 1,500,208,755 2,572,075,009
(d) Calculating fuel consumption by car and motorcycle
The next step is to calculate the total gasoline and diesel consumption by car as well
as gasoline consumption by motorcycle from the total traveled km calculated above.
Again here it is assumed, that the specific fuel consumption of the vehicles will also
be constant, because the impact of the technological improvement in regard of fuel
efficiency is weighed as insignificant (which is seen to be realistic considering the
high share of older fleet vehicles, as it is common in developing countries). According
to this calculation, the gasoline consumption of car, the diesel consumption of car
and the gasoline consumption of motorcycle amount to approximately 184,775
kiloliters, 3,750 kiloliters and 103,000 kiloliters, respectively (see the following table).
2010 Car (gasoline ) Car (diese l) Motorcycle (gsln)Fuel consumption [L] 183,775,573 3,750,522 102,883,000
It is not expected that the fuel consumption of taxis and other diesel vehicles would
be affected by the modal shifts caused by the public transport improvement
measures. They would, however, benefit from less congestion effects which will be
5 On the other hand, greater reliance on public transport is also associated with greater use of non-motorized
modes such as walking and cycling.
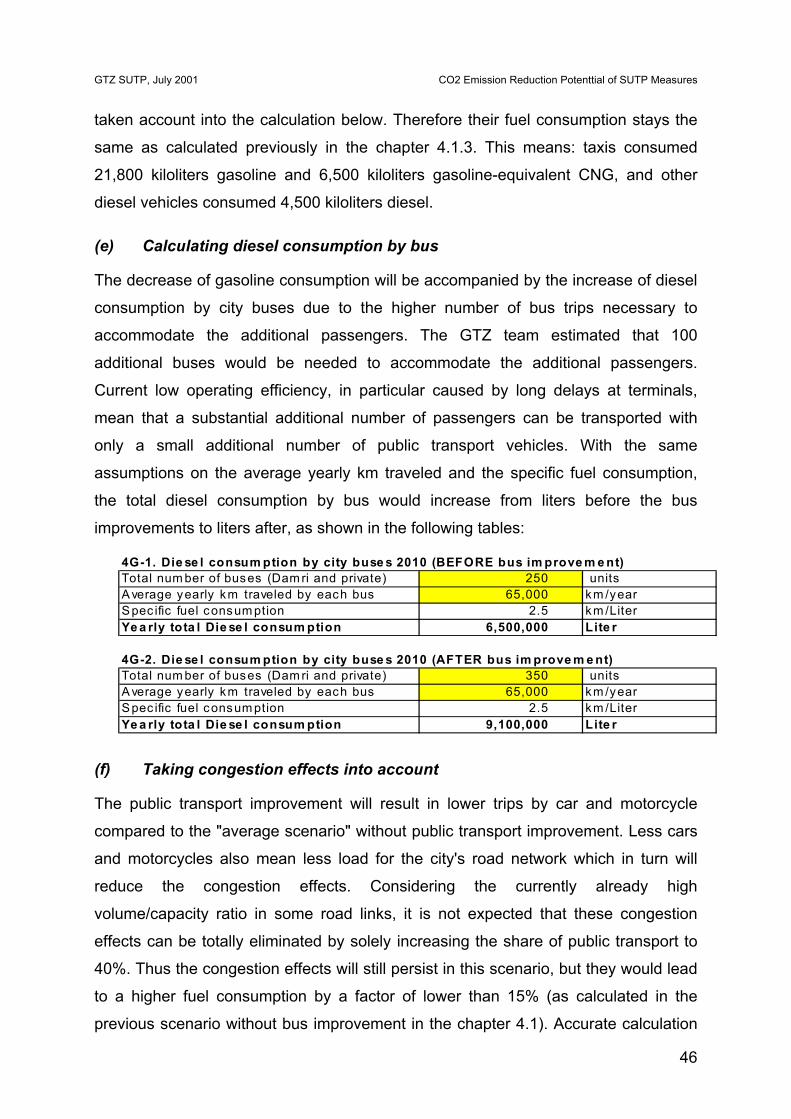
GTZ SUTP, July 2001 CO2 Emission Reduction Potenttial of SUTP Measures
46
taken account into the calculation below. Therefore their fuel consumption stays the
same as calculated previously in the chapter 4.1.3. This means: taxis consumed
21,800 kiloliters gasoline and 6,500 kiloliters gasoline-equivalent CNG, and other
diesel vehicles consumed 4,500 kiloliters diesel.
(e) Calculating diesel consumption by bus
The decrease of gasoline consumption will be accompanied by the increase of diesel
consumption by city buses due to the higher number of bus trips necessary to
accommodate the additional passengers. The GTZ team estimated that 100
additional buses would be needed to accommodate the additional passengers.
Current low operating efficiency, in particular caused by long delays at terminals,
mean that a substantial additional number of passengers can be transported with
only a small additional number of public transport vehicles. With the same
assumptions on the average yearly km traveled and the specific fuel consumption,
the total diesel consumption by bus would increase from liters before the bus
improvements to liters after, as shown in the following tables:
4G-1. Die se l consum ption by city buse s 2010 (BEFORE bus im prove m e nt)Total num ber of buses (Dam ri and private) 250 unitsA verage yearly km traveled by each bus 65,000 km /year
2.5 km /LiterYe a rly tota l Die se l consum ption 6,500,000 Lite r
4G-2. Die se l consum ption by city buse s 2010 (AFTER bus im prove m e nt)Total num ber of buses (Dam ri and private) 350 unitsA verage yearly km traveled by each bus 65,000 km /year
2.5 km /LiterYe a rly tota l Die se l consum ption 9,100,000 Lite r
S pec ific fuel consum ption
S pec ific fuel consum ption
(f) Taking congestion effects into account
The public transport improvement will result in lower trips by car and motorcycle
compared to the "average scenario" without public transport improvement. Less cars
and motorcycles also mean less load for the city's road network which in turn will
reduce the congestion effects. Considering the currently already high
volume/capacity ratio in some road links, it is not expected that these congestion
effects can be totally eliminated by solely increasing the share of public transport to
40%. Thus the congestion effects will still persist in this scenario, but they would lead
to a higher fuel consumption by a factor of lower than 15% (as calculated in the
previous scenario without bus improvement in the chapter 4.1). Accurate calculation
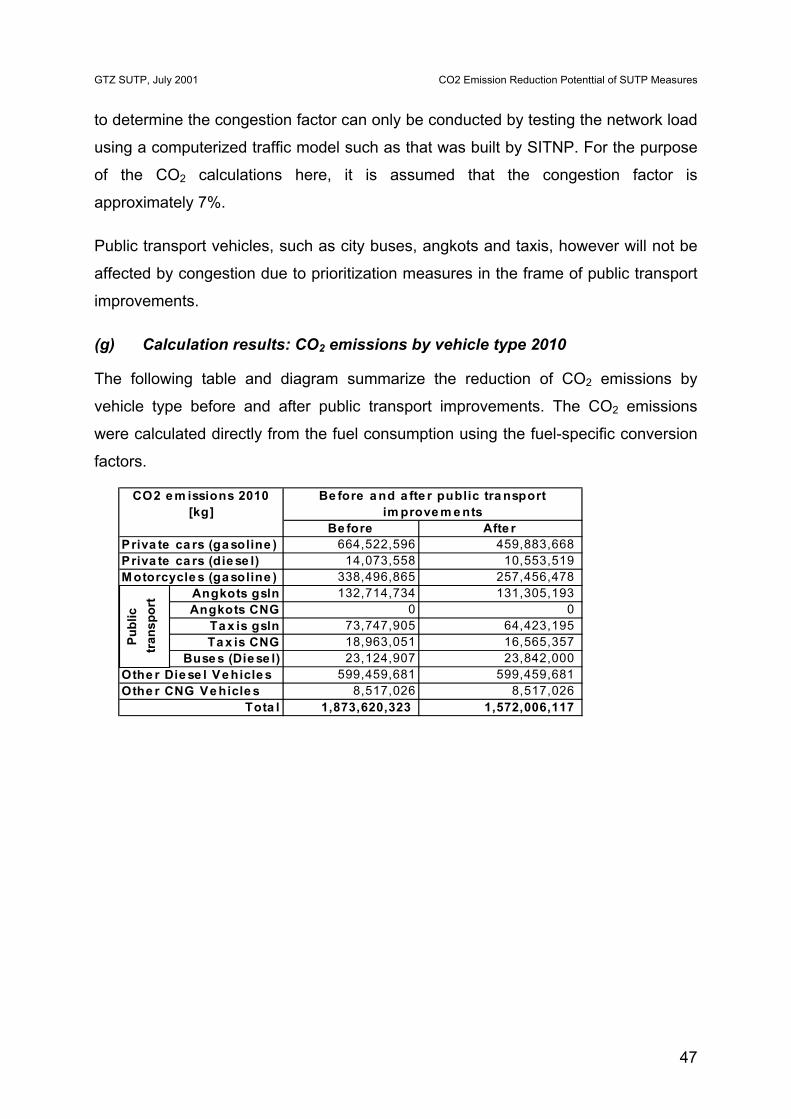
GTZ SUTP, July 2001 CO2 Emission Reduction Potenttial of SUTP Measures
47
to determine the congestion factor can only be conducted by testing the network load
using a computerized traffic model such as that was built by SITNP. For the purpose
of the CO2 calculations here, it is assumed that the congestion factor is
approximately 7%.
Public transport vehicles, such as city buses, angkots and taxis, however will not be
affected by congestion due to prioritization measures in the frame of public transport
improvements.
(g) Calculation results: CO2 emissions by vehicle type 2010
The following table and diagram summarize the reduction of CO2 emissions by
vehicle type before and after public transport improvements. The CO2 emissions
were calculated directly from the fuel consumption using the fuel-specific conversion
factors.
CO2 e m issions 2010 [kg]
Be fore Afte rPriva te ca rs (ga soline ) 664,522,596 459,883,668Priva te ca rs (die se l) 14,073,558 10,553,519M otorcycle s (ga soline ) 338,496,865 257,456,478
Angkots gsln 132,714,734 131,305,193Angkots CNG 0 0
Ta x is gsln 73,747,905 64,423,195Ta x is CNG 18,963,051 16,565,357
Buse s (Die se l) 23,124,907 23,842,000Othe r Die se l Ve hicle s 599,459,681 599,459,681Othe r CNG Ve hicle s 8,517,026 8,517,026
Tota l 1,873,620,323 1,572,006,117
Be fore a nd a fte r public tra nsport im prove m e nts
Publ
ic
tran
spor
t

GTZ SUTP, July 2001 CO2 Emission Reduction Potenttial of SUTP Measures
48
CO2 emissions (kg) from the road transportation sector in Surabaya 2010 before and after public transport
improvements
0
200,000,000400,000,000
600,000,000800,000,000
1,000,000,000
1,200,000,0001,400,000,000
1,600,000,0001,800,000,000
2,000,000,000
Before After
Other CNG Vehicles
Other Diesel Vehicles
Buses (Diesel)
Taxis CNG
Taxis gsln
Angkots CNG
Angkots gsln
Motorcycles (gasoline)
Private cars (diesel)
Private cars (gasoline)
The table shows that the increase of CO2 emissions due to more public transport
trips are more than offset by the decrease in the CO2 emissions due to relatively
fewer trips on cars and motorcycles. The calculated reduction of CO2 emissions
amounts to 272 kilotons, around 14% less than before the public transport
improvements, which is considered as a significant reduction potential.
4.5 TRANSPORT DEMAND MANAGEMENT (TDM) Transport demand management (TDM) measures are needed in Surabaya to avert
intolerable future congestion conditions. These measures aim to reduce congestion
in congested areas at congested times, primarily by encouraging shifts from private
cars to more efficient modes such as walking, cycling, and public transport. Demand
management measures for short-term application in Surabaya currently being
developed include an “odd/even” scheme based on number plates, which is to be
applied in Jl. Achmad Yani. Mid term solutions under serious consideration include
using parking policy to restrict demand for private vehicle use, and applying an area-
licensing scheme. An area-licensing scheme is the only measure which can have a
large impact on the modal split; but since the development of such a scheme is still at
a very early stage, the following calculations are based on the projected
implementation of more modest TDM measures, including the odd/even scheme and
tighter parking policy.

GTZ SUTP, July 2001 CO2 Emission Reduction Potenttial of SUTP Measures
49
In general, the reduction impacts of TDM on the CO2 emissions are estimated with
the same methodology as the impacts of the other measures that have effects on
modal split changes. This is preformed by deriving the reduction of fuel consumption
from the modal split and other traffic data, and converting it to CO2 emissions.
As forecast by SITNP, the modal split for 2010 in the average scenario is as follows:
Car Motorcycle Public Transport Tota lSHARE IN % 19.6% 46.1% 34.3% 100%Source: SITNP Study Report C2, 1998
It is expected that the share of public transport in the modal split would increase after
successful implementation of transport demand management measures. The
increase of public transport share in the modal split varies depending on the intensity
of the traffic restraint effects of the measures. In the following calculations, the CO2
emissions are calculated using the share of public transport in the modal split of 40%,
45% or even 50% depending on whether medium, heavy or extreme traffic restraint
is applied, as shown in the following tables. The calculation results are later
compared to the BAU scenario, which has the share of public transport in the modal
split of 35%.
Public Transport (Bus) Private cars/motorbikes Traffic restraint40% 60% Medium45% 55% Heavy50% 50% Extreme
In the following calculations, the impacts of the TDM measure on CO2 emissions are
estimated for the three scenarios.
(a) Modal splits
As previously mentioned, In the medium, heavy and extreme traffic-restraint
scenarios, the share of public transport would increase to 40%, 45% and 50% in
2010. Furthermore, it is assumed that the modal shift wouldn't cause a change in the
total number of trips of 2010, and that the modal shift in favor of public transport is
caused by the same number of people who otherwise would go by car or motorcycle.
This means that the modal shares of car and motorcycle decrease by the same
factor, namely by approximately 3%, 5% and 8% each, respectively, leading to a
modal distribution of trips as shown in the following table:

GTZ SUTP, July 2001 CO2 Emission Reduction Potenttial of SUTP Measures
50
TDM Sce na rios Ca r M otorcycle Public Tra nsport Tota lM edium trffic res traint 16.8% 43.3% 40.0% 100%Heavy traffic res traint 14.3% 40.8% 45.0% 100%Heavy traffic res traint 11.8% 38.3% 50.0% 100%
This modal split change leads to a relative reduction of car trips and motorcycle trips
by approx. 12% and 7%, respectively, for the medium traffic-restraint scenario as
shown in the following table. The corresponding relative reductions of car trips and
motorcycle trips for the heavy and extreme traffic-restraint scenarios are set out in
the last column in the following tables. These reduction factors will be needed later
for the calculation of the total gasoline consumption of car and motorcycle.
TDM w ith m e dium tra ffic re stra int Be fore (2010) Afte r (2010) Re duction
(trips/da y) Re la tive re duction
(in %)Trips by cars 392,278 335,238 57,040 - 12.9%Trips by M otorcyc les 922,654 865,614 57,040 - 6.7%
TDM w ith he a vy tra ffic re stra int Be fore (2010) Afte r (2010) Re duction
(trips/da y) Re la tive re duction
(in %)Trips by cars 392,278 285,202 107,076 - 24.2%Trips by M otorcyc les 922,654 815,578 107,076 - 12.5%
TDM w ith e x tre m e tra ffic re stra int Be fore (2010) Afte r (2010) Re duction
(trips/da y) Re la tive re duction
(in %)Trips by cars 392,278 235,167 157,111 - 35.5%Trips by M otorcyc les 922,654 765,543 157,111 - 18.4% (b) Calculating the total traveled kilometers by car and motorcycle
The next step is to calculate the total traveled kilometers. The calculation of the total
traveled kilometers and the total fuel consumption, which is derived on the traffic
data, is based on the same methodology as previously performed for the BAU
scenario in the calculation of traveled kilometers for 2000 and 2010 in subchapter
4.1.3 of this report. Using the new modal splits reached by public transport
improvements, and the same input data provided in the SITPN reports for the share
of trips (by purpose) and the average trip length (by transport mode and trip
purpose), the total traveled kilometers by car and motorcycle in 2010 after the bus
improvement would grow as shown in the following table:
Tra ve le d km 2010 Ca r MotorcycleMedium traffic restraint 1,500,208,755 2,572,075,009Heavy traffic restraint 1,305,670,576 2,410,505,719Extreme traffic res traint 1,111,132,397 2,248,936,430 Assuming that 2% of cars use diesel (as previously discussed in the BAU scenario), the total traveled km can be split as follows:

GTZ SUTP, July 2001 CO2 Emission Reduction Potenttial of SUTP Measures
51
Tra ve le d km 2010 Ca r (Ga soline ) Ca r (Die se l) MotorcycleMedium traffic res traint 1,470,204,580 30,004,175 2,572,075,009Heavy traffic res traint 1,279,557,164 26,113,412 2,410,505,719Extreme traffic res traint 1,088,909,749 22,222,648 2,248,936,430 (c) Calculating gasoline consumption by car and motorcycle
The next step is to calculate the total gasoline and diesel consumption by car and the
total gasoline consumption by motorcycle from the total traveled km calculated
above. Again here it is assumed, that the specific fuel consumption of the vehicles
will also be constant, because the impact of the technological improvement in regard
of fuel efficiency is weighed as insignificant. According to this calculation, the
gasoline consumption of car, the diesel consumption of car and the gasoline
consumption of motorcycle in the medium traffic-restraint scenario amounts to
183,776 kiloliters gasoline, 3,750 kiloliters and 103 kiloliters, respectively (see the
following table). The fuel consumption of car and motorcycle for the other scenarios
is also shown in the following table:
Fue l consum ption 2010 (in Lite rs)
Ca r (Ga soline )
Ca r (Die se l)
M otorcycle (Ga soline )
M edium traffic res traint 183,775,573 3,750,522 102,883,000Heavy traffic res traint 159,944,646 3,264,176 96,420,229Extrem e traffic res traint 136,113,719 2,777,831 89,957,457 It is not expected that the fuel consumption of taxis and other diesel vehicles would
be affected by the modal shifts caused by the public transport improvement
measures, though they would benefit from less congestion effects which will be taken
account into the calculation below. Their fuel consumption stays the same as
calculated previously in the chapter 4.1.3. This means: taxis consumed 21,840
kiloliters gasoline and 6,960 kiloliters gasoline-equivalent CNG, and other diesel
vehicles consumed 3,126 kiloliters diesel.
(d) Calculating diesel consumption by bus
As a part of the "push-pull" concept, it is necessary to complement TDM measures
with other measures improving the public transport system. The decrease of gasoline
consumption will therefore be accompanied by the increase of diesel consumption by
city buses due to the higher number of bus trips necessary to accommodate the
additional passengers. In the public transport improvement measures, the GTZ team
estimated that 100 new buses would be needed to accommodate the additional

GTZ SUTP, July 2001 CO2 Emission Reduction Potenttial of SUTP Measures
52
passengers as a result of the modal share increase from 34.3% by 5.7% to 40.0%.
This means, 17.5 new buses will be needed to increase the public transport share by
1%. In the heavy traffic-restraint scenario, the public transport share would increase
from 34.3% by 10.7% to 45%, which means that 189 additional buses would be
needed. The total number of buses for the heavy traffic-restraint scenario would be
439 units. Similar calculations for the extreme traffic-restraint scenario would result in
a total number of 527 buses.
With the same assumptions on the average yearly km traveled and the specific fuel
consumption, the total diesel consumption by bus would increase from 6,500 kiloliters
before the TDM to 9,100 kiloliters, 11,414 kiloliters or 13,702 kiloliters after TDM with
medium, heavy or extreme traffic-restraint measures, as shown in the following
tables:
4F. CNG consum ption by Ta x is 2000 (Ta x i Ze bra , Be fore & a fte r: no cha nge )Total num ber of CNG Tax is 700 unitsAverage daily CNG consum ption 29 Liter/dayNum ber of operational days per year 320 days/yearYe a rly tota l fue l consum ption of Ta x is 6,496,000 Lite r-e quiva le nt
4G-1. Diesel consum ption by c ity buses 2000 (BEFORE TDM )Total num ber of buses (Dam ri and private) 250 unitsAverage yearly km traveled by each bus 65,000 km /year
2.5 km /LiterYe a rly tota l Die se l consum ption 6,500,000 Lite r
4G-2. Diesel consum ption by c ity buses 2010 (AFTER TDM with m e dium traffic res traint)Total num ber of buses (Dam ri and private) 350 unitsAverage yearly km traveled by each bus 65,000 km /year
2.5 km /LiterYe a rly tota l Die se l consum ption 9,100,000 Lite r
4G-3. Diesel consum ption by c ity buses 2010 (AFTER TDM with he a vy traffic res traint)Total num ber of buses (Dam ri and private) 439 unitsAverage yearly km traveled by each bus 65,000 km /year
Spec ific fuel consum ption
Spec ific fuel consum ption
(e) Calculating gasoline consumption by angkot
As previously explained, it is expected that a part of the additional public transport
passengers would use angkots, which is for the calculation here assumed to be 30%
of the total additional ridership, as estimated by GTZ staff. The other 70% additional
passengers would take bus.

GTZ SUTP, July 2001 CO2 Emission Reduction Potenttial of SUTP Measures
53
According to the SITNP projections (Study Report C2 1998), the total number of
public transport passengers would increase to 688,098 passengers per day if the
share of public transport in the modal split were maintained at 34.3%. For the
medium traffic-restraint scenario, this means that the total number of public
transport passenger would increase to approximately 800,600 passengers if the
share of public transport in the modal split increases to 40.0%. In other words, there
are 112,700 additional passengers are expected if the modal share of public
transport is increased from 34.3% to 40.0%. And if 30% of this additional ridership
goes by angkots, the total angkot capacity should be increased to accommodate
additional 33,800 passengers. According to the same SITNP report, in 1995, there
were around 4,500 angkots serving 151,684 passengers per day. This means, the
total number of angkots has to be increased to around 5,870 to maintain the same
capacity-related level of service. Higher number of angkots increases their total
gasoline consumption. Assuming the same operational characteristics (average daily
fuel consumption and number of operational day per year), the total gasoline
consumption of angkots in 2010 would increase to 56,400 kiloliters, as shown in the
following table:
5,870 unitsAverage daily fuel consumption 30 Liter/dayNum ber of operational days per year 320 days/yearYe a rly tota l fue l consum ption of a ngkots 56,354,160 Lite r
Total num ber of angkots 2010
For the heavy and extreme traffic-restraint scenarios, similar calculations with the
same assumptions lead to a total angkots' gasoline consumption of 65,474 kiloliters
and 74,594 kiloliters, respectively. These calculations are summarized in the
following tables:
4A1. Ga soline consum ption by Angkots (Afte r TDM - he a vy tra ffic-re stra int sce na rio)6,820 units
Average daily fuel consum ption 30 Liter/dayNum ber of operational days per year 320 days/yearYe a rly tota l fue l consum ption of a ngkots 65,474,310 Lite r
4A2. Ga soline consum ption by Angkots (Afte r TDM - Ex tre m e tra ffic-re stra int sce na rio)7,770 units
Average daily fuel consum ption 30 Liter/dayNum ber of operational days per year 320 days/yearYe a rly tota l fue l consum ption of a ngkots 74,594,460 Lite r
Total num ber of angkots 2010
Total num ber of angkots 2010
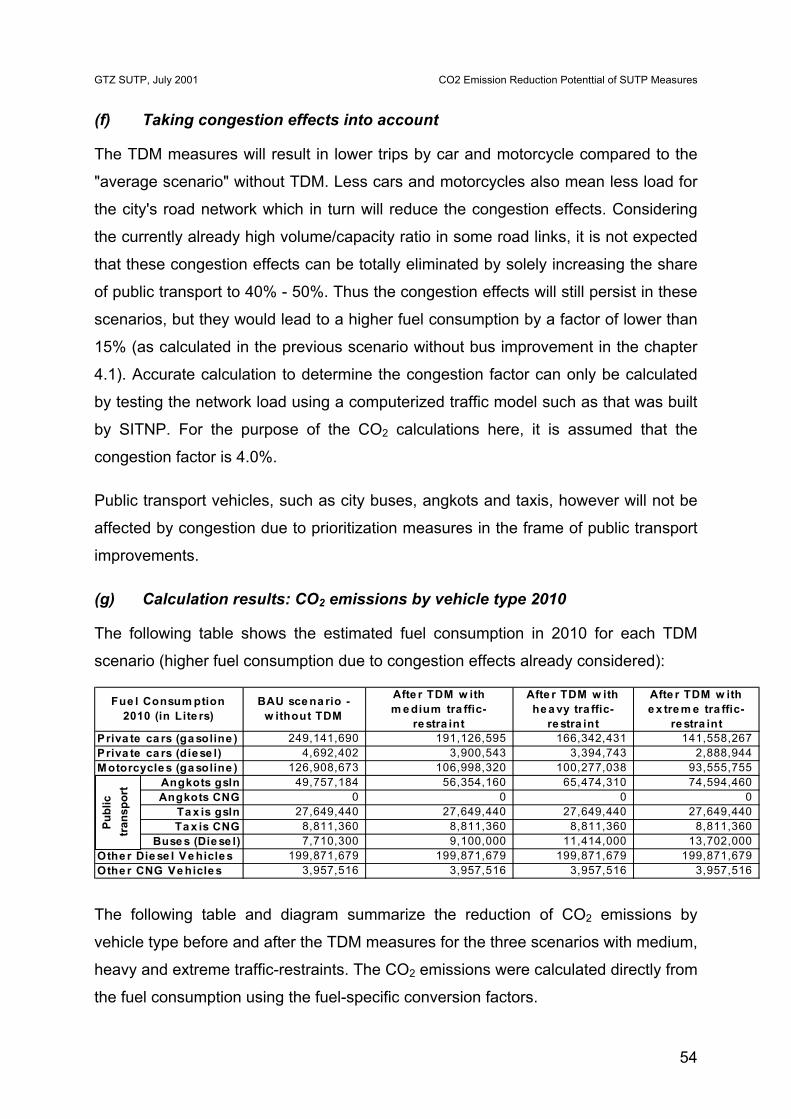
GTZ SUTP, July 2001 CO2 Emission Reduction Potenttial of SUTP Measures
54
(f) Taking congestion effects into account
The TDM measures will result in lower trips by car and motorcycle compared to the
"average scenario" without TDM. Less cars and motorcycles also mean less load for
the city's road network which in turn will reduce the congestion effects. Considering
the currently already high volume/capacity ratio in some road links, it is not expected
that these congestion effects can be totally eliminated by solely increasing the share
of public transport to 40% - 50%. Thus the congestion effects will still persist in these
scenarios, but they would lead to a higher fuel consumption by a factor of lower than
15% (as calculated in the previous scenario without bus improvement in the chapter
4.1). Accurate calculation to determine the congestion factor can only be calculated
by testing the network load using a computerized traffic model such as that was built
by SITNP. For the purpose of the CO2 calculations here, it is assumed that the
congestion factor is 4.0%.
Public transport vehicles, such as city buses, angkots and taxis, however will not be
affected by congestion due to prioritization measures in the frame of public transport
improvements.
(g) Calculation results: CO2 emissions by vehicle type 2010
The following table shows the estimated fuel consumption in 2010 for each TDM
scenario (higher fuel consumption due to congestion effects already considered):
Fue l Consum ption 2010 (in Lite rs)
BAU sce na rio - w ithout TDM
Afte r TDM w ith m e dium tra ffic-
re stra int
Afte r TDM w ith he a vy tra ffic-
re stra int
Afte r TDM w ith e x tre m e tra ffic-
re stra intPriva te ca rs (ga soline ) 249,141,690 191,126,595 166,342,431 141,558,267Priva te ca rs (die se l) 4,692,402 3,900,543 3,394,743 2,888,944Motorcycle s (ga soline ) 126,908,673 106,998,320 100,277,038 93,555,755
Angkots gsln 49,757,184 56,354,160 65,474,310 74,594,460Angkots CNG 0 0 0 0
Ta x is gsln 27,649,440 27,649,440 27,649,440 27,649,440Ta x is CNG 8,811,360 8,811,360 8,811,360 8,811,360
Buse s (Die se l) 7,710,300 9,100,000 11,414,000 13,702,000Othe r Die se l Ve hicle s 199,871,679 199,871,679 199,871,679 199,871,679Othe r CNG Ve hicle s 3,957,516 3,957,516 3,957,516 3,957,516
Publ
ic
tran
spor
t
The following table and diagram summarize the reduction of CO2 emissions by
vehicle type before and after the TDM measures for the three scenarios with medium,
heavy and extreme traffic-restraints. The CO2 emissions were calculated directly from
the fuel consumption using the fuel-specific conversion factors.
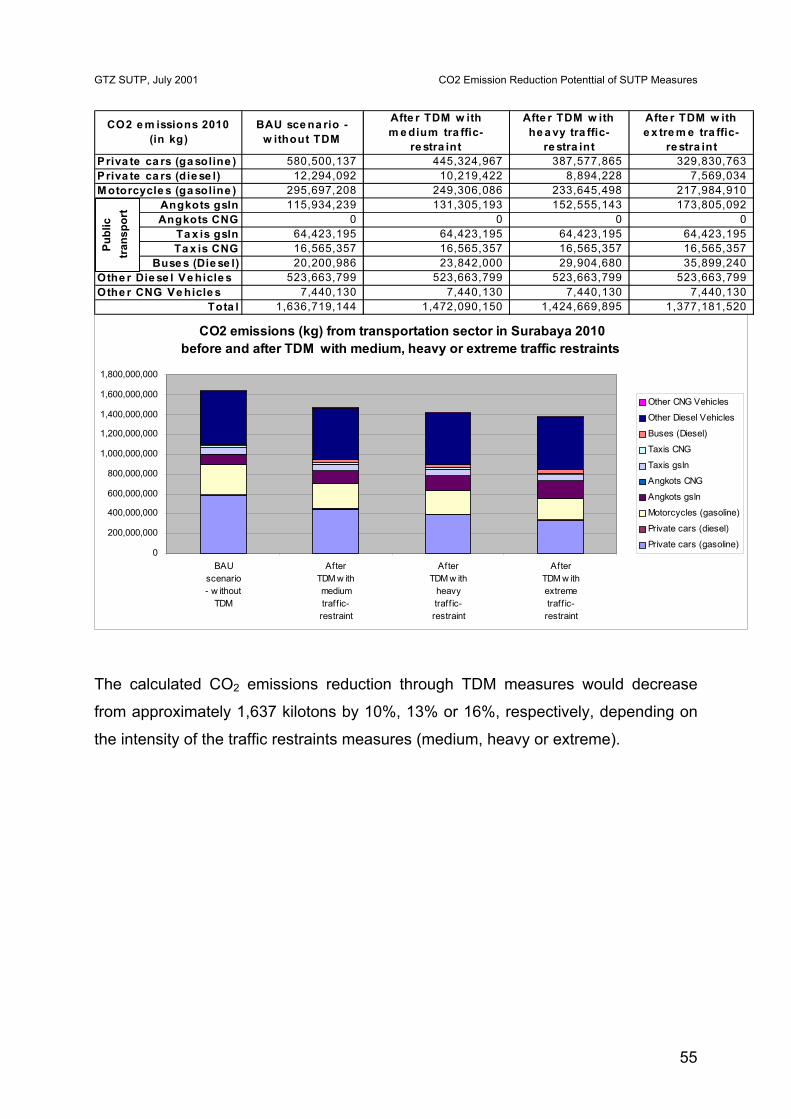
GTZ SUTP, July 2001 CO2 Emission Reduction Potenttial of SUTP Measures
55
CO2 e m issions 2010 (in kg)
BAU sce na rio - w ithout TDM
Afte r TDM w ith m e dium tra ffic-
re stra int
Afte r TDM w ith he a vy tra ffic-
re stra int
Afte r TDM w ith e x tre m e tra ffic-
re stra intPriva te ca rs (ga soline ) 580,500,137 445,324,967 387,577,865 329,830,763Priva te ca rs (die se l) 12,294,092 10,219,422 8,894,228 7,569,034M otorcycle s (ga soline ) 295,697,208 249,306,086 233,645,498 217,984,910
Angkots gsln 115,934,239 131,305,193 152,555,143 173,805,092Angkots CNG 0 0 0 0
Ta x is gsln 64,423,195 64,423,195 64,423,195 64,423,195Ta x is CNG 16,565,357 16,565,357 16,565,357 16,565,357
Buse s (Die se l) 20,200,986 23,842,000 29,904,680 35,899,240Othe r Die se l Ve hicle s 523,663,799 523,663,799 523,663,799 523,663,799Othe r CNG Ve hicle s 7,440,130 7,440,130 7,440,130 7,440,130
Tota l 1,636,719,144 1,472,090,150 1,424,669,895 1,377,181,520
Publ
ic
tran
spor
t
CO2 emissions (kg) from transportation sector in Surabaya 2010
before and after TDM with medium, heavy or extreme traffic restraints
0
200,000,000
400,000,000
600,000,000
800,000,000
1,000,000,000
1,200,000,000
1,400,000,000
1,600,000,000
1,800,000,000
BAUscenario- w ithout
TDM
AfterTDM w ithmediumtraff ic-restraint
AfterTDM w ith
heavytraff ic-restraint
AfterTDM w ithextremetraff ic-
restraint
Other CNG Vehicles
Other Diesel Vehicles
Buses (Diesel)
Taxis CNG
Taxis gsln
Angkots CNG
Angkots gsln
Motorcycles (gasoline)
Private cars (diesel)
Private cars (gasoline)
The calculated CO2 emissions reduction through TDM measures would decrease
from approximately 1,637 kilotons by 10%, 13% or 16%, respectively, depending on
the intensity of the traffic restraints measures (medium, heavy or extreme).

GTZ SUTP, July 2001 CO2 Emission Reduction Potenttial of SUTP Measures
56
4.6 IMPROVEMENTS FOR NON-MOTORIZED TRANSPORT In the following calculations, the CO2 emissions reduction potential of measures
towards improvement of Non-Motorized Transport (NMT) is estimated. The
improvements of NMT would encourage emissions-free transport modes for trips
conducted on foot, by bike or by becak (rickshaw). The emission reduction effects
can be achieved through substitution of motorized trips by non-motorized trips. Since
NMT trips are, by nature, mostly conducted for short distances, it is highly expected
that non-motorized ones will substitute only short-distance motorized trips. Therefore
it is assumed that this substitution effect only applies to short-distance motorized
trips, which here are defined as trips with an average length of 3 km. In reality, NMT
improvements that mainly aim at short distance trips, do encourage longer non-
motorized trips, too. But the effects on the longer trips are very limited, because most
of the times they are significantly lower than the impacts affecting the short trips.
Furthermore, not all short motorized trips would be affected by NMT improvements.
Short motorized trips, which are actually within reasonable distance to be conducted
by NMT means, are currently conducted by motorized means due to impossibility,
high insecurity or high level of detour, e.g. caused by lack of sidewalk or crossing
facilities. This sort of trips are more likely to be substituted by non-motorized trips,
than those motorized short trips, that are conducted mainly because of convenience
reasons. Thus, improvements of NMT facilities will have significant effects. Given the
poor conditions of NMT facilities, which are to be seen as the major constraint for
NMT in Surabaya, and the fact that the urban mixed land-use pattern that is ideal for
non-motorized trips, it is believed that the level of substitutable motorized trips is very
high. In the center areas of city (e.g. Kedungdoro and Rungkut), is believed that more
than 50% of the motorized trips are substitutable. For the purpose of that calculations
here, the substitution rate is set lower to 30% citywide, which means that the
improvement of NMT facilities would lead that 30% of short-motorized trips to be
substituted by non-motorized trips.
Another assumption that is used in the following calculations is that the share of car
in the extended modal split (that includes non-motorized trips) of short distance trips
is believed to be very low, as indicated by a non-motorized traffic survey conducted

GTZ SUTP, July 2001 CO2 Emission Reduction Potenttial of SUTP Measures
57
by GTZ in cooperation with ITDP/LPIST in 2000. For the purpose of the calculations
here, it is assumed that the car share is 1%. If around 30% of these short distance
car trips can be substituted by non-motorized trips, then a total of 1,677 kiloliters
gasoline and 34 kiloliters diesel can be saved.
The following table shows the modal split of short distance trips (average 3 km)
based on the NMT surveys mentioned above. Since the calculation here is
conducted on person.trip basis, and not like previous calculations, which were
performed on vehicle-trip basis, the specific fuel consumption of angkot and
motorcycle needs to be converted from vehicle.trip/liter to person.trip/liter. The
specific fuel consumption of angkot is known to be 10 km per liter gasoline, and the
specific fuel consumption of motorcycle is assumed to be 25 km per liter gasoline.
Assuming the occupancy rate of angkot to be 8 passengers per angkot and the
occupancy rate of motorcycle to be 1.1 persons per motorcycle, the calculated
specific fuel consumption would be 0.04 liter gasoline per person per trip for angkot
and 0.11 liter gasoline per person per trip. The specific fuel consumption of persons
traveling by angkot and motorcycle is included in the last row of the table.
M ode M oda lsplit sha re
Fue l consum ption (liter per person.trip)
walk 40% -becak 7% -bike 3% -angkot 17% 0.04m otorcyc le 33% 0.11Car 1% 0.58 Source: GTZ SUTP, Improving Conditions for Non-motorized Transport in Surabaya, 2000
The reduction of the gasoline consumption is calculated from the reduction of the
angkot, motorcycle and car trips. In spite of the reduction of 30% person-trips by
angkot in the short distance range, it is expected that there would be only a very
small reduction of the number of angkot vehicle trips. If this reduction of angkot-
passenger trips leads to a reduction of angkot-vehicle trips by 1%, then the total fuel
consumption of angkots would decrease by approx. 570 kiloliters, to 56,959 kiloliters.
Furthermore, if one assumes that 30% of the total citywide motorcycle trips are short
distance trips (in average of 3 km), and that these trips consume 15% of the total
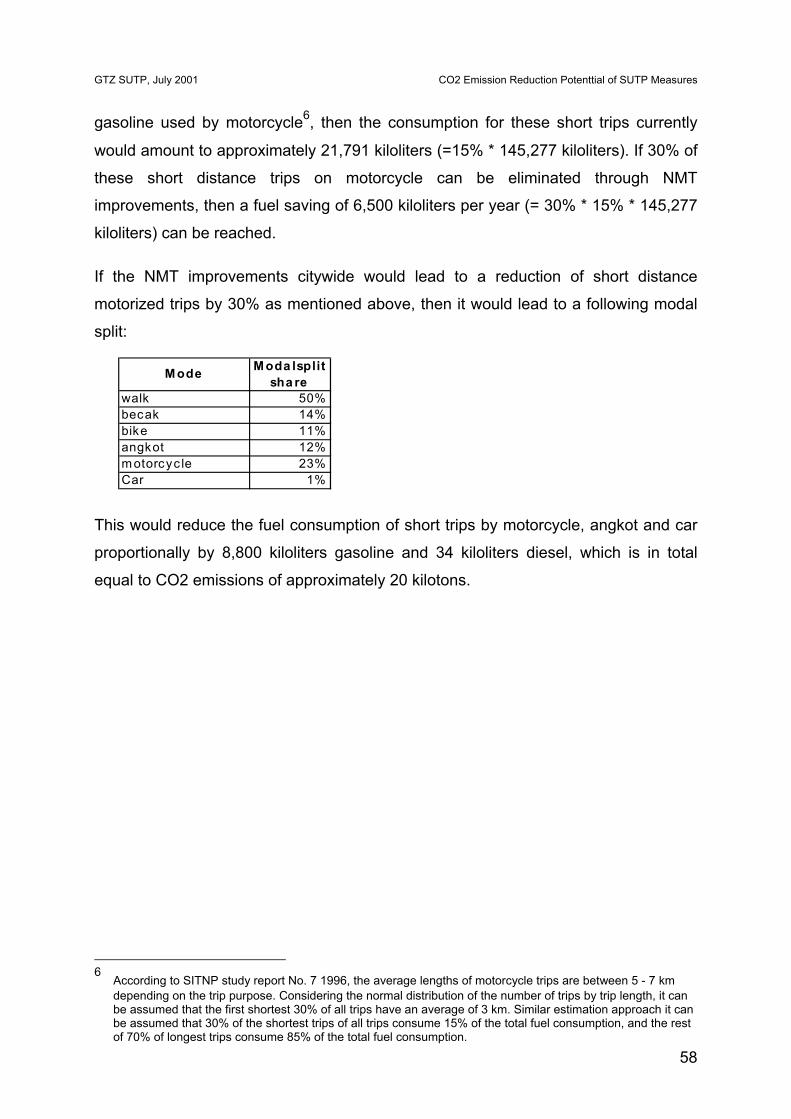
GTZ SUTP, July 2001 CO2 Emission Reduction Potenttial of SUTP Measures
58
gasoline used by motorcycle6, then the consumption for these short trips currently
would amount to approximately 21,791 kiloliters (=15% * 145,277 kiloliters). If 30% of
these short distance trips on motorcycle can be eliminated through NMT
improvements, then a fuel saving of 6,500 kiloliters per year (= 30% * 15% * 145,277
kiloliters) can be reached.
If the NMT improvements citywide would lead to a reduction of short distance
motorized trips by 30% as mentioned above, then it would lead to a following modal
split:
M ode M oda lsplit sha re
walk 50%becak 14%bike 11%angkot 12%m otorcyc le 23%Car 1%
This would reduce the fuel consumption of short trips by motorcycle, angkot and car
proportionally by 8,800 kiloliters gasoline and 34 kiloliters diesel, which is in total
equal to CO2 emissions of approximately 20 kilotons.
6 According to SITNP study report No. 7 1996, the average lengths of motorcycle trips are between 5 - 7 km
depending on the trip purpose. Considering the normal distribution of the number of trips by trip length, it can be assumed that the first shortest 30% of all trips have an average of 3 km. Similar estimation approach it can be assumed that 30% of the shortest trips of all trips consume 15% of the total fuel consumption, and the rest of 70% of longest trips consume 85% of the total fuel consumption.

GTZ SUTP, July 2001 CO2 Emission Reduction Potenttial of SUTP Measures
59
5 BIBLIOGRAPHY [1] Badan Pusat Statistik 2000: Surabaya Statistical Year Book 1999 [2] GTZ SUTP, Project trial for microbuses with CNG in Surabaya - Feasibility
Study, Surabaya 2000 [3] GTZ SUTP, Improving conditions for Non-Motorized Transport in Surabaya: A
Case Study of Two Neighbourhoods, 2000. [4] GTZ SUTP, Public Transport Reform through a Demonstration Route in
Surabaya: Physical and Planning Aspects, 2000 [5] GTZ SUTP, Public Transport Reform through a Demonstration Route in
Surabaya: Legal and Regulatory Aspects, 2000. [6] Forschungsgesellschaft für Straßenverkehr: Merkblatt über
Luftverunreinigungen an Strassen, Bonn 1992 [7] Intergovernmental Panel on Climate Change (IPCC) 1997: Guidelines for
National Greenhouse Gas Inventories [8] Surabaya Integrated Transportation Network Project Study Report No. 7, 1996 [9] Surabaya Integrated Transportation Network Project Study Report No. 9, 1996 [10] Surabaya Integrated Transportation Network Project Study II Report C2, 1998 [11] Surabaya Integrated Transportation Network Project Study II Report B3, 1998