involving homeowners in urban flood reduction
DESCRIPTION
This study investigated basement flood perceptions and mitigative behaviours of residents in the Sherwood Forest neighbourhood of London, Ontario. Though the Sherwood Forest area is relatively new and serviced by a separated sewer system, considerable sewer backup flood risk exists largely due to foundation drain connections to the sanitary sewer system. On May 28, 2009, a rainfall event consisting of 83 mm of precipitation over a five hour period flooded dozens of homes in the neighbourhood. This study investigated several aspects of homeowner knowledge and behaviour related to urban flood reduction and revealed many opportunities for both the City of London and insurers to increase homeowner knowledge and home-level action for urban flood reduction.TRANSCRIPT

Institute for CatastrophicLoss ReductionBuilding resilient communities
Institut de Préventiondes Sinistres CatastrophiquesConstruction de resilient communities
Involving Homeowners in Urban Flood Risk ReductionA Case Study of the Sherwood Forest Neighbourhood,London, Ontario
By Dan Sandink
May 2011

Involving Homeowners in Urban FloodRisk ReductionA Case Study of the Sherwood Forest Neighbourhood,London, Ontario
By Dan Sandink
Institute for Catastrophic Loss Reduction
May 2011
ICLR research paper series – number 51
Published by
Institute for Catastrophic Loss Reduction
20 Richmond Street East, Suite 210
Toronto, Ontario, Canada M5C 2R9
This material may be copied for purposes related to the document as long as
the author and copyright holder are recognized.
The opinions expressed in this paper are those of the author and not necessarily those
of the Institute for Catastrophic Loss Reduction.
ISBN: 978-0-9811792-1-6
Copyright©2011 Institute for Catastrophic Loss Reduction

ICLR’s mission is to reduce the loss of life and property caused by severe weatherand earthquakes through the identification and support of sustained actionsthat improve society’s capacity to adapt to, anticipate, mitigate, withstand andrecover from natural disasters. ICLR is achieving its mission through thedevelopment and implementation of its programs Open for business, to increasethe disaster resilience of small businesses, Designed for safer living, which increasesthe disaster resilience of homes, and RSVP cities, to increase thedisaster resilience of communities.

Table of contents
Executive summary . . . . . . . . . . . . . . . . . . . . . . . . . . . . . . . . . . . . . i
1. Introduction . . . . . . . . . . . . . . . . . . . . . . . . . . . . . . . . . . . . . . . . 1
1.1 Hazard perceptions and individual risk mitigation behaviour . . . . . . . . 2
1.2 Residential/homeowner urban flood mitigation . . . . . . . . . . . . . . . . 6
1.2.1 Behavioural measures . . . . . . . . . . . . . . . . . . . . . . . . . . . . . 6
1.2.2 Structural measures . . . . . . . . . . . . . . . . . . . . . . . . . . . . . . 7
1.2.3 Categorization of adjustments . . . . . . . . . . . . . . . . . . . . . . . 9
1.3 Education and incentive programs and requirements for basement flood reduction measures . . . . . . . . . . . . . . . . . . . . . 10
2. Methods . . . . . . . . . . . . . . . . . . . . . . . . . . . . . . . . . . . . . . . . . . 14
2.1 Case study . . . . . . . . . . . . . . . . . . . . . . . . . . . . . . . . . . . . . . . 14
2.1.1 Basement flooding grant program . . . . . . . . . . . . . . . . . . . . 17
2.2 Questionnaire administration . . . . . . . . . . . . . . . . . . . . . . . . . . . 19
2.3 Responses and analysis . . . . . . . . . . . . . . . . . . . . . . . . . . . . . . . 20
3. Results and discussion . . . . . . . . . . . . . . . . . . . . . . . . . . . . 21
3.1 Flood history . . . . . . . . . . . . . . . . . . . . . . . . . . . . . . . . . . . . . . 21
3.2 Reporting flooding to city and claiming insurance . . . . . . . . . . . . . . 23
3.3 Insurance coverage . . . . . . . . . . . . . . . . . . . . . . . . . . . . . . . . . . 24
3.4 Perceptions of future flood probability . . . . . . . . . . . . . . . . . . . . . 26
3.5 Knowledge and information sources . . . . . . . . . . . . . . . . . . . . . . . 28
3.6 Structural mitigation measures . . . . . . . . . . . . . . . . . . . . . . . . . . 31
3.6.1 Backwater valves . . . . . . . . . . . . . . . . . . . . . . . . . . . . . . . . 32
3.6.2 Sump pumps . . . . . . . . . . . . . . . . . . . . . . . . . . . . . . . . . . 33
3.6.3 Sewage ejectors . . . . . . . . . . . . . . . . . . . . . . . . . . . . . . . . 35
3.6.4 Downspout connections . . . . . . . . . . . . . . . . . . . . . . . . . . . 36
3.7 Correlations: Responsible for adjustments vs. flood history and flood type . . . . . . . . . . . . . . . . . . . . . . . . . . . . . . . 36
3.8 Applications for the subsidy program . . . . . . . . . . . . . . . . . . . . . . . . . . . 37
3.9 Open ended responses . . . . . . . . . . . . . . . . . . . . . . . . . . . . . . . . . . . . . . 38
4. Summary, implications and conclusions . . . . . . . . . . . . . . . . . . . . . 40
4.1 Summary of findings . . . . . . . . . . . . . . . . . . . . . . . . . . . . . . . . . 40
4.2 Implications and recommendations . . . . . . . . . . . . . . . . . . . . . . . . 44
4.3 Conclusion and further study . . . . . . . . . . . . . . . . . . . . . . . . . . . 49

Table of contents (continued)
Appendix A: Subsidy program summaries . . . . . . . . . . . . . . . . . . . . . 52
Appendix B: Summer, 2009 City of London survey . . . . . . . . . . . . . . . 57
Appendix C: City of London basement flooding brochure . . . . . . . . . . 58
Appendix D: Initial contact letter . . . . . . . . . . . . . . . . . . . . . . . . . . . 59
Appendix E: First drop cover letter and questionnaire . . . . . . . . . . . . 60
Appendix F: Second drop cover letter . . . . . . . . . . . . . . . . . . . . . . . 68
Appendix G: Reminder post card . . . . . . . . . . . . . . . . . . . . . . . . . . . 69
Appendix H: Flooding dates (ordered by year) . . . . . . . . . . . . . . . . . 70
Appendix I: Open ended responses . . . . . . . . . . . . . . . . . . . . . . . . 71
Works cited . . . . . . . . . . . . . . . . . . . . . . . . . . . . . . . . . . . . . . . . . . 80
Acknowledgements . . . . . . . . . . . . . . . . . . . . . . . . . . . . . . . . . . . . 89

List of tables
Table 1 Lot level adjustments for urban flood risk reduction . . . . . . . . . . 9
Table 2 Basement flood grant program funding for ground-related homes . . . . . . . . . . . . . . . . . . . . . . . . . . 17
Table 3 Response method . . . . . . . . . . . . . . . . . . . . . . . . . . . . . . . 20
Table 4 Respondent home tenure . . . . . . . . . . . . . . . . . . . . . . . . . . 20
Table 5 Flood history . . . . . . . . . . . . . . . . . . . . . . . . . . . . . . . . . . 21
Table 6 Flooding type and total number flooded . . . . . . . . . . . . . . . . . 21
Table 7 Number of reported most recent flood events by year . . . . . . . . 21
Table 8 Sources of clean water flooding . . . . . . . . . . . . . . . . . . . . . . 22
Table 9 Sources of sewage flooding . . . . . . . . . . . . . . . . . . . . . . . . . 22
Table 10 Respondents who did not indicate clean wateror sewage flooding . . . . . . . . . . . . . . . . . . . . . . . . . . . . . . 23
Table 11 Sewage flooding: Respondents who reported flooding to the city . . . . . . . . . . . . . . . . . . . . . . . . . . . . . . . . . . . . 23
Table 12 Clean water flooding: Respondents who reported flooding to the city . . . . . . . . . . . . . . . . . . . . . . . . . . . . . . 23
Table 13 Sewage flooding: Respondents who made an insurance claim . . . 24
Table 14 Clean water flooding: Respondents who made an insurance claim . . . . . . . . . . . . . . . . . . . . . . . . . . . . . . 24
Table 15 Insurance coverage: Total sample . . . . . . . . . . . . . . . . . . . . . 24
Table 16 Insurance coverage: Respondents who reported sewage flooding . . . . . . . . . . . . . . . . . . . . . . . . . . . . . . . 25
Table 17 Insurance coverage: Respondents who reported clean water flooding . . . . . . . . . . . . . . . . . . . . . . . . . . . . . 25
Table 18 Reasons for not having insurance coverage for sewer backup . . . . . . . . . . . . . . . . . . . . . . . . . . . . . . . 25
Table 19 Reasons for not having insurance coverage for sewer backup: Respondents who reported sewage flooding . . . . . . . . . . . . . . . . . . . . . . . . . . . . . . . 25
Table 20 Likelihood that basement will flood in next 10 years: Respondents with no flood history . . . . . . . . . . . . . . . . . . . . 26
Table 21 Likelihood that basement will flood in next 10 Years: Respondents with a history of flooding . . . . . . . . . . . . . . . . . 26

List of tables (continued)
Table 22 Likelihood that basement will food during next major rainstorm or snowmelt event: Respondents who did not report flooding . . . . . . . . . . . . . . . . . . . . . . . . 27
Table 23 Likelihood that basement will flood during next major rainstorm or snowmelt event: Respondents who reported flooding . . . . . . . . . . . . . . . . . . . . . . . . . . . . 27
Table 24 Knowledge of risk reduction measures . . . . . . . . . . . . . . . . . . 28
Table 25 Years lived in residence vs. know what to do to reducebasement flood risk . . . . . . . . . . . . . . . . . . . . . . . . . . . . . . 29
Table 26 Interactions and knowledge of City programs . . . . . . . . . . . . . 29
Table 27 Interest in receiving more information about basement flooding . . . . . . . . . . . . . . . . . . . . . . . . . . . . . . . 30
Table 28 Preferred information sources . . . . . . . . . . . . . . . . . . . . . . . . 30
Table 29 Preferred information sources . . . . . . . . . . . . . . . . . . . . . . . . 31
Table 30 Total responses: Backwater valve . . . . . . . . . . . . . . . . . . . . . . 32
Table 31 Years lived in residence vs. knowledge of whether or not a home had a backwater valve . . . . . . . . . . . . . . . . . . 32
Table 32 Responsibility for backwater valve installation . . . . . . . . . . . . . . 32
Table 33 Who installed backwater valve? . . . . . . . . . . . . . . . . . . . . . . 32
Table 34 Backwater valve in home by type of flood and flood history . . . . 33
Table 35 Flood history vs. have backwater valve . . . . . . . . . . . . . . . . . . 33
Table 36 Type of flooding vs. have backwater valve . . . . . . . . . . . . . . . 33
Table 37 Total responses: Sump pump . . . . . . . . . . . . . . . . . . . . . . . 33
Table 38 Where does your sump pump drain? . . . . . . . . . . . . . . . . . . 34
Table 39 Responsibility for sump pump installation . . . . . . . . . . . . . . . . 34
Table 40 Who installed sump pump? . . . . . . . . . . . . . . . . . . . . . . . . 34
Table 41 Flood history vs. have sump . . . . . . . . . . . . . . . . . . . . . . . . 35
Table 42 Type of flooding vs. have sump . . . . . . . . . . . . . . . . . . . . . . 35
Table 43 Total responses: Sewage ejector . . . . . . . . . . . . . . . . . . . . . . 35
Table 44 Responsibility for sewage ejector installation . . . . . . . . . . . . . . 35

Table 45 Total responses: Downspout connection . . . . . . . . . . . . . . . . . 36
Table 46 Flood history vs. downspout connections . . . . . . . . . . . . . . . . 36
Table 47 Type of flooding vs. downspout connections . . . . . . . . . . . . . . 36
Table 48 Flood history vs. responsible for backwater valve, sump or sewage ejector installation . . . . . . . . . . . . . . . . . . . . 36
Table 49 Type of flooding vs. responsible for backwater valve, sump or sewage ejector installation . . . . . . . . . . . . . . . . . . . . 36
Table 50 Responsible for adjustment vs. how likely in next 10 years? . . . . . 37
Table 51 Responsible for adjustment vs. how likely during next major event? . . . . . . . . . . . . . . . . . . . . . . . . . . . . . . . 37
Table 52 Respondents who applied for grant program . . . . . . . . . . . . . . 37
Table 53 Responses who received assistance from the grant program . . . . 37
List of figures
Figure 1 Study area . . . . . . . . . . . . . . . . . . . . . . . . . . . . . . . . . . . . 14
Figure 2 Sherwood Forest area sewershed . . . . . . . . . . . . . . . . . . . . . 15
Figure 3 Development history of Sherwood Forest . . . . . . . . . . . . . . . . 16
Figure 4 Number of reported most recent flood events by month . . . . . . . 22
Figure 5 Likelihood that basement will flood in next 10 yearsvs. flood history . . . . . . . . . . . . . . . . . . . . . . . . . . . . . . . . 27
Figure 6 Likelihood that basement will flood duringnext major rain or snowmelt event vs. flood history . . . . . . . . . . 27
Figure 7 Likelihood of flooding in next 10 years vs. likelihoodof flooding during next major rain or snowmelt event: Respondents with no flood history . . . . . . . . . . . . . . . . . . . . 28
Figure 8 Likelihood of flooding in next 10 years vs. likelihoodof flooding during next major rain or snowmelt event:Respondents with flood history . . . . . . . . . . . . . . . . . . . . . . . 28
Figure 9 Preferred information dissemination method . . . . . . . . . . . . . . 30

Executive summary
Urban flooding is a considerable and growing problem for residents, municipalitiesand insurers across Canada. Homeowners and residents who can take action toreduce their risk of experiencing damages and can limit their homes’ impact onsewer and stormwater management infrastructure have important roles in urbanflood mitigation. Many municipalities in Canada have developed comprehensiveprograms designed to increase homeowner involvement in urban flood reductionincluding education campaigns, and subsidy and grant programs. Municipalitieshave also applied by-laws and policies to require basement flood mitigationmeasures in homes and insurers are beginning to incentivize risk reducing plumbingmeasures for home insurance policy holders. Despite the important role ofhomeowners in urban flood mitigation, there has been very little researchinvestigating public perceptions of urban flood risk. This study compliments earlierICLR studies to help fill this research gap.
This study investigated basement flood perceptions and mitigative behaviours ofresidents in the Sherwood Forest neighbourhood of London, Ontario. Though theSherwood Forest area is relatively new and serviced by a separated sewer system,considerable sewer backup flood risk exits largely due to foundation drainconnections to the sanitary sewer system. On May 28, 2009, a rainfall eventconsisting of 83 mm of precipitation over a five hour period flooded dozens ofhomes in the neighbourhood. This study investigated several aspects of homeownerknowledge and behaviour related to urban flood reduction and revealed manyopportunities for both the City of London and insurers to increase homeownerknowledge and home-level action for urban flood reduction.
Similar to previous urban flooding surveys, respondents in this study had limitedawareness of sewer backup insurance coverage. Almost half of the respondentscould not indicate if they had sewer backup insurance coverage. One third ofrespondents also did not know whether or not their home had a backwater valve.Inability to indicate the existence of backwater valves has implications for insurers,specifically reliability of sewer backup questionnaire responses for new business.The City of London had taken various measures to inform residents in theSherwood Forest area of flood risk and city programs for flood risk reduction,including information mailings, surveys, brochures and public meetings. However,many respondents reported that they had not read or received any City of Londoninformation on flooding and many respondents had not heard of the City’sbasement flood reduction subsidy program. Further, a considerable proportion of respondents who experienced sewer backup flooding and the majority ofrespondents who experienced clean water flooding did not report their floodexperiences to the City.

Several respondents experienced flooding from sump pumps and open-endedresponses indicated that residents were concerned about flood risks associated withsump pumps. If there is the perception that sump systems lead to flooding, the Citymay experience difficulty in encouraging the use of sump systems as a means offlood reduction. Also, several respondents were concerned about how increasingdevelopment near the Sherwood Forest area had affected flood risk. However, thesewer systems of new development in the area are unrelated to those serving theSherwood Forest area and increased development would not have exacerbatedflood risk. Uptake of mitigative adjustments was relatively low, and very fewrespondents reported having installed sump pump systems or backwater valves on their own. Further, a considerable proportion of respondents reported havingexperienced infiltration flooding; a type of flooding that is largely not addressed in current City of London education materials.
There are opportunities for the City of London to partner with the insuranceindustry to address several of the abovementioned issues, specifically addressingresident uncertainty about sewer backup insurance coverage and in identifyingwhich residents have experienced sewer backup in the past. Government sponsoredinspections may also help address homeowner uncertainty about flood reductionmeasures in their home. To increase lot-level flood reduction, the City may chooseto implement stronger means of incorporating mitigation measures into homes,including by-laws or policies requiring backwater valves in all new homes. Requiringmitigation in all new homes could also help address uncertainties created by climate change.
Results from this study indicated that residents, by far, preferred information fromthe City rather than from their insurer or insurance broker. However, as insurancebrokers and insurers often serve as first point of contact for homeowners whoexperience a basement flood event, insurers and brokers may serve as an essentialconduit for City information. Though public meetings are an important part ofeffective public education and engagement, respondents preferred other means ofinformation distribution, including handbooks and brochures mailed to homes andwebsites. A large proportion of respondents reported that they would like to receiveinformation from City websites; however, only a small number of respondents hadreported accessing the City’s existing website. More aggressive informationdistribution methods may be required to increase resident up-take of cityinformation. While only a small proportion of residents reported having read Cityinformation about basement flooding, almost two thirds indicated that they wouldlike to receive more information about basement flood reduction from the City. An incremental approach to information distribution that takes advantage ofstrategic moments, including times when a flood event has made local news orwhen residents are purchasing new homes, may help increase uptake of City flood reduction education programs.

1
1. Introduction
Urban flooding presents a severe and continuing problem for homeowners,municipalities and insurers in Canada. Several recent events have exemplified thefinancial and social impact of severe urban flooding events, including the August 19, 2005 event in Southern Ontario, which resulted in over $500 million in insured damages and caused significant damage to infrastructure throughout theGreater Toronto Area, from Hamilton to Durham Region (IBC, 2007). Residents inthe City of Hamilton have endured numerous basement flood events over the pastfive years, from July 26, 2005 and the August 19, 2005 storm to as recently asAutumn, 2010 (City of Hamilton, 2010a; City of Hamilton, 2006a; Stockton, 2010).Other recent severe events include flooding in Southern Alberta in 2005, resultingin $300 million in insured damages, and the 2004 flood event in Peterborough,Ontario, resulting in over $87 million in insured damages. The 2004 event inPeterborough also resulted in provincial disaster relief payments of $25 million,almost $6 million of which was paid to residents (IBC, 2008; Sandink, 2006, 2007).
Aside from damage to infrastructure and the impact to the homes of their citizens,municipalities have also faced litigation associated with basement flooding,including the municipalities of Thunder Bay, Port Alberni, St. John’s and Kenora(Campbell et al., 2007). In early 2010, the City of Stratford settled a class-actionlawsuit related to a flood event in July, 2002. Under the settlement, $7.7 million wasto be paid to approximately 800 homeowners in the City (City of Stratford, 2010).
Flooded homeowners may experience significant hardship as a result of basementflooding events. While sewer backup coverage is available for most homeownersin Canada, claiming insurance for damages may result in increased premiums orreduced payout limits for future claims. Insurers may also require specific damagereducing measures for homeowners to continue their coverage levels and premiumsor to retain sewer backup coverage. In some cases, multiple claims for sewerbackup damage can result in cancellation of sewer backup coverage forhomeowners. Homeowners may also experience uninsurable damages caused byinfiltration or overland flooding. While provincial disaster relief may fill this gap afterwide-spread flood events, homeowners are often responsible for these damageson their own (Sandink et al., 2010). Aside from financial hardship, flood events mayresult in health and safety concerns and stress associated with the recurrenceof flooding (Arthur et al., 2009), mould issues (Sandink, 2006) as well as the lossof valued personal items and reduced enjoyment of one’s home.
Along with infrastructure and planning approaches, actions at the homeowner orprivate property level can play a significant role in the reduction of urban flood risk(Miguez et al., 2009; Turley, 2002). Private homeowners can adopt measures toreduce the risk of flood waters entering their home and can take actions to reducethe amount of water their home contributes to municipal sewer systems, thusreducing the risk of flooding for buildings serviced by the same system. ManyCanadian municipalities have adopted programs to encourage the implementationof flood mitigation adjustments by private homeowners, including educationprograms, by-laws and policies and financial incentive programs to offset the costof altering home plumbing and drainage characteristics.

2
This study investigates the basement flood perceptions and mitigative behaviours ofresidents in the Sherwood Forest neighbourhood of London, Ontario. On May 28,2009, a rainfall event consisting of 83 mm of precipitation over a five hour periodflooded dozens of homes in the Sherwood Forest neighbourhood of NorthwestLondon (City of London, 2009a; Van Brenk, 2009). This storm was estimated asbeing a 1 in 100 to 1 in 150 year event. Forty-seven complaints of basementflooding were made to the City as a result of the event, and the City of Londonsubsequently hired a consulting firm to model the area, held a public meeting andtargeted the area for basement flood education and subsidy programs. Engineeringwork is ongoing in the area, and the City has identified the Sherwood Forestneighbourhood as potentially vulnerable to future flooding events.
This paper is organized into four different sections. The first section provides a briefreview of major findings in the hazards perception literature, followed by adescription of lot-level mitigation adjustments for urban flooding. Provided in thefirst section is also a summary of measures employed by several Canadian municipalgovernments to educate and encourage the adoption of lot-level urban floodmitigation adjustments. Section 2 describes the methods applied in this study,including a description of the case study (the Sherwood Forest neighbourhood ofLondon, Ontario). Results and discussion are then provided in Section 3. Section 4summarizes the findings of the study, discusses the implications of the results andprovides recommendations based on the findings.
1.1. Hazard perceptions and individual risk mitigation behaviourThough there is a long tradition of studying the perceptions of natural hazards,including flooding from natural water bodies, research on urban flood riskperceptions is extremely limited (Terpstra et al., 2006). This is especially true inCanada. To date, few known studies have investigated public perceptions of urbanflood hazards, including sewer backup (Sandink, 2006; 2007). However, many ofthe characteristics of urban flooding are similar to previously studied hazards,including riverine and coastal flooding, due to their relatively infrequent occurrenceand the fact that they are often triggered by extreme natural events (heavy rainfallor snowmelt). Thus, many of the findings from previous hazard studies may apply to residential perceptions and behaviours associated to urban flooding.
There is considerable evidence that hazard vulnerable residents have a low level of awareness of their risk. For example, nearly three quarters of respondents from a North Carolina community rated their flood risk as low despite their occupancy in an officially defined 1 in 100 year flood risk zone (Horney et al., 2010), andSiegrist and Gutscher (2006) found that residents occupying identified flood riskareas were no more likely to adopt adjustments than residents in low risk areas.Yoshida and Deyle (2005) also found that adoption of adjustment by small businessowners in Duvall County, Florida was not affected by their occupancy of anidentified 1 in 100 year flood zone. Further, in Glen Williams, Ontario, Kreutzwiseret al. (1994) found that 72% of residents who occupied the officially definedfloodplain perceived no risk of future flooding. Similar results were identified in asurvey of London, Ontario residents by Shrubsole et al. (1997), who investigatedactual and perceived impacts of floodplain zoning on homes located in the

3
regulatory flood zone in the Coves area of London (Shrubsole et al., 1995). Thesurvey results revealed that 25 of 37 respondents believed that there was no futurerisk of flooding, despite their occupancy of the regulatory flood zone. Further, it hasbeen argued that individuals may occupy hazard vulnerable lands for aesthetic orquality of life reasons, and that these factors may overshadow risk of occupyingdesirable areas. For example, Terpstra et al. (2006) revealed that, in a study ofNetherlands residents, respondents felt that the benefit of their location in floodvulnerable areas far outweighed flood risk.
Kunreuther (2006) argued that a reason for low levels of preparedness for disasterevents and subsequent damages are a result of the “decision processes ofindividuals with respect to low-probability high-consequence events” (pg. 209) suchas category 4 hurricanes. Due to their low probability, individuals tend to denigrateor deny disaster risk, and adopt the perception that disasters “‘... will not happento [them]’” (Kunreuther, 2006: 209). Further, given the low probability of extremeevents, individuals may not consider investment in damage reducing adjustmentsas worthwhile (Kunreuther, 2006). As a result, it is often only after a disasterexperience that they will adopt risk reducing measures. Indeed, many authors haveidentified a link between recent experience with hazards and both awareness ofhazards and the adoption of mitigative adjustments (Browne & Hoyte, 2004;Coulibaly, 2008; Grothmann & Reusswig, 2006; Nguyen et al., 2006; Siegrist& Gutscher, 2006). Further, lack of historical experience with disaster events mayreduce the adoption of mitigation adjustments by both the public and governments(Burn, 1999). This finding is reflected in the study by Zaleskiewicz et al. (2002),where flood experience increased the purchase of flood insurance. Local floodevents and historical flood damages were also found to increase purchase ofoptional flood insurance in the U.S. (Brown & Hoyte, 2000). It has also been arguedthat policy makers should learn to take advantage of the “window of opportunity”that is often present shortly after a major disaster, when both public officials andresidents are most receptive to investing in disaster reducing measures (Henstra& McBean, 2004; Sandink, 2009a; Solecki & Michaels, 1994).
While it is generally argued that hazard experience is a necessary condition for riskreducing behaviour, experience with multiple storms over a short time period mayresult in decreased risk perception (Horney et al., 2010). This phenomenon maybe a result of the perception that extreme events occur over a regular pattern (e.g.,that a 1 in 100 year flood will occur once every 100 years) and has been referredto as the “gambler’s fallacy” (Arvai et al., 2006; Burton et al., 1993; Slovic et al.,1979; Slovic et al., 1974). Further, “false experiences” with relatively weak stormsmay lead individuals to misinterpret future risk (Horney et al., 2006). Conversely,experience with an unusually severe event may result in overestimation of futurerisk by vulnerable individuals (Arlikatti et al., 2006; Horney et al., 2010). Thereis some evidence to suggest that individuals in urban areas may be more fearfulof urban flooding rather than flooding from natural water bodies. In a studyof Netherlands residents, Terpstra et al. (2006) found that residents were moreworried about water nuisance, defined as “abnormal amounts of water in thestreets or on the land due to heavy rainfall, maximum a few decimetres” (pg. 432),

4
than they were of flooding from natural water bodies, as respondents felt thatthere was a higher probability of water nuisance while respondents felt that a floodwas highly unlikely.
It has been argued that there is a strong reliance of individuals on structural floodcontrol measures to reduce flood risk (Laska, 1986; McPherson & Saarinen, 1977;Yoshida & Deyle, 2005). Reliance on governments for risk reduction may reduceprotective behaviour by residents, as they feel that structures reduce disaster riskto a point where further lot-level mitigation is not necessary (Burby, 2006).However, in an investigation of perceptions of urban flash flood risk in CarbondaleIllinois, Coulibaly (2008) revealed that respondents who had experienced urbanflood damages still perceived a level of flood risk despite the fact that stormwatermanagement infrastructure in their area had been upgraded to a point as toessentially eliminate risk. Further, dependency on structures to reduce risk maydepend on past experiences with structural failure (Yoshida & Deyle, 2005).
Though it has been found that individuals place the majority of responsibility ongovernments for both flood damages and flood mitigation (Burby, 2006; Sandink,2007), this finding is not universal. For example, it has been shown that in ahurricane prone region of the U.S., homebuyers were willing to pay more forhomes that had mitigation features (Simmons & Kruse, 2002). Arthur et al. (2009)found that survey respondents in Edinburgh, Scotland also accepted a level ofresponsibility for both sewer related flood damages and mitigation. While 64%of respondents in Edinburgh identified insufficient sewer system capacity, and61% identified poor maintenance of sewer systems as the most important failuremechanisms for municipal sewer systems, 69% of respondents in their studyreported that “pipework blocking due to household and business activities” wasthe most important failure mechanism. Further, 59% of respondents in the Arthuret al. (2009) study were willing to pay more for sewer system services if theincreased cost resulted in improvements to the system, suggesting anunderstanding of the role of homeowners in maintenance of the system and inurban flood risk reduction.
Various methods have been employed to increase awareness and risk reducingbehaviour by hazard prone individuals. As described below, several Canadianmunicipal governments have employed incentive and education programs toincrease awareness of urban flood risk and to encourage risk reducing behaviour.Mass media is a common method of distributing hazards information, though thismethod has met with varying levels of success (Mileti et al., 1992). Thedevelopment and dissemination of riverine floodplain maps has been widely appliedas a method to increase hazard awareness (Montz, 1982; Sandink et al., 2010;Shrubsole et al., 2003; Yoshida & Deyle, 2005), and have been found to besuccessful means of increasing awareness in some cases (Siegrist & Gutsher, 2006).Some studies have found that communication with family members, friends andco-workers may have a positive impact on disaster awareness, including thelikelihood that individuals will evacuate an area at immediate risk of experiencinga disaster (Drabek & Boggs, 1968; Horney, et al., 2006).

5
Adoption of risk mitigating measures is low amongst private residents. Severalstudies, for example, have found that fewer than 15% of individuals exposed toearthquake risk choose to adopt mitigation measures (Kunreuther et al., 1978; Palmet al., 1990). Similar results have been found for those exposed to flood risk (Laska,1986; 1991). Kunreuther (2006) identified several explanations for limited adoptionof risk reducing adjustments by private residents. Residents may underestimate orignore probabilities of hazards, and thus are unable to accurately assess the benefitsand costs of implementing risk reducing adjustments. Further, residents may choosenot to seek out information on the probabilities of disaster events or may chooseto anchor or focus their perceptions on the lowest probability of events if they doseek probability information (Kunreuther, 2006). Short time-horizons may also bea barrier to the adoption of risk reducing adjustments. When considering adoptingrisk reducing adjustments, homeowners may only consider benefits over a few yearsafter adoption (Kunreuther, 2006). Further, residents are more likely to take intoconsideration the up-front costs of mitigation measures, rather than consideringthe long-term benefits these measures may provide (Kunreuther, 2006). Indeed,difficulty in considering long-term consequences of current actions is a welldocumented failing of human decision making (Kunreuther, 2006), and short-sighted policy decisions by governments has also been an identified culprit in theoccurrence of disasters (Burby, 2006).
Interdependencies between neighbours’ actions may also serve as a barrier or driverfor mitigative action—if many homeowners in a neighbourhood implement aspecific action, the probability of an individual adopting the action may increase.Conversely, homeowners may not want to be the “first person on the block”to adopt mitigative actions, especially if they change the appearance of the homeor property as changes in appearance may reduce property values (Kunreuther,2006). Family budgets, especially for low-income homeowners, serve as a furtherbarrier to mitigative action (Kunreuther, 2006).
Kunreuther (2006) argues that the expectation of government financial assistanceafter a disaster event serves as an additional barrier to mitigation, as an expectationof financial assistance for damages may preclude physical adjustments for damagereduction. Though adoption of insurance for flooding where available or for sewerbackup in Canada may be considered as a risk reducing adjustment, as it limitsfinancial loss to the insurance purchaser, expectation of insurance coverage mayalso reduce the probability that an individual will adopt mitigative adjustments.This phenomenon, where “…obtaining of insurance tends to alter an individual’sincentives to prevent loss or to take specific [loss reducing] actions…” (Parsons,2003: 451) is referred to as moral hazard (Jongejan & Barrieu, 2008; Lamond& Proverbs, 2008; McLeman & Smit, 2006). It has been argued that moral hazardcreated by the subsidized provision of flood insurance under the U.S. National FloodInsurance Program has led to intense development of hurricane prone areas in theU.S. (Cutter & Emrich, 2006) and has contributed to substantial damages causedby U.S. hurricane events (Kousky, 2010).

6
1.2. Residential/homeowner urban flood mitigationDuring urban flood events, which often result from extreme rainfall or extremesnowmelt, homeowners have typically experienced impacts from one or more ofthree types of flooding: Overland flooding, infiltration flooding and/or sewer backup.There are a number of adjustments that can be adopted at the private-property (orlot) level and that can assist in mitigating the risk of one or more of these types offlooding. These adjustments can largely be categorized as “behavioural” and“structural.” Adjustments that relate to actions of homeowners in attainingknowledge, informing others of their risk, maintenance of home or lot features orchanging the way they use their home or plumbing are considered behavioural.Adjustments that result in changes to the nature of a property, lot or home areconsidered structural. These adjustments are described below. For more informationon homeowner level adjustments for urban flood risk reduction, see Sandink (2009b).
1.2.1. Behavioural measuresSeveral behavioural measures may be adopted to directly or indirectly reduce the riskof flooding for homeowners and neighbourhoods. Homeowners may choose to seekout and read information about basement flood reduction, which may be availablethrough their municipality or other sources. Ideally, homeowners would seekinformation from their own municipality, as municipal-specific information will bemore reflective of local sewer system and plumbing characteristics. It is also importantthat residents inform their municipality of flooding they have experienced in the past.This information may be used by a municipality to identify areas of concern and mayassist in the prioritization of infrastructure projects or other measures that alleviateurban flood risk (City of Hamilton, 2006). A further important behavioural measure is becoming informed of one’s own home plumbing by hiring a licensed professionalto conduct a plumbing investigation. Proper plumbing investigations can ensure thatproperty owners install the proper measures to reduce flood risk. The importance of plumbing investigations is reflected by their incorporation into severalmunicipalities’ homeowner sewer backup subsidy programs, including the City ofOttawa, the City of St. Catharines, Halton Region and the City of Welland, wheresubsidy programs include site investigations by municipal representatives (City ofOttawa, 2010a; City of Ottawa, 2006; City of St. Catharines, 2010; City of Welland,2009; Halton Region, 2010). Other programs require third party inspections bylicensed professionals before subsidy funds are disbursed (City of Toronto, 2010).
Only insurance coverage for sewer backup damage is widely available for Canadianhomeowners (Sandink et al., 2010). However, previous research has revealed aconsiderable lack of awareness of insurance coverage related to flooding. A 2004ICLR survey revealed that close to 70% of Canadian homeowners believed thatoverland flooding is covered under typical homeowners’ insurance policies (ICLR,2004 cited in Sandink et al., 2010). A 2007 survey of homeowners in Toronto and Edmonton revealed that close to a third of respondents who had experiencedsewer backup at some time in the past did not know whether or not their insurancecovered sewer backup (Sandink, 2007). Thus, talking to one’s broker or insuranceprovider or carefully reviewing one’s policy is an important behavioural risk mitigating measure.

7
Fats, oils and grease (FOGs) can accumulate in both home sanitary sewer lateralsand municipal sanitary or combined sewer systems, resulting in reduced capacity to convey heavy flows of water and leading to blockages in the system, which maydirectly cause sewer backup. Thus, avoiding pouring FOGs down household drainscan reduce sewer backup risk for both homeowners and the community. Further,the blockage of storm sewer grates by leaves, snow and ice or other debris mayresult in increased surface flows during a heavy rainfall event (UMA, 2005). Thus,either clearing out or reporting blocked sewer grates can reduce overland flowsduring extreme rain events. Reducing water use during heavy rainfall events,including delaying running of dishwashers, washing machines and using showersand bathrooms helps reduce stress on municipal systems. Further, if a backwatervalve has been installed, residents should refrain from the use of any householdplumbing during extreme rainfall events, as the valve may be closed and water will not be able to exit the home through the sanitary lateral. The maintenance ofeavestroughs and downspouts may also reduce flood risk. Eavestroughs anddownspouts plugged with leaves or debris may result in water pouring over the side of the eavestrough and landing directly next to the home and foundation wall.This water may enter window wells and windows and cause basement flooding.Further, water pouring over the side of eavestroughs may increase the amount ofwater that enters the homes foundation drains, which may increase the amount of water that enters the municipal sewer system. Homeowners may also choose to change the way they use their basements, including choosing not to store orlocate valuable or expensive items in basements.
1.2.2. Structural measuresStructural measures include those that result in the alteration of plumbing or othercomponents of the home and property. Like behavioural measures, structuralmeasures may directly or indirectly reduce flood risk.
Identifying and sealing cracks in basement floors and foundation walls can serve to reduce the risk of infiltration flooding, and the identification and sealing ofcracks in basement walls or other unsealed openings around utilities (wires, pipes)in the foundation above ground level may reduce the risk of water entering thebasement from overland flooding. Window well covers may also help preventoverland flow water from entering basements through basement window wells andwindows. Extending eavestroughs away from the side of the foundation wall helpskeep eavestrough drainage away from the soil directly adjacent to foundation walls,thus reducing the amount of water that enters foundation drains. Lot gradingshould accommodate water flows from the property during rainfall and snowmeltevents. Appropriate lot grading may not have be been incorporated into olderdevelopments, or homeowners may have changed the nature of lot gradingresulting in grading that does not direct water away from the home or directs watertoward the home. Homeowners should ensure lot grading redirects flows awayfrom the home as much as possible.

8
Backwater valves and sewage ejector systems serve to reduce the risk of sewerbackup at the homeowner level. Backwater valves are placed in either the mainsanitary sewer connection (mainline valves) or in branch connections throughout thehome (inline valves). When the municipal sanitary sewer surcharges, backwatervalves prevent flows from entering the home. The installation of sewage ejectorsystems includes increasing the height of the main sewer connection where it entersthe home above the potential flood level in the municipal sewer. Basementplumbing drains are then directed to a sump where they are pumped up into thelateral by the sewage ejector (Tinley Park, n.d.).
Cracks and loose joints in older sewer lateral or sanitary sewer connections mayserve as a source of infiltration and excess water in municipal sanitary sewersystems. Further, blockages on private property, including those caused by treeroots or a build up of FOGs, can cause isolated sewer backup events. Thus, lateralsshould be inspected and repaired if necessary. As an example of a municipalprogram designed to address sewer laterals, the City of Surrey, British Columbiarequires replacement of sewer laterals for redeveloped land or major upgrades tohomes if camera inspections reveal that the lateral is in poor condition. The city mayalso require replacement of the lateral if it is over 30 years old without camerainspections (City of Surrey, 2008).
Foundation drains consist of perforated pipes that surround the outside of thefoundation footing and serve to drain excess groundwater away from foundationwalls. When connected to a home’s sanitary sewer lateral, foundation drainage cancontribute significant amounts of water to the municipal sewer system and result inor exacerbate the risk of sewer backup. Subject to lot conditions and local drainageinfrastructure, foundation drains can be routed into a sump pit and pumped out of the home onto the surface of the lot. Municipalities may also allow connectionof foundation drains into municipal storm or “third pipe” systems via storm-sewerlaterals. Downspout connections into sanitary sewers may also contributesubstantial quantities of water into municipal sanitary sewer systems and exacerbatesewer backup risk. Given appropriate lot characteristics, downspouts can bedisconnected from sanitary or combined sewer systems and made to drain over the surface of the lot.
Foundation drain and downspout disconnection do not directly reduce a home’srisk of basement flooding. However, if numerous homeowners serviced by aparticular sewershed remove these extraneous sources of inflow from the sanitaryor combined sewers, sewer backup risk can be reduced for neighbourhoodsgenerally. Further, disconnection of foundation drainage and downspouts fromsanitary laterals is crucial for proper backwater valve installation. “Self flooding”may result from the connection of downspouts and foundation drains to lateralsupstream of backwater valves, as water will not be able to get in or out of thehome when a backwater valve closes. Thus, when the backwater valve closes,foundation drainage and downspout water may be forced up through floor drainsor other bathroom drains and result in basement flooding.

9
1.2.3. Categorization of adjustmentsAside from behavioural and structural, lot-level adjustments can be categorizedbased on the type of flood they will mitigate and how they reduce risk (either forthe homeowner directly or for the community or neighbourhood). Availableadjustments are displayed in Table 1. It is important to consider that some lot-levelmitigation measures, specifically downspout disconnection and foundation draindisconnection, do not directly reduce flood risk for the home that employs them.However, as described above, if several homeowners employ these measures, riskcan be reduced for all homeowners serviced by the same sewer.
Table 1: Lot level adjustments for urban flood risk reduction
Adjustment Type of flooding addressed Who does it help? Classification
SewerOverland Infiltration Backup Homeowner Neighbourhood Structural Behavioural
Seek out or read information on flood reduction � � � � � �
Inform municipal government aboutflood experiences � � � � � �
Plumbing investigation � � � � � �
Review insurance coverage � � �
Avoid pouring FOGs down drains � � � �
Keep storm sewer grates clear � � � �
Reduce water use during heavy rainfall events � � � �
Maintain eavestroughs and downspouts � � � � �
Change use of basement � � � � �
Seal cracks in foundation walls, basement floors � � �
Identify/Seal overland flood entry points � � �
Extension of downspouts/splash pads � � � � �
Lot grading/backfilling/swales � � � � �
Backwater valve(s) � � �
Sewage Ejector System � � �
Maintenance, repair of sewer laterals � � � �
Window wells/well covers � � �
Downspout disconnection from municipal sanitary/combined sewer � � �
Weeping tile disconnection and sump installation � � �
Source: City of London, 2010; Sandink, 2009b

10
1.3. Education and incentive programs and requirementsfor basement flood reduction measures
Reflecting the role of private property owners in urban flood reduction, manyCanadian municipalities have employed programs to increase public awareness ofurban flood risk and encourage the adoption of mitigation measures. There maybe several components to these programs, including educational programs, by-lawsand financial incentive programs.
Education programs that rely on mass media, printed materials, informationmailings and public meetings are often employed in cities that have been affectedby wide-spread basement flooding events. Municipal government materials areoften focussed on sewer backup issues, rather than infiltration and overland floodrisk reduction, though some municipalities (e.g., Richmond, B.C. and Calgary,Alberta) discuss measures to reduce the risk of severe overland flooding (e.g.,riverine, coastal flooding) (City of Calgary, 2010; City of Richmond, 2010). Publicmeetings are a common method of basement flood communication and are oftenheld by municipal governments and consulting firms involved in infrastructure work(Sandink, 2007). For example, The City of Edmonton, Alberta conducted publicmeetings focussed on backwater valves and sump pumps, which drew attendancefrom hundreds of residents (Sandink, 2007). Cities across Canada have developedbasement flooding websites and public education materials, which focus on severalaspects of urban flooding. For example, the cities of Vancouver, Calgary, Edmonton,Regina, Saskatoon, Winnipeg, Toronto, Ottawa, Montréal, Moncton and St. Johnhave developed websites and public information materials for basement floodingand flood reduction (City of Calgary, 2010; City of Edmonton, 2011; City ofMoncton, n.d.; City of Montréal, n.d.; City of Vancouver, 2009; City of Regina,2010; City of Saskatoon, 2011; City of Saint John, 2010; City of Toronto, n.d.;City of Winnipeg, 2011a). Some cities, including Calgary, Regina and Edmonton,have developed comprehensive flood guides. The Canadian Mortgage and HousingCorporation has also developed and posted general basement flood reductioninformation on their website (CMHC, 2010).
The City of London has applied numerous measures to increase flood awareness,including social media (e.g., Twitter and Facebook), basement flooding websites,newspaper ads, public meetings, brochures and other printed materials, as well as public service announcements that run on a local television station. As explainedbelow, the City of London has also employed mass information mailings foraffected neighbourhoods. The City of London also undertakes surveys inneighbourhoods that are targeted for infrastructure upgrades, and has employed a financial incentive program (see Section 2).
Many Canadian municipalities have developed and implemented financial incentive(grant or loan) programs to subsidize the adoption of flood reducing measures forhomeowners. Municipalities that have or once had such programs include Toronto;Brantford; Edmonton; London; Ottawa; The Region of Halton; St. Catharines;Welland; Niagara Falls; Hamilton; Saskatoon; Vaughan; Durham Region; The Region

11
of Peel/Mississauga; Sudbury; Winnipeg, and; Peterborough. These programs aregenerally aimed at reducing the risk of sewer backup caused by surcharging ofmunicipal sewer systems rather than damages caused by overland or infiltrationflooding. Maximum subsidies or loans provided through the programs are generallyin the range of $3,000, which may provide funding for downspout disconnection,foundation drain disconnection and the installation of a sump pump system, andthe installation of a backwater valve. However, subsidy levels vary from program to program. Several provide a portion of the cost of installing sewer backupreducing measures to a specific maximum (e.g., the City of Toronto may provide80% of the cost of installing a backwater valve to a maximum of $1,250 andHalton Region may provide 50% to a maximum of $675 for the installation of abackwater valve), while some programs provide the full cost to a certain maximum(for example, the City of Niagara Falls may provide 100% of the cost of theinstallation of a backwater valve to a maximum of $500). Of note are the varyinglevels of assistance provided for the installation of backwater valves, which rangefrom $1,250 in Toronto and $1,200 in Edmonton, to $675 in Halton andPeel/Mississauga and $500 in Niagara Falls. For a summary of several of theseprograms, see Appendix A. The City of London’s grant program is summarized in Section 2.1.1.
Homeowners are often required to sign a release form along with their applicationto subsidy programs, releasing municipalities from liability from failed plumbingmeasures and indicating that provision of subsidies are not admissions of guilt bymunicipalities. Maintenance of backwater valves has been identified as a concern bysome municipal professionals. Backwater valves must be maintained to ensure thatblockages do not affect the operation of the valve during a sewer backup, andshould be monitored to ensure that they are in general good condition. Reflectingthese maintenance issues, the City of Brantford’s Basement Flooding GrantProgramme Application Form, Agreement, and Release states that “in the event of the sale or lease of the property, the applicant will inform the purchaser or lesseeof the existence of the completed work installed and the applicable maintenancerequirements” (City of Brantford, n.d.).
Some municipalities have adopted by-laws or policies that include requirements for backwater valves in all new homes. The adoption of by-laws or policies for therequirement of backwater valves may relate to both implementation andinterpretation of the relevant section of the relevant provincial building or plumbingcodes. Ontario Building Code Section 7.4.6.4(3) states that “where a building drainor a branch may be subject to backflow, a backwater valve shall be installed onevery fixture drain connected to them when the fixture is located below the level ofthe adjoining street.” A key factor in implementation of this section of the buildingcode is the interpretation of whether or not a lateral “may” be subject to backflow.Municipalities may consider only new development in areas that have had historicalsewer backup problems as those that “may” be subject to backflow. However,other municipalities may consider any home serviced by the municipal sewer systemas potentially vulnerable to sewer backup.

12
In an August, 2008 staff report, City of Toronto staff recommended wider adoptionof backwater valves in homes through the requirement of their installation when a plumbing permit is requested from the City for work on sewer drains. The staffreport recommended that:
The whole City be declared at risk of basement flooding in the event ofunusually severe or extreme precipitation, and the Chief Building Official, incollaboration with the General Manager, Toronto Water, the Chief Planner,the Executive Director of Municipal Licensing & Standards, and the CitySolicitor, in accordance with the Ontario Building Code, require any applicantof a Plumbing Permit related to the sewer drain where there is a below gradeliving area anywhere in the City of Toronto to install a backwater valve ontheir sanitary sewer lateral (City of Toronto, 2008: 5).
Toronto City Council adopted the recommendation in September, 2008. Severalother municipalities throughout Canada have required backwater valves in newhomes, sometimes for several decades. For example, the City of Edmonton has had this requirement since 1989 and the City of Winnipeg since 1979 (City ofEdmonton, 2008; City of Winnipeg, 2011b). The City of Ottawa has also recentlytaken steps toward requiring backwater valves on sanitary sewer connections in all new homes (City of Ottawa, 2010b).
Neepawa, Manitoba’s by-law number 3059 requires that “all new plumbing fixturesbelow ground level shall be protected by a backwater valve” and that the “ownershall maintain the backwater valve to ensure that it is in good mechanicalcondition.” Similar wording requiring backwater valves is also used in Portage LaPrairie, Manitoba’s by-law number 6748. The City of Welland, Municipal Standards,9.6 requires that “… all new houses (single detached, semi-detached andtownhouses) to be fitted with a normally open backwater valve, in accordance withthe Ontario Building Code 7.4.6.4, located in the building drain inside the house.”Some municipalities may only require backwater valve installation when there isliving area below street level on a home, or if the municipality feels that the homeor development may be subject to sewer backflow at sometime in the future. Forexample, the City of Kenora’s by-law number 168-2004 states that “every buildingdrain branch serving fixtures below street level that may be subject tobackflow…shall have installed a backwater valve or other approved device toprevent [backflow]” and by-law number 949-07 of Red Lake, Ontario states that“where a building drain or a branch may be subject to backflow, a backwater valveshall be installed on every fixture drain connected to them when the fixture islocated below the level of the adjoining street.” However, By-law number 005 ofQuispamsis, New Brunswick states that “backwater valves are to be installed onbuilding drains, inside foundation walls on all new building construction regardlessof foundation elevation with roadway… .”

13
Some municipalities integrate maintenance requirements into by-laws for backwatervalves. For example, by-laws in Welland and Kenora, Ontario and Neepawa, Manitobarequire that if a backwater valve is installed in a home that it be maintained by theoccupant or owner of the home. Similarly, Pointe Claire, Quebec’s by-law number2495C states that “… any connection to public sanitary, storm or combined sewershall be equipped with a backwater valve…” and that “any backwater valve shall bemaintained in good working condition by the owner.”
As described in this section, Canadian municipalities have employed numerousmethods to increase public awareness of basement flooding issues, ranging frommass media campaigns to the requirement of basement flood reducing measures “in new development. Incentive programs are also a relatively common method of encouraging flood reducing behaviour, but not all municipalities affected by flooding use incentive programs and incentive programs vary widely betweenmunicipalities.

14
2. Methods
This section describes the case study investigated in this report (the SherwoodForest neighbourhood), including a historical flooding event in the area. Thequestionnaire administration technique is also described, following a brief summaryof questionnaires received and analysis methods employed in the report.
2.1. Case studyThe Sherwood Forest neighbourhood of London, Ontario is located in thenorthwest portion of the City. The study area consisted of 2,065 single detached,semi detached and apartment units (including both rental and condominiumapartments) (Figure 1). The study area is defined by a sanitary sewershed thatservices only that neighbourhood. The sewershed services an area bounded byGainsborough Rd. to the north, Wonderland Rd. to the east and Sarnia Rd. to the south. The western boundary of the study area included homes west ofAldersbrook Rd., Queensborough Crt., and Olympic Cres. (Figure 2). The area is serviced by a separated sewer system.
Figure 1: Study area
Adapted from AECOM, 2009

15
Figure 2: Sherwood Forest area sewershed
The Sherwood Forest neighbourhood experienced a severe rainfall event on May 28, 2009 that resulted in 47 basement flood complaints made to the City (Cityof London, 2009a). Eighty-three millimeters of rain was recorded over a five-hourperiod at the City of London Aquatic Centre, located west of Wonderland Rd.,between Gainsborough Rd. and Sarnia Rd., translating to a 1 in 100 to 1 in 150 year rainfall event for the area (City of London, 2009a). City records indicatedthat 78 mm of the rainfall occurred during a three hour period between 9:30 amand 12:30 pm (Personal Communication, K. Chambers, Wastewater and DrainageEngineering, City of London, Jan. 27, 2011). Note that London received an averageof 82.9 mm of precipitation in the month of May between 1971 and 2000(Environment Canada, 2010), however this event resulted in 83 mm in just a fivehour period. While the event was rare, when extended over the life of a home orthe life of a mortgage a 1 in 100 year event becomes much more probable. Forexample, the U.S. Federal Emergency Management Agency (FEMA) estimated that a 1 in 100 year flood event has a 26% chance of occurring over the life of a 30 year mortgage (FEMA, n.d.).
The Sherwood Forest neighbourhood has gone through several phases ofdevelopment, starting in the 1970s (Figure 3). The vast majority of theneighbourhood was developed by 1985, while a section in the southwest portion of the area was developed between 1985 and 1995 and the far west portion of theneighbourhood was developed after 1995. The dates of development are relevantfor responses relating to sump pumps, sump pump discharge practices anddownspout connections. Before 1985, new homes in the City of London were notrequired to have sump pumps, and foundation drains were generally made to draininto sanitary sewer connections. Thus, homes built before 1985 would likely nothave sump pumps unless they were installed by homeowners. Between 1985 and1995, new homes in London were required to have sump pumps. During this

16
period, sump pumps would largely have been designed to drain over the surface of lots, rather than into the municipal storm or sanitary sewer. After 1995, all newhomes in London were required to have both a storm private drain connection (PDC)and a sump pump, which was required to drain into the storm PDC. Further, as itwas common practice by the 1970s to drain eavestrough downspouts over lotsurfaces, it is likely that the majority of residents do not have downspouts thatconnect into the municipal sewer system.
Figure 3: Development history of Sherwood Forest
Adapted from AECOM, 2009
On July 6th, 2009, the City of London, through the Wastewater and DrainageEngineering Division, distributed information packages to residents in the SherwoodForest neighbourhood, which included a letter of explanation, basement floodcommunication materials, a pamphlet on basement flood issues in the City ofLondon and a one-page questionnaire for residents to be mailed back to the City(see Appendix B) (City of London, 2009a). City staff reported that the City received350 responses from this initial survey, generating a response rate of approximately17%. The basement flooding pamphlet mailed with the questionnaire containedinformation on specific homeowner responsibilities for drainage and floodreduction, the importance of lot-level flood mitigation actions, who to contact forflood reduction work, notification of the City’s basement flooding subsidy program,causes of flooding and information on home plumbing and drainage (includingschematics) among other topics (see Appendix C for the brochure).

17
A subsequent mailing on November 26th, 2009 notified and invited Sherwood Forestresidents to a public meeting about basement flooding, held on Dec. 9th, 2009. Thepublic meeting was not associated with an environmental assessment process, andincluded a presentation on basement flooding issues. Included in the presentationwas information on the causes of basement flooding, areas in the City of London thathave experienced basement flooding issues, methods the City was applying toaddress infrastructure, information on the May 28th, 2009 flood event in SherwoodForest, the role of private-side (lot-level) and city infrastructure measures for floodreduction, how residents can reduce basement flooding risk, information on the City of London’s basement flooding grant program and additional sources ofinformation residents could access on basement flood reduction. Approximately 100 residents attended the meeting, representing 73 properties in the SherwoodForest neighbourhood. Further, in 2010 the City of London was engaging residents in the Blanchard Cres. area of Sherwood Forest in a downspout extension pilot, and information on the pilot program was mailed to these residents as well.
2.1.1. Basement flooding grant programThe City of London currently operates a basement flood reduction grant program,entitled the Sump Pump, Sewage Ejector, and Storm Private Drain Connection GrantProgram (City of London, 2010). The program is available to homeowners,condominium corporations and non-profit housing co-operatives that haveexperienced flooding caused by surcharging of sanitary or storm sewers, or are likelyto experience this type of flooding in the future (City of London, 2010). Furthereligibility criteria for homeowners include the existence of weeping tiles that are directlyconnected to the sanitary or storm sewer system, and flooding, erosion or icing issueswhich are a problem on the property. Further, all proper permits and inspections must be secured by the contractor conducting the work (City of London, 2010).
Detached, semi-detached and duplex dwellings are eligible to receive assistance fordisconnection of weeping tiles, installation of sump pumps, construction of a stormprivate drain connection, installation of a full-port, mainline backwater valve and/orinstallation of a sewage ejector system in lieu of a backwater valve. Funding levelsdiffer depending on the characteristics of the home and are provided in Table 2.
Table 2: Basement flood grant program funding for ground-related homes
75% to a maximum of $1,875 for out-of-pocket expenses to disconnect the weeping tiles when they are connected to the main drain inside of the basement
75% to a maximum of $2,650 for out-of-pocket expenses to disconnect weeping tiles when they are connected to the main drain outside the basement
75% to a maximum of $575 for out-of-pocket expenses when a full port type backwater valve is installed in a residential home that already has an approved sump pump
75% to a maximum of $1,525 for out-of-pocket expenses for installation of a sewage ejector and holding tank to dispose of sewage from basement plumbing fixtures in lieu of a full port type backwater valve installed with the sump pump.
75% to a maximum of $3,775 for out-of-pocket expenses for the construction of a storm private drain connection within the City road allowance or with a city easement where the owner extends the storm PDC onto the property and connects it to a catch basin, pumped footing tile water, or both
Source: City of London, 2010; 2009b

18
Condominium corporations and non-profit housing co-operatives may be eligiblefor 75% to a maximum of $2,000 for out-of-pocket expenses for an engineeringreport and costs associated with sump, sewage ejector and/or private drainconnections and 75% of expenses up to $900 per condominium unit for out-of-pocket expenses for lot grading, sump systems and backflow prevention systems(City of London, 2010). Also included on the grant program website is a list of 16 contractors who have attended an information session hosted by the City of London and are aware of the program and its purposes.
From 1994 to 2010, 48 homes in the Sherwood Forest area have receivedassistance from the City’s grant program for the installation of sump pumps,sewage ejectors, storm private drain connections (PDCs) and backwater valves. Of the 48 grant recipients, 41 received assistance for the installation of sumppumps, three received assistance for sewage ejectors and 11 received assistance forthe installation of a storm PDC. One homeowner received assistance for both asump pump and sewage ejector and six homeowners received assistance for both a sump pump and storm PDC installation. Though records of which homeownersreceived assistance for backwater valves were not recorded by the City, all recipientsof grants in 2009/2010 (a total of seven homeowners in the area) would havereceived assistance for the installation of a backwater valve (PersonalCommunication, K. Chambers, Wastewater and Drainage Engineering, City ofLondon, July 15, 2010). Very few London residents received assistance for sewageejectors, as backwater valves are the preferred means of reducing sewer backuprisk. The City only provides assistance for sewage ejectors in extenuatingcircumstances, such as when a homeowner has experienced repeated backwatervalve failures (Personal Communication, K. Chambers, Wastewater and DrainageEngineering, City of London, Jan. 26, 2011).
Of note was the historic progression of the City’s grant program. Originallydesigned to provide a 100% subsidy for flood reduction measures, City staff foundthat contractors were taking advantage of the program through canvassinghomeowners in areas not designated to receive funding. City staff also indicatedthat in some instances the subsidy was being applied to install improper measuresor install measures where they were not necessary. This situation created unduestrain on the subsidy program, and subsequently the grant portion was reduced to50% of the cost of installation of flood related measures. The 50% subsidy,however, was not widely adopted by residents and in August, 2009, the subsidywas increased to 75% of the out-of-pocked expenses for installing risk reducingmeasures. The City of Hamilton has also reported cases where contractors wereaggressively recruiting homeowners to participate in their subsidy program withoutcity encouragement or authorization. Similar to the experience in London, somehomeowners in Hamilton were convinced by contractors to install measures in theirhome that were subsidized through the grant program that may not have reflectedthe needs of particular homes. Further, it was reported that contractors werecanvassing neighbourhoods and misrepresenting themselves as City employees toencourage homeowners to sign up for the grant program, likely to create businessfor themselves (City of Hamilton Media Release, 2010).

19
2.2. Questionnaire administration A self-administered survey method was applied, based on a modified Dillman et al.(2009) Tailored Design Method. Survey delivery was completed June throughSeptember, 2010 by two research assistants. Both research assistants were students atthe University of Western Ontario, specializing in engineering and sociology. Theresearch assistants were provided resources on basement flood reduction and instructedon interview conduct and communication methods with potential respondents. To helpincrease interview responses and to provide homeowners an opportunity to speakdirectly with the research assistants about the content and purpose of the survey,research assistants delivered surveys on evenings and weekends. The questionnaireswere administered through four phases. Phase one included a notification letter sentapproximately one week before survey delivery began, phase two included an initialsurvey drop, where surveys were hand delivered to residences, phase three included a second drop of surveys to residents who did not respond and phase four included a reminder postcard, mailed to the entire survey population.
The first phase of survey administration included the mailing of an initial contact letterto homeowners in the Sherwood Forest neighbourhood (including those who ownedbut did not occupy homes in the neighbourhood). The initial contact letter, mailed toeach potential respondent in early June, 2010, provided a general explanation of theproblem of basement flooding in Canada and identified the study sponsors (theInstitute for Catastrophic Loss Reduction and the City of London). The letter specificallyrequested responses from all recipients, even if they had never experienced basementflooding, and notified that letter recipients would be hand-delivered a basement floodsurvey sometime throughout the summer (see Appendix D).
Several homes in the study area were not owner-occupied. As the address list obtainedfrom the City only included addresses of homeowners, several of the letters went tohomeowners outside of the Sherwood Forest area, and in some cases, outside of theCity of London. Thus, the notification letter requested that land-owners either send theletter to tenants occupying homes in Sherwood Forest or let tenants know about thestudy. Also included in the letter was contact information for both ICLR and City ofLondon Staff and a guarantee that information about their specific home would not bepublished or publicly released.
The second phase of survey administration included hand-delivering of survey packagesto the study population from early June to mid- to late-July. Included in the surveypackages were: A cover letter; a seven-paged, double-sided questionnaire, and; a post-stamped reply envelope. The cover letter and questionnaire are available in Appendix E.Similar to the initial contact letter, the cover letter in the survey package explained thepurpose and goals of the survey study, included contacts for both ICLR and City ofLondon representatives and requested responses from residents even if they had neverexperienced basement flooding. The questionnaire was comprised of close and open-ended questions, and explored the following topics:
• Basement flood experiences;
• The characteristics of respondents’ most recent flood events;

20
• Whether or not respondents had reported their flood to the municipalgovernment or made an insurance claim;
• Perceptions of the likelihood of future flood events;
• Insurance coverage for sewer backup and knowledge of insurance coverage;
• Interactions with municipal urban flood education and mitigation subsidy programs;
• Desire for information on basement flood reduction, and;
• Mitigation options adopted (including backwater valves, foundation draindisconnection and sumps, sewage ejectors and downspout connections).
Photos and descriptions of backwater valves, sump pumps, sewage ejectors anddownspouts were included in the survey to help educate respondents and to assistin their responses to the survey questions (see Appendix E). Also, respondents wereprovided an opportunity to provide general comments on flood issues in Londonthrough an open-ended response section. To ensure repeat surveys were notdelivered to respondents, surveys were marked with a serial number to allowtracing of surveys back to specific properties.
The third phase of survey delivery included a survey re-drop, where a second surveypackage was delivered to those who had not responded to the first survey drop.The re-drop process began in late July, after research assistants had completed thefirst drop to all residences. Similar to the initial survey drop, residents were giventhe opportunity to fill out the questionnaire at the door, or were left with thesurvey package and asked to return the completed questionnaire by mail. Includedin the re-drop survey package was a cover letter, a postage-paid reply envelope anda questionnaire identical to the one included in the first drop. The re-drop coverletter is available in Appendix F. The cover letter notified the recipient that thepackage provided an additional copy of the initial questionnaire, and furtherguaranteed confidentiality for survey responses.
The final phase of administration included the mailing of a reminder/thank youpostcard. The postcard informed recipients that one or two questionnaire packageshad been dropped at their residence sometime during the summer, and served asboth a thank you letter for those who had responded and a final reminder/appealfor a response for those who had not yet responded. The reminder/thank you postcard is available in Appendix G.
2.3. Responses and analysisA total of 674 responses were received, providing a response rate of 32.6%. Four hundred sixty-four (69%) respondents replied to the survey by mail, while 210 (31%) respondents filled out the survey with the research assistant at the doorof their home (Table 3). The vast majority of respondents owned their home (Table4). Data was entered into an excel spread sheet as questionnaires were returned.Data was then organized and transferred into SPSS data files for analysis. In theanalyses of statistical correlations, results in the 95% confidence level (p=0.05) orhigher were considered statistically significant.
Table 3: Response method
n %
Mail 464 69%
Interview 210 31%
Total 674 100%
Table 4: Respondent home tenure
Do you own your home? n %
Yes 590 88%
No 81 12%
No response 3 <1%
Total 674 100%

21
3. Results and discussion
The following sections provide the results and analyses of survey data anddiscussion of findings. The results are largely organized in this section as theyappeared in the questionnaire delivered to residents (Appendix E).
3.1. Flood historyTwo-hundred and nine respondents (31%) reported having experienced basementflooding at some time in the past. Four-hundred and three reported never havingexperienced a flood, while 52 (8%) indicated that they did not know whether ornot their basement flooded in the past (Table 5). Several respondents who did notknow whether or not they had flooded wrote comments on the survey indicatingthat they did not know if their home flooded before they purchased it.
Respondents were not asked directly whether they had experienced sewer backup,overland or infiltration flooding; rather, respondents were asked first to reportwhether or not they had experienced any type of flooding, and whether their mostrecent flood event consisted of clean or sewage water. Respondents were thenasked to indicate the source of the flooding (i.e., how the water entered theirbasement). Respondents had the option of indicating that flood waters enteredtheir homes through the following: Floor drain; Other basement drains (e.g., toilet,sink); Sump pump; Sewer clean out; Cracks in basement floors or walls; The base of the basement wall; Basement window or door, and; Other. Respondents couldalso select a “don’t know” option.
Of the 209 respondents that reported having been flooded in the past, 44 reportedhaving experienced sewage flooding, 120 reported having experienced clean waterflooding and eight reported having experienced both sewage and clean waterflooding during their most recent flood event. Thirty-seven did not indicate whetherthey experienced sewage or clean water flooding (Table 6).
Respondents were asked to report the month and year of their most recent floodevent. One-hundred and seventy-seven respondents with flood histories provided a clear response to this question (see Appendix H). The highest frequency offlooding for respondents occurred in 2008, 2009 or 2010 (Table 7), May, 2009 (37 of 209 flooded respondents, or 18%) and June, 2010 (16 of 209 floodedrespondents, or 8%). A high frequency of flooding for respondents in May, 2009was expected, as a heavy rainfall event in May, 2009 resulted in 47 complaints of basement flooding made to the City from residents in the Sherwood Forestneighbourhood. When categorized by month, the data revealed that most recentflood events reported by respondents occurred in April through June (Figure 4).
Table 5: Flood History
Has your basement ever flooded? n %1
Yes 209 31%
No 403 60%
Don’t know 52 8%
No response 10 1%
Total 674 100%
Table 6: Flooding type and total number flooded
Flooding Type n %1
Sewage only 44 21%
Clean water only 120 57%
Sewage and clean water 8 4%
Did not indicate flooding type 37 18%
Total 209 100%1 Percentage based on total number of those flooded
Table 7: Number of reported mostrecent flood events by year
Month n %
1990 1 0.5%
1992 2 1.0%
1997 3 1.5%
1998 3 1.5%
1999 1 0.5%
2000 7 3.0%
2001 1 0.5%
2002 1 0.5%
2003 2 1.0%
2005 2 1.0%
2006 8 4.0%
2007 8 4.0%
2008 27 13.0%
2009 65 31.0%
2010 46 22.0%
No response 32 15.0%
Total 209 100%

22
Figure 4: Number of reported most recent flood events by month
Table 8 displays the reported sources of clean water flooding. The majority of thosewho experienced clean water flooding (a total of 128) indicated that the watercame from cracks in basement walls or floors (32%), suggesting that theyexperienced infiltration flooding. Further, 22% of those who experienced cleanwater flooding reported that water entered their home through the base of thebasement wall. Amalgamated responses indicated that 44% of those whoexperienced clean water flooding cited infiltration flooding as the source.1 Thesefindings suggest that infiltration flooding is a major source of clean water floodingin the study area. The next most common source of clean water flooding was thebasement window or door, with 20% of clean water flooding respondents reportingthis type of flooding. Thus, though frequent, overland flooding may not be as commonas infiltration flooding.
A portion of clean water flooding respondents reported that flooding entered theirhome through their basement floor drain (19%). Further, 17% of clean water floodrespondents reported that flooding entered their basement through their sumppump. There are several explanations for clean water flooding through floor drainsand sumps, including improper installation and maintenance of flood reductionmeasures. In some cases, sewage backup could have been heavily diluted withgroundwater from foundation drainage or stormwater and thus may have appearedto be clean when backing up through floor drains.
The vast majority of those who experienced sewage flooding reported that thisflooding entered the home through the basement floor drain (81%). This reflectsthe nature of sewer backup flooding, which is likely to enter the home through the lowest elevation drain in the home. Following the floor drain, other basementdrains (e.g., bathroom drains) were cited as frequent sources of sewage flooding. Itis important to note that backwater valves are effective means of reducing theprobability of sewer backup flooding through basement floor drains and other
50%
Jan Feb Mar Apr May Jun Jul Aug Sep Oct Nov Dec
45%
40%
35%
30%
25%
20%
15%
10%
5%
0%
1 Infiltration flooding included flooding that entered the home through the base of the basement wall
or cracks in basement walls and floors.
Table 8: Sources of clean waterflooding
Source of flooding n %1
Floor drain 24 19%
Other basement drains 3 2%
Sump pump 22 17%
Sewer clean out 1 1%
Cracks in basement floors or walls 41 32%
The base of the basement wall 28 22%
Basement window or door 26 20%
Don’t know 11 9%
Other 18 14%
1 Percentage based on a total of 128 reported clean water flood events
Table 9: Sources of sewage flooding
Source of Flooding n %1
Floor drain 42 81%
Other basement drains 7 13%
Sump pump 4 8%
Sewer clean out 3 6%
Cracks in basement floors or walls 4 8%
The base of the basement wall 5 10%
Basement window or door 1 2%
Don’t know 2 4%
Other 2 4%
1 Percentage based on a total of 52 reported sewage flood events

23
basement drains. The sewer clean out is also a common source of sewer backupflooding, and is reflected in results from the survey (Table 9). Interestingly, severalrespondents reported uncommon sources of sewage flooding, including the sumppump (8%), cracks in basement walls and floors (8%) and the base of thebasement wall (10%).
As discussed above, the source of much of the clean water flooding reported byrespondents was infiltration flooding. Further supporting this finding, the majority(24%) of respondents who did not indicate they type of flooding they experiencedreported that flood waters entered their homes through cracks in basement wallsand floors, and 16% reported that flood waters entered their home through thebase of the basement wall (Table 10). However, a considerable portion (21%) ofthese respondents reported that overland flooding entered their home throughbasement windows and doors (Table 10)
3.2. Reporting flooding to city and claiming insuranceAs discussed above, it is important that those who experience urban flooding reportevents to the municipal government, as this information can help municipalitiesidentify risk areas and assist in reducing flood risk for homeowners. Despite theimportance of reporting flood events to municipal governments, it has been foundthat many homeowners do not report these events (City of Hamilton, 2006;Sandink, 2007). Survey results indicate that a considerable portion of SherwoodForest neighbourhood residents have not reported flood events to the City ofLondon. Fifty-six percent of the 52 respondents who reported sewage floodingindicated that they reported their flooding to the City of London. Only 13% ofrespondents who reported clean water flooding reported their flooding to the City(Tables 11 and 12).
Claiming insurance has been one of the most common means of reducing theimpacts of sewer backup damages. For example, in a 2005 survey of residents whoexperienced sewer backup during a severe flood event in Peterborough in 2004,93% of respondents reported claiming insurance for their sewer backup damages(Sandink, 2006). Reliance on or expectation of insurance coverage after a hazardevent may be so strong as to result in a “moral hazard,” where insurance coverage
Table 10: Respondents who did notindicate clean or sewageflooding
Source of Flooding n %1
Floor drain 7 18%
Other basement drains 0 0%
Sump pump 2 5%
Sewer clean out 1 3%
Cracks in basement floors or walls 9 24%
The base of the basement wall 6 16%
Basement window or door 8 21%
Don’t know 4 11%
Other 4 11%
1 Based on 37 respondents who did not indicate whetherthey experienced clean water or sewage flooding
Table 11: Sewage flooding:Respondents who reportedflooding to the city
Reported flooding to the City n %1
Yes 29 56%
No 22 42%
No response 1 2%
Total 52 100%
1 Based on 44 respondents who reported sewage floodingand eight respondents who reported both sewage andclean water flooding
Table 12: Clean water flooding:Respondents who reportedflooding to the city
Reported flooding to the City n %1
Yes 16 13%
No 111 87%
No response 1 1%
Total 128 100%
1 Based on 120 respondents who reported clean waterflooding and eight respondents who reported bothsewage and clean water flooding

24
precludes further action to reduce risk at the individual level (see Section 1.1.).However, survey results in this study indicated that only a portion (52%) ofrespondents who experienced sewage flooding claimed insurance for their mostrecent event (Table 13). A much smaller proportion (20%) of those whoexperienced clean water flooding claimed insurance, likely reflecting the fact thattheir damages would not be covered under conventional home policies (Table 14)(see Section 1.2.).
3.3. Insurance CoverageAs discussed earlier, homeowners can purchase coverage for sewer backup damageunder home insurance policies, generally as an additional endorsement. Previousresearch has indicated that homeowners possess considerable uncertainty abouthome insurance coverage for flooding and sewer backup (ICLR, 2004; Sandink,2007; Sandink et al., 2010). A 2007 study of homeowners in Toronto andEdmonton revealed that 33% of respondents from Edmonton and 38% ofrespondents from Toronto who had experienced sewer backup in the past did notknow whether or not they had insurance coverage for sewer backup (Sandink,2007). These results are reflected in the current study. Of the total of 674respondents in this study, 45% could not report whether or not they had sewerbackup coverage (Table 15).
Table 13: Sewage flooding:Respondents who madean insurance claim
Claimed insurance for flood n %1
Yes 27 52%
No 23 44%
No response 2 4%
Total 52 100%
1 Based on 44 respondents who reported sewage floodingand eight respondents who reported both sewage andclean water flooding
Table 15: Insurance coverage: Total sample
Do you have insurance coverage for sewer backup? n %1
Yes 289 43%
No 75 11%
Don’t know 301 45%
No response 9 1%
Total 674 100%
Table 14: Clean water flooding:Respondents who madean insurance claim
Claimed insurance for flood n %1
Yes 26 20%
No 102 80%
No response 0 0%
Total 128 100%
1 Based on 120 respondents who reported clean waterflooding and eight respondents who reported bothsewage and clean water flooding
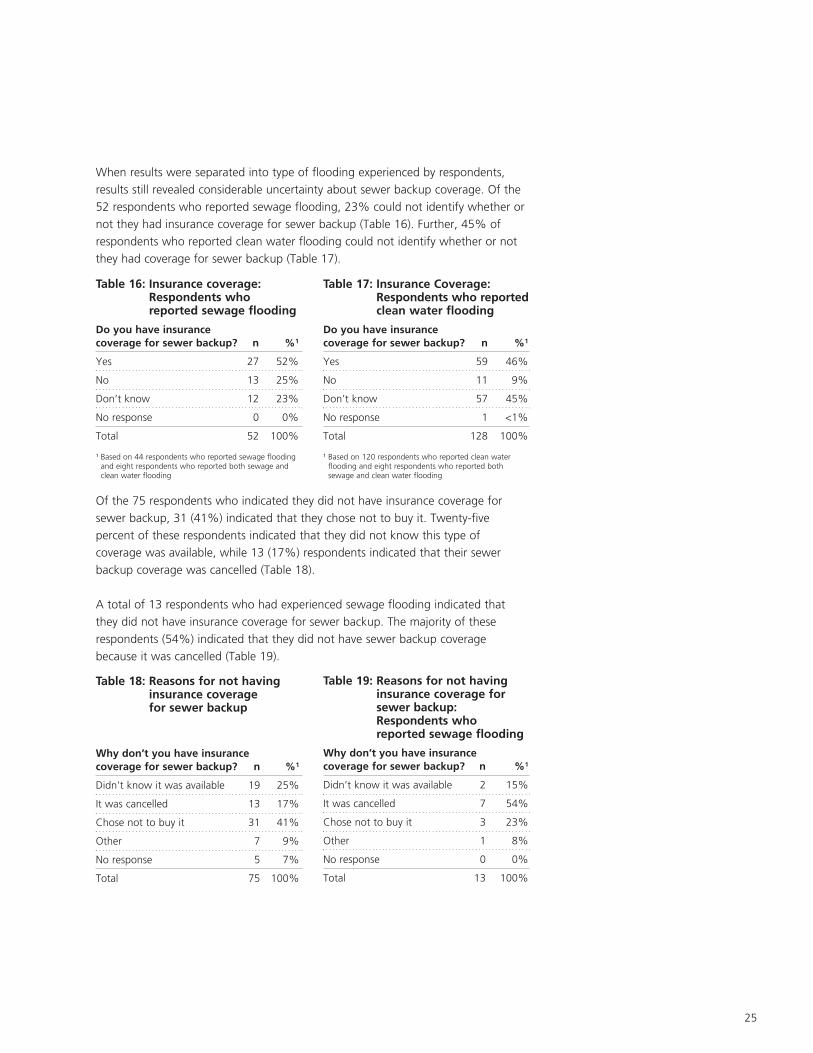
25
When results were separated into type of flooding experienced by respondents,results still revealed considerable uncertainty about sewer backup coverage. Of the52 respondents who reported sewage flooding, 23% could not identify whether ornot they had insurance coverage for sewer backup (Table 16). Further, 45% ofrespondents who reported clean water flooding could not identify whether or notthey had coverage for sewer backup (Table 17).
Of the 75 respondents who indicated they did not have insurance coverage forsewer backup, 31 (41%) indicated that they chose not to buy it. Twenty-fivepercent of these respondents indicated that they did not know this type ofcoverage was available, while 13 (17%) respondents indicated that their sewerbackup coverage was cancelled (Table 18).
A total of 13 respondents who had experienced sewage flooding indicated thatthey did not have insurance coverage for sewer backup. The majority of theserespondents (54%) indicated that they did not have sewer backup coveragebecause it was cancelled (Table 19).
Table 16: Insurance coverage: Respondents whoreported sewage flooding
Do you have insurance coverage for sewer backup? n %1
Yes 27 52%
No 13 25%
Don’t know 12 23%
No response 0 0%
Total 52 100%
1 Based on 44 respondents who reported sewage floodingand eight respondents who reported both sewage andclean water flooding
Table 17: Insurance Coverage:Respondents who reportedclean water flooding
Do you have insurancecoverage for sewer backup? n %1
Yes 59 46%
No 11 9%
Don’t know 57 45%
No response 1 <1%
Total 128 100%
1 Based on 120 respondents who reported clean waterflooding and eight respondents who reported bothsewage and clean water flooding
Table 18: Reasons for not havinginsurance coverage for sewer backup
Why don’t you have insurancecoverage for sewer backup? n %1
Didn’t know it was available 19 25%
It was cancelled 13 17%
Chose not to buy it 31 41%
Other 7 9%
No response 5 7%
Total 75 100%
Table 19: Reasons for not havinginsurance coverage forsewer backup:Respondents whoreported sewage flooding
Why don’t you have insurancecoverage for sewer backup? n %1
Didn’t know it was available 2 15%
It was cancelled 7 54%
Chose not to buy it 3 23%
Other 1 8%
No response 0 0%
Total 13 100%
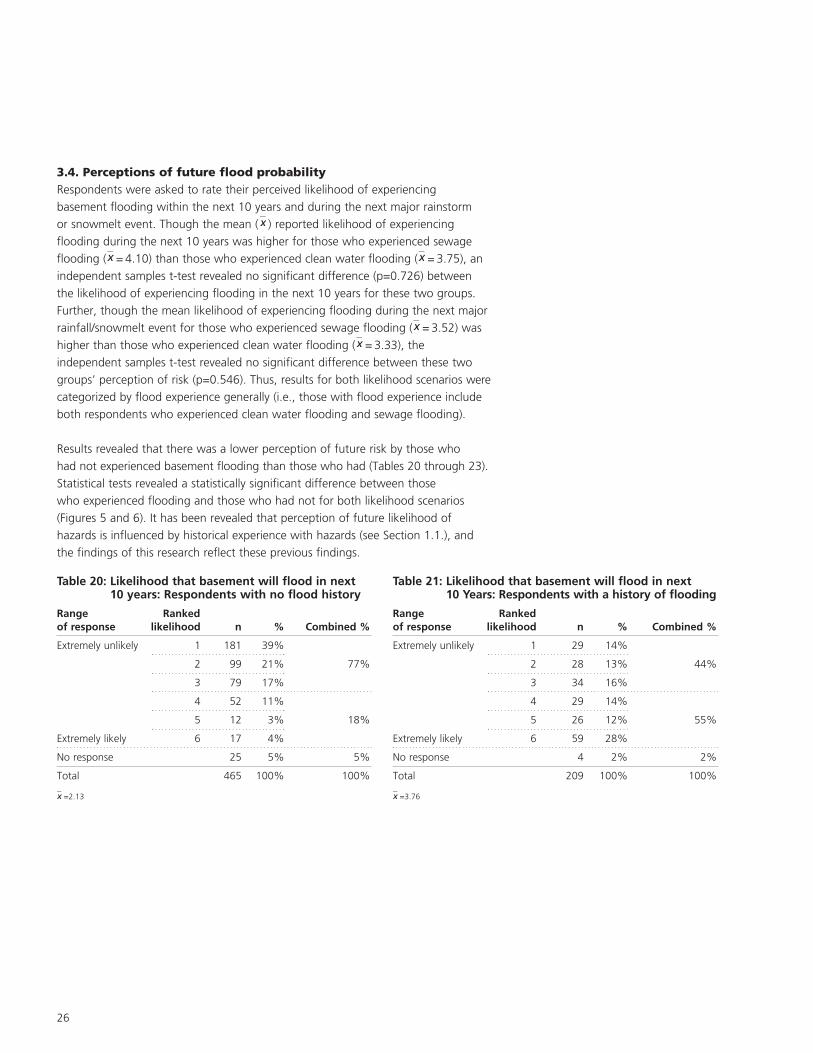
26
3.4. Perceptions of future flood probabilityRespondents were asked to rate their perceived likelihood of experiencing basement flooding within the next 10 years and during the next major rainstorm or snowmelt event. Though the mean ( ) reported likelihood of experiencingflooding during the next 10 years was higher for those who experienced sewageflooding ( = 4.10) than those who experienced clean water flooding ( = 3.75), anindependent samples t-test revealed no significant difference (p=0.726) betweenthe likelihood of experiencing flooding in the next 10 years for these two groups.Further, though the mean likelihood of experiencing flooding during the next majorrainfall/snowmelt event for those who experienced sewage flooding ( = 3.52) washigher than those who experienced clean water flooding ( = 3.33), theindependent samples t-test revealed no significant difference between these twogroups’ perception of risk (p=0.546). Thus, results for both likelihood scenarios werecategorized by flood experience generally (i.e., those with flood experience includeboth respondents who experienced clean water flooding and sewage flooding).
Results revealed that there was a lower perception of future risk by those who had not experienced basement flooding than those who had (Tables 20 through 23).Statistical tests revealed a statistically significant difference between those who experienced flooding and those who had not for both likelihood scenarios(Figures 5 and 6). It has been revealed that perception of future likelihood ofhazards is influenced by historical experience with hazards (see Section 1.1.), andthe findings of this research reflect these previous findings.
Table 20: Likelihood that basement will flood in next10 years: Respondents with no flood history
Range Ranked of response likelihood n % Combined %
Extremely unlikely 1 181 39%
2 99 21% 77%
3 79 17%
4 52 11%
5 12 3% 18%
Extremely likely 6 17 4%
No response 25 5% 5%
Total 465 100% 100%
=2.13
Table 21: Likelihood that basement will flood in next10 Years: Respondents with a history of flooding
Range Ranked of response likelihood n % Combined %
Extremely unlikely 1 29 14%
2 28 13% 44%
3 34 16%
4 29 14%
5 26 12% 55%
Extremely likely 6 59 28%
No response 4 2% 2%
Total 209 100% 100%
=3.76

Figure 5: Likelihood that basement will flood in next 10 Years vs. flood history
t-test, p=0.000
Figure 6: Likelihood that basement will flood during next major rain or snowmelt event vs. flood history
t-test, p=0.000
27
Table 22: Likelihood that basement will flood duringnext major rainstorm or snowmelt event:Respondents who did not report flooding
Range Ranked of response likelihood n % Combined %
Extremely unlikely 1 246 53%
2 108 23% 87%
3 49 11%
4 21 5%
5 12 3% <10%
Extremely likely 6 10 2%
No response 19 4% 4%
Total 465 100% 100%
=1.75
Table 23: Likelihood that basement will flood during next major rainstorm or snowmelt event:Respondents who reported flooding
Range Ranked of response likelihood n % Combined %
Extremely unlikely 1 43 21%
2 34 16% 51%
3 29 14%
4 34 16%
5 27 13% 47%
Extremely likely 6 38 18%
No response 4 2% 2%
Total 209 100% 100%
=3.33
1 2Extremelyunlikely Flood history
Extremelylikely
3 4 5 6
No flood history
35%
30%
25%
20%
15%
10%
5%
0%
40%
1 2Extremelyunlikely Flood history
Extremelylikely
3 4 5 6
No flood history
50%
40%
30%
20%
10%
0%
60%
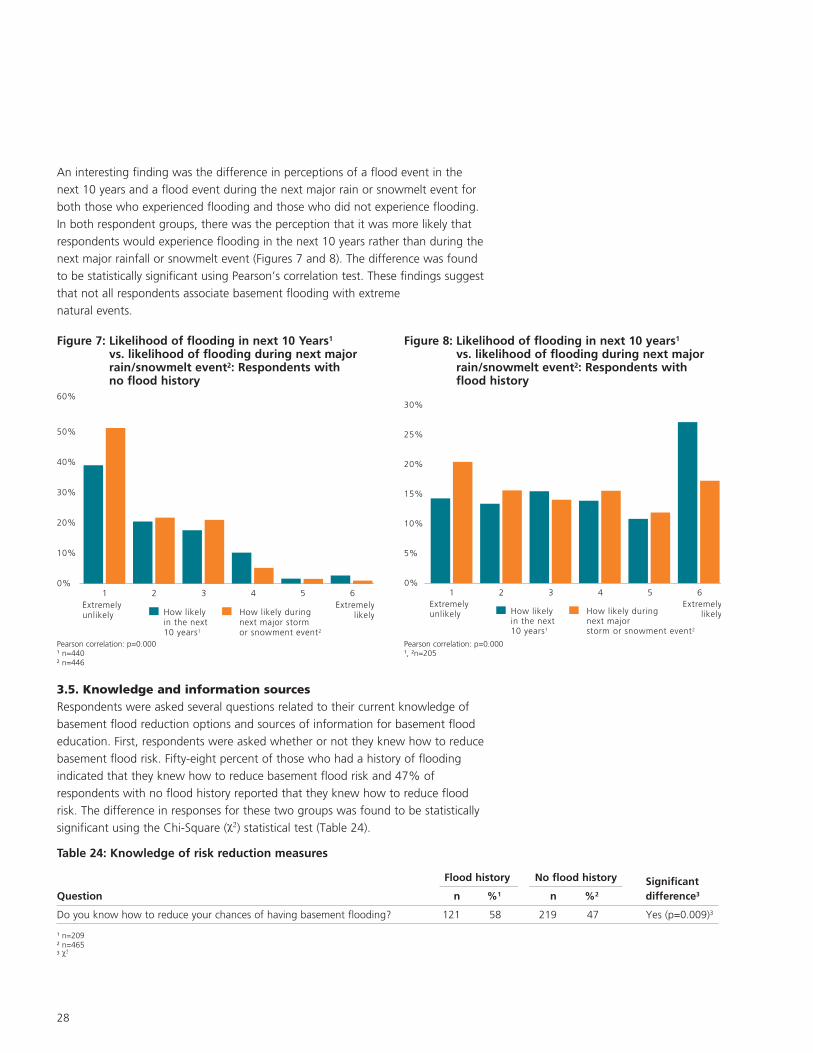
28
An interesting finding was the difference in perceptions of a flood event in the next 10 years and a flood event during the next major rain or snowmelt event forboth those who experienced flooding and those who did not experience flooding.In both respondent groups, there was the perception that it was more likely thatrespondents would experience flooding in the next 10 years rather than during thenext major rainfall or snowmelt event (Figures 7 and 8). The difference was foundto be statistically significant using Pearson’s correlation test. These findings suggestthat not all respondents associate basement flooding with extreme natural events.
1 2Extremelyunlikely How likely
in the next 10 years1
Extremelylikely
3 4 5 6
How likely during next major storm or snowment event2
50%
40%
30%
20%
10%
0%
60%
1 2Extremelyunlikely How likely
in the next 10 years1
Extremelylikely
3 4 5 6
How likely during next major storm or snowment event2
25%
30%
20%
15%
10%
5%
0%
Figure 7: Likelihood of flooding in next 10 Years1vs. likelihood of flooding during next majorrain/snowmelt event2: Respondents with no flood history
Pearson correlation: p=0.0001 n=4402 n=446
Figure 8: Likelihood of flooding in next 10 years1vs. likelihood of flooding during next majorrain/snowmelt event2: Respondents withflood history
Pearson correlation: p=0.0001, 2n=205
3.5. Knowledge and information sourcesRespondents were asked several questions related to their current knowledge ofbasement flood reduction options and sources of information for basement floodeducation. First, respondents were asked whether or not they knew how to reducebasement flood risk. Fifty-eight percent of those who had a history of floodingindicated that they knew how to reduce basement flood risk and 47% ofrespondents with no flood history reported that they knew how to reduce floodrisk. The difference in responses for these two groups was found to be statisticallysignificant using the Chi-Square ( ) statistical test (Table 24).
Table 24: Knowledge of risk reduction measures
Flood history No flood history SignificantQuestion n %1 n %2 difference3
Do you know how to reduce your chances of having basement flooding? 121 58 219 47 Yes (p=0.009)3
1 n=2092 n=4653

29
Table 26: Interactions and knowledge of city programs
Flood history No flood history SignificantQuestion n %1 n %2 difference3
Have read, received, downloaded City of London information? 87 42 137 29 Yes (p=0.002)3
Visited City of London basement flooding webpage? 38 18 25 5 Yes (p=0.000)3
Attended City public meeting? 31 15 23 5 Yes (p=0.000)3
Read other organizations’ material? 7 3 5 1 Yes (p=0.000)3
Heard of City grant program? 82 39 102 22 Yes (p=0.000)3
1 n=2092 n=4653
Previous research has revealed that knowledge and perceptions of hazards can beaffected by length of residence in a hazard prone area (Kreutzwiser et al., 1994;Schiff, 1977). That is, the longer one has occupied a specific neighbourhood orcommunity, the more aware they may be of local hazards. To test this hypothesis,the number of years respondents had occupied their current home was testedagainst whether or not they knew what to do to reduce basement flooding risk. A total of 648 respondents indicated on the questionnaire both how many yearsthey had lived in their residence and whether or not they knew what to do toreduce basement flooding risk. The results of the test are presented in Table 25.The hypothesis was proven to be correct, as there was a statistically significantdifference between the number of years lived in the residence of respondents andwhether or not they knew what to do to reduce the risk of basement flooding. The average number of years the respondents lived in their current home and whoindicated they knew what to do to reduce risk was 13.2, while the average numberof years of residence for those who did not know what to do was 9.9 (Table 25).
Forty-two respondents who had historical flooding reported having read, receivedor downloaded information from the City of London and 29% of respondents whodid not report flooding read, received or downloaded City of London information(Table 26). The relatively low frequency of having read City of London basementflooding information is interesting, as an informational brochure was mailed alongwith a one page questionnaire to all homes in the Sherwood Forest neighbourhoodin the summer of 2009 (see Section 2.1.).
A relatively low proportion of respondents reported having accessed the City ofLondon’s basement flooding webpage, with 18% of those with a history offlooding and 5% of those with no history of flooding having reported this action(Table 26). A combined total of 54 respondents reported having attended a City ofLondon public meeting (8% of the total sample of 674 respondents). When brokendown in terms of flood history, 15% of respondents with a history of flooding and 5% of respondents with no flood history reported having attended a City ofLondon public meeting. Very few respondents read information produced byorganizations other than the City of London. Considering the low responses forvisiting the City of London’s basement flooding webpage, a relatively high numberof respondents reported having known about the City’s basement flood grantprogram, as 39% of those with a history of flooding and 22% of those with noflood history reported having known about the program (Table 26).
Table 25: Years lived in residence vs. know what to do toreduce basement flood risk
Mean yearsKnow how lived into reduce risk? residence n
Yes 13.2 333
No 9.9 315
2-Tailed Independent Samples t-test: p=0.000

30
A relatively high proportion of respondents were interested in receiving moreinformation on basement flood reduction. Sixty-seven percent of respondents witha history of flooding indicated that they would be interested in receiving moreinformation and 56% of respondents with no flood history indicated an interest inreceiving more information (Table 27). From the total sample of 674, 401 (60%)indicated that they would like more information about basement flooding. Themajority of these respondents indicated that they would prefer information onlyfrom the City of London (Table 28). No respondents preferred information onlyfrom their insurer or insurance broker, while 123 respondents indicated that theywould like information from both their insurer or insurance broker and the City of London (Table 28).
A further break-down of information preference results indicates that “handbooksthat tell one everything about basement flooding” and “pamphlets and brochuresmailed to my home” by the City were the most popular measures (Figure 9 andTable 29). Websites were also a popular measure, with 45% of respondentsindicating that they would like to receive information about basement floodingthrough City websites. This is an interesting if somewhat contradictory finding, asvery few respondents have reported accessing the City’s existing website onbasement flooding. Public meetings, newspaper ads and TV ads were among theleast popular measures, especially if only provided through insurers (Figure 9 andTable 29).
Figure 9: Preferred information dissemination method
Table 27: Interest in receiving more Information about basement flooding
Flood history No flood history SignificantQuestion n %1 n %2 difference3
Interested in receiving more information about basement flood reduction? 141 67 260 56 Yes (p=0.004)3
1 n=2092 n=4653
Table 28: Preferred informationsources
Information source n %1
City of London 276 69%
Insurer or insurance broker 0 0%
Both insurer and City 123 31%
No response 2 <1%
Total 401 100%1 n=401
Handbook Pamphletsandbrochuresmailed
Websites Somebrochues
Publicmeetings
Newspaperads
Televisionads
CityInsurer
50%
40%
30%
20%
10%
0%
60%
70%

31
3.6. Structural mitigation measuresStructural mitigation measures that reduce the risk of sewer backup were the focusof this study. To simplify the survey and increase response rates, respondents wereasked only about backwater valves, sump pump systems, sewage ejectors anddownspout connections. Respondents were also asked whether they wereresponsible for installation of backwater valves, sump pumps and sewage ejectorsor if these features were already in the home when they moved in. Further,respondents were asked to indicate if they installed the measures themselves, if they hired a licensed plumber or contractor for installation, or if they hiredsomeone but did not know their qualifications. Considering the potential complexityof home plumbing systems and the requirement for permits for proper installation,professional installation by a licensed plumber or contractor is ideal. Indeed, in many cases, municipal subsidy programs require professional installation of mitigation measures before funds are disbursed, and professional installation is required by many insurers to retain coverage, increase caps and/or reducepremiums after a sewer backup event.
A total of 223 respondents (35%) reported having a backwater valve, sump pumpsystem or sewage ejector system in their home. The vast majority (594 or 88%) ofrespondents indicated that their downspouts were not connected into the municipalsewer system. The high frequency of this adjustment reflects the relative newness of the developments in the neighbourhood, as the homes were built after it wascommon practice to drain downspouts over the surface of lots rather than into themunicipal sewer system. Twenty-six respondents reported that their downspoutswere connected into the municipal sewer system.
Table 29: Preferred information sources
Information provider Information medium n %1
City of London Pamphlets and brochures mailed to home 244 61%
Some brochures that tell me a few different things about basement flooding 148 37%
One handbook that tells me everything about basement flooding 275 69%
Websites 182 45%
Newspaper advertisements 63 16%
TV commercials 59 15%
Public information meetings and open houses 79 20%
Insurance company or broker Pamphlets and brochures mailed to home 66 16%
Some brochures that tell me a few things about basement flooding 41 10%
One handbook that tells me everything about basement flooding 74 18%
Websites 46 11%
Newspaper advertisements 15 4%
TV commercials 16 4%
Public information meetings and open houses 11 3%
Other 15 4%1 n=401

32
3.6.1. Backwater valvesEighty-six (13%) respondents reported having a backwater valve in their home.Thirty-three (16%) of the 209 respondents who reported flooding in the pastreported the adoption of backwater valves. A considerable proportion ofrespondents (32%) could not indicate whether or not they had a backwater valvedespite photographs and explanations of backwater valves in the questionnaire (seeAppendix E), suggesting a considerable amount of public uncertainty about thisadjustment. However, given the current perception literature, this uncertainty is notcompletely unexpected and, in fact, mirrors uncertainty about sewer backupinsurance (see Table 30).
When responses were categorized into flood history, the data revealed that 33% of respondents who have never experienced basement flooding could not indicatewhether or not they had a backwater valve, while only 8% of respondents whohave experienced sewer backup in the past could not indicate if they had abackwater valve. This finding reflects previous research that associates hazardexperience with hazard knowledge.
Knowledge of having a backwater valve in the home was tested against the number of years respondents occupied their current homes. In this case, the numberof years respondents occupied their current homes was not statistically correlated to knowledge of whether or not backwater valves were in respondents’ homes (Table 31), suggesting that residents who have occupied their home for a greaterperiod of time were no more aware of this adjustments than new residents.
The majority of respondents (66%) who reported the existence of a backwater valvein their home indicated that it was already installed when they moved in, while only23% of those with a backwater valve indicated that they were responsible for itsinstallation (Table 32). If this finding is extended to the entire sample, only 3% ofrespondents (n=674) chose to install a backwater valve themselves. However, 75%of those who were responsible for the installation of their backwater valve hired aprofessional plumber for installation, which is a positive finding (Table 33).
Table 30: Total responses: Backwater valve
Have backwater valve? n %
Yes 86 13%
No 365 54%
Don’t know 214 32%
No response 9 1%
Total 674 100%
Table 31: Years lived in residence vs. knowledge of whether or not a home had a backwater valve
Know if a Mean yearsbackwater valve lived inis in the home residence n
Yes1 11.9 442
No2 11.1 210
1 Includes respondents who responded “yes” or “no” to:Does your home have a backwater valve?
2 Includes respondent who responded “don’t know” to:Does your home have a backwater valve?
2-Tailed Independent Samples t-test: p=0.288
Table 32: Responsibility forbackwater valve installation
n %
I was responsible 20 23%
It was already installed when I moved in 57 66%
No response 9 10%
Total 86 100%
Table 33: Who installed backwater valve?
n %
Installed myself 3 15%
Hired plumber 15 75%
Hired contractor 1 5%
Hired someone but didn’t know their qualifications 1 5%
Total 20 100%

33
The greatest proportion of those who had a backwater valve in their homeconsisted of those who experienced sewage flooding in the past (37%). Twelvepercent of those who experienced clean water flooding had a backwater valve intheir home, while 11% of those who did not experience flooding had a backwatervalve in their home (Table 34).
Statistical tests revealed that, while having a backwater valve in one’s home was notcorrelated with uncategorized flood history (Table 35), there was a statisticallysignificant correlation between sewage flooding experience and having a backwatervalve (Table 36).
3.6.2. Sump pumpsThirty-six percent of respondents reported having a sump pump in their home and67% reported that there was no sump pump in their home (Table 37). A smallproportion of respondents (5%) could not identify whether or not a sump pumpwas in their home. The number of respondents who could not identify whether ornot a pump was in their home was considerably lower than the counterpart groupfor backwater valves, likely because sump pumps are highly visible in basementfloors. As displayed in Figure 3, sump pumps were incorporated into new homesafter 1985. Of the 174 respondents who reported that they had a sump pump in their basements, approximately 110 were from the area of Sherwood Forest thatwas built after 1985.
Respondents were asked to identify where their sump pump drained. In SherwoodForest, the majority of homes do not have storm PDCs. Thus, in the majority ofcases, if a sump is installed in the home the discharge should be drained over thesurface of the lot. However, as discussed in Section 2, homes built after 1995 wererequired to drain sump pumps into a storm PDC. A total of 10 respondentsoccupied the area of Sherwood Forest that was developed after 1995, and two ofthese respondents reported that their sump pump drained onto the surface of theirlot. Further, homes that have received assistance through the City’s basement
Table 34: Backwater valve in home by type of flood and flood history
Type of flooding n %
Sewage 19 37% (out of 52 respondents)
Clean water 15 12% (out of 128 respondents)
Did not indicate type of flooding 3 8% (out of 37 respondents)
No flooding 53 11% (out of 465 respondents)
Table 35: Flood history vs. havebackwater valve
Have backwater valve
Flooded Yes No
Yes 33 110
No 53 255
, p=0.090 (not statistically significant)
Table 36: Type of flooding vs. havebackwater valve1
Have
Clean orbackwater valve
sewage flooding Yes No
Clean 11 62
Sewage 15 21
, p=0.0031 Includes only respondents who clearly identified that theyhad either sewage flooding or clean water flooding andwhether or not they had a backwater valve
Table 37: Total responses: Sump pump
Have a sump pump? n %
Yes 174 26%
No 454 67%
Don’t know 35 5%
No response 11 2%
Total 674 100%

34
flood grant program may have sump pumps that drain into storm PDCs. However,only three respondents who reported that they had a sump pump connected intothe municipal sewer system also reported that they had received assistance throughthe City’s grant program.
The majority (59%) of respondents who had a sump in their home indicated thatthe pump discharge drained over the surface to their lot outside of their home(Table 38). Thirteen percent (n=23) of those who had a sump indicated that itdrained into their sewer connection. Considering only three respondents who’ssump pumps drained into their sewer connection have received assistance throughthe City’s basement flooding grant program, and considering only eight residentswho responded from the area built after 1995 likely have sumps that drain intostorm PDCs, it is possible that many of these 23 homeowners’ sumps do not draininto the storm sewer. Five respondents who had sumps (3%) reported that theirsumps drained into their laundry tub or other internal plumbing. Draining intointernal plumbing and laundry tubs essentially negates the purpose of having asump pump system for foundation drainage, as water that drains into laundry tubs orother internal plumbing will continue to enter the municipal sanitary sewer system.
Respondents who had sump pumps in their homes were asked if the sump systemwas installed in their home when they moved in or if they were responsible for theinstallation of the sump. The vast majority of those who had sumps (85%) reportedthat the sump was already installed when they moved into their homes. Only 18 (10%) respondents reported that they were responsible for sump installations(Table 39).
The 18 respondents who were responsible for the installation of their sumps wereasked to indicate who installed their sump system. Most of these respondents(61%) reported having hired a professional plumber to install the sump (Table 40).
Table 38: Where does your sump pump drain?
n %
Surface of ground outside home 103 59%
Into sewer connection 23 13%
Into laundry tub or other plumbing 5 3%
Don’t know 31 18%
Other 6 3%
No Response 6 3%
Total 174 100%
Table 39: Responsibility for sumppump installation
Who was responsible? n %
I was responsible 18 10%
Already installed when I moved in 148 85%
No response 8 5%
Total 174 100%
Table 40: Who installed sump pump?
Who installed pump? n %
Installed myself 4 22%
Hired plumber 11 61%
Hired contractor 2 11%
Hired someone but didn’t know their qualifications 1 6%
Total 18 100%

35
There existed a statistically significant relationship between having been flooded inthe past and having a sump in the home (Table 41). This relationship likely resultsfrom the fact that several homeowners experienced flooding from their sumppump. However, there was no relationship between type of flooding respondentsexperienced (clean or sewage flooding) and having a sump in their home (Table 42).
3.6.3. Sewage ejectorsVery few respondents (1%) reported having a sewage ejector system in their home(Table 43). This is not surprising, as the City only subsidizes the installation ofsewage ejectors where backwater valves are not viewed as appropriate. Indeed,from 1994 to 2010, only three homes in the Sherwood Forest neighbourhoodreceived financial assistance from the City to install a sewage ejector system in placeof a backwater valve (see Section 2.1.1.).
Of the 10 respondents who reported having a sewage ejector system, only tworeported that they were responsible for its installation. Seven reported that thesystem was already in the home when they moved in (Table 44).
Of the two respondents who reported that they were responsible for installing theirsewage ejector system, one reported having hired a professional plumber and onereported having hired a professional contractor to install the system. Only threerespondents who had a sewage ejector system reported having experiencedbasement flooding in the past. Of those three respondents, two reported sewageflooding and one reported both overland and sewage flooding. All threerespondents experienced flooding in 2009 and 2010.
Table 41: Flood history vs. have sump
Have sump
Flooded Yes No
Yes 73 125
No 85 291
, p=0.000
Table 42: Type of flooding vs. have sump
Have sump
Flooded Yes No
Clean water 48 73
Sewage flooding 16 24
, p=0.557 (not statistically significant)
Table 43: Total responses: Sewage ejector
Have sewage ejector system? n %
Yes 10 1%
No 519 77%
Don’t know 132 20%
No response 13 2%
Total 674 100%
Table 44: Responsibility for sewageejector installation
n %
I was responsible 2 20%
It was already installed when I moved in 7 70%
No response 1 10%
Total 10 100%

36
3.6.4. Downspout connectionsThe vast majority of respondents (88%) reported that their downspouts were notconnected into the municipal sewer system (Table 45). As discussed above, thisfinding reflects the relative newness of developments in the Sherwood Forestneighbourhood. Some respondents reported that, though their downspouts enteredthe ground, they were not connected into the municipal sewer system and wererouted toward other parts of their properties. As downspouts in the area were notconnected to the municipal sewer system as a matter of development design, it wasexpected that downspout connection would not have been correlated to floodhistory or flood type. Indeed, there was no statistical relationship found betweenflood history and type of flooding experienced and having one’s downspoutsconnected to the municipal sewer system (Tables 46 and 47).
3.7. Correlations: Responsible for adjustments vs. flood history and flood type
Of the 223 respondents who reported having a backwater valve, sump or sewageejector in their homes, 32 reported that they were responsible for having installedany one of these items at their particular home. It was expected that beingresponsible for installation of various flood reduction measures would have a strongcorrelation with flood history and flood type. Indeed, a strong statistical correlationwas found between flood history and being responsible for the installation of floodreduction measures (Table 48) and type of flooding experienced and beingresponsible for the installation of flood reducing measures (Table 49).
Those who experienced sewage flooding were far more likely to take action bybeing responsible for flood reduction measure installation than those whoexperienced clean water flooding (Table 49). It has been found through previoussurveys that residents have a stronger negative reaction to sewage flooding than to clean water flooding (UMA, 2005). It has also been argued that sewer backup is viewed as a technological hazard rather than a natural hazard, and overland andinfiltration flooding tend to be perceived as natural hazards (Baum et al., 1983;Sandink, 2006). Thus, those who experience sewer backup may be more willing toemploy technological measures to reduce their risk than those who experience cleanwater flooding. Further, natural hazards may be perceived as “uncontrollable”forces of nature (Baum et al., 1983; Mileti, 1999; Wong & Zhou, 2001) and resultin a lower willingness of individuals to take action for the reduction of risk. Thus,the finding that a higher proportion of respondents who experienced sewageflooding were responsible for the adoption of adjustments has some precedent in the literature.
Table 45: Total responses:Downspout connection
Is your downspout connected into the municipal sewer system? n %
Yes 26 4%
No 594 88%
Don’t know 47 7%
No response 7 1%
Total 674 100%
Table 46: Flood history vs.downspout connections
Downspout connected to municipal system?
Flooded? Yes No
Yes 7 182
No 16 365
, p=0.487 (not statistically significant)
Table 47: Type of flooding vs.downspout connections
Downspout connected to municipal system?
Flooded? Yes No
Clean water 3 114
Sewage flooding 2 37
, p=0.599 (not statistically significant)
Table 48: Flood History vs.responsible for backwatervalve, sump or sewageejector installation
Responsible for mitigation
Flooded? Yes No
Yes 26 56
No 4 107
, p=0.000
Table 49: Type of flooding vs.responsible for backwatervalve, sump or sewageejector installation
Responsible for mitigation
Type of flooding Yes No
Clean 9 44
Sewage 12 7
, p=0.000

37
Statistically significant relationships were found both between perceptions oflikelihood of experiencing flooding in the next 10 years and during the next majorrainfall event and having adopted various flood adjustments on one’s own (Tables50 and 51). This finding is not surprising, as perceptions of risk of experiencingfuture events have been associated with the adoption of adjustments in otherstudies (Penning-Roswell, 1976; Preston et al., 1983; Sandink, 2007).
3.8. Applications for the subsidy programRespondents who were responsible for the installation of a backwater valve, sump pump or sewage ejector were asked to indicate whether or not they appliedfor the City of London’s Basement Flooding Grant Program and whether or notthey received funding through the program. Overall, 14 (2%) of the total of 674 respondents reported having applied for the grant program in the past. Sixrespondents with a history of flooding reported having applied for the program, all of whom had experienced flooding from sewage in the past (Table 52). Most of the respondents who reported having made an application program reportedreceiving financial assistance (Table 53).
Table 50: Responsible foradjustment1 vs. how likelyin next 10 years?
How likely in
Responsible next 10 years
for adjustment? x n
Yes 3.55 29
No 2.63 175
Independent samples t-test, p=0.0071 Respondent was responsible for installation of abackwater valve, sump pump or sewage ejector system
Table 51: Responsible foradjustment1 vs. how likelyduring next major event?
How likelyduring next
Responsible major event?
for adjustment? x n
Yes 2.29 32
No 2.20 179
Independent samples t-test, p=0.0141 Respondent was responsible for installation of abackwater valve, sump pump or sewage ejector system
Table 52: Respondents who applied for grant program
n %
Total Sample 14 2% (out of 674 respondents)
Respondents with flood history 6 3% (out of 209 respondents)
Sewage flood respondents 6 12% (out of 52 respondents)
Table 53: Respondents who received assistance from the grant program
n %
Total sample 12 86% (out of 14 respondents, carriedfrom previous table)
Sewage flood respondents 4 67% (out of 6 respondents, carriedfrom previous table)

38
3.9. Open ended responsesAt the end of the questionnaire, respondents were invited to provide comments onanything related to basement flooding in the City of London. A total of 108 open-ended responses were received and are provided in Appendix I. A short summary ofkey findings from the open-ended responses is provided here.
A review of the open-ended responses revealed several main themes, including:
• Comments and concerns surrounding insurance coverage;
• Comments on the role and responsibility of the City of London in basementflooding, including comments on the capacity and design of sewerinfrastructure, perceived poor planning decisions made by the City and requestsfor compensation from the City;
• The perceived role of increased development in and around the Sherwood Forestneighbourhood as a factor in increased flood risk, and;
• Comments on the perceived attitude of the City toward residents in theoccurrence of basement flooding.
Further, the open-ended question was used by many respondents as an opportunityto request specific information on their homes for basement flood reduction or oncity programs. When specific information was requested, surveys were forwarded tothe City of London for follow-up.
Several respondents used their open-ended response as an opportunity to makecomments regarding insurance coverage, including concerns regarding increasedpremium prices for sewer backup coverage and dropped sewer backup coverage.For example, a respondent reported that their “sewer backup insurance coveragehas been dropped” and another reported that their “insurance rates have gone updramatically due to flooding.” Despite these concerns, survey results indicated thatmost residents in the Sherwood Forest neighbourhood have not experienced sewerbackup coverage cancellation, though no questions regarding changing nature ofcoverage (e.g., increased premiums, caps, etc.) were included in the survey. It ispossible that a larger number of respondents experienced changes in the nature oftheir sewer backup coverage than cancellation of sewer backup coveragealtogether.
Twenty-nine (27%) of the 108 open-ended responses included comments regardingthe responsibility of the City of London for both flood risk and solving flood riskproblems. These responses often included comments on the perceived inadequacyof sewer infrastructure. For example, one respondent commented that “the cityshould be taking care of infrastructure as top priority to prevent basementflooding,” and another commented that “the problem is inadequate sewer/sanitarylines for the area….” Some respondents felt that flooding problems were a result ofboth inadequate sewer infrastructure and increased development in the area,exemplified by one respondent who reported that the “city needs to build a biggersewer pipe; stop home construction until then” and another respondent requestedthat the City “stop allowing houses to be built unless [the City is] prepared toincrease the size of the sewage system.”

39
There were several comments about the perceived role of increased development in and around the Sherwood Forest area and increased flood risk. One respondentstated: “From 1985 to 1999, no floods… from 2000 to 2009, 9 floods – way morehouses…”. The following represent further respondent comments on the topic ofperceived over-development:
• “The excess water in our backyards (Brandy Lane Crt) is a direct result of thecompletion of Aldersbrook Rd. (18 years ago).”
• “In 20 years we have never had a basement flooding issue. Has thedevelopments to the west tied into the storm water system [caused] the recentneighbourhood problems?”
• “Happens two times and the City do nothing to solve the problems – there arenow too many new houses linked to this system in my street.”
• “When we purchased our home fifteen years ago the issue or concern offlooding did not come up. Now there has been considerable development in ourarea and we are noticing more problems with standing water, slow waterdrainage on our street and water in our basement.”
• “We were OK until additional subdivisions were built all around us.”
There were also comments about the perceived attitude of the City of Londontoward homeowners on the issue of basement flooding. For example, onerespondent reported that “when [they] attended [a] meeting [they] felt that the City kept cutting people off when voicing their concerns. They only seemed to pushback responsibility to the homeowner…” There were also some comments aboutthe adequacy of the City’s subsidy program, including one respondent whoreported that they “used the City's Grant program, but it was difficult – took 2 triesto get the money. Hope that it won't be used against you. Too little, too late. TheCity should have acted years ago.”
Of note was a respondent who reported that they had newly arrived in Canada,and did not have a complete understanding of home plumbing systems and home maintenance practices, as they were considerably different than in theiroriginal country. The respondent reported that “we need a program to introducehow everything in house works in this type of weather.” Some respondents voicedconcern that flood reduction measures installed in homes will decrease resalevalues. Concerns about sump pumps, including their capacity to handle heavyflows, the impact of power failure, and concerns that battery backup systems wouldnot have the capacity to continue running during a heavy rainfall event were alsoreported by respondents.

40
4. Summary, implications and conclusions
This section provides a summary of the major findings of the study, followed by adiscussion of implications of the findings. Recommendations are provided in tandemwith the implications. Recommendations relate directly to the City of London,municipalities in general and to the insurance industry. A conclusion is thenprovided for this study, including recommendations for further study.
4.1. Summary of findings1. Summary of questionnaire administration findings:
a. The survey methods applied for this project yielded a response rate of 32.6%.This is considered to be good, as a similar survey using less intensivedistribution methods mailed to each homeowner in the study area theprevious summer yielded a response rate of 17%.
b. Most respondents chose to fill out and mail back their survey rather than fill itout with the research assistant.
2. Summary of flood history findings:
a. A total of 209 respondents reported that their basement had flooded at sometime in the past. Fifty-two respondents could not indicate whether or nottheir basement had flooded in the past.
b. A significant portion of flooded respondents reported flooding in May, 2009and June 2010. The majority of flooding events were reported to haveoccurred in April, May and June.
c. The majority of respondents who reported clean water flooding indicated thatflooding entered their homes through cracks in basement walls and floorsand through the base of basement walls, indicating that infiltration floodingcaused the majority of clean water flood events for the study sample.
d. Twenty-four percent of respondents who did not indicate whether they hadclean or sewage flooding indicated that water entered their home throughcracks in basement walls and floors.
e. Twenty percent of clean water flooded respondents reported that floodwaters entered the home through basement windows and doors, while 19%indicated that clean water entered the home through the floor drain and17% indicated that water entered the home through the sump pump.
f. Eighty-one percent of those who reported sewage flooding indicated thatsewage entered their home through the floor drain. The next most commonsource (13%) was other basement drains. Five respondents reported thatsewage water entered their home through the base of the basement wall.
3. Summary of findings, reporting flooding to City and claiming insurance:
a. A significant proportion (42%) of respondents who reported sewage floodingindicated that they did not report their flood event to the City of London.
b. The majority (87%) of respondents who reported clean water flooding didnot report their flood event to the City.

41
c. Fifty-two percent of respondents who experienced sewage flooding claimedinsurance for their flood event, and 20% of respondents who experiencedclean water flooding claimed insurance for their most recent event.
4. Summary of findings, insurance coverage:
a. Forty-three percent of respondents reported that they had insurance coveragefor sewer backup, and 11% indicated that they did not have insurancecoverage for sewer backup.
b. The majority of respondents (45%) could not indicate whether or not theyhad insurance coverage for sewer backup.
c. When responses were separated in terms of flood history, it was revealed thata greater proportion of respondents with a sewage flood history (77%) couldindicate whether or not they had insurance, however, 23% of theserespondents did not know whether or not they had insurance coverage forsewer backup.
d. Forty-five percent of respondents who reported clean water flooding couldnot indicate whether or not they had insurance coverage for sewer backup.
e. Most respondents (41%) who indicated that they did not have insurancecoverage for sewer backup indicated that they chose not to buy sewerbackup coverage.
f. A total of 13 respondents indicated that their sewer backup coverage wascancelled.
g. Seven (54%) of the 13 respondents who reported sewage flooding andreported that they did not have sewer backup insurance coverage reportedthat their sewer backup insurance coverage was cancelled.
5. Summary of results, perceptions of the likelihood of future flooding events:
a. The majority of respondents who had no flood history (77%) felt that it wasunlikely that they would experience flooding in the next 10 years. Further,87% of these respondents felt that it was unlikely that they would experienceflooding during the next major rainstorm or snowmelt event.
b. Fifty-five percent of respondents who experienced flooding in the pastindicated that it was likely that they would experience flooding again at sometime over the next 10 years, and 28% of these respondents felt that it was“extremely likely” that they would experience flooding again in the next 10 years.
c. Forty-seven percent of respondents who experienced flooding in the pastreported that it was likely that they would experience flooding again duringthe next major rainstorm or snowmelt event, and 18% of these respondentsfelt it was “extremely likely” that they would experience flooding during thenext major rainstorm or snowmelt event.
d. Results indicated that, generally, respondents felt it was more likely that theywould experience flooding over the next 10 years than during the next majorrainstorm or snowmelt event.

42
6. Summary of results, knowledge and information sources:
a. Fifty-eight percent of those with a history of flooding and 47% of those withno flood history reported that they knew how to reduce their chances ofhaving basement flooding. The difference between these two groups wasstatistically significant.
b. Results indicated that those who occupied their current homes for a longerperiod of time were more likely to know what to do to reduce the risk ofbasement flooding in their homes.
c. Forty-two percent of respondents with a history of flooding and 29% ofrespondents with no flood history reported having read, received ordownloaded City of London information on basement flooding.
d. Eighteen percent of respondents with a history of flooding and 5% ofrespondents with no flood history reported having visited the City ofLondon’s basement flooding webpage.
e. Fifteen percent of respondents with a history of flooding and 5% ofrespondents with no flood history reported having attended a City of Londonpublic meeting on basement flooding.
f. Thirty-nine percent of respondents with a history of flooding and 22% ofrespondents with no flood history reported having heard about the City’sbasement flooding grant program.
g. Sixty-seven percent of respondents with a history of flooding and 56% ofrespondents with no flood history were interested in receiving moreinformation of basement flood reduction.
h. Of the respondents who reported that they would like to receive moreinformation about basement flooding, most indicated that they would like toreceive this information from the City of London. No respondent indicatedthat they would like to receive information only from their insurance provideror insurance broker.
i. Preferred methods for receiving information included a single handbook thatdescribes everything about basement flood reduction, brochures andpamphlets mailed to the respondents’ homes, and websites. Respondentspreferred that this information be provided by the City.
7. Summary of results, structural mitigation measures:
a. 35% of respondents reported having a backwater valve, sump pump and/orsewage ejector.
b. Eighty-six respondents reported having a backwater valve in their home.Twenty (23%) of these respondents indicated that they were responsible forthe installation of the backwater valve, and 66% of these respondentsreported that the backwater valve was already in their home when theymoved in.
c. A considerable proportion of respondents (32%) could not indicate whetheror not they had a backwater valve in their home.

43
d. A greater proportion of those who experienced sewage flooding had abackwater valve in their home compared to those who experienced cleanwater flooding.
e. One-hundred and seventy-four respondents reported that they had a sumppump in their home. Only 5% of respondents could not indicate whether or not there was a backwater valve in their home.
f. Most respondents who had a sump pump (59%) reported that the pumpdrained on the surface of the ground outside of their home. However, 13% of these respondents indicated that their sump pump drained into theirsewer connection.
g. Only 10% of those who had a sump pump in their home were responsiblefor its installation.
h. Very few respondents reported having a sewage ejector in their home, and20% of respondents could not indicate whether or not there was an ejectorin their home. Only two respondents reported having been responsible forthe installation of their sewage ejector system.
i. Most respondents who were responsible for the installation of a backwatervalve, sump pump or sewage ejector reported having hired a professionalplumber or contractor for installation.
j. Eighty-eight percent of respondents reported that none of their downspoutswere connected into the City sewer system.
8. Summary, factors associated with adopting structural adjustments:
a. A total of 32 respondents reported that they were responsible for theinstallation of a backwater valve, sump pump and/or sewage ejector.
b. There was a strong correlation between flood history and being responsiblefor the installation of a structural measure.
c. Respondents who experienced sewage flooding were more likely to havebeen responsible for the installation of a structural measure than those withclean water flooding.
d. Perceiving a risk of flooding in the next 10 years was statistically correlatedwith being responsible for the installation of a structural measure, as wasperceiving a risk of flooding during the next major rainstorm or snowmeltevent.
9. Summary of results, applications for subsidy program:
a. Very few respondents (2%) reported having applied for the City’s basementflood grant program. Six respondents with a history of flooding reportedhaving applied for the program, all of whom experienced sewage flooding.
b. A total of 12 respondents reported having received financial assistancethrough the program, four of whom had experienced sewage flooding.

44
4.2. Implications and recommendationsReflecting the findings of previous surveys (ICLR, 2004; Sandink, 2007), aconsiderable lack of awareness of insurance coverage for sewer backup wasrevealed in this study, as 45% of respondents did not know whether or not theyhad sewer backup insurance coverage. Also, 23% of respondents who experiencedsewage flooding in the past could not indicate if they had sewer backup coverage.Further, only 31 respondents indicated that they chose not to buy insurancecoverage for sewer backup, indicating that those who know about sewer backupcoverage are likely to purchase it. Thus, there is an identified need for insurers andgovernments to increase awareness about sewer backup and insurance coverage.Though information on insurance coverage is often included as part of municipaleducation programs, municipalities should consider developing more targetedinformation on this topic, including, for example, a brochure that focuses exclusivelyon issues surrounding insurance coverage for basement flooding. The City ofLondon may wish to partner with the insurance industry in the development ofinsurance education materials for basement flooding.
There existed a relatively high rate of “don’t know” responses when asked if respondents had a backwater valve in their home (32% of respondents). Thisfinding indicates that there is low awareness of current states of homes as theyrelate to basement flood risk. A lack of knowledge about the plumbingcharacteristics of the home also indicates the potential importance and benefits ofmunicipal government sponsored inspections of homes, as applied in Halton Regionand other municipalities (see Appendix A), which help homeowners identify thecurrent state of their home and the appropriate measures for flood reduction. TheCity of London may wish to investigate incorporating municipally sponsored homeinspections into their current grant program. Government sponsored inspectionsmay also increase the confidence of homeowners and may help ensure they knowwhat to ask for when seeking out plumbers and contractors for the installation offlood reduction measures. As discussed in Section 1.3., some municipalities haveincorporated requirements that homeowners pass on information about basementflood reduction measures to whomever purchases or rents the home, includingmaintenance requirements for these measures. This requirement may also assist in increasing awareness of basement flood reduction measures.
There was a much greater lack of awareness of backwater valves than of sumppumps or sewage ejectors. The City, thus, may choose to make a concerted efforton increasing awareness about this particular flood adjustment. For example, a separate brochure or separate set of information materials on backwater valvescould be developed and aggressively distributed in the Sherwood Forest area. The City may also choose to work with insurers or insurance brokers on thedistribution of information on backwater valves.
45
Residents who occupied the neighbourhood for a greater period of time reportedhaving more awareness of basement flood reduction measures than newerresidents. This indicates a greater need to “reach out” to newer residents. Thepoint of sale may serve as an opportune time to communicate information. Further,when purchasing a home, residents are likely to deal with insurance providers orinsurance brokers, further identifying the insurance industry as a potential keyplayer in the education of homeowners and residents about basement flooding.Though new residents indicated that they were less knowledgeable about basementflood reduction in general, knowing whether or not a backwater valve was in thehome was not correlated to length of residence in the home. Thus, there is a needto communicate with all homeowners about backwater valves, regardless of thelength of time they have lived in their home.
Twenty-two respondents reported that they experienced clean water flooding thatentered their home through their sump pump, representing a considerable portionof those who experienced clean water flooding (17%). Previous research hasargued that information passed through various conduits must remain consistent in order for it to be perceived as trustworthy (Nathe et al., 1999). Also, previousresearch has indicated that private residents may rely heavily on family and friendsfor information on basement flood reduction (Sandink, 2007). If a large proportionof individuals are flooded through their sump pump systems, and if this informationis passed through neighbourhood social networks, individuals may develop anegative perception of sump pump systems and may be less likely to adopt thisimportant flood reduction measure. Reflecting this concern, there were severalcomments in the open-ended response section expressing concern over the use of sump pumps. Thus, identifying and addressing sump pump related flooding maybe considered as a priority for urban flood managers. For example, it may be in the City’s interest to follow-up on homeowner complaints of sump pump failureand ensure that proper remedies are applied.
Despite the fact that all residences in the Sherwood Forest neighbourhood receiveda package including a brochure identifying City of London programs for floodreduction, only 42% of respondents with a history of flooding and 29% of no floodhistory reported that they had ever read any City of London information onbasement flooding. Further, only 39% of respondents with a history of floodingand 22% of respondents with no flood history reported that they knew of theCity’s basement flooding grant program. Though previous research has revealedthat residents have a low level of awareness of hazard issues, this finding issomewhat surprising considering brochures were mailed to each home the previoussummer that contained information on City programs including the subsidy. Thefinding is even more surprising when considering that respondents identified the mailing of brochures and pamphlets to homes as one of the preferred means of receiving information on basement flooding. This findings indicates that a one-time mailing of information may not be, in and of itself, sufficient for thecommunication of flood reduction information.

46
Several respondents expressed concern that development in the area surroundingthe Sherwood Forest neighbourhood may be increasing flood risk. Further, somerespondents perceived a direct relationship between development and increasedoccurrence of flooding in the area. However, as displayed in Figure 2, SherwoodForest is serviced by a specific sanitary sewer system, separate from the systems thatserve developments around the area. Thus, increased development outside of theSherwood Forest area would not impact sewer backup risk for Sherwood Forestresidents. It may be beneficial to communicate this fact to residents in theSherwood Forest neighbourhood.
The argument that homeowners are often unwilling to adopt risk reducingadjustments on their own (Kunreuther, 2006) was supported in this research, as the majority of those who had risk reducing plumbing features in their home werenot responsible for their installation (i.e., only 32 respondents reported that theywere responsible for the installation of a sump pump, backwater valve and/orsewage ejector). Further, though sewer backup is often viewed as a problem witholder developments, Turley (2002) reported that in New Lennox, Illinois, there werecases where new development had higher rates of infiltration and inflow than olderdevelopments due to poor construction and inspection practices. Compared tomany neighbourhoods in London, the developments in the Sherwood Forest areaare relatively new, but many homes have still had problems with sewer backup. For these reasons, the City may consider implementing more coercive means for theinstallation of backwater valves, such as the requirement that valves be installed inall new homes or requirements for the installation of backwater valves whenpermits are requested for work related to sanitary sewer connections, as otherCanadian cities have done (see Section 1.3.).
Changing development patterns throughout the City and climate change may serve to alter the nature of urban flood risk in the future. For example, Nirupamaand Simonovic (2006) reported that increasing urbanization in the Upper Thameswatershed has changed the nature of urban runoff in the City of London. In 1970,400 mm of total precipitation resulted in 350 m3/s of peak flow in the ThamesRiver, as recorded by a Byron monitoring station. In 1997, a 200 mm precipitationevent resulted in a flow of 800 m3/s in the Thames River (Nirupama & Simonovic,2006). Further, a 2007 study by Prodanovic and Simonovic revealed that climatechange may result in increasing severity and intensity of short duration rainfallevents in London, Ontario. As well, a report by Cheng (2007) suggested thatseasonal rainfall totals during the warm months (April-November) could increaseunder certain climate change scenarios in several Southern Ontario cities, includingLondon. The study indicated that the frequency of heavy rainfall events that include equal or at least 15 mm of precipitation in one day could increase anywherefrom 8% to 40% in the 21st Century from average frequencies in the same basins between 1961 and 2002. The frequency of rainfall events that include atleast 25 mm of precipitation in one day could increase by 10% to 50% (Cheng, 2007). These factors suggest that the nature of urban flooding events

47
could change in London in the future, perhaps in unpredictable ways. Practicing theprecautionary principle and mandating wider implementation of basement floodreducing measures could serve as one way to address these uncertainties.
In the open-ended sections of the questionnaires, there was evidence that somehomeowners felt that the City was placing responsibility for basement flooding onhomeowners, and some respondents felt that placing responsibility on homeownerswas a method adopted by the City to shift responsibility away from itself. It may be worthwhile to address this concern in public education efforts. For example, the City may wish to communicate to homeowners that, while they have a role inurban flood reduction, the City is also taking actions that will reduce risk. Hazard researchers have argued in the past that hazard managers should make useof as many information conduits as possible, and should make sure that informationis consistent across these conduits to increase the effectiveness of public educationprograms (Nathe et al., 1999; Sandink, 2007). As discussed earlier, the City ofLondon has applied numerous conduits for the transmission of basement floodinformation, including mailings of brochures and questionnaires, TV commercialsand websites. However, the interaction of the study group with City basementflood materials remained relatively low, as only 42% of respondents with history of flooding and 29% of respondents with no flood history reported having everread any City information. The City has not incorporated the insurance industry intotheir education campaign, and this presents a considerable opportunity to spreadinformation on basement flood reduction. As described in this study, respondentswould prefer information from the City rather than from insurers, however, insurersmay serve as a conduit for City information.
Public participation in government planning exercises can assist governments inincreasing public support for decision making and policy initiatives, and increase the ability of decision makers to identify potential conflicts in policy and decisionmaking exercises (Healey, 1992; Innes & Booher, 1999). Burby adds that publicparticipation can increase awareness of certain planning related issues and help topersuade relevant stakeholders of a need to address issues (Burby, 2003). Further,effective participation can increase the legitimacy of, and reduce cynicism aboutgovernment initiatives (Forester, 2006). As reported by City staff, the publicinformation session held in the Sherwood Forest area following the May, 2009flooding event provided an opportunity for residents to “blow off steam” andaddress their concerns directly to City staff. Thus, there is no doubt that publicengagement and public information meetings are an important part of the publiceducation and engagement process. However, relatively few respondents (15% offlooded respondents and 5% of respondents with no flood history) reported havingattended a City public meeting about basement flooding. Further, only 20% ofrespondents who were interested in receiving more information about basementflooding indicated that they would like this information to be provided through

48
municipal public meetings (12% of the total sample of 674). The lack of attendanceof respondents and potential lack of interest in public meetings as an informationdistribution tool further supports the need to use multiple conduits to both disperseand receive information about basement flooding (Nathe et al., 1999; Sandink, 2007).
While only 33% of respondents reported reading City of London basement floodmaterials, 59% expressed interest in receiving more information from the City. As described in this paper, repeated appeals for homeowner response to thequestionnaire significantly increased response rates when compared to the singularquestionnaire mailing used by the City the previous summer. Further, anincremental approach to information dissemination can be an effective means of increasing hazard awareness. An incremental approach may include providinginformation of specific aspects of basement flooding over a period of time (forexample, spacing out the mailing of brochures on sump pumps, backwater valves,lot grading, etc. over a period of time). Strategic moments, including when a floodevent has made local new media, serve as effective times to send information onflood reduction to residents. As the majority of flood events reported in this surveyoccurred in the spring, and the spring is when most flooding events in Canadaoccur (Shrubsole et al., 2003), the City may choose the spring months as a furtherstrategic information distribution moment.
Though 27% of the total sample of 674 (or 45% of the 401 respondents whoindicated they would like to receive more information on basement flood reduction)indicated that they would like information provided to them by use of a Citywebsite, only 18% of respondents with a history of flooding and 5% ofrespondents with no flood history reported that they had ever visited the City’scurrent webpage on basement flooding. This finding suggests that residents areunaware of the flooding webpage on the City of London website. The City mayconsider placing a link to the basement flooding section of their website in a moreaccessible area, including the home page. Though the flooding website wasmentioned in the brochure mailed to residents in the Sherwood Forestneighbourhood (see Appendix C), it was mentioned in relatively small text near thebottom of the brochure, and directed residents to use the website’s search functionto access the flooding webpage.
A significant portion of respondents in this study experienced infiltration flooding.However, most municipal education programs are focussed only on flood reductionfrom surcharging of the City’s sanitary sewer, causing sewer backup. Cities may chooseto increase educational content relating to the reduction of infiltration flooding.

49
Sewer backup endorsement summaries have indicated that several Canadianinsurers that write sewer backup risk in Ontario consider the existence of floodreducing plumbing measures when setting premiums, caps and/or deductibles forhomeowner sewer backup coverage. When a homeowner makes a claim for sewerbackup damage and the insurer subsequently requests the installation of sewerbackup mitigating devices, the insurer may ask for evidence of installation, such as an invoice or receipt from a professional plumber. However, when writing newbusiness, insurers may rely on homeowner responses to sewer backupquestionnaires to indicate whether or not a potential insured has sewer backupmitigating devices. Arguably the most important mitigation device at thehomeowner level is a properly installed backwater valve, in combination withfoundation drains that are disconnected from the sanitary sewer. However, aconsiderable proportion of respondents in this study (32%) could not indicatewhether or not they had a backwater valve in their home. If a large proportion of homeowners do not know if they have appropriate risk mitigating devices in their homes, it calls into question the legitimacy of homeowner responses tosewer backup questionnaires.
As discussed above, it is important that residents who experience basementflooding report flood events to their municipality. This information can be used to help the municipality identify areas at risk of flooding and the potential causes of flood events. However, 42% of respondents who experienced sewage flooding and 87% of respondents who experienced clean water flooding did not report theirmost recent events to the City of London. When recommending mitigationmeasures or when dealing with homeowner claims for basement flooding, insurersor insurance brokers should consider requesting that homeowners report their flood events to their municipality.
As discussed in Section 3.6.2, there is evidence to suggest that the some of the 23 respondents who reported that their sump pumps are draining into their sewerconnection are actually draining their pumps into the sanitary sewer. Further, fiverespondents reported that their sump pumps were draining into their laundry tub or other internal plumbing. The City may wish to follow-up with these homeownersand identify their sump pump connections, and take action to correct them if theyare indeed draining into the sanitary sewer.
4.3. Conclusion and further studyUrban flooding presents one of the more significant risks to Canadian urbanmunicipalities, homeowners and insurers. Given the possible changes in the natureof extreme events caused by climate change (Kharin & Zwiers, 2000; Madsen & Figdor, 2007; Prodanovic & Simonovic, 2007), combined with increasingdevelopment and deteriorating infrastructure, urban flooding stands to continue or possibly increase as a threat to the well being of urban residents. Whileaddressing infrastructure and planning issues serve as important means of reducing

50
urban flood risk, private residents also play a considerable role in urban flood riskreduction. Thus, understanding how residents perceive and react to urban flood riskis an important component of effective urban flood management.
Reflecting previous perception studies, there appears to be significant opportunityto increase awareness and mitigative behaviour of residents in the Sherwood Forestneighbourhood. Though the City of London has been relatively aggressive in thecommunication of flood risk information (including the use of multiple informationconduits and mailing information to each home in the area), actual use of Cityinformation was surprisingly low. Further, the prevalence of infiltration flooding inthe study sample indicates that increased focus on infiltrating flood reduction maybe a concern for the City.
The results of this survey provide a “snap-shot” of resident perceptions andbehaviours. A longitudinal survey, where a similar survey and survey administrationprocedure is applied again in the future, would provide an indication of thechanging levels of awareness and perceptions that are likely to exist in theneighbourhood. Applying a longitudinal survey approach would also allow for the investigation of the effectiveness of City of London education programs over a period of time.
Flooding associated with sump pumps remains a specific concern, as thedisconnection of foundation drains and the installation of sump pumps arerecommended as a flood reduction measure. Thus, identifying the reasons for flooding from sump pumps should be a topic of future surveys. Questions in future surveys should relate to the knowledge of maintenance procedures forsump pumps, whether the sump pump system installation was inspected by the City, the existence of emergency backup power, and the pump type (e.g., pedestalvs. submersible). Further surveys should also investigate homeowner awareness of maintenance practices for backwater valves.
Reflecting pervious surveys (ICLR, 2004; Sandink, 2007), a low awareness ofinsurance coverage for basement flood was identified in this study. Surprisingly,almost a quarter of residents who had experienced sewage flooding in the pastcould not indicate whether or not they had insurance coverage. An investigation of insurance coverage awareness, including how insurance coverage iscommunicated to homeowners and the reasons for the low level of awareness, is warranted based on the findings of this study. Further, a more nuancedinvestigation of insurance coverage should be included in future surveys, includinghow insurance coverage for sewer backup changed after respondents made sewerbackup claims or whether respondents are receiving discounts or other incentives if they have installed flood mitigation measures in their homes.

51
Considering the primary point of contact for many homeowners when seeking to buy insurance coverage or seeking information on insurance coverage is theirinsurance broker, identification of communication and education issues associatedwith insurance brokers should be a focus of future study. Insurance brokers canplay several roles in basement flood coverage and reduction awareness. Forexample, brokers may take initiative to collect and distribute information aboutbasement flood reduction to their customers, and must also explain the details ofhome insurance coverage to their clients. Further, the varieties of coverage availablefor water damage and the fact that sewer backup may be sold as part of its own“sewer backup” endorsement or as part of a “water escape” endorsement maycause confusion amongst insurance customers, especially if water damageendorsements are referred to as “flood” endorsements (Sandink et al., 2010). Thus, an understanding of how information on basement flood coverage is passedto insureds through brokers serves as a subject for further study.

52
Appendix A: Subsidy program summaries
London
(Sump Pump,Sewage Ejector,and Storm PrivateDrain ConnectionGrant Program)
• Weeping tile disconnection
• Backwater valve
• Sewage ejector (in lieu of backwater valve)
• Storm Private Drainconnection
• 75% up to $1,875 forweeping tile disconnectionwhen connected to maindrain inside of basement
• 75% up to $2,650 forweeping tile disconnectionwhen connected to maindrain outside of building
• 75% up to $575 forbackwater valve
• 75% up to $1,525 forsewage ejector
• 75% up to $3,775 for StormPrivate Drain Connection
• Funding also available for condominiumcorporations and non-profit housing co-operatives
• Available for those who have experiencedflooding caused by surcharging ofsanitary or storm sewers
• Available to those at risk of flooding fromsurcharging storm of sanitary sewers
• Permits and inspections required
Brantford
(Basement FloodingPrevention GrantProgram)
• Installation of sumppump with batterybackup
• Weeping tiledisconnection
• Backwater valve
• Connection of weepingtiles to sump pit
• Downspout disconnection
• $3,000 • Available to homes that havedocumented recurring storm or sanitarysewer back ups as a caused by sewersurcharging
• Downspouts must be disconnectedwhere appropriate
• Professional installation of backwatervalve required
• Permits, inspections required forbackwater valve installation
• Homes reviewed by city staff to identifyrelevant flood reduction measures
• Priority given to homeowners whoexperienced flooding between June 1, 2010 and December 31, 2010
• Priority given to homeowners withrecurrent sewer backups
• Program not implemented if disasterrelief provided by another level ofgovernment (e.g., ODRAP)
Municipality(Name) Measures Funding availability Notes

53
Ottawa
(Residential ProtectivePlumbing Program)
• City protective plumbingevaluation of home
• Measures deemedappropriate based onhome evaluation
• Measures may includebackwater valve,disconnection of weeping tiles andinstallation of sumppumps, disconnection of downspouts fromweeping tiles
• 100% up to $4,000 forbasements that haveexperienced sewer backup
• 50% of the cost of work upto $2,500 for homes with no sewer backup history butlocated in risk areas (i.e.,historically flooded areas)
• Homeowners are eligible for100% grant assistance iftheir home is directlyadjacent to a property thatexperienced a backup,including semi-detachedhomes where other side ofbuilding experienced sewerbackup
• Special grants available forflat-roofed buildings and ininstances where a sealedsump pump system isrequired
• Available to residences that haveexperienced a sewer backup or arelocated in an area at risk of sewerbackups
• Insurer or city documentation of sewerbackup event required for historicalsewer backups or sewer backups inneighbouring properties
• Inspection by City programrepresentative, consultant hired by City
Halton Region
(Basement FloodingPrevention Subsidy Program)
• Weeping tiledisconnection and sump installation
• Disconnection/redirection ofdownspouts
• Installation of mainlinebackwater valve
• 50% if the invoiced total to a maximum of $1,800 for weeping tile disconnection and sump system
• 50% to a maximum of $250 for downspoutdisconnection/redirection
• 50% to a maximum of $675 for backwater valve
• Weeping tiles and downspouts must bedisconnected from sanitary sewer
• Household Drainage Survey must beconducted by regional representative
• Post-installation inspections required
• Among other requirements, applicantsmust agree to inform future purchasersor leasers of their property of theexistence and maintenance requirementsof flood reduction measures
St. Catharines
(Flood AlleviationProgram)
• Backwater valve
• Sump pump system
• Downspout disconnection
• $3,000 • Pre-work site inspection, includingCity representatives
• Downspouts must be disconnected from sanitary system
City of Welland
(Sewage WaterAlleviationProgram)
• Backwater valveinstallation
• Foundation draindisconnection and sump system includingbackup power
• Downspout disconnection
• $3,000 • Foundation drain disconnection
• Downspout disconnection
• Pre-work inspection by City representatives
• Available for homes with sewer backupssince July 31, 2004
Municipality(Name) Measures Funding availability Notes

54
City of Vaughan
(Back-water Valve InstallationSubsidy Program)
• Backwater valveinstallation
• 50% to a maximum of $750 for backwater valve
• Site assessment carried out by licensedplumber or drain contractor
• Available to those who have installedbackwater valves since August 19, 2005
• Historical sewer backup events are not aprerequisite
• Downspouts must be disconnected fromCity sewer system wherever possible
• Professional installation
• Permits and inspections
• Measures must be completed beforeapplicant applies for subsidy program
Region of Peel and City ofMississauga
• Household drainagesurvey
• Backwater valveinstallation
• Downspout disconnection
• 50% to a maximum of $675 for backwater valve
• 100% of cost for disconnection of downspoutfrom sanitary sewer to a maximum of $1,000
• Homeowners who reported damage tothe Region of Peel or City of Mississaugadue to the August 4, 2009 rain event
• Other homeowners added to waiting listfor potential supplementary program
• Household drainage survey conducted by municipal representatives
• Disconnection of downspouts
• Downspout disconnection includesrequirements for 2% yard slope, that water not affect neighbouringproperties or directly drain on sidewalksor driveways, and that sewer standpipe be sealed
City of Saskatoon
(Flood ProtectionProgram)
• Assessment by selectedplumber
• Backwater valve(s)installation
• Sump pump system
• Permit costs
• $3,000 • Available to property owners who haveexperienced sewer backup or are at riskof experiencing a sewer backup
• No application process – properties areselected by the City
• All basement plumbing must beprotected with backwater valves
• Disconnection of weeping tiles and sumpinstallation where water does notnegatively affect neighbouring properties,streets, sidewalks, etc.
Municipality(Name) Measures Funding availability Notes

55
City of Greater Sudbury
(PreventativePlumbing Subsidy)
• Backwater valve(s)installation
• Sump pump system
• 50% to a maximum of $1,000 for a backwatervalve
• 50% of the cost to a maximum of $1,250 for a sump pump system
• 50% to a maximum of $2,250 for a backwatervalve and sump system
• Residential, commercial, industrial,institutional and non-profit properties are eligible
• Site assessment by licensed plumber
• Where possible, downspouts andweeping tiles must be disconnected
• Property must have been flooded on July 26, 2009, at sometime in the past,or must be located in flood prone area
• Plumbing inspections
• In 2010, program targeted to propertyowners flooded during July 26, 2009rainfall event. In 2011, priority given toproperty owners who have experiencedflooding in the past, followed by thosewho occupy risk areas.
Hamilton
(ProtectivePlumbing Program (3P))
• Backwater valve
• Sump pump (inconjunction withbackwater valve)
• Downspout inspectionand disconnection
• Sewer lateral inspectionand repair
• $2,000
• Additional $1,500 if sewerlateral was affected by roots from a City owned tree(funds are available throughexisting sewer lateralmanagement program)
• Loans may be available foreligible costs that exceed the program grant maximumof $2,000
• Not available to all Hamiltonhomeowners
• First phase of program targets residentswho have experienced sewer backup.Later phases will provide funding to those who occupy areas that have a history of flooding.
• Professional installation, permits
• Post-installation inspections
• Eligibility requires sewer backup duringone of 13 flood events that occurredbetween August 19, 2005 andSeptember 28, 2010.
• Residents are notified of their eligibilityfor the program by mail, and can alsoapply independently
City of Edmonton
(Backwater Valve SubsidyProgram)
• Backwater valve • $1,200 • Priority is given to those who haveexperienced sewer backup; if fundsavailable, homeowners who have not experienced sewer backup and are in specific at-risk neighbourhoods can apply
• Available to dwellings built before 1989 (Backwater valves have beenrequired in new homes since 1989)
• Subsidy available for both inline (branch)and mainline backwater valves
Municipality(Name) Measures Funding availability Notes

56
Durham Region
(Basement Flooding LoanProgram)
• Sump pump
• Backwater valve
• $3,000 interest-free loan • Installation by licensed plumber
• Inspections after installation
• Available for those who experiencedsewer backup flooding in specificneighbourhoods in the region
Municipality(Name) Measures Funding availability Notes
City of Niagara Falls
(Weeping Tile RemovalAssistanceProgram)
• Weeping tiledisconnection fromsanitary sewer
• Sump pumpdisconnection fromsanitary sewer
• Backwater valve
• Weeping tile investigation
• 100% to a maximum of$3,000 for weeping tiledisconnection
• 100% to a maximum of $500 for backwater valve
• 100% to a maximum of $400 for weeping tileinspection
• Specific sump design conditions are outlined, including battery backupsystem
Winnipeg (MB)
(Basement Flooding Protection Subsidy Program)
• In-line backwater valve
• Sump pit drainage system
• 60% of invoiced cost up to $1,000 for in-linebackwater valve
• 60% of invoiced cost up to $2,000 for sump pitdrainage system
• 60% of invoiced cost up to $3,000 for both sumpsystem and backwater valve
• Subsidy not available to homes that wererequired by building or plumbing codesto have backwater valves and/or sumpsystems (homes built since 1979 wererequired to have backwater valves;homes built since 1990 were required tohave sumps)
• Available for sumps/backwater valvesinstalled on or after May 1, 2010
• Homes may require more than one in-linebackwater valve
• Available to all pre-1979 homes
Sources: City of Brampton, 2010; City of Edmonton, 2010; City of Hamilton, 2010; City of London, 2010; City of Niagara Falls, 2010; City of Greater Sudbury, 2010; City of Ottawa, 2010a; City of Ottawa, 2006; City of St. Catharines, 2010; City of Toronto, 2010; City of Vaughan, 2009a, 2009b; City of Welland, 2009; City of Winnipeg, 2011b; Durham Region, 2009a,b; Halton Region, 2010; Region of Peel, 2010a,b,c.

57
Appendix B: Summer, 2009 City of London survey

58
Appendix C: City of London basement flooding brochure
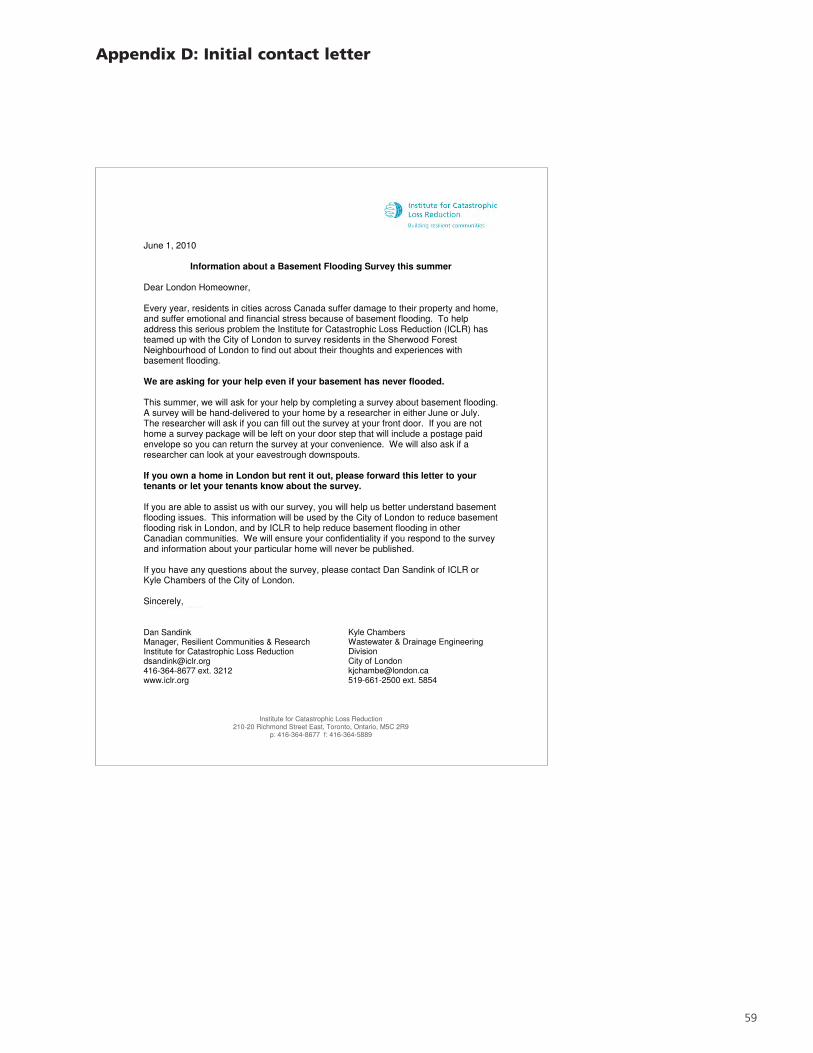
59
Appendix D: Initial contact letter
Institute for Catastrophic Loss Reduction 210-20 Richmond Street East, Toronto, Ontario, M5C 2R9
p: 416-364-8677 f: 416-364-5889
June 1, 2010
Information about a Basement Flooding Survey this summer Dear London Homeowner, Every year, residents in cities across Canada suffer damage to their property and home, and suffer emotional and financial stress because of basement flooding. To help address this serious problem the Institute for Catastrophic Loss Reduction (ICLR) has teamed up with the City of London to survey residents in the Sherwood Forest Neighbourhood of London to find out about their thoughts and experiences with basement flooding. We are asking for your help even if your basement has never flooded. This summer, we will ask for your help by completing a survey about basement flooding. A survey will be hand-delivered to your home by a researcher in either June or July. The researcher will ask if you can fill out the survey at your front door. If you are not home a survey package will be left on your door step that will include a postage paid envelope so you can return the survey at your convenience. We will also ask if a researcher can look at your eavestrough downspouts. If you own a home in London but rent it out, please forward this letter to your tenants or let your tenants know about the survey. If you are able to assist us with our survey, you will help us better understand basement flooding issues. This information will be used by the City of London to reduce basement flooding risk in London, and by ICLR to help reduce basement flooding in other Canadian communities. We will ensure your confidentiality if you respond to the survey and information about your particular home will never be published. If you have any questions about the survey, please contact Dan Sandink of ICLR or Kyle Chambers of the City of London. Sincerely,
Dan Sandink Manager, Resilient Communities & Research Institute for Catastrophic Loss Reduction [email protected] 416-364-8677 ext. 3212 www.iclr.org
Kyle Chambers Wastewater & Drainage Engineering Division City of London [email protected] 519-661-2500 ext. 5854

60
Appendix E: First drop cover letter and questionnaire
Institute for Catastrophic Loss Reduction 210-20 Richmond Street East, Toronto, Ontario, M5C 2R9
p: 416-364-8677 f: 416-364-5889
A survey on your home, your community and basement flooding
Dear London Resident, Every year, residents in cities across Canada suffer damage to their property and home, and suffer emotional and financial stress because of basement flooding. To help address this serious problem the Institute for Catastrophic Loss Reduction (ICLR) and the City of London are surveying residents in the Sherwood Forest Neighbourhood of London to find out about their thoughts and experiences with basement flooding. You or the owner of your home may have received a letter about this survey earlier in June. We are interested in your input even if your basement has never flooded. Enclosed in this package is a survey with 22 questions, which should take about 10 or 15 minutes to fill out. If you could help us by filling out the survey and returning it in the postage paid reply envelope, we would be extremely grateful. This survey has been hand-delivered to your home because we think your opinions and experiences are important and valuable. The information you provide will be used by the City of London to reduce basement flood risk in your neighbourhood and in London, and by ICLR to help reduce basement flooding in other Canadian communities. We will ensure your confidentiality and any information you provide about your particular home will never be published. We greatly appreciate your help with our survey. If you have any questions or comments, please contact Dan Sandink of ICLR or Kyle Chambers of the City of London. Sincerely,
Dan Sandink Manager, Resilient Communities & Research Institute for Catastrophic Loss Reduction [email protected] 416-364-8677 ext. 3212 www.iclr.org
Kyle Chambers Wastewater & Drainage Engineering Division City of London [email protected] 519-661-2500 ext. 5854

61
�
�
������������
������������� ����������������
��������������������������
�� ������������������������������������������������������
� !�������"�������#��������������������������
$� %�"������������#�����������������������������#�����������������
&� %��������'���������������������
����� ����� �����
���� ��� ����������
�(��)*�+�"#���"����#������#������������������������������'������������������������������������������������������
(�����������������������������+�����,-*�.�/�0* �������*/��*��������������'���������#����#�1�#��2����#����33�4��
����������������������������� ����� ��������� �!���"���������#����� �����
����� �!���������$�%�&������&�����'���� ����� ��� ���"���� �!���#������� �����
�(!)�)(!)������������������� ����� *�!���#����#��������������� �����
�#�������(������������������ ����� ���������������������� �����
!��������"����������������#�����������#���"�����������53����� ��������������� ����������������������������������������������������������������������������� �
6� !���������3���������������������'�����������������������#��,�������-�������
����� ����� �����
���� ��� �+� �!�������,��"������
7� !���������2�����������������������������������������������������
����� ����� �����
���� ��� �+� �!�������,��"������
8� (��������3�����+�������������������7+�#�"��2����������#��������'��������"�����������#����5���������������9�)������
����� ����� ����� ����� ���� �����*5�������:��2��� -� .� /� 0� 1� 2�
*5�������-�2���

62
�
�
�����������
������������� ����������������
�� (��������3�����+�������������������7+�#�"��2����������#��������'��������"���������������#����5����;�������������������"�����������
����� ����� ����� ����� ���� �����*5�������:��2��� -� .� /� 0� 1� 2�
*5�������-�2���
<� !������#�����������������������������"���'��2�3��
����� ����� �����
���� ��� ����������
(��.=+�"#�����>������#�����������������������������"���'��2�3��
����� ����� �����
3�����������#����#��,�� �� 3��#��������� 3������������� (+����
��������������=0%* �� ����������������������������������������������������������������������������������������������������������������������������������������������
�9� !������2��"�#�"�����������������#���������#������'�����������������
����� �����
���� ���
���������?��"��������,�������-���������������
��� %�����������������+���������������"�������'������������������������+�3��3#�������'���#�����������#��,�������-�������
����� �����
���� ���
� � %����������������������#��,�������-�����>������������������"�'3�����
����� �����
���� ���
�$� %������������������������,�������-������3�'������������'����'�����������������
����� �����
���� ���

63
�
�
������������
������������� ����������������
�&� %�����������������+���������������"�������'�������������������������������������������������������@���������#����#����#��,�������-�������
����� �����
���� ���
(��)*�+�"#���������@������>������������������������������������������������������������������������������������������� ��������������������������������������������������������������������� �
�6� %��������#���������#��,�������-�����>����������������������������+�"#��#�3����������3����������������#����"��������������'��2"����������+���"�����;�������������3A3��3������3��������������������������������������3����3��������������������������
����� �����
���� ���
�����,��(�����������������������
�7� /���������2��������������������'����#�"�����������'�����������������
����� �����
���� ���
��8� %�"�"���������2�����������������������������"#���#����3�������������
� ������+��"�4������
�+�3��(������!)�+����*�����
5!)�������� ����(���!�������!+���!�������������������������� ����� �����
��!� ����(�����������!��"#���""��������%�� �(��"�������(���������� ����� �����
������ �������������!�,�+����%�3����������#� �(��"�������(��������� ����� �����
� �������������������������������������������� ����� �����
�#�))���,����!�������������������������������� ����� �����
�6���!!���������������������������������������� ����� �����
5( ������"��!�����!���%������)����(��������������������� ����� �����
���=0%* �� ��������������������������������������������������������������������������������������������������������������������������������������������������

64
�
�
������������
������������� ����������������
�����!��������������� ������������'����
�������� �� � � � ������������� �
��� !���������#����#������'��2"�����������
����� ����� �����
���� ��� ����������
(�������#����#�����'��2"���������+�"�����������3����'������������������������"��������������#����"#�����������������������#�����
����� �����
3�#����)���� ��"������������������ 3��#�����+���������#���3�!�,�����
(������"�������3����'��������������������+�"#��#�����#�����"�����33������������
����� ����� ����� ����� �����
3������������������
3���������������3��'����
3��������������������������
3��������!��� (������������#�
�����7(��"��������
��8�9�
�
� � � � � � � �
�<� (���#���������3A3����������3A3��3���������'���������
����� ����� �����
���� ��� ����������
(�����B�������'��2"�����������
(�����B ������'��2"������������������>������������0#���������������������������#������������2"�������������������#��'������������+��������������������#��'��������"���#�����������������#��,������������
B�� B �
���3A�����������3A���3�0#��3������������#�����#���������3A3�����������3A3��3����0#�������������������#��'������������+����������#��'��������"����

65
�
�
����� ������
������������� ����������������
(�������#����#��������3A3����������3A3��3+�"#������������3��3�"���������
����� ����� ����� �����
����(�"���"����%��(����(�����!+���!�
3����!+��#������������
3��������(���+��( ����������������)�(! ��%�
����������
������������������=0%* �������������������������������������������������������������������������������������������������������������������������������������������
(�������#����#��������3A3����������3A3��3+�"�����������3����'������������������������"��������������#����"#�����������������������#�����
����� �����
3�#����)���� ��"������������������ 3��#�����+���������#���3�!�,�����
(������"�������3����'��������������������+�"#��#�����#�����"�����33������������
����� ����� ����� ����� �����
3������������������
3���������������3��'����
3��������������������������
3��������!��� (������������#�
�����7(��"��������
��8�9�
�
�
�
9� !���������#����#��������"�����;������������������������#���#�����������"���'��2�3��
����� ����� �����
���� ��� ����������
(�������#����#�������"�����;������������+�"�����������3����'������������������������"��������������#����"#�����������������������#�����
����� �����
3�#����)���� ��"������������������ 3��#�����+���������#���3�!�,�����
(������"�������3����'��������������������+�"#��#�����#�����"�����33������������
����� ����� ����� ����� �����
3������������������
3���������������3��'����
3��������������������������
3��������!��� (������������#�
�����7(��"��������
��8�9�
��"����*;����������"�����;���������������������2�����������������3A3����������3A3��3+�����������������������#��'����������������%�"����+��#����"�����;������3��3�"��������������������������#��3��'������������'��������1������������#����������+���3��������'��#���'+���2�������#�"��+���3�����������2+�����4��

66
�
�
������������
������������� ����������������
�� (����������������'��2"���������+����3A3��3������"�����;������������+����������33��������3�������������#����#��#��,�������-�����>������������������������������
����� ����� �����
���� ��� �������:554��������
� (�����������33�+�����������������������������#��3��������
����� �����
���� ���
�����*��!�"��3�����
*���������#���"��3������#���������������������#����"������������������2��2���#����
�
*���������#���"��3������#�������>����������������#����"������������������2��2���#����
� ��������������������������#���"��3�������������������#��������3����"�����������
����� ����� �����
���� ��� ����������

67
�
�
�����������
������������� ����������������
����������������
�-*��*�� =C(!*�)=: �%=D*��!! *����=�0%�0�)=: �%=D*�/(--�.=0��*�,=.0�,0*!����(.���=:0�0%(���: C*)����
:������� ����������������������������������������������������������������������� � ��
���������C����� �E�����
0��#�3������������������#����'����������������������+�"��"�����2�����#���������3�����������������������#�����������������#������������������3��������������#���"��3�������������#������������������#�������
/����������������3������������������������#������������������3�����������"��3��������
����� ����� �����
)��&��������������!����,��(��+����)���!+���#��)�(����
.�&�)����������,�����!+���!���
�������������))�+����!���
(������"�����2����������3�����33����������������������#��������2�����������"��3����+�3�����3���������������3#�������'������"���������������������
�������!��� ����������������������
��)�����(! ���� ����������������������
�
�� 0�%����������������'��2�
$� /���������2������#��������#���������'����'��������������������#��,�������-�������������������������������������������������������������������������������������� �������������������������������������������������������������������������������� �������������������������������������������������������������������������������� �������������������������������������������������������������������������������� �������������������������������������������������������������������������������� �������������������������������������������������������������������������������� ��
0#��2���������#�3�������"��#�����������F�

68
Appendix F: Second drop cover letter
Institute for Catastrophic Loss Reduction 210-20 Richmond Street East, Toronto, Ontario, M5C 2R9
p: 416-364-8677 f: 416-364-5889
An additional basement flood reduction survey package
Dear London Resident, Earlier this summer a research assistant dropped a survey off at your home that asked about your opinions and experiences with basement flooding. As far as we know, we have not received a response from you. If you could help us by filling out and returning the survey, we would find your input extremely valuable. We are interested in your input even if your basement has never flooded. Basement flooding includes any amount of unwanted water that enters your basement, especially if it enters through your sewer connections, or enters during or after heavy rainfall events. No information about your individual property or home will be made public or reported to any insurance company. If you have already mailed back your survey or have chosen not to respond, please accept our sincere thanks and ignore this survey package. Enclosed in this package is a survey with 22 questions, which should take about 10 or 15 minutes to fill out. If you could fill out the survey and return it in the postage paid reply envelope, we would be extremely grateful. The information you provide will be used by the City of London to reduce basement flood risk in your neighbourhood and in London, and by ICLR to help reduce basement flooding in other Canadian communities. We greatly appreciate your help with our survey. If you have any questions or comments, please contact Dan Sandink of ICLR or Kyle Chambers of the City of London. Sincerely,
Dan Sandink Manager, Resilient Communities & Research Institute for Catastrophic Loss Reduction [email protected] 416-364-8677 ext. 3212 www.iclr.org
Kyle Chambers Wastewater & Drainage Engineering Division City of London [email protected] 519-661-2500 ext. 5854

69
Appendix G: Reminder post card
September 16, 2010
Earlier this summer a survey on resident experiences and opinions about basement flooding was hand-delivered to your home in the Sherwood Forest neighbourhood of London. The survey was a joint project of the Institute for Catastrophic Loss Reduction and the City of London. If someone from your home has already returned a survey, please accept our sincere thanks for your help. If not, please help us by filling out a survey and returning it in the postage paid envelope included in the survey package. You may have received a second survey over the summer, but please fill out and return only one survey. We greatly appreciate your help with this project. If you did not receive or have misplaced your survey package, let us know and we’ll send another right away. Sincerely,
Kyle Chambers
City of London [email protected] 519-661-2500 ext. 5854
Dan Sandink
ICLR [email protected] 416-364-8677 ext. 3212

70
Appendix H: Flooding dates (ordered by year)
1990 1 0.5%
March 1992 1 0.5%
May 1992 1 0.5%
April 1997 1 0.5%
July 1997 1 0.5%
1997 1 0.5%
July 1998 1 0.5%
1998 2 1.0%
April 1999 1 0.5%
January 2000 1 0.5%
June 2000 2 1.0%
September 2000 1 0.5%
2000 3 1.4%
August 2001 1 0.5%
March 2002 1 0.5%
Apr 2003 1 0.5%
2003 1 0.5%
March 2005 1 0.5%
April 2005 1 0.5%
January 2006 1 0.5%
February 2006 2 1.0%
March 2006 1 0.5%
May 2006 1 0.5%
September 2006 1 0.5%
2006 2 1.0%
February 2007 1 0.5%
April 2007 3 1.4%
June 2007 1 0.5%
November 2007 1 0.5%
December 2007 1 0.5%
Spring 2007 1 0.5%
January 2008 3 1.4%
February 2008 1 0.5%
March 2008 2 1.0%
April 2008 5 2.4%
May 2008 2 1.0%
June 2008 1 0.5%
August 2008 2 1.0%
September 2008 2 1.0%
December 2008 6 2.95
2008 3 1.4%
January 2009 1 0.5%
March 2009 2 1.0%
April 2009 3 1.4%
May 2009 37 17.7%
June 2009 5 2.4%
July 2009 4 1.9%
August 2009 1 0.5%
October 2009 3 1.4%
November 2009 1 0.5%
December 2009 2 1.0%
2009 6 2.9%
January 2010 5 2.4%
February 2010 2 1.0%
March 2010 4 1.9%
April 2010 6 2.9%
May 2010 9 4.3%
June 2010 16 7.7%
July 2010 3 1.4%
August 2010 1 0.5%
No response 32 15%
Total 209 100%
Month Year n % Month Year n % Month Year n %

71
Appendix I: Open ended responses
The City should fix this problem in our neighbourhood and not be asking “what the chances are that itmight happen again”.
I don't think downspout inspection is the problem, my sewer backup insurance coverage has been dropped.I think the City of London knows the problem so fix it please.
The problem in my area is the San sewer on our street is only 8"… and houses down stream of us have their weeping tiles tied into the sanitary sewer which met the building code prior to 1986 or 1987. Everytime we have an extreme rainfall or snow melt i.e. more than 1" of rainfall in an have or snow melt thesewer (8" dia) cannot handle the excessive water which then backs up through our san sewer. I have had 2 floods in Jan/Feb2008 and 1 in May 2009. Our insurance company have not cut off sewer backup orflood damage. The previous owner of this house also had 2 floods sometime around 2000.
My insurance rates have gone up dramatically due to flooding. The City of London is at fault. City shouldpay for my backwater valve plus insurance hike. Sewer drains connected to water drains that is why we are flooded always, doesn’t have anything to do with downspouts. City messed up when sub division wasestablished. Cut corners to save money. I’m one of many annoyed and frustrated residents.
My sump expels all the time anywhere from once an hour to every 10 minutes depending on rain andweather… last town meeting about it early studies were showing that development and construction offGainsborough and further up Wonderland towards Fanshawe Park Road was going to negatively affect the water table in my area. I certainly hope this isn’t the case.
Sump pumps run constantly in our neighbourhood all day. Everyday. Our neighbour’s front yards are oftenflooded and swampy – our backyard is often very moist.
Not a big fan of sump pump pits in a house. Seems that routing outside water into the house which in turnis directed back out of the house is not a good system, especially if it is subject to mechanical failure.
When I say flooding as far as my home I referring to water on the floor which can be cleaned up fairly fast.
I understand there have been people/homes on my street that had flooding including sewage backup.
Would like to know if flooding reported in the past as I have only owned my home for 1 year and previousowner failed to inform me of the basement flooding problem. Not sure where the backwater valve shouldbe installed in my home. Do I need sump pump, backwater valve and a sewage ejector? not sure if I canafford to do all 3; not sure how great a risk for flooding I have but have noticed even with a heavy rain thatthe soil against my house till is dry as a bone and water doesn’t soak into it as it is clay. Is it possible to havesomeone come to my home and advise the best course of action to prevent basement from flooding?Money is tight and would like to participate in program as grants are available but need to know where tostart. Thanks for your help in this matter... XXX.
My home is a raised XXX. This style, on my street, does not seem to get flooded like those homes withdeeper basements.

72
Needs to be corrected immediately. People involved should be compensated (since their insurance will nolonger cover any flood damage!)
The attitude of the City of London staff is not good. The constant denial of responsibility and blaming thehomeowner entirely is wrong.
I would like my daughter to receive this survey. She lives at XXX. She would be very interested in filling it out as she has the opposite of what this house has. This house was built in 1984 and I am the originalowner.
When we bought our house five years ago we were told about the flood and the burm that had been builton Gainsborough Rd to take of the problem. We were also told about the sump pump and backflow valveand were told it wouldn’t happen again. When we experienced the huge sewer backup in January 07 wewere very surprised. We had insurance coverage and then we had one more sewer backup in April 08 itcost us $800 out of pocket plus the loss of our flood insurance. After the first flood in January ourinsurance company put us on a flood insurance where we were covered for $25,000 damage but we had to pay extra for it. Now we have an alarm system in our home with a flood censor but still no floodinsurance so every time it rains we hope for a dry basement. If it floods again with no insurance we will notbe able to fix it as we just don’t have that kind of money available.
The city should be taking care of infrastructure as top priority to prevent basement flooding…
I have flooded 4 times! Please help! I am open to any advice…
Why is it every time we got hit by a Flood or Sewer Backup it is always the same houses. Many of thesehave back flow valves and sump pumps.
The problem is inadequate sewer/sanitary lines for the area. A city problem period! They say they can’tafford to remedy the problem for a while – Budgetary issues! Well don’t we all have financial problemsespecially since they keep hiking our taxes – for what? but they toss our… in other non-essential…
Just a point to ponder – in new subdivisions does the developments practice of stripping off the top soiluntil there’s a think covering left contribute to flooding? Are new subdivisions inspected to confirm the landhas been properly sloped and graded to minimize flooding?
After heavy rains we get water sitting at back edge of our property for a few days…
I have not experienced a flood while owning my home. I did notice a water stain on the cement floor and a puddle after our last rain storm (early June). Water stain started/ended at bottom of basement walland ended/started at floor drain. Concrete floor is painted white. Water stain/mark is yellow.
The researcher already checked the downspouts when the survey was dropped off…
Problem was fixed with landscaping and fixing foundation. Problem was minor leakage in basement.

73
We changed the landscaping to direct water away from the outer side of the house and this corrected ourproblem that only occurred in the most serious storms or when the snow was melting.
The city should be solely responsible for cost related to resolving flooding issues. As previously stated –the city gave permits for housing development in the area. This was a marshy-clay area. Clay does notabsorb water well when dry and cracked. Soil for gardens lawns has been added year after year but themajority of land is lumpy clay. I have spoken to many people who knew the land in its natural state –unbelievable! New post holes were dug and set in cement 1 year ago for the fence had shifted and broken.In that year – the post are no longer aligned. The ground shifts in the clay H2O soaked spring. The groundshifts enough to move and buckle my shed from 2’ away the fence to <8" at present. The buckled metalshed now leaks each rain. We bought this home in 1991. The house was situated on the property –property graded so rainfall drained from the foundation. The mistake we made was not to inquire aboutthe “ground” soil. In the spring, it was soon evident the ground way clay. Soupy and wet in the spring –poor absorption of water. Clay/H2O mix on surface – once summer – the ground “cracks” it is so dry. When rain does fall absorption remains poor. That is when the water runs down the street or now in maycase toward the house foundation! The house is raised… The back entrance is opened aside from a slantedroof and railings… I have placed the front downspout that runs close to the front door in a precariousposition. It is directed to flow down the asphalt to prevent further “pooling” at the entrance. The rainwater does not run on to the street. It bypasses the front door, runs down the driveway midway and runsonto the front lawn due to the cracks and bulges in the asphalt… I know of families in the area who cannotpurchase insurance ANYWHERE because of previous floods…
My basement flood was minor – not really flood by a small leak that drained in the laundry room but didwet the floor since we were out of town for a couple days when it happened.
Provide a backup (battery) sump pump to guarantee minimum flooding with sump pump failure.
First, best step is to extend downspout at least 3-4 m from buildings.
Yes – please provide: contacts for companies that install sump pumps and sewage backhaul services and the grant program
I was told by my insurance company that a backwater valve could create hydrostatic pressure that couldcause a pipe to break and leak through my basement floor which would not be covered by insurance.
From 1985-1999 No floods. Hmmmm… From 2000-2009 9 floods – way more houses. I now have a backwater valve and sump pump. No floods as of yet… No insurance – cancelled by insurer. Lots of sumppumps in my area but I don’t see many discharging. Many have been re-plumbed to drains inside houses.(illegally?)
City needs to build a bigger sewer pipe; Stop home construction until then.
Had a crack in the foundation fixed in 2006 when minimal leakage was detected.
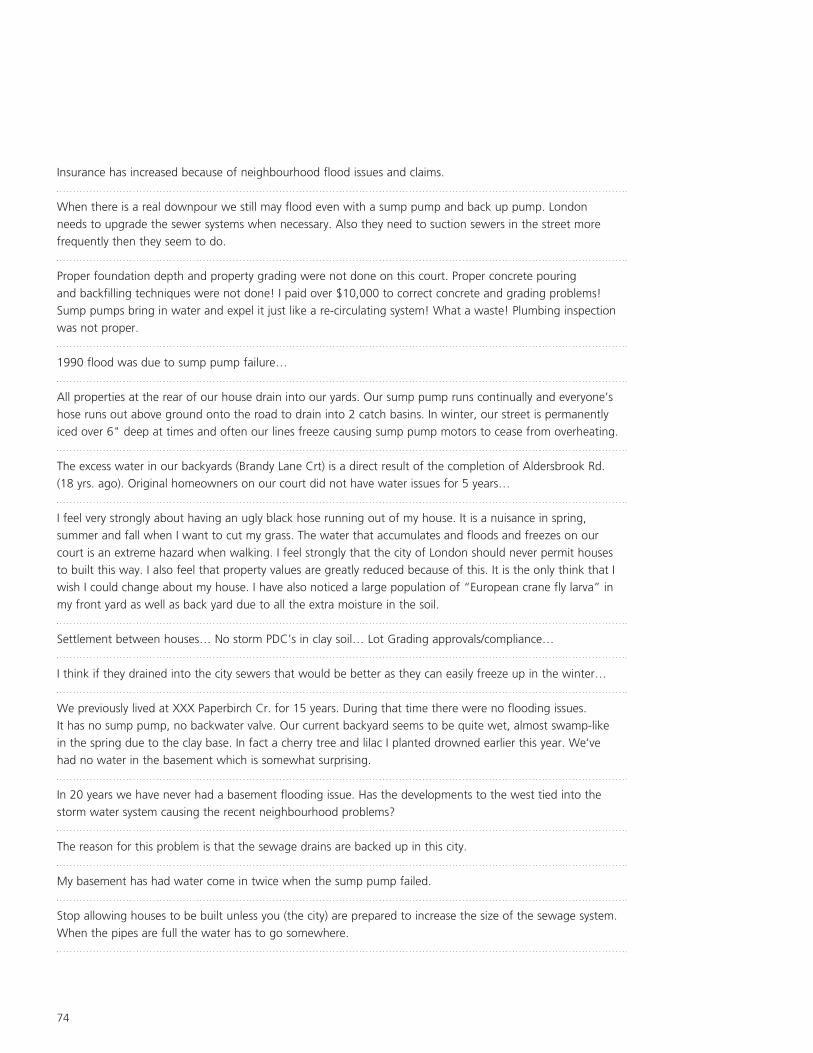
74
Insurance has increased because of neighbourhood flood issues and claims.
When there is a real downpour we still may flood even with a sump pump and back up pump. London needs to upgrade the sewer systems when necessary. Also they need to suction sewers in the street morefrequently then they seem to do.
Proper foundation depth and property grading were not done on this court. Proper concrete pouring and backfilling techniques were not done! I paid over $10,000 to correct concrete and grading problems!Sump pumps bring in water and expel it just like a re-circulating system! What a waste! Plumbing inspectionwas not proper.
1990 flood was due to sump pump failure…
All properties at the rear of our house drain into our yards. Our sump pump runs continually and everyone’shose runs out above ground onto the road to drain into 2 catch basins. In winter, our street is permanentlyiced over 6" deep at times and often our lines freeze causing sump pump motors to cease from overheating.
The excess water in our backyards (Brandy Lane Crt) is a direct result of the completion of Aldersbrook Rd. (18 yrs. ago). Original homeowners on our court did not have water issues for 5 years…
I feel very strongly about having an ugly black hose running out of my house. It is a nuisance in spring,summer and fall when I want to cut my grass. The water that accumulates and floods and freezes on ourcourt is an extreme hazard when walking. I feel strongly that the city of London should never permit housesto built this way. I also feel that property values are greatly reduced because of this. It is the only think that Iwish I could change about my house. I have also noticed a large population of “European crane fly larva” inmy front yard as well as back yard due to all the extra moisture in the soil.
Settlement between houses… No storm PDC’s in clay soil… Lot Grading approvals/compliance…
I think if they drained into the city sewers that would be better as they can easily freeze up in the winter…
We previously lived at XXX Paperbirch Cr. for 15 years. During that time there were no flooding issues. It has no sump pump, no backwater valve. Our current backyard seems to be quite wet, almost swamp-like in the spring due to the clay base. In fact a cherry tree and lilac I planted drowned earlier this year. We’ve had no water in the basement which is somewhat surprising.
In 20 years we have never had a basement flooding issue. Has the developments to the west tied into thestorm water system causing the recent neighbourhood problems?
The reason for this problem is that the sewage drains are backed up in this city.
My basement has had water come in twice when the sump pump failed.
Stop allowing houses to be built unless you (the city) are prepared to increase the size of the sewage system.When the pipes are full the water has to go somewhere.

75
I would like information on how my home’s resale value is affected by flooding, having a sump pump andbackwater valve installed and living in a flood prone zone. When we bought the house on one told us thatthis area of the city was flood prone.
The only time we have water in our basement is if it rains a lot, we sometimes (very rare) have water come in our laundry room – but it drains right away – only makes a small puddle on the ground that can be cleanedup with a towel.
Not really. It seems that the City is already paying attention to flood management in current developmentprojects.
I have not experienced flooding, but occasionally have a mild sewage smell coming up through the basementfloor drain.
Not at this time, except that maybe the city should be more careful about clearing areas for development and more concerned about preservation of wet lands, natural flood zones, woods, etc.
We sit on a hill, there is no problem with basement flooding.
Is the researcher going to give a report on my downspouts?
We have never had a sewer backup problem thank goodness!! But over the years our water drainageproblems increased. Our street is on a hill and… a neighbour up the street put in a new patio or changessomething in their yard or eavestroughs it makes a difference to the water flow. Fortunately, our basementseems to be able to handle it even without a sump pump but the below ground level back door and drainwere a bad design idea which we now have to live concerned with all the time. Thank you for your time and input into the situation...
My understanding is that my flood occurred because of extreme sewer debris the City of London hadneglected to remove.
Sewer grates are often covered with leaves and when rainfall is heavy the sewer can’t take it away fastenough. Sewer grates are quite a distance from our home for the water to run to.
The area in which I live the foundations are just over 30 years old. They were built with precast walls with(holes) for construction. A number of homes have had the holes crack and the water gets in. My oldneighbour had to have three sides fixed due to flooding in the basement.
Used the City’s Grant program, but it was difficult – took 2 tries to get the money. Hope that it won’t be used against you. Too little, too late. The City should have acted years ago.
Thanks for being concerned about this. I know many of our neighbours have had flooding problems.
The drains and sewer pipes in our area were not big enough to handle the rain run off after the subdivision is grown larger.

76
When I attended meeting I felt that the city kept cutting people off when voicing their concerns. They onlyseemed to push back responsibility to the homeowner. Yet they admit that pipe diameter is too small and allnew pipes are much larger to handle population in area. I understand that they were done to spec. at thetime but that does not resolve problem now with increasing pop. in area!
Subsidy program in London is not good, regarding as to who can perform work under program guidelines it is restricted to plumbers, other can do this work but are unable thus the city gives a monopoly to a trade, this is unfair practice.
Received flood reduction info from the City of Sudbury.
The water came in near the back wall and only because my daughter was here we were aware – somethingwas going to be done about the grade level at the back but it never was. Thorne Property rep came andlooked at it.
Our problem stems from the design of our area where water from the street and yards behind us are to flowvia our swales to the front of the house.
This flooding started two years ago. Previous to this date my basement was completely dry.
For financial reason can’t afford to install a sump pump.
I have no problem with basement flooding, however I much appreciate the City’s concern and offered help.
Happens two times and the City do nothing to solve the problems – there are now too many new houseslinked to this system in my street.
Weeping tile spot required to fix cracks. London water wells over flowed, new my… same night my repairedcrack flooded again. Crack only leaks after overwhelming rains. Usually in Spring. Even small floods can have a huge impact. My finished basement TV room enjoyment was (XXX) reduced the last two summers.
Yes – my semi-detached neighbour’s home has had problems with basement flooding. I feel I could be at riskbecause my home is attached to his. What can I do to prevent this from occurring in my basement?
I haven’t had any sewer backup at all so far.
I had water come in so I had a contractor redo my window wells and I put in drainage trench. No moreproblems… just another rate payer wondering how many more consultants my property taxes are paying for.
Some financial help with grading would be appreciated. My sump hose has to go uphill before it goesdownhill to the storm sewer street drain. This line sometimes gets frozen in winter and is a potential source of flooding if I do not constantly break up the ice in the line.
Inconsistent delivery of hydro in heavy rainfall periods means loss of function in SUMP PUMP. Please improvehydro service.

77
Part of my complex has had a problem with flooding and have sump pumps however my unit is more elevated and I have had no problem.
This unit is in part a housing cooperative. If the City has a drainage expert to… downspouts and site drainage for the entire complex, I would like to be contacted so we can use his/her expertise.
Many units have flooded in this area so we worry about it but are renters so can do very little about it.
I live in a condominium complex. You may visually inspect the downspout at the front anytime – noappointment needed. The downspout at the back goes into my neighbour’s courtyard, so I would have to say no to that unless you had their permission. Sorry about the delay in returning the form.
The walls of the basement – the cracks were filled in – no more water in basement. Was only a little.
Run off water comes from Blanchard through my property into my road (Limberlost).
I am not sure of the system that exists at this home, I would appreciate if somebody an come in, have a look and advise me about it.
I live in London Housing. When I reported the sewer backup up the informed me someone would be out in 4-5 hours this was not acceptable as far as I’m concerned. I ended up cleaning myself with a lot of bleach.
Why hasn’t housing ensured that the worker they hired to fix my cracks in the basement walls, came to do hisjob. I have been having basement flooding for months.
I am not sure how I can be helpful as my basement has not flooded!!
There is a storm drain at the end of my driveway on the city street at the curb. In all the 18 years I have livedhere, I have never seen city workers come to clean it. Certain times of the year when it gets plugged (i.e. icein winter/leaves in fall) I clean it myself but I wonder who will clean it when I can’t any longer as I am aging.
When we purchased our home fifteen years ago the issue or concern of flooding did not come up. Now there has been considerable development in our area and we are noticing more problems with standingwater, slow water drainage on our street and water in our basement.
This neighbourhood seems to have a history of basement flooding. In my area, homes on the other side of the street seem to be most affected.
I also paid for a licensed contractor to install an exterior drainage system to ensure downspout near frontentrance has water exit close to street and not house.
The water that has flooded my basement in the past two years came up form the sewer. It came in and outso fast we didn’t…

78
I want to know (and willing to pay) if there is a device that can be used in case there is no electricity topump the water out of the basement.
I had catastrophic basement flooding in my last house in Stoneybrook. Please caution people not to dowindow wells for their basements.
Yes, I’m a new comer in Canada a lot of people like me our/style of life back home is very different so I event don’t know where or how the pipes in my home. I did buy it the way it is for all the new comer weneed a program to introduce how everything in house works in this type of weather and rainstorm fence,plumber, electricity everything here work very different. I’m afraid to touch.
We were OK until additional subdivision were built all around us. Now several people have had flooding, the system cannot handle the larger volume. All new homes should be repaired to have the itemsmentioned installed. Existing homes on flood danger zones should have them installed free.
I have also had sewage come up through the floor drain. I have had cracks in foundation wall and thesehave been repaired. The plumber that installed the backwater valve after the last flood told me I was not eligible therefore I have delayed putting in a sump pump because of the cost. I had 16 inches of waterin my basement my recent flood.
I have had two floods in the same year. My thought is that someone hasn’t done the job correctly in“planning” the city sewers as this whole neighbourhood has had floods for years. How is the City going to fix the sewers to accommodate the growth for the old homes and new homes in this area? I feel like the City is trying to pass the buck onto us to fix it. Additionally, your grants aren’t enough money to fix the problem as I checked out… I didn’t bother applying considering the funding amount.
Our home is a 4 level back split – the lower level flooded in 2008 and we had the crack in the wall fixed by advanced basements. (invoice enclosed). This was the north side of the house – April 2010 we hadanother flood in the next level up (family room) south side of the home – we had a contractor dig on theoutside of the wall but they could not find any crack in the wall. We are still experiencing some seepagewhen it rains heavily…
Yes we do have a ‘sump pump’. It all depends on the City to prevent power loss during a “rain storm”. All these preventative measures and reading materials are great. What is your input on assuring us of yourbackup plan during a power loss.
There is no info on City of London Website re: Basement Flood Grant Program!!
I believe the sanitary and storm sewers were tied together. The City should have been held accountable for the costs. We relieved very extensive damage and paid our insurance deductible.
Flooding was due to poor design of having a basement door to outside at the bottom of a stairwell. … landscaping drained rain into stairwell, drain got plugged by one leaf. Stairwell filled with water until 6'of water pushed in and filled basement. Horrible design.

79
We purchased this home on Oct 31, 2009. XXX runoff and heavy rain showers our sump pump ranconstantly. I was fearful of this go had a second sump pump hooked up on 12V battery power. Thissecond pump is hooked up to kick in should the primary pump fail or the power goes off.
Who are the morons that grant too many building permits to underserviced areas? City is responsible100% for design flaws in municipal drain systems. Minor water damage in my home has beenstopped by tiling the backyard; removing an abandoned fireplace flange; and re grading. Many homeson this street have foundation cracks – City inspectors bribed in the 70’s?
During this last major rain event my neighbour came in and was monitoring sump pump/Found abouta foot of wetness/water around the floor drain (of which I installed a drain check-valve) as well as thesump pit was full to the top and pump was running continually – neighbour went out to dischargepoint (catch basin) and found about 3' of water above catch basin. There is no doubt in my mind thatif there were a power failure at the time of the event, my batter back-up would be drained quicklyand I would have been flooded (just this past year). Also with the information that my neighbour hadprovided about the amount of water above my catch basin, the storm system was not able to handlethis amount to take it away or there is restrictions in the system. Therefore, City should beinvestigating the system, i.e., how much sediment/debris in storm pipes and is flushing required,bigger storm pipes? Or installation of storm holding tank and where to put it. Flow study during rainyseasons is a good way to model what is happening in the system This is a good start to see problemareas. Has this already been done? What is the city doing about it?
We had several block flood – units 32-36 several times, 42-47 most recent. Getting backflow andejector systems instead – have (XXXX) and added downspouts to (XXXX) help as well…
Mould problem in house from previous flooding – in walls and floors.
A computer spellcheck program was applied to the above responses. Further, in some cases, responses were summarized or truncated by the author.
80
AECOM. (2009). Sherwood Forest Area Flooding Public Meeting. December 9th, 2009.London: AECOM.
Arlikatti, S., Lindell, M., Prater, M., & Zhang, Y. Risk area accuracy and hurricane evacuation expectations of coastal residents. Environmental Behavior, 38, 226-247.
Arvai, J., Gregory, R., Ohlson, D., Blackwell, B., & Gray, R. (2006). Let downs, wake-up calls, and constructed preferences: People’s responses to fuel and wildfire risks.Journal of Forestry, 104, 173.
Arthur, S., Crow, H., & Karikas, N. (2009). Including public perception data in the evaluation of the consequences of sewerage derived urban flloding. WaterScience & Technology, 60, 231-242.
Baum, A., Fleming, R., & Davidson, L. (1983). Natural disaster and technological catastrophe. Environment and Behaviour, 15, 333-354.
Brown, M., & Hoyt, R. The demand for flood insurance. Journal of Risk and Uncertainty, 20, 291-306.
Burby, R. (2006). Hurricane Katrina and the paradoxes of government disaster policy: Bringing about wise governmental decisions for hazardous areas. The ANNALSof the American Academy of Political and Social Science, 604, 171-191.
Burby, R.J. (2003). Making plans that matter: Citizen Involvement and Government Action. Journal of the American Planning Association, 69, 33-49.
Burn, D. (1999). Perceptions of flood risk: A case study of the Red River floodof 1997. Water Resources Research, 35, 3451-3458.
Burton, I., Kates, R., & White, G. (1993). The Environment as Hazard (2nd ed.). New York: The Guilford Press.
Campbell, J., Saxe, D., & Zechner, F. (2007). Municipal Liability for Sewer and Water Pipe Failures… Despite Statutory Authority and Immunity. Publication of theOntario Sewer and Watermain Construction Association: Mississauga.
Canadian Mortgage and Housing Corporation. (2010). Avoiding basement flooding.Accessed Jan. 13, 2011 from http://www.cmhc-schl.gc.ca/en/co/maho/gemare/gemare_002.cfm
Cheng, C.S. (2007). Climate Change and Extreme Rainfall-Related Flooding and Surface Runoff Risks in Ontario. Technical Report, Executive Summary. EnvironmentCanada.
City of Brampton. (2010). City of Brantford Basement Flooding Prevention Grant Programme Due to Storm Events. City of Brantford.
Works cited

81
City of Brantford. (n.d.). Basement Flooding Grant Programme Application Form, Agreement, and Release. City of Brantford.
City of Calgary. (2010). Flooding and sewer backups. Accessed Jan. 13, 2011 from http://www.calgary.ca/portal/server.pt/gateway/PTARGS_0_0_104_0_0_35/http%3B/content.calgary.ca/CCA/City+Hall/Business+Units/Water+Services/Flooding+and+Sewer+Back+Ups/Flooding+and+Sewer+Back+Ups+.htm
City of Edmonton. (2011). Flood proofing program. Accessed Jan. 13, 2011 from http://www.edmonton.ca/for_residents/flooding_sewers/flood-proofing-program.aspx
City of Edmonton. (2010). City of Edmonton Drainage Services Backwater Valve Subsidy Program. City for Edmonton.
City of Edmonton. (2008). Flood Proof Prevention Program Information Bulletin. Accessed Jan. 10, 11 fromhttp://edmonton.ca/for_residents/ForHouseholds/InfoBulletin8.pdf
City of Greater Sudbury. (2010). Preventative Plumbing Subsidy. City of Greater Sudbury.
City of Hamilton. (2010a). Protective Plumbing Program Application for Eligibility. City of Hamilton.
City of Hamilton Media Release. (2010). City warns residents about misleading contractors. City of Hamilton.
City of Hamilton. (2010). Protective Plumbing Program (3P). Accessed Dec. 22, 2010 fromhttp://www.hamilton.ca/CityDepartments/PublicWorks/WaterAndWasteWaterDev/ProtectivePlumbingProgram.htm
City of Hamilton. (2006a). Council approves Residential Municipal Disaster Relief Assistance Program for basement flooding. Press Release, City of Hamilton.Accessed Jan. 13, 2011 fromhttp://www.hamilton.ca/NewsandPublications/NewsReleases/2006News/August/06-08-10jv.htm
City of Hamilton. (2006). Independent Community Panel Report to the City of Hamilton.City of Hamilton, Ontario.
City of London. (2010). The Sump Pump, Sewage Ejector, and Storm Private Drain Connection Grant Program. Accessed Nov. 11, 2010 fromhttp://www.london.ca/d.aspx?s=/Sewer_and_Wastewater/Basement_Flooding_Grant_Program.htm

82
City of London. (2009a). Appointment of the Consultant for Sherwood Forest Flooding Assessment and Mitigation Works Study – ES2680. Council Report. City of London.
City of London. (2009b). Grants for Sump Pump, Sewage Ejector, and Storm Private Drain Connection By-law. A-6403-272 – Enacted August 31, 2009. City of London.
City of Moncton. (n.d.).Protect your home against flooding. Accessed Jan. 31, 2011 from http://www.moncton.ca/AssetFactory.aspx?did=1290
City of Montréal. (n.d.). Sewer backup. Accessed Jan. 13, 2011 from http://www2.ville.montreal.qc.ca/pls/portal/docs/page/eau_potable_en/rep_refoulement_egout/cause.shtm
City of Niagara Falls. (2010). Weeping tile Removal Assistance Program Application Form. City of Niagara Falls.
City of Ottawa. (2011). Sewer backups and basement flooding. Accessed Jan. 13, 2011 fromhttp://ottawa.ca/residents/waterwaste/backups/index_en.html
City of Ottawa. (2010a). Residential Protective Plumbing Program. Accessed Nov. 15, 2010 fromhttp://www.ottawa.ca/residents/funding/protective_plumbing_en.html
City of Ottawa. (2010b). Comprehensive review of storm and sanitary service backwater valves-council motion 71/11. Accessed March 1, 2011 fromhttp://ottawa.ca/calendar/ottawa/citycouncil/occ/2010/06-09/pec/4%20-%20ACS2010-ICS-INF-0006%20-%20Comprehensive%20Review%20of%20Storm%20BWV.htm
City of Ottawa. (2006). By-Law No. 2005-209. Residnetial Protective Plumbing Program for Sewer Backup Protection. Accessed Nov. 15, 2010 fromhttp://www.ottawa.ca/residents/by-law/a_z/sewer_209_en.html
City of Richmond. (2010). Flooding. Accessed Jan. 13, 2011 from http://www.richmond.ca/safety/prepare/howto/during/flood.htm
City of Regina. (2010). Comprehensive flood proofing tips. Accessed Jan. 13, 2011 from http://www.regina.ca/Page2308.aspx
City of Saint John. (2010). Reduce the risk of flooding. Accessed Jan. 14, 2011 from http://www.saintjohn.ca/en/home/cityservices/transportation/stormwatermanagement/flooding.aspx

83
City of Saskatoon. (2011). Basement flooding. Accessed Jan. 13, 2011 from http://www.saskatoon.ca/DEPARTMENTS/Infrastructure%20Services/Public%20Works/Water%20and%20Sewer/Basement%20Flooding/Pages/default.aspx
City of Stratford. (2010). City of Stratford Agrees to Settle Class Action Suit Related to 2002 Flood. Press Release. City of Stratford.
City of Surrey. (2008). Surrey Sanitary Sewer Regulation and Charges. By-law, 2008, No. 1611. City of Surrey, British Columbia.
City of Toronto. (2010). Information and Application: Basement Flooding Protection Subsidy Program. City of Toronto.
City of Toronto. (2008). Update on the Engineering Review Addressing Basement Flooding. Staff Report to Council. August 18, 2008.
City of Toronto. (n.d.). Basement flooding. Accessed Jan. 13, 2011 from http://www.toronto.ca/water/sewers/basement_flooding.htm
City of Vancouver. (2009). Having a flood? Accessed Jan. 13, 2011 from http://vancouver.ca/engsvcs/watersewers/sewers/flood/flood.htm
City of Vaughan. (2009a). Backwater Valve Installation Subsidy Program. Accessed Nov. 23, 2010 fromhttp://www.city.vaughan.on.ca/vaughan/departments/public_works/pdf/Back-water%20Valve%20Installation%20Subsidy.pdf
City of Vaughan. (2009b). Proposed Wastewater Back-Water Valve Installation Subsidy Program. City of Vaughan.
City of Welland. (2009). Sewage Water Alleviation Program (SWAP): Policies and Procedures. Accessed Nov. 22, 2010 fromhttp://www.welland.ca/Building/SWAP.asp
City of Winnipeg. (2011a). Protect your home from basement flooding. Accessed Jan. 10, 2011 fromhttp://www.winnipeg.ca/waterandwaste/drainageflooding/basementflooding.stm
City of Winnipeg (2011b). Protect your home from basement flooding: Basement flooding protection subsidy program. Accessed March 15, 2011 from http://www.winnipeg.ca/waterandwaste/drainageFlooding/basementFloodingProtectionSubsidyProgram.stm
Coulibaly, M. (2008). Spatial analysis of an urban flash flood survey results. Geocarto International, 23, 217-234.
84
Cutter, S., & Emrich, C. (2006). Moral hazard, social catastrophe: The changing face of vulnerability along the hurricane coasts. The ANNALS of the AmericanAcademy of Political and Social Science, 604, 102-112.
Dillman, D., Smyth, J., & Christian, L. (2009). Internet, Mail and Mixed-Mode Surveys: The Tailored Design Method. 3rd Ed. John Wiley & Sons, Ltd.: New Jersey.
Durham Region. (2009a). Annes Street Sewer Catchment Area (Whitby) Basement Flooding Improvement Class Environmental Assessment Study. Durham Region.
Durham Region. (2009b). Lawrie Rd. Sewer Catchment Area (Ajax) Basement Flooding Improvement Class Environmental Assessment Study. Durham Region.
Environment Canada. (2010). Canadian Climate Normals 1971-2000. Accessed April 1, 2011 fromhttp://www.climate.weatheroffice.gc.ca/climate_normals/index_e.html
FEMA (Federal Emergency Management Agency). (n.d.). Definitions of FEMA Flood ZoneDesignations. Accessed March 31, 2011 fromhttp://www.msc.fema.gov/webapp/wcs/stores/servlet/info?storeId=10001&catalogId=10001&langId=1&content=floodZones&title=FEMA%20Flood%20Zone%20Designations
Forester, J. (2006). Making participation work when interests conflict. Journal of the American Planning Association, 72, 447-458.
Grothmann, T., & Reusswig, F. (2006). People at risk of flooding: Why some residents take precautionary measures while others do not. Natural Hazards, 38,101-120.
Healey, P. (1992). Planning through debate: The communicative Turn in Planning Theory. Town Planning Review, 63, 143-162.
Halton Region. (2010). Basement Flooding Prevention Subsidy Program. Accessed Nov. 16, 2010 fromhttp://www.halton.ca/cms/One.aspx?portalId=8310&pageId=10011
Henstra, D., & McBean, G. (2004). The role of government in services for disaster mitigation. Institute for Catastrophic Loss Reduction: Toronto.
Innes, J.E., & Booher, D.E. (1999). Consensus Building as Role Playing and Bricolage: Toward a theory of collaborative planning. Journal of the American PlanningAssociation, 65, 9-26.
Insurance Bureau of Canada. (2007). Facts of the General Insurance Industry. Insurance Bureau of Canada, Toronto.

85
Insurance Bureau of Canada. (2008). Facts of the General Insurance Industry. Insurance Bureau of Canada, Toronto.
Institute for Catastrophic Loss Reduction (ICLR). (2004). Canada-wide homeowner insurance survey, tabulations complied by Venture Market Research Corp.,Vancouver.
Jongejan, R., & Berrieu, P. (2008). Insuring large-scale floods in the Netherlands. The Geneva Papers, 33, 250-268.
Kharin, V., & Zwiers, F. (2000). Changes in the extremes in an ensemble of transient climate simulations with a coupled atmosphere-ocean GCM.Journal of Climate, 13, 3760-3788.
Kousky, C. (2010). Reforming the National Flood Insurance Program. Washington, D.C.: Resources for the Future, Issue Brief 10-01, Feb. 2010.
Kreutzwiser, R., Woodly, I., & Shrubsole, D. (1994). Perceptions of flood hazards and floodplain regulations in Glen Williams, Ontario. Canadian WaterResources Journal, 19, 115-124.
Kunreuther, H. (2006). Disaster mitigation and insurance: Learning from Katrina. The ANNALS of the American Academy of Political and Social Science, 604,208-227.
Kunreuther, H., Oncular, A., & Slovic, P. (1978). Disaster Insurance Protection: Public Policy Lessons. New York: John Wiley.
Lamond, J., & Proverbs, D. (2008). Flood insurance in the UK—a survey of the experience of floodplain residents. WIT Transactions on Ecology and theEnvironment, 118, 325-334.
Laska, S. (1990). Homeowner adaptation to flooding: An application of the General Hazards Coping Theory. Environment and Behavior, 22, 320-357.
Laska, S. (1986). Involving homeowners in flood mitigation. Journal of the American Planning Association, Autumn, 452-466.
Madsen, T., & Figdor, E. (2007). When it rains, it pours: Global warming and the rising frequency of extreme precipitation in the United States. Environment America.
McLeman, R., & Smit, B. (2006). Vulnerability to climate change hazards and risks: Crop and flood insurance. Canadian Geographer, 50, 217-226.
McPherson, H., & Saarinen, T. (1977). Floodplain dwellers’ perception of the flood hazard in Tucson, Arizona. Annals of Regional Science, 11, 25-40.

86
Miguez, M., Mascarenas, F., Magalhaes, L., D’Alterio, C. (2009). Planning and design of urban flood control measures: Assessing effects combination. Journal of Urban Planning and Development, September, 100-109.
Mileti, D. (1999). Disasters by Design: A Reassessment of Natural Hazards in the United States. Washington, D.C.: Joseph Henry Press.
Mileti, D., Fitzpatrick, C., & Farhar, B. (1992). Fostering public perceptions of naturalhazards: Lessons from the Parkfield earthquake prediction. Environment, 34,16-39.
Montz, B. (1982). The effect of location on the adaptation of hazard mitigation measures. Professional Geographer, 34, 416-423
Nathe, S., Gori, P., Greene, M., Lamersal, E., & Mileti, D. (1999). Public education for earthquake hazards. Natural Hazards Informer, 2, November 1999.
Nirupama, N., & Simonovic, S. (2006). Increase of flood risk due to urbanization: A Canadian example. Natural Hazards, DOI: 10.1007/s11069-006-0003-0
Palm, R., Hodgson, M., Blanchard, D., & Lyons, D. (1990). Earthquake Insurance in California: environmental Policy and Individual Decision Making.Boulder: Westview.
Parsons, C. (2003). Moral hazard in liability insurance. The Geneva Papers on Risk and Insurance, 28, 448-471.
Penning-Roswell, E. (1976). The effect of flood damage on land use planning. Geographica Polonica, 34, 139-153.
Preston, V., Taylor, S., & Hodge, D. (1983). Technological hazards: A study of an urban residential community. Environment and Behavior, 15, 143-164.
Prodanovic, P., & Simonovic, S. (2007). Development of rainfall intensity duration frequency curces for the City of London under the changing climate. The University of Western Ontario Department of Civil and EnvironmentalEngineering. Report No. 058, November, 2007.
Region of Peel. (2010a). Basement Flooding Remediation Program. Accessed Nov. 23, 2010 from http://www.peelregion.ca/pw/water/sewage-trtmt/remediation-program.htm
Region of Peel. (2010b). Basement Flooding Remediation Program Subsidy Application Form. Region of Peel.
Region of Peel (2010c). Terms and Conditions for Subsidy Funding. Region of Peel.

87
Sandink, D., Kovacs, P., Oulahen, G., & McGillivray, G. (2010). Making Flood Insurable for Canadian Homeowners. Zurich: Swiss Re.
Sandink, D. (2009a). The Resilience of the City of Kelowna: Exploring Mitigation Before,During and After the Okanagan Mountain Park Fire. Toronto: Institute forCatastrophic Loss Reduction.
Sandink, D. (2009b). Handbook for Reducing Basement Flooding. Toronto: Institute for Catastrophic Loss Reduction.
Sandink, D. (2007). Hazard perceptions and urban flooding. Canadian Underwriter.
Sandink, D. (2006). Perceptions of Overland Flow Flooding and Sewer Backup in Peterborough, Ontario. M.A. Thesis, Department of Geographer, Universityof Western Ontario.
Schiff, M. (1977). Hazard adjustment, locus of control, and sensation seeking: Some null findings. Environment and Behavior, 9, 233-254.
Shrubsole, D., Brooks, G., Halliday, R., Haque, E., Kumar, A., Lacroix, J., Rasid, H., Rousselle, J., Simonovic, S. (2003). An assessment of flood risk management in Canada. Institute for Catastrophic Loss Reduction: Toronto.
Shrubsole, D., Green, M., & Scherer, J. (1997). The actual and perceived effects of floodplain land use regulations on property values in London, Ontario.Canadian Geographer, 41, 166-178.
Shrubsole, D., Hammond, V., & Green, M. (1995). Floodplain management in London, Ontario, Canada: Assessing the implementation of Section 28 of theConservation Authorities Act. Environmental Management, 19, 703-717.
Siegrist, M., & Gutscher, H. (2006). Flooding risks: A comparison of lay people’s perceptions and expert’s assessments in Switzerland. Risk Analysis, 26, 971-979.
Simmons, K., & Kruse, J. (2002) Does a market for mitigation exist? Disaster Safety Review, Fall, 7-8.
Slovic, P., Fischoff, B., & Lichtenstein, S. (1979). Rating the risks. Environmnet, 2, 14-39.
Slovic, P., Kunreuther, H., & White, G. (1974). Decision processes, rationality and adjustment to natural hazards. In White, G. (Ed.). Natural Hazards: Local, National, Global. New York: Oxford University Press.
Solecki, K., & Michaels, S. (1994). Looking through the post-disaster policy window. Environmental Management, 18, 587-595.

88
Stockton, A. (2010). Hamilton woman pulled from flooded car. The Weather Network. Accessed Jan. 13, 2011 from http://www.theweathernetwork.com/news/storm_watch_stories3&stormfile=hamilton_woman_pulled_from_f_280910
Terpstra, T., Gutteling, J., Geldof, G., & Kappe, L. (2006). The perception of flood risk and water nuisance. Water Science and Technology, 54, 431-439.
Tinley Park. (n.d.). Overhead Sewers. Accessed Dec. 16, 2010 from http://www.tinleypark.org/government/departments/public_works/floodproofing/backup_overhead.htm
Turley, R. (2002). Home remedy, part 2. Water Environment & Technology, 14, 108-110.
UMA. (2005). City of Peterborough Flood Reduction Master Plan. UMA: Mississauga.
Van Brenk, D. (July 12, 2009). Handbook, subsidies help keep home basements dry. London Free Press.
Wong, K., & Zhao, X. (2001). Living with floods: Victims’ perceptions in Beijiang, Guangdong, China. Area, 33, 190-201.
Yoshida, K., & Deyle, R. (2005). Determinants of small business hazard mitigation. Natural Hazards Review, February, 1-12
Zaleskiewicz, T., Piskorz, Z., & Borkowska, A. (2002). Fear or money? Decisions on insuring oneself against flood. Risk Decision and Policy, 7,221-133.

89
Acknowledgements
I would like to acknowledge Kyle Chambers for helping to define the study and forproviding valuable City information on basement flooding and the Sherwood Forestarea. Thanks also to Arthur Gonzalez and Philip Baiden for their hard workdistributing surveys and interviewing residents in Sherwood Forest and to GregOulahen for helping Arthur and Philip with administering surveys and for data work.Finally, the help of all the Sherwood Forest residents who chose to respond to thesurvey is gratefully acknowledged.


92
Institute for Catastrophic Loss Reduction
Institut de Prévention des Sinistres Catastrophiques
Toronto office20 Richmond Street EastSuite 210Toronto, Ontario, CanadaM5C 2R9
416-364-8677
416-364-5889
[email protected] www.iclr.org
London officeBoundary Layer Wind Tunnel LaboratoryUniversity of Western OntarioLondon, Ontario, CanadaN6A 5B9
519-661-3234519-661-4273