cmps 6630: introduction to computational biology...
TRANSCRIPT

Experimental Structure Determination Methods
CMPS 6630: Introduction to Computational Biology and
Bioinformatics

Fold Recognition - ThreadingDifferences Between Fold Recognition Algorithms• Protein Model and Interaction Description The full three-dimensional structure is often simplified • Energy Parameterization Energy functions not as sophisticated as we’ll see in molecular simulation • Alignment Algorithms Dynamic Programming with Frozen Approximation Double Dynamic Programming Monte Carlo Minimization Branch-and-Bound
Limitations• Fold Recognition algorithms will return the fold that minimizes the energy function or maximizes the alignment score - but that doesn’t mean the identified model is correct. • Identified model structure is often not as good as in homology modeling

Experimental Structure Determination
X-Ray Diffraction - X-Ray Crystallography Nuclear Magnetic Resonance Spect. - NMR Spectroscopy
Produce atomic coordinates for most atoms Objective end-products XRC produces an electron density map NMR produces a set of geometric constraints Objective end-products are interpreted Structures can have errors (usually small)
Methods
For larger proteins (>50-100kDa) XRC is best Smaller proteins or complexes either ok Study of dynamics best with NMR
But constraints on what will crystallize or dissolve at high concentrations
isodensity
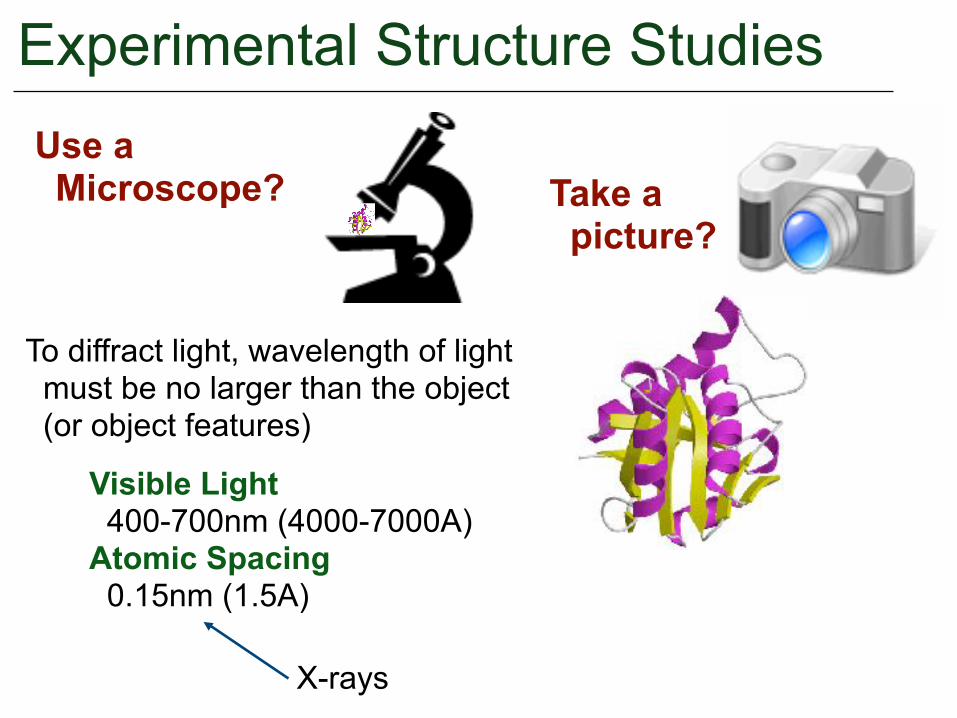
Experimental Structure Studies
Take a picture?
To diffract light, wavelength of light must be no larger than the object (or object features)
Visible Light 400-700nm (4000-7000A) Atomic Spacing 0.15nm (1.5A)
X-rays
Use a Microscope?

X-Ray Crystallography
Single molecule is very weak diffractor We don’t know how to build X-ray lenses
Problems:
Solutions:Use multiple molecules Observe scattered diffractions - use the computer as a lens
Rhodes, 2000

X-Ray CrystallographyComputer as Lens
Rhodes, 2000
Petsko, Ringe, Prot Struct and Function, 2004
X-ray Beam
crystal

X-Ray CrystallographyProtein Crystal
Unit cell - smallest volume element that can fully reproduce the crystal structure via translation only
Goal - determine electron density of the average unit cell
Molecule
Unit Cell
Crystal Lattice
Lattice Points
Rhodes, 2000

X-Ray Crystallography
Computed electron density ...
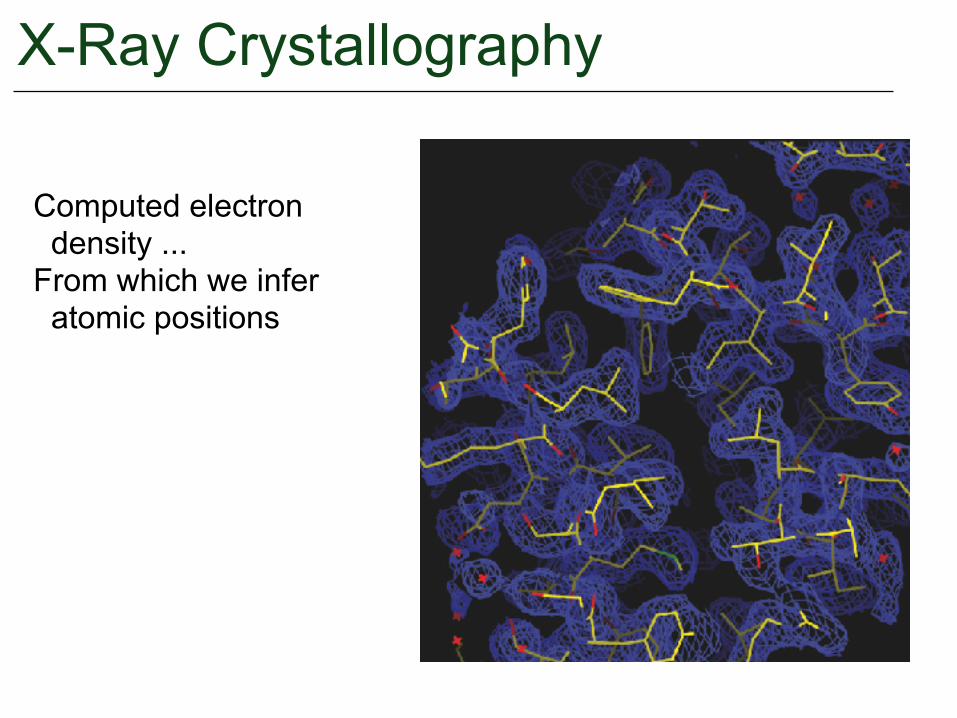
X-Ray Crystallography
Computed electron density ... From which we infer atomic positions
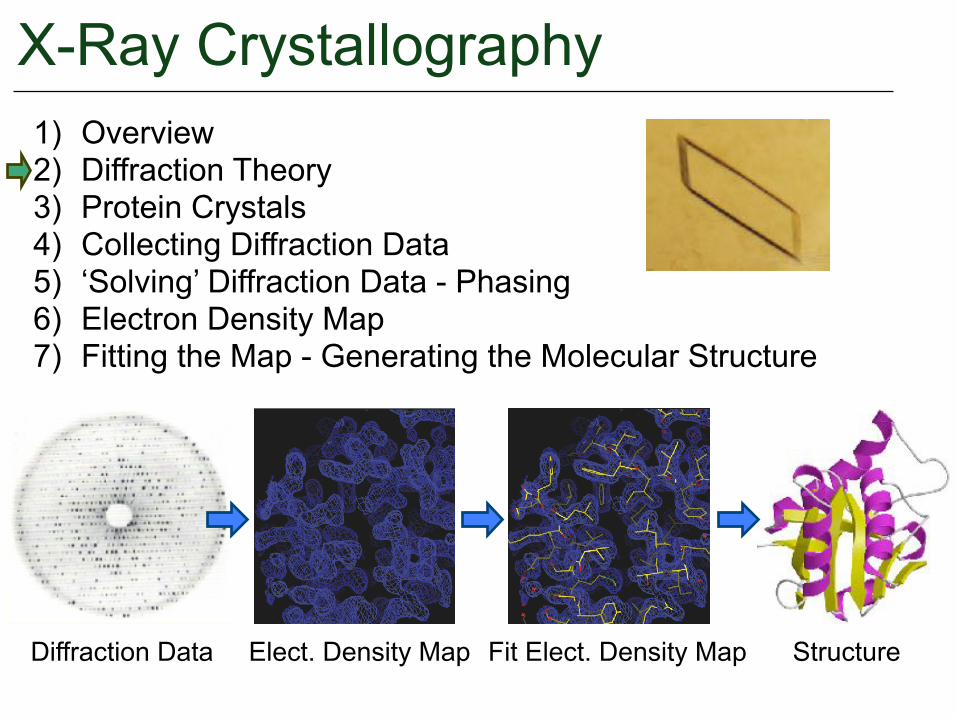
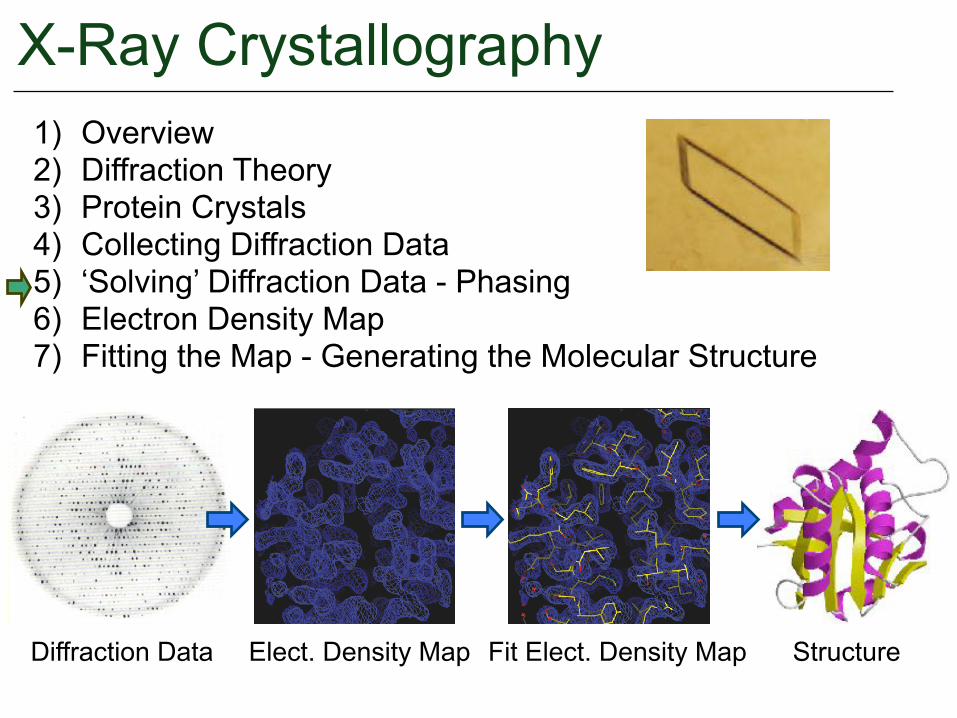
X-Ray Crystallography1) Overview 2) Diffraction Theory 3) Protein Crystals 4) Collecting Diffraction Data 5) ‘Solving’ Diffraction Data - Phasing 6) Electron Density Map 7) Fitting the Map - Generating the Molecular Structure
Diffraction Data Elect. Density Map Fit Elect. Density Map Structure

Diffraction TheoryPeriodic Functions / Wave Equations
Fourier theory: Any periodic function can be expressed as a sum of basis periodic functions (infinite sum of sin and cos terms) In the Fourier Transform, basis functions consist of sin and cos with all possible frequencies.
We have a periodic function!

Diffraction follows the FT of the electron density of the crystal.
S: spatial frequency (hkl) resolutionr: position (xyz)
resulting mag and phase of the wave incident on detector plate
n: num atomsatomic scattering factorStructure Factor
If we sum over all atoms in the crystallographic unit cell: The diffraction point observed at S is
Although the x-rays are a single frequency, each diffraction point corresponds to a different spatial frequency.
X-Ray Crystallography

S: spatial frequency (hkl) resolutionr: position (xyz)
resulting mag and phase of the wave incident on detector plate
n: num atomsatomic scattering factorStructure Factor
If we sum over all atoms in the crystallographic unit cell: The diffraction point observed at S is
To reconstruct density:
X-Ray Crystallography

X-Ray Crystallography1) Overview 2) Diffraction Theory 3) Protein Crystals 4) Collecting Diffraction Data 5) ‘Solving’ Diffraction Data - Phasing 6) Electron Density Map 7) Fitting the Map - Generating the Molecular Structure
Diffraction Data Elect. Density Map Fit Elect. Density Map Structure

Crystal Growth
2D ‘Crystal’

Crystal GrowthInorganic crystals (ie. NaCl) are very strong Protein crystals held together with weaker forces - are weak, fragile, and hard to grow Not perfect in arrangement
Drenth, 1994
Multiple crystals are needed / consumed in data collection Not all crystals ‘behave’ (diffract) May want derivative crystals - with ligand, cofactors, ...

Crystal Growth

Crystal GrowthCrystallization Condition SearchEssentially infinite combination of: salts, pH-buffers, polymers, organic molecules, temperature Trial and Error Use of ‘Crystal Screens’ (commonly successful conditions) Use of previous knowledge Coarse Search followed by Fine Search Sometimes hit is never found
0.2M Calcium Chloride dihydrate, HEPES pH 7.5, 28% PEG 4000 0.2M tri-Sodium Citrate dihydrate, Tris Hydrochloride pH 8.5, 30% PEG 4000
First (Coarse) Screen
0.1M Calcium Chloride dihydrate, HEPES pH 7.5, 28% PEG 4000 0.1M Calcium Chloride dihydrate, HEPES pH 7.5, 30% PEG 4000 0.2M Calcium Chloride dihydrate, HEPES pH 7.5, 30% PEG 4000 0.3M Calcium Chloride dihydrate, HEPES pH 7.5, 28% PEG 4000 0.3M Calcium Chloride dihydrate, HEPES pH 7.5, 30% PEG 4000
Second (Fine) Screen
...

‘Crystal Screen’from Hampton Research

Crystal GrowthRobots and Automation
Robots for Cloning (ie. getting your gene into a bacteria) Robots for Bacterial growth and Protein Expression Robots for Protein Purification Robots for Crystallization Robots for Imaging (crystal detection)
porter.llnl.gov

X-Ray Crystallography1) Overview 2) Diffraction Theory 3) Protein Crystals 4) Collecting Diffraction Data 5) ‘Solving’ Diffraction Data - Phasing 6) Electron Density Map 7) Fitting the Map - Generating the Molecular Structure
Diffraction Data Elect. Density Map Fit Elect. Density Map Structure

X-Ray SourcesRequires high-energy X-ray source -home sources -synchrotron (particle accelerators) Wavelengths: 0.6A - 1.5A
Advanced Photon Source at Argonne (Illinois, USA)
Appx. 3km around
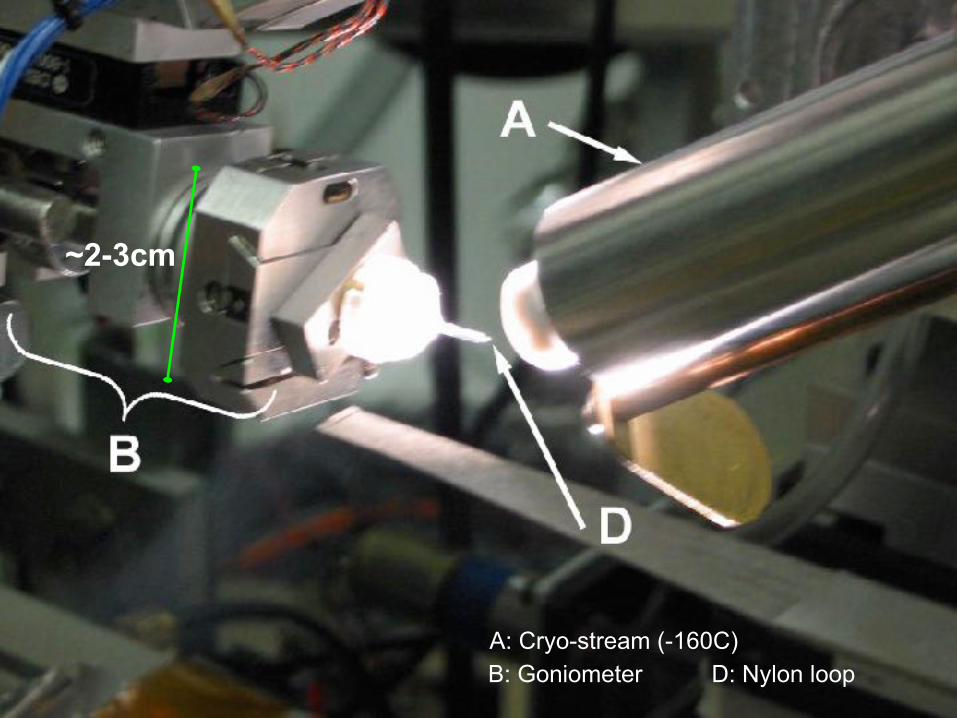
A: Cryo-stream (-160C)B: Goniometer D: Nylon loop
~2-3cm

nylon loop
crystalice
to goniometer

Setup A: Cryo-stream (-160C)B: Goniometer
C: CameraD: Nylon fibre loop E: X-ray path
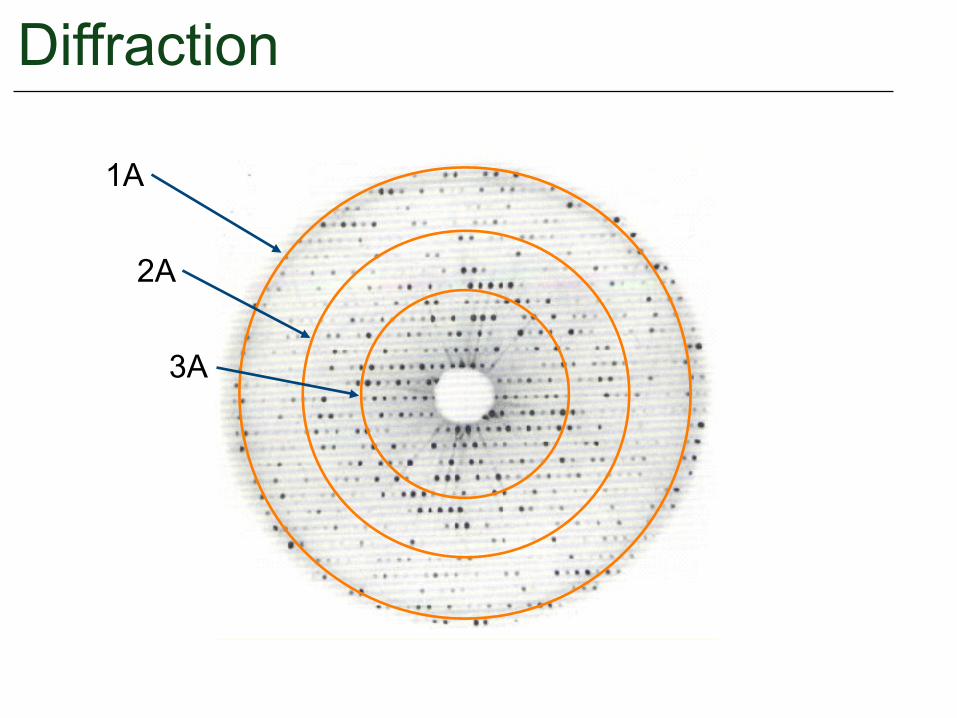
Diffraction
1A
2A
3A

Diffraction
FTFT-1
Missing Phases!!!
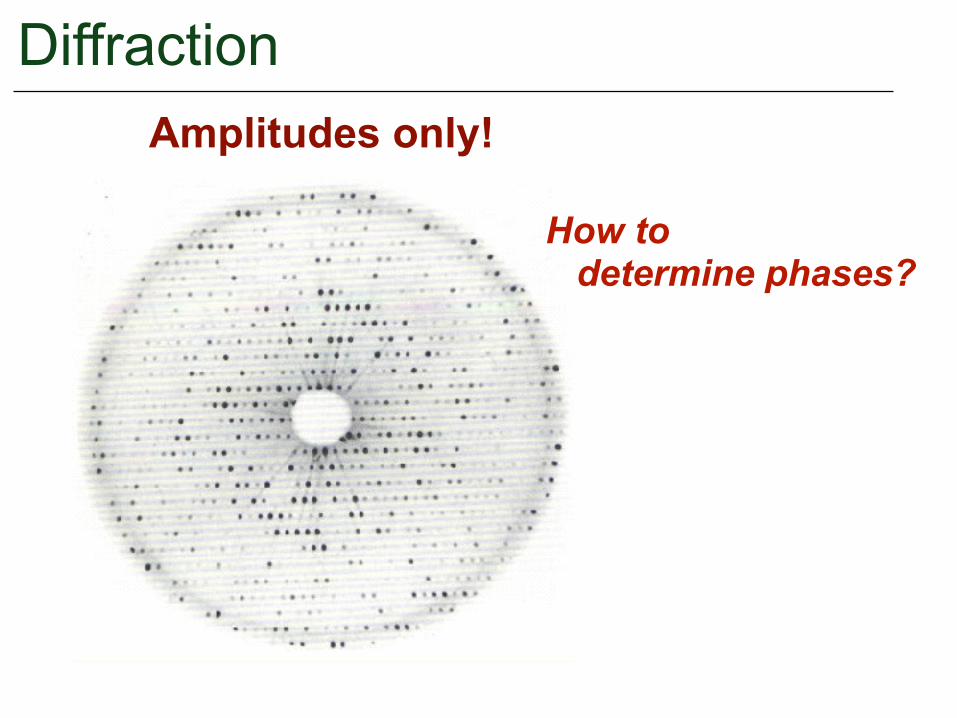
DiffractionAmplitudes only!
How to determine phases?
X-Ray Crystallography1) Overview 2) Diffraction Theory 3) Protein Crystals 4) Collecting Diffraction Data 5) ‘Solving’ Diffraction Data - Phasing 6) Electron Density Map 7) Fitting the Map - Generating the Molecular Structure
Diffraction Data Elect. Density Map Fit Elect. Density Map Structure
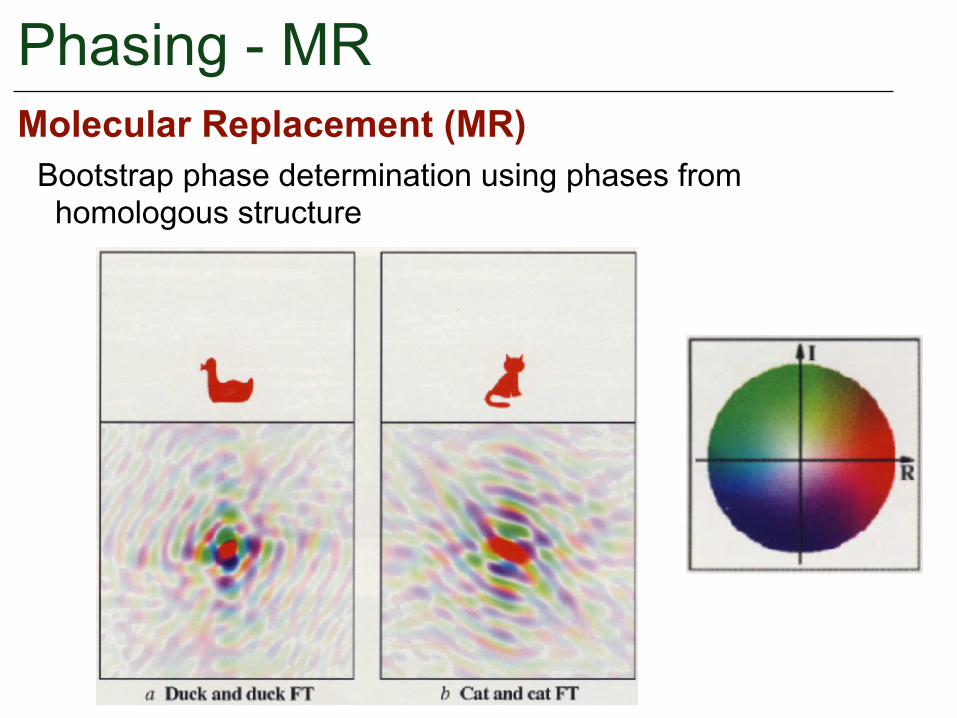
Phasing - MRMolecular Replacement (MR)
Bootstrap phase determination using phases from homologous structure

Phasing - MR

Phasing - MR

Phasing - MR

Phasing - MR

Phasing - MR
Model

Phasing - MR
FT( )
Experiment
Back Transform
compute
compute
Back Transformcompute
compute
FT( )
?

X-Ray Crystallography1) Overview 2) Diffraction Theory 3) Protein Crystals 4) Collecting Diffraction Data 5) ‘Solving’ Diffraction Data - Phasing 6) Electron Density Map 7) Fitting the Map - Generating the Molecular Structure
Diffraction Data Elect. Density Map Fit Elect. Density Map Structure

Electron Density MapWe have initial phase estimates, with confidences
molecular envelopeImprove Map
Initially we will only have confidence in low frequency / resolution terms
Increase overall density to expected density
Ifthen
New density to recompute phases

Electron Density Map
Rhodes, 2000
Series truncated at 6.0 A

Electron Density Map
Rhodes, 2000
Series truncated at 4.5 A

Electron Density Map
Rhodes, 2000
Series truncated at 3.0 A

Electron Density Map
Rhodes, 2000
Series truncated at 1.6 A

3 - 5 Ao
1 Ao
2.5 Ao
Electron Density Map - Tryptophan

X-Ray Crystallography1) Overview 2) Diffraction Theory 3) Protein Crystals 4) Collecting Diffraction Data 5) ‘Solving’ Diffraction Data - Phasing 6) Electron Density Map 7) Fitting the Map - Generating the Molecular Structure
Diffraction Data Elect. Density Map Fit Elect. Density Map Structure
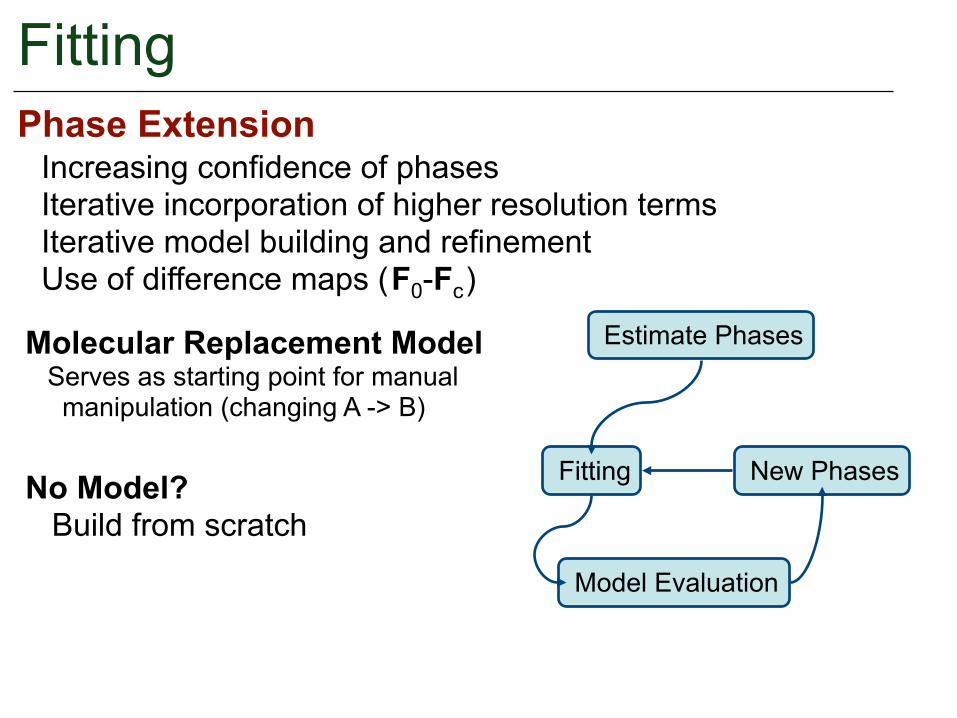
FittingPhase Extension
Increasing confidence of phases Iterative incorporation of higher resolution terms Iterative model building and refinement Use of difference maps ( F0-Fc )
Molecular Replacement Model Serves as starting point for manual manipulation (changing A -> B)
No Model? Build from scratch
Estimate Phases
Fitting
Model Evaluation
New Phases

Fitting / Refinement - Typical1) Early Fittings Often Done Manually First trace - disconnected, fragments, low resolution Ridge lines - through regions of maximum density - backbone? 2) Build Backbone from Trace (find Calpha) 3) Align Sequence to the Trace Find landmarks (ie. characteristic AAs) 4) Place Side-Chains 5) Adjust (refine) Structure
atoms ~4A apart, near the center of the main-chain next to bulges representing side-chains
Phe Leu Lys
Poly-Alanine if unknown
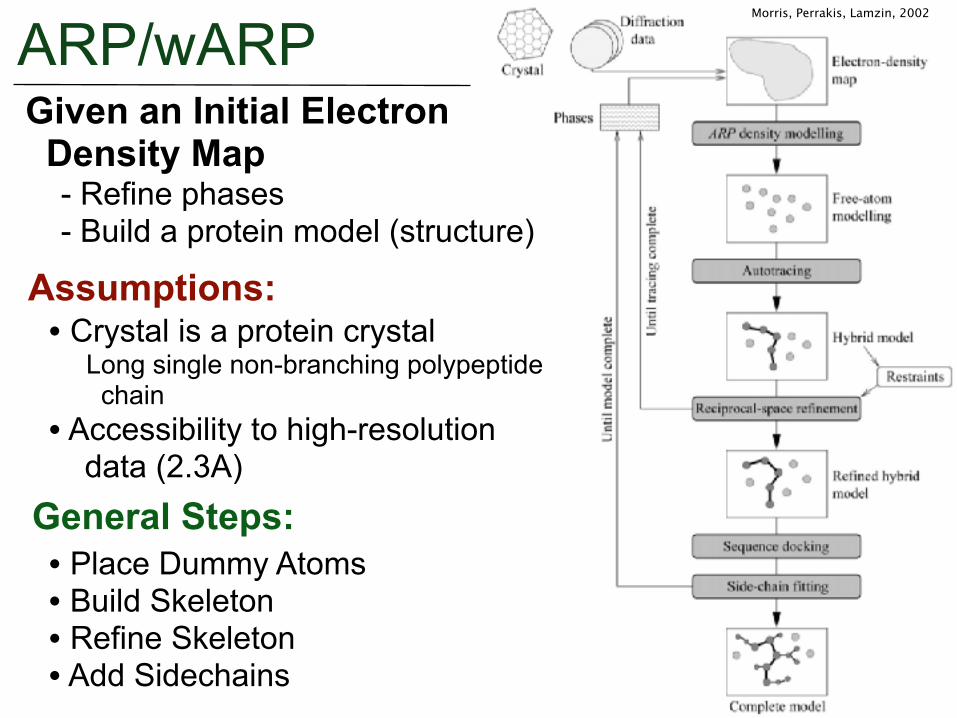
ARP/wARPGiven an Initial Electron Density Map - Refine phases - Build a protein model (structure)
Assumptions:• Crystal is a protein crystal Long single non-branching polypeptide chain • Accessibility to high-resolution data (2.3A)
General Steps:• Place Dummy Atoms • Build Skeleton • Refine Skeleton • Add Sidechains
Morris, Perrakis, Lamzin, 2002

ARP/wARPFlood Electron Density Map with Dummy Atoms
Atoms placed in regions of high electron density Each placed atom is free to move (untethered) Moves: translation, appear, disappear Update phases

ARP/wARP
Flood Electron Density Map with Dummy AtomsAtoms placed in regions of high electron density Each placed atom is free to move (untethered) Moves: translation, appear, disappear Update phases

ARP/wARP
Atoms usually within 0.5A of final position Tasks:• Identify atom types • Identify connectivity • Align to sequence
First: Identify putative positions

ARP/wARPEach should be connected to at least one other approximately 3.8A away in either: -C(=O)-N-Ca Forward (outgoing) -N-C(=O)-Ca Backward (incoming)
For all pairs of atoms ~3.8A apart, check intervening electron density
If correlation of electron density is above threshold:• Make vertex from candidate atoms • Add edge between atoms

ARP/wARP
a
bc
d
r
x
y
(cdxy)
(bcdx) (bcdr)
(abcd)
Given directed graph (previous slide) of candidate Ca
Generate graph where each vertex represents 4 continuous Ca Consider all paths of length 4 in original graph Prune 4-mers that are not consistent with protein structure
Valence Angle
Dihedral Angle
Underlying distribution mined from pdb, represented with Parzen windows of multivariate Gaussians.
ARP/wARP(cdxy)
(bcdx) (bcdr)
(abcd)
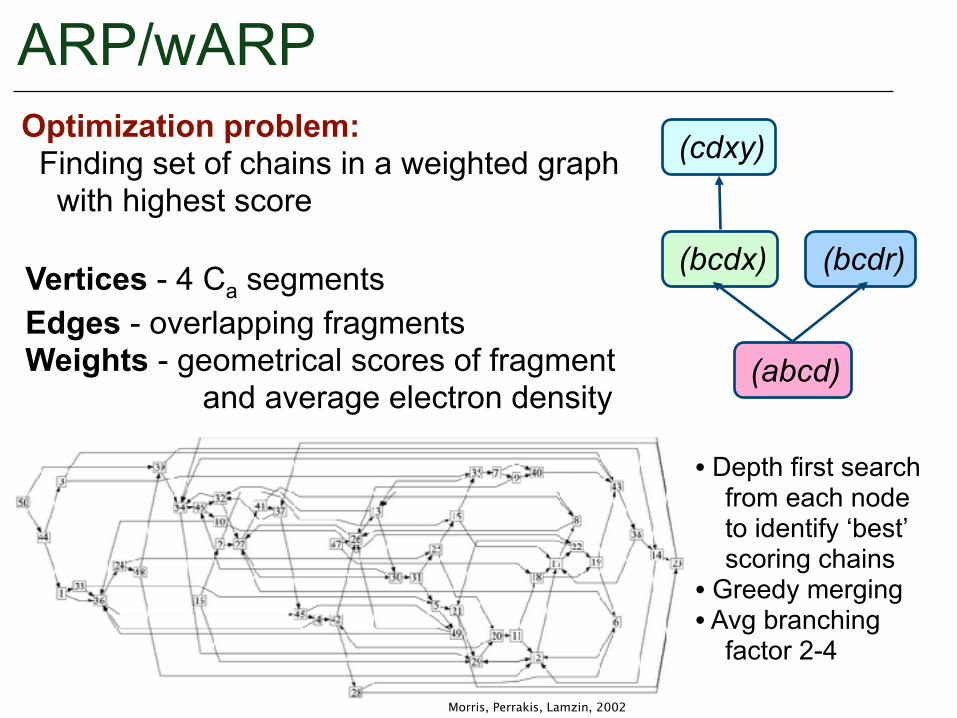
Optimization problem: Finding set of chains in a weighted graph with highest score
Vertices - 4 Ca segments Edges - overlapping fragments Weights - geometrical scores of fragment and average electron density
Morris, Perrakis, Lamzin, 2002
• Depth first search from each node to identify ‘best’ scoring chains • Greedy merging • Avg branching factor 2-4

ARP/wARPSidechains
Consider atoms neighbouring Cas but not part of the backbone. Compute a mini-feature vector for each Ca, based on number of atoms hanging off the Ca
Asp Val
Ser
112 12 11
Ca
Ca
Compute probability of each AA type for each Ca density region Di
Compute score of sliding window over observed densities D and known sequence S

TEXTALLocate putative Ca positions Use of rotation invariant feature vectors• Average Density / Distance to center of mass • Moment of Inertia Based, Skewness (magnitudes and ratios) • Tubes (Ca should have 3 regions of density extending out)
19 Features per Radius (4 radii used) Compare feature vectors to classify each Ca into Structure and AA type Match against fragments from the PDB database
Phe Leu Lys

TEXTAL
TEXTAL: green structure, top sequence Correct / Refined: white structure, bottom sequence
Holton, Ioerger, Christopher, Sacchettini, 2000

TEXTAL
Holton, Ioerger, Christopher, Sacchettini, 2000
TEXTAL: white Correct: blue

TEXTAL
Holton, Ioerger, Christopher, Sacchettini, 2000
TEXTAL: white Correct: blue
Results Building 12 ProteinsMean Ca RMSD = 0.96A All atom RMSD = 1.04A

Iterative Structure Solution - XRC
Experimental Magnitudes
Initial Phases
Inverse FT
Experiment
Electron Density
Model Fitting
Model Refinement
Electron DensityFourier Transform
Phases
Iterative Process

Nuclear Magnetic Resonance Spect.Proteins in Solution - high concentration, but don’t want crystal
• Get dictionary of resonances • Measure geometric constraints (bond, angle, space)
Two broad classes of experiments:
Generate ensemble of conformations consistent with constraints Can measure protein dynamics

Effect of Local Environment
Different Atoms Different Electronic Environments Atoms experience B0 differently Resonate at different frequencies slightly different frequencies
B0
IMPORTANT
Ala
NMR
NH
O
C CH
H
R
N
O
C C
H H
R
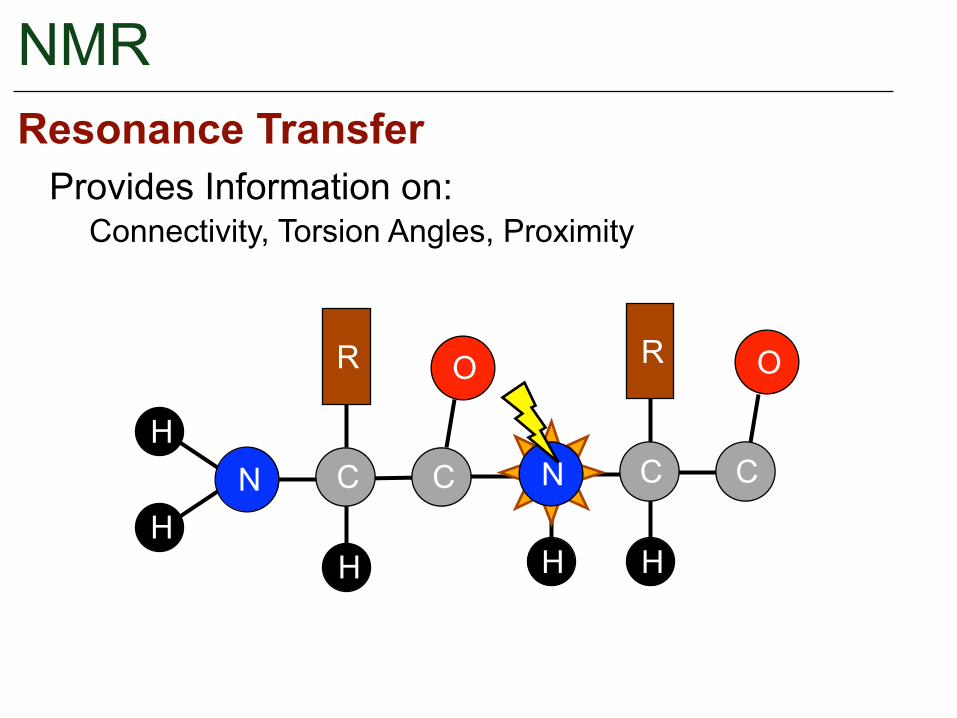
Provides Information on:Resonance Transfer
Connectivity, Torsion Angles, Proximity

NMR
NH
O
C CH
H
R
N
O
C C
H H
R
FID
Provides Information on:Resonance Transfer
Connectivity, Torsion Angles, Proximity

NMR
Spectra are Unassigned! Unknown correspondence between spectral peak and residue
Assignment Problem!
A43 L44 Y45 V46 S47 S48
?
D
T
I
E
N
K
1
6
5
2
4
3

NMRPeak Picking Problem!

HSQCHeteronuclear Single- Quantum Correlation
Through Bond Experiment Identifies NH Resonances
Cross-Peaks indicate that atoms are coupled (aka Spin System)

NMR
Resonance Assignments (assume peaks picked) Geometric Constraints
Three Main Stages
Dihedrals: J-couplings - interaction of dipoles Interatomic Distances: NOEs Relative Bond Vector Orientation: RDCs
Structure Generation
2D vs 3D vs ...Multidimensional NMR Vary transfer times Spreads peaks out Allows better peak picking

NMR - Experiment Types
N
O
C C
H
R
N
O
C C
H H
R
H
N
O
C C
H H
R
HSQC - (HN(i), N(i)) HNCA - (HN(i), N(i), Ca(i)) & (HN(i), N(i), Ca(i-1)) HNCOCA - (HN(i), N(i), Ca(i-1)) HNCO, HNCACO, CCONH, CBCACONH, HNCACB

NMR - Experiment Types
N
O
C C
H
R
N
O
C C
H H
R
H
N
O
C C
H H
R
HSQC - (HN(i), N(i)) HNCA - (HN(i), N(i), Ca(i)) & (HN(i), N(i), Ca(i-1)) HNCOCA - (HN(i), N(i), Ca(i-1)) HNCO, HNCACO, CCONH, CBCACONH, HNCACB

NMR
NOESY
Through Space Resonance Transfer
Nuclear Overhauser Effect (NOE) Through Space Resonance transferred between two non-bonded hydrogens. Strength falls off as r
6
Atoms must be <6A apart

NMR
NOESY Nuclear Overhauser Effect (NOE) Through Space Resonance transferred between two non-bonded hydrogens. Strength falls off as r
6
Atoms must be <6A apart
Large Peaks Medium Peaks Smaller Peaks
0 - 2.5 A 0 - 3.5 A 0 - 5.0 A
Crude Distance Measurements

NMRResidual Dipolar Couplings
B0
NO
CC
HH
R
Measures angle of bond vector wrt B0
Use of partially aligning media
B0
NH
Provides additional geometric constraint

NMR
Geometric Constraints
Available Information
Dihedrals: J-couplings - interaction of dipoles Interatomic Distances: NOEs Relative Bond Vector Orientation: RDCs
Sequential Connectivity HSQC, HNCAResidue Type ‘Assignment’ TOCSYThrough Space Distance Constraints NOEs
Bond Vector Orientations RDCs

NMR - Structure GenerationChallenges: Missing information False information
DYANA Start with ‘random’ conf. Energy function of PE, KE Torsion Angle Optimization MD with Simulated Annealing
torsion angle constraints
distance constraints
Typical Approach: MC or Molec. Dynamics
NOE

NMR
Well-Ordered Regions
Disordered Regions

SAR-by-NMRStructure-Activity-Relationship or Chemical Shift PerturbationAssists in Ligand Binding and Protein-Protein Interactions

SAR-by-NMRStructure-Activity-Relationship or Chemical Shift PerturbationAssists in Ligand Binding and Protein-Protein Interactions

Label Protein
Collect Spectra
Peak Picking
Resonance Assignment
Distance
Dihedral
Bond Vector Orientation
Ensemble Structure
Generation
GEOMETRIC CONSTRAINTS
Assignment Problem• Noise, Degeneracy • Often cast as graph algorithm • Locate Mutually Consistent Information
Structure Generation• Identify structures consistent with most geometric constraints • Must ignore some constraints • Utilize prior knowledge
phi, psi constraints
10-20 NOE per AA
Interpreting Dynamics Information• Model time evolution of spin-systems
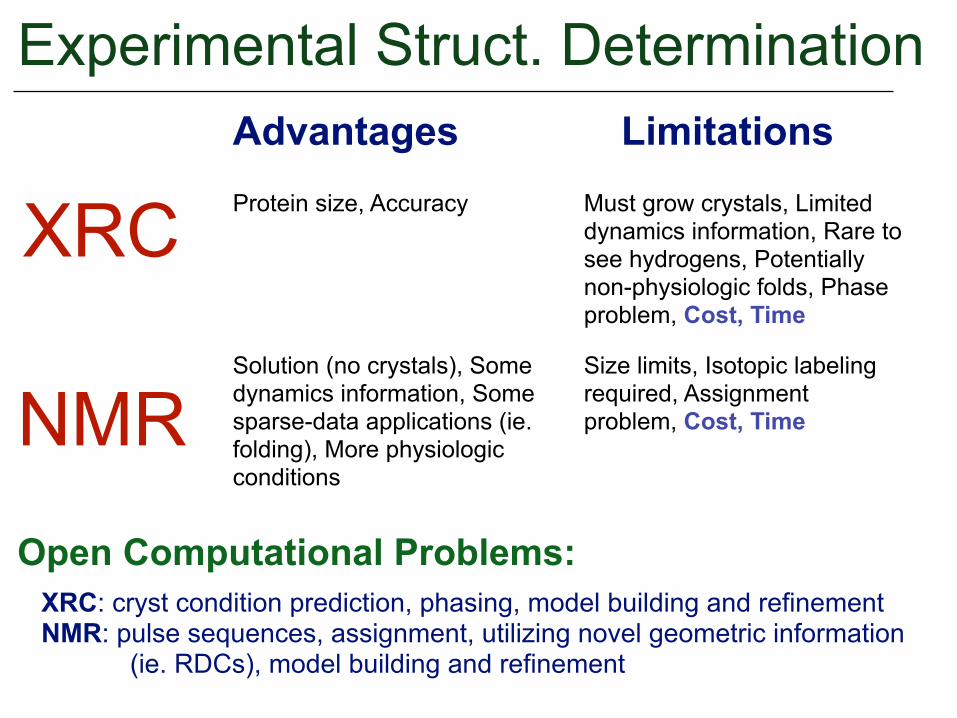
Experimental Struct. Determination
XRCAdvantagesProtein size, Accuracy
LimitationsMust grow crystals, Limited dynamics information, Rare to see hydrogens, Potentially non-physiologic folds, Phase problem, Cost, Time
NMRSolution (no crystals), Some dynamics information, Some sparse-data applications (ie. folding), More physiologic conditions
Size limits, Isotopic labeling required, Assignment problem, Cost, Time
XRC: cryst condition prediction, phasing, model building and refinement NMR: pulse sequences, assignment, utilizing novel geometric information (ie. RDCs), model building and refinement
Open Computational Problems:

Drews, Science, March 17 2000
Drug Targets

Drug DesignTraditional Drug Design
Active Site:• Small compared with rest of protein • Three dimensional crevice • Binding specificity based on functional groups of active site residues (obvious)
Ligand: Any small, non-protein molecule capable of binding something Typically <50 atoms Inhibitors are usually analogs of natural substrate
Identify small molecule capable of binding protein active site and inhibiting protein function
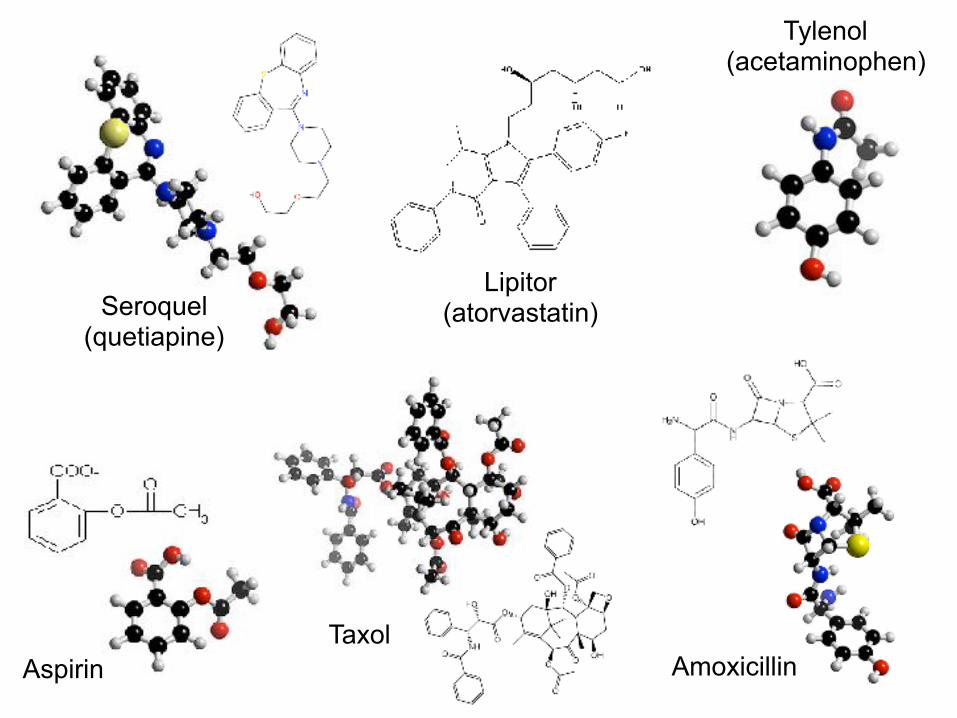
Tylenol (acetaminophen)
Lipitor (atorvastatin)Seroquel
(quetiapine)
AspirinTaxol
Amoxicillin


Kitchen, Decornez, Furr, Bajorath, Nature Reviews Drug Disc, 2004
Protein-Ligand Interactions

Protein Ligand Binding
Kitchen, Decornez, Furr, Bajorath, Nature Reviews Drug Disc, 2004

Protein Ligand Binding
Maximum Likelihood min( )(pick most probable)
Global Minimum Energy Conformation
Bayesian ∫1 Z
Probability ↔ Energy using Boltzmann distribution
(average over all conformations)

High Throughput Screening (HTS)
Brute Force

Choice of Protein Target
Protein Structure: XRC, NMR, Modeling
3D Ligand Database
Docking
Struct of Prot-Lig Complex
Lead Compound
Linking Building
Synthesis
Screening
Redesign, improve affinity, specificity,
pharmacodynamics, toxicity
If promisingPre-Clinical Trials Clinical Trials
Drug
SBDD Process
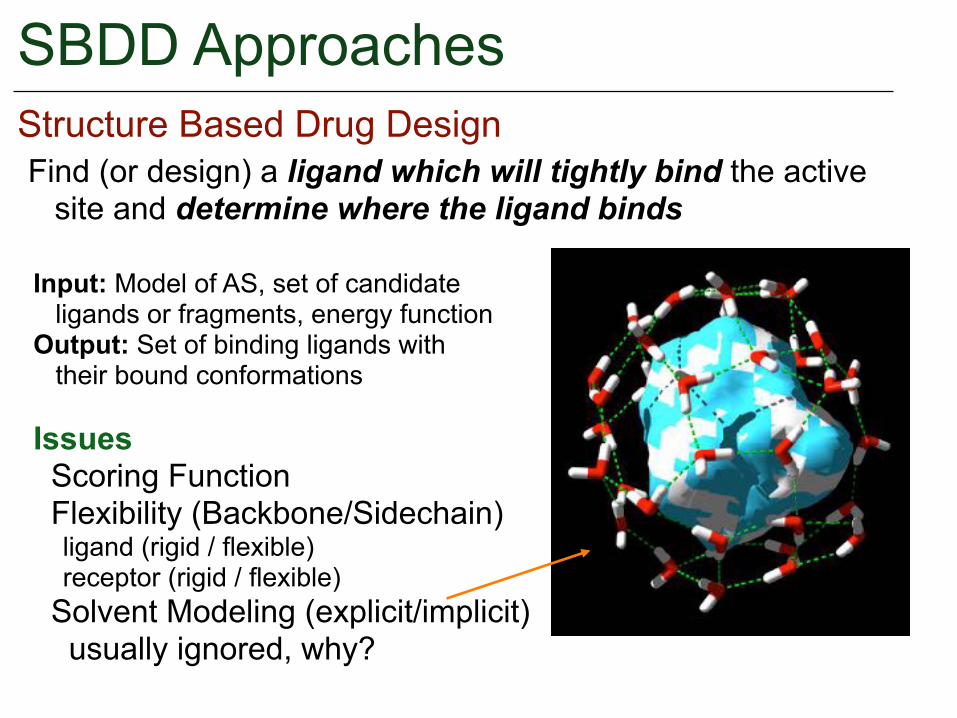
SBDD ApproachesStructure Based Drug DesignFind (or design) a ligand which will tightly bind the active site and determine where the ligand binds
Input: Model of AS, set of candidate ligands or fragments, energy function Output: Set of binding ligands with their bound conformations
Issues Scoring Function Flexibility (Backbone/Sidechain) ligand (rigid / flexible) receptor (rigid / flexible) Solvent Modeling (explicit/implicit) usually ignored, why?

The believed interaction site is in RED
A wildly variable side loop is in BLUE
Molecular Flexibility3 ‘Snapshots’ of CBFb

SBDD ApproachesStructure Based Drug Design
Sousa, Fernandes, Ramos, PROTEINS, 2006
AutoDock
FlexXFTDOCK
DOCKGOLD
Database Search Docking - Virtual Screening
De Novo Ligand Design Building vs. Bridging
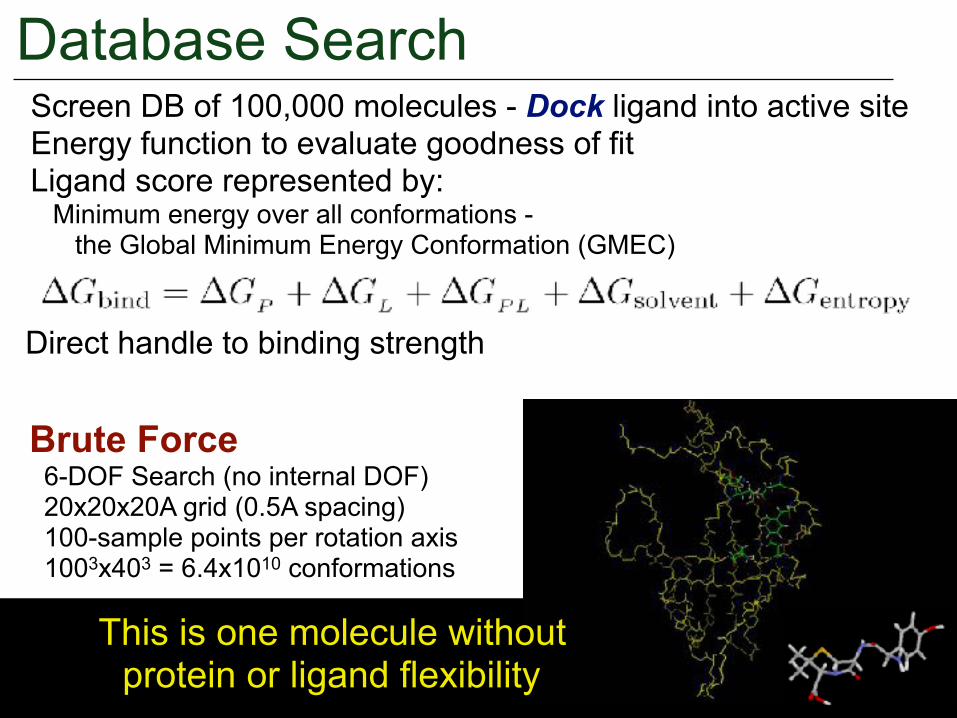
Database SearchScreen DB of 100,000 molecules - Dock ligand into active site Energy function to evaluate goodness of fit Ligand score represented by: Minimum energy over all conformations - the Global Minimum Energy Conformation (GMEC)
Brute Force 6-DOF Search (no internal DOF) 20x20x20A grid (0.5A spacing) 100-sample points per rotation axis 1003x403 = 6.4x10¹⁰ conformations
This is one molecule without protein or ligand flexibility
Direct handle to binding strength

Database Search
Random Methods Monte Carlo / Simulated Annealing Genetic Algorithms (state variables ‘genes’) Tabu Search (avoid previously seen solutions) Simulation Methods Molecular Dynamics Minimization Methods Energy Minimization (rarely used alone)
Docking Search Methods
Docking ScoringEmpirical Energy function (varying types) Some with explicit hydrogen-bond terms

Database SearchLigand Flexibility
Ensemble-Based Generate multiple conformations of each ligand Dock each conformation Compute some consensus score (weighted average) Explicitly Modeled with Hinges Maintain information on rotatable dihedrals Allow them to move during docking May need to utilize ‘rotamers’ to get over energy barriers
Protein (Receptor) FlexibilitySystematic modeling not feasible Some approaches Explicit Backbone vs Sidechain Flexibility Dock against Ensemble (FlexX, FlexE) Multiple ‘static’ conformations Harmonic (Normal) Mode Analysis Soft-Receptors (dampen vdW term)
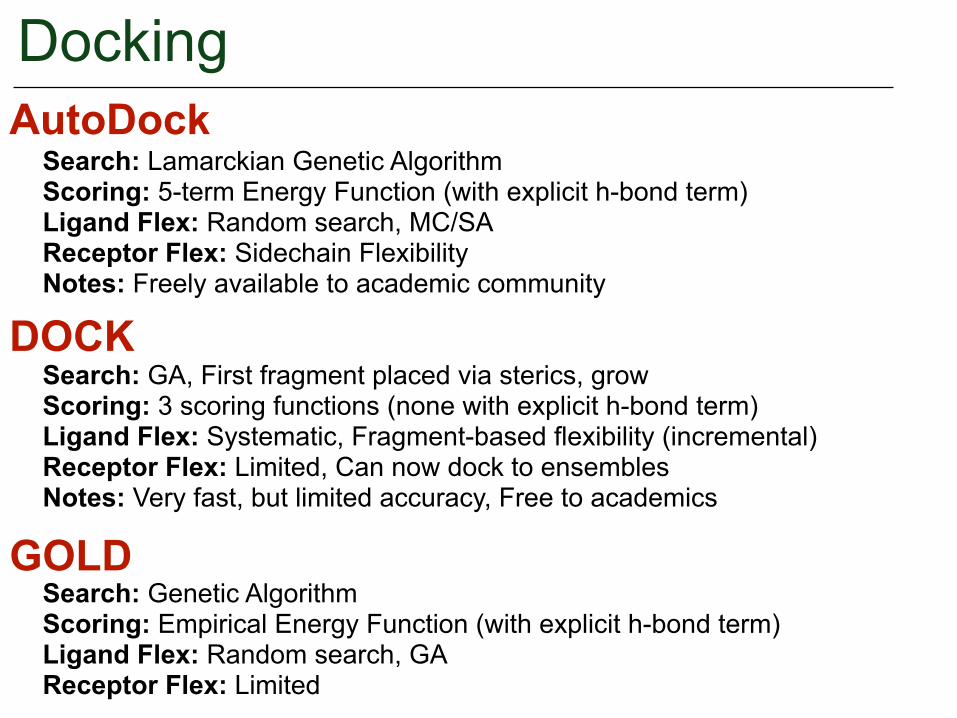
DockingAutoDock
Search: Lamarckian Genetic Algorithm Scoring: 5-term Energy Function (with explicit h-bond term) Ligand Flex: Random search, MC/SA Receptor Flex: Sidechain Flexibility Notes: Freely available to academic community
DOCKSearch: GA, First fragment placed via sterics, grow Scoring: 3 scoring functions (none with explicit h-bond term) Ligand Flex: Systematic, Fragment-based flexibility (incremental) Receptor Flex: Limited, Can now dock to ensembles Notes: Very fast, but limited accuracy, Free to academics
GOLDSearch: Genetic Algorithm Scoring: Empirical Energy Function (with explicit h-bond term) Ligand Flex: Random search, GA Receptor Flex: Limited

Docking
Decent at enrichment Not so good at absolute binding strength Most able to predict known protein-ligand poses with 1.5-2A RMSD 70-80% of the time Performance drops dramatically with >7 rotatable bonds Only 20-30% within 1.5-2A No major methodology change over past 10 years
Challenges Scoring function Solvent modeling Deterministic search (better branch-bound algorithms) Micro-Flexibility (Multi-resolution rotamers?) Macro-Flexibility (NMR?, Harmonic Mode Analysis?)
Performance

de novo
Building Methods (Grow methods) Start with seed fragment Selectively add atoms (fragments)
Bridging (Linking) Methods Dock multiple fragments Connect by bridging
• Based on identification and satisfaction of interaction sites • Select interaction sites • Satisfy interaction sites with functional groups • Join functional groups (Bridging technique) • Refine structure
General Scheme
h-bond donors h-bond acceptors electrostatic hydrophobic

de novo
Building (Grow) Methods
Schneider, Fechner, Nature Rev Drug Disc, 2005
Define Binding Pocket
Determine Interaction Sites
Bridging (Linking) Methods

de novoMajor Challenges• Problems when interaction sites are far away • Very difficult to model receptor flexibility • Synthetic accessibility • Suggested molecules may not be chemically stable • Pharmacodynamic / Pharmacokinetic properties of ligands
Components / ParametersBuilding Blocks: Atoms vs. Fragments Search Strategy: Deterministic (DFS, BFS), Random (MC, GA) Construction: Bridging vs. Building Scoring Function: Empirical Energy Force Field

de novo - BuildupMonte Carlo de Novo Ligand Generator (MCDNLG)Building Blocks: Atom Search Strategy: Random MCActive Site starts filled with CarbonsMonte Carlo Steps• Change atom occupancy (on/off) • Change atom position • Change bond type (off/single/double) • Change atom type (C,N,O) • Rotate/Translate a fragment
Heuristic Penalties and Rewards 300,000 steps in typical run
Gehlhaar et al., 1995

de novo - BuildupGROWBuilding Blocks: Fragments Search Strategy: Beam Search
Moon and Howe, 1991
Attach new fragment Rotate around new bond Energy minimize

de novo - BridgingSPROUT
Building Blocks: Fragments Search Strategy: DFS/BFS, A* Search
Generate Skeletons of 3D Fragments• No notion of element type • Anchor one vertex of template, rotate (15o) increments • Continue to add fragments until some fraction of sites linked • All templates added in all ways • A* search (branch-and-bound)
Find ‘target sites’ Known ligand binding site Manual ligand docking Multiple Copy Simultaneous Search (MCSS) Pharmacophore

de novoSPROUT
http://chem.leeds.ac.uk/ICAMS/SPROUT/zsolt/sprout_galery.html
Substitute Real Atoms into Skeleton• Based on binding character (H-Donor/Acceptor) • Conformations grouped by common ancestors

PharmacophoresPharmacophore: A molecular framework that carries (phoros) the essential features responsible for a drug’s (=pharmacon's) biological activity -Paul Ehrlich
Useful when Active Site structure unknown Have Positive and Negative Ligand Examples
[C,N]
4.2-7.3A
4.9-7.3A
4.7-5.1A
Can Reduce Pharmacophore Matching Problem to Clique
3D PharmacophorePaul Ehrlich (1854–1915)
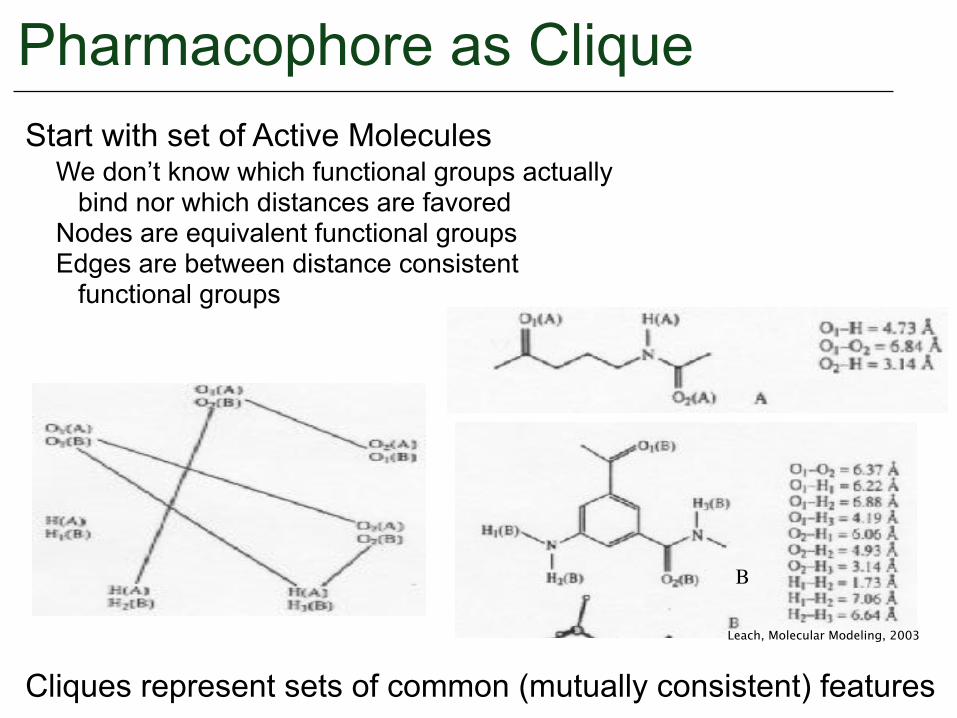
Pharmacophore as CliqueStart with set of Active Molecules
We don’t know which functional groups actually bind nor which distances are favored Nodes are equivalent functional groups Edges are between distance consistent functional groups
Cliques represent sets of common (mutually consistent) features
B
Leach, Molecular Modeling, 2003

Pharmacophore
Molecule 1 Molecule 1 and Molecule 2
d1 d1
d2 d2
d1
d2
Constrained Systematic SearchGoal: Identify arrangements of functional groups accessible to all positive binding examples Determine regions of k dimensional hyperspace accessible for first molecule For nth molecule, determine torsion angles that place functional groups in allowed regions Intersect, Maintain common regions

Extensions
Absorption Distribution Metabolism Excretion Toxicity
ADMET problems kill most drugs
Pharmacokinetics / Pharmacodynamics ADMET
Lead OptimizationGiven lead compound (virtual screening, HTS) Suggest changes to improve binding May or may not have structure of lead bound active site
www.netlash.com
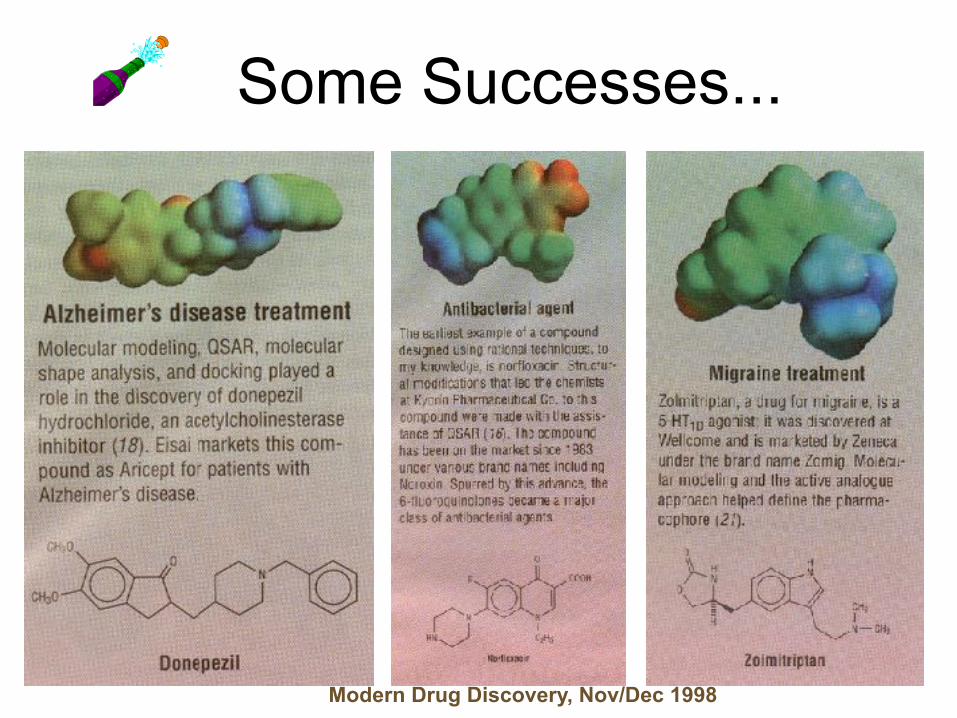
Modern Drug Discovery, Nov/Dec 1998
Some Successes...

Protein Design
Two ProblemsDe Novo Design Very Difficult ReDesign Use of existing protein (backbone) template Improve (thermal) stability Change substrate
Protein design with the use of rotamers and a pairwise energy function is NP-Hard
Suggest a sequence of amino acids capable of folding into a desired conformation or possessing a desired function Inverse protein folding problem
Typically Maximum Likelihood: For each mutation sequence look for the Global Minimum Energy Conformation (GMEC)
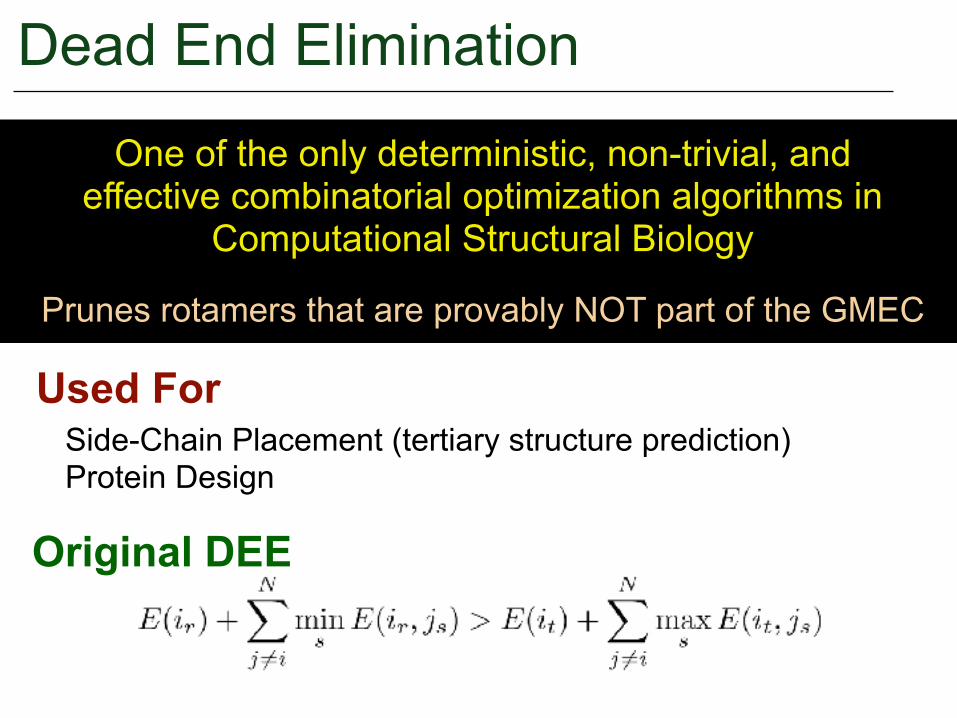
Dead End Elimination
Original DEE
One of the only deterministic, non-trivial, and effective combinatorial optimization algorithms in
Computational Structural Biology
Used ForSide-Chain Placement (tertiary structure prediction) Protein Design
Prunes rotamers that are provably NOT part of the GMEC

1
3
2
Dead End Elimination
Total Energy
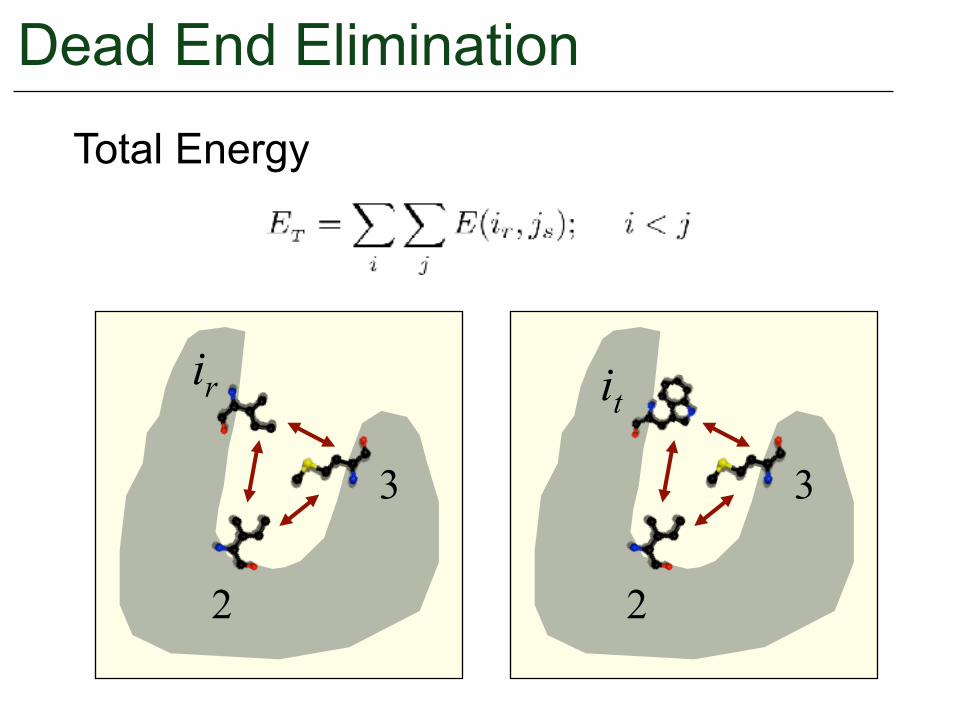
ir it
Total Energy
3
2
3
2
Dead End Elimination
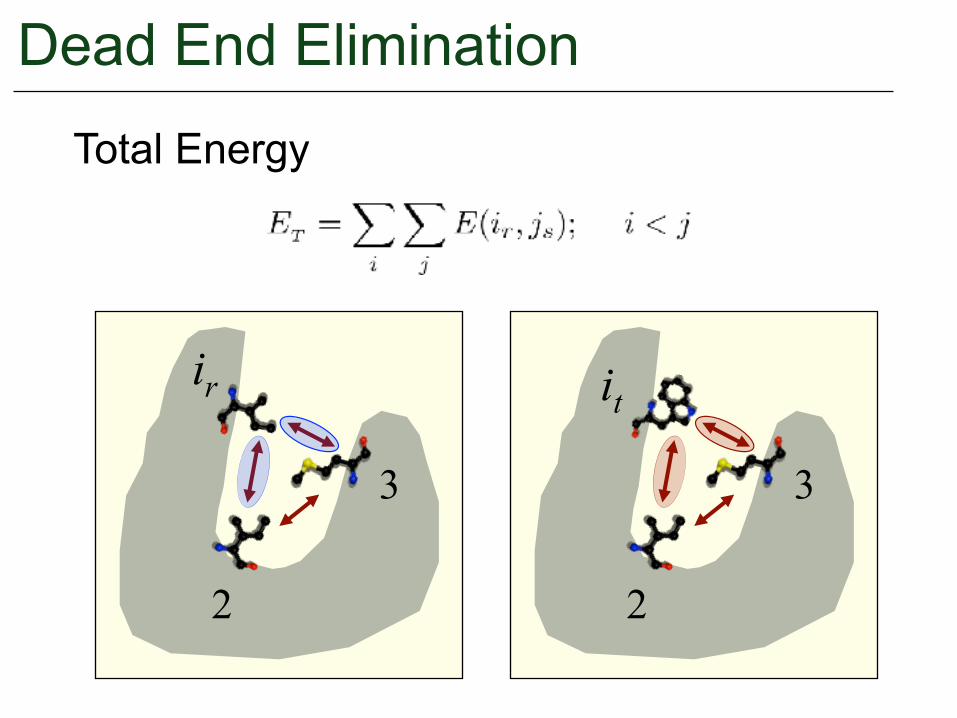
ir it
Total Energy
3
2
3
2
Dead End Elimination

ir it
Total Energy
3
2
3
2
Dead End Elimination

ir it
?
?
?
?3
2
3
2
Dead End EliminationOriginal DEE (Simplified)

ir it
?
?
?
?
min
min
max
max3
2
3
2
Dead End EliminationOriginal DEE (Simplified)
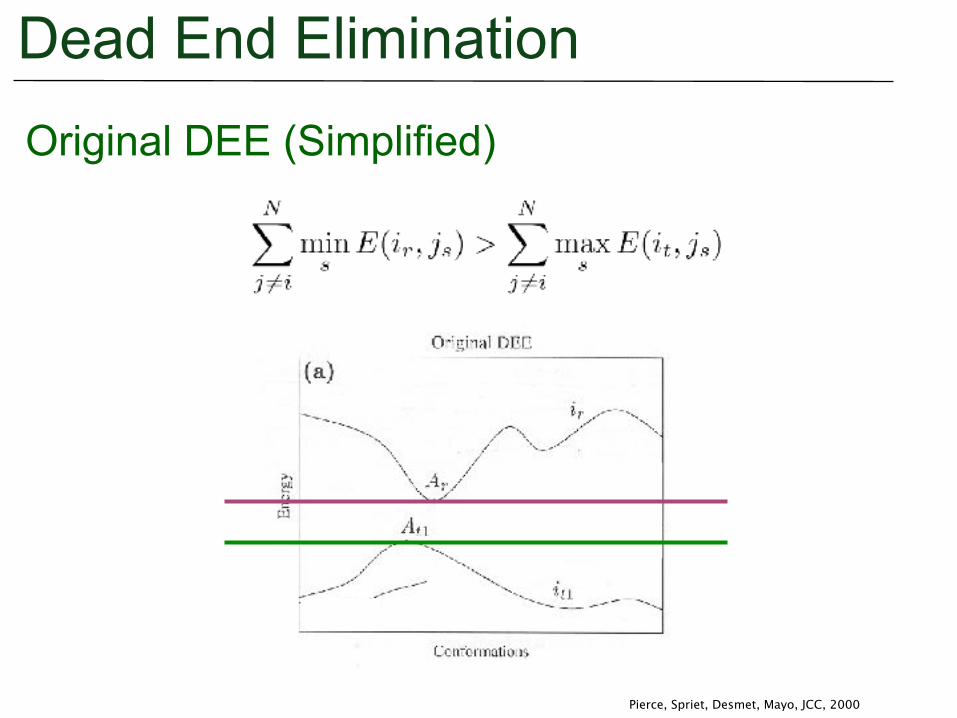
Pierce, Spriet, Desmet, Mayo, JCC, 2000
Dead End EliminationOriginal DEE (Simplified)

Dead End Elimination - ExtensionsOriginal DEE (Simplified)
Pierce, Spriet, Desmet, Mayo, JCC, 2000

Dead End Elimination - ExtensionsOriginal DEE (Simplified)
ir
it
iu
Conformations
Ene
rgy
ir cannot be
pruned by it or iubut it can be by it AND iu

Leach, Lemon. Proteins 33(2):227-39 (1998)
Let f (x) be the score of node x f (x) = g(x) + h(x)
g(x) = cost of path from root to node x h(x) = lower bound on cost of path from x to leaf
A* Search - Conformation Treeg
h

A1(21) A2(108) A3(206)
Leach, Lemon. Proteins 33(2):227-39 (1998)
A* Search - Conformation Tree

A1(21) A2(108) A3(206)
A1B2(21) A1B1(22) A1B3(22) A2(108) A3(206)
Leach, Lemon. Proteins 33(2):227-39 (1998)
A* Search - Conformation Tree

A1(21) A2(108) A3(206)
A1B2(21) A1B1(22) A1B3(22) A2(108) A3(206)
A1B2C2(21) A1B1(22) A1B3(23) A1B2C1(25) A2(108) A3(206)
Leach, Lemon. Proteins 33(2):227-39 (1998)
A* Search - Conformation Tree