cma strategic management (part 3) study unit twelve
TRANSCRIPT

PIONEERS ACADEMYCMA - PART 1
FINANCIAL PLANNING, PERFORMANCE, AND ANALYTICS
Section C: Planning, Budgeting, and Forecasting….(20%)
Unit 12 : Analysis, Forecasting, and Strategy.Unit 13 : Budgeting – Concepts and Methodologies.Unit 14 : Budgeting – Calculations and Pro Forma Financial
Statements.
1Samer Odeh - CMA, CIA, CIPA, CRP, CBA

PIONEERS ACADEMY
UNIT 12
Analysis , Forecasting, and Strategy
2Samer Odeh - CMA, CIA, CIPA, CRP, CBA
UNIT OUTLINE
Correlation and Regression. Learning Curve Analysis. Expected Value and Sensitivity Analysis. Strategic Management. Strategic Planning.
3© 2021 Samer Odeh - Pioneers
Correlation and Regression
© 2021 Samer Odeh - Pioneers4
Forecasting Methods
A vital function of managing any business is planning for the future.
Forecasts are the basis for business plans.
Forecasts are used to project product demand, inventory level, cash flow, etc.
© 2021 Samer Odeh - Pioneers 5
1. Qualitative methods rely on:o Manager’s experience and intuition.o Personal Motivation.
2. Quantitative methods use mathematical models & graphs and rely on:o Logic.o Historical Data.o Scientific Analysis.o Modeling.
© 2021 Samer Odeh - Pioneers 6
Forecasting Methods
Forecasting Methods
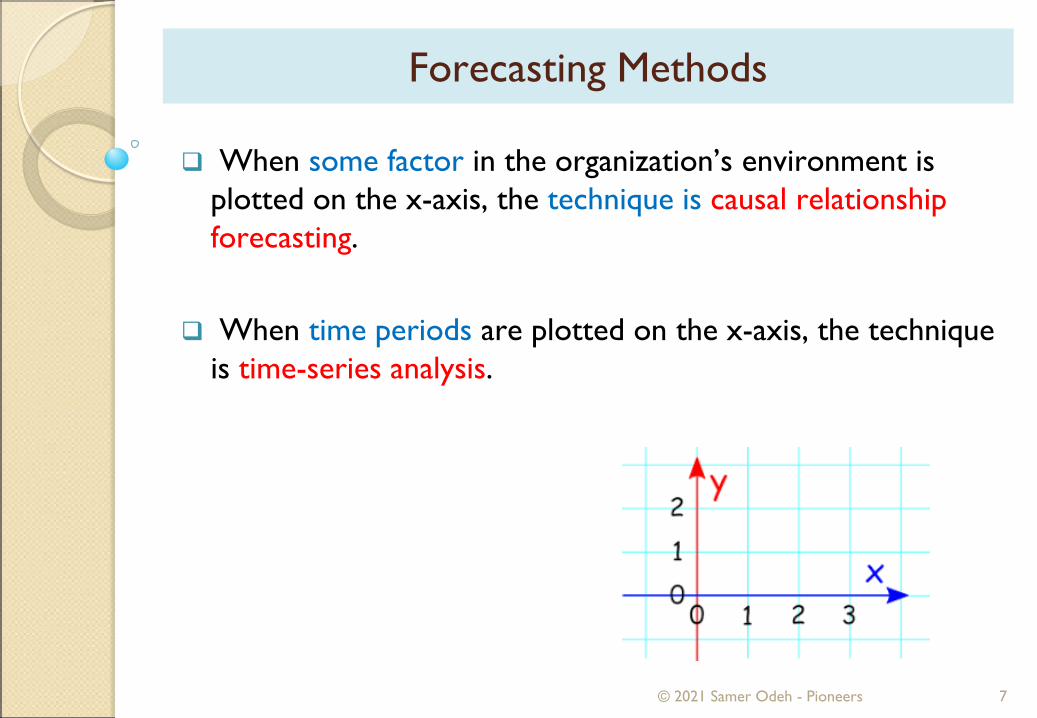
When some factor in the organization’s environment is plotted on the x-axis, the technique is causal relationship forecasting.
When time periods are plotted on the x-axis, the technique is time-series analysis.
© 2021 Samer Odeh - Pioneers 7
In forecasting, historical data is used in various ways.
We may look at the past to discover a pattern for use in predicting the future.
Or we may look at the past relationship between twofactors to determine if there has been a cause-and-effectrelationship between them that can be used to predict future results.
© 2021 Samer Odeh - Pioneers 8
Forecasting Methods

Thus, there are two basic forecasting methods:
1) Time series methods, which look only at the historical pattern of one variable and generate a forecast byextrapolating the pattern using one or more of the components of the time series.
2) Causal forecasting methods, which look for a cause-and-effect relationship between the variable we are trying to forecast (the dependent variable) and one or more other variables (the independent variables).
© 2021 Samer Odeh - Pioneers 9
Forecasting Methods

Correlation Analysis
Correlation analysis is the foundation of any quantitativemethod of forecasting.
Correlation is:o The strength of the linear relationship between two
variables.o Expressed mathematically in terms of the coefficient of
correlation (r). o It can be graphically depicted by plotting the values for the
variables on a graph in the form of a scatter diagram. o (r) measures both the direction (positive or negative) and
the strength of the linear association.
© 2021 Samer Odeh - Pioneers10
Coefficient of Correlation (r)
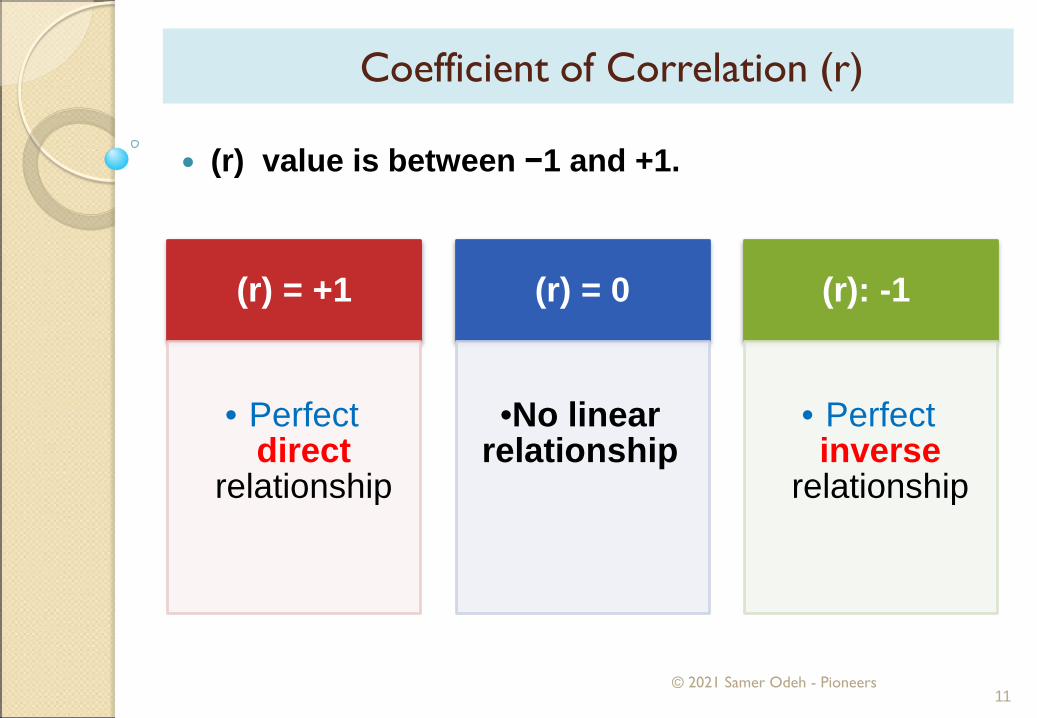
(r) value is between −1 and +1.
(r) = +1
• Perfectdirect
relationship
(r) = 0
•No linear relationship
(r): -1
• Perfectinverse
relationship
© 2021 Samer Odeh - Pioneers11
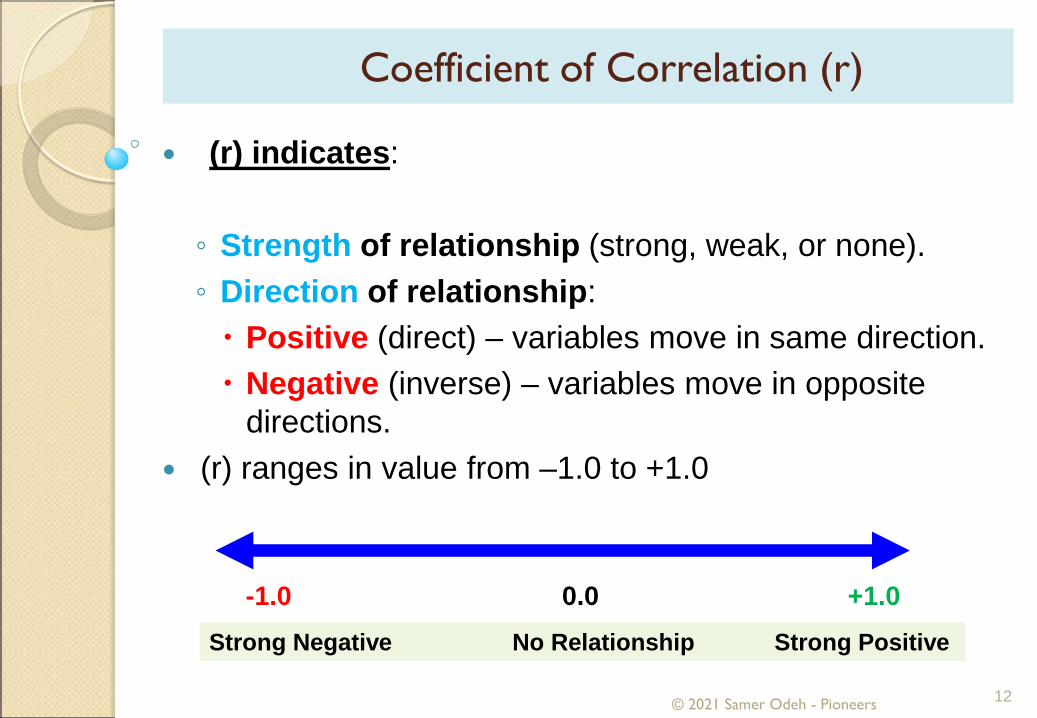
(r) indicates:
◦ Strength of relationship (strong, weak, or none).◦ Direction of relationship: Positive (direct) – variables move in same direction. Negative (inverse) – variables move in opposite
directions. (r) ranges in value from –1.0 to +1.0
-1.0 0.0 +1.0Strong Negative No Relationship Strong Positive
© 2021 Samer Odeh - Pioneers 12
Coefficient of Correlation (r)
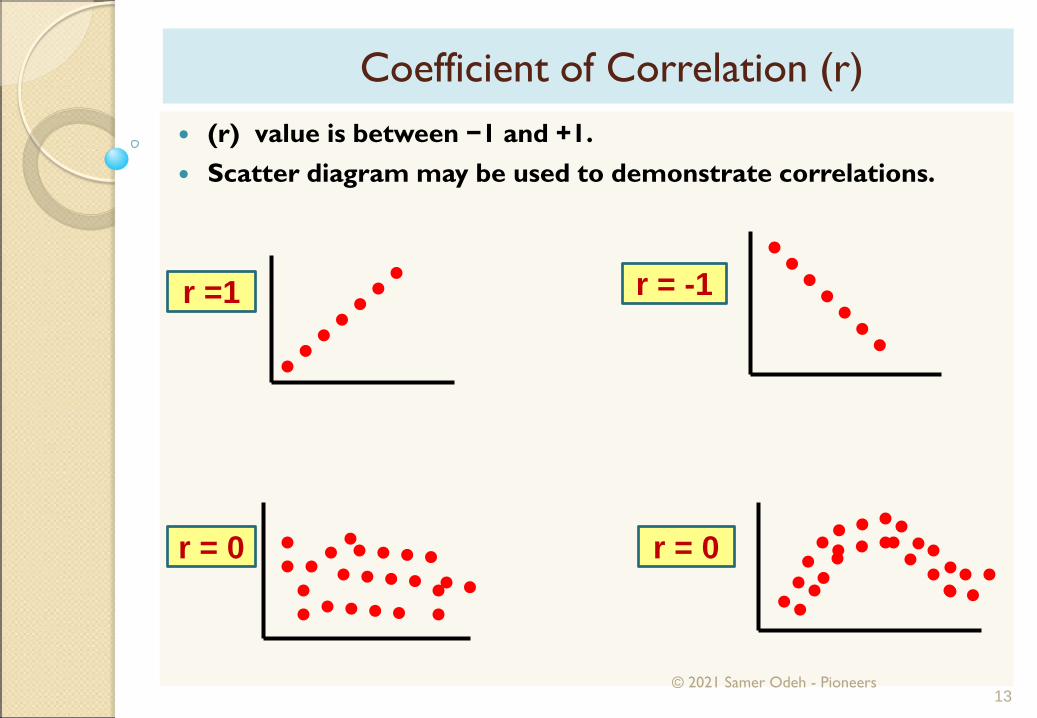
(r) value is between −1 and +1. Scatter diagram may be used to demonstrate correlations.
r =1 r = -1
r = 0 r = 0
© 2021 Samer Odeh - Pioneers13
Coefficient of Correlation (r)

(r) of zero does not mean there is no relationship at allbetween the two variables, only that what relationship they may have cannot be expressed as a linear equation.
Warning: ◦ No proof of causality.◦ Cannot assume x causes y.
© 2021 Samer Odeh - Pioneers14
Coefficient of Correlation (r)
Warning
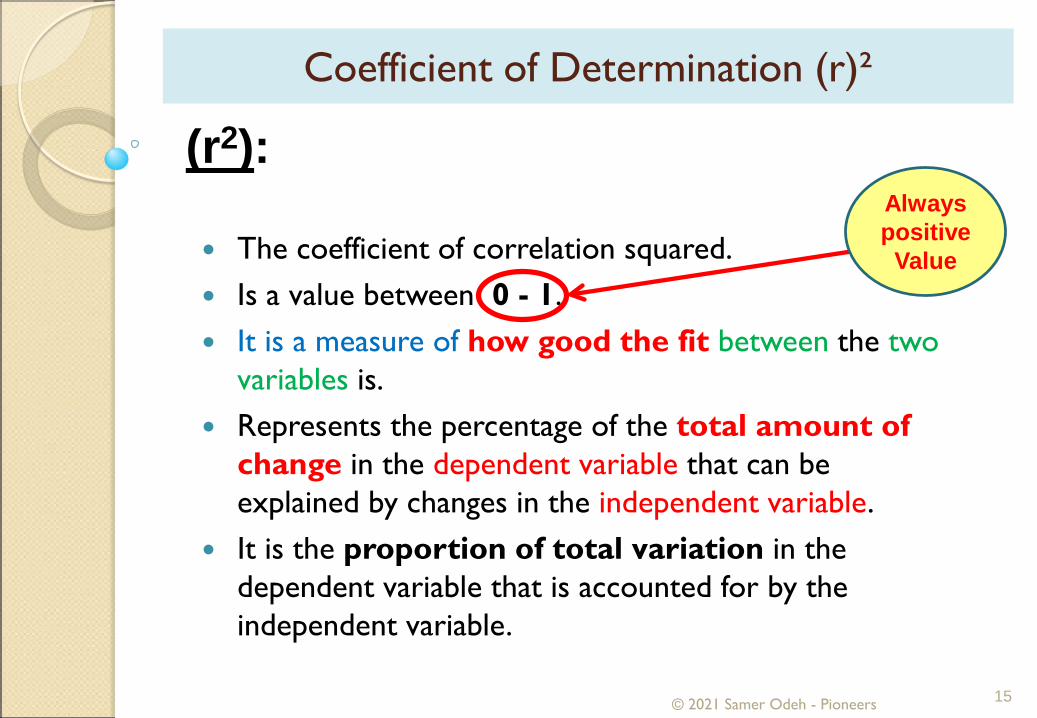
(r2):
The coefficient of correlation squared. Is a value between 0 - 1. It is a measure of how good the fit between the two
variables is. Represents the percentage of the total amount of
change in the dependent variable that can be explained by changes in the independent variable.
It is the proportion of total variation in the dependent variable that is accounted for by the independent variable.
© 2021 Samer Odeh - Pioneers 15
Always positive
Value
Coefficient of Determination (r)²
Note:
If the trend line were down sloping and the coefficient of
correlation were - .9, for example, the coefficient of
determination would still be +.81, since squaring eliminates
the negative value.
© 2021 Samer Odeh - Pioneers16
Coefficient of Determination (r)²

Example:
A car dealership determines that new car sales are a function
of disposable income with a coefficient of correlation of 0.8.
This is equivalent to stating that 64% (0.8²) of the variation of
new car sales from the average can be explained by changes
in disposable income.
© 2021 Samer Odeh - Pioneers17
Coefficient of Determination (r)²
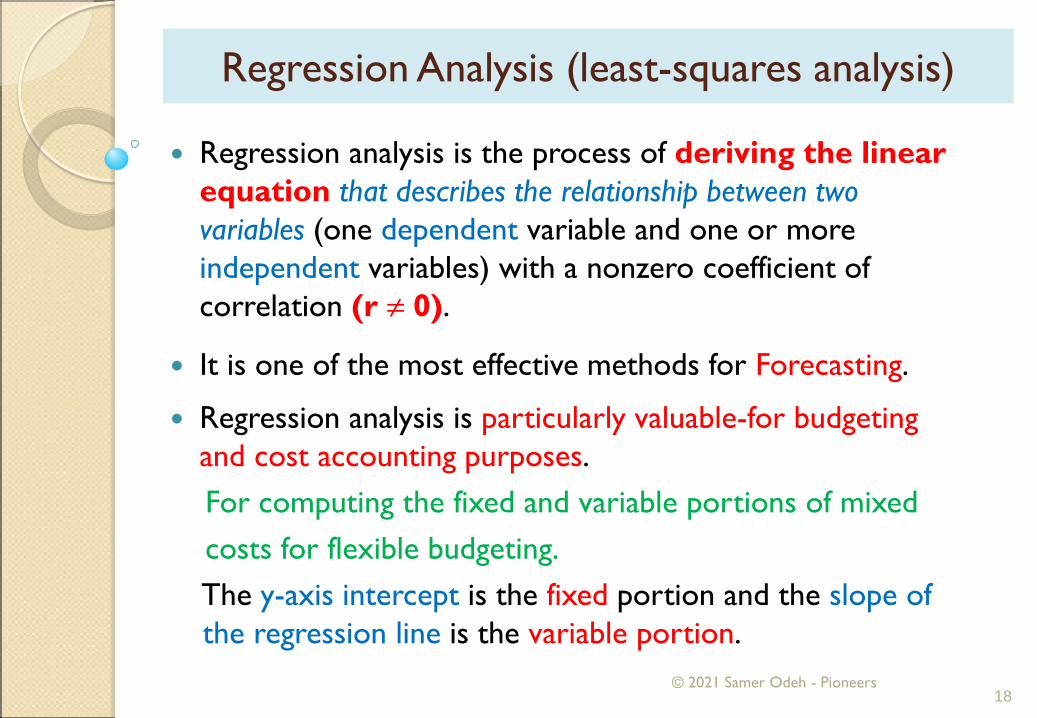
Regression analysis is the process of deriving the linear equation that describes the relationship between two variables (one dependent variable and one or more independent variables) with a nonzero coefficient of correlation (r ≠ 0).
It is one of the most effective methods for Forecasting.
Regression analysis is particularly valuable-for budgeting and cost accounting purposes.For computing the fixed and variable portions of mixedcosts for flexible budgeting.The y-axis intercept is the fixed portion and the slope of the regression line is the variable portion.
© 2021 Samer Odeh - Pioneers18
Regression Analysis (least-squares analysis)

© 2021 Samer Odeh - Pioneers 19
y = a + b X
The DependentVariable:
The cost that isbeing predicted
The IndependentVariable:
The cost driver
The Intercept:Fixed costs
The Slope ofthe Line:
Variable cost per unit
Simple Regression
20
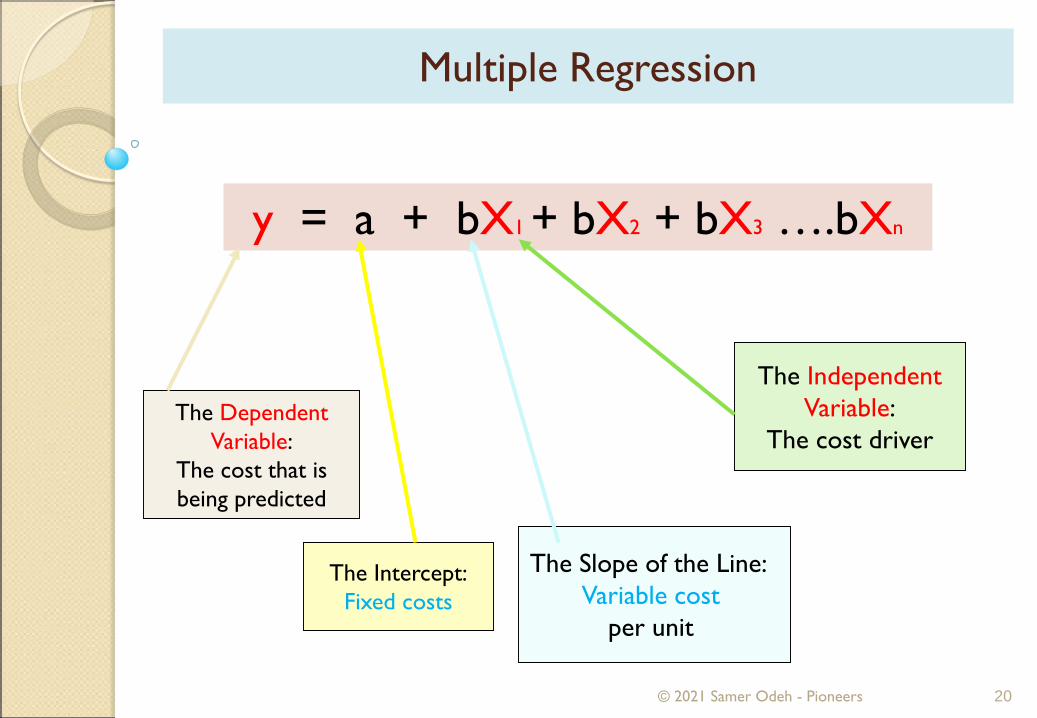
y = a + bX1 + bX2 + bX3 ….bXn
The DependentVariable:
The cost that isbeing predicted
The IndependentVariable:
The cost driver
The Intercept:Fixed costs
The Slope of the Line: Variable cost
per unit
© 2021 Samer Odeh - Pioneers
Multiple Regression

Example:A firm has collected observations on advertising expendituresand annual sales.Advertising Sales($000s) ($000,000s)71 26.331 13.950 19.860 22.935 15.1
© 2021 Samer Odeh - Pioneers 21
Regression Analysis

Example:A firm has collected observations on advertising expenditures and annual sales.Advertising Sales($000s) ($000,000s)71 26.331 13.950 19.860 22.935 15.1
© 2021 Samer Odeh - Pioneers 22
Regression Analysis
Independent Variable dependent
Variable
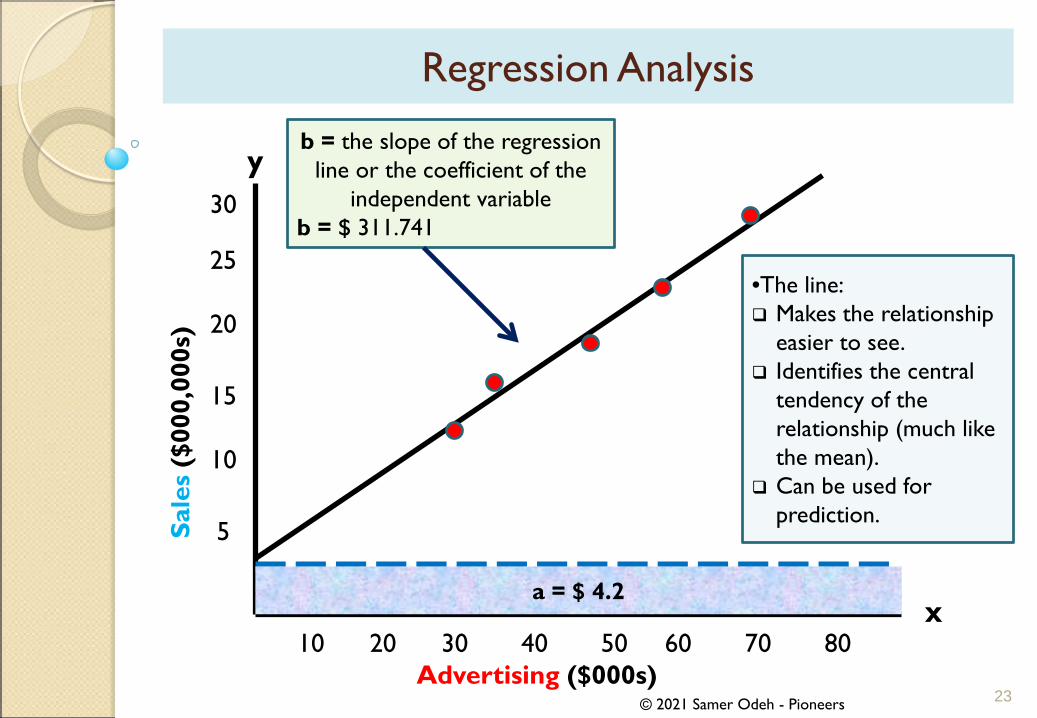
Solving with the least-squares method reveals that expected sales equal $4.2 million plus311.741 times the advertising expenditure.
y = $4,200,000 + 311.741 x
© 2021 Samer Odeh - Pioneers
y
x
25
15
20
5
10
30Sa
les
($00
0,00
0s)
a = $ 4.2
10 20 4030 80706050Advertising ($000s)
•The line: Makes the relationship
easier to see. Identifies the central
tendency of the relationship (much like the mean).
Can be used for prediction.
b = the slope of the regression line or the coefficient of the
independent variableb = $ 311.741
23
Regression Analysis
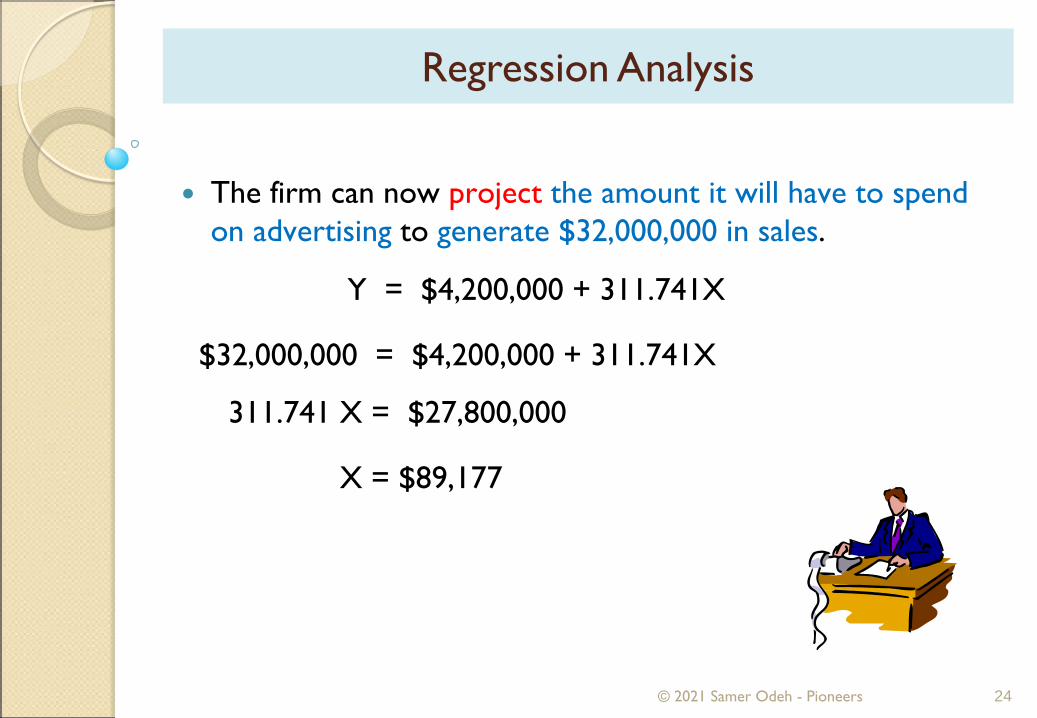
The firm can now project the amount it will have to spend on advertising to generate $32,000,000 in sales.
Y = $4,200,000 + 311.741X
$32,000,000 = $4,200,000 + 311.741X
311.741 X = $27,800,000
X = $89,177
© 2021 Samer Odeh - Pioneers 24
Regression Analysis

Assumptions of linear regression model:
1. The linear relationship established for X and Y is only valid across the relevant range.
2. Regression analysis assumes that past relationships can be validly projected into the future. Economists call this the ceteris paribus assumption
3. The distribution of Y around the regression is constant for different values of X, referred to constant variance or homoscedasticity (all things must remain equal).Thus a limitation of the regression method is that it can onlybe used when the cost patterns remain unchanged from prior periods.
© 2021 Samer Odeh - Pioneers 25
Benefits and Limitations of Regression Analysis

Regression analysis is particularly valuable for budgeting and cost accounting purposes.o Regression analysis is almost a necessity for computing the
fixed and variable portions of mixed costs for flexible budgeting.
o The y-axis intercept is the fixed portion and the slope of the regression line is the variable portion.
Regression does not determine causality.o Although x and y move together, the apparent relationship
may be caused by some other factor.o For instance, car wash sales volume and sunny weather are
strongly correlated, but car wash sales do not cause sunny weather.
© 2021 Samer Odeh - Pioneers 26
Benefits and Limitations of Regression Analysis

Questions and Answers
© 2021 Samer Odeh - Pioneers 27
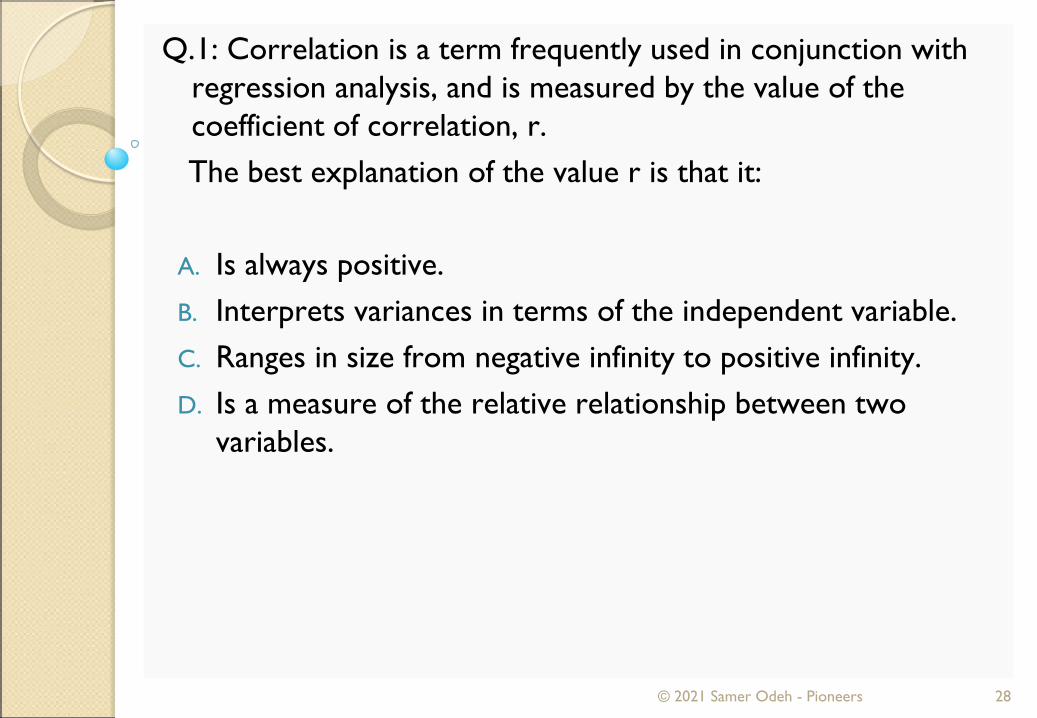
Q.1: Correlation is a term frequently used in conjunction with regression analysis, and is measured by the value of the coefficient of correlation, r.The best explanation of the value r is that it:
A. Is always positive.B. Interprets variances in terms of the independent variable.C. Ranges in size from negative infinity to positive infinity.D. Is a measure of the relative relationship between two
variables.
© 2021 Samer Odeh - Pioneers 28

Q.1: Correlation is a term frequently used in conjunction with regression analysis, and is measured by the value of the coefficient of correlation, r.The best explanation of the value r is that it:
A. Is always positive.B. Interprets variances in terms of the independent variable.C. Ranges in size from negative infinity to positive infinity.D. Is a measure of the relative relationship between two
variables.
© 2021 Samer Odeh - Pioneers 29
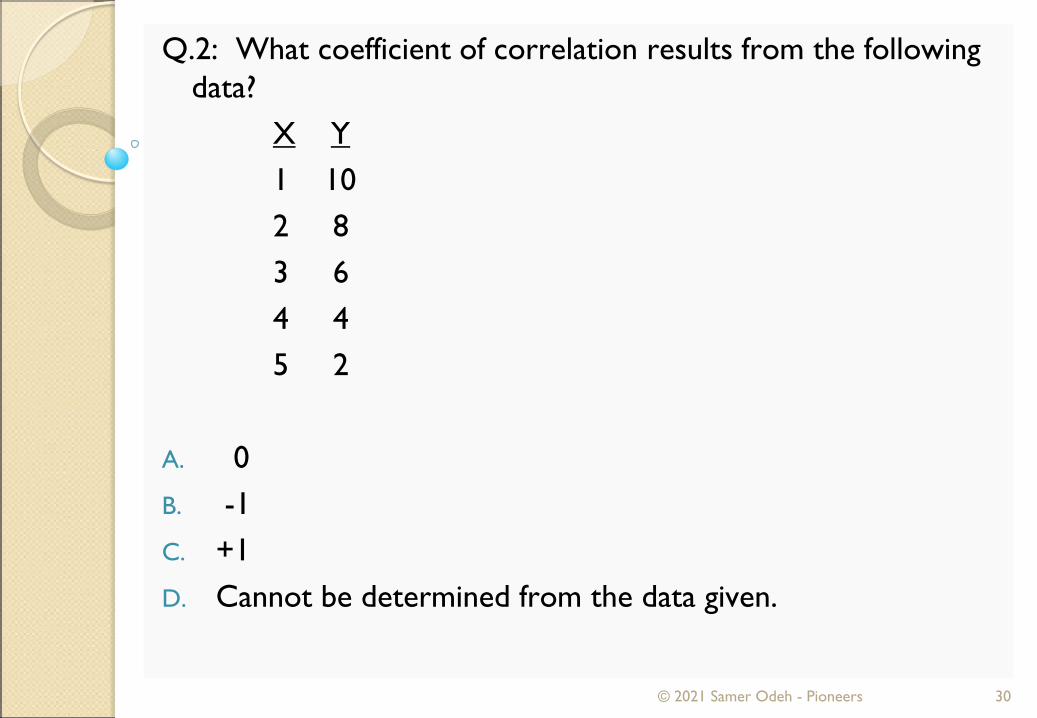
Q.2: What coefficient of correlation results from the following data?
X Y1 102 83 64 45 2
A. 0B. -1C. +1D. Cannot be determined from the data given.
© 2021 Samer Odeh - Pioneers 30
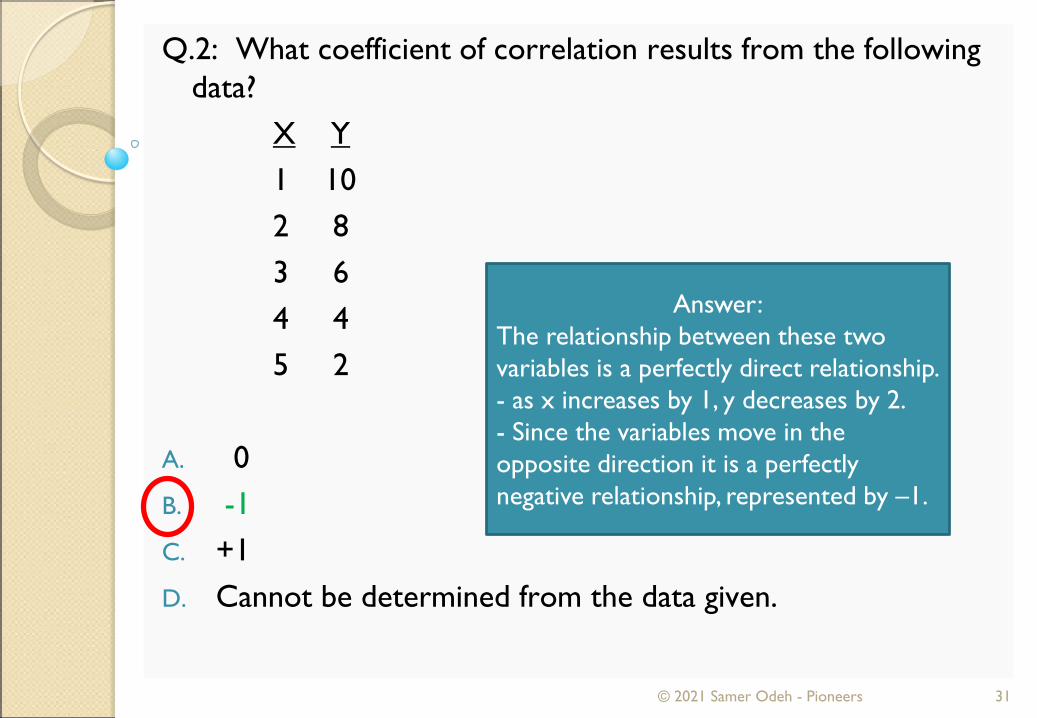
Q.2: What coefficient of correlation results from the following data?
X Y1 102 83 64 45 2
A. 0B. -1C. +1D. Cannot be determined from the data given.
© 2021 Samer Odeh - Pioneers 31
Answer:The relationship between these two variables is a perfectly direct relationship. - as x increases by 1, y decreases by 2. - Since the variables move in the opposite direction it is a perfectly negative relationship, represented by –1.

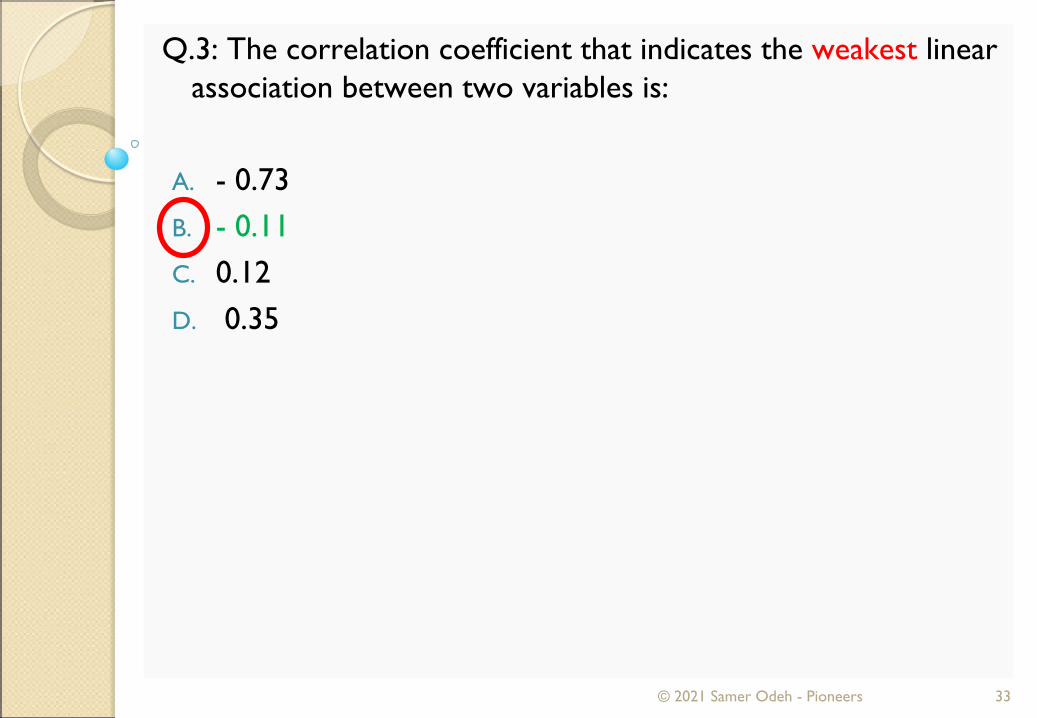
Q.3: The correlation coefficient that indicates the weakest linear association between two variables is:
A. - 0.73B. - 0.11C. 0.12D. 0.35
© 2021 Samer Odeh - Pioneers 32
Q.3: The correlation coefficient that indicates the weakest linear association between two variables is:
A. - 0.73B. - 0.11C. 0.12D. 0.35
© 2021 Samer Odeh - Pioneers 33
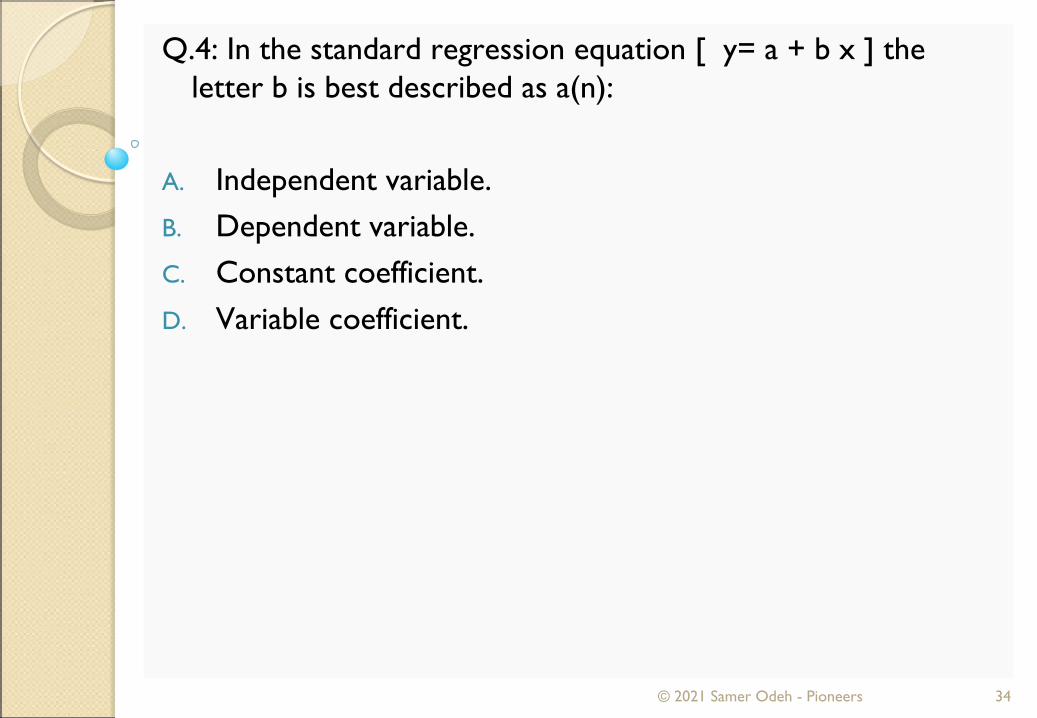
Q.4: In the standard regression equation [ y= a + b x ] the letter b is best described as a(n):
A. Independent variable.B. Dependent variable.C. Constant coefficient.D. Variable coefficient.
© 2021 Samer Odeh - Pioneers 34

Q.4: In the standard regression equation [ y= a + b x ] the letter b is best described as a(n):
A. Independent variable.B. Dependent variable.C. Constant coefficient.D. Variable coefficient.
© 2021 Samer Odeh - Pioneers 35
For example, in a cost determination regression, y equals total costs, b is the variable cost per unit, x is the number of units produced, and a is fixed cost.
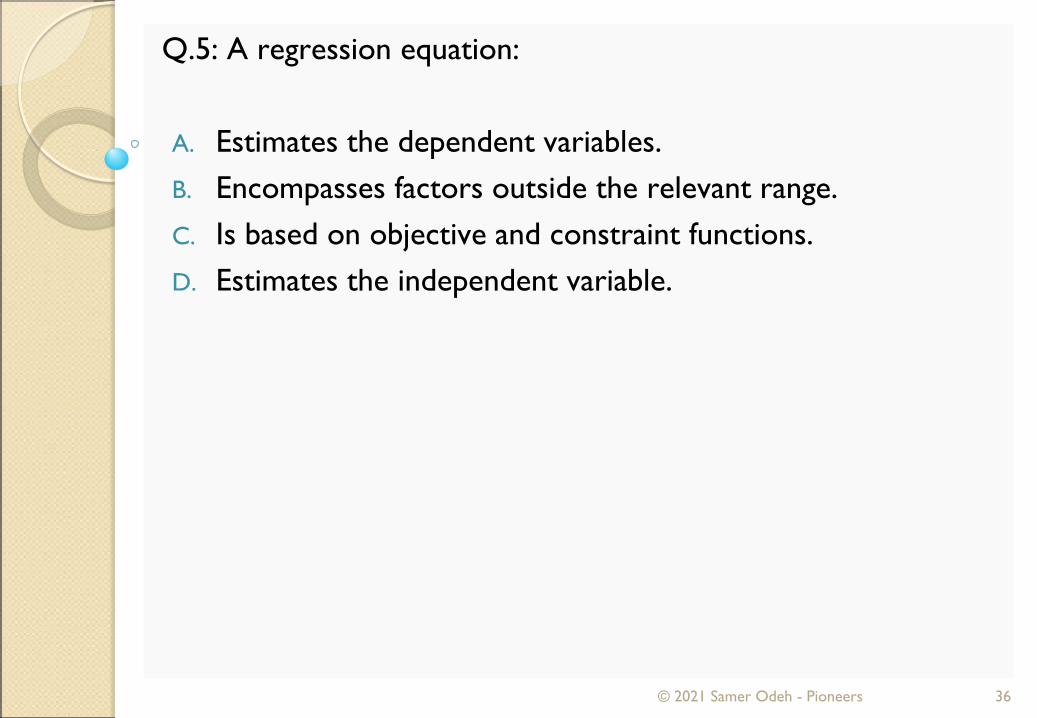
Q.5: A regression equation:
A. Estimates the dependent variables.B. Encompasses factors outside the relevant range.C. Is based on objective and constraint functions.D. Estimates the independent variable.
© 2021 Samer Odeh - Pioneers 36
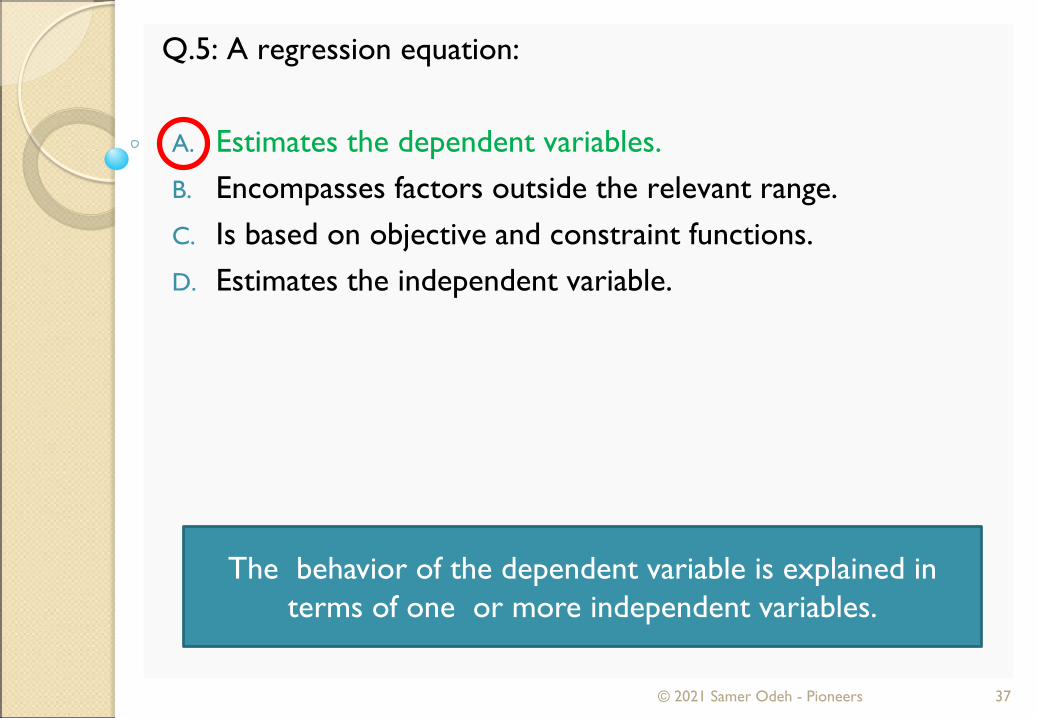
Q.5: A regression equation:
A. Estimates the dependent variables.B. Encompasses factors outside the relevant range.C. Is based on objective and constraint functions.D. Estimates the independent variable.
© 2021 Samer Odeh - Pioneers 37
The behavior of the dependent variable is explained in terms of one or more independent variables.

Learning Curve Analysis
38© 2021 Samer Odeh - Pioneers

Learning Curves
Learning curve analysis reflects the increased rate at which people perform tasks as they gain experience.
The time required to perform a given task becomes progressively shorter during the early stage of production.
© 2021 Samer Odeh - Pioneers 39
Tasks Performed
Time Per Task
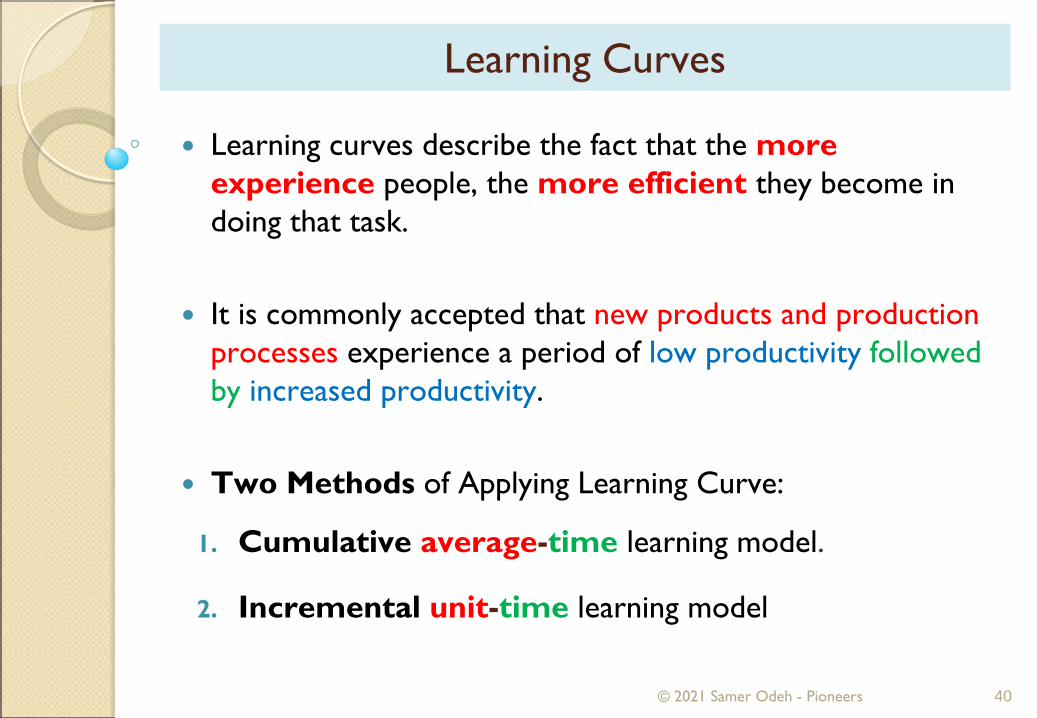
Learning curves describe the fact that the more experience people, the more efficient they become in doing that task.
It is commonly accepted that new products and production processes experience a period of low productivity followed by increased productivity.
Two Methods of Applying Learning Curve:
1. Cumulative average-time learning model.
2. Incremental unit-time learning model
© 2021 Samer Odeh - Pioneers 40
Learning Curves
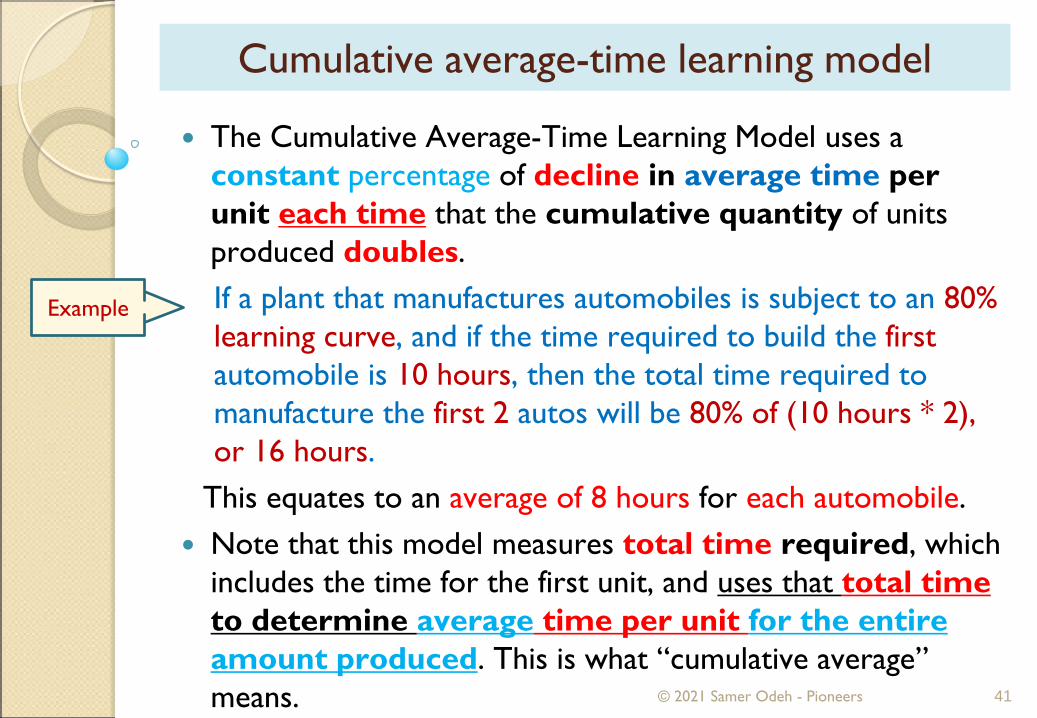
The Cumulative Average-Time Learning Model uses a constant percentage of decline in average time per unit each time that the cumulative quantity of units produced doubles.If a plant that manufactures automobiles is subject to an 80% learning curve, and if the time required to build the firstautomobile is 10 hours, then the total time required to manufacture the first 2 autos will be 80% of (10 hours * 2), or 16 hours.
This equates to an average of 8 hours for each automobile. Note that this model measures total time required, which
includes the time for the first unit, and uses that total time to determine average time per unit for the entire amount produced. This is what “cumulative average” means. © 2021 Samer Odeh - Pioneers 41
Cumulative average-time learning model
Example
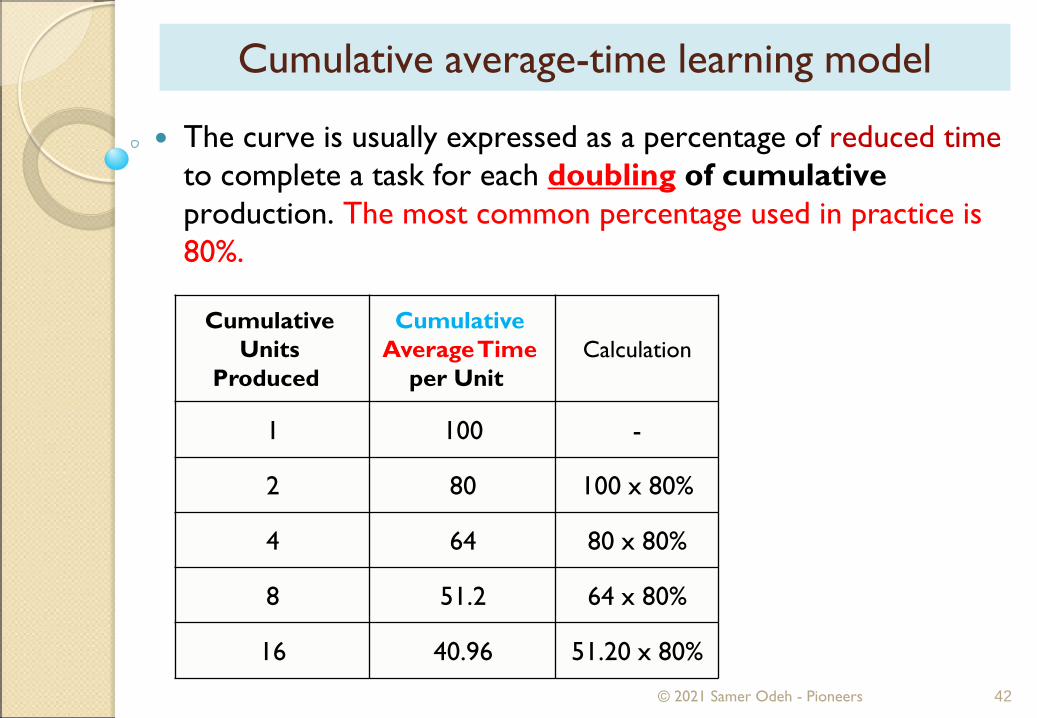
The curve is usually expressed as a percentage of reduced time to complete a task for each doubling of cumulative production. The most common percentage used in practice is 80%.
© 2021 Samer Odeh - Pioneers 42
Cumulative average-time learning model
CalculationCumulative
Average Time per Unit
Cumulative Units
Produced
-1001
100 x 80%802
80 x 80%644
64 x 80%51.28
51.20 x 80%40.9616

The curve is usually expressed as a percentage of reduced time to complete a task for each doubling of cumulative production. The most common percentage used in practice is 80%.
© 2021 Samer Odeh - Pioneers 43
Cumulative average-time learning model
CalculationCumulative
Average Time per Unit
Cumulative Units
Produced
-1001
100 x 80%802
80 x 80%644
64 x 80%51.28
51.20 x 80%40.9616
What is the Av. Time per unit after 2 units?
It is 80.
What is the time to produce the second unit?
2 x100 x 0.8=160160-100 = 60
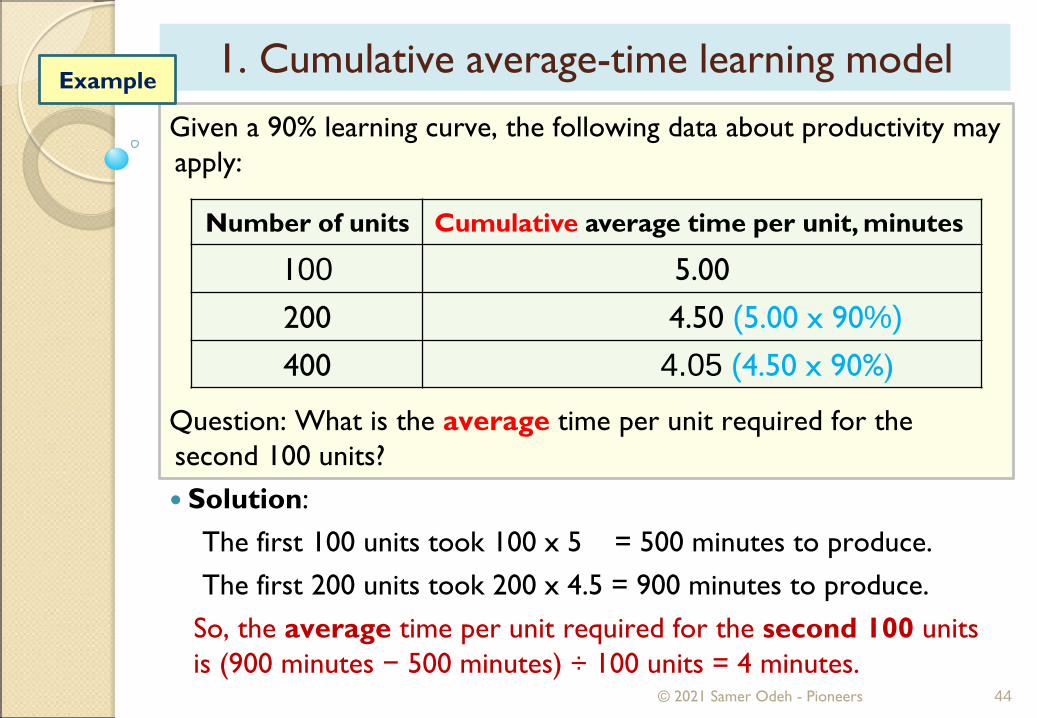
Given a 90% learning curve, the following data about productivity may apply:
Question: What is the average time per unit required for the second 100 units? Solution:
The first 100 units took 100 x 5 = 500 minutes to produce. The first 200 units took 200 x 4.5 = 900 minutes to produce.
So, the average time per unit required for the second 100 units is (900 minutes − 500 minutes) ÷ 100 units = 4 minutes.
© 2021 Samer Odeh - Pioneers 44
1. Cumulative average-time learning modelExample
Cumulative average time per unit, minutes Number of units
5.00001%)90x5.00 (4.50200
4.50 x 90%) (4.05400
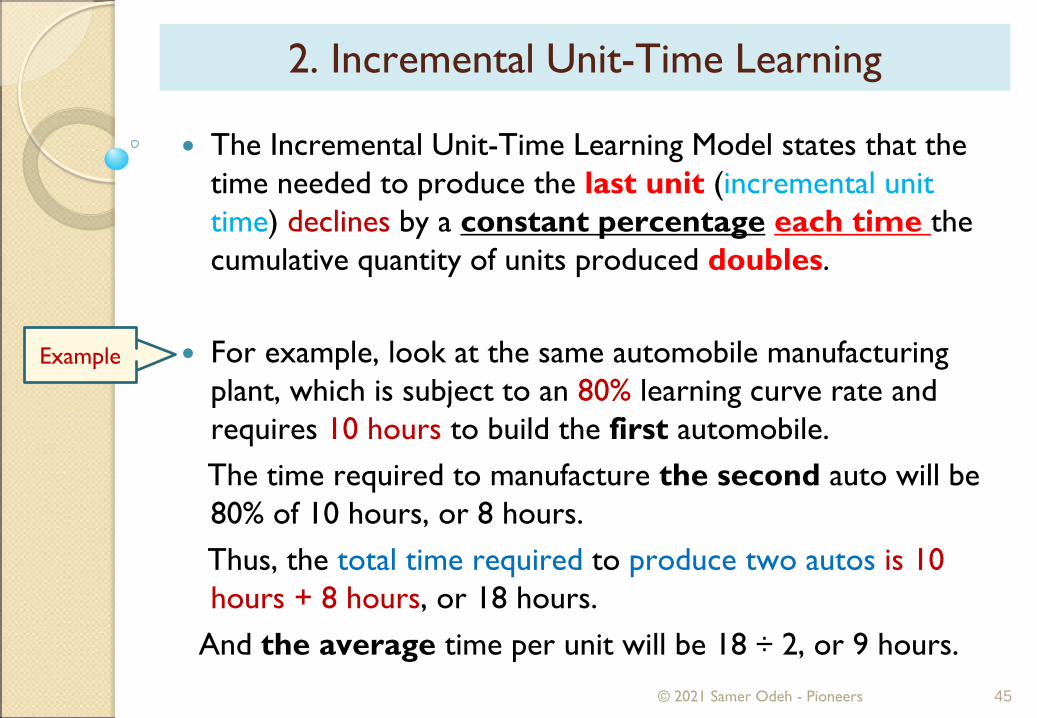
The Incremental Unit-Time Learning Model states that the time needed to produce the last unit (incremental unit time) declines by a constant percentage each time the cumulative quantity of units produced doubles.
For example, look at the same automobile manufacturing plant, which is subject to an 80% learning curve rate and requires 10 hours to build the first automobile.The time required to manufacture the second auto will be 80% of 10 hours, or 8 hours.Thus, the total time required to produce two autos is 10 hours + 8 hours, or 18 hours.
And the average time per unit will be 18 ÷ 2, or 9 hours.© 2021 Samer Odeh - Pioneers 45
2. Incremental Unit-Time Learning
Example
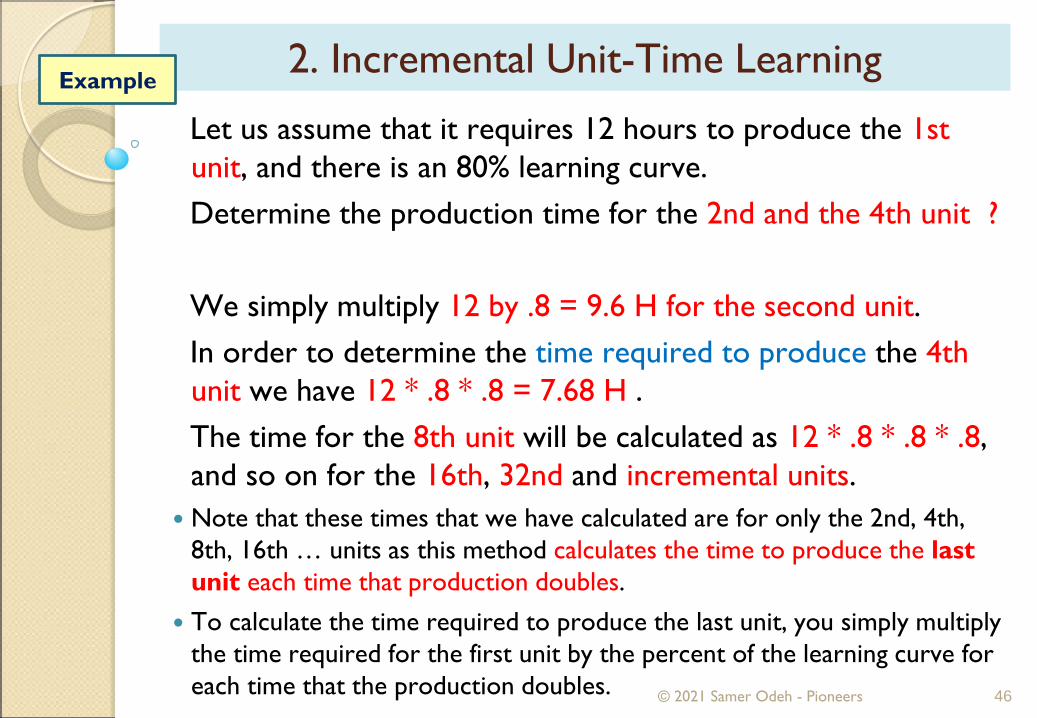
Let us assume that it requires 12 hours to produce the 1st unit, and there is an 80% learning curve. Determine the production time for the 2nd and the 4th unit ?
We simply multiply 12 by .8 = 9.6 H for the second unit. In order to determine the time required to produce the 4th unit we have 12 * .8 * .8 = 7.68 H . The time for the 8th unit will be calculated as 12 * .8 * .8 * .8, and so on for the 16th, 32nd and incremental units.
Note that these times that we have calculated are for only the 2nd, 4th, 8th, 16th … units as this method calculates the time to produce the last unit each time that production doubles.
To calculate the time required to produce the last unit, you simply multiply the time required for the first unit by the percent of the learning curve for each time that the production doubles. © 2021 Samer Odeh - Pioneers 46
2. Incremental Unit-Time LearningExample
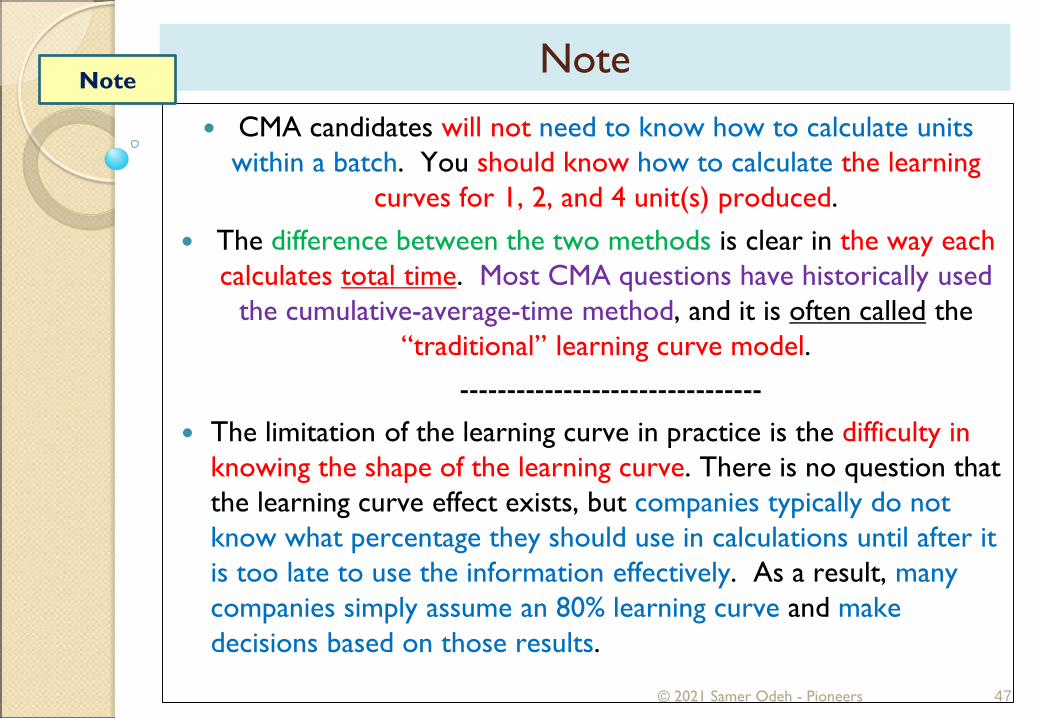
CMA candidates will not need to know how to calculate units within a batch. You should know how to calculate the learning
curves for 1, 2, and 4 unit(s) produced. The difference between the two methods is clear in the way each
calculates total time. Most CMA questions have historically used the cumulative-average-time method, and it is often called the
“traditional” learning curve model.--------------------------------
The limitation of the learning curve in practice is the difficulty in knowing the shape of the learning curve. There is no question that the learning curve effect exists, but companies typically do not know what percentage they should use in calculations until after it is too late to use the information effectively. As a result, many companies simply assume an 80% learning curve and make decisions based on those results.
© 2021 Samer Odeh - Pioneers 47
NoteNote

Questions and Answers
© 2021 Samer Odeh - Pioneers 48
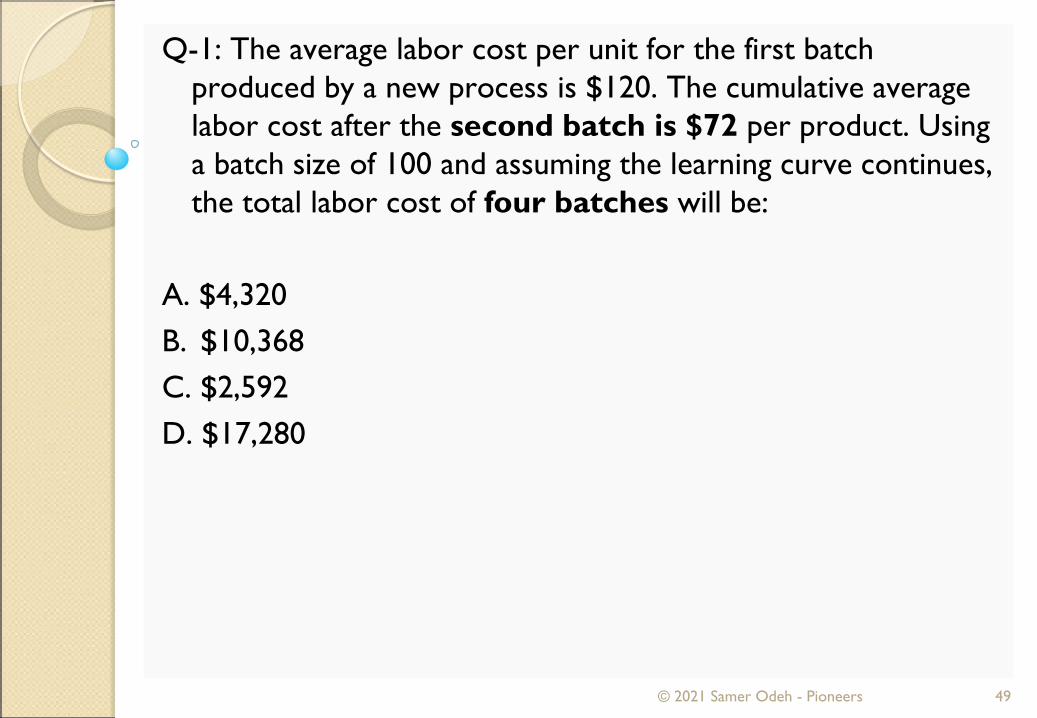
Q-1: The average labor cost per unit for the first batch produced by a new process is $120. The cumulative average labor cost after the second batch is $72 per product. Using a batch size of 100 and assuming the learning curve continues, the total labor cost of four batches will be:
A. $4,320B. $10,368C. $2,592D. $17,280
© 2021 Samer Odeh - Pioneers 49
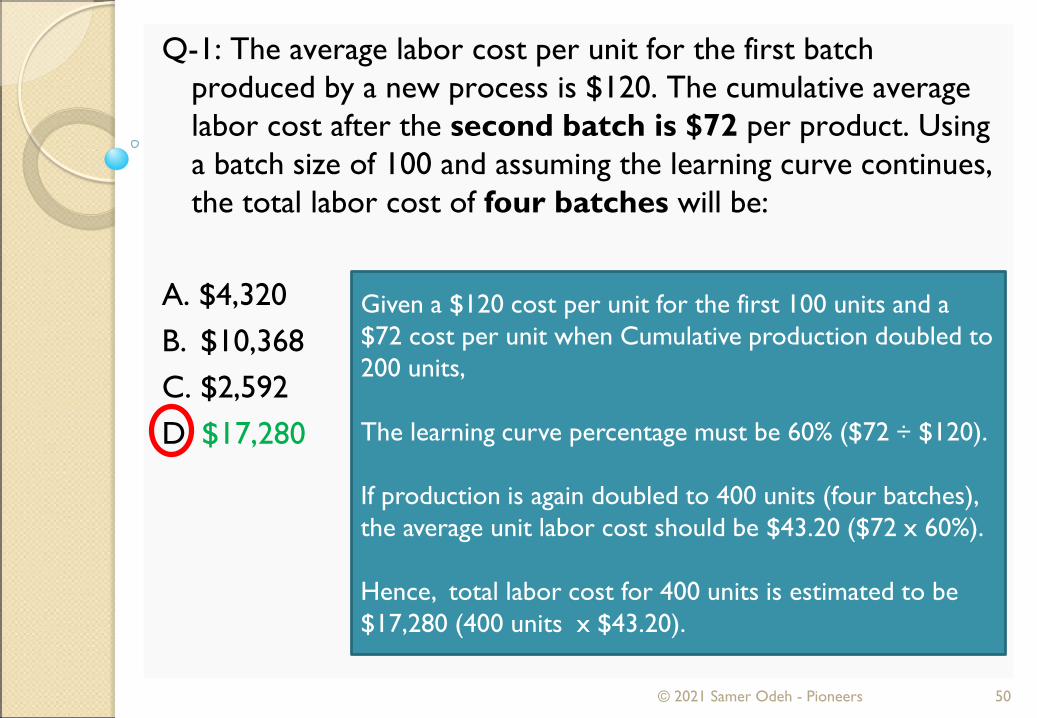
Q-1: The average labor cost per unit for the first batch produced by a new process is $120. The cumulative average labor cost after the second batch is $72 per product. Using a batch size of 100 and assuming the learning curve continues, the total labor cost of four batches will be:
A. $4,320B. $10,368C. $2,592D. $17,280
© 2021 Samer Odeh - Pioneers 50
Given a $120 cost per unit for the first 100 units and a $72 cost per unit when Cumulative production doubled to 200 units,
The learning curve percentage must be 60% ($72 ÷ $120).
If production is again doubled to 400 units (four batches), the average unit labor cost should be $43.20 ($72 x 60%).
Hence, total labor cost for 400 units is estimated to be $17,280 (400 units x $43.20).
Expected Value
51© 2021 Samer Odeh - Pioneers
Expected value
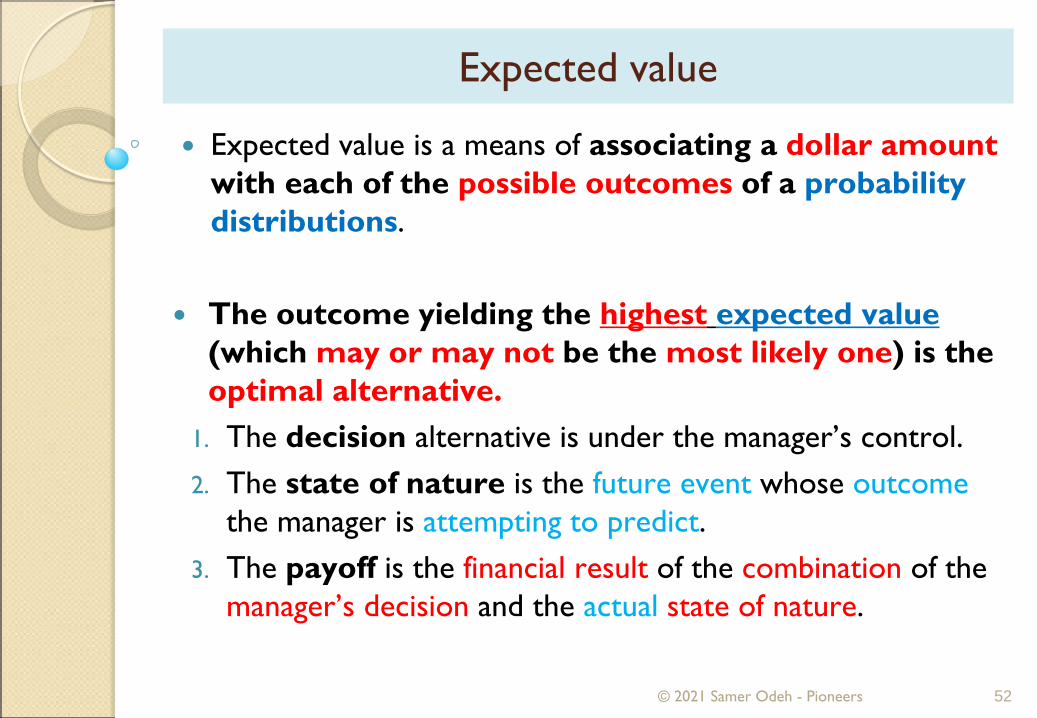
Expected value is a means of associating a dollar amountwith each of the possible outcomes of a probability distributions.
The outcome yielding the highest expected value(which may or may not be the most likely one) is the optimal alternative.
1. The decision alternative is under the manager’s control.2. The state of nature is the future event whose outcome
the manager is attempting to predict. 3. The payoff is the financial result of the combination of the
manager’s decision and the actual state of nature.
© 2021 Samer Odeh - Pioneers 52
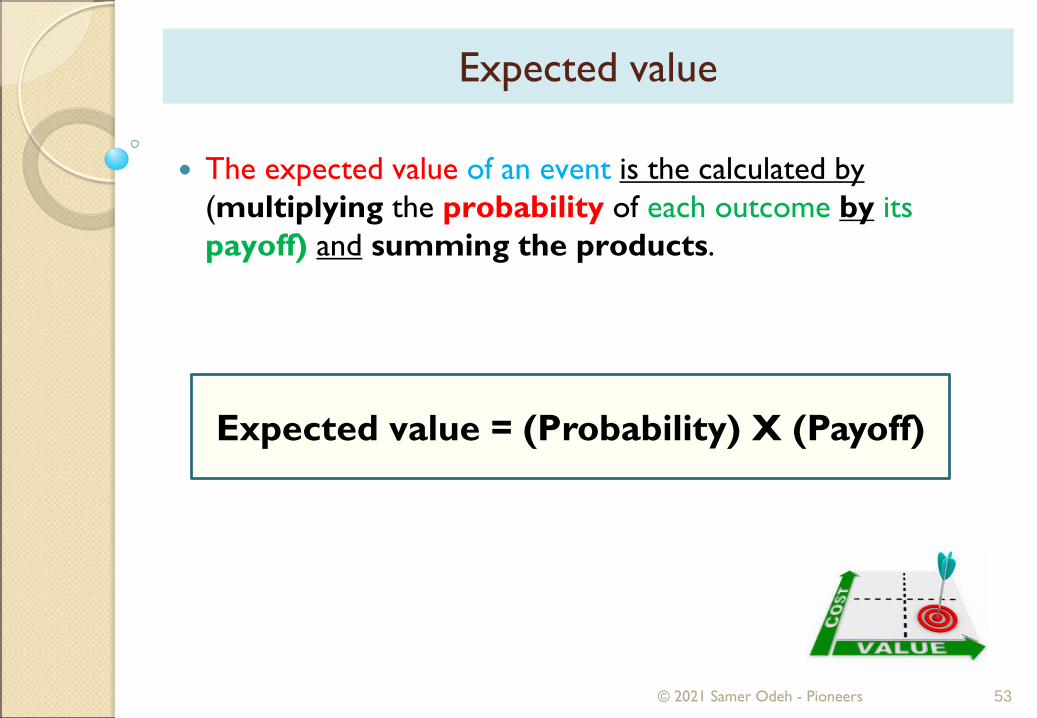
The expected value of an event is the calculated by (multiplying the probability of each outcome by itspayoff) and summing the products.
© 2021 Samer Odeh - Pioneers 53
Expected value = (Probability) X (Payoff)
Expected value

An investor is considering the purchase of two identically priced pieces of property. The value of the properties will change if a road, currently planned by the state, is built.
The following are estimates that road construction will occur:Future Stateof Nature (SN) Event Probability
SN 1 No road is ever built. 0.1SN 2 A road is built this year. 0.2SN 3 A road is built more than 0.7
1 year from now.
© 2021 Samer Odeh - Pioneers 54
Expected valueExample
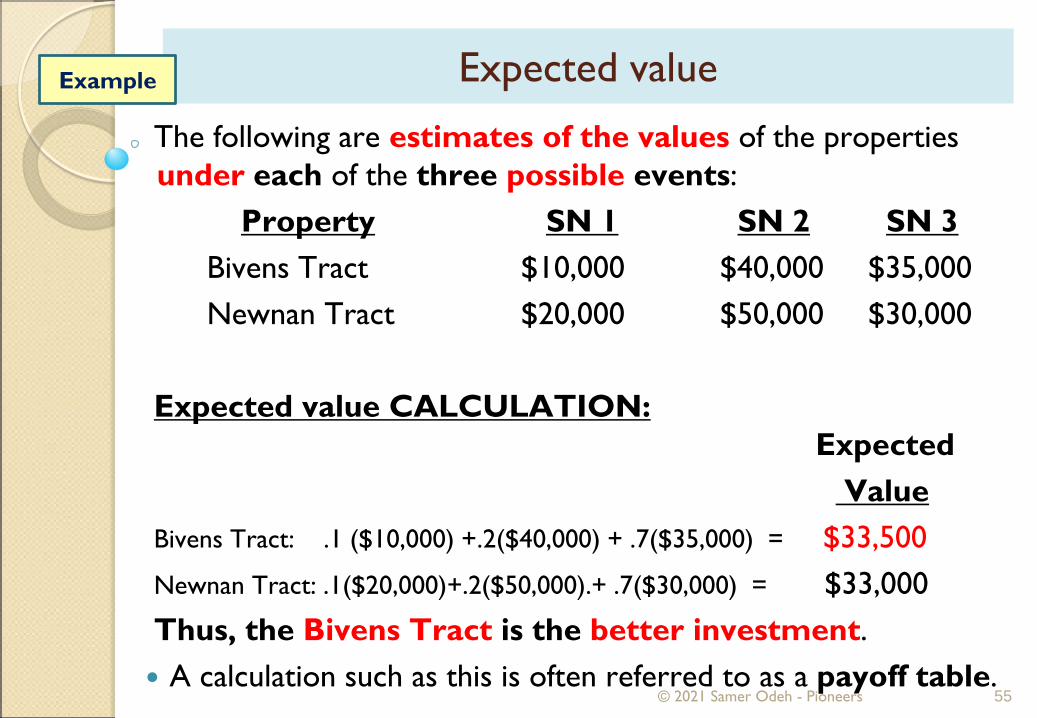
The following are estimates of the values of the properties under each of the three possible events:
Property SN 1 SN 2 SN 3Bivens Tract $10,000 $40,000 $35,000Newnan Tract $20,000 $50,000 $30,000
Expected value CALCULATION:Expected
Value Bivens Tract: .1 ($10,000) +.2($40,000) + .7($35,000) = $33,500Newnan Tract: .1($20,000)+.2($50,000).+ .7($30,000) = $33,000Thus, the Bivens Tract is the better investment. A calculation such as this is often referred to as a payoff table.
© 2021 Samer Odeh - Pioneers 55
Expected valueExample

The expected value criterion is likely to be adopted by a decision maker who is risk neutral. However; other circumstances may cause the decision maker to be risk averse or even risk seeking.
Expected value is a rational means for selecting the best alternative.
The best alternative is the one having the highestexpected value.
© 2021 Samer Odeh - Pioneers 56
Expected value

Expected Value of Perfect Information (EVPI)
Expected value of perfect information (EVPI) is the additionalexpected value that could be obtained if a decision maker knew ahead of time which state of nature would occur.
Is the knowledge that a future state of nature will occur with certainty.
© 2021 Samer Odeh - Pioneers 57
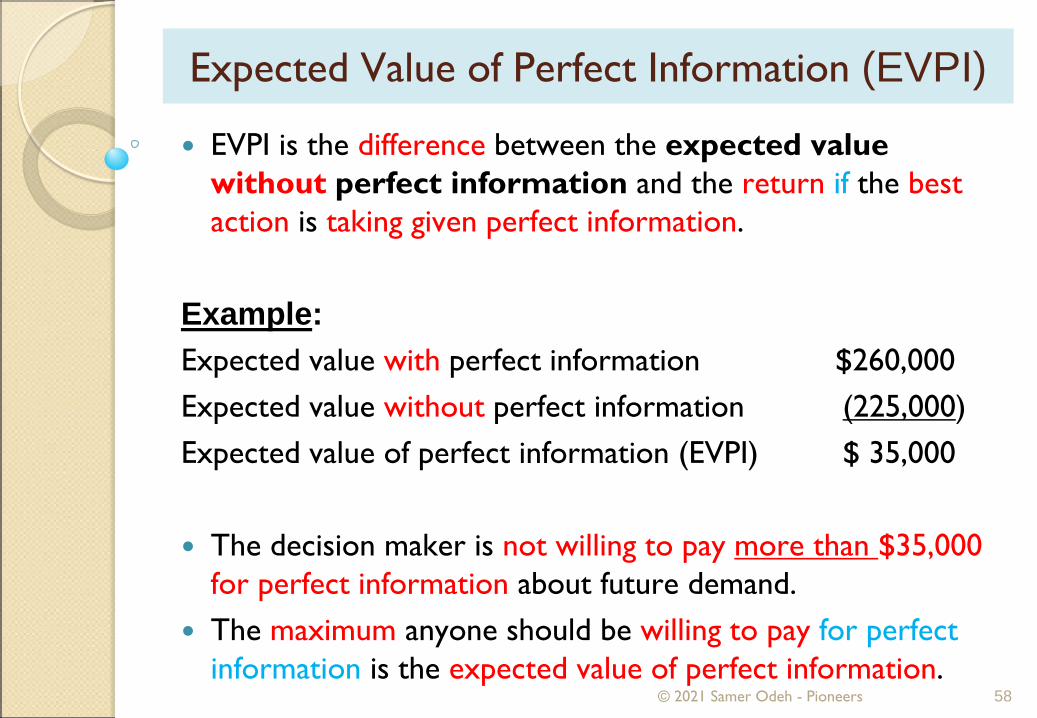
EVPI is the difference between the expected value without perfect information and the return if the best action is taking given perfect information.
Example:Expected value with perfect information $260,000Expected value without perfect information (225,000)Expected value of perfect information (EVPI) $ 35,000
The decision maker is not willing to pay more than $35,000 for perfect information about future demand.
The maximum anyone should be willing to pay for perfect information is the expected value of perfect information.
© 2021 Samer Odeh - Pioneers 58
Expected Value of Perfect Information (EVPI)

Sensitivity Analysis
59© 2021 Samer Odeh - Pioneers
Sensitivity analysis
Sensitivity analysis is the process of evaluating the effect of changes in variables on the optimum solution. Such analysis helps management analyze alternatives and estimate the consequences of possible prediction errors
Sensitivity analysis reveals how sensitive expected value calculations are to the accuracy of the initial estimates.
Sensitivity analysis is thus useful in determining whether expending additional resources to obtain better forecasts is justified.
© 2021 Samer Odeh - Pioneers 60
Sensitivity analysis
The benefit of sensitivity analysis is that managers can see the effect of changes assumptions on the final objectives.
For example, in a capital budgeting situation, a proposed investment might promise a return of $10,000 per year and a rate of return of 15%. The $10,000 is based on an estimate. What management needs to know is how acceptable the investment would be if the return was only $6,000 per year.
© 2021 Samer Odeh - Pioneers 61
Sensitivity analysis encompasses a variety of methods used to determine how an expected result will change if the factors that were involved in predicting an amount change.
It is particularly helpful when there is a great deal of uncertainty about the various inputs to a decision model.
Simulation analysis is the process of learning about a real situation or system by experimenting with a model that represents the real situation or system. Given certain values of inputs, the simulation model uses mathematical expressions and logical relationships to compute the value of the outputs.
© 2021 Samer Odeh - Pioneers 62
Sensitivity analysis
A trial-and-error method inherent in sensitivity analysis is facilitated by the use of computer software.
A major use of sensitivity analysis is in capital budgeting, where small changes in prevailing interest rates or payoff amounts can make a very great difference in the profitability of a project.
© 2021 Samer Odeh - Pioneers 63
Sensitivity analysis

Questions and Answers
© 2021 Samer Odeh - Pioneers 64
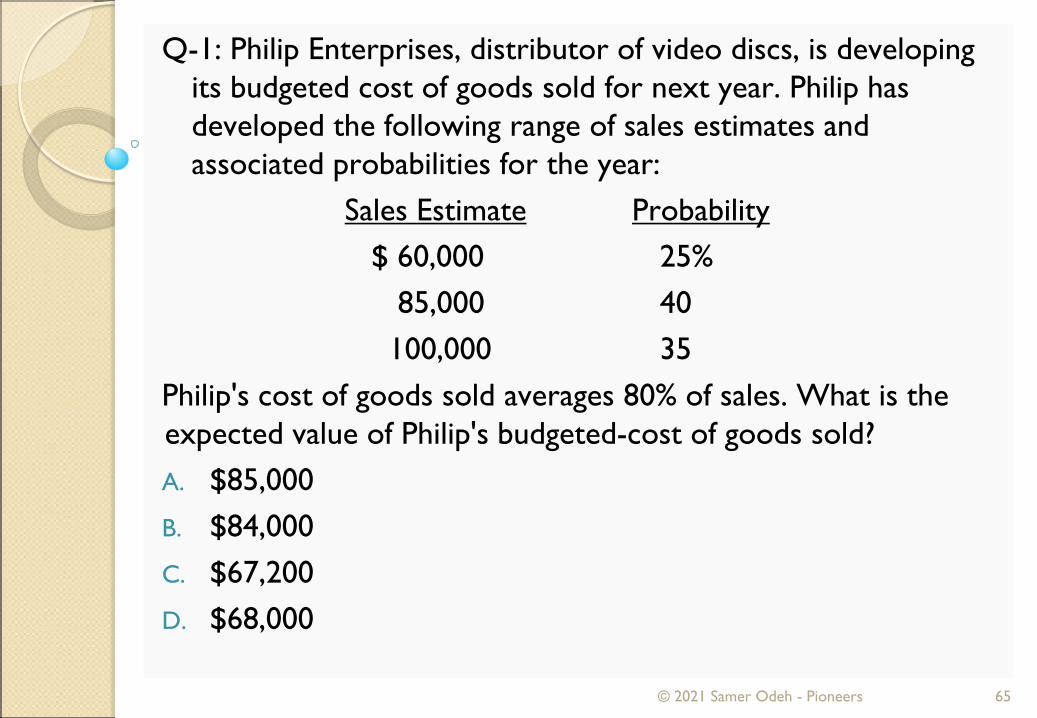
Q-1: Philip Enterprises, distributor of video discs, is developing its budgeted cost of goods sold for next year. Philip has developed the following range of sales estimates and associated probabilities for the year:
Sales Estimate Probability$ 60,000 25%
85,000 40100,000 35
Philip's cost of goods sold averages 80% of sales. What is the expected value of Philip's budgeted-cost of goods sold?A. $85,000B. $84,000C. $67,200D. $68,000
© 2021 Samer Odeh - Pioneers 65

Q-1: Philip Enterprises, distributor of video discs, is developing its budgeted cost of goods sold for next year. Philip has developed the following range of sales estimates and associated probabilities for the year:
Sales Estimate Probability$ 60,000 25%
85,000 40100,000 35
Philip's cost of goods sold averages 80% of sales. What is the expected value of Philip's budgeted-cost of goods sold?A. $85,000B. $84,000C. $67,200D. $68,000
© 2021 Samer Odeh - Pioneers 66
The expected value is calculated by weighting each sales estimate by the probability of its occurrence. Consequently, the expected value of sales is: $84,000 [$60,000 x .25) + ($85,000 x .40) + ($100,000 x .35)]. Cost of goods sold is therefore $67,200 ($84,000 x .80).
Q-2: Sweivel Company is preparing its budget and, taking into consideration the recent pace of economic recovery, has developed several sales forecasts and the estimated probability associated with each sales forecast. To determine the sales forecast to be used for budgeting purposes, which one of the following techniques should Sweivel use?
A. Expected value analysis.B. Continuous probability simulation.C. Exponential distribution analysis.D. Sensitivity analysis.
© 2021 Samer Odeh - Pioneers 67

Q-2: Sweivel Company is preparing its budget and, taking into consideration the recent pace of economic recovery, has developed several sales forecasts and the estimated probability associated with each sales forecast. To determine the sales forecast to be used for budgeting purposes, which one of the following techniques should Sweivel use?
A. Expected value analysis.B. Continuous probability simulation.C. Exponential distribution analysis.D. Sensitivity analysis.
© 2021 Samer Odeh - Pioneers 68
Expected value analysis provides a rational means for selecting the best alternative
in decisions involving risk. The expected value of an
alternative is found by multiplying the probability of each outcome by its payoff and summing the products. It represents the long-term average payoff for repeated
trials.
Q-3: The process of evaluating the effect of changes in variables such as sales price or wage rates on the optimum solution in a linear programming application is called:
A. Iterative analysis.B. Regression analysis.C. Sensitivity analysis.D. Matrix analysis.
© 2021 Samer Odeh - Pioneers 69

Q-3: The process of evaluating the effect of changes in variables such as sales price or wage rates on the optimum solution in a linear programming application is called:
A. Iterative analysis.B. Regression analysis.C. Sensitivity analysis.D. Matrix analysis.
© 2021 Samer Odeh - Pioneers 70
Sensitivity analysis is a process to determine how sensitive the final result (solution) is to changes in variables. It is often used in capital budgeting decisions to incorporate various levels of risk.
Strategic Management
71© 2021 Samer Odeh - Pioneers

Strategic Management
© 2021 Samer Odeh - Pioneers 72
Strategic management sets overall objectives for an entity and guides the process reaching those objectives. It is the responsibility of upper management.
Strategic planning is the design and implementation of the specific steps and processes necessary to reach the overall objectives.
Strategic management and strategic planning are thus closely linked. By their nature, strategic management and strategic planning have a long-term planning horizon.
Steps in the Strategic Management Process
© 2021 Samer Odeh - Pioneers 73
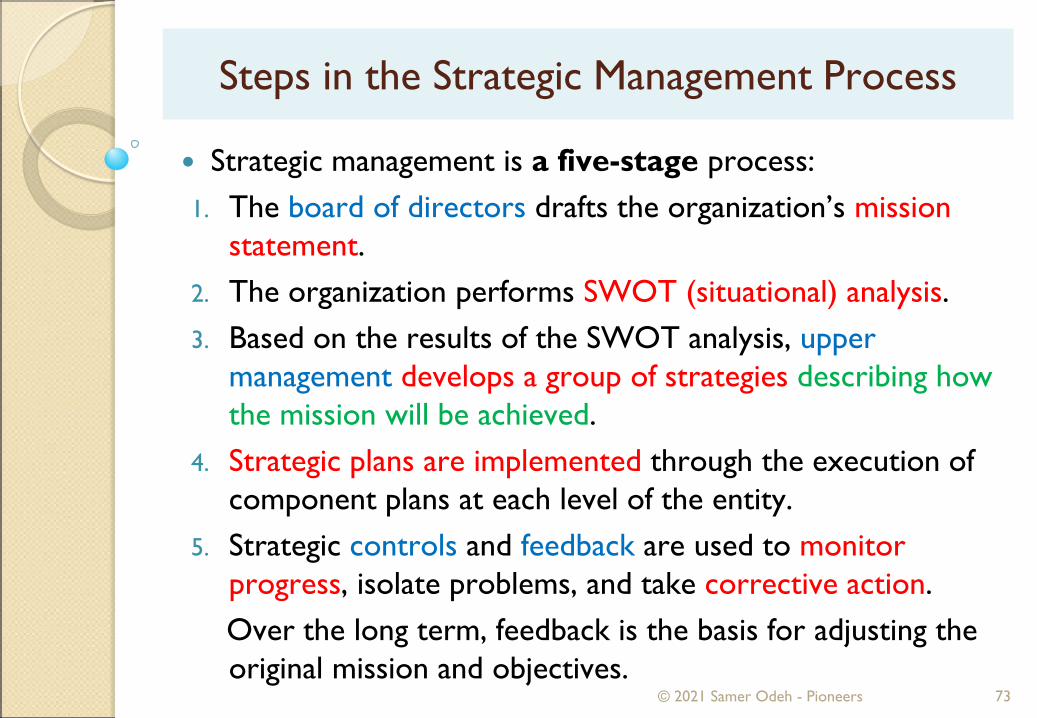
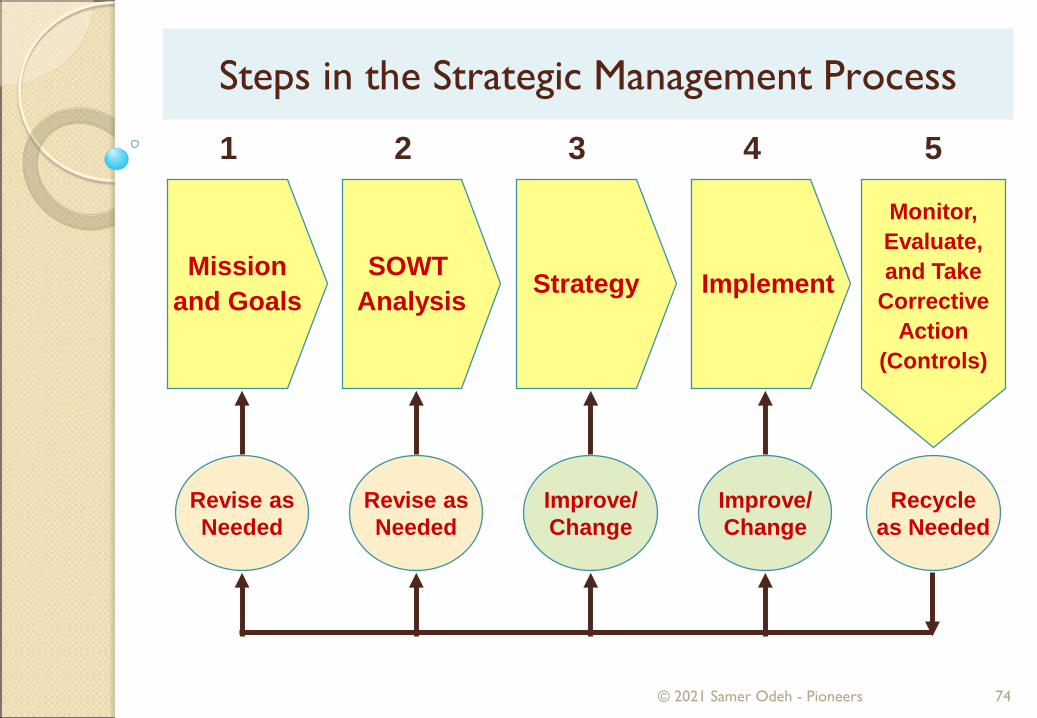
Strategic management is a five-stage process:1. The board of directors drafts the organization’s mission
statement.2. The organization performs SWOT (situational) analysis.3. Based on the results of the SWOT analysis, upper
management develops a group of strategies describing how the mission will be achieved.
4. Strategic plans are implemented through the execution of component plans at each level of the entity.
5. Strategic controls and feedback are used to monitor progress, isolate problems, and take corrective action. Over the long term, feedback is the basis for adjusting the original mission and objectives.
Steps in the Strategic Management Process
© 2021 Samer Odeh - Pioneers 74
StrategySOWT Analysis
Missionand Goals Implement
Improve/Change
Revise asNeeded
Revise asNeeded
Improve/Change
Recycleas Needed
1 2 3 4 5
Monitor,Evaluate,and Take
CorrectiveAction
(Controls)

1. Mission Statement
© 2021 Samer Odeh - Pioneers 75
The mission statement summarizes the entity's reason for existing. It provides the framework for formulation of the company's strategies.
Missions tend to be stated in general terms. Setting specific objectives in the mission statement can limit an entity's ability to respond to a changing marketplace.
Hierarchy of Goals
vision
Mission
Strategicobjectives
Missions tend to be most effective when they consist of a single sentence.
For example, the mission of Avis Rent-a-Car: “Our business is renting cars. Our mission is total customer satisfaction”.

1. Mission Statement
© 2021 Samer Odeh - Pioneers 76
A mission statement focuses on currentbusiness activities –
“who we are and what we do”
◦ Current product and service offerings.
◦ Customer needs being served.
◦ Technological and business capabilities.
A vision concerns a firm’sfuture business path –
“where we are going”
◦ Markets to be pursued.◦ Future technology-product-customer focus.◦ Kind of company that management is trying to create.
2. SWOT Analysis
© 2021 Samer Odeh - Pioneers 77
The situational analysis is most often called a SWOT analysisbecause it identifies the entity's strengths, weaknesses, opportunities, and threats.
Strengths and weaknesses are usually identified by considering the entity‘s capabilities and resources (its internal environment). What the entity does particularly well or has in greater
abundance are its core competencies. But many entities may have the same core competencies (cutting-edge lT, efficient distribution, etc..).
An entity gains a competitive advantage in the marketplace by developing one or more distinctive competencies, i.e., competencies that are unlike those of its competitors.

2. SWOT Analysis
© 2021 Samer Odeh - Pioneers 78
Opportunities and threats exist in the entity's external environment.
They are identified by considering: Macro-environment factors (economic, demographic,
political, legal, social, cultural, and technical). Micro-environment factors (suppliers, customers,
distributors, competitors, and other competitive factors in the industry).

3. Developing Strategy
© 2021 Samer Odeh - Pioneers 79
Based on the results of the SWOT analysis, upper management develops a group of strategies describing how the mission will be achieved.
The strategies answer such questions as:1) Which lines of business will we be in?2) How do we penetrate and compete in the international
marketplace?3) How will this line of business reach its objectives that
contribute to achievement of the overall entity's mission?4) How do we perform each strategic business unit's basic
processes (materials handling, assembly, shipping, human resources, customer relations, etc.) as efficiently as possible?
4. Implementation
© 2021 Samer Odeh - Pioneers 80
Implementing the chosen strategies involves every employee at every level of the entity.
Incentive systems and employee performance evaluations must be designed so that they encourage employees to focustheir efforts on achieving the entity's objectives.
This approach requires communication among senior managers, who devise strategies; middle managers, who supervise and evaluate employees; and human resources managers, who must approve evaluation and compensation plans.
5. Controls
© 2021 Samer Odeh - Pioneers 81
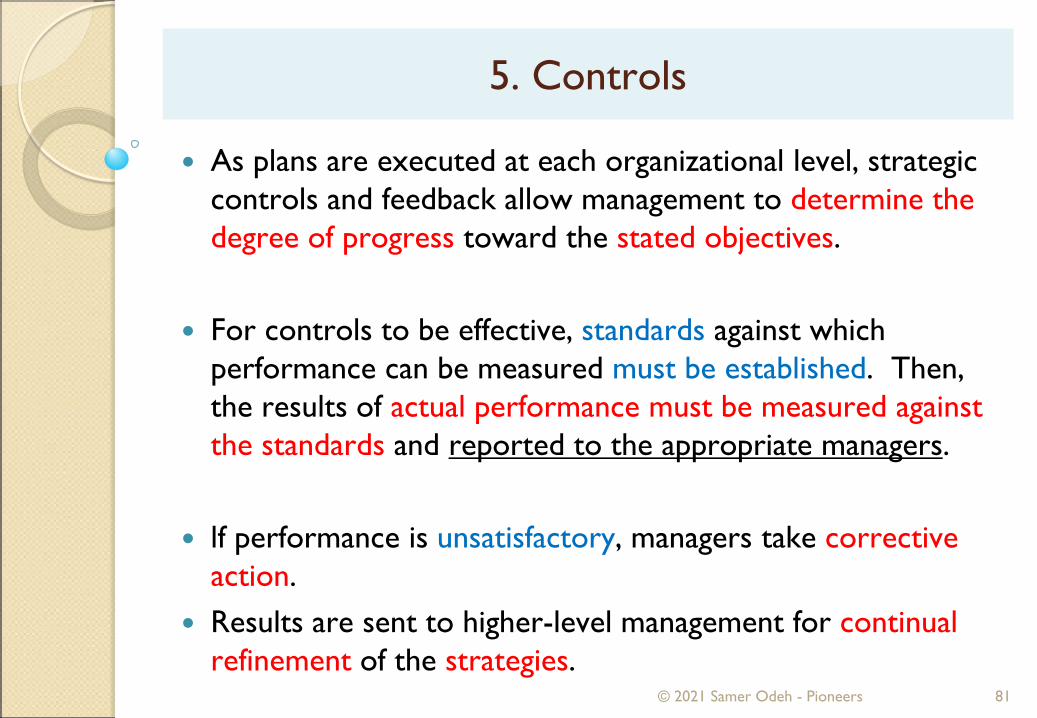
As plans are executed at each organizational level, strategic controls and feedback allow management to determine the degree of progress toward the stated objectives.
For controls to be effective, standards against which performance can be measured must be established. Then, the results of actual performance must be measured against the standards and reported to the appropriate managers.
lf performance is unsatisfactory, managers take corrective action.
Results are sent to higher-level management for continual refinement of the strategies.

Porter's Five Competitive Forces
© 2021 Samer Odeh - Pioneers 82
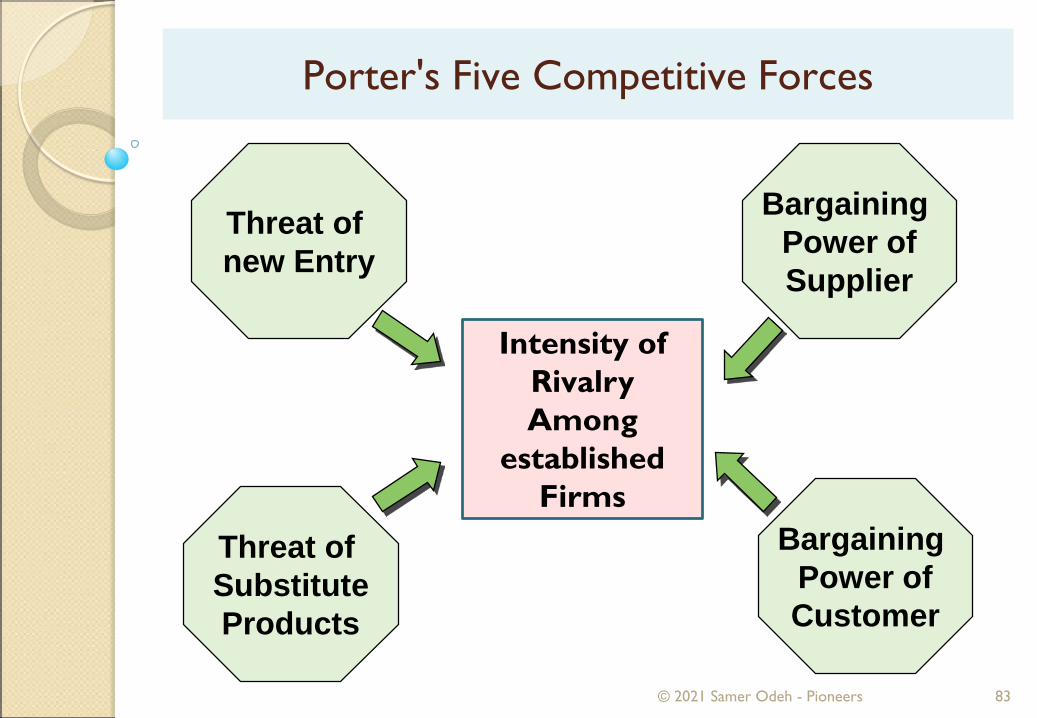
Business theorist Michael E. Porter has developed a model of the structure of industries and competition.
lt includes an analysis of the five competitive forces that determine long-term profitability as measured by long-term return on investment.
This analysis includes an evaluation of the basic economicand technical characteristics that determine the strength of each force and the attractiveness of the industry.
Porter's Five Competitive Forces
© 2021 Samer Odeh - Pioneers 83
Threat of new Entry
Bargaining Power ofSupplier
Intensity of RivalryAmong
established Firms
Threat of SubstituteProducts
Bargaining Power ofCustomer

Rivalry Among Existing Firms
© 2021 Samer Odeh - Pioneers 84
Rivalry among existing firms will be intense when an industry contains many strong competitors. Price-cutting, large advertising budgets, and frequent introduction of products are typical.
The intensity of rivalry and the threat of entry vary with the following factors:
1) The stage of the industry life cycle, e.g., rapid growth, growth, maturity, decline, or rapid decline.Thus, growth is preferable to decline. In a declining or even a stable industry, a firm’s growth must come from winning other firms' customers, thereby strengthening competition.

Rivalry Among Existing Firms
© 2021 Samer Odeh - Pioneers 85
2) The distinctions among products (product differentiation) and the costs of switching from one competitor's product to another. Less differentiation tends to heighten competition based on price, with price cutting leading to lower profits. But high costs of switching suppliers weaken competition.
3) Whether fixed costs are high in relation to variable costs. High fixed costs indicate that rivalry will be intense. The greater the cost to generate a given amount of sales revenues, the greater the investment intensity and the need to operate at or near capacity. Hence, price cutting to sustain demand is typical.

Rivalry Among Existing Firms
© 2021 Samer Odeh - Pioneers 86
4) Capacity expansion.lf the size of the expansion must be large to achieve economies of scale, competition will be more intense. The need for large-scale expansion to achieve production efficiency may result in an excess of industry capacity over demand.
1. Threat of New Entry
© 2021 Samer Odeh - Pioneers 87
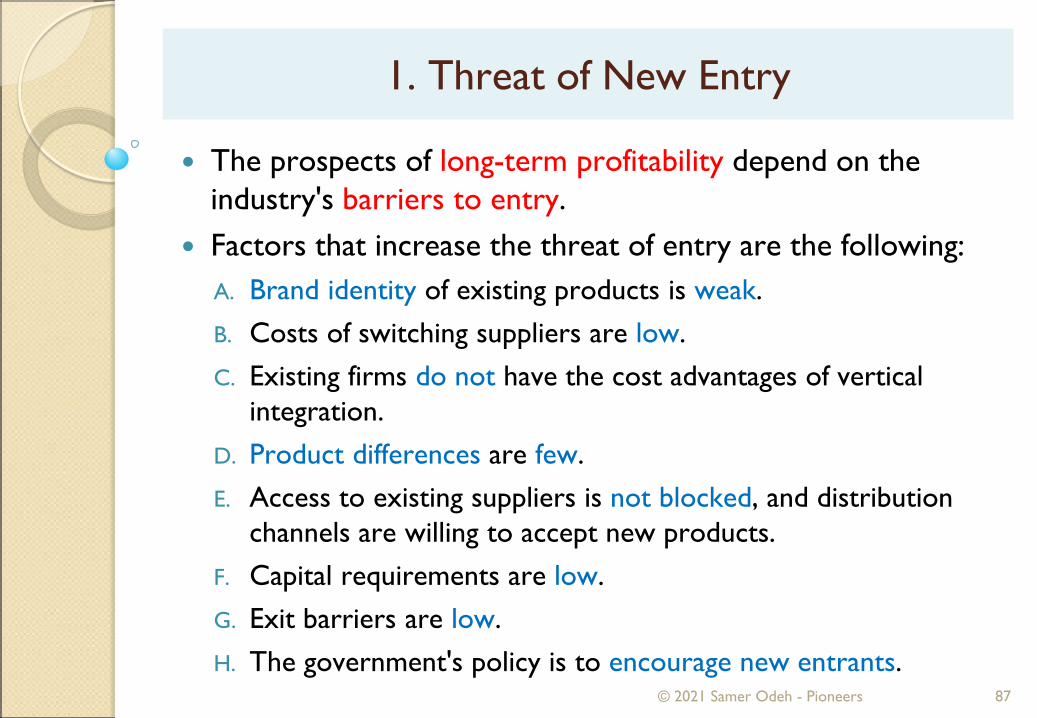
The prospects of long-term profitability depend on the industry's barriers to entry.
Factors that increase the threat of entry are the following:A. Brand identity of existing products is weak.B. Costs of switching suppliers are low.C. Existing firms do not have the cost advantages of vertical
integration.D. Product differences are few.E. Access to existing suppliers is not blocked, and distribution
channels are willing to accept new products.F. Capital requirements are low.G. Exit barriers are low.H. The government's policy is to encourage new entrants.

1. Threat of New Entry
© 2021 Samer Odeh - Pioneers 88
The most favorable industry condition is one in which entry barriers are high and exit barriers are low.
When the threat of new entrants is minimal and exit is not difficult, returns are high, and risk is reduced in the event of poor performance.
Low entry barriers keep long-term profitability low because new firms can enter the industry, increasing competition and lowering prices and the market shares of existing firms.

2. Threat of Substitute
© 2021 Samer Odeh - Pioneers 89
The threat of substitutes limits price increases and profit margins. The greater the threat, the less attractive the industry is to potential entrants.
Substitutes are types (not brands) of goods and services that have the same purposes, for example, plastic and metal or minivans and SUVs. Hence, a change in the price of one such product (service) causes a change in the demand for its substitutes.
Structural considerations affecting the threat of substitutes:A. Relative prices. B. Costs of switching to a substitute. C. Customers' inclination to use a substitute.
3. Threat of Buyers' Bargaining Power
© 2021 Samer Odeh - Pioneers 90
As the threat of buyers' bargaining power increases, the appeal of an industry to potential entrants decreases.
Buyers seek lower prices, better quality, and more services. Moreover, they use their purchasing power to obtain better terms, possibly through a bidding process. Thus, buyers affect competition.
Buyers' bargaining power varies with the following factors:A. When purchasing power is concentrated in a few buyers or
when buyers are well organized, their bargaining power is greater. This effect is reinforced when sellers are in a capital-intensive industry.
B. High (low) switching costs decrease (increase) buyers' bargaining power.

3. Threat of Buyers' Bargaining Power
© 2021 Samer Odeh - Pioneers 91
C. The threat of backward (upstream) vertical integration, that is, the acquisition of a supply capacity, increases buyers' bargaining power.
D. Buyers are most likely to bargain aggressively when their profit margins are low and a supplier's product accounts for a substantial amount of their costs.
E. Buyers are in a stronger position when the supplier's product is undifferentiated.
F. The more important the supplier's product is to buyers, the less bargaining Power they have.
4. Threat of Suppliers' Bargaining Power
© 2021 Samer Odeh - Pioneers 92
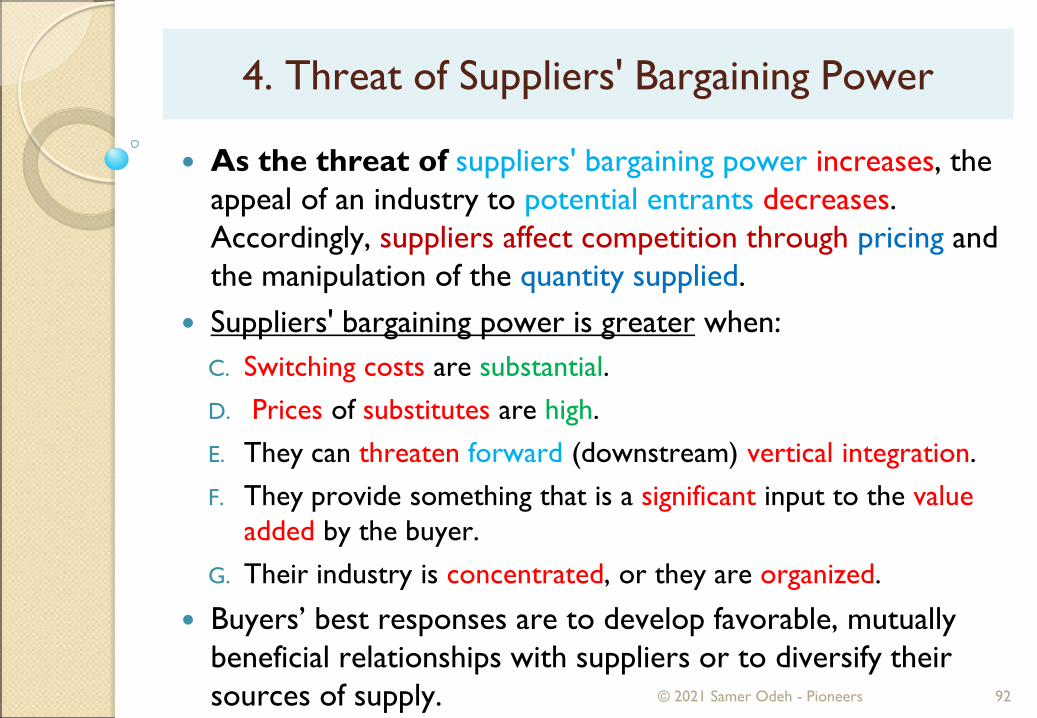
As the threat of suppliers' bargaining power increases, the appeal of an industry to potential entrants decreases. Accordingly, suppliers affect competition through pricing and the manipulation of the quantity supplied.
Suppliers' bargaining power is greater when:C. Switching costs are substantial.D. Prices of substitutes are high.E. They can threaten forward (downstream) vertical integration.F. They provide something that is a significant input to the value
added by the buyer.G. Their industry is concentrated, or they are organized.
Buyers’ best responses are to develop favorable, mutually beneficial relationships with suppliers or to diversify their sources of supply.
Generic Competitive Analysis (Strategies)Model
© 2021 Samer Odeh - Pioneers 93
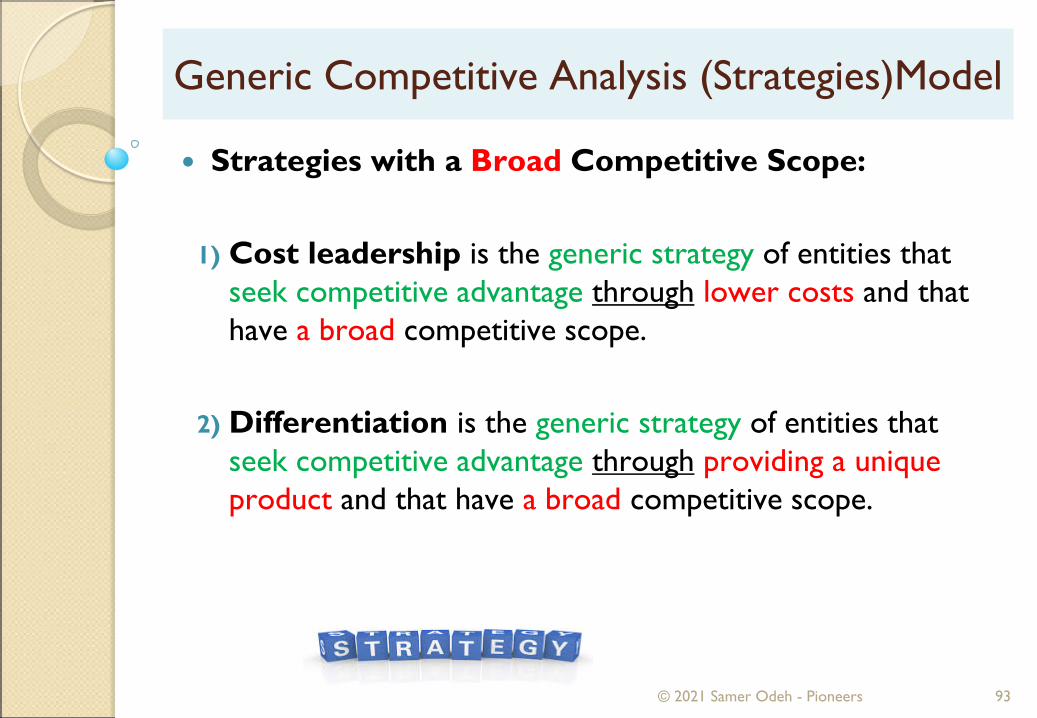
Strategies with a Broad Competitive Scope:
1) Cost leadership is the generic strategy of entities that seek competitive advantage through lower costs and that have a broad competitive scope.
2) Differentiation is the generic strategy of entities that seek competitive advantage through providing a unique product and that have a broad competitive scope.

Generic Competitive Analysis (Strategies)Model
© 2021 Samer Odeh - Pioneers 94
Strategies with a Narrow Competitive Scope:1) Cost focus is the generic strategy of entities that seek
competitive advantage through lower costs and that have a narrow competitive scope (a regional or smaller market).
2) Focused differentiation is the generic strategy of entities that seek competitive advantage through providing a unique product and that have a narrow competitive scope (a regional or smaller market).
The Growth-Share Matrix
© 2021 Samer Odeh - Pioneers 95
Since a large firm may be viewed as a portfolio of investments in the form of strategic business units (SBUs), techniques of portfolio analysis have been developed to aid management in making decisions about resource allocation, new business startups and acquisitions, downsizing, and divestitures.
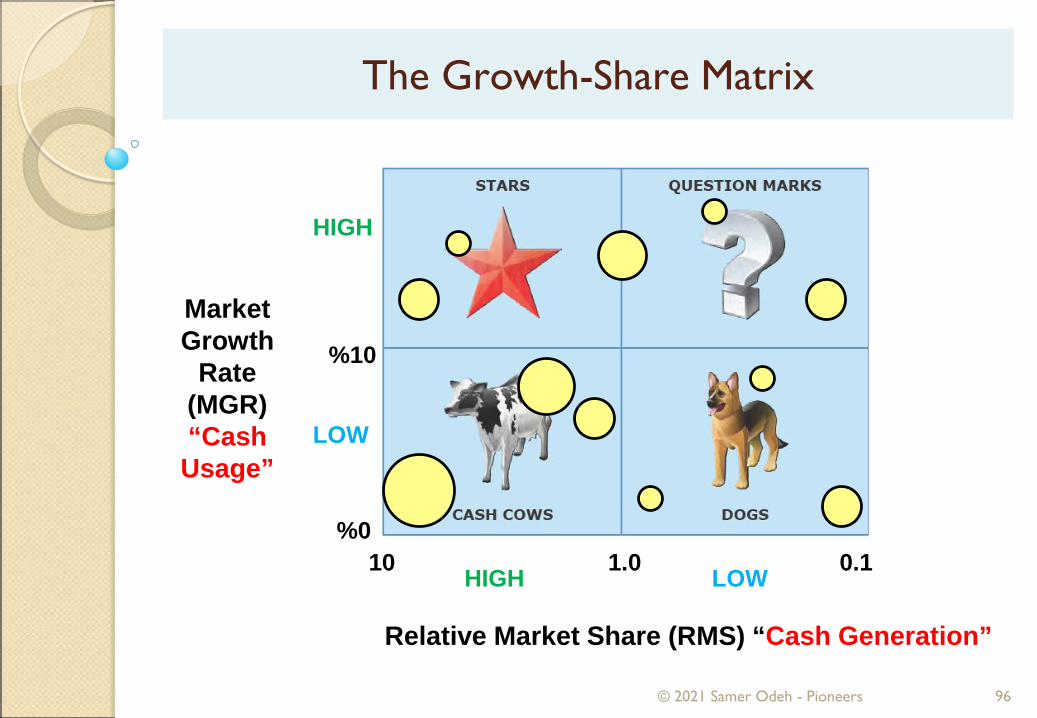
One of the models most frequently used for competitive analysis was created by the Boston Consulting Group (BCG). This model, the growth-share matrix, has two variables. The market growth rate (MGR) is on the vertical axis, and the firm's relative market share (RMS) is on the horizontalaxis.
The Growth-Share Matrix
© 2021 Samer Odeh - Pioneers 96
HIGH
LOW
0%1.0 0.1
Relative Market Share (RMS) “Cash Generation”
MarketGrowth
Rate(MGR)“Cash
Usage”
LOWHIGH
10%
10

The Growth-Share Matrix
© 2021 Samer Odeh - Pioneers 97
The annual MGR is stated in constant units of the currency used in the measurement. lt reflects the maturity and attractiveness of the market and the relative need for cash to finance expansion.
The RMS reflects the SBU's competitive position in the market segment. lt equals the SBU's absolute market share divided by that of its leading competitor.
The growth-share matrix has four quadrants. The firm's SBUs are commonly represented in their appropriate quadrants by circles. The size of a circle is directly proportional to the SBU's sales volume.
The Growth-Share Matrix
© 2021 Samer Odeh - Pioneers 98
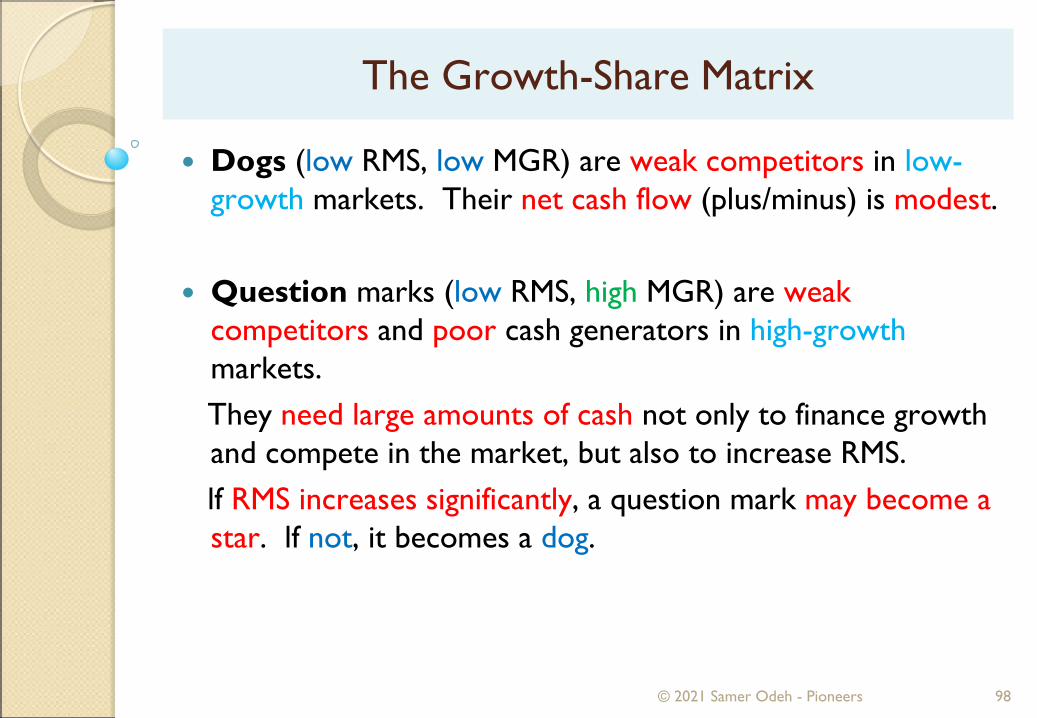
Dogs (low RMS, low MGR) are weak competitors in low-growth markets. Their net cash flow (plus/minus) is modest.
Question marks (low RMS, high MGR) are weakcompetitors and poor cash generators in high-growthmarkets.They need large amounts of cash not only to finance growth and compete in the market, but also to increase RMS. lf RMS increases significantly, a question mark may become a star. lf not, it becomes a dog.
The Growth-Share Matrix
© 2021 Samer Odeh - Pioneers 99
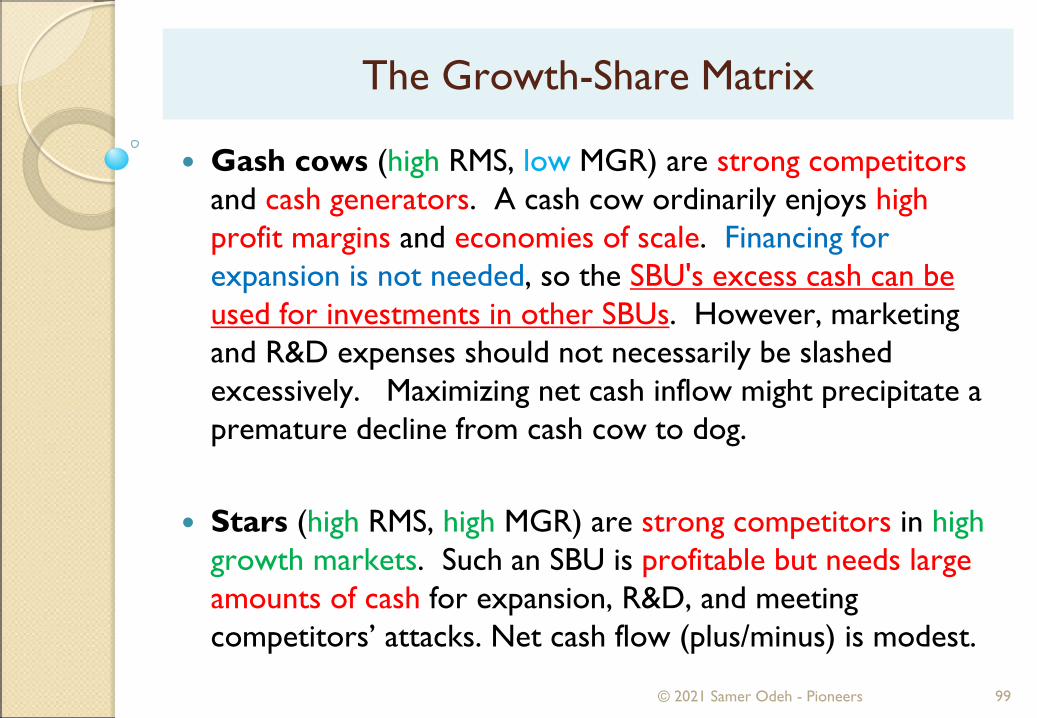
Gash cows (high RMS, low MGR) are strong competitors and cash generators. A cash cow ordinarily enjoys high profit margins and economies of scale. Financing for expansion is not needed, so the SBU's excess cash can be used for investments in other SBUs. However, marketing and R&D expenses should not necessarily be slashed excessively. Maximizing net cash inflow might precipitate a premature decline from cash cow to dog.
Stars (high RMS, high MGR) are strong competitors in high growth markets. Such an SBU is profitable but needs large amounts of cash for expansion, R&D, and meeting competitors’ attacks. Net cash flow (plus/minus) is modest.

The Growth-Share Matrix
© 2021 Samer Odeh - Pioneers 100
A portfolio of SBUs should not have too many dogs and question marks or too few cash cows and stars.
Each SBU should have objectives, a strategy should be formulated to achieve those objectives, and a budget should be allocated: A hold strategy is used for strong cash cows. A build strategy is necessary for a question mark with
the potential to be a star. A harvest strategy maximizes short-term net cash
inflow. Harvesting means zero-budgeting R&D, reducing marketing costs, not replacing facilities, etc. This strategy is used for weak cash cows and possibly question marks and dogs.
The Growth-Share Matrix
© 2021 Samer Odeh - Pioneers 101
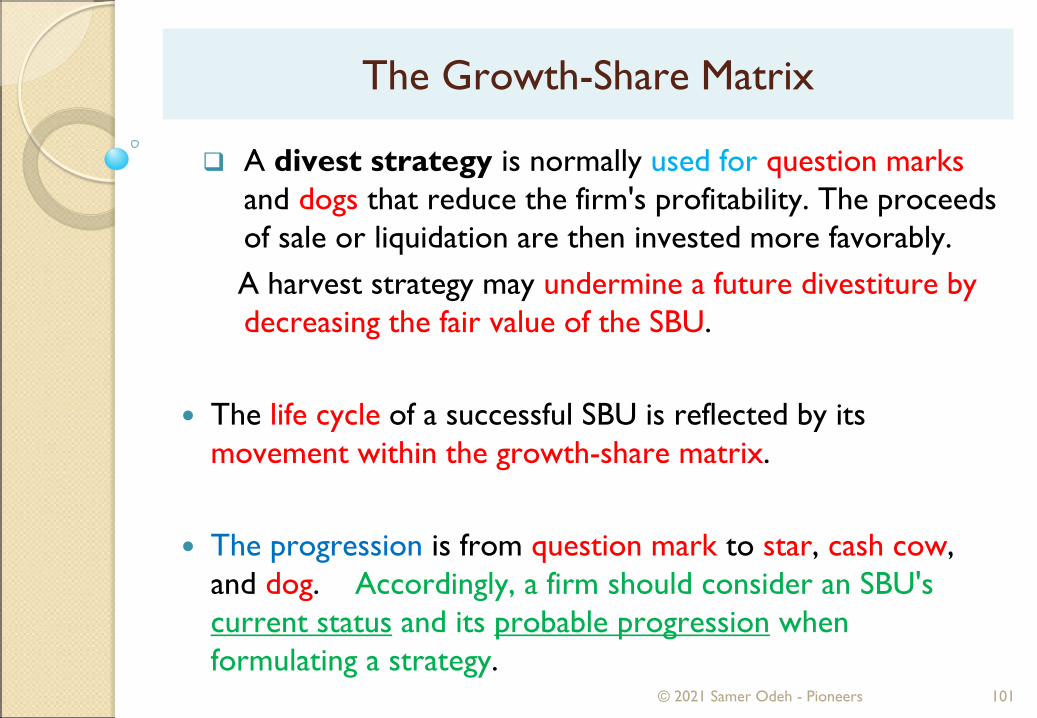
A divest strategy is normally used for question marks and dogs that reduce the firm's profitability. The proceeds of sale or liquidation are then invested more favorably.A harvest strategy may undermine a future divestiture by decreasing the fair value of the SBU.
The life cycle of a successful SBU is reflected by its movement within the growth-share matrix.
The progression is from question mark to star, cash cow, and dog. Accordingly, a firm should consider an SBU's current status and its probable progression when formulating a strategy.
The Growth-Share Matrix
© 2021 Samer Odeh - Pioneers 102
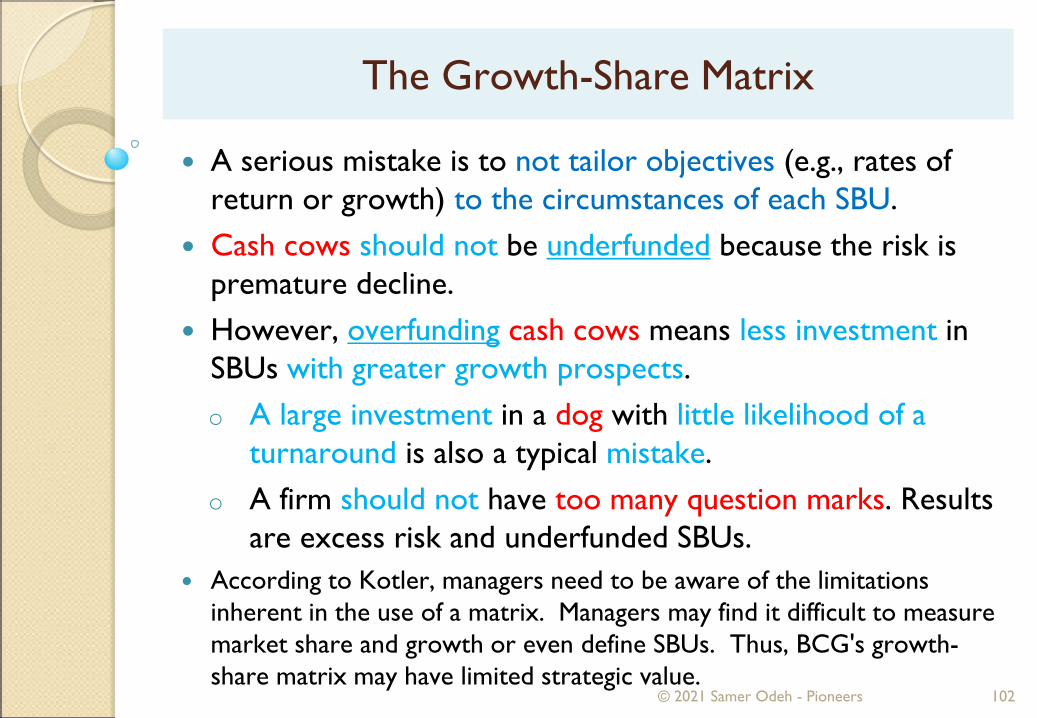
A serious mistake is to not tailor objectives (e.g., rates of return or growth) to the circumstances of each SBU.
Cash cows should not be underfunded because the risk is premature decline.
However, overfunding cash cows means less investment in SBUs with greater growth prospects.o A large investment in a dog with little likelihood of a
turnaround is also a typical mistake.o A firm should not have too many question marks. Results
are excess risk and underfunded SBUs. According to Kotler, managers need to be aware of the limitations
inherent in the use of a matrix. Managers may find it difficult to measure market share and growth or even define SBUs. Thus, BCG's growth-share matrix may have limited strategic value.

Questions and Answers
© 2021 Samer Odeh - Pioneers 103

Q-1: A firm's statement of broad objectives or mission statement should accomplish all of the following except?
A. Outlining strategies for technological development, market expansion, and product differentiation.
B. Defining the purpose of the company.C. Providing an overall guide to those in high-level, decision-
making positions.D. Stating the moral and ethical principles that guide the actions
of the firm.
© 2021 Samer Odeh - Pioneers 104
Q-1: A firm's statement of broad objectives or mission statement should accomplish all of the following except?
A. Outlining strategies for technological development, market expansion, and product differentiation.
B. Defining the purpose of the company.C. Providing an overall guide to those in high-level, decision-
making positions.D. Stating the moral and ethical principles that guide the actions
of the firm.
© 2021 Samer Odeh - Pioneers 105
The determination of organizational objectives is the first step in the planning process. A mission statement is a formal, written document that defines the organization's purpose in society, for example, to produce and distribute certain goods of high quality in a manner beneficial to the public, employees, shareholders, and other constituencies . Thus, a mission statement does not announce specific operating plans. It does not describe strategies for technological development, market expansion, or product differentiation because these are tasks for operating management.
Q-2: Intensity of rivalry among existing firms in an industry increase when?
I. Products are relatively undifferentiatedII. Consumer switching costs are low
A. I only.B. II only.C. Both I and II.D. Neither I nor II.
© 2021 Samer Odeh - Pioneers 106

Q-2: Intensity of rivalry among existing firms in an industry increase when?
I. Products are relatively undifferentiatedII. Consumer switching costs are low
A. I only.B. II only.C. Both I and II.D. Neither I nor II.
© 2021 Samer Odeh - Pioneers 107
The degree of product differentiation and the costs of switching from one competitor’s product to another increase in the intensity of rivalry and competition in an industry. Less differentiation tends to heighten competition based on price, with price cutting leading to lower profits. Low costs of switching products also increase competition.

Q-3: In a product's life cycle, the first symptom of the decline stage is a decline in the?
A. Firm's inventory levels.B. Product's sales.C. Product's production cost.D. Product's prices.
© 2021 Samer Odeh - Pioneers 108
Q-3: In a product's life cycle, the first symptom of the decline stage is a decline in the?
A. Firm's inventory levels.B. Product's sales.C. Product's production cost.D. Product's prices.
© 2021 Samer Odeh - Pioneers 109
The first symptom of the decline stage of a product's life cycle triggers such other effects as price cutting, narrowing of the product line, and reduction in promotion budgets.
Strategic Planning
110© 2021 Samer Odeh - Pioneers

Planning
© 2021 Samer Odeh - Pioneers 111
Planning is the determination of what is to be done and of how, when, where, and by whom it is to be done.
Plans serve to direct the activities that all organizational members must undertake and successfully perform to move the organization from where it is to where it wants to be (accomplishment of its objectives).o However, no transactions occur during the planning cycle
that must be recorded in the general ledger.
Planning must be completed before undertaking any other managerial function. o Forecasting is the basis of planning because it projects the
future.

Planning
© 2021 Samer Odeh - Pioneers 112
Planning establishes the means to reach organizational ends (objectives).
o This means-end relationship extends throughout the organizational hierarchy and ties together the parts of the organization so that the various means all focus on the same end.
o One organizational level's ends provide the next higher level's means.
The Planning Process
© 2021 Samer Odeh - Pioneers 113
Long-range (strategic) planning includes strategic budgeting. A strategic budget describes the long-term position and objectives of an entity within its environment.o Generally, timeframes range from 3-5 years, depending on
what is best for the company; longer time-frames are not uncommon. Such planning is difficult because of uncertaintyabout future events and conditions.
o Thus, strategic plans tend to be general and exclude operational detail.
o An entity must complete its strategic plan before any specific budgeting can begin. The strategic plan states the means by which an entity expects to achieve its stated mission.
The Planning Process
© 2021 Samer Odeh - Pioneers 114
Strategic planning embodies the concerns of senior management. It is based on a strategic analysis that includes the following:
1) Identifying and specifying organizational objectives.2) Evaluating the strengths (competitive advantages) and
weaknesses of the organization and its competitors.3) Assessing risk levels.4) ldentifying and forecasting the effects of external
(environmental) factors relevant to the organization. For example, market trends, changes in technology, international competition, and social change may provide opportunities, impose limitations, or represent threats. o Forecasting is the basis of planning because it projects the future.
A variety of quantitative methods are used in forecasting.

The Planning Process
© 2021 Samer Odeh - Pioneers 115
5) Deriving the best strategy for reaching the objectives, given the organization's strengths and weaknesses and the relevant future trends.
6) Capital budgeting, a planning process for choosing and financing long-term projects and programs.
7) Capacity planning, an element of planning closely related to capital budgeting that includes, among other things, consideration of business combinations or divestitures.
8) Contingency planning involves having alternative strategies in place (i.e., disaster recovery plans or business continuity plans) as a way of preparing for unexpected emergencies or other disruptions to operations. The primary purpose for a contingency plan is to ensure operations continue with minimal interruption, losses, or damage.
The Planning Process
© 2021 Samer Odeh - Pioneers 116
9) Scenario planning, involves projecting plausible future events (i.e., economic conditions, political environment, scientific and technological developments, etc.) and developing alternative strategies for each one of them to ensure operations continue.
Strategic plans are translated into measurable and achievable intermediate and operational plans. Thus, intermediate and operational plans must be consistent with, and contribute to achieving, strategic objectives.

Premises
© 2021 Samer Odeh - Pioneers 117
Premises are the underlying assumptions about the expected environment in which the strategic plan will be carried out. Thus, the next step in planning is premising, or the generation of planning assumptions. Premises should be limited to those crucial to the success of the plans.
Managers should ask, "What internal and external factors would influence the actions planned for this organization (division, department, program)?“ Premises must be considered at all levels of the organization.o Thus, capital budgeting plans should be premised on
assumptions (forecasts) about economic cycles, price movements, etc.
o The inventory department's plans might be premised on stability of parts prices or on forecasts that prices will rise.

Premises
© 2021 Samer Odeh - Pioneers 118
EXAMPLES: The general economy will suffer an 11% decline next year. Our closest competitor's new model will provide greater
competition for potential sales. Union negotiations will result in a general wage increase of
8%. Over the next 5 years, the cost of our raw materials will
increase by 30%. The elasticity of demand for the company's products is 1.2.

Organizational Objectives
© 2021 Samer Odeh - Pioneers 119
Organizations may have multiple objectives that are contradictory.• The objective of maximizing profit and the objective of
growth could be mutually exclusive within a given year. Maximizing short-term profit might hamper or preclude future growth.
• Conflict among an organization's objectives is common.
Objectives vary with the organization's type and stage of development.

Management Objectives
© 2021 Samer Odeh - Pioneers 120
The primary task of management is to carry on operations effectively and efficiently.• Effectiveness is the degree to which the objective is
accomplished. Efficiency is maximizing the output for a given quantity of input.
• Effectiveness is sometimes called "doing the right things," and efficiency is known as "doing things right”. o Trade-offs are frequently made between efficiency and
effectiveness.
Objectives should be clearly and specifically stated, communicated to all concerned parties, and accepted by those affected.
Means-End Hierarchy
© 2021 Samer Odeh - Pioneers 121
Objectives should be established at the top and retranslated in more specific terms as they are communicated downwardin the means-end hierarchy.
EXAMPLE:o An entity has a socioeconomic purpose, such as providing food.o The entity's mission is the accomplishment of its socio-economic
purpose through the production of breakfast cereal.o The entity develops long-range or strategic objectives with regard to
profitability, growth, or survival.o A more specific overall objective might be to provide investors with an
adequate return on their investment.o Divisional objectives can be developed, e.g., to increase the sales of a
certain kind of cereal.o Departmental objectives are developed, e.g., to reduce waste in the
packaging department.

Policies, Procedures, and Rules
© 2021 Samer Odeh - Pioneers 122
After premises and objectives are formulated, the next step in the planning process is the development of policies, procedures, and rules. These elements are necessary at all levels of the organization and overlap both in definition and in practice.o Intermediate and operational plans are translated into
policies, procedures, and rules, which are standing plans for repetitive situations.
Policies and procedures provide feed-forward control because they anticipate and prevent problems and provide guidance on how an activity should be performed to best ensure that an objective is achieved.

Policies, Procedures, and Rules
© 2021 Samer Odeh - Pioneers 123
o Policies are general statements that guide thinking and action in decision making. Policies may be explicitly published by, or implied by the actions of management. A strong organizational culture means that the
organization's key values are intensely held and widely shared. In this case, the need for formal written policies is minimized.
o Procedures are specific directives that define how work is to be done.
o Rules are specific, detailed guides that restrict behavior.
Management by Objectives (MBO)
© 2021 Samer Odeh - Pioneers 124
MBO is a behavioral, communications-oriented, responsibility approach to management and employee self-direction.
It is a comprehensive management approach and therefore is relevant to planning and control.
MBO is based on the philosophy that employees:1) Want to work hard if they know what is expected.2) Like to understand what their jobs actually entail.3) Are capable of self-direction and self-motivation.
Management by Objectives (MBO)
© 2021 Samer Odeh - Pioneers 125
MBO requires:1) Senior management participation and commitment to the
program. These managers must:A. Determine the overall direction and objectives for the
organization.B. Communicate these effectively in operational or
measurable terms.C. Coordinate subordinates' objectives with overall
objectives.D. Follow up at the end of the MBO cycle period to reward
performance and review problems.

Management by Objectives (MBO)
© 2021 Samer Odeh - Pioneers 126
2) Integration of objectives for all subunits into a compatible, balanced system directed toward accomplishment of the overall objectives.
3) Provisions for regular periodic reporting of performancetoward attainment of the objectives.
4) Free and honest communication between supervisor and subordinate.
5) A commitment to taking the ideas of subordinates seriouslyon the part of supervisors.
6) An organizational climate that encourages mutual trust and respect.
Steps necessary to implement an MBO program include establishing objectives and action plans (the planning steps) and periodic review and final appraisal (the control steps).

Goal Congruence
© 2021 Samer Odeh - Pioneers 127
Goal congruence ensures the harmonization of objectives, procedures for achieving these objectives, operational planning, and strategic planning are working as a whole in order to realize the company goals.1) Planning activities must be designed to encourage goal
congruence at various levels of management.2) Periodic (i.e., monthly) analysis of actual results compared
to budget assists with identifying whether a company is on or off course to achieving long-term strategic goals. - Tactics can be assessed and revised wherever necessary in order to get the company back on course to realizing company goals.
Goal Congruence
© 2021 Samer Odeh - Pioneers 128
Characteristics of successful strategic plans include but are not limited to:1) Clarity of purpose and realistic goals.2) Monitoring, measurement, and feedback.3) Discipline and commitment.4) Leadership.

Questions and Answers
© 2021 Samer Odeh - Pioneers 129

Q-1: What is strategic planning?
A. It establishes the general direction of the organization.B. It establishes the resources that the plan will require.C. It establishes the budget for the organization.D. It consists of decisions to use parts of the organization’s
resources in specified ways.
© 2021 Samer Odeh - Pioneers 130

Q-1: What is strategic planning?
A. It establishes the general direction of the organization.B. It establishes the resources that the plan will require.C. It establishes the budget for the organization.D. It consists of decisions to use parts of the organization’s
resources in specified ways.
© 2021 Samer Odeh - Pioneers 131
Strategic planning establishes the general direction of an organization. It embodies the concerns of senior management and is based specifically on:(1) identifying and specifying organizational objectives; (2) evaluating theorganization's strengths and weaknesses; (3) assessing risk levels; (4) identifying and forecasting the effect of external (environmental) factors relevant to the organization; (5) deriving the best strategy for reaching the objectives, given the organization's strengths and weaknesses and the relevant future trends; and (6) analyzing and reviewing the capital budgetingprocess and capacity planning.
Q-2: Which one of the following management considerations is usually addressed first in strategic planning?
A. Outsourcing.B. Overall objectives of the firm.C. Organizational structure.D. Recent annual budgets.
© 2021 Samer Odeh - Pioneers 132

Q-2: Which one of the following management considerations is usually addressed first in strategic planning?
A. Outsourcing.B. Overall objectives of the firm.C. Organizational structure.D. Recent annual budgets.
© 2021 Samer Odeh - Pioneers 133
Strategic planning is the process of setting overall organizational objectives and drafting strategic plans. Setting ultimate objectives for the firm is a necessary prelude to developing strategies for achieving those objectives. Plans and budgets are then needed to implement those strategies.

Q-3: Strategic planning, as practiced by most modern organizations, includes all of the following except?
A. Top-level management participation.B. A long-term focus.C. Strategies that will help in achieving long-range goals.D. Analysis of the current month's actual variances from budget.
© 2021 Samer Odeh - Pioneers 134
Q-3: Strategic planning, as practiced by most modern organizations, includes all of the following except?
A. Top-level management participation.B. A long-term focus.C. Strategies that will help in achieving long-range goals.D. Analysis of the current month's actual variances from budget.
© 2021 Samer Odeh - Pioneers 135
Strategic planning is the process of setting overall organizational objectives. lt is a long-term process aimed at determining the future course of the organization. Analysis of the current month's budget variances is a short-term activity.

END OF THE UNIT
THANK YOU
136© 2021 Samer Odeh - Pioneers