cm and gm reporting - forestforest.jrc.ec.europa.eu/media/cms_page_media/232/a...25./26. may 2015...
TRANSCRIPT

25./26. May 2015
Andreas Gensior et al.JRC technical workshop on LULUCF reporting
Slide 0
CM and GM Reporting
JRC technical workshop on LULUCF reporting
Arona, 26./27. May 2015
1 Thünen - Institute of Climate-Smart AgricultureBundesallee 50D-38116 [email protected]
Andreas Gensior1 , Wolfgang Stümer2, Andreas Laggner1 & Annette Freibauer1
- the German way meeting the challenge
2 Thünen - Institute of Forest EcosystemsAlfred-Möller-Straße 1D-16225 Eberswalde [email protected]
25./26. May 2015
Andreas Gensior et al.JRC technical workshop on LULUCF reporting
Slide 1
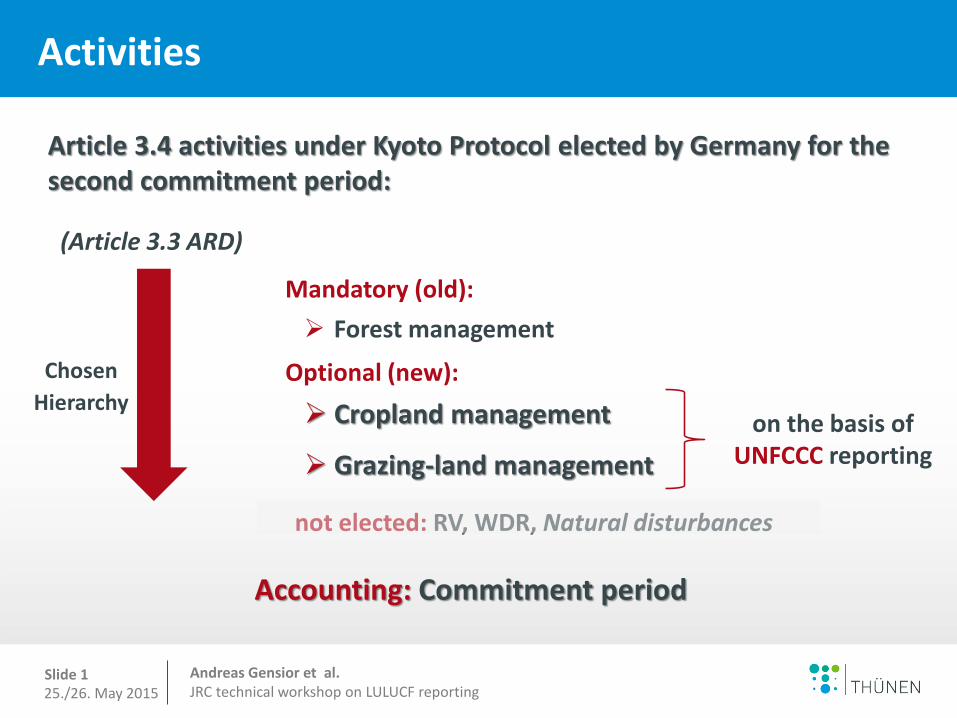
Activities
Article 3.4 activities under Kyoto Protocol elected by Germany for thesecond commitment period:
Chosen
Hierarchy
(Article 3.3 ARD)
Optional (new):
Cropland management
Grazing-land management
Mandatory (old):
Forest management
on the basis ofUNFCCC reporting
Accounting: Commitment period
not elected: RV, WDR, Natural disturbances

25./26. May 2015
Andreas Gensior et al.JRC technical workshop on LULUCF reporting
Slide 2
Consistent representation of land
Activity data
Reporting CM and GM: Data Availability

25./26. May 2015
Andreas Gensior et al.JRC technical workshop on LULUCF reporting
Slide 3
Definitions
UNFCCC
Woody GrasslandGrassland
Cropland management
Grazing land management
KP
≙Grassland in a strict sense
Cropland
Grassland in a strict sense: Meadows, pastures, alpine pastures, rough pastures, heath areas(natural-condition grassland and swamp/reeds)
Cropland: Area for cultivation of field crops, vegetables, berries, fruit and flowers including specialised cultivation (e.g. orchards, vineyards, short rotation coppices, tree nurseries, christmas- tree plantations)
Hedges, field copses and shrubbery make up the sub-category “woody grassland”.They are not subject of GM

25./26. May 2015
Andreas Gensior et al.JRC technical workshop on LULUCF reporting
Slide 4
Activity Data: Consistent Representation of Lands
Sample-based system (Approach 3)
Data Sources:
• National Forest Inventory (QL 1)
• Inventory Study (QL 1)
• ColorInfraRed Aerial Photography (QL 1)
• Basic Digital Landscape Model (QL 2)
• CORINE Land Cover (QL 3)
• GSE- Forest Monitoring (QL 4)

25./26. May 2015
Andreas Gensior et al.JRC technical workshop on LULUCF reporting
Slide 5
Land-Use Matrix
Land-Use Matrix Germany 2013 [ha]
Initial\Final Forest Land Cropland Grassland
i.n.S. Woody
Grassland Terrestrial Wetlands
Waters Peat
Extraction Settlements
Other Land
Σ Losses (2)
(1)-(2)
Forest Land 10.981.066 36.771 57.980 16.690 3.783 7.345 0 97.620 0 220.190 174.190
Cropland 129.301 12.365.027 477.028 65.278 729 17.662 0 541.502 0 1.231.500 -105.382
Grassland 167.647 1.013.881 5.077.170 62.248 14.812 21.272 0 240.454 0 1.520.314 -811.539
Woody Grassland 26.315 13.099 32.886 417.725 770 1.758 0 14.615 0 89.442 90.113
Terrestrial Wetlands 6.953 2.157 2.657 539 44.503 501 0 7.547 0 20.355 857
Waters 10.545 5.151 27.944 2.019 278 526.88
1 0 7.013 0 52.951 15.877
Peat Extraction 0 0 0 0 0 0 19.857 0 0 0 0
Settlements 41.480 49.826 93.576 29.357 839 13.008 0 2.909.757 0 228.086 690.592
Other Land 12.139 5.234 16.703 3.424 0 7.282 0 9.925 20.102 74.809 -74.809
Σ Gains (1) 394.380 1.126.118 708.775 179.555 21.211 68.827 0 918.678 0
Σ Land-Use Category
11.375.446 13.491.146 5.785.945 597.280 65.715 595.709 19.857 3.828.434 20.102
Germany 35.779.633

25./26. May 2015
Andreas Gensior et al.JRC technical workshop on LULUCF reporting
Slide 6
Land-Use Matrix
Land-Use Matrix Germany 2013 [ha]
Initial\Final Forest Land Cropland Grassland
i.n.S. Woody
Grassland Terrestrial Wetlands
Waters Peat
Extraction Settlements
Other Land
Σ Losses (2)
(1)-(2)
Forest Land 10.981.066 36.771 57.980 16.690 3.783 7.345 0 97.620 0 220.190 174.190
Cropland 129.301 12.365.027 477.028 65.278 729 17.662 0 541.502 0 1.231.500 -105.382
Grassland 167.647 1.013.881 5.077.170 62.248 14.812 21.272 0 240.454 0 1.520.314 -811.539
Woody Grassland 26.315 13.099 32.886 417.725 770 1.758 0 14.615 0 89.442 90.113
Terrestrial Wetlands 6.953 2.157 2.657 539 44.503 501 0 7.547 0 20.355 857
Waters 10.545 5.151 27.944 2.019 278 526.88
1 0 7.013 0 52.951 15.877
Peat Extraction 0 0 0 0 0 0 19.857 0 0 0 0
Settlements 41.480 49.826 93.576 29.357 839 13.008 0 2.909.757 0 228.086 690.592
Other Land 12.139 5.234 16.703 3.424 0 7.282 0 9.925 20.102 74.809 -74.809
Σ Gains (1) 394.380 1.126.118 708.775 179.555 21.211 68.827 0 918.678 0
Σ Land-Use Category
11.375.446 13.491.146 5.785.945 597.280 65.715 595.709 19.857 3.828.434 20.102
Germany 35.779.633
KP-CRF Table Article 3.3/3.4 Activities

25./26. May 2015
Andreas Gensior et al.JRC technical workshop on LULUCF reporting
Slide 7
Reporting CM and GM: Data Availability
Activity data
Consistent representation of land
Emission factors
Management data Data for developing, feeding, fitting and validating models
• Cropland
• Grassland
Copland management
Grazing land management

25./26. May 2015
Andreas Gensior et al.JRC technical workshop on LULUCF reporting
Slide 8
Remaining Categories: Data Gap
No management data no „remaining category“ reporting
Possibilities:
1. Adduce evidence: CM and GM are not a source
2. Reporting results of representative inventories
3. Searching for and working with proxies for management data
4. Combinations of 1., 2. and 3.
Gaining management data access
Implementation of representative national inventories

25./26. May 2015
Andreas Gensior et al.JRC technical workshop on LULUCF reporting
Slide 9
CM, GM: Reported Pools and GHGs
Categories Pools R
emai
nin
g
Soils Biomass3)
organic1) mineral2) above-ground below-ground
CM X
GM X
Tran
siti
on
to CM4) X X X X
to GM4) X X X X
from CM5)
from GM)5
1) CO2, CH4, (N2O reported under agriculture)
2) CO2, N2O
3) CO2
4) not from Forest Land (otherwise Deforestation)
5) not to Forest Land (otherwise Afforestation or Reforestation)
(pools at equilibrium, not a source)
(accounted as zero)
25./26. May 2015
Andreas Gensior et al.JRC technical workshop on LULUCF reporting
Slide 10
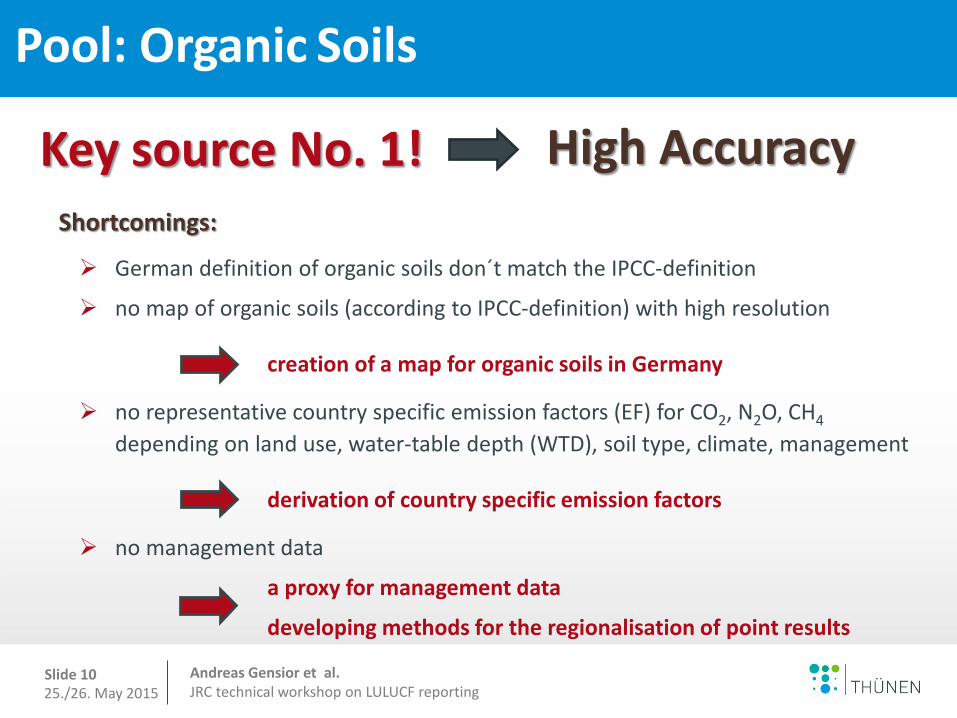
Pool: Organic Soils
Key source No. 1! High Accuracy
Shortcomings:
German definition of organic soils don´t match the IPCC-definition
no map of organic soils (according to IPCC-definition) with high resolution
creation of a map for organic soils in Germany
no representative country specific emission factors (EF) for CO2, N2O, CH4
depending on land use, water-table depth (WTD), soil type, climate, management
derivation of country specific emission factors
no management data
a proxy for management data
developing methods for the regionalisation of point results

25./26. May 2015
Andreas Gensior et al.JRC technical workshop on LULUCF reporting
Slide 11
Structure
Modul 1: Activity data and regionalisationof modelling parameters
Modul 2: Emission factors
Modul 3: Model development
11 participating institutions
Design/Configuration
Sites: 14 Study Areas
Land use: Grassland, arable land, re-wetted and semi-natural
Mean annual WTD: -0,15 – -1,42 m
SOC in 0-20 cm: 5 – 57%
C:N ratio in 0-20 cm: 10 – 65
pH-value 0-20 cm: 3,3 – 7,4
Joint Research Project „Organic Soils“
Basemap (potential) organic soils: Geological map 1:200.000 (BGR)
Dümmer
(LBEG Hannover)
Peene Valley
(ZALF)
4 Paulinenaue
(ZALF)
Freisinger
Moos (HSWT)
Dummerstorf
(Uni Rostock)
9 Großes Moor (TI)
Spreewald(ZALF)
Ahlenmoor (Uni
Rostock, LBEG)
BERLIN
Bog peat
Fen peat
Other
Study area
Donaumoos
(HSWT, MPI)
Benediktbeuern
(HSWT)
Rhine Valley
(Uni Hohenheim)
Leegmoor
(LBEG Hannover)
Kendlmühlfilze (HSWT)

25./26. May 2015
Andreas Gensior et al.JRC technical workshop on LULUCF reporting
Slide 12
HuMoor new map of organic soils of Germany
• map legacy data
• soil borehole databases
• detailed data on topography, hydrology and geology
• accompanied by additional ground verification
grid map
scale 1.25.000 – 1:50.000
detailed and almost complete dataset on organic soils
based on
New Map of Organic Soils
(ROßKOPF et al. 2015: Catena 133 (2015) 157–170)
25./26. May 2015
Andreas Gensior et al.JRC technical workshop on LULUCF reporting
Slide 13
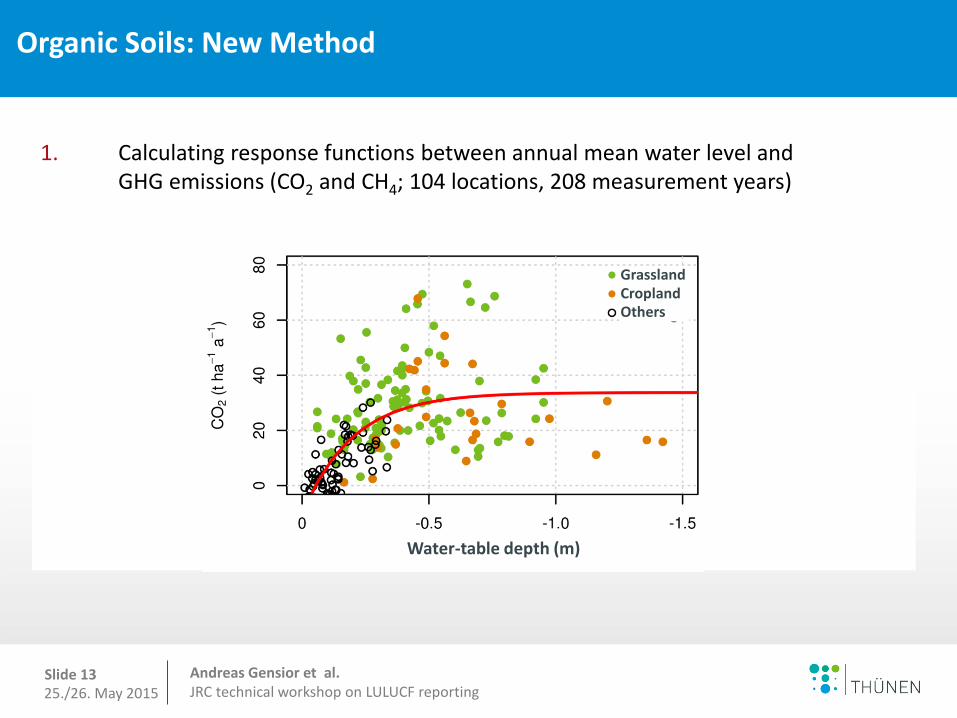
Organic Soils: New Method
Results of the project „Organic Soils“ relating to GHG emissions:
no or neglegible differences between fens and bogs
differences between cropland and grassland
differences in dependence of intensity of use on cropland andgrassland
1. Calculating response functions between annual mean water level and GHG emissions (CO2 and CH4; 104 locations, 208 measurement years)
Water-table depth (m)
GrasslandCroplandOthers

25./26. May 2015
Andreas Gensior et al.JRC technical workshop on LULUCF reporting
Slide 14
Organic Soils: New Method
Map of water-table depth in organic soils ofGermany
wet
dry
Water-table depth (m)2. Developing a map of mean annual waterlevel for all German organic soils
Model building• Boosted regression trees
Predictor variables:• Land cover• Drainage network• Peatland characteristics• Climatic boundary conditions• Relative altitude• Topographic wetness index• Protection status
(Bechtold et al. 2014: Hydrol. Earth Syst. Sci., 18, 3319–3339)
Hydrologic data• 1094 dip wells (> 7000 measurement years)• 53 German peatlands (well distributed)• covering the major types of organic soils
Basic data

25./26. May 2015
Andreas Gensior et al.JRC technical workshop on LULUCF reporting
Slide 15
Organic Soils: New Method
3. Calculating GHG-Emissions and derivating representative country specific GHGemission factors for organic soils in Germany
Grassland
Cropland
Are
a (h
a)
Water-table depth (m)
Water-table depth (m)
GrasslandCroplandOthers
Are
a (h
a)
GrasslandCropland
CO2
EFCropland = 28,6 Mg ha-1 a-1 (15,0-33,7)
EFGrazingland = 26,0 Mg ha-1 a-1 (11,0-33,7)
CH4
EFCropland = 0,29 Mg CO2-Eq. ha-1 a-1 (-0,07-1,83)
EFGrazingland = 0,26 Mg CO2-Eq. ha-1 a-1 (0,09-1,73)
N2O (mean value, Leppelt et al. 2014)
EFCropland = 3,17 Mg CO2-Eq. ha-1 a-1 (0,46-12,26)
EFGrazingland = 0,81 Mg CO2-Eq. ha-1 a-1 (0,01-2,63)
DOC; Ditch-CH4 according to IPCC, 2014(TI-AK/Freibauer et al. 2014)
The combination of national GHG measurement data and the classification of sites in national water level distributions
enables high representativeness
25./26. May 2015
Andreas Gensior et al.JRC technical workshop on LULUCF reporting
Slide 16
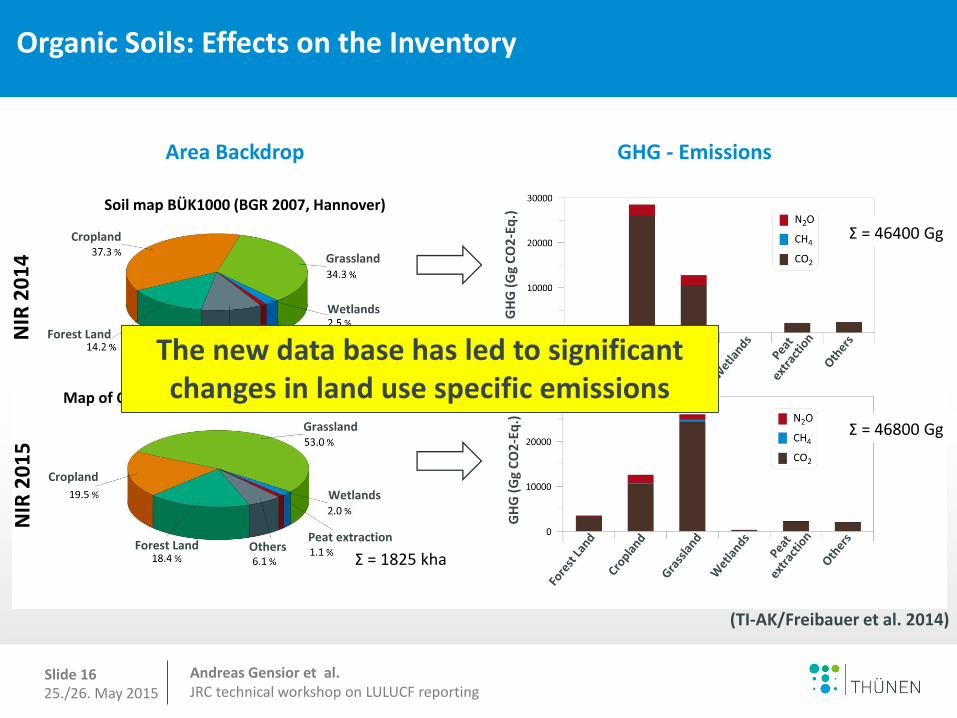
Organic Soils: Effects on the Inventory
Area Backdrop GHG - Emissions
NIR
20
15
Soil map BÜK1000 (BGR 2007, Hannover)
Map of Organic Soils (Roßkopf et al., submitted)
NIR
20
14
Σ = 1725 kha
Σ = 1825 kha
Σ = 46400 Gg
Σ = 46800 Gg
ForestLand
GH
G (
Gg
CO
2-E
q.)
GH
G (
Gg
CO
2-E
q.)
Forest Land
Wetlands
Grassland
Cropland
Peat extractionOthers
Forest Land
Wetlands
Grassland
Cropland
Peat extractionOthers
(TI-AK/Freibauer et al. 2014)
2015)
The new data base has led to significant changes in land use specific emissions

25./26. May 2015
Andreas Gensior et al.JRC technical workshop on LULUCF reporting
Slide 17
Remaining Categories: Mineral Soils
Present assumption:
mineral soils of the remaining categories under CM and GM are not a source
No management data no „remaining category“ reporting
Evidence (Tier 1 approach):
1. Results of long term soil monitoring sites
2. Rough calculation of carbon input in mineral soils under cropland based on the data for crop yields, crop residues and manure input of UNFCCC reporting
3. Using simple modells for carbon balance calculation on agricultural soils (firstdata of the ongoing German agricultural soil inventory)
25./26. May 2015
Andreas Gensior et al.JRC technical workshop on LULUCF reporting
Slide 18
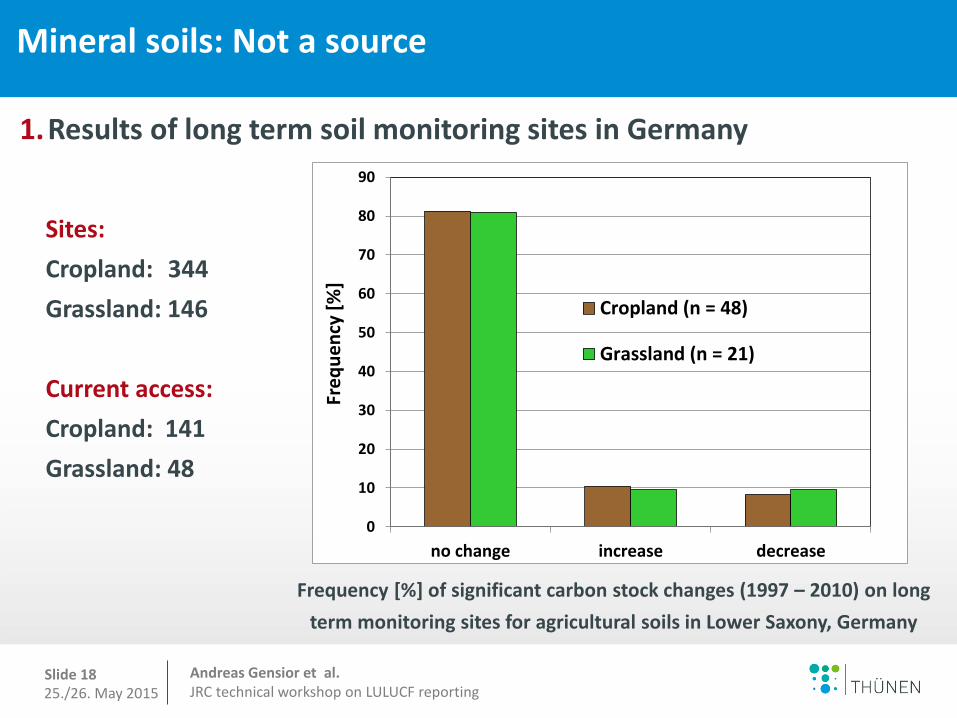
Mineral soils: Not a source
1.Results of long term soil monitoring sites in Germany
0
10
20
30
40
50
60
70
80
90
no change increase decrease
Fre
qu
en
cy [
%]
Cropland (n = 48)
Grassland (n = 21)
Frequency [%] of significant carbon stock changes (1997 – 2010) on long
term monitoring sites for agricultural soils in Lower Saxony, Germany
Sites:
Cropland: 344
Grassland: 146
Current access:
Cropland: 141
Grassland: 48

25./26. May 2015
Andreas Gensior et al.JRC technical workshop on LULUCF reporting
Slide 19
Mineral soils: Not a source
2. Rough calculation of carbon input in mineral soils under cropland based on
the data for crop yields, crop residues and manure input of UNFCCC reporting
C-input [Mg C a-1]
crop residues animal manure
1990 54.027.217 10.634.496
2012 65.151.329 9.249.269
2012 - 1990 11.124.112 -1.385.227
25./26. May 2015
Andreas Gensior et al.JRC technical workshop on LULUCF reporting
Slide 20
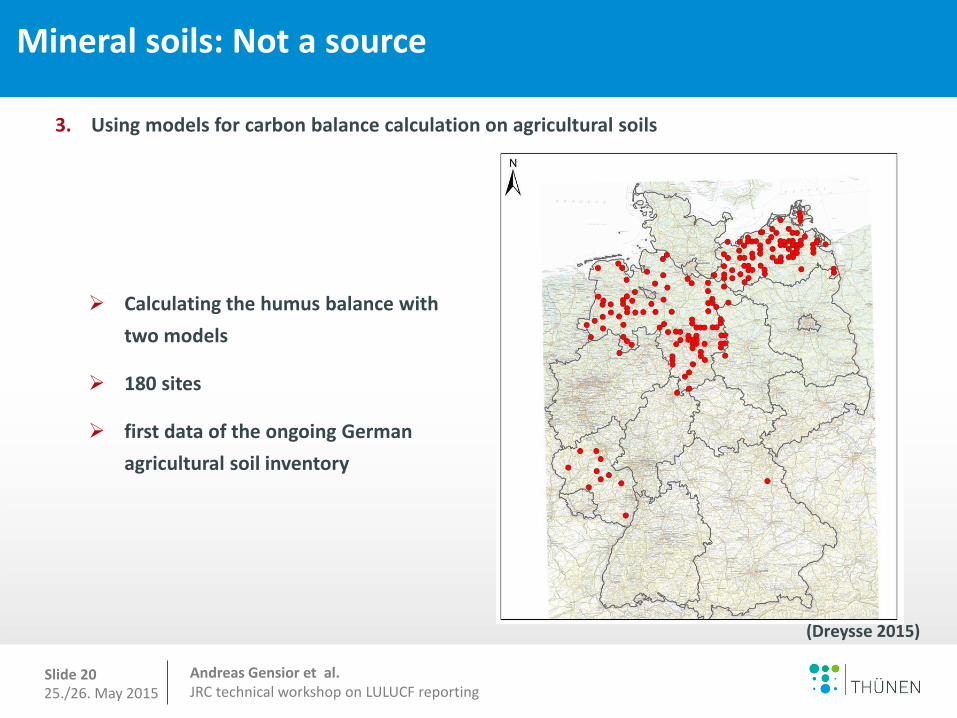
Mineral soils: Not a source
3. Using models for carbon balance calculation on agricultural soils
(Dreysse 2015)
Calculating the humus balance with
two models
180 sites
first data of the ongoing German
agricultural soil inventory

25./26. May 2015
Andreas Gensior et al.JRC technical workshop on LULUCF reporting
Slide 21
Model VDLUFA - Humusbilanzierung CANDY Carbon Balance
Authors KÖRSCHENS, et al., 2004; Team of authors, 2014 FRANKO, et al., 2011
Type of model balance approach process based
Model basics Reproduktionswirksame organische Substanz - ROS (ASMUS, et al., 1977)
Humuseinheitenschlüssel (RAUHE, et al., 1966)
Carbon and Nitrogen Dynamics - CANDY (FRANKO, et al., 1995)
Carbon turnover in Pore Space - CIPS (KUKA, et al., 2007)
Biologic Active Time - BAT (FRANKO, et al., 1995)
Validated yes yes
Site adaption no yes
Time period year, crop rotation year
Input data (mandatory) species of fruit
amount of organic fertilisers
yield
species of fruit
amount of organic and mineral fertilisers
yield
management options
climatic parameters
chemical and physical soil properties
field size
Output / results humus balance humus and nitrogene balance
carbon stocks
production
Assessment of results VDLUFA – supply classes non specific
Mineral soils: Not a source
(Dreysse 2015)
3. Using models for carbon balance calculation on agricultural soils
Comparison of the used models

25./26. May 2015
Andreas Gensior et al.JRC technical workshop on LULUCF reporting
Slide 22
Mineral soils: Not a source
0
5
10
15
20
25
30
35
40
VDLUFA
CCB
n
kg SOM C ha-1 a-1
(Dreysse 2015)
3. Using models for carbon balance calculation on agricultural soils
frequency distribution of calculated balances

25./26. May 2015
Andreas Gensior et al.JRC technical workshop on LULUCF reporting
Slide 23
Mineral soils: Not a source
n Mean Standarderror Min 25% Median 75% Max
[kg SOM C ha-1 a-1]
VDLUFA 180 205,83 21,81 -426,00 72,00 195,00 319,50 2641,00
CCB 180 75,82 41,72 -1857,60 -181,21 188,35 456,71 1261,96
∆𝑪𝒐𝒓𝒈 [% 10a-1] 180 0,0192 0,0096 -0,406 -0,0454 0,0374 0,0979 0,298
(Dreysse 2015)
3. Using models for carbon balance calculation on agricultural soils
descriptive statistics of the model calculations

25./26. May 2015
Andreas Gensior et al.JRC technical workshop on LULUCF reporting
Slide 24
Planned Improvements: Mineral soils
Main objectives
development of a consistent, nation-wide data set on current carbon stocks of agricultural soils
utilization of an adequate population for geo-statistical interpolation
using advanced modelling techniques under consideration of the theory of errors
provide the data basis to separate the influence of site and climate factors from land use history and land management
improvement of the national reporting on emissions under the UNFCCC, KP and EU 529/2013
Design
Random based 8 x 8 km grid, > 3.100 sites
Questionaire
Information about land use history and management of the sampling plots (at least for the last 10 years)
German agricultural soil inventory
Developing a model-based assessment of C stock
changes based on
• upcoming data from the German Inventory of
Agricultural Soils by 2018
• additional data from long-term monitoring
and long-term experiments

25./26. May 2015
Andreas Gensior et al.JRC technical workshop on LULUCF reporting
Slide 25
Remaining Categories: Biomass
German approach
(In addition to annual biomass), woody biomass is assumed to be inequilibrium in the “remaining categories”
Annual and perennial (woody) biomass are reported as „NO“
Reason/Motivation
We determined representative country specific “dynamic equilibrium carbon stocks” for Germany's woody biomass outside of forests
Loss of orchard area was compensated by higher tree density and small shiftings in age class structure

25./26. May 2015
Andreas Gensior et al.JRC technical workshop on LULUCF reporting
Slide 26
Remaining Categories: Biomass
Method
Research project: “Development of methods for determining the biomass of plants, outside of
forests, with multiple years of wood growth” (Orchards, vineyards, tree nurserys,
christmas-tree plantations and hedges)
(Destructive) analysis of
• 100 fruit trees
• 76 grapevines
• 50 hedges
Survey on a large number of plants and plantation structures (literature)
Calculation of regression functions (e.g. agetree parameter; tree parameter carbon stocks)
summation of calculated carbon stocks of above- and below-ground biomass over all age classes,
plant types and plantation structures and combinations
deriving of representative type-specific mean carbon stocks for woody plants and plantation
structures outside of forests in consideration of the (short) rotation periods (about 10 – 12 years)

25./26. May 2015
Andreas Gensior et al.JRC technical workshop on LULUCF reporting
Slide 27
Remaining Categories: Biomass
(Short rotation coppices: Results of “BEST - bioenergy for climate mitigation” (Walter et al 2014) and literature)
Plant type /plantation structure
Bioabove Biobelow Biototal
Mg C ha-1
Apple 5,31 2,27 7,58
Pear 4,91 2,04 6,95
Sweet cherry 8,44 1,57 10,01
Morello cherry 17,31 3,13 20,45
Plum/ damson plum 9,60 1,90 11,51
Mirabelle / greengage 8,25 1,51 9,76
Vine 1,12 0,54 1,66
Christmas-tree plantations 8,10 3,15 11,25
Tree nurseries 9,06 2,91 11,97
Short rotation coppices 40,75 12,96 53,71
Hedges/shrubs 32,69 10,47 43,16
the values represent a
type-specific state of
dynamic equilibrium
Type-specific mean carbon stocks [Mg C ha-1] of woody plants and plantation structures in Germany

25./26. May 2015
Andreas Gensior et al.JRC technical workshop on LULUCF reporting
Slide 28
Emissions: Cropland Management
Cropland Management (CM) Germany 2013
Subcategories
C-Stock Change Biomass
C-Stock Change Mineral Soils
CO2 from Organic Soils
CH4 from Organic Soils
Direct/indirect N2O associated with loss of soil organic matter
∑ 2013
[Gg C] [Gg C] [Gg C] [Gg CH4] [Gg N2O] [Gg CO2-Eq.]
CM remaining CM 0 0 -2.179,06 6,99 0 8.164,76
LUC from GM to CM 63,79 -826,17 -521,72 1,67 1,25 5.123,91
LUC from Woody Grassland to CM -24,99 -8,42 -2,38 0,01 0,01 135,38
LUC from Terrestrial Wetlands to CM 0 -1,51 0 0 0 6,08
LUC from Flooded Land to CM 0 0 0 0 0 0
LUC from Settlements to CM -8,4 2,27 -131,62 0,42 0 515,63
LUC from Other Land to CM 0 1,16 0 0 0 -4,25
∑ LUC to CM 30,4 -832,67 -655,73 2,1 1,27 5.776,76
∑ LUC from CM 0 0 0 0 0 0
∑ 2013 30,4 -832,67 -2.834,79 9,1 1,27 13.941,51
∑ 1990 15.341,19
ccounting -1 99

25./26. May 2015
Andreas Gensior et al.JRC technical workshop on LULUCF reporting
Slide 29
Emissions: Grazingland Management
Grazingland Management (GM) Germany 2013
Subcategories
C-Stock Change Biomass
C-Stock Change Mineral Soils
CO2 from Organic Soils
CH4 from Organic Soils
Direct/indirect N2O associated with loss of soil organic matter
∑ 2013
[Gg C] [Gg C] [Gg C] [Gg CH4] [Gg N2O] [Gg CO2-Eq.]
GM remaining GM 0 0 -5.561,55 17,29 0 20.824,50
LUC from CM to GM -17,62 338,88 -600,18 1,87 0 1.069,33
LUC from Woody Grassland to GM -18,26 4,94 -66,22 0,21 0 296,78
LUC from Terrestrial Wetlands to GM -2,43 0,3 -6,33 0,02 0 31,52
LUC from Flooded Land to GM 4 0 -74,6 0,23 0 264,65
LUC from Settlements to GM -9,8 70,68 -124,8 0,39 0 244,07
LUC from Other Land to GM 0 18,23 0 0 0 -66,84
∑ LUC to GM -44,1 433,02 -872,12 2,71 0 1.839,50
∑ LUC from GM 0 0 0 0 0 0
∑ 2013 -44,1 433,02 -6.433,68 20 0 22.664,00
∑ 1990 21.057,27
ccounting 1 0

25./26. May 2015
Andreas Gensior et al.JRC technical workshop on LULUCF reporting
Slide 30
Summary
Under the current circumstances and possibilities Germany
could report CM and GM according to the requirements of
the regulatory framework
With a little brain power and creative thinking it seemed to
be easy (easier than previously thought)
Problems (not fully satisfying solutions) have been
identified; solutions for them are under progress
Remaining problem: Reporting on Grazing land management

25./26. May 2015
Andreas Gensior et al.JRC technical workshop on LULUCF reporting
Slide 31
The End!?
What do you think about the German way meeting the
challenge „CM/GM reporting“?
Thank you very much for your attention and patience!