ghg inventory in lulucf sector swarnim prof n.h. ravindranath nitasha sharma, indu .k. murthy,...
TRANSCRIPT
Shilpa SwarnimProf N.H. Ravindranath
Nitasha Sharma, Indu .K. Murthy, Asmita Sengupta, Sumedha Malaviya
GHG Inventory in LULUCF sector

GHG Inventory for LULUCF
• NATCOM-I
– Inventory prepared for 1994
– Methods – IPCC 1996 revised guidelines
• NATCOM-II
– Inventory being prepared for 2004
– Methods- IPCC 2003 GPG for LULUCF
• Institutions involved
– IISc, ICFRE, FSI, FRI, NRSC, IIRS…

Net emissions from LULUCF sector: 1.4 million tons for 1994
Emission inventory – LULUCF in Gg
For year 1994 (IPCC, 1996 Guidelines)

Why GPG approach
• UNFCCC recommends adoption of IPCC 2003 GPG approach to LULUCF
• GPG is Land use categories: Adopted 6 land categories to ensure consistent representation, covering all geographic area of a country.
– Forestland, cropland, grassland, wetland, settlements and others
• Each land use category is further disaggregated to reflect the past and the current land use
– Forestland remaining forestland
– Lands converted to forestland
• Links Biomass carbon with Soil Carbon
• CO2
emissions and removal is estimated for all the C-pools namely;
– Aboveground biomass
– Belowground biomass
– Soil carbon
– Dead organic matter and woody litter
• Non-CO2 gases estimated include; CH4, N
2O, CO and No
x

Reporting of GHG Inventory in the LUCF
Sector – GPG2003Net CO2 emissions / removals
(1) CH4 N2O NOx CO Greenhouse gas source and sink
categories IPCC guidelines
(Gg)
5. Total Land-Use Categories
5.A. Forest Land
5.A.1. Forest Land remaining Forest Land 5A
5.A.2. Land converted to Forest Land 5A, 5C, 5D
5.B. Cropland
5.B.1. Cropland remaining Cropland 5A, 5D
5.B.2. Land converted to Cropland 5B, 5D
5.C. Grassland
5.C.1. Grassland remaining Grassland 5A, 5D
5.C.2. Land converted to Grassland 5C, 5D
5.D. Wetlands (2)
5.D.1. Wetlands remaining Wetlands 5A, 5E
5.D.2. Land converted to Wetlands 5B, 5E
5.E. Settlements (2)
5.E.1. Settlements remaining Settlements 5A
5.E.2. Land converted to Settlements 5B, 5E
5.F. Other Land (2)
5.F.1. Other Land remaining Other Land 5A
5.F.2. Land converted to Other Land 5B, 5E
5.G. Other (please specify) (2)
Harvested Wood Products (2)
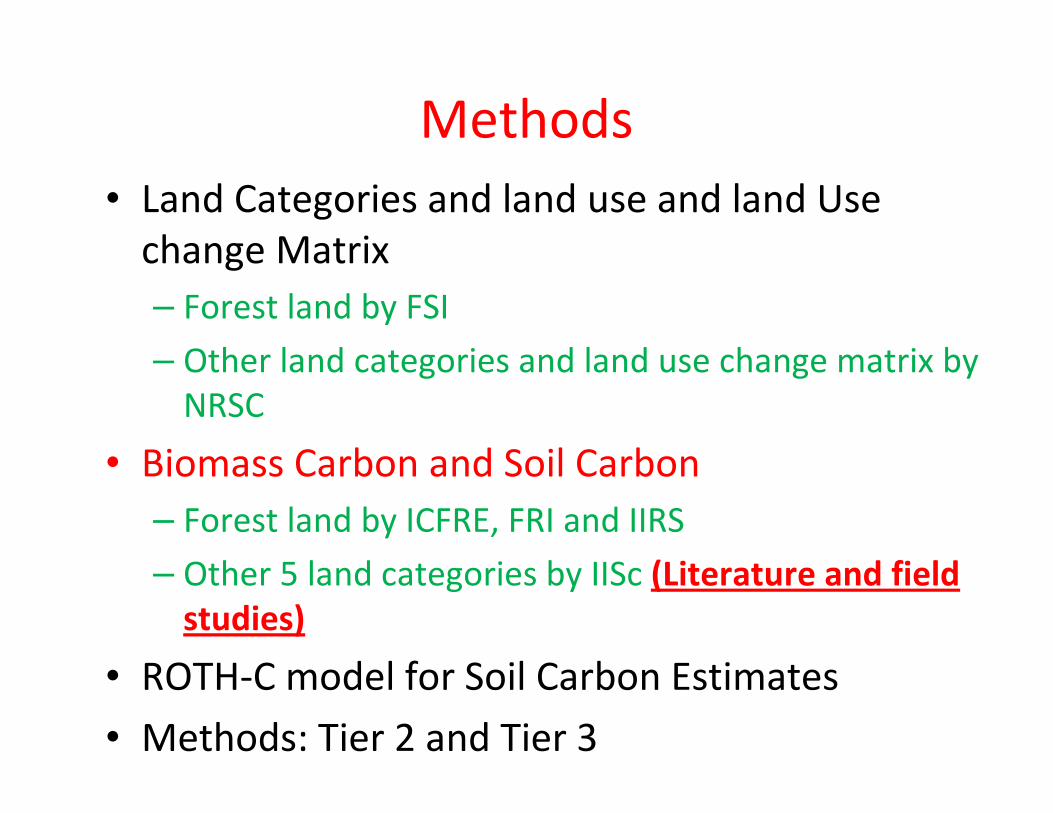
Methods
• Land Categories and land use and land Use
change Matrix
– Forest land by FSI
– Other land categories and land use change matrix by
NRSC
• Biomass Carbon and Soil Carbon
– Forest land by ICFRE, FRI and IIRS
– Other 5 land categories by IISc (Literature and field
studies)
• ROTH-C model for Soil Carbon Estimates
• Methods: Tier 2 and Tier 3

Current Status
• Forest land – ICFRE and FSI will present the
results
• Other land categories (CL,FL,WT,ST,OL)
– Land Use data and Land Use change matrix under
preparation by NRSC
– Biomass and soil carbon data – Being collected by
IISc team from literature and field studies
• Inventory to be ready by early next year
• Very crude preliminary estimates presented
here
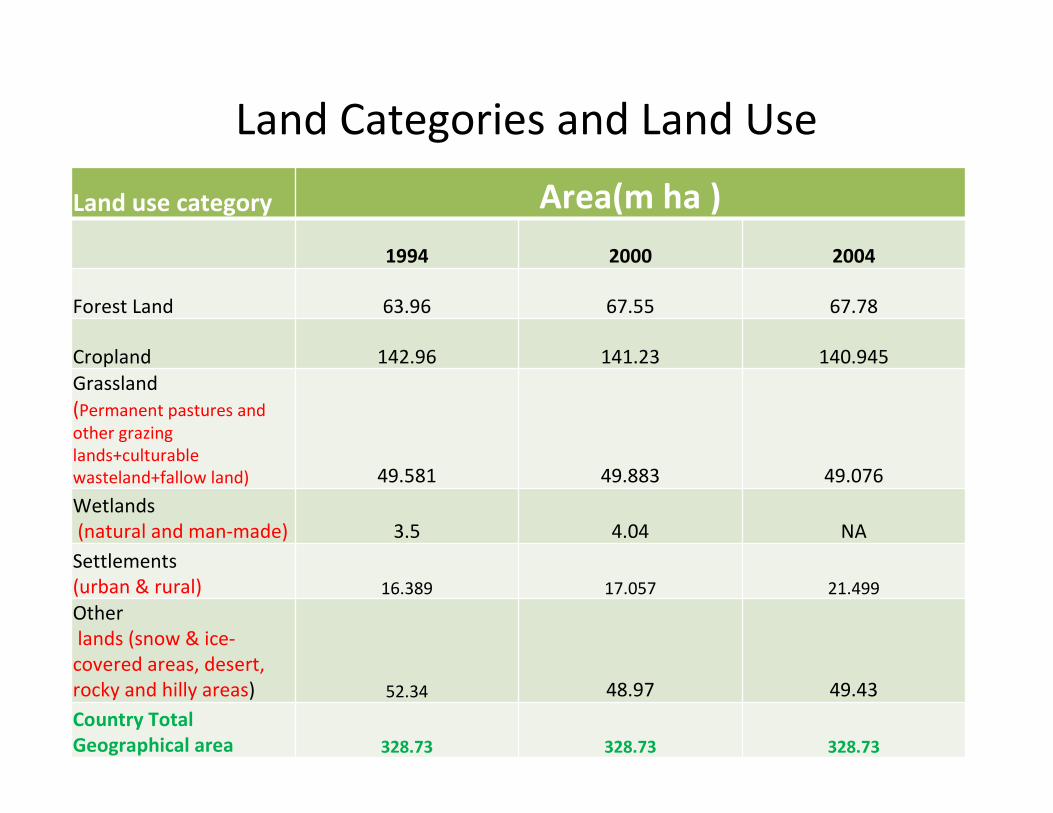
Land Categories and Land Use
Land use category Area(m ha )
1994 2000 2004
Forest Land 63.96 67.55 67.78
Cropland 142.96 141.23 140.945
Grassland
(Permanent pastures and
other grazing
lands+culturable
wasteland+fallow land) 49.581 49.883 49.076
Wetlands
(natural and man-made) 3.5 4.04 NA
Settlements
(urban & rural) 16.389 17.057 21.499
Other
lands (snow & ice-
covered areas, desert,
rocky and hilly areas) 52.34 48.97 49.43
Country Total
Geographical area 328.73 328.73 328.73

Average Change in Forest Area during 2004 in different states – Estimates based
on Area under forest in 2003 and 2005 (FSI data)
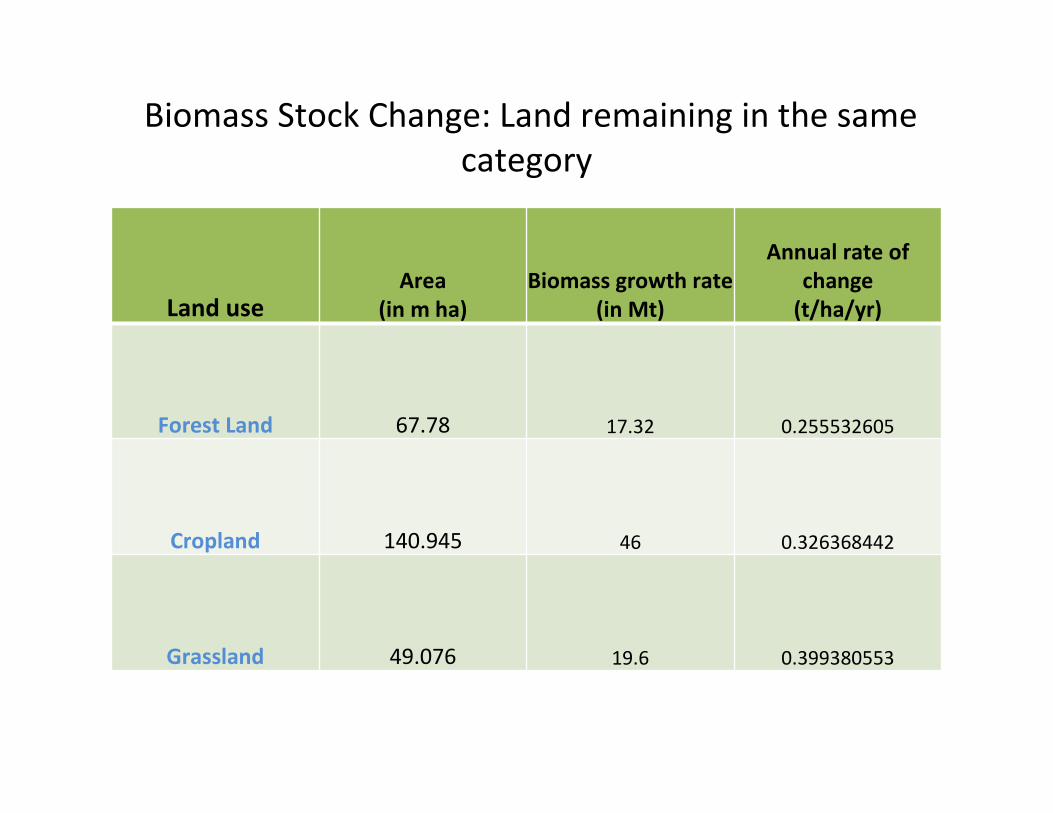
Biomass Stock Change: Land remaining in the same
category
Land useArea
(in m ha)
Biomass growth rate
(in Mt)
Annual rate of
change
(t/ha/yr)
Forest Land 67.78 17.32 0.255532605
Cropland 140.945 46 0.326368442
Grassland 49.076 19.6 0.399380553

SOC Stock change
Land useArea
(in m ha)SOC growth rate
(t/ha)
Annual rate of
change
(t/ha/yr)
Forest Land 67.78 22.805 0.34
Cropland 140.945 26.06
Grassland 49.076 181.87 0.18
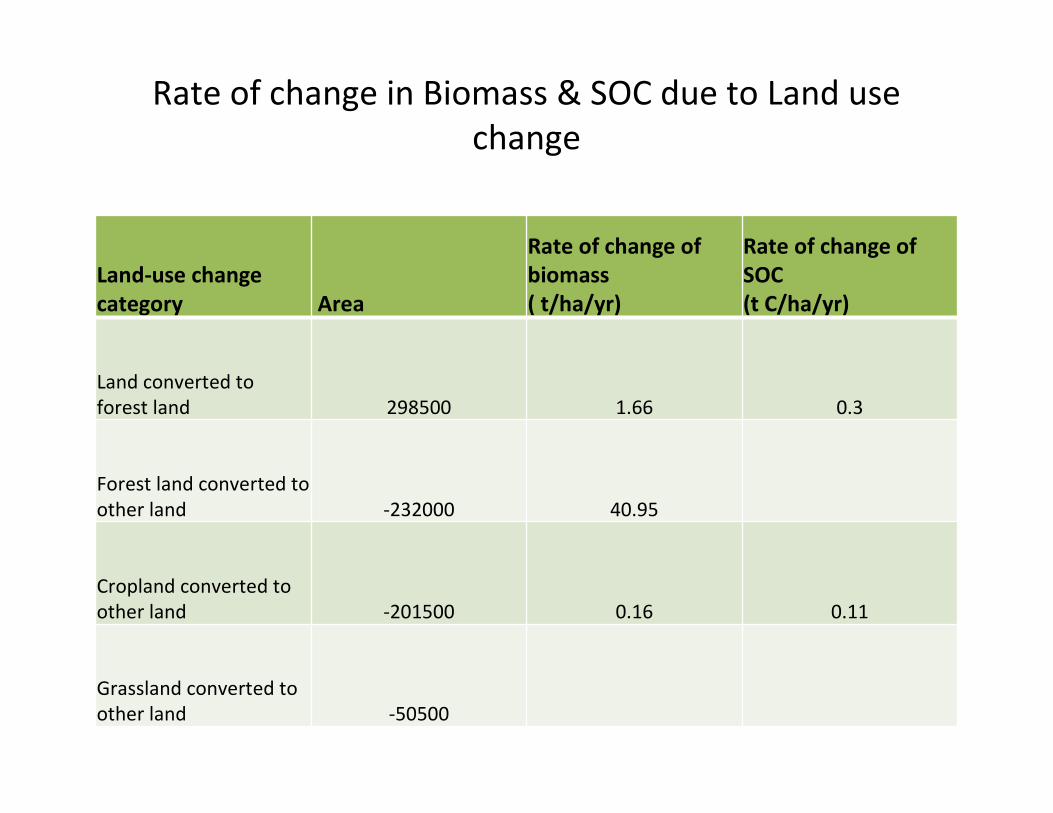
Rate of change in Biomass & SOC due to Land use
change
Land-use change
category Area
Rate of change of
biomass
( t/ha/yr)
Rate of change of
SOC
(t C/ha/yr)
Land converted to
forest land 298500 1.66 0.3
Forest land converted to
other land -232000 40.95
Cropland converted to
other land -201500 0.16 0.11
Grassland converted to
other land -50500

GHG emissions/removals from LULUCF sectorLand-use
category
Land-use change
category
Carbon emissions/removals
(MtC)Biomass SOC
Forest land Forest land remaining forest land 16.94 20.33
Land converted to forest land 0.49 0.09
Forest land converted to other land -9.5 IC
Cropland Cropland remaining cropland 22.55 15.50
Land converted to cropland - -
Cropland converted to other land IC -0.02
Grassland Grassland remaining grassland 9.81 37.78
Land converted to grassland - -
Wetland Wetland remaining wetland IC IC
Land converted to wetland IC IC
Settlements Settlements remaining Settlements IC IC
Land converted to Settlements IC IC
Other lands Other lands remaining Other lands IC IC
Land converted to Other lands IC IC
Total Net emissions and removal 40.30 73.69

Plan of work
Work Deadline
Field studies for biomass and soil carbon Oct-Nov
Laboratory studies for soil carbon Oct-Nov
Synthesis of Inventory Report Dec 2009
Peer review Jan-Feb 2010
Workshop March 2010