clustering in machine learning - cad.zju.edu.cn machine learning - introduction •it is a...
TRANSCRIPT

Clustering in Machine
Learning
By: Ibrar Hussain
Student ID: 11021083

Presentation – An Overview
• Introduction
• Definition
• Types of Learning
• Clustering in Machine Learning
• K-means Clustering
• Example of k-means Clustering
• References

Machine Learning - Introduction
• It is a scientific discipline concerned with the designand development of Algorithms that allowcomputers to evolve behaviors based on empiricaldata, such as from sensor data or databases.
• A learner can take advantage of examples (data) tocapture characteristics of interest of their unknownunderlying probability distribution. Data can beseen as examples that illustrate relations betweenobserved variables.

Machine Learning - Definition
• A major focus of machine learning research is toautomatically learn to recognize complexpatterns and make intelligent decisions based ondata.
• “The ability of a program to learn fromexperience — that is, to modify its execution onthe basis of newly acquired information.”

Major Types of Learning
• Unsupervised Learning:In machine learning, unsupervised learning is a class of problems in which one seeks to determine how the data are organized. It is distinguished from supervised learning (and reinforcement learning) in that the learner is given only unlabeled examples.
• Supervised Learning:A machine learning technique whereby a system uses a set of training examples to learn how to correctly perform a task

Clustering in Machine Learning
• Clustering: is the assignment of a set of observations into subsets (called clusters) so that observations in the same cluster are similar in some sense. Clustering is a method of unsupervised learning, and a common technique for statistical data analysis used in many fields.

K-means Clustering
• K-means clustering is an algorithm to classify or to group your objects based on attributes/features into K number of group. K is positive integer number.
• The grouping is done by minimizing the sum of squares of distances between data and the corresponding cluster centroid. Thus the purpose of K-mean clustering is to classify the data.

K-means Clustering - Example
Objects Attribute 1 (X):weight index
Attribute 2 (Y): pH
Medicine A 1 1
Medicine B 2 1
Medicine C 4 3
Medicine D 5 4
We also know before hand that these objects belong to two groups of medicine (cluster 1 and cluster 2). The problem now is to determine which medicines belong to cluster 1 and which medicines belong to the other cluster.

K-means Clustering - Example
• The basic step of k-means clustering is simple. In the beginning we determine number of cluster K and we assume the centroid or center of these clusters. We can take any random objects as the initial centroids or the first K objects in sequence can also serve as the initial centroids.
• Then the K means algorithm will do the three steps below until convergence

Example - Continued
Step 1. Begin with a decision on the value of k = number of clusters.
Step 2. Put any initial partition that classifies the data into k clusters. You may assign the training samples randomly, or systematically as the following:
1) Take the first k training sample as single-element clusters.
2) Assign each of the remaining (N-k) training sample to the cluster with the nearest centroid. After each assignment, recomputed the centroid of the gaining cluster.

Step 3 . Take each sample in sequence and compute its distance from the centroid of each of the clusters. If a sample is not currently in the cluster with the closest centroid, switch this sample to that cluster and update the centroid of the cluster gaining the new sample and the cluster losing the sample.
Step 4 . Repeat step 3 until convergence is achieved, that is until a pass through the training sample causes no new assignments.
Example - Continued

• If the number of data is less than the number of cluster then we assign each data as the centroid of the cluster. Each centroid will have a cluster number.
• If the number of data is bigger than the number of cluster, for each data, we calculate the distance to all centroid and get the minimum distance. This data is said belong to the cluster that has minimum distance from this data.
Example - Continued

Iterate until stable (= no object move group):
1) Determine the centroidcoordinate.
2) Determine the distance of each object to the centroids.
3) Group the object based on minimum distance.

Objects Attribute 1 (X):weight index
Attribute 2 (Y): pH
Medicine A 1 1
Medicine B 2 1
Medicine C 4 3
Medicine D 5 4
Suppose we have several objects (4 types of medicines) and each object have two attributes or features as shown in table below. Our goal is to group these objects into K=2 group of medicine based on the two features (pH and weight index).

• Each medicine represents one point with two attributes (X, Y) that we can represent it as coordinate in an attribute space as shown in the figure.

1. Initial value of centroids : Suppose we use medicine Aand medicine B as the first centroids. Let and denote the coordinate of the centroids, then
and

2. Objects-Centroids distance : Lets calculate the distance between cluster centroid to each object. Let us use Euclidean distance, then we have distance matrix at iteration 0 is

• Each column in the distance matrix symbolizes the object. The first row of the distance matrix corresponds to the distance of each object to the first centroid and the second row is the distance of each object to the second centroid.
• For example, distance from medicine C = (4, 3) to the first centroid is , and its
distance to the second centroid is

3. Objects clustering : Assign each object based on the minimum distance. Thus, medicine A is assigned to group 1, medicine B to group 2, medicine C to group 2 and medicine D to group 2. The element of Group matrix below is 1 if and only if the object is assigned to that group.

4. Iteration-1, determine centroids : Knowing the members of each group, now compute the new centroidof each group based on these new memberships. Group 1 only has one member.
Thus the centroid remains in . Group 2 now has three members, thus the centroid is the average coordinate among the three members:

5. Iteration-1, Objects-Centroidsdistances : The next step is to compute the distance of all objects to the new centroids. Similar to step 2, we have distance matrix at iteration 1 is

6. Iteration-1, Objects clustering: Similar to step 3, we assign each object based on the minimum distance. Based on the new distance matrix, we move the medicine B to Group 1 while all the other objects remain. The Group matrix is shown below

7. Iteration 2, determine centroids: Now we repeat step 4 to calculate the new centroids coordinate based on the clustering of previous iteration.
Group1 and group 2 both has two members, thus the new centroids are and

8. Iteration-2, Objects-Centroidsdistances: Repeat step 2 again, we have new distance matrix at iteration 2 as
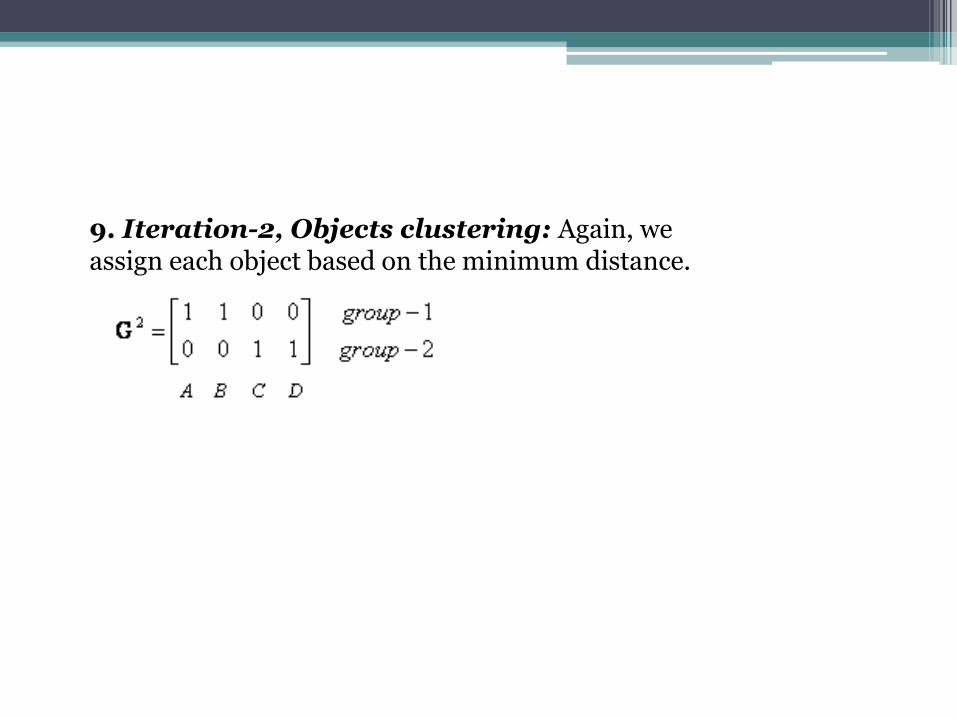
9. Iteration-2, Objects clustering: Again, we assign each object based on the minimum distance.

• We obtain result that . Comparing the grouping of last iteration and this iteration reveals that the objects does not move group anymore. Thus, the computation of the k-mean clustering has reached its stability and no more iteration is needed. We get the final grouping as the results

Final Grouping – As a Result
Objects Attribute 1 (X):weight
index
Attribute 2 (Y): pH
Group (Result)
Medicine A 1 1 1
Medicine B 2 1 1
Medicine C 4 3 2
Medicine D 5 4 2

References:
• MacQueen, J. B. (1967). Some Methods for classification and Analysis of Multivariate Observations, Proceedings of 5th Berkeley Symposium on Mathematical Statistics and Probability, Berkeley, University of California Press, 1:281-297.
• Bezdek, James C. (1981). Pattern Recognition with Fuzzy Objective Function Algorithms. ISBN 0306406.
• Finch, H. (2005). Comparison of distance measures in cluster analysis with dichotomous data. Journal of Data Science, 3, 85-100
• Huberty, C. J., Jordan, E. M., & Brandt, W. C. (2005). Cluster analysis in higher education research. In J. C. Smart (Ed.), Higher Education: Handbook of Theory and Research (Vol. 20, pp. 437-457). Great Britain: Springer.
• Hattie (2002). Schools Like Mine: Cluster Analysis of New Zealand Schools. Technical Report 14, Project asTTle. University of Auckland.
• Cornish, (2007). Cluster Analysis. Mathematics Learning Support Chapter 3.1.
• Ines Färber, Stephan Günnemann, Hans-Peter Kriegel, Peer Kröger, Emmanuel Müller, Erich Schubert, Thomas Seidl, Arthur Zimek (2010).”On Using Class-Labels in Evaluation of Clusterings”. In Xiaoli Z. Fern, Ian Davidson, Jennifer Dy. MultiClust: Discovering, Summarizing, and Using Multiple Clusterings. ACM SIGKDD.
