cloud-based architecture for web applications with load forecasting mechanism: a use case on the...
TRANSCRIPT

J SupercomputDOI 10.1007/s11227-014-1125-x
Cloud-based architecture for web applications with loadforecasting mechanism: a use case on the e-learningservices of a distant university
Salvador Ros · Agustín C. Caminero ·Roberto Hernández · Antonio Robles-Gómez ·Llanos Tobarra
© Springer Science+Business Media New York 2014
Abstract In cloud systems, a clear necessity emerges related to the use of efficient andscalable computing resources. For this, accurate predictions on the load of computingresources are a key. Thanks to these accurate predictions, reduced power consump-tion and enhanced revenue of the system can be achieved, since resources can beready when users need them and shutdown when they are no longer needed. Thiswork presents an architecture to manage web applications based on cloud computing,which combines both local and public cloud resources. This work also presents thealgorithms needed to efficiently manage such architecture. Among them, a load fore-casting algorithm has been developed based on Exponential Smoothing. An use caseof the e-learning services of our University presenting the behaviour of our architec-ture has been evaluated through a series of simulations. Among the most remarkableresults, power consumption is reduced by 32 % at the cost of 367.31 US$ a monthcompared with the current architecture.
Keywords Cloud computing · e-Learning · Load forecasting · Provision ofresources · Power consumption · System evaluation
S. Ros · A. C. Caminero (B) · R. Hernández · A. Robles-Gómez · L. TobarraDpto. de Sistemas de Comunicación y Control,Universidad Nacional de Educación a Distancia, Madrid, Spaine-mail: [email protected]
S. Rose-mail: [email protected]
R. Hernándeze-mail: [email protected]
A. Robles-Gómeze-mail: [email protected]
L. Tobarrae-mail: [email protected]
123

S. Ros et al.
1 Introduction
Several definitions exist for cloud computing. Among others, Buyya et al. [10] definea cloud as a type of parallel and distributed system consisting of a collection of inter-connected and virtualized computers that are dynamically provisioned and presentedas one or more unified computing resource(s) based on service-level agreements estab-lished through negotiation between the service provider and consumers.
Cloud computing provides many benefits, among others [29,30], lower cost of own-ership; more efficient and effective use of technical staff; cloud computing saves time,money and shortens production cycle; allows Information Technology (IT) to shiftfocus, no longer having to worry about constant server updates and other computingissues in the case of using Software as a Service (SaaS) or Platform as a Service (PaaS);organizations can store more data than on private computer systems; cloud computingoffers much more flexibility than past computing methods.
Several key points arise from the afore-mentioned definition, among the main onesis the dynamic provision of computers. This point is the subject of interest of thiswork, since the dynamic provision of computers for a given service (in our case, thee-learning services of our University) can lead to a number of benefits, among othersreduced power consumption, better utilization of resources, and improved revenue ofthe system.
But cloud computing, or more precisely, the use of public cloud providers, alsohas disadvantages [40,59]. Among others, security and privacy issues related to thefact that applications running in a public cloud provider are using your data; possi-ble downtime, meaning that your business depends on the reliability of your cloudprovider; inflexibility, related to the fact that several public cloud providers may havetheir proprietary formats; and costs, which means that for a continuous use, a built-infacility will safe more money than the use of a public cloud provider. With regard tosecurity, undoubtedly the most important of the afore-mentioned drawbacks, it is ahot research topic at the moment [8,16,28,49,60], and no standard solution has beenfound.
Concerning inflexibility, this is another important issue that has also been the focusof the research community [43]. A number of best practices have been recently pre-sented [14,15], and although there are standards for some important points, such as thevirtual machine (VM) format [20], a fully inter-operable cloud computing platformis yet to come. Among the features, it should include we can find [57] the ability tomove a live compute workload without losing client connections which incorporateone or more VMs, network policy, storage policy, and additional metadata arounddependencies, automation policies, etc.
Regarding downtime, which is related to inflexibility, it could be tackled usingdifferent providers, so that when one of them fails you can just move your VMs toanother provider, but this is only possible if the issues related to flexibility are solved.Finally, regarding costs, the use of public cloud providers is of interest to handle largeloads that are in excess to the average load an IT infrastructure will have to handle.This is the case of the e-learning platform object of this work, and average loads arehandled by local facilities, which are scaled up and down to fit it to the incomingload.
123

Cloud-based architecture for web applications
An important point to keep in mind is the power consumption of the computers [6].According to [33], datacenters now drive more in carbon emissions than both Argentinaand the Netherlands. Thus, cloud infrastructures should be managed trying to reducethe power consumption of the computers, along with efficient utilization of machines.As determined by [9,23], methods for load forecasting are needed to provide moreefficient use of resources. Exponential Smoothing (ES) [32] is a prediction methodthat creates predictions for future values of time series in which past observations aregiven lower weights as they get lower.
The main contributions of this paper are the following. Authors have developed(1) an architecture to manage the infrastructures for web applications based on cloudcomputing; (2) a set of algorithms to efficiently manage such architecture; (3) an usecase showing the e-learning services of our University (UNED, Universidad Nacionalde Educación a Distancia [56], the largest distant University in Spain); and (4) asystem evaluation which shows the suitability of the afore-mentioned contributions,along with the gain we are going to achieve when this architecture is fully deployedin our University. For the second contribution, authors have developed algorithms toperform forecasts of the load of the machines based on ES, and to dynamically performprovision of resources based on load forecasts.
Authors will focus on the UNED e-learning infrastructures, which is used as thebasis for the explanation of the contributions of this work. This is because, as a totallydistant university, it relies on its technological facilities to deal with students, keeptrack of them, and provide them with the access to lecturers and academic resources.Even more, due to its large size (UNED has more than 220,000 students, 1,500 lectur-ers, and 2,000 administrative staff), the need to efficiently manage its technologicalinfrastructures becomes more apparent.
Considering this, this paper is structured as follows: Section 2 explains theinfrastructures for a sample web application, these being the current technologicalinfrastructures of UNED. Section 3 details the cloud-based architecture for web appli-cations developed for this work, focusing on the UNED technological infrastructures.Section 4 presents the experiments conducted to show the usefulness of our work,including experiments showing the suitability of the algorithms presented here andthe gain that the presented architecture will produce when it is in production. Section 5provides related work of cloud infrastructures for web applications. Finally, Sect. 6concludes the paper and presents guidelines for future work.
2 Sample infrastructures for web applications
Prior to explaining our developments for cloud-based infrastructures for web appli-cations, which are intended to provide such application along with fault-tolerance,scalability, and reduced power consumption, this section presents details of the techno-logical infrastructures of a sample web application. For this, we focus on the e-learningservices of our University.
UNED is the largest university in Spain in terms of number of students (more than200,000) and number of lecturers (more than 1,500). UNED employs around 6,900local tutors, who are spread over 61 associated centers all over Spain. Furthermore,
123

S. Ros et al.
UNED also provides university training to more than 2,100 students in more than11 countries. UNED is a totally distant university, so interactions between studentsand university are by means of the technological infrastructures of the university, thatis, students download material and upload essays and other works through the website, read and send emails, and read and post messages in the forums. With regard toexaminations, they take place in February, June and September–as many Universitiesin Spain. Students take exams in person in the associated centers, where professorsfrom the central offices are moved for the examinations period.
UNED has developed its own learning management system (LMS) to handle theinteractions between the participants in the learning/teaching process. This tool iscalled aLF [45], and it is based on dotLRN [24]. aLF provides all the necessaryservices needed to perform the teaching tasks (e.g. communication tools such as web-conferences, forums or email; grading tools, …). It can be seen that aLF is the key tothe proper functionality of the university, since all the interactions between studentsand the university staff are conducted through it. If aLF does not perform smooth-ingly, this would seriously affect the service received by students and staff, makingthe learning/teaching process more complicated—or even impossible.
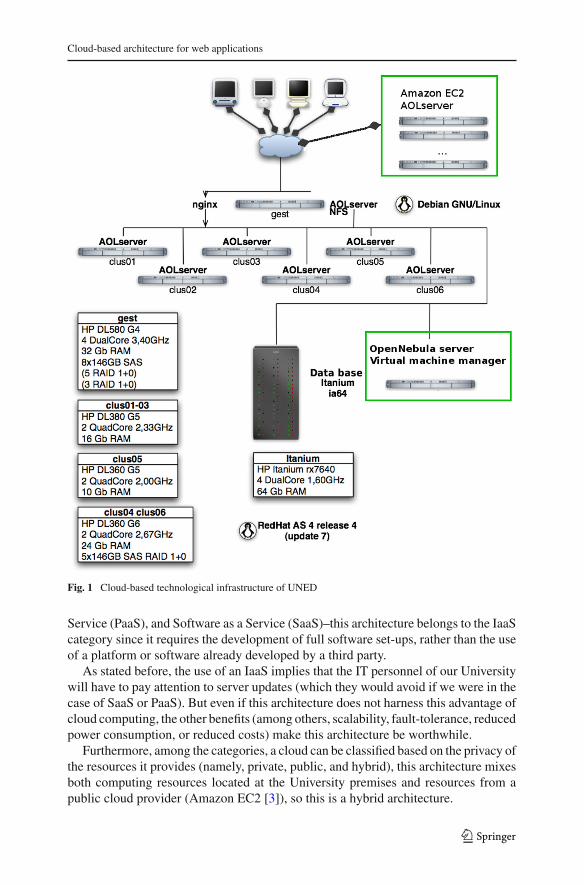
Figure 1 presents the technological infrastructure of UNED, including software andhardware features of the machines and the interconnection network. The extensionsincluded for the development of the cloud-based infrastructure are inside a green box,and are explained later. The basic architecture is made of one management machine(gest), one data base server, and six machines (clus01-06), all of them connected by a1 Gbps interconnection network.
Before the extensions are implemented, the infrastructure of UNED works as fol-lows. Users connect to the infrastructure through the Internet, and the only requirementfor them is a web browser. Then, connections are managed by the gest machine. Thismachine performs management tasks, such as monitoring of the connections and othermachines. The monitoring tool used is Nagios [39]. Gest receives all the connectionrequests and forwards them to one of the clus machines. This forwarding is performedusing a hash function, based on the IP address of the requester.
Each of the clus machines has a Nginx [42] web server (entrusted with the staticcontents) and either a AOL server [5] or a OpenACS [44] application server servingthe LMS. All the machines are connected to the data base server running Oracle 10 g.Besides, the data base server stores a content repository (CR) that is shared amongmachines by means of network file system (NFS).
All the software is installed directly on the operating system (OS) of the machines(the Linux OS mentioned in the figure)—no virtualization is performed at all. Formore details see [45]. Next, the extensions introduced to take advantage of cloudtechnologies are detailed.
3 Cloud-based infrastructure for web applications: a use case on e-learning
With this in mind, UNED has designed an architecture that relies on cloud principlesas its base design. Among the different categories, a cloud can be classified basedon the services it provides—namely, Infrastructure as a Service (IaaS), Platform as a
123
Cloud-based architecture for web applications
Fig. 1 Cloud-based technological infrastructure of UNED
Service (PaaS), and Software as a Service (SaaS)–this architecture belongs to the IaaScategory since it requires the development of full software set-ups, rather than the useof a platform or software already developed by a third party.
As stated before, the use of an IaaS implies that the IT personnel of our Universitywill have to pay attention to server updates (which they would avoid if we were in thecase of SaaS or PaaS). But even if this architecture does not harness this advantage ofcloud computing, the other benefits (among others, scalability, fault-tolerance, reducedpower consumption, or reduced costs) make this architecture be worthwhile.
Furthermore, among the categories, a cloud can be classified based on the privacy ofthe resources it provides (namely, private, public, and hybrid), this architecture mixesboth computing resources located at the University premises and resources from apublic cloud provider (Amazon EC2 [3]), so this is a hybrid architecture.
123
S. Ros et al.
To develop a cloud-based technological infrastructure, a number of changes havebeen made to the previous architecture. Some of them are depicted in green boxesin Fig. 1. First of all, Nginx servers are executed on VM, rather than directly on thephysical clus machines. This virtualization is performed using VMWare ESXi [34].Also, one machine has been added to the infrastructure explained above, namely thevirtual machine manager (VMM). This machine runs OpenNebula [41] and performsthe management (monitoring, deployment, migration, etc.) of the VMs.
The OpenNebula server acts as a classical cluster front-end and has several modules;the main ones are (1) the OpenNebula daemon (ONED), which manages the clusternodes, virtual networks, VMs and users; (2) the scheduler module, entrusted withdeciding in which physical machine a VM will be instantiated; (3) drivers, which areused for several tasks such as to gather information from the cluster nodes (informationdrivers), to transfer, clone, remove and create VM images (transfer drivers), or tocreate, control and monitor VMs on the cluster nodes (virtualization drivers); and(4) a repository of VM images that works with multiple back-ends (such as LVM oriSCSI).
These extensions work as follows. The OpenNebula server performs monitoring ofthe load of the clus machines. Every hour, the OpenNebula server checks the predic-tions on the load for each clus machine for the next hour, and turns-off those machineswhose load is under a threshold, thus saving power.
In the case that predictions show that all the clus machines will be overloadednext hour, the OpenNebula server instantiates VMs using an external cloud provider,such as Amazon EC2 [3]. In this way, in the case of a peak load, the technologicalinfrastructure of UNED is made of (1) VMs running locally in the clus machines,and (2) VMs running externally in Amazon EC2. Once the VMs are instantiated, thegest machine balances the load among all of them. When the peak load dismisses, theOpenNebula server switches off the VMs running in Amazon EC2, migrating theirload to the local machines.
To create a fault-tolerant scalable architecture, several points must be improved,namely the database, the gest machine and the VMM. Regarding the database, asharding architecture [50] can be implemented, in which the database can be split intoa number of databases. Each database would hold a subset of the data (the shards),where shards can be replicated to provide fault-tolerance and scalability. Concerningthe gest machine and the VMM, other machines could be set to back them in the casethey fail.
This infrastructure has fault-tolerance, high availability and elasticity provided bythe dynamic deployment of new virtual servers added to the load balancer. It is avirtual infrastructure that can be resized on demand thanks to OpenNebula, whichsimplifies the management of two different virtualization technologies (VMWare ESXiand Amazon EC2).
3.1 Load forecasting algorithms
Although there are a number of parameters that may be of interest to decide on theutilization of resources, such as memory usage or link bandwidth, in this work authors
123
Cloud-based architecture for web applications
consider the CPU load as the key parameter to decide on the utilization of resources.Recall that the application we are going to run in our system is a web application, theLMS of our University. According to [6], the parameter to decide on the levels of useof a web application is the CPU load, and other scientific proposals such as [27] andsome commercial approaches [48] agree. The study of other parameters to decide onthe utilization of resources and the creation of metrics consisting on a combination ofseveral parameters (for instance, as [11]) is among the future work.
To calculate predictions on the load of machines, a prediction technique calledExponential Smoothing is used. Exponential Smoothing (ES) [32] is a simple predictionmethod based on historical and current data that work very good in practice [21]. ES isa procedure for continually revising a forecast in the light of more recent experience.In this way, ES assigns exponentially decreasing weights as the observations get older.In this point, recent observations are given relatively more weight in forecasting thanthe older ones.
A significant number of papers have been devoted to prediction methods, such asautoregressive models [19,46], linear regression [37,62], neural networks [26] or hid-den Markov models [25]. We have chosen ES because it has been used for the samepurposes we need to use it in this work, that is, to predict the CPU load in paral-lel distributed systems in [54,55]. In addition, implementations of ES are publicallyavailable for download.
There are several types of ES’s. In this work, a triple exponential smoothing is used,which is also named Holt-Winters [32]. With this kind of ES, the trend and seasonalityof data are taken into account for the predictions. Trend refers to the long-term patternsof data (e.g. sales of a toy may show a linear upward trend if they increase by 1 millioneuros a year), whilst seasonality is defined to be the tendency of time-series data toexhibit behavior that repeats itself every L periods (e.g. sales of a toy may increasenear Christmas and decrease afterwards, every year). The reason for choosing an ESwhich takes into account the trend and seasonality is because our data may presentboth behaviors. For example, in 1 day log of CPU load, there is a seasonality of havingless CPU load percentage at night hours. There is also a 4-month seasonality, sincethe CPU load increases as exams get closer (e.g. students access the online coursesmore frequently) and decreases afterwards. Regarding trend, the number of studentsin our University increases every year by several thousands.
The forecasting method used is presented in Eq. 1. At the end of a time period t ,and being xt the observed value of the time series at time t (in our case, the CPUusage), then ft+m is the forecasted value for m periods ahead, Tt is the trend of thetime series, Lt is the deseasonalized level, and St is the seasonal component.
ES =deadline∑
m=initT
ft+m =deadline∑
m=initT
(Lt + Tt ∗ (m + 1))St+m−L (1)
Lt = α ∗ xt
St−L+ (1 − α) ∗ (Lt−1 + Tt−1) (2)
Tt = β ∗ (Lt − Lt−1) + (1 − β) ∗ Tt−1 (3)
St = γ ∗ xt
Lt+ (1 − γ ) ∗ St−L (4)
123

S. Ros et al.
The deseasonalized level Lt is calculated following the Eq. 2. The trend of thetime series Tt is the smoothed difference between two successive estimations of thedeseasonalized level as Eq. 3 depicts. Finally, the seasonal component (St ) is calculatedusing the Eq. 4. This expression means only a combination of the most recentlyobserved seasonal factors given by the demand xt divided by the deseasonalized serieslevel estimate Lt and the previous best seasonal factor estimate for this time period.Thus, seasonality indicates how much this period typically deviates from the period(in our case 4 months) average. So, at least one full season of data is required for thecomputation of seasonality.
In the equations, α, β and γ are constants that must be estimated in such a waythat the mean square error is minimized. It is important to set a correct value for themto predict the behavior of the machines as accurately as possible. At least, a 8-monthlog must be used, divided into two 4-month data sets. Using the first of these two datasets, the R program tries to estimate these values for the period. These results are thencompared with the real status registered and the α, β and γ values are adjusted tominimize the mean square error.
Thanks to the presented load prediction technique, more efficient resource provi-sioning can be performed, which leads to better utilization of resources and lowerpower consumption. Details on the way how the dynamic provision of resources isperformed are presented in next section.
3.2 Resource provisioning
The load prediction technique is used to calculate predictions on the CPU load of themachines of our cluster. These predictions are used to provide the necessary resources,and the whole process is performed as Algorithm 1 depicts, which is explained next.First, the predictions on the CPU load of the machines are obtained (line 9). This iscalculated as presented in Algorithm 2. Then, those machines whose load is below athreshold are scheduled to be switched off (line 12). Although the switching off ofmachines is decided in this point, this decision will not be committed until the endof the algorithm (line 23) to avoid switching on/off multiple times the same machineduring the same interval.
After checking if there are underloaded machines, it must also be checked theopposite case, that is, the presence of overloaded machines. In this case, one of themachines that are off must be turned on (line 17). In the case that all the machinesare already running, but there are overloaded machines, VMs must be instantiated ina public cloud provider, such as Amazon EC2 [3] (line 19). Instances of the standardextra large instance type are created, since their features are more similar to the ones ofthe local cluster. Work on developing efficient strategies to choose different instancetypes that can yield better cost and performance is among the future work. This step isrepeated until the load forecasts of all the machines are under the threshold (line 15).Finally, all the decisions (e.g. switch on/off machines, instantiate VMs in AmazonEC2) are given in line 23.
The way how the monitoring of the machines is performed is presented in Algo-rithm 2. This is performed every monitoring interval, which is a customizable parame-
123

Cloud-based architecture for web applications
Algorithm 1 Resource provisioning.1: Let T hresbottom = the bottom threshold for the load of machines2: Let T hrestop = the top threshold for the load of machines
3: Let Order = the way how vmij are ordered (TopDown, BottomUp)
4: Let ProvisioningI nterval = the provisioning interval5: Input: T hresbottom , T hrestop , Order6: Output: ∅7: loop8: {Get the predictions of the CPU load of the machines}9: Get-CPU-LoadPredictions()10: {Schedule the switch off of underused machines}11: if (NumberUnderloadedMachines()>0) then12: TrySwitchOff(T hresbottom , T hrestop)13: end if14: {If there are overloaded machines, then switch on one of the off machines, or instantiate VMs in
Amazon in the case that all the local machines are already running}15: while (NumberOverloadedMachines()>0) do16: if (NumberOffMachines()>0) then17: ScheduleSwitchOnOneMachine()18: else19: ScheduleUseAmazon()20: end if21: end while22: {Perform migrations, switch machines on/off, instantiate VMs in Amazon}23: CommitDecisions()24: Wait(ProvisioningI nterval)25: end loop
Algorithm 2 Resource monitoring.1: Let MonI nterval = the monitoring interval2: Let count = the number of monitoring events3: Input: MonI nterval4: Output: ∅5: count := 06: loop7: Wait(MonI nterval)8: MonitorMachines()9: count++10: if (count == 60) then11: count := 012: CalculateAvgCPU-Load()13: PredictCPU-LoadUsingES()14: end if15: end loop
ter. To choose a reasonable value for the monitoring interval, a trade off between theoverhead generated by the monitoring and the accuracy on the information must bereached. The monitoring interval can be set to 1 min, as in [55]. Then, every hour, theaverage CPU load of each machine is calculated (line 12). We need the CPU load in a1 h basis since 1 h is the hiring period of machines in Amazon EC2. After that, a pre-diction for the CPU load of machines for the next hour is calculated using ExponentialSmoothing (line 13), as explained in Sect. 3.1.
123

S. Ros et al.
Algorithm 3 presents the way how underused machines are switched off. In thisalgorithm, machines that are clearly lower than the bottom threshold (their predictedload is lower than half the threshold) are switched off (line 9). Prior to switching offa machine, the VMs running on it must be powered off (line 13). When a machineis switched off, the system automatically balances the incoming requests over themachines that are running, so no further steps are needed to this end.
Algorithm 3 TrySwitchOff(T hresbottom): Switch off underused machines.1: Let i = the number of machines2: Let j = the number of virtual machines running at a machine i3: Let mx = a machine4: Let vmx = a virtual machine5: Let vmi
j = a virtual machine j running at a machine mi6: Let Predi = the predicted load for machine mi7: Input: T hresbottom8: Output: The list of machines that can be switched off, the updated load of the remaining machines9: for all mi such that Predi <(T hresbottom/2) do10: {Prior to switching mi off, ensure that there is at least one machine running to host the service}11: if (NumberRunningMachines()>1) then12: {Prior to switching mi off, power off the VMs running on it}13: Schedule(vmi
j , switch off)14: Schedule(mi , switch off)15: {Update the load predictions for all the machines}16: for all mi do17: Update(Predi )18: end for19: end if20: end for
Thresholds are used to set lower and upper limits on the CPU utilization of machines.These allow system administrators to decide about how loaded machines should be.Depending on each scenario, the load of the machines may be kept as high as possible,or maybe not—e.g. in the case that the machines in the local infrastructures have abottleneck in the network links, it could be good to share the load between the machinesrather than concentrating all the load on a few machines. So, thresholds are the waywe provide system administrators to balance load between machines.
The architecture presented in this paper has been designed taking into account thatthere is only one application running in our local infrastructures (e.g. the UniversityLMS). This architecture could be easily extended to support multiple applicationsrunning on the same local premises, and this would be done by (1) adapting the resourceprovisioning algorithm, and (2) developing an algorithm for the load balancing ofVMs over the physical machines our infrastructures are made of. These extensions aredetailed in the next section.
3.3 Extension to support multiple applications on the same local premises
This section details how the architecture presented in this paper can be extendedto support more than one application running on the same local premises. For this,
123

Cloud-based architecture for web applications
adapting the resource provisioning algorithm, and the ability to migrate VMs over thephysical machines our infrastructures are needed, along with the load balancing ofVMs over the physical machines. These algorithms are presented in this section.
Resource provisioning for multiple applications is presented in Algorithm 4. Thisalgorithm is essentially similar to Algorithm 1 but it includes the load balancing ofVMs over the physical machines.
Algorithm 4 Resource provisioning for multiple applications.1: Let T hresbottom = the bottom threshold for the load of machines2: Let T hrestop = the top threshold for the load of machines
3: Let Order = the way how vmij are ordered (TopDown, BottomUp)
4: Let ProvisioningI nterval = the provisioning interval5: Input: T hresbottom , T hrestop , Order6: Output: ∅7: loop8: {Get the predictions of the CPU load the machines}9: Get-CPU-LoadPredictions()10: {Balance load among available machines. This is, migrate VMs from the most loaded machine to
the least loaded.}11: BalanceLoad(T hresbottom , T hrestop , Order )12: {Schedule the switch off of underused machines}13: if (NumberUnderloadedMachines()>0) then14: TrySwitchOff(T hresbottom , T hrestop)15: end if16: {If there are overloaded machines, then switch on one of the off machines, or instantiate VMs in
Amazon in the case that all the local machines are already running}17: while (NumberOverloadedMachines()>0) do18: if (NumberOffMachines()>0) then19: ScheduleSwitchOnOneMachine()20: else21: ScheduleUseAmazon()22: end if23: BalanceLoad(T hresbottom , T hrestop , Order )24: end while25: {Perform migrations, switch machines on/off, instantiate VMs in Amazon}26: CommitDecisions()27: Wait(ProvisioningI nterval)28: end loop
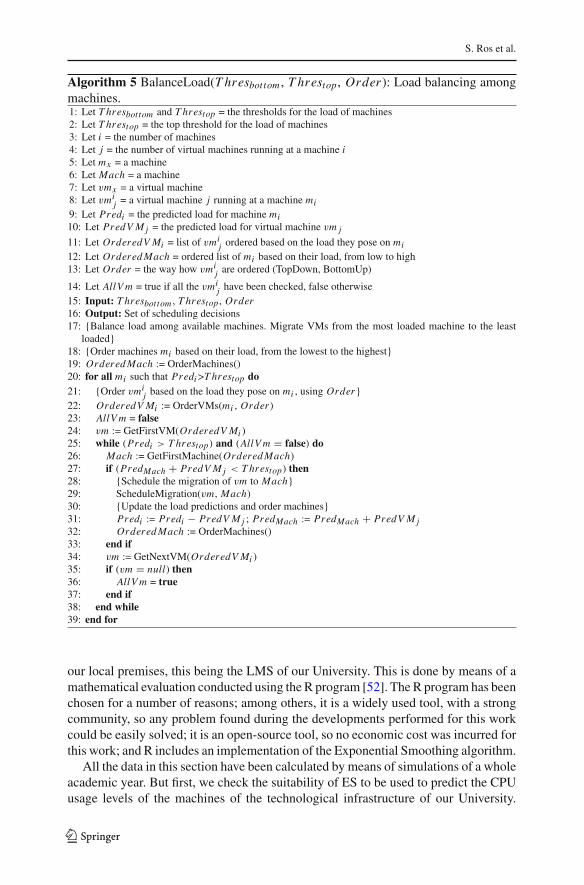
Algorithm 5 explains the way how the load balancing is performed. The goal keepsthe load of machines between the two thresholds. So, for machines whose predictedload is above the top threshold (line 25), the system tries the migration of the VMsrunning on them to other less loaded machines, but only if the destination machinedoes not become overloaded (line 27). If this is the case, the VM is scheduled tobe migrated to the chosen machine (line 29). After that, predictions on the load ofmachines must be updated (line 31).
4 Experimental results
In this section, we present results that illustrate the usefulness of our work. Here,we evaluate the cloud-based architecture to support a single application running on
123
S. Ros et al.
Algorithm 5 BalanceLoad(T hresbottom , T hrestop, Order ): Load balancing amongmachines.1: Let T hresbottom and T hrestop = the thresholds for the load of machines2: Let T hrestop = the top threshold for the load of machines3: Let i = the number of machines4: Let j = the number of virtual machines running at a machine i5: Let mx = a machine6: Let Mach = a machine7: Let vmx = a virtual machine8: Let vmi
j = a virtual machine j running at a machine mi9: Let Predi = the predicted load for machine mi10: Let PredV M j = the predicted load for virtual machine vm j
11: Let OrderedV Mi = list of vmij ordered based on the load they pose on mi
12: Let Ordered Mach = ordered list of mi based on their load, from low to high13: Let Order = the way how vmi
j are ordered (TopDown, BottomUp)
14: Let AllV m = true if all the vmij have been checked, false otherwise
15: Input: T hresbottom , T hrestop , Order16: Output: Set of scheduling decisions17: {Balance load among available machines. Migrate VMs from the most loaded machine to the least
loaded}18: {Order machines mi based on their load, from the lowest to the highest}19: Ordered Mach := OrderMachines()20: for all mi such that Predi >T hrestop do21: {Order vmi
j based on the load they pose on mi , using Order}22: OrderedV Mi := OrderVMs(mi , Order )23: AllV m = false24: vm := GetFirstVM(OrderedV Mi )25: while (Predi > T hrestop) and (AllV m = false) do26: Mach := GetFirstMachine(Ordered Mach)27: if (PredMach + PredV M j < T hrestop) then28: {Schedule the migration of vm to Mach}29: ScheduleMigration(vm, Mach)30: {Update the load predictions and order machines}31: Predi := Predi − PredV M j ; PredMach := PredMach + PredV M j32: Ordered Mach := OrderMachines()33: end if34: vm := GetNextVM(OrderedV Mi )35: if (vm = null) then36: AllV m = true37: end if38: end while39: end for
our local premises, this being the LMS of our University. This is done by means of amathematical evaluation conducted using the R program [52]. The R program has beenchosen for a number of reasons; among others, it is a widely used tool, with a strongcommunity, so any problem found during the developments performed for this workcould be easily solved; it is an open-source tool, so no economic cost was incurred forthis work; and R includes an implementation of the Exponential Smoothing algorithm.
All the data in this section have been calculated by means of simulations of a wholeacademic year. But first, we check the suitability of ES to be used to predict the CPUusage levels of the machines of the technological infrastructure of our University.
123
Cloud-based architecture for web applications
0
1000
2000
3000
4000
5000
6000
7000
End of Oct End of Nov
Num
ber
of c
oncu
rren
t ses
sion
s
Hours, from 13h of 10/Oct/2010, to 19h of 14/Dec/2010
October November December
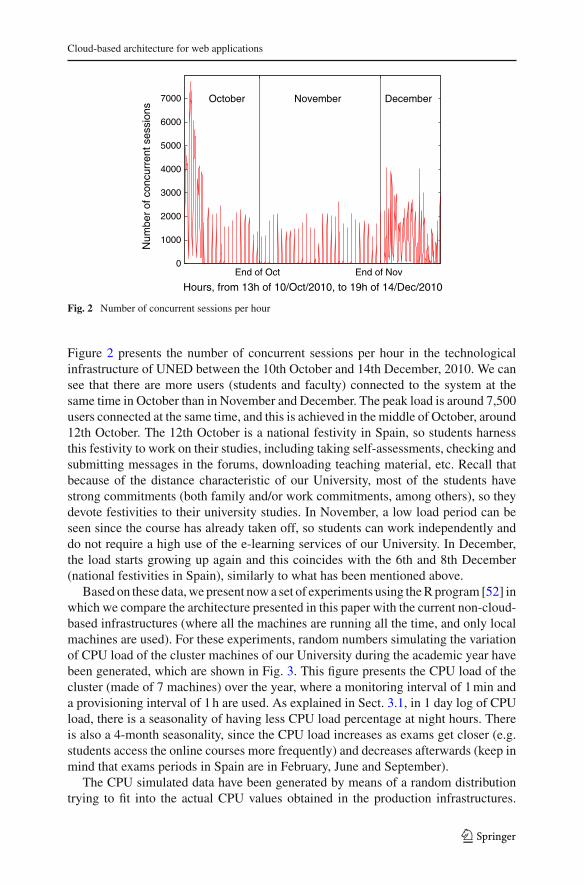
Fig. 2 Number of concurrent sessions per hour
Figure 2 presents the number of concurrent sessions per hour in the technologicalinfrastructure of UNED between the 10th October and 14th December, 2010. We cansee that there are more users (students and faculty) connected to the system at thesame time in October than in November and December. The peak load is around 7,500users connected at the same time, and this is achieved in the middle of October, around12th October. The 12th October is a national festivity in Spain, so students harnessthis festivity to work on their studies, including taking self-assessments, checking andsubmitting messages in the forums, downloading teaching material, etc. Recall thatbecause of the distance characteristic of our University, most of the students havestrong commitments (both family and/or work commitments, among others), so theydevote festivities to their university studies. In November, a low load period can beseen since the course has already taken off, so students can work independently anddo not require a high use of the e-learning services of our University. In December,the load starts growing up again and this coincides with the 6th and 8th December(national festivities in Spain), similarly to what has been mentioned above.
Based on these data, we present now a set of experiments using the R program [52] inwhich we compare the architecture presented in this paper with the current non-cloud-based infrastructures (where all the machines are running all the time, and only localmachines are used). For these experiments, random numbers simulating the variationof CPU load of the cluster machines of our University during the academic year havebeen generated, which are shown in Fig. 3. This figure presents the CPU load of thecluster (made of 7 machines) over the year, where a monitoring interval of 1 min anda provisioning interval of 1 h are used. As explained in Sect. 3.1, in 1 day log of CPUload, there is a seasonality of having less CPU load percentage at night hours. Thereis also a 4-month seasonality, since the CPU load increases as exams get closer (e.g.students access the online courses more frequently) and decreases afterwards (keep inmind that exams periods in Spain are in February, June and September).
The CPU simulated data have been generated by means of a random distributiontrying to fit into the actual CPU values obtained in the production infrastructures.
123

S. Ros et al.
% C
PU
usa
ge
020
4060
8010
0
TimeSept/Oct Nov/Dec Jan/Feb Mar/Apr May/Jun Jul/Aug
Fig. 3 Variation of the CPU load of the technological infrastructures of UNED over time
So, near to 100 % utilization was used for the periods near the exams (in February,June and September), and near to 0 % values were obtained in the mid terms andin summer (December, April, and August). We could not use actual historical databecause to perform this evaluation, data on the whole year should be needed. Dueto the University policy, publishing such information is not allowed, so we had tosimulate actual data. The only actual data we were allowed to publish are the numberof concurrent users, presented in Fig. 3, but these data only represent a 2-month period(from 10th October to 14th December).
Figures 2 and 3 show that in October there is one of the highest loads during theyear. The course is taking off, so the enrollment, setting up the virtual courses byfaculty, and downloads of the training material by students (among other initial tasks)take place. November is a low load period since the course has already taken off. InDecember, the load starts growing up again and this corresponds with two nationalfestivities in Spain. These tendencies can be seen in both Figs. 2 and 3, so Fig. 3can be considered as a reasonable model for the load variation of the technologicalinfrastructures of UNED over time.
Figure 4 presents a comparison between the CPU load (in black) and the predictionsusing ES (in red). It can be seen that predictions and actual values overlap each other,thus it can be concluded that ES is a suitable way of predicting the CPU load of themachines of the University cluster.
Next results are depicted in Fig. 5, which shows the number of machines (out ofthe seven machines, our cluster is made of) running during the course for differentthresholds. This only includes the local machines (our cluster of seven machines);no Amazon machine is used. The case of the current non-cloud-based infrastructures
123

Cloud-based architecture for web applications
% C
PU
usa
ge
020
4060
8010
0
Time
Sept/Oct Nov/Dec Jan/Feb Mar/Apr May/Jun Jul/Aug
Fig. 4 Variation of the CPU load of the technological infrastructures of UNED over time (in black), andpredictions using ES (in red)
Num
ber
of m
achi
nes
runn
ing
12
34
56
7
Thresholds: Red: 0 − 25% / Blue: 25 − 50% /
Green: 50 − 75% / Yellow: 75 − 100%
Sept/Oct Nov/Dec Jan/Feb Mar/Apr May/Jun Jul/Aug
Fig. 5 Number of machines running (using only local machines) for different thresholds
123

S. Ros et al.
Num
ber
of m
achi
nes
runn
ing
05
1015
2025
30
Thresholds: Red: 0 − 25% / Blue: 25 − 50% /
Sept/Oct Nov/Dec Jan/Feb Mar/Apr May/Jun Jul/Aug
Green: 50 − 75% / Yellow: 75 − 100%
Fig. 6 Number of machines running (including local and Amazon machines) for different thresholds
(where all the machines are running all the time, and only local machines are used) isnot shown since no variations would be depicted for this case. Recall from Algorithm 1that there are thresholds which represent a top and bottom limit for the CPU usageof the machines. The thresholds used are 0–25 25–50, 50–75, and 75–100 %, and thisfigure has been calculated using the ES predictions. It can be concluded that the higherthe thresholds, the lower is the number of machines running each time, and it fits intothe CPU load variations presented in Fig. 4. Thus, when the CPU load of the machinesis higher (in Sept/Oct, Jan/Feb, and May/Jun), there are more machines sharing thatload, and when the load is low, then machines are turned off so that the load is sharedbetween less machines. In this way, machines are running only when they are needed,thus saving power.
Figure 6 shows the number of machines running during a course, and this figureincludes Amazon machines. This means that when the local cluster is overloaded,machines in Amazon are hired, and the load is balanced over all of them. The typeof Amazon EC2 machine used is the standard extra large since this is the machinetype most similar to the local machines in the University cluster. Again, the case ofthe current non-cloud-based infrastructures is not shown, since no variations wouldbe depicted for this case. This figure shows that the lower the thresholds, the moremachines are needed—as for the previous figure. But this figure also shows that thesystem may need up to 29 machines when the 0–25 % thresholds are in place (theseven machines in our local cluster and 21 more machines from Amazon EC2). Thisis a large number of machines compared with the other thresholds—which need up to15 machines for the 25–50 % threshold. Also, the gap between the red line (thresholds
123
Cloud-based architecture for web applications
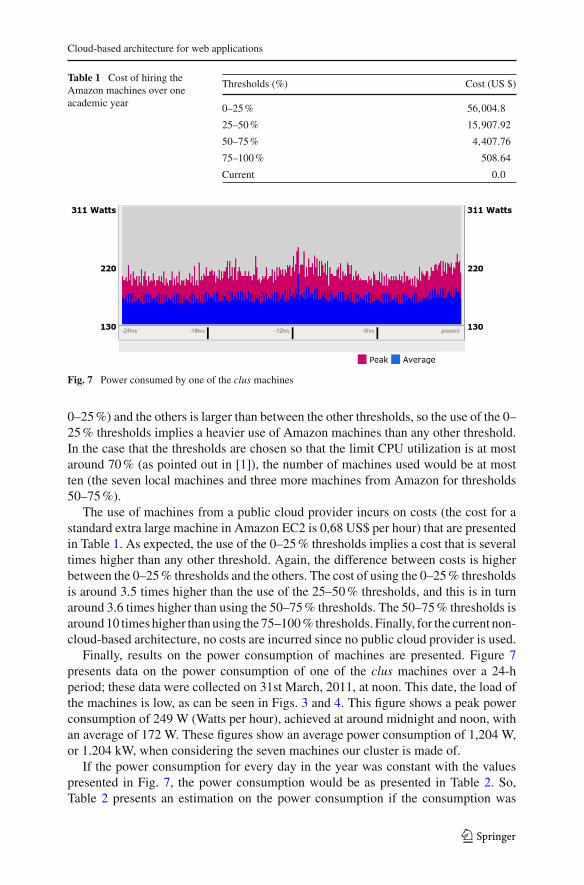
Table 1 Cost of hiring theAmazon machines over oneacademic year
Thresholds (%) Cost (US $)
0–25 % 56,004.8
25–50 % 15,907.92
50–75 % 4,407.76
75–100 % 508.64
Current 0.0
Fig. 7 Power consumed by one of the clus machines
0–25 %) and the others is larger than between the other thresholds, so the use of the 0–25 % thresholds implies a heavier use of Amazon machines than any other threshold.In the case that the thresholds are chosen so that the limit CPU utilization is at mostaround 70 % (as pointed out in [1]), the number of machines used would be at mostten (the seven local machines and three more machines from Amazon for thresholds50–75 %).
The use of machines from a public cloud provider incurs on costs (the cost for astandard extra large machine in Amazon EC2 is 0,68 US$ per hour) that are presentedin Table 1. As expected, the use of the 0–25 % thresholds implies a cost that is severaltimes higher than any other threshold. Again, the difference between costs is higherbetween the 0–25 % thresholds and the others. The cost of using the 0–25 % thresholdsis around 3.5 times higher than the use of the 25–50 % thresholds, and this is in turnaround 3.6 times higher than using the 50–75 % thresholds. The 50–75 % thresholds isaround 10 times higher than using the 75–100 % thresholds. Finally, for the current non-cloud-based architecture, no costs are incurred since no public cloud provider is used.
Finally, results on the power consumption of machines are presented. Figure 7presents data on the power consumption of one of the clus machines over a 24-hperiod; these data were collected on 31st March, 2011, at noon. This date, the load ofthe machines is low, as can be seen in Figs. 3 and 4. This figure shows a peak powerconsumption of 249 W (Watts per hour), achieved at around midnight and noon, withan average of 172 W. These figures show an average power consumption of 1,204 W,or 1.204 kW, when considering the seven machines our cluster is made of.
If the power consumption for every day in the year was constant with the valuespresented in Fig. 7, the power consumption would be as presented in Table 2. So,Table 2 presents an estimation on the power consumption if the consumption was
123
S. Ros et al.
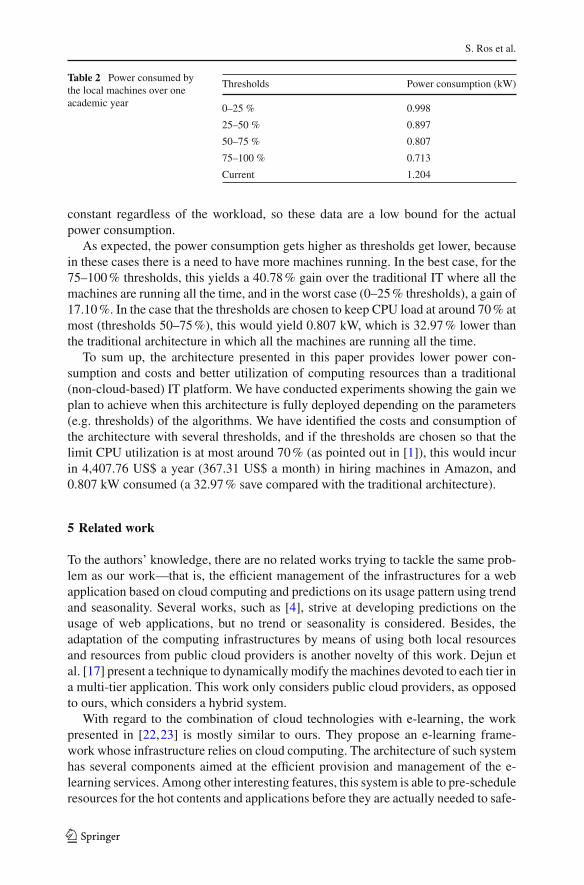
Table 2 Power consumed bythe local machines over oneacademic year
Thresholds Power consumption (kW)
0–25 % 0.998
25–50 % 0.897
50–75 % 0.807
75–100 % 0.713
Current 1.204
constant regardless of the workload, so these data are a low bound for the actualpower consumption.
As expected, the power consumption gets higher as thresholds get lower, becausein these cases there is a need to have more machines running. In the best case, for the75–100 % thresholds, this yields a 40.78 % gain over the traditional IT where all themachines are running all the time, and in the worst case (0–25 % thresholds), a gain of17.10 %. In the case that the thresholds are chosen to keep CPU load at around 70 % atmost (thresholds 50–75 %), this would yield 0.807 kW, which is 32.97 % lower thanthe traditional architecture in which all the machines are running all the time.
To sum up, the architecture presented in this paper provides lower power con-sumption and costs and better utilization of computing resources than a traditional(non-cloud-based) IT platform. We have conducted experiments showing the gain weplan to achieve when this architecture is fully deployed depending on the parameters(e.g. thresholds) of the algorithms. We have identified the costs and consumption ofthe architecture with several thresholds, and if the thresholds are chosen so that thelimit CPU utilization is at most around 70 % (as pointed out in [1]), this would incurin 4,407.76 US$ a year (367.31 US$ a month) in hiring machines in Amazon, and0.807 kW consumed (a 32.97 % save compared with the traditional architecture).
5 Related work
To the authors’ knowledge, there are no related works trying to tackle the same prob-lem as our work—that is, the efficient management of the infrastructures for a webapplication based on cloud computing and predictions on its usage pattern using trendand seasonality. Several works, such as [4], strive at developing predictions on theusage of web applications, but no trend or seasonality is considered. Besides, theadaptation of the computing infrastructures by means of using both local resourcesand resources from public cloud providers is another novelty of this work. Dejun etal. [17] present a technique to dynamically modify the machines devoted to each tier ina multi-tier application. This work only considers public cloud providers, as opposedto ours, which considers a hybrid system.
With regard to the combination of cloud technologies with e-learning, the workpresented in [22,23] is mostly similar to ours. They propose an e-learning frame-work whose infrastructure relies on cloud computing. The architecture of such systemhas several components aimed at the efficient provision and management of the e-learning services. Among other interesting features, this system is able to pre-scheduleresources for the hot contents and applications before they are actually needed to safe-
123
Cloud-based architecture for web applications
guard the performance in concurrent access. This is similar to the main aim of ourwork, but no details have been found with regard to how this is achieved—so no analy-sis of such system could be performed. Our work extends this by means of detailing thearchitecture designed at UNED, both hardware and software. Furthermore, our workincludes experiments showing the behavior of our architecture in terms of number ofmachines running, costs and power consumption.
Vouk et al. [58] focus on the reservation of VMs to students for a specific time frame.Sulistio et al. [51] present CloudIA, which provides on-demand creation and config-uring of VMs. This allows the instantiation of VMs according to students’ necessities,so that they can carry out practical exercises easily. But their aim is different fromours, we have designed a system for the management of the LMS of our University,and this requires predictions on the use of resources. Al-Zoube [2] presents a proposalfor personal and virtual learning. This proposal provides cloud services by meansof interacting with services that rely on the cloud, such as YouTube or GoogleDocs.Other works, such as [7,61], present applications deployed in cloud systems to allowstudents to carry out practical exercises on programming.
Our previous work, presented in [13] and extended in [12], presents the load fore-casting technique, and the algorithms for the resource provision and monitoring ofresources, along with a brief evaluation. The current work improves on them by meansof presenting the algorithms needed to switch on/off machines. Also, details on thehardware and software of the technological infrastructures of our University are pre-sented. Finally, this work presents extended experimental results showing the gain weplan to achieve when this architecture is fully deployed. To the authors’ knowledge,no architecture has been developed with the same aim and features as ours.
As mentioned above, Dong et al. [23] and Buyya et al. [9] agree that load forecastingmethods are needed to efficiently manage computing resources in a cloud environment.In [18], it is shown that although load exhibits complex properties, it is still consistentlypredictable from past behavior. In [31], an evaluation of various linear time seriesmodels for prediction of CPU loads in the future is presented. For this work, a techniquebased on historical data is used, since it has been demonstrated to provide better resultscompared to linear functions [53].
Kepart et al. [35] use dynamic voltage scaling to reduce the consumption of hostswithout virtualization and without switching machines off—as opposed to our work.According to [6], an idle server consumes approximately 70 % of the power consumedby the server at full speed, so the reduction of the voltage scaling only provides a 30 %gain in power consumption. If machines are turned off completely, a 100 % gain willbe achieved in power consumption.
Buyya et al. [6] present several techniques which divide the VM allocation in twodifferent problems, namely admission and placement of new requests, and optimizationof current allocations. But the techniques presented are not based on any prediction,but current data on utilization of VMs. Besides, several techniques are also presentedin [6] to minimize the power consumption in a datacenter. These techniques are aimedat allocating a set of independent VMs, which is a totally different case. For [6], VMexecutes independent applications, so if the application Appa is executed in V Ma ,V Ma cannot be switched off in any case to ensure the availability of Appa . In our case,our datacenter only hosts one application (the LMS of our University), so VMs can be
123

S. Ros et al.
switched off when needed, provided that there is at least one VM running at all timesto ensure the availability of the service. Considering this, the techniques presentedin [6] tackle a totally different problem than ours, so an analysis comparing our workwith theirs would be meaningless.
Reducing power consumption in server clusters has been the aim of several pub-lications, among others [38,47]. They combine CPU-clock throttling with switchingentire servers on/off as needed, based on the incoming workload. In the presence ofswitching costs, however, two crucial issues must be addressed [36]. First, turningservers off in a dynamic environment is risky in terms of Quality of Service (QoS),because if a server was powered off in anticipation of a lighter workload, and the work-load increases, this would negatively affect the QoS received by users. Also, excessivepower cycling of a server could reduce its reliability. Our work extends these worksby including the use of public cloud providers to host copies of our LMS, thus theload of the system can be shared between more machines to provide reasonable QoS.
6 Conclusions and future work
Cloud technologies allow the efficient use of technological infrastructures, which isof great interest for web applications. Thanks to clouds, scalable, fault-tolerant andgreen computing infrastructures can be developed. As several publications conclude,methods for load forecasting are needed to provide more efficient use of resources.
The main contributions of this paper are the design of (1) an architecture to managethe infrastructures for web applications based on cloud computing; (2) a set of algo-rithms to efficiently manage such architecture; (3) an use case showing the e-learningservices of UNED, the largest university in Spain; and (4) a system evaluation whichshows the suitability of the afore-mentioned contributions, along with the gain we aregoing to achieve when this architecture is fully deployed in UNED. For the secondcontribution, authors have developed algorithms to perform forecasts of the load ofthe machines based on Exponential Smoothing (ES) [32], and to dynamically performprovision of resources based on load forecasts.
We are currently working on implementing the architecture presented in this paperto manage the technological infrastructures of our University. This architecture willbe connected to the existing LMS of our University (the afore-mentioned aLF) to takefull control of our technological infrastructures. Furthermore, study on the differentusage that each part of our LMS is making (similarly to [17]) to split the LMS intodifferent parts which can have a different amount of resources (both local and publicresources) allocated is among our future work.
Also, the study of different techniques to dynamically choose instance types ofAmazon EC2 (rather than using the same instance type all the time) is among thefuture work. Furthermore, studying the influence of other parameters (apart fromthe CPU load) to predict the usage of the technological infrastructure of UNED andprovision resources efficiently is another guideline for future work. Among others,requests per second, links bandwidth, and available memory are considered. Whatis more, the creation of metrics consisting of a combination of several parameters(similarly to [11]) is also another interesting guideline for the future research.
123
Cloud-based architecture for web applications
Acknowledgments The authors would like to acknowledge the support of the following EuropeanUnion projects: RIPLECS (517836-LLP-1-2011-1-ES-ERASMUS-ESMO), PAC (517742-LLP-1-2011-1-BG-ERASMUS-ECUE), EMTM (2011-1-PL1-LEO05-19883), and MUREE (530332-TEMPUS-1-2012-1-JO-TEMPUS-JPCR). Furthermore, we also thank the Community of Madrid for the support of E-MadridNetwork of Excellence (S2009/TIC-1650).
References
1. Understanding linux cpu load–when should you be worried? http://blog.scoutapp.com/articles/2009/07/31/understanding-load-averages. Accessed 6 Feb 2014
2. Al-Zoube M (2009) E-learning on the cloud. Int Arab J e-Technol 1(2):58–643. Amazon Elastic Compute Cloud. http://aws.amazon.com/ec2/. Accesses 6 Feb 20144. Andreolini M, Casolari S (2006) Load prediction models in web-based systems. In: Proceedings of
the 1st ACM international conference on performance evaluation methodolgies and tools (VALUE-TOOLS), Pisa, Italy
5. AOL server (2014). http://www.aolserver.com/. Accessed 6 Feb 20146. Beloglazov A, Abawajy J, Buyya R (2012) Energy-aware resource allocation heuristics for efficient
management of data centers for cloud computing. Future Gener Comput Syst 28(5):755–7687. Bhattacharya P, Guo M, Tao L, Wu B, Qian K, Palmer K (2011) A cloud-based cyberlearning envi-
ronment for introductory computing programming education. In: Proceedings of the internationalconference on advanced learning technologies (ICALT). Athens, USA
8. Blandford R (2011) Information security in the cloud. Netw Secur 2011(4):15–179. Buyya R, Beloglazov A, Abawajy J (2010) Energy-efficient management of data center resources
for cloud computing: a vision, architectural elements, and open challenges. In: Proceedings of theinternational conference on parallel and distributed processing techniques and Applications (PDPTA),Las Vegas, USA
10. Buyya R, Yeo CS, Venugopal S, Broberg J, Brandic I (2009) Cloud computing and emerging ITplatforms: vision, hype, and reality for delivering computing as the 5th utility. Future Gener ComputSyst 25(6):599–616
11. Caminero A, Rana O, Caminero B, Carrión C (2011) Network-aware heuristics for inter-domain meta-scheduling in Grids. J Comput Syst Sci 77(2):262–281
12. Caminero AC, Ros S, Hernández R, Robles-Gómez A, Pastor R (2011) Cloud-based e-learninginfrastructures with load forecasting mechanism based on exponential smoothing: a use case. In:Proceedings of the frontiers in education conference (FIE), Rapid City, USA
13. Caminero AC, Ros S, Hernández R, Robles-Gómez A, Pastor R (2011) Load forecasting mechanismfor e-learning infrastructures using exponential smoothing. In: Proceedings of international conferenceon advanced learning technologies (ICALT), Athens, USA
14. Claybrook B (2014) Cloud interoperability: problems and best practices. http://www.computerworld.com/s/article/9217158/Cloud_interoperability_Problems_and_best_practices. Accessed 6 Feb 2014
15. Cloud Computing Interopreability Forum (2014). http://www.cloudforum.org/. Accessed 6 Feb16. Cloud Security Alliance: Enabling secure vm-vtpm migration in private clouds. Tech Rep (2011)17. Dejun J, Pierre G, Chi CH (2011) Resource provisioning of web applications in heterogeneous clouds.
In: Proceedings of the 2nd USENIX conference on web application development (WebApps). Portland,USA
18. Dinda PA (1999) The statistical properties of host load. Sci Progr 7(3–4):211–22919. Dinda PA, O’Hallaron DR (2000) Host load prediction using linear models. Clust Comput 3(4):265–
28020. Distributed Management Task Force: Open Virtualization Format Specification 1.0. Tech Rep DMTF
DSP0243 (2009)21. Dobber M, van der Mei R, Koole G (2007) A prediction method for job runtimes on shared processors:
survey, statistical analysis and new avenues. Perform Eval 64(7–8):755–78122. Dong B, Zheng Q, Qiao M, Shu J, Yang J (2009) Bluesky cloud framework: an E-learning framework
embracing cloud computing. In: Proceedings of the first international conference on cloud computing(CloudCom). Beijing, China
23. Dong B, Zheng Q, Yang J, Li H, Qiao M (2009) An E-learning ecosystem based on cloud comput-ing infrastructure. In: Proceedings of the international conference on advanced learning technologies(ICALT), Riga, Latvia
123

S. Ros et al.
24. dotLRN. http://www.dotlrn.org/. Accesses 6 Feb 201425. Eddy SR (1996) Hidden markov models. Curr Opin Struct Biol 6(3):361–36526. Frank RJ, Davey N, Hunt SP (2001) Time series prediction and neural networks. J Intell Robot Syst
31(1–3):91–10327. Goiri I, Juliá F, Fitó JO, Macías M, Guitart J (2012) Supporting cpu-based guarantees in cloud slas via
resource-level qos metrics. Future Gener Comput Syst 28(8):1295–1302. doi:10.1016/j.future.2011.11.004
28. Hamlen KW, Kantarcioglu M, Khan L, Thuraisingham BM (2010) Security issues for cloud computing.Int J Inform Secur Privacy 4(2):36–48
29. IBM Corporation: the benefits of cloud computing. Tech Rep (2009)30. IBM Corporation: cloud computing saves time, money and shortens production cycle. http://www-01.
ibm.com/software/success/cssdb.nsf/CS/ARBN-7QK2YV?OpenDocument&Site=corp&cty=en_us.Accessed 6 Feb 2014
31. Jin H, Shi X, Qiang W, Zou D (2005) An adaptive meta-scheduler for data-intensive applications. IntJ Grid Util Comput 1(1):32–37
32. Kalekar PS (2004) Time series forecasting using holt-winters exponential smoothing. Tech rep, KanwalRekhi School of Information Technology
33. Kaplan JM, Forest W, Kindler N (2008) Revolutionizing data center energy efficiency. Tech rep,MacKinsey
34. Kellogg T (2008) ESX guest capacity determination using guest ready-time metric as an indicator. In:International computer measurement group conference (CMG), Las Vegas, USA
35. Kephart JO, Chan H, Das R, Levine DW, Tesauro G III, Rawson FL, Lefurgy C (2007) Coordinatingmultiple autonomic managers to achieve specified power-performance tradeoffs. In: Proceedings ofthe international conference on autonomic computing (ICAC), Jacksonville, Florida
36. Kusic D, Kephart JO, Hanson JE, Kandasamy N, Jiang G (2009) Power and performance managementof virtualized computing environments via lookahead control. Clust Comput 12(1):1–15
37. Lee B, Schopf J (2003) Run-time prediction of parallel applications on shared environments. In:Proceedings of the international conference on cluster computing (Cluster), Hong Kong, China
38. Lefurgy C, Wang X, Ware M (2007) Server-level power control. In: Proceedings of the internationalconference on autonomic computing (ICAC), Jacksonville, Florida
39. Miah W (2010) Monitoring scientific computing infrastructure using Nagios. Tech Rep RAL-TR-2010-002, SFTC Rutherford Appleton Laboratory
40. Miller M (2014) Cloud computing pros and cons for end users. http://www.informit.com/articles/article.aspx?p=1324280&seqNum=2. Accesses 6 Feb 2014
41. Moreno-Vozmediano R, Montero RS, Llorente IM (2012) Iaas cloud architecture: from virtualizeddatacenters to federated cloud infrastructures. IEEE Comput 45(5):65–72
42. Nginx: http://wiki.nginx.org/Main. Accessed 6 Feb 201443. Open Cloud Standards Incubator: Interoperable clouds white paper. Tech Rep DSP-IS0101 (2009)44. OpenACS (2014) http://openacs.org/. Accessed 6 Feb 201445. Pastor R, Read T, Ros S, Hernàndez R, Hernàndez R (2009) Virtual communities adapted to the EHEA
in an enterprise distance e-learning based environment. In: Proceedings of the third internationalconference on online communities and social computing (OCSC), held as part of 13th internationalconference on human computer interaction (HCI), San Diego, USA
46. Qiao Y, Dinda P (2009) Network traffic analysis, classification, and prediction. Tech Rep NWU-CS-02-11, Department of Computer Science, Northwestern University
47. Ranganathan P, Leech P, Irwin DE, Chase JS (2006) Ensemble-level power management for denseblade servers. In: Proceedings of the 33th annual international symposium on computer architecture(ISCA), Boston, USA
48. Red-Hat enterprise virtualization for servers (2014). https://www.redhat.com/v/swf/redhat_ss_scheduler.html. Accessed 6 Feb 2014
49. Reddy VK, Reddy LSS (2011) Security architecture of cloud computing. Int J Eng Sci Technol3(9):7149–7155
50. Seovic A, Falco M, Peralta P (2010) Oracle Coherence 3.5. Packt Publishing51. Sulistio A, Reich C, Doelitzscher F (2009) Cloud infrastructure & applications–CloudIA. In: Proceed-
ings of the first intertnational conference on cloud computing (CloudCom), Beijing, China52. The R Foundation (2014). http://www.r-project.org/. Accessed 6 Feb 2014
123

Cloud-based architecture for web applications
53. Tomás L, Caminero A, Caminero B, Carrión C (2010) Using network information to perform meta-scheduling in advance in Grids. In: Proceedings of the 16th international conference on parallel com-puting (Euro-Par), Ischia, Italy
54. Tomás L, Caminero A, Carrión C, Caminero B (2010) Exponential smoothing for network-awaremeta-scheduler in advance in grids. In: Proceedings of the sixth international workshop on schedul-ing and resource management for parallel and distributed systems (SRMPDS), held jointly with theinternational conference on parallel processing (ICPP), San Diego, USA
55. Tomás L, Caminero AC, Rana O, Carrión C, Caminero B (2012) A Gridway-based autonomic network-aware metascheduler. Future Gener Comput Syst 28(7):1058–1069
56. Universidad Nacional de Educación a Distancia (UNED) (2014). http://www.uned.es/. Accessed 6 Feb2014
57. Urquhart J (2014) Exploring cloud interoperability. http://news.cnet.com/8301-19413_3-10235492-240.html. Accessed 6 Feb 2014
58. Vouk M, Averitt S, Bugaev M, Kurth A, Peeler A, Shaffer H, Sills E, Stein S, Thompson J (2008)Powered by VCL-using virtual computing laboratory (VCL) technology to power cloud computing.In: Proceedings of the 2nd international conference on the virtual computing initiative (ICVCI)
59. Ward S (2014) 5 disadvantages of cloud computing. (2014). http://sbinfocanada.about.com/od/itmanagement/a/Cloud-Computing-Disadvantages.htm Accessed 6 Feb 2014
60. Winkler V (2011) Securing the cloud: cloud computer security techniques and tactics. Elsevier, Ams-terdam
61. Wu B, Qian K, Guo M, Bhattacharya P, Hu W (2011) Live programming learning objects on cloud.In: Proceedings of the international conference on advanced learning technologies (ICALT), Athens,USA
62. Yang L, Foster I, Schopf JM (2003) Homeostatic and tendency-based cpu load predictions. In: Pro-ceedings of the 17th international symposium on parallel and distributed processing (IPDPS), Nice,France
123