clo valuation and investor due · pdf file3 structure of basic clo syndicated loans servicer...
TRANSCRIPT

CLO Valuation and Investor Due Diligence
A Presentation by Dr. Stanley J. Feldman

2
Topic Outline
• Structure of Basic CLO
• Identification of CLO Risks
• CLO Case Study: Fair Value of CLO Tranches
‐ Valuation of the CLO Portfolio Using Portfolio Replication‐ Valuation of CLO Tranches
• Overview of Axiom Valuation’s Credit Risk Platform
• Axiom Valuation Overview
Page
2
3
59
11
14

3
Structure of Basic CLO
Syndicated Loans
Servicer
Floating Rate Interest and Principal
Bond Proceeds
Special Purpose Vehicle
Trustee
Floating Rate Interest and Principal
Bond Proceeds
PaymentServices
Swap Counterparty
Floating Rate Cash Flows
Investment Grade Debt Tranche
Speculative Grade Debt Tranche
Equity Tranche
Fixed Rate Interest and Principal

4
Identifying CLO Risks
• Transparency Risk‐Incomplete information on the obligor (e.g. private firm), stale creditrating, no rating assigned to collateral
• Portfolio Credit Risk‐ Independent credit risk of individual assets‐ Cross industry credit risk: business operations are correlated
• Counterparty Risk‐ Swap counterparty‐ Servicer risk
• Interest rate risk
• Liquidity risk
CLO Case Study:Fair Value of CLO Tranches

6
Axiom Client CLO Collateral Portfolio Industry Breakdown
Aerospace & Defense, 0.50%
Automotive, 3.10%
Banking, 0.20%
Beverage, Food & Tobacco, 7.80% Chemicals, Plastics, and
Rubber, 2.50%Consumer Goods ‐ Durable,
2.00%
Consumer Goods ‐Non‐durable, 4.00%
Containers, Packaging & Glass, 0.80%
Energy ‐ Oil & Gas, 3.00%
Finance, 0.80%
Real Estate, 2.30%
Healthcare & Pharmaceuticals, 17.80%
Hotel, Gaming & Leisure, 4.20%Media ‐ Advertising, Printing
& Publishing, 2.60%Metals & Mining, 0.90%
Retail, 9.80%
Services ‐ Business, 15.10%
Services ‐ Consumer, 3.80%
Telecommunications, 0.50%Transportation ‐ Cargo, 0.40%
Transportation ‐Consumer, 1.90% Manufacturing,
6.60%
Farming & Agriculture, 0.50%
Electronics, 8.90%
7
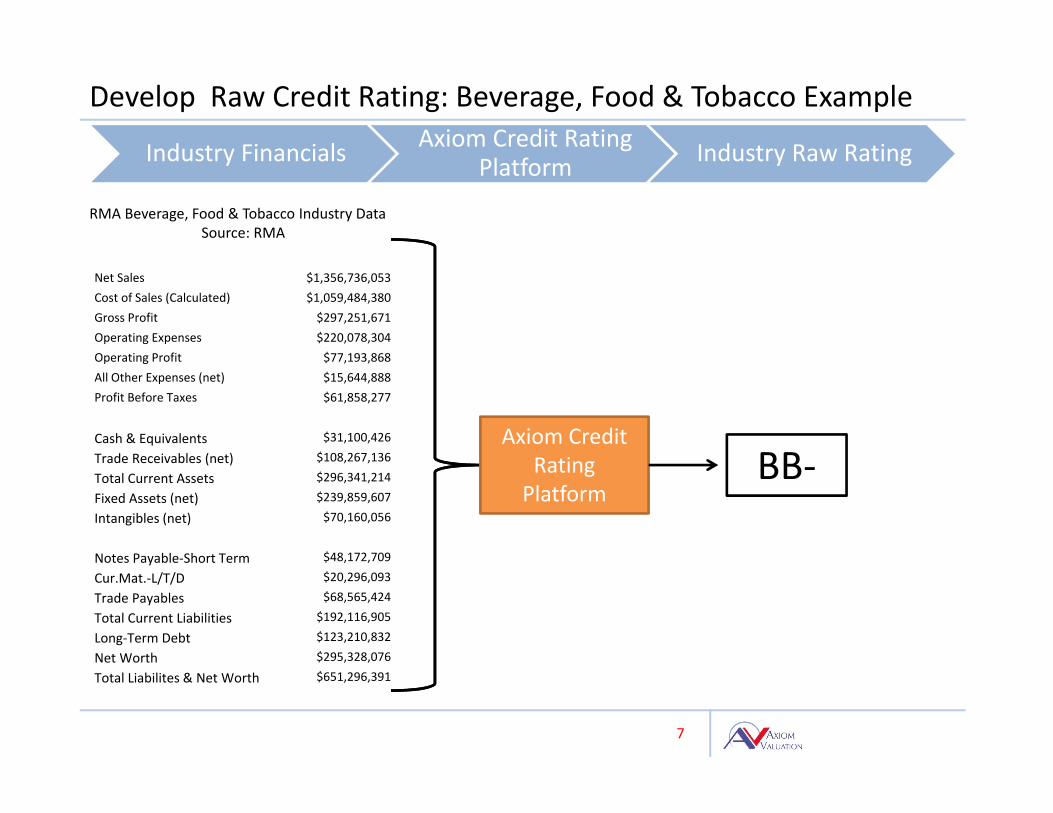
Develop Raw Credit Rating: Beverage, Food & Tobacco Example
Net Sales $1,356,736,053Cost of Sales (Calculated) $1,059,484,380Gross Profit $297,251,671Operating Expenses $220,078,304Operating Profit $77,193,868All Other Expenses (net) $15,644,888Profit Before Taxes $61,858,277
Cash & Equivalents $31,100,426
Trade Receivables (net) $108,267,136
Total Current Assets $296,341,214
Fixed Assets (net) $239,859,607
Intangibles (net) $70,160,056
Notes Payable‐Short Term $48,172,709
Cur.Mat.‐L/T/D $20,296,093
Trade Payables $68,565,424
Total Current Liabilities $192,116,905
Long‐Term Debt $123,210,832
Net Worth $295,328,076
Total Liabilites & Net Worth $651,296,391
RMA Beverage, Food & Tobacco Industry DataSource: RMA
Industry Financials Axiom Credit Rating Platform Industry Raw Rating
Axiom Credit Rating Platform
BB‐
8
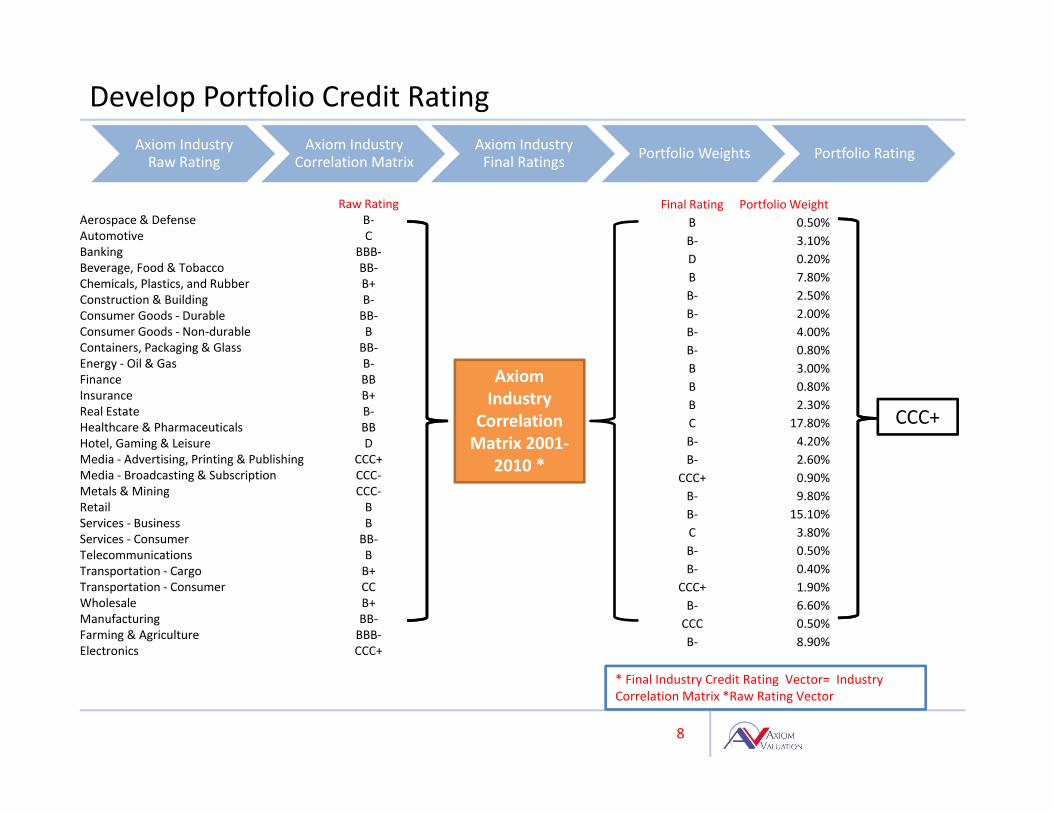
Develop Portfolio Credit RatingAxiom Industry Raw Rating
Axiom Industry Correlation Matrix
Axiom Industry Final Ratings Portfolio Weights Portfolio Rating
Axiom Industry
Correlation Matrix 2001‐
2010 *
CCC+
Raw RatingAerospace & Defense B‐Automotive CBanking BBB‐Beverage, Food & Tobacco BB‐Chemicals, Plastics, and Rubber B+Construction & Building B‐Consumer Goods ‐ Durable BB‐Consumer Goods ‐ Non‐durable BContainers, Packaging & Glass BB‐Energy ‐ Oil & Gas B‐Finance BBInsurance B+Real Estate B‐Healthcare & Pharmaceuticals BBHotel, Gaming & Leisure DMedia ‐ Advertising, Printing & Publishing CCC+Media ‐ Broadcasting & Subscription CCC‐Metals & Mining CCC‐Retail BServices ‐ Business BServices ‐ Consumer BB‐Telecommunications BTransportation ‐ Cargo B+Transportation ‐ Consumer CCWholesale B+Manufacturing BB‐Farming & Agriculture BBB‐Electronics CCC+
Final Rating Portfolio WeightB 0.50%B‐ 3.10%D 0.20%B 7.80%B‐ 2.50%B‐ 2.00%B‐ 4.00%B‐ 0.80%B 3.00%B 0.80%B 2.30%C 17.80%B‐ 4.20%B‐ 2.60%
CCC+ 0.90%B‐ 9.80%B‐ 15.10%C 3.80%B‐ 0.50%B‐ 0.40%
CCC+ 1.90%B‐ 6.60%CCC 0.50%B‐ 8.90%
* Final Industry Credit Rating Vector= Industry Correlation Matrix *Raw Rating Vector

9
Tranche Pricing Based on 2001‐2010 Correlation MatrixCCC+ Yield Spread
Portfolio Weighted Average Coupon: 9% Portfolio Price: 91.73
Portfolio Face Value: $550,000,000
Portfolio Market Value: $504,520,355
A‐1 Tranche: LIBOR + 2.5%, AAA Rating, Face Value: $301,500,000
Cash Flow: Full Principal Coverage
A‐2 Tranche: LIBOR + 2.5%, AAA Rating, Face Value: $46,000,000
After A‐1 Cash Flow: Full Principal Coverage
B Tranche: LIBOR + 3.75%, AA Rating, Face Value: $22,000,000
After A‐1, and A‐2 Cash Flow: Full Principal Coverage
C Tranche: LIBOR + 4.75%, A Rating, Face Value: $33,000,000
After A‐1, A‐2, and B Cash Flow: Full Principal Coverage
Equity Tranche: No Rating, Face Value: $147,500,000
After A‐1, A‐2, B,and C Cash Flow: 69.1% Principal Coverage
Portfolio Weighted Average Duration: 5 years
Cash Flow Waterfall

10
Tranche Pricing Using a Different Correlation Matrix (1990‐2000) B+ Yield Spread
Portfolio Weighted Average Coupon: 9% Portfolio Price: 99.39
Portfolio Face Value: $550,000,000
Portfolio Market Value: $546,620,195
A‐1 Tranche: LIBOR + 2.5%, AAA Rating, Face Value: $301,500,000
Cash Flow: Full Principal Coverage
A‐2 Tranche: LIBOR + 2.5%, AAA Rating, Face Value: $46,000,000
After A‐1 Cash Flow: Full Principal Coverage
B Tranche: LIBOR + 3.75%, AA Rating, Face Value: $22,000,000
After A‐1, and A‐2 Cash Flow: Full Principal Coverage
C Tranche: LIBOR + 4.75%, A Rating, Face Value: $33,000,000
After A‐1, A‐2, and B Cash Flow: Full Principal Coverage
Equity Tranche: No Rating, Face Value: $147,500,000
After A‐1, A‐2, B,and C Cash Flow: 97.7% Principal Coverage
Portfolio Weighted Average Duration: 5 years
Cash Flow Waterfall

Overview of Axiom Valuation’sCredit Risk Platform

12
Stress Test Covenants
Competitive Advantage Assessment
Credit Risk Platform
Enterprise Protection Rating
Initial Fair Value Assessment
Fair Value Range
Market Price DataLoanX, Markit,
ReutersFINRA, Bloomberg
Axiom Valuation’s Fair Value Assessment Framework
13
13
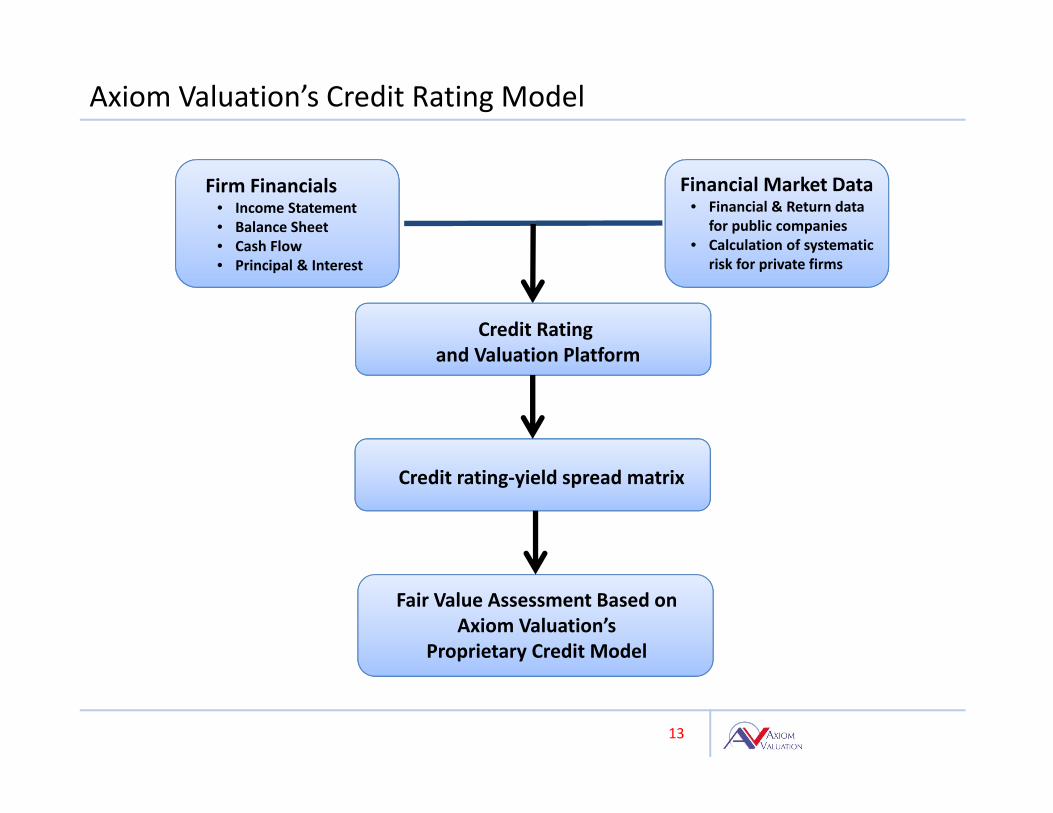
Firm Financials • Income Statement• Balance Sheet• Cash Flow• Principal & Interest
Financial Market Data• Financial & Return data
for public companies• Calculation of systematic
risk for private firms
Credit Ratingand Valuation Platform
Credit rating‐yield spread matrix
Fair Value Assessment Based on Axiom Valuation’s
Proprietary Credit Model
Axiom Valuation’s Credit Rating Model

14
Why Choose Axiom Valuation?
Our Principals Offer Both Academic Rigor and Real World Experience.
Principals• Dr. Stanley Feldman, Ph.D., Chairman and Chief Valuation Officer
‐ Former member of the FASB’s Valuation Resource Group, an advisory panel on establishing fair value standards
‐ Tenured Associate Professor of Finance at Bentley University, retired‐ Primary researcher on numerous refereed published articles on valuation related
issues‐ Author of two well known books on valuation
• Roger Winsby, CMEA, President

15
Well Positioned to Meet Fair Value Review Requirements
• Stable and scalable resource base allows Axiom Valuation to increase the number of assets it fair values and still meet hard financial reporting deadlines.
• Real world experience in fair valuing illiquid fixed income instruments.
• Our work has been vetted by the all leading auditing firms.
• We fair value all types of financial securities from vanilla fixed income instruments to complex derivatives.
• Axiom Valuation is the most cost‐effective valuation firm in the country.

16
Axiom Valuation
Axiom Valuation is a nationally recognized financial security and business valuation firm.We have conducted valuation assignments for clients throughout the U.S., Europe andAsia. We regularly conduct fair value assignments for financial institutions in terms of fairvaluing portfolio assets and liabilities as well as acting as an advisor and assessingwhether internal transfers between funds meet the fair value standard. Our Co‐founderand Chairman, Dr. Stanley Jay Feldman, was a member FASB’s Valuation Resource Group,an advisory group to FASB on fair value issues. Axiom Valuation develops and updates astate‐of‐the‐art credit risk platform to value debt instruments effectively, efficiently, andwith full documentation of assumptions and findings.
For more information, please visitwww.axiomvaluation.comwww.avairas.comwww.hedgefundvalue.com
201 Edgewater Drive, Suite 255, Wakefield, MA, 01880 781‐486‐0100