servicer total achievement and rewards performance
TRANSCRIPT

© 2019 Fannie Mae. Trademarks of Fannie Mae. 09.01.19 1 of 19
Servicer Total Achievement and Rewards Performance Scorecard Report User Guide
Introduction to the Performance Scorecard Report
September 2019
The Servicer Total Achievement and Rewards™ (STAR™) Performance Scorecard is designed to help you quickly identify opportunities for improvement. Fannie Mae provides performance feedback on your progress against each metric and relative ranking within your Peer Group.
The Performance Scorecard metrics were selected based on Fannie Mae’s current strategic objectives to minimize credit losses, increase operational efficiency, and improve the borrower experience. As conditions change, the STAR Team will update and communicate revisions to these key performance indicators.
This user guide will provide information on accessing and navigating the STAR Performance Scorecard Report. For additional information on the context for evaluating your specific results as represented in the Scorecard, refer to the STAR Performance Scorecard White Paper. The White Paper covers the following topics:
STAR Introduction
Servicer Profiles and Relevant Metrics
General Servicing Metric Definitions
Solution Delivery Metric Definitions
Timeline Management Metric Definitions
Exceptions and Special Handling
Comparable Pool Methodology
Calculating Comparable Performance
Evaluating Servicer Performance
Resources

© 2019 Fannie Mae. Trademarks of Fannie Mae. 09.01.19 2 of 19
Accessing the Performance Scorecard Report
You will access the Performance Scorecard Report from the Fannie Mae Connect Reporting Portal (Fannie Mae Connect™) on the Single Family Business web site.
Follow these steps to access the Fannie Mae Connect Reporting Portal.
1. Open the Fannie Mae Connect page on Fannie Mae.com/singlefamily. (https://www.fanniemae.com/singlefamily/fannie-mae-connect)
2. Click the LAUNCH APP button to access Fannie Mae Connect.
Fannie Mae Connect launches in a separate window, and displays the Fannie Mae Connect Login screen.
NOTE: Remember to bookmark the Fannie Mae Connect page so you can to access it directly.

© 2019 Fannie Mae. Trademarks of Fannie Mae. 09.01.19 3 of 19
3. Log onto Fannie Mae Connect using your provided User Name and Password.
NOTE: If you have forgotten your User ID or Password, click the "Need Help With Your User ID or Password” link.
Are you a first time user? If so, contact the designated Technology Manager Corporate Administrator at your company to register you for access to Fannie Mae Connect. Only Technology Manager Corporate Administrators have the ability to set up and manage application access for users. Once registered, you can set up a password and update your personal profiles via Technology Manager. You can find more information on how to identify your Technology Manager Corporate Administrator or using Technology Manager at the Technology Manager Page on FannieMae.com.
NOTE: For more information on using Fannie Mae Connect see the Help and Training section on Fannie Mae Connect Website.

© 2019 Fannie Mae. Trademarks of Fannie Mae. 09.01.19 4 of 19
4. After logging in to Fannie Mae Connect, you will see the home screen. Click the Report Center link for a list of Report Categories.
5. Scroll down to the bottom of the screen, if you have been granted access to the “Management” Report Category by your Corporate Administrator, you will find a link to the STAR Performance Scorecard under the Management area.
6. Click the Tableau icon to open the STAR Performance Scorecard.

© 2019 Fannie Mae. Trademarks of Fannie Mae. 09.01.19 5 of 19
The STAR Performance Scorecard defaults to the Monthly Summary screen.

© 2019 Fannie Mae. Trademarks of Fannie Mae. 09.01.19 6 of 19
Performance Scorecard Report Navigation
Introduction The Performance Scorecard Report opens in a web browser. This enables you to explore data using interactive visualizations that will help you respond to events affecting your business with Fannie Mae.
In this user guide, we describe and use a sample report to show the main features of the Performance Scorecard Report. Main Navigation The Performance Scorecard consists of six main reports that can be accessed from one main screen. To navigate between the reports, click the Tabs on the main menu at the top of each screen.
Exporting Reports You can export reports from any of the tabs at the top of the Performance Scorecard Report. For more information on exporting and printing reports, see the Tableau Report Export & Print Instructions.
Exporting to a PDF 1. From any report tab, click the download icon in the upper right corner of the screen. The available download options
will appear. When a download option is not available for a report, the options will be grayed out.
2. Click PDF and the selection for the PDF export will appear on the screen:
3. Select Landscape from the Layout area,
4. Select Letter from the Paper Size area.
5. Select Automatic from the scaling area.
6. Select This Dashboard from the Contents area to create a PDF of an individual dashboard, or select Sheets in Workbook to create a PDF with multiple dashboards.
7. Click the Download button
8. Click on Download again for PDF export

© 2019 Fannie Mae. Trademarks of Fannie Mae. 09.01.19 7 of 19

© 2019 Fannie Mae. Trademarks of Fannie Mae. 09.01.19 8 of 19
Performance Summary
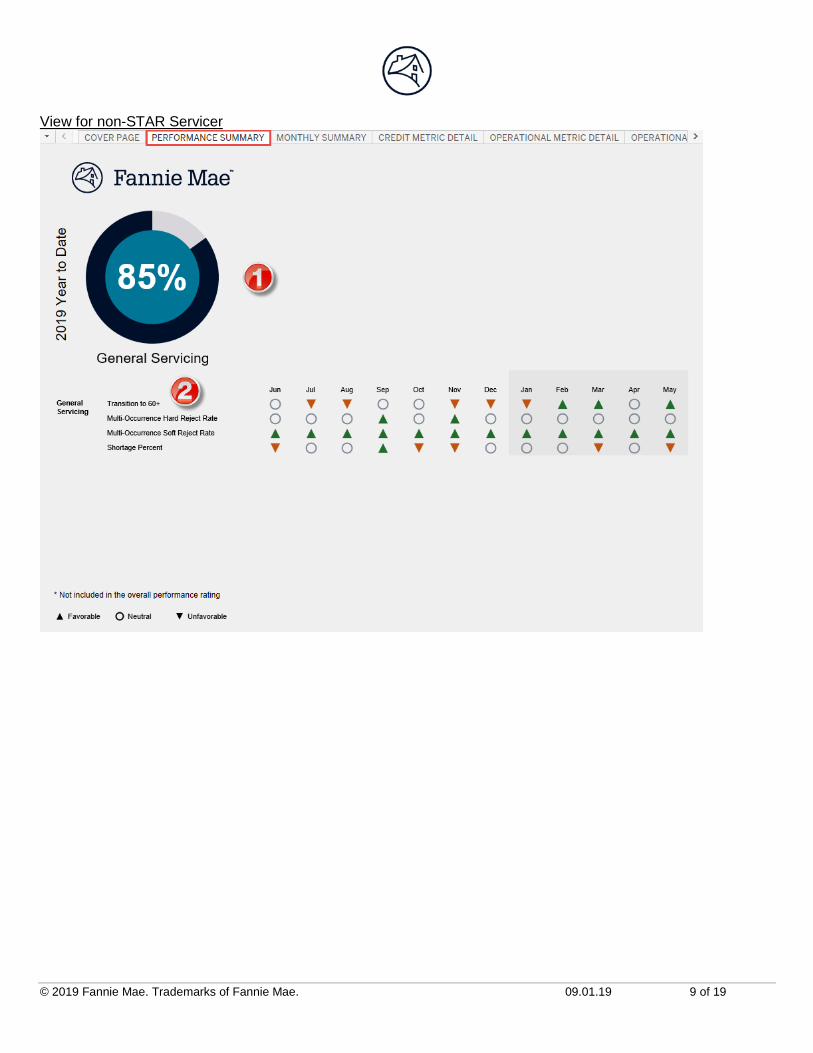
The Performance Summary page provides a one page snapshot of performance for the most recent month. The layout changes depending on STAR or non-STAR servicer.
Performance Summary Screen 1. The donut charts show how frequently a servicer achieves favorable or neutral performance in the metrics
relevant to each process area in which they are evaluated.
2. This chart shows the individual monthly indicator for the year. View for STAR Timeline Management Servicer
© 2019 Fannie Mae. Trademarks of Fannie Mae. 09.01.19 9 of 19
View for non-STAR Servicer

© 2019 Fannie Mae. Trademarks of Fannie Mae. 09.01.19 10 of 19
Monthly Summary
This page provides a monthly snapshot of the metrics in the scorecard based on each servicer's profile and inclusion criteria described in the White Paper. Seven key columns are provided in the view:
1. Performance Indicator - Illustrates if the performance in the metric is favorable, unfavorable, or within the acceptable range
2. Servicer - Represents the servicer's reported or calculated metric.
3. Comp - For credit performance metrics, the comp rate will be displayed and for the operational metrics, the metric threshold will be displayed.
4. Variance - The percentage difference between the metric rate and the comp or threshold rate.
5. Numerator -The number of event occurrences for the period. For a detailed description of the events measured by each metric, please see the STAR Performance Scorecard White Paper.
6. Denominator - The total number of loans measured by the metric at the beginning of the reporting period.
7. Rank - Represents the servicer's rank relative to other servicers measured in STAR Scorecard based on their variance to Comp or performance to threshold.

© 2019 Fannie Mae. Trademarks of Fannie Mae. 09.01.19 11 of 19
Credit Metric Detail
This tab is divided into four distinct areas: Performance Indicators, Credit Performance Metric Details, Metric and Comp, and Variance to Comp.
1. Performance Indicators - Illustrates if the performance in the metric is favorable, unfavorable, or neutral to Comp.
2. Credit Performance Metric Details a. Servicer – Represents the servicer's calculated metric
b. Comp – Expected performance based on performance of similar Fannie Mae loans.
c. Numerator – The servicer’s number of event occurrences for the period.
d. Comp Num – The number of event occurrences for a similar group of Fannie Mae loans.
e. Neutral Upper – The numerator threshold between Neutral and Favorable rating.
f. Neutral Lower – The numerator threshold between Neutral and Unfavorable rating.
g. Denominator – The total number of loans measured by the metric at the beginning of the reporting period.
h. Variance – The percentage difference between the servicer’s metric rate and the comp rate.
i. Rank – Servicers are ranked based on their relative performance to the Comp.
j. Score – Based on the rank, a score is assigned based on the distribution. For a detailed explanation of the score calculation, please see the STAR Performance Scorecard White Paper.
3. This chart shows the servicer’s performance (dark blue line) versus the comp rate (gray shading)
4. The dark blue line in this chart shows the servicer’s variance to comp over time. The light grey areas extending above and below 0% variance represents the range of performance considered neutral to comp, and the area above represents performance considered favorable to comp.
NOTE: All information will be available for a year cycle - January - December

© 2019 Fannie Mae. Trademarks of Fannie Mae. 09.01.19 12 of 19

© 2019 Fannie Mae. Trademarks of Fannie Mae. 09.01.19 13 of 19
Operational Metric Detail
This tab is divided into four distinct areas: Performance Indicators, Metric Details, Metric Trending, and Variance to Comp Trending.
1. Performance Indicators - Illustrate if the performance in the metric is favorable, unfavorable, or neutral to Comp.
2. Metric Details - a. Servicer – Represents the servicer's reported or calculated metric.
b. Threshold – Established threshold performance for the metric.
c. Numerator – The number of event occurrences for the period.
d. Denominator – The total number of loans measured by the metric at the beginning of the reporting period.
e. Variance – The percentage difference between the servicer’s metric rate and the threshold rate.
3. This chart shows the servicer’s performance (dark blue line) versus the threshold rate (gray shading)
4. The dark blue line in this chart shows the servicer’s variance to comp over time.
NOTE: All information will be available for a year cycle - January - December.

© 2019 Fannie Mae. Trademarks of Fannie Mae. 09.01.19 14 of 19
Operational Metrics
This tab contains metrics for Investor Reporting, Collections, Liquidation, Retention, Bankruptcy, Foreclosure, and Post Foreclosure metrics.

© 2019 Fannie Mae. Trademarks of Fannie Mae. 09.01.19 15 of 19
Banyan
The Banyan tab allows users to:
• View a visual representation of the decision trees for each credit performance metric
• View their performance at the individual node level
• Download a list of the Fannie Mae loans evaluated for each node
1. The Metric drop down allows you to select the metric tree
2. The Month drop down selects the report month
3. Click the “View Tree” button to render the decision tree

© 2019 Fannie Mae. Trademarks of Fannie Mae. 09.01.19 16 of 19
Clicking on individual nodes to expand or contract all child nodes
The node colors indicate the following:
1. Grey - if the diff between num and comp num is -1 to 1
2. Light red - if the diff between num and comp num is -1 to -3
3. Dark red - if the diff between num and comp num is -3 and worse
4. Light green - if the diff between num and comp num is 1 to 3
5. Dark green - if the diff between num and comp num is 3 and above

© 2019 Fannie Mae. Trademarks of Fannie Mae. 09.01.19 17 of 19
By hovering over an individual node the user can see node performance details and the number of loans in that node. It also gives options to view historical node detail or download a list of the Fannie Mae loans included in the node population.
Selecting the “Historical Charts” option loads detailed historical performance for the individual node

© 2019 Fannie Mae. Trademarks of Fannie Mae. 09.01.19 18 of 19
You can switch back to the decision tree view with the toggle

© 2019 Fannie Mae. Trademarks of Fannie Mae. 09.01.19 19 of 19
Additional Resources
For more information about other STAR materials, please visit the STAR Page on Fannie Mae’s website. STAR Performance Scorecard White Paper STAR Page STAR Team Email