clinical safety & effectiveness session # 1uthscsa.edu/cpshp/cseproject/reducing discharge...
TRANSCRIPT

Clinical Safety & EffectivenessSession # 1
1
DATEEducating for Quality Improvement & Patient Safety
Reducing discharge times: From Order to Door

The TeamCourse Participants:University Health SystemLisa Dodge, RN Administrative Director, Care Coordination Mary Anne Mote, BS, MBA Senior VP & Chief Revenue Officer
University of Texas Health Science CenterMichael Johnson, MD HospitalistLuci Leykum, MD, MBA Div. Chief,Hospital Medicine & Asst. Chair Clinical Service &
Quality
Team Members:University Health SystemNursing staffDebbie Stolz, RNLinda Frausto, RNWard ClerksGeri Friedland, Crystal Pleasant, Ward Clerk
2

What We Are Trying to Accomplish?
OUR AIM STATEMENT
3
Reduce the time taken to discharge a patient, from the 12th floor at UHS, once a discharge order is written, by 10% by August 2009.

Project Milestones
• Team Created March 2009
• AIM statement created April 2009
• Weekly Team Meetings Started April 200
• Background Data, Brainstorm Sessions, Jan 2009-April 2009
Workflow and Fishbone Analyses
• Interventions Implemented June, 1 2009
• Data Analysis Mar 2009-Aug 2009
• CS&E Presentation August 28, 2009
4

Background
• Emergency Center diversion times and Emergency Center waiting room times are great across the country.
• Part of the responsibility for “decompressing” the Emergency Center relies on the hospital to be efficient in admitting and discharging patients in a timely manner
5

How Will We Know That a Change is an Improvement?
• We tracked the time required to discharge a patient from the floor after a physician had written a discharge order as part of our assessment of inpatient “hospital flow.”
• Discharge orders recorded in our electronic medical record noted time “zero” for a discharge encounter. Release of the hospital bed to housekeeping noted the end time for this discharge encounter.
6

What Changes Can We Make That Will Result in an Improvement?
1. Design a system where the clerk checks the printer every 10 minutes for discharge orders and then prioritizes processing these orders over other daily work.
2. Simplify the Nursing Discharge Note and Medicine ReconcilliationNote so that the note is pre-populated with data already entered into the electronic medical record.
3. Create a templated note that will allow nursing to document patient education they provided earlier in the hospital stay so that it is not all completed and recorded at the time of discharge.
7
Selected Process Analysis Tools
• Brainstorming
• Flowchart
• Fishbone
• Check sheet (Nursing Questionnaire)
8

Flowchart
9

Cause & Effect Diagram
10

Nursing Survey
1. How long did it take to print the discharge orders, obtain physician prescriptions, and compile the paperwork in the discharge folder?
2. How long did it take you to find time to begin the discharge process once you received the
discharge folder?
3. How long did it take you to complete the discharge note?
4. How long did it take you to enter the medicine reconciliation note?
5. How long did it take you to provide patient education?
6. Once the patient was ready to leave the room, how long did it take for either transportation to take the patient to the lobby or for a designated worker on the floor to take the patient to the lobby?
11

Pareto Chart
12
0.0%
10.0%
20.0%
30.0%
40.0%
50.0%
60.0%
70.0%
80.0%
90.0%
100.0%
0
1
2
3
4
5
> 60 min 16-30 min 31-45 min 6-15 min 46-60 min N/A 0-5 min
Responses Cumulative Percent

Background Data
Prior to our intervention, the time required to
discharge a patient from the moment the physician
order was placed to the time the bed was released to
be cleaned by housekeeping, was 3.10 hours.
13
Intervention
Plan
Decrease Patient Discharge times on the 12th floor to under 3.10 hours.
14

Implementing the Change
Do
After brainstorming with nursing, reviewing the nursing discharge process questionnaire (check sheet), and studying our flowcharts and fishbone diagrams, we implemented the aforementioned three changes in the discharge process on June 1, 2009.
15
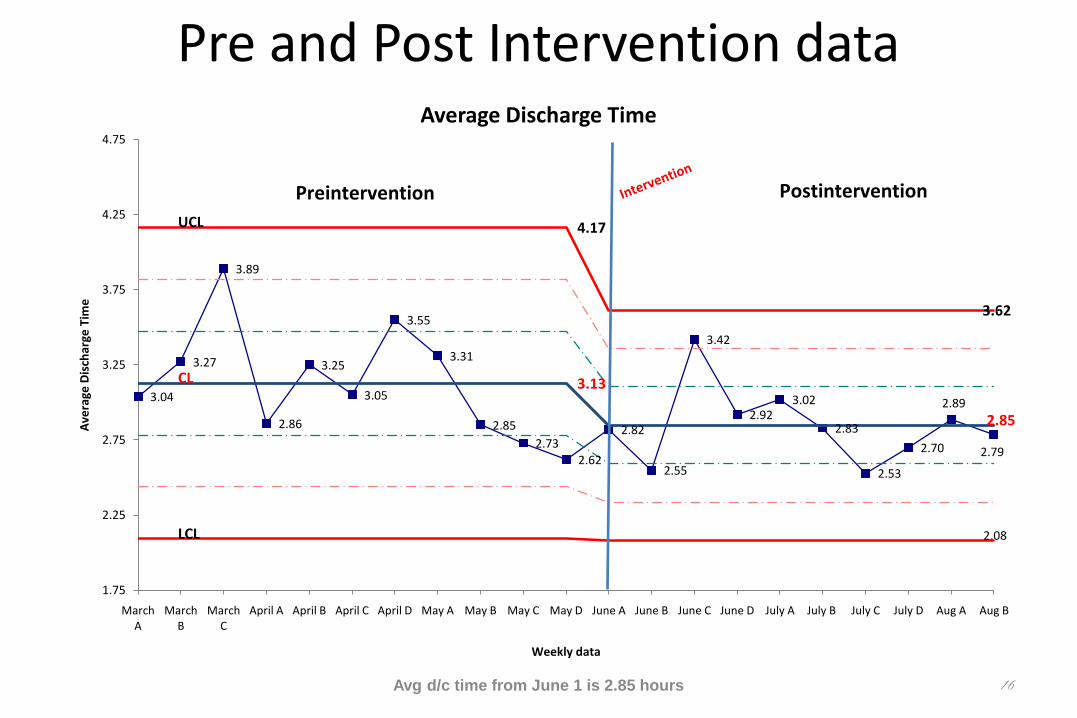
Pre and Post Intervention data
Avg d/c time from June 1 is 2.85 hours 16
3.04
3.27
3.89
2.86
3.25
3.05
3.55
3.31
2.85
2.732.62
2.82
2.55
3.42
2.923.02
2.83
2.53
2.70
2.89
2.79
UCL 4.17
3.62
CL 3.13
2.85
LCL 2.08
1.75
2.25
2.75
3.25
3.75
4.25
4.75
March A
March B
March C
April A April B April C April D May A May B May C May D June A June B June C June D July A July B July C July D Aug A Aug B
Ave
rage
Dis
char
ge T
ime
Weekly data
Average Discharge Time
Preintervention Postintervention

Act
We hope to distribute our automated discharge note, clerical discharge protocol, and nursing patient education protocol to the entire hospital.
Once implemented, we hope to show improvement in patient discharge times throughout the entire hospital that will result in decreased wait times for admitted patients in the EC and ultimately, decreased waiting room and diversion times in the EC.
17
Conclusion
Process improvement is possible using the systematic methods taught in this course along with rigorous data collection of pre and post interventions.
To maintain these improvements, we must equip our healthcare leaders with the knowledge to adequately track and analyze our discharge data in real time. This will be accomplished using daily run charts for each floor that will be monitored by the Nurse Manager for each floor.
18

19
Thank you!
Educating for Quality Improvement & Patient Safety