clinical safety & effectiveness cohort 18 team #7uthscsa.edu/cpshp/cseproject/cohort18/group...
TRANSCRIPT

1
Clinical Safety & EffectivenessCohort 18 Team #7
Increasing Early Detection of Sepsis
DATE

2
The Team• Division
CS&E Participant: Mohammed Al Fayyadh, MD
CS&E Participant: Alexandra Castro, MD
CS&E Participant: Ha Lam, MD
CS&E Participant: Helena Quezon, RN
CS&E Participant: Maria Cathy Salak, RN
Facilitator: Edna Cruz, M.Sc., RN, CPHQ, CPPS
• Sponsoring DepartmentsDr. James Barker, UHS VP for Clinical Services CMO Office
Dr. Luci Leykum, Division Chief of General and Hospital Medicine
Ronald Estrella, RN, Executive Director of Nursing on 5th floor
Dr. Daniel Dent, Program Director of General Surgery Residency Program
Dr. Jan Patterson, Associate Dean for Quality and Lifelong Learning

STATEMENT
To increase early detection of sepsis on the fifth floor Acute Care Unit at UHS hospital by reducing
“Onset of sepsis to MD antibiotic order” cycle time by 50% from 9:28 to 4:44 hours
by May of 2016.

Project Milestones
• Team Created Jan 2016
• AIM statement created Feb 2016
• Weekly Team Meetings Jan-April 2016
• Background Data, Brainstorm Session, Jan-Feb 2016
Workflow and Fishbone Analyses
• Interventions Implemented Mar-April 2016
• Data Analysis May 2016
• CS&E Presentation Jun 3rd, 2016
5
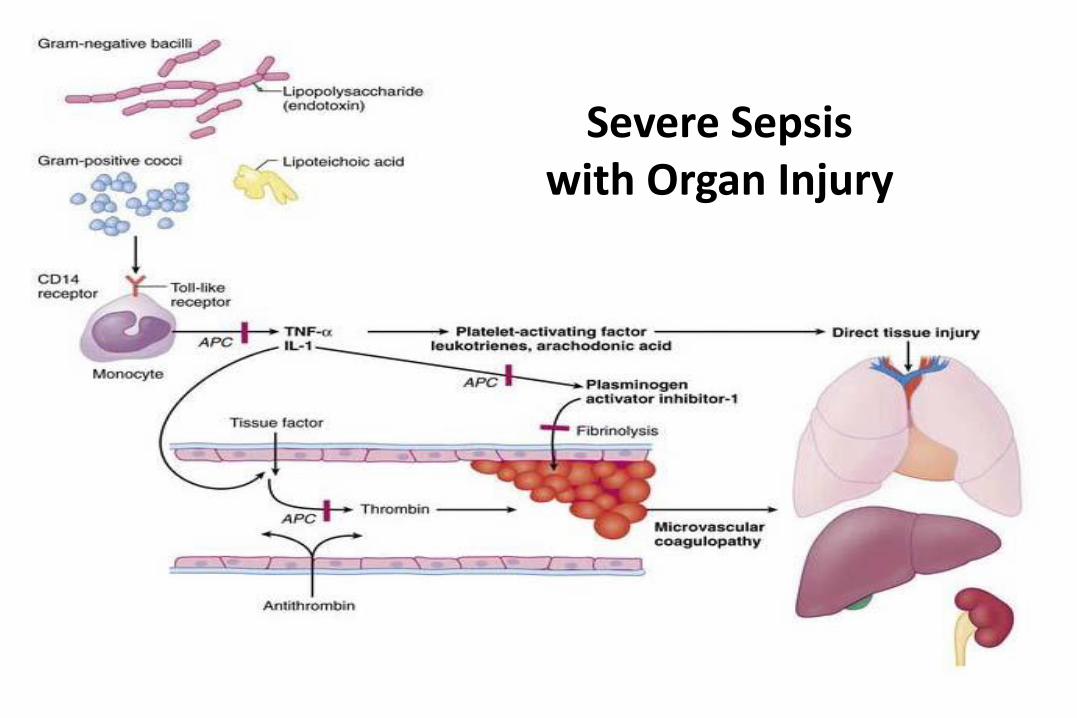
Severe Sepsis with Organ Injury

Background• Sepsis is a common problem with a major global impact on
healthcare resources and expenditure.
• Developed countries sepsis incidence : 300 cases per 100,000 population and rising.
• Mortality for patients with severe sepsis or septic shock ranges between 20% and 50%.
• The Surviving Sepsis Campaigns promoted internationally recognized pathways to improve the management of sepsis.
• To translate recommendations into the daily practice is challenging and requires a multi-disciplinary approach.

Background• Severe sepsis: sepsis + sepsis-induced organ dysfunction or
tissue hypo perfusion.
• Septic shock : severe sepsis criteria + hypotension despite IV fluid resuscitation.
• Fundamental approach: early recognition, appropriate, timely delivery of antibiotics, source control.
• Mortality increases by 7.6% for every hour delay in starting antibiotic therapy.
• Early goal-directed therapy (EGDT) has previously been associated with a 34% relative risk reduction in mortality.

Background
• The Surviving Sepsis Campaign
– Joint collaboration of the Society of Critical Care Medicine and the European Society of Intensive Care Medicine committed to reducing mortality from sepsis worldwide.
– Implementation of a core set of evidence-based interventions, otherwise known as ‘resuscitation bundles’
• Sepsis Six:
– three diagnostic and monitoring steps and three therapeutic interventions:

Background- Sepsis six1. Deliver high-flow oxygen
2. Take blood cultures prior to antibiotics but do not delay treatment
3. Administer empirical intravenous antibiotics
4. Measure serum lactate
5. Start intravenous fluid resuscitation with crystalloids
6. Commence urine output monitoring via either a catheter or chart

Bibliography1. Kumar, P., Jordan, M., Caesar, J., & Miller, S. (2015). Improving the management of sepsis in a district general hospital by implementing the “Sepsis Six” recommendations. BMJ Quality Improvement Reports, 4(1), u207871.w4032. http://doi.org/10.1136/bmjquality.u207871.w4032
2. Dellinger RP, Levy MM, Rhodes A et al. Surviving sepsis campaign: International guidelines for the management of severe sepsis and septic shock: 2012. Crit Care Med 2013;41(2):580–637 [PubMed]
3. Rivers E, Nguyen B, Havstad S et al. Early goal-directed therapy in the treatment of severe sepsis and septic shock. N Engl J Med 2001;345:1368–77. [PubMed]
4. Robson WP, & Daniels R The Sepsis Six: helping patients to survive sepsis. Br J Nurs 2008;17:16–21 [PubMed]

11
Plan - Determine the Baseline Performance
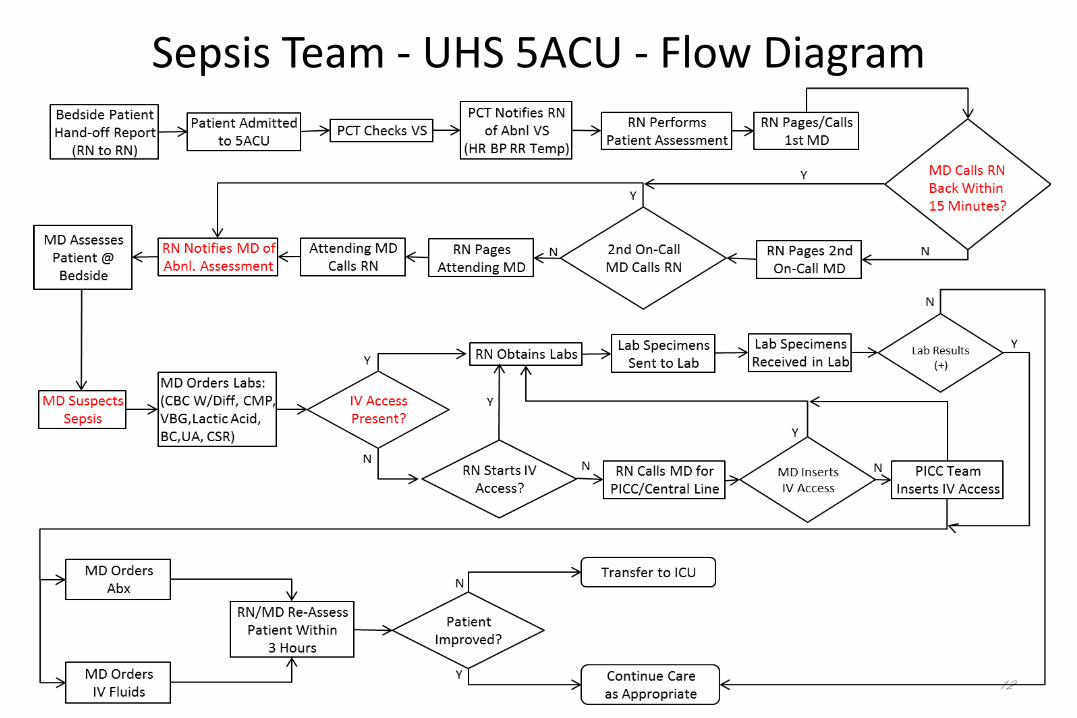
• Flow to determine bottle neck issues for lack of performance
• Cause and Effect Diagram to determine the root cause for non-performance
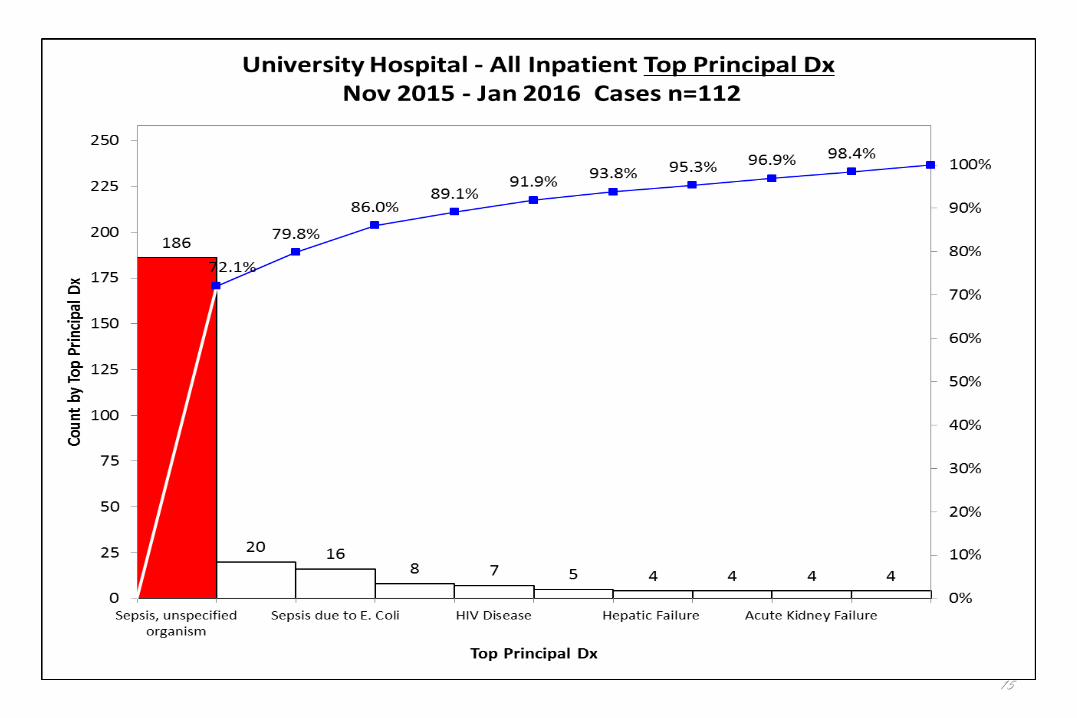
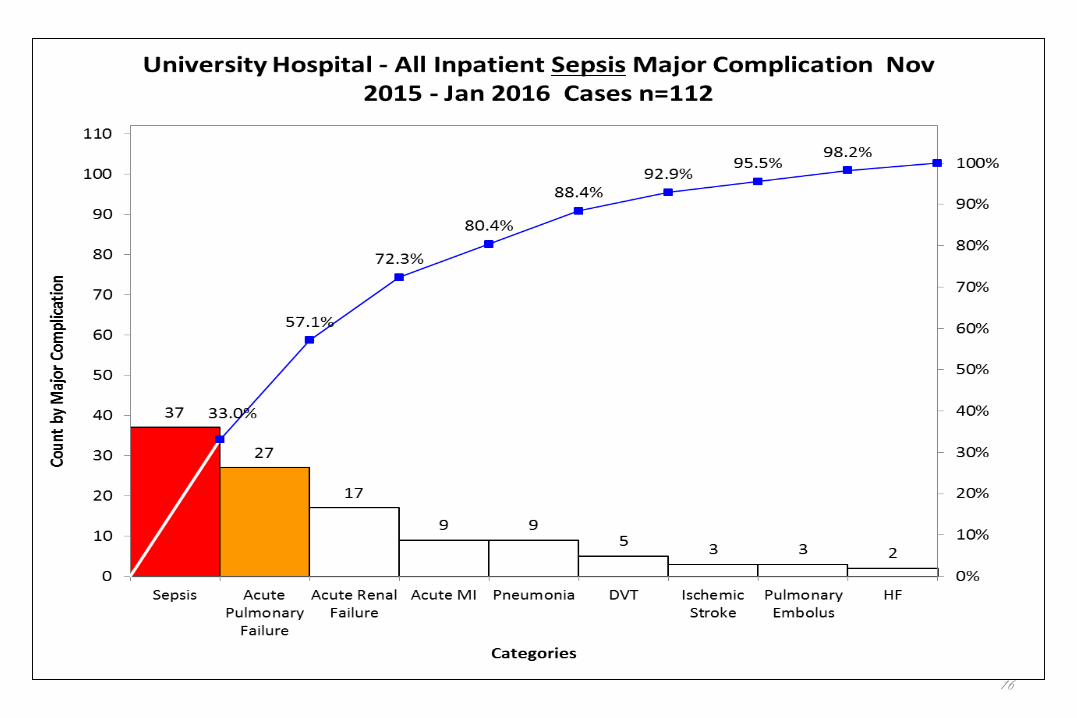
• Pareto chart to narrow to a focus
• Process control chart to determine stability of the process and present performance
12
Sepsis Team - UHS 5ACU - Flow Diagram


15
16

17

18
19
DO – Plan & Test the Actions
• After analysis of UH statistics in preliminary data analysis and noticed that the majority of sepsis occurred on 5ACU and not in 6ACU, teaching and implementation of screening tool was done in 5ACU (Feb 2016, completed)
• The primary and secondary outcome analysis will be based on the data collected from screening tool and chart review (May 2016, completed)

PLAN: Intervention
• Initial analysis of pre-intervention data
• Screening tool implementation
• Post-Intervention data to be collected until May
• Final analysis of post-intervention data

21
PLAN: InterventionDynamic changes in statement, population, and
primary and secondary outcomes:
– Population: Change the focus from 6ACU to 5ACU
– Primary outcome: Cycle time from time of sepsis onset to initiation of antibiotics for patients located on 5ACU
– Secondary outcomes: ICU transfers and mortality

22

Intervention 1

Intervention 1: SIRS criteria
24

Intervention 2

• Compare the results to the plan

27
A 72% reduction in cycle time exceeding our aim of 50%

Nursing Survey
• 4 question survey using a 5 point Likert scale given to 5ACU RNs
• 42% of RNs felt confident diagnosing or recognizing sepsis PRIOR to the use of the Sepsis Screening Tool
• 64% of RNs felt confident diagnosing or recognizing sepsis AFTER the use of the Sepsis Screening Tool
• 48% of RNs felt that the tool changed the way they managed patients
• Neutral response in terms of time management28

29
Act - Modify Plan for Next Test of Change
Use the tool as part of shift change protocol for the nursing staff
Incorporate an automated version of the tool into Sunrise
If proven helpful this tool must be part of the new Employee or Unit Orientation, Graduate Medical Education and Continuing Education courses
More data analysis and reporting to come.

30
Act - Modify Plan for Next Test of Change
• Continue to monitor and report
the data to the staffs.
• Spread best practice to the ED and other units as appropriate.
• Focus education and training on proper tool use, its benefits and patient selection.

31
Benefits
- Standardizing and facilitating the right care via use of a protocol reduces both transfers to the ICU and mortality.
Barriers
– Bedside nurse may view screening tool as added workload and extra paperwork to be filled out.
– Additional unit activities on the wards may affect the timing and implementation of the screening tool.
32
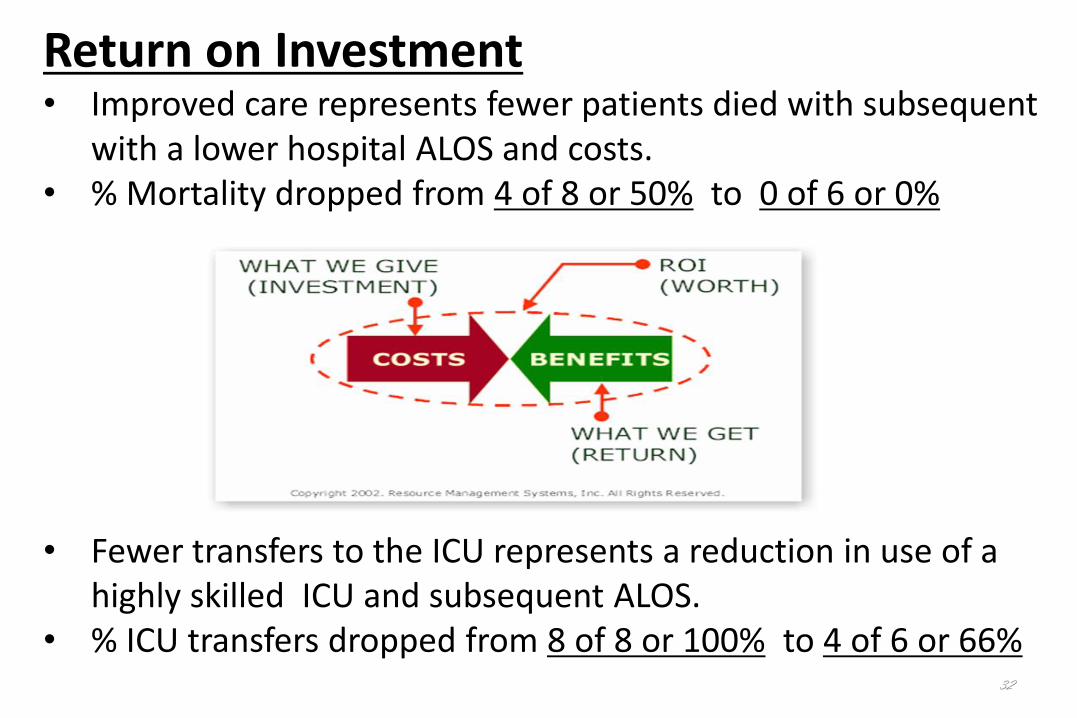
Return on Investment• Improved care represents fewer patients died with subsequent
with a lower hospital ALOS and costs.• % Mortality dropped from 4 of 8 or 50% to 0 of 6 or 0%
• Fewer transfers to the ICU represents a reduction in use of a highly skilled ICU and subsequent ALOS.
• % ICU transfers dropped from 8 of 8 or 100% to 4 of 6 or 66%

Return on Investment
33
% Mortality
LIVED n=4 DIED n=4 TOTAL POPULATION LIVED n=6 DIED n=0 TOTAL POPULATION
Hospital ALOS 31.3 16.5 23.9 10.7 0 10.7
Hospital Average Cost $41,264 $26,317 $33,790 $15,355 $0 $15,355
Total Hospital Days 125 66 191 64 0 64
Total Hospital Cost $165,058 $105,266 $270,324 $92,127 $0 $92,127
% ICU Transfers
ICU Days Non-ICU Days TOTAL POPULATION ICU Days Non-ICU Days TOTAL POPULATION
ALOS 11.4 12.5 23.9 3.3 7.3 10.7
Total Days 91 100 191 20 44 64
ROI on Sepsis Cases Pre-Intervention
4/8 or 50%
8/8 or 100%
Post-Intervention0/6 or 100%
4 of 6 or 66%

34