clin parasitology: united kingdom national quality...
TRANSCRIPT

9 Clin Pathol 1992;45:968-974
Parasitology: United Kingdom National QualityAssessment Scheme
M Hawthorne, P L Chiodini, J J S Snell, A H Moody, A Ramsay
AbstractAims:To assess the results from parasitol-ogy laboratories taking part in a qualityassessment scheme between 1986 and1991; and to compare performance withrepeat specimens.Methods: Quality assessment of bloodparasitology, including tissue parasites(n = 444; 358 UK, 86 overseas), and faecalparasitology, including extra-intestinalparasites (n = 205; 141 UK, 64 overseas),was performed.Results: Overall, the standard ofperform-ance was poor. A questionnaire distrib-uted to participants showed that a widerange ofmethods was used, some ofwhichwere considered inadequate to achievereliable results. Teaching material wasdistributed to participants from time totime in an attempt to improve standards.Conclusions: Since the closure of theIMLS feilowship course in 1972, feweropportunities for specialised training inparasitology are available: more trainingis needed. Poor performance in thedetection of malarial parasites is mainlyattributable to incorrect speciation, mis-identification, and lack ofequipment suchas an eyepiece graticule.
(7 Clin Pathol 1992;45:968-974)
(HTD). The parasitology of the immunocom-promised is also becoming increasingly impor-tant and not all laboratories may be preparedto tackle rare opportunistic infections.To help remedy these deficiencies, in 1986
QAL (then part of the (Division of Microbio-logical Reagents and Quality DMRQC)together with the Department of ClinicalParasitology, HTD, began to develop a qualityassessment control) scheme for parasitology.Two subschemes were established: blood para-sitology, including tissue parasites and faecalparasitology, including extra-intestinal para-sites. Objectives of the parasitology schemeswere to provide participants with a variety ofspecimen material to increase awareness andskills in this specialty, and to educate partici-pants through the production of teachingsheets describing unfamiliar parasites and con-taining recommendations for standardisedmethods.To facilitate access to specimen material and
specialised expertise, the day to day functionsof the scheme were located at HTD withadministrative support based at QAL. Dis-tributions began on a regular basis in January1987. Since June 1991, NEQAS parasitologyhas also regularly supplied blood films fordistribution by the NEQAS haematologyscheme to haematology departments.
Department ofParasitology, Hospitalfor Tropical Diseases,London NWl OPEM HawthorneP L ChiodiniA H MoodyA RamsayQuality AssuranceLaboratory, CentralPublic HealthLaboratory, Colindale,LondonJ J S SnellCorrespondence to:P L Chiodini
Accepted for publication6 April 1992
The United Kingdom National External Qual-ity Assessment Scheme for Microbiology(NEQAS), which covers many areas of micro-biology, has already been described.' 2 As partof this scheme, simulated specimens are
despatched to participants, who examine themand report their results to the Quality Assur-ance Laboratory (QAL). Before 1986 speci-mens containing parasites were occasionallydistributed as part of the general bacteriologyquality assessment scheme, there being noseparate subscheme for parasitology. Severalfactors, including retirement of pathology staffwho had gained considerable overseas experi-ence in former years, allied to diminishedoverseas experience of trainee pathologists andclosure of the IMLS fellowship course inparasitology in 1972, has led to the gradualdecline in the standard of diagnostic parasitol-ogy in the United Kingdom. This trend wasnoted through results from earlier NEQASdistributions, discussions with laboratory staffaround the country, an increase in misdiag-noses and more routine work being referred tothe Hospital for Tropical Diseases, London
MethodsPARTICIPANTSA total of 444 laboratories participate in thefaecal parasitology scheme of which 358 are inthe United Kingdom and 86 are overseas. Inthe blood parasitology scheme 205 laboratoriesparticipate, 141 from the United Kingdom and64 from overseas.The parasites distributed are shown in tables
1 to 4. Most material distributed was obtainedfrom patients with known infections and wasselected on the basis of the presence ofadequate numbers of parasites, with character-istic morphological features and sufficientquantities of specimen. Where naturally infec-ted material was not available, alternativesources were used. Trichomonas vaginalis tro-phozoites were cultured in TYl-S-33 medium3from which smears were prepared, dried, fixedin methanol and distributed unstained. Giardialamblia trophozoites were cultured similarly,fixed in formalin, and dispensed into phialsbefore distribution as a simulated jejunal fluid.Filariform larvae of Hookworm spp wereobtained by the Harada-Mori filter paper stripculture4' and Strongyloides stercoralis by char-
968
on 23 May 2018 by guest. P
rotected by copyright.http://jcp.bm
j.com/
J Clin P
athol: first published as 10.1136/jcp.45.11.968 on 1 Novem
ber 1992. Dow
nloaded from

0Qality assessment ofparasitology
Table 1 Single blood and tissue parasites distributed and participants' results
Specimen Nme i
Species
Plasmodium vivax
PIasmodium vivax
Plasmodium vtvax
Plasmodium vivax
Plasmodium malariae
Plasmodium malariae
PIasmodium malariae
Pllasmodium ovale
Plasmodium falciparum
Plasmodium falciparum*
Trypanosoma brucei sp
Trypanosoma brucei sp
Trypanosoma cruzi
Leishmania sp
Loa loa
Loa loa
Loa loa
Onchocerca volvulus
Number oflaboratories
80
116
119
138
83
113
137
111
84
127
103
125
125
134
110
117
133
122
Correct genus
species, and stage
44(55 0%)91(78-4%)93(78 2%)102(73'9%)55(66-3%)81(71-7%)99(72 3%)59(53'2%)66(78-6%)90(70'9%)40(38-8%)91(72 8%)97(77 6%)124(92 6%)54(49-1%)97(82 9%)72(54-1%)79(64 8%)
Correct genusonly
9(11-2%)7
(6 0%)3(2-5%)5(3-6%)10(12-0%)8
(7 0%)8
(5 8%)17(15-3%)7(8-3%)
61(59-2%)20(16-0%)18(14-4%)1
(0 7%)25t(22-7%)8t
(6 8%)15t(11-3%)lot(8 2%)
Incorrectspecies Unexpectedor stage parasite only None found
15(18-8%)9(7-8%)5 1(4-2%) (0 8%)17 2(12-3%) (1-5%)14 3(16-9%) (3-6%)13 7 3(11-5%) (6 2%) (2 7%)18 1 9(13-1%) (0-7%) (6 6%)31 1 1(27 9%) (0 9%) (0 9%)6(7-1%)1
(0-8%)2
(2 0%)10 1 2(8 0%) (0 8%) (1-6%)8(6-4%)
3(2 2%)23**(20'9%)12**(10-3%)36**(27-1%)
3 24**(2-4%) (19-7%)
5
(3 8%)8(7'3%)
10(7'5%)
Multiple parasites,genera, speciesor stages
12(15-0%)9(7-8%)17(14-3%)12(8 7%)1
(1-2%)1
(0 9%)2(1-5%)2(1-8%)5
(6 0%)36(28-3%)
(0 8%)2(1-6%)1
(0 7%)
6(4-9%)
*For identification only, not assessment of parasitaemia.** Includes incorrect identification of Microfilariae.The reporting of "Microfilariae present" has been considered equivalent to genus level identification.Specimen 2285 was a mixed sample containing llasmodium falciparum and Plasmodium vivax. The following results were obtained:18/140 laboratories (12-9%) reported correct genus, species, and stage; two of 140 laboratories (1-4%) reported correct genus only; nine of 140 laboratories(6'4%) reported incorrect species or stage; and 111 of 140 laboratories (79-3%) reported the presence of a single species only.Two negative samples (no parasites present) were distributed and the following results were obtained:specimen 1763: 93/96 laboratories (96-9%) reported no parasites present; three of 93 laboratories (3-1%) reported an unexpected parasite.specimen 2344: 134/139 laboratories (96 4%) reported no parasites present; five of 139 laboratories (3 6%) reported an unexpected parasite.
Table 2 Percentage parasitaemias of Plasmodium falkiparum and participants' results
Specimen Actual Number of laboratories % parasitaemia Number of laboratoriesnumber % parasitaemia (total examining) reported reporting result
1956 < 1% 107 < 2% 105(98 0%)
5-10% 2(2 0%)
1738 6-5% 109 < 45% 1(0 9%)
4-5-8-5% 41(37 6%)
8-6-10-0% 37(33-9%)
10-1-12 0% 7(6 4%)
12-0-15-0% 16(14-7%)
15-1-20-0% 4(3'7%)
> 20% 3(2 8%)
2323 23% 127 9-11% 1(0-8%)
15-17% 2(1-6%)
18-20% 7(5'5%)
21-25% 42(33-1%)
26-28% 24(18-9%)
29-31% 23(18-1%)
32-34% 7(5'5%)
35-37% 6(4'7%)
38-40% 10(7-9%)
>40% 5(3-9%)
number
1336
1686
1917
2256
1435
1957
2178
1628
1384
2363
1516
1976
1977
2201
1575
1847
2151
2370
969
on 23 May 2018 by guest. P
rotected by copyright.http://jcp.bm
j.com/
J Clin P
athol: first published as 10.1136/jcp.45.11.968 on 1 Novem
ber 1992. Dow
nloaded from

Hawthorne, Chiodini, Snell, Moody, Ramsay
Table 3 Single faecal parasites distributed and participants' results
Incorrect species, Multiple parasites,Specimen Number of Correct genus Correct genus stage, or partial Unexpected genera, speciesnumber Species laboratories species, and stage only identification parasite only None found or stages
Nematodes:1383 A
1599 A
1710 A
1955 A
1626
2368
1737
1514
2255
1600
Cestodes:1335
2369
1974
1474
1654
1941
1573
1916
2200
2406
Trematodes:
1433 i
1973 1
1546
1874
1684
1845
2284
1353
1846
2253
1975
Protozoa:1351
1382
1915
1475
1574
2321
1404
1547
1954
1972
1711
Coccidia:1434
1761
1875
2176
2362
Ascaris lumbricoides
Ascaris lumbricoides
Ascaris lumbricoides
Ascaris lumbricoides
Hookworm sp
Hookworm sp
Hookworm sp(filariform larvae)Strongyloides stercoralis(rhabditiform larvae)Strongyloides stercoralistt(filariform larvae)Enterobius vermicularis
Hymenolepis nana
Hymenolepis nana
Hymenolepis diminuta
Taenia sp
Taenia sp
Taenia sp
Echinococcus granulosus#
Echinococcus granulosus#
Echinococcus granulosus#
Echinococcus granulosus#
Fasciola hepatica
Fasciola hepatica
Clonorchis sinensis
Clonorchis sinensis
Schistosoma mansoni
Schistosoma mansoni
Schistosoma mansoni
338
340
343
330
341
343
342
327
321
339
314
343
342
326
345
324
339
322
351
339
331
329
340
344
343
342
354
Schistosoma haematobium## 325
Schistosoma haematobium## 342
Schistosoma haematobium## 354
Schistosoma mekongi 342
Entamoeba coli
Entamoeba histolytica
Entamoeba histolytica
Iodamoeba butschlii
Chilomastix mesnii
Chilomastix mesnili
Endolimax nana
Giardia lamblia(cysts)Giardia lamblia(cysts)Giardia lamblia(cysts)Giardia lamblia(trophozoites)
Cryptosporidium sp
Cryptosporidium sp
Cryptosporidium sp
Cryptosporidium sp
Cryptosporidium sp
326
337
321
326
340
336
323
340
330
329
343
318
340
340
348
336
258(76-3%)314(92-3%)333(97-1%)308(93-3%)325(95-3%)285(83-1%)180(52-6%)284(86-9%)127(39-6%)299(88-2%)
192(61-1%)258(75-3%)259(75-7%)299(91-7%)310(89-8%)284(87-8%)234(69-1%)301(93-5%)338(96-3%)312(92-0%)
177**(53-3%)290**(88-2%)325**(95-6%)335**(97-4%)309(90-1%)307(89-8%)297(83-9%)232(71-4%)303(88-6%)349(98-6%)280(81-9%)
229(70-3%)277(82-2%)272(84-7%)279(85-6%)235(69-1%)242(72-0%)189(58-5%)333(97-9%)308(93-3%)313(95-2%)300(87-5%)
286(89-9%)309(90-9%)309(90-9%)332(95-4%)321(95-5%)
(0-3%)
3(0-9%)17(5-0%)14(4-3%)116(36-1%)
14 4(4-5%) (1-3%)7 16(2-0%) (4-7%)13 22(3-8%) (6-4%)
1(0-3%)
2 7(0-6%) (2-0%)
3(0-9%)33(9-7%)3(0-9%)6(1-7%)18(5-3%)
4(1-2%)1(0-3%)
(0-3%)1(0-3%)
(0-3%)4(1.1%)
4(1-2%)
3(0-8%)
7 2(2-0%) (0-6%)
3(0-9%)
6 8(1-8%) (2-4%)3
(0-9%)
2(0-6%)
17(5-3%)
9(2-7%)5(1-5%)1(0-3%)5(1-5%)6(1-8%)6(1-7%)130t(38-0%)7(2-1%)38(11-8%)5(1-5%)
18(5-7%)7(2-0%)43(12-6%)11(3-4%)13(3-8%)27(8-3%)14(4-1%)5(1-6%)4(1-1%)6(1-8%)
17(5-1%)22(6-7%)9(2-6%)4(1-2%)
63(18-6%)15(4-4%)2(0-6%)15(4-6%)8(2-3%)23(6-7%)1(0-3%)16(14-9%)40(12-5%)35(10-3%)
32(10-2%)24(7-0%)5(1-5%)2(0-6%)2(0-6%)5(1-5%)57(16-8%)12(3-7%)3(0 9%)2(0-6%)
130(39-3%)7(2-1%)3(0-9%)
34(9-9%)
4 22(1-2%) (6-4%)6 27(1-7%) (7-6%)
92(28-3%)34(9-9%)2(0-6%)
24 13(7-0%) (3-8%)
3(0-9%)
5(1-5%)8 4(2-5%) (1-3%)8 7(2-5%) (2-1%)73 19(21-5%) (5-6%)47 30(14-0%) (8-9%)39 57(12-1%) (17-6%)1 5(0-3%) (1-5%)3 19(0-9%) (5-8%)6 6(1-8%) (1-8%)5 38(1-5%) (11-0%)
32(10-1%)31(9-1%)31(9-1%)
1 15(0-3%) (4-3%)
15(4-5%)
8(2-4%)6(1-8%)6(1-7%)2(0-6%)2(0-6%)26(7-6%)14(4-1%)6(1-8%)
54(17-2%)31(9-0%)
13(4-0%)11(3-2%)5(1-5%)1(0-3%)1(0-3%)
(0 3%)
7
(2-1%)6(1-8%)2(0-6%)5(1-4%)
7
(2-0%)19(5-4%)1(0-3%)1(0 3%)
16(4-7%)
91(27-9%)41(12-1%)34(10-6%)30(9-2%)13(3-8%)17(5-1%)21(6-5%)1(0-3%)
4(1-2%)
*Some non-faecal parasites included. **Includes visually indistinguishable ova. tMost reports stated Strongyloides stercoralis (misidentification). ttSputum samplecontaining filariform larvae of Strongyloides stercoralis. #Hydatid cyst fluid samples. ##Terminal urine samples. NB: From specimen 2150 onwards, incorrectreporting of stages present was penalised in scoring.
970
on 23 May 2018 by guest. P
rotected by copyright.http://jcp.bm
j.com/
J Clin P
athol: first published as 10.1136/jcp.45.11.968 on 1 Novem
ber 1992. Dow
nloaded from
Quality assessment ofparasitology
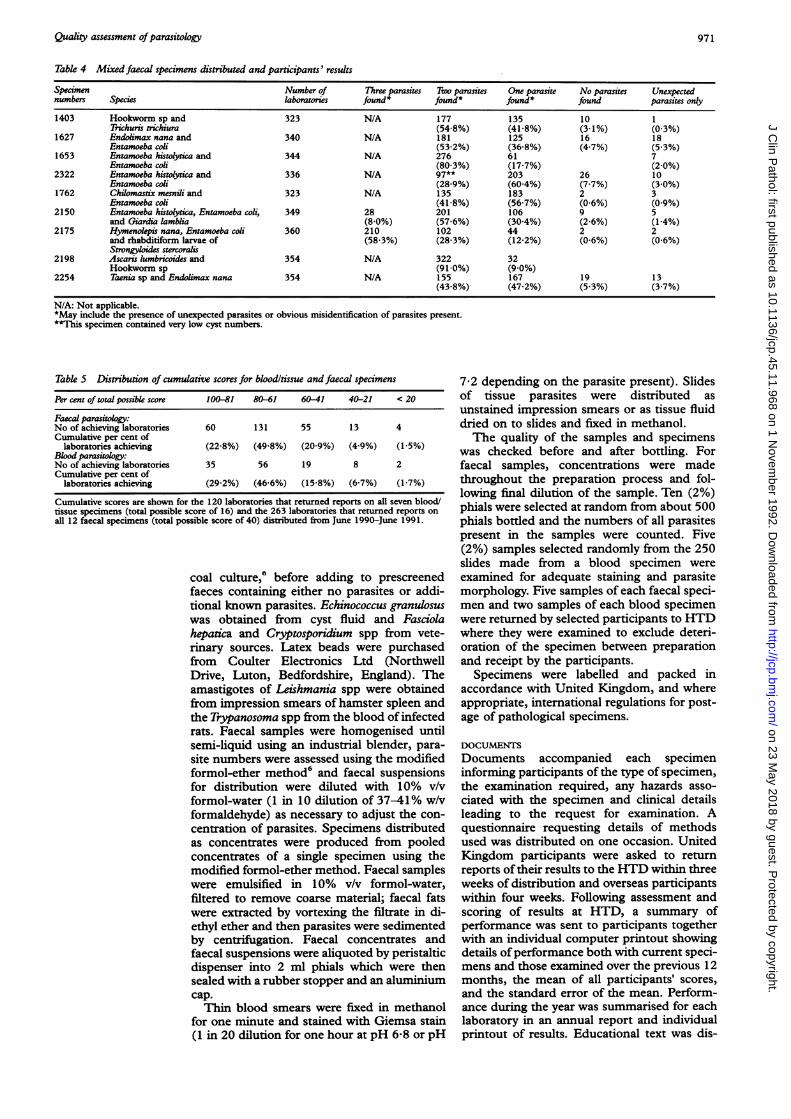
Table 4 Mixed faecal specimens distributed and participants' results
Specimen Number of Three parasites Two parasites One parasite No parasites Unexpectednumbers Species laboratories found* found* found* found parasites only
1403 Hookworm sp and 323 N/A 177 135 10 1Trichuris trichiura (54-8%) (41-8%) (3-1%) (0-3%)
1627 Endolimax nana and 340 N/A 181 125 16 18Entamoeba coli (53-2%) (36-8%) (4-7%) (5-3%)
1653 Entamoeba histolytica and 344 N/A 276 61 7Entamoeba coli (80-3%) (17-7%) (2-0%)
2322 Entamoeba histolytica and 336 N/A 97** 203 26 10Entamoeba coli (28-9%) (60-4%) (7-7%) (3-0%)
1762 Chilomastix mesnii and 323 N/A 135 183 2 3Entamoeba coli (41-8%) (56-7%) (0-6%) (0-9%)
2150 Entamoeba histolytica, Entamoeba coli, 349 28 201 106 9 5and Giardia lamblia (8-0%) (57-6%) (30-4%) (2-6%) (1-4%)
2175 Hymenokpis nana, Entamoeba coli 360 210 102 44 2 2and rhabditiform larvae of (58-3%) (28-3%) (12-2%) (0-6%) (0-6%)Strongyloides stercoralis
2198 Ascaris lumbricoides and 354 N/A 322 32Hookworm sp (91-0%) (9-0%)
2254 Taenia sp and Endolimax nana 354 N/A 155 167 19 13(43-8%) (47-2%) (5-3%) (3-7%)
N/A: Not applicable.*May include the presence of unexpected parasites or obvious misidentification of parasites present.**This specimen contained very low cyst numbers.
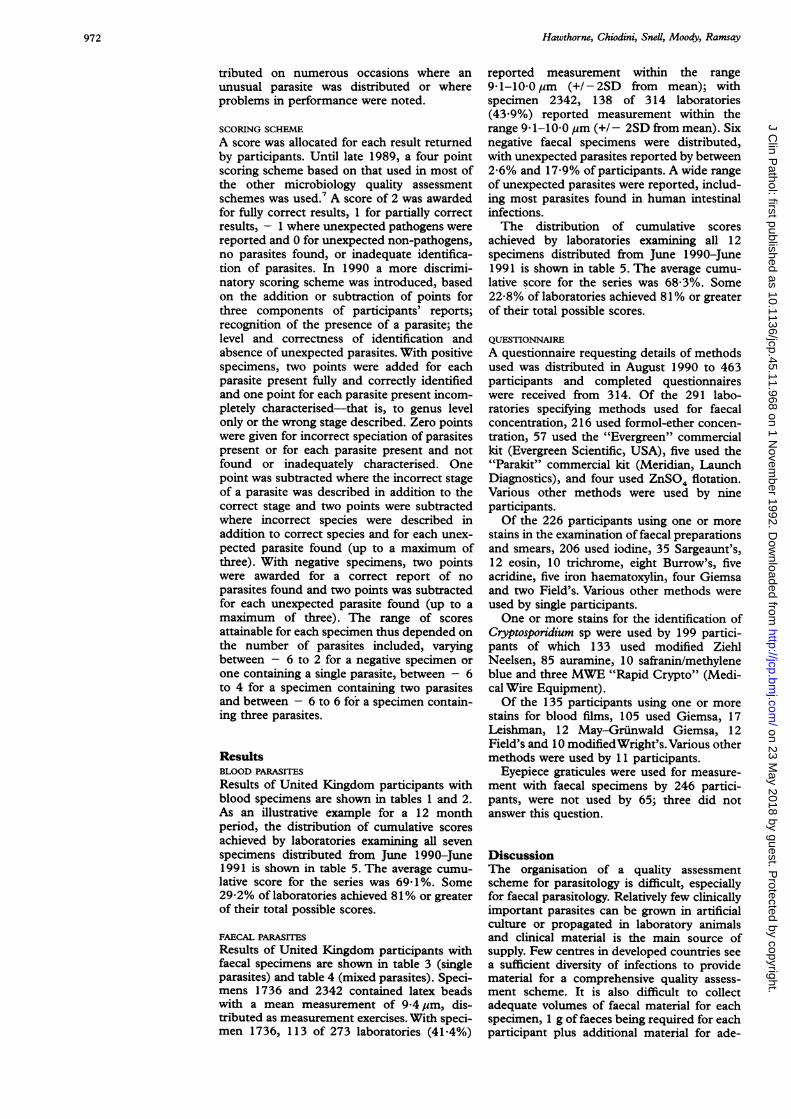
Table 5 Distribution of cumulative scores for bloodltissue and faecal specimens
Per cent of total possible score 100-81 80-61 60-41 40-21 <20
Faecal parasitology:No of achieving laboratories 60 131 55 13 4Cumulative per cent of
laboratories achieving (22-8%) (49-8%) (20-9%) (4-9%) (1-5%)Blood parasitology:No of achieving laboratories 35 56 19 8 2Cumulative per cent of
laboratories achieving (29-2%) (46-6%) (15-8%) (6-7%) (1-7%)
Cumulative scores are shown for the 120 laboratories that returned reports on all seven blood/tissue specimens (total possible score of 16) and the 263 laboratories that returned reports onall 12 faecal specimens (total possible score of 40) distributed from June 1990-June 1991.
coal culture,6 before adding to prescreenedfaeces containing either no parasites or addi-tional known parasites. Echinococcus granulosuswas obtained from cyst fluid and Fasciolahepatica and Cryptosporidium spp from vete-rinary sources. Latex beads were purchasedfrom Coulter Electronics Ltd (NorthwellDrive, Luton, Bedfordshire, England). Theamastigotes of Leishmania spp were obtainedfrom impression smears of hamster spleen andthe Trypanosoma spp from the blood of infectedrats. Faecal samples were homogenised untilsemi-liquid using an industrial blender, para-site numbers were assessed using the modifiedformol-ether method6 and faecal suspensionsfor distribution were diluted with 10% v/vformol-water (1 in 10 dilution of 37-41% w/vformaldehyde) as necessary to adjust the con-centration of parasites. Specimens distributedas concentrates were produced from pooledconcentrates of a single specimen using themodified formol-ether method. Faecal sampleswere emulsified in 10% v/v formol-water,filtered to remove coarse material; faecal fatswere extracted by vortexing the filtrate in di-ethyl ether and then parasites were sedimentedby centrifugation. Faecal concentrates andfaecal suspensions were aliquoted by peristalticdispenser into 2 ml phials which were thensealed with a rubber stopper and an aluminiumcap.Thin blood smears were fixed in methanol
for one minute and stained with Giemsa stain(1 in 20 dilution for one hour at pH 6-8 or pH
7-2 depending on the parasite present). Slidesof tissue parasites were distributed asunstained impression smears or as tissue fluiddried on to slides and fixed in methanol.The quality of the samples and specimens
was checked before and after bottling. Forfaecal samples, concentrations were madethroughout the preparation process and fol-lowing final dilution of the sample. Ten (2%)phials were selected at random from about 500phials bottled and the numbers of all parasitespresent in the samples were counted. Five(2%) samples selected randomly from the 250slides made from a blood specimen wereexamined for adequate staining and parasitemorphology. Five samples of each faecal speci-men and two samples of each blood specimenwere returned by selected participants to HTDwhere they were examined to exclude deteri-oration of the specimen between preparationand receipt by the participants.Specimens were labelled and packed in
accordance with United Kingdom, and whereappropriate, international regulations for post-age of pathological specimens.
DOCUMENTSDocuments accompanied each specimeninforming participants of the type of specimen,the examination required, any hazards asso-ciated with the specimen and clinical detailsleading to the request for examination. Aquestionnaire requesting details of methodsused was distributed on one occasion. UnitedKingdom participants were asked to returnreports of their results to the HTD within threeweeks of distribution and overseas participantswithin four weeks. Following assessment andscoring of results at HTD, a summary ofperformance was sent to participants togetherwith an individual computer printout showingdetails of performance both with current speci-mens and those examined over the previous 12months, the mean of all participants' scores,and the standard error of the mean. Perform-ance during the year was summarised for eachlaboratory in an annual report and individualprintout of results. Educational text was dis-
971
on 23 May 2018 by guest. P
rotected by copyright.http://jcp.bm
j.com/
J Clin P
athol: first published as 10.1136/jcp.45.11.968 on 1 Novem
ber 1992. Dow
nloaded from
Hawthorne, Chiodini, Snell, Moody, Ramsay
tributed on numerous occasions where anunusual parasite was distributed or whereproblems in performance were noted.
SCORING SCHEMEA score was allocated for each result returnedby participants. Until late 1989, a four pointscoring scheme based on that used in most ofthe other microbiology quality assessmentschemes was used.7 A score of 2 was awardedfor fully correct results, 1 for partially correctresults, - 1 where unexpected pathogens werereported and 0 for unexpected non-pathogens,no parasites found, or inadequate identifica-tion of parasites. In 1990 a more discrimi-natory scoring scheme was introduced, basedon the addition or subtraction of points forthree components of participants' reports;recognition of the presence of a parasite; thelevel and correctness of identification andabsence of unexpected parasites. With positivespecimens, two points were added for eachparasite present fully and correctly identifiedand one point for each parasite present incom-pletely characterised that is, to genus levelonly or the wrong stage described. Zero pointswere given for incorrect speciation of parasitespresent or for each parasite present and notfound or inadequately characterised. Onepoint was subtracted where the incorrect stageof a parasite was described in addition to thecorrect stage and two points were subtractedwhere incorrect species were described inaddition to correct species and for each unex-pected parasite found (up to a maximum ofthree). With negative specimens, two pointswere awarded for a correct report of noparasites found and two points was subtractedfor each unexpected parasite found (up to amaximum of three). The range of scoresattainable for each specimen thus depended onthe number of parasites included, varyingbetween - 6 to 2 for a negative specimen orone containing a single parasite, between - 6to 4 for a specimen containing two parasitesand between - 6 to 6 for a specimen contain-ing three parasites.
ResultsBLOOD PARASITESResults of United Kingdom participants withblood specimens are shown in tables 1 and 2.As an illustrative example for a 12 monthperiod, the distribution of cumulative scoresachieved by laboratories examining all sevenspecimens distributed from June 1990-June1991 is shown in table 5. The average cumu-lative score for the series was 69-1%. Some29-2% of laboratories achieved 81% or greaterof their total possible scores.
FAECAL PARASITESResults of United Kingdom participants withfaecal specimens are shown in table 3 (singleparasites) and table 4 (mixed parasites). Speci-mens 1736 and 2342 contained latex beadswith a mean measurement of 9-4 pm, dis-tributed as measurement exercises. With speci-men 1736, 113 of 273 laboratories (41-4%)
reported measurement within the range9 1-10 0,um (+/-2SD from mean); withspecimen 2342, 138 of 314 laboratories(43 9%) reported measurement within therange 9 1-10 0 pm (+/- 2SD from mean). Sixnegative faecal specimens were distributed,with unexpected parasites reported by between2-6% and 17-9% of participants. A wide rangeof unexpected parasites were reported, includ-ing most parasites found in human intestinalinfections.The distribution of cumulative scores
achieved by laboratories examining all 12specimens distributed from June 1990-June1991 is shown in table 5. The average cumu-lative score for the series was 68-3%. Some22-8% of laboratories achieved 81% or greaterof their total possible scores.
QUESTIONNAIREA questionnaire requesting details of methodsused was distributed in August 1990 to 463participants and completed questionnaireswere received from 314. Of the 291 labo-ratories specifying methods used for faecalconcentration, 216 used formol-ether concen-tration, 57 used the "Evergreen" commercialkit (Evergreen Scientific, USA), five used the"Parakit" commercial kit (Meridian, LaunchDiagnostics), and four used ZnSO4 flotation.Various other methods were used by nineparticipants.Of the 226 participants using one or more
stains in the examination of faecal preparationsand smears, 206 used iodine, 35 Sargeaunt's,12 eosin, 10 trichrome, eight Burrow's, fiveacridine, five iron haematoxylin, four Giemsaand two Field's. Various other methods wereused by single participants.One or more stains for the identification of
Cryptosporidium sp were used by 199 partici-pants of which 133 used modified ZiehlNeelsen, 85 auramine, 10 safranin/methyleneblue and three MWE "Rapid Crypto" (Medi-cal Wire Equipment).Of the 135 participants using one or more
stains for blood films, 105 used Giemsa, 17Leishman, 12 May-Grunwald Giemsa, 12Field's and 10 modifiedWright's. Various othermethods were used by 11 participants.
Eyepiece graticules were used for measure-ment with faecal specimens by 246 partici-pants, were not used by 65; three did notanswer this question.
DiscussionThe organisation of a quality assessmentscheme for parasitology is difficult, especiallyfor faecal parasitology. Relatively few clinicallyimportant parasites can be grown in artificialculture or propagated in laboratory animalsand clinical material is the main source ofsupply. Few centres in developed countries seea sufficient diversity of infections to providematerial for a comprehensive quality assess-ment scheme. It is also difficult to collectadequate volumes of faecal material for eachspecimen, 1 g of faeces being required for eachparticipant plus additional material for ade-
972
on 23 May 2018 by guest. P
rotected by copyright.http://jcp.bm
j.com/
J Clin P
athol: first published as 10.1136/jcp.45.11.968 on 1 Novem
ber 1992. Dow
nloaded from

Quality assessment ofparasitology
quate quality control and for providing repeatspecimens to participants failing with the first.Such quantities of material are easiest tocollect from inpatients with the active collab-oration of ward staff. Increasingly parasiticinfections are treated in the outpatient depart-ment, which aggravates the problem of supply,as does the growth of the scheme, both in thenumbers of participants and in associatedteaching activities. For these reasons, it hasbeen found necessary to undertake periodicvisits to the tropics to collect material for use inthe scheme.
Other problems are inherent in the use ofbiological material. It is difficult to ensureconsistency of numbers of parasites betweenphials, particularly where multiple parasites orlow numbers are included. Semi-liquificationof the sample, thorough blending, and mixingduring bottling reduce sample variation.Shortage of clinical material precludes theinclusion of "text book" examples of parasiteson every occasion, and some degenerationduring transport may further alter morpho-logical features, although examination by theHTD of duplicate samples returned throughthe post controlled this possibility. Judgementis required to ensure that in spite of thesefactors the morphological features of parasitesdistributed are representative of those encoun-tered in the often less than ideal specimens inthe clinical laboratory. As well as potentiallycausing heterogeneity within a single speci-men,variation among specimens can also com-plicate comparison of participants' results withparasites distributed repeatedly. To overcomethis problem, where sufficient material is avail-able and where parasites are stable on storage,a sample is divided into quantities sufficient fortwo or more distributions. The absence of verylow numbers of parasites other than those seenin the organising laboratory is impossible toguarantee because there is a limit to thevolume of sample that can be screened. How-ever, participants' reporting of unexpectedparasites in terms of numbers and variety wasfar greater than could be attributed to inade-quate pre-distribution screening. Performancewith negative specimens has shown somevariation (table 1) in the numbers of partici-pants reporting the presence of unexpectedparasites, probably due to differences in thecontent of undigested elements (such as fruitfibres, cellulose, and meat fibres), leading tomisidentification as ova and larvae. The report-ing of unexpected parasites in positive samplescontaining parasites may be caused by mis-identifications of artefacts or of the parasitespresent (table 3). Several of the specimenslisted in table 3 show high numbers of partici-pants reporting the presence of unexpectedparasites-for example, specimen 1404(12-1%), specimen 1574 (21-5%), specimen1737 (380%), specimen 1974 (1296%) andspecimen 2255 (1 1-8%). In most cases this isdue to confusion of the actual species present,whether ova or cysts, with another species ofsimilar appearance and size. Although partici-pants were invited to submit photomicro-graphs in support of such findings, this was
rarely done.Scoring of participants' results is useful in
assessing overall standards of performancewith time, and in providing participants with ameasure of their individual performance com-pared with their peers. This has proved moredifficult than in other areas of microbiologybecause of the complexity of possible combina-tions of response in terms of numbers of actualparasites present, unexpected parasites repor-ted, and the level of identification made. It israre to find single parasites in clinical speci-mens and to reflect this, quality assurancespecimens contained up to three parasites.Identification ofmost parasites relies mainly oncorrect morphological identification and speci-ation is necessary to confirm or excludepathogenicity. For this reason, unlike othermicrobiology subschemes, speciation of non-pathogens is required to obtain a full score.The four point scoring scheme used for mostother microbiology subschemes lacked ade-quate discrimination; the scheme adopted forparasitology allowed more logical scoring andprovided a more objective measure of perform-ance. It is, however, more confusing for partici-pants since the maximum score attainable isnot constant, varying between 2 and 6,depending on the numbers of parasites presentin the specimen.The scoring scheme at presentlacks a penalty for incorrect answers whichcould lead to clinical catastrophe, as forexample, misdiagnosis of a Plasmodium falci-parum infection.The overall standard of performance with
these quality assessment specimens varied. Atbest, success rates of between 90-99 % ofparticipants achieving full scores with somespecimens comparing favourably with many ofthe other microbiology subschemes. However,there are considerable variations in successrates where parasites have been repeatedlydistributed on separate occasions (tables 1 to4). These differences may reflect variationsbetween specimens such as the number ofspecies of parasites present, the variable quan-tity of each species present, and the state ofdegeneration. Comparison between specimensis further complicated by changes in thescoring scheme introduced in June 1990 and aconcurrent change from faecal concentrates tofaecal suspensions.A noticeable drop in performance was noted
with repeated distribution of a mixture con-taining cysts of Entamoeba coli and Entamoebahistolytica (table 4). The initial sample (1653)was distributed as a faecal concentrate contain-ing moderate numbers of cysts from bothspecies and 80-3% of participants reported afully correct result. The second sample (2322)was distributed as a faecal suspension for aconcentration containing very low numbers ofcysts, with only 28-9% of participants report-ing a fully correct result. This much poorerperformance could possibly be attributed toinadequate concentration of the sample or afailure fully to examine the entire sample.
Repeated distribution of less commonlyencountered species has resulted in an encour-aging trend towards improved performance.
973
on 23 May 2018 by guest. P
rotected by copyright.http://jcp.bm
j.com/
J Clin P
athol: first published as 10.1136/jcp.45.11.968 on 1 Novem
ber 1992. Dow
nloaded from

Hawthorne, Chiodini, Snell, Moody, Ramsay
For example, the percentages of laboratoriesachieving fully correct results in successivedistributions were, for Hymenolepis nana,61 1% and 75 3%; for Fasciola hepatica, 53 3%and 88-2%; and for Schistosoma haematobium,71-4%, 88-6%, and 98-6% (table 3).A sputum sample containing filariform lar-
vae of Strongyloides stercoralis was distributed as
specimen 2255 (table 3). Fully correct resultswere achieved by 39-6% of participants. Thesample also contained some yeasts which weremisidentified as Pneumocystis carinii by 29 of 38(78-3%) of laboratories reporting unexpectedparasites. Extensive testing of-the sputumsample prior to distribution showed no evi-dence of P carinii.Poor performance of detection of malarial
parasites is mainly attributable to incorrectspeciation, description of the wrong stages ofparasites, and diagnosis of a mixed Plasmodiuminfection when only one species- is present.Incorrect speciation occurs through lack offamiliarity with species differences such asinfected cell size and shape, parasite appear-ance within the cell, pigment characteristics,presence or absence of Maurer's clefts or
Schuffner's dots and poor knowledge of thegeographical distribution of species. Unex-pected parasites reported in a sample contain-ing malarial parasites are often the result ofmisidentification of artefacts and stainingdeposit or identifying exflagellating gameto-cytes as Trypanasoma sp or Borrelia sp. Theerror in estimation of percentage parasitaemiasof P falciparum infections appears greatestwhen high numbers of parasites are present,with the poorest performance noted withspecimen 2323 (23% parasitaemia) (table 2).-!This could be due to laboratories using inap-propriate methods of estimation such as count-ing more than one parasite per infected cell.
Microfilariae are poorly speciated by partici-pants. Clinical details accompanying speci-mens aim to aid participants in their finaldiagnosis of the species present. In most casesa misidentification within the group of micro-filariae cannot be considered an incorrectspeciation as most genera of microfilariaecontain only one species. Unexpected parasitesreported with microfilariae samples (table 1)usually represent misidentification of themicrofilariae present, rather than the reportingof unrelated unexpected parasites, such as
specimen 2151, where 27-1 % (36 of 133) ofparticipants reported unexpected parasites andother microfilariae accounted for 88-9%(32/36) of these reports.
Distributions of latex beads for measure-ment showed that as many as 20% of partici-pants receiving faecal distributions did notpossess an eyepiece graticule and were unableto perform measurements. This is a seriousconcern as measurement is essential for accu-rate diagnosis and differentiation of parasiteova and cysts. The wide range of measure-ments reported indicated that graticules in use
by some participants may have been incor-rectly calibrated. Results from the question-naire showed a variation in methods used forfaecal concentration. The method recommen-
ded by the Department of Clinical Parasitologyat HTD is modified formol-ether concentra-tion.' The use of gauze for the filtration ofcoarse material from faecal samples is inap-propriate as parasites, especially ova, can beretained on its surface and wire mesh shouldbe used. The samples of faecal suspension wereintended for concentration, using the entiresample provided. All statistical data providedby QAL are based on the average numbers ofparasites present in one phial of sample. Thoseparticipants who did not follow the instruc-tions and divided a sample into several aliquotsor treated the specimen as a pre-preparedfaecal concentrate performed poorly as aresult. Laboratories achieving incorrect resultsare encouraged to obtain repeat samples toinvestigate problems. Further assistanceregarding technical matters is available fromthe Department of Clinical Parasitology,HTD. A mechanism for offering advice andhelp to poorly performing laboratories throughthe Advisory Panel for Microbiology2 wasintroduced in July 1991.
Since the closure of the IMLS fellowshipcourse in 1972, there have been fewer oppor-tunities for specialised training in parasitology.This problem has been addressed in part byshort courses in blood and intestinal parasitol-ogy held at Paddington College (Polytechnic ofCentral London), but these courses are over-subscribed and accessible to only a smallnumber of participants. Other short coursesare also available at the London and LiverpoolSchools of Tropical Medicine and a part timeMSc course in clinical parasitology is nowoffered by the Royal Free Hospital School ofMedicine together with the London School ofHygiene and Tropical Medicine. There arecurrently plans to introduce, as part of thequality assessment scheme, an expandedteaching programme, offering greater accessi-bility to teaching for all participants. It ishoped to achieve this by running seminars inblood and intestinal parasitology at regularintervals in various locations throughout theUnited Kingdom.The parasitology schemes aim to offer an
interesting and challenging programme ofassessment and teaching, and it is hoped thatlaboratories' knowledge, confidence, and inter-est in parasitology will continue to grow.
1 Snell JJS, de Mello JV, Gardner PS. The United Kingdomnational external microbiological quality assessmentscheme. J Clin Pathol 1982;35:82-93.
2 Snell JJS. United Kingdom National external microbio-logical quality assessment scheme for Microbiology. Eur3tClin Microbiol 1985;4:464-7.
3 Diamond LS, Harlow DR, Cunnick CC. A new medium forthe axenic cultivation of Entamoeba histolytica and otherEntamoeba. Trans R Soc Trop Hygiene 1978;74:431-2.
4 Harada Y, Mori 0. A new method for culturing hookworm.YonagoActa Med 1955;1:177-9.
5 Hsieh HC. A test-tube filter-paper method for the diagnosisof Ancylostoma duodenale, Necator americanus andStrongyloides stercoralis. WHO Technical Report Series255:27-30.
6 Garcia LS, Ash LR Diagnostic parasitology clinical laboratorymanual. 2nd ed. St Louis: CV Mosby, 1979:27.
7 Allen AVH, Ridley DS. Further observations on the formol-ether concentration technique for faecal parasites. J ClinPathol 1970;23:545-6.
8 Snell JJS, de Mello J, Phua TJ. Errors in bacteriologicaltechniques: results from United Kingdom national exter-nal quality assessment scheme for microbiology. Med LabSci 1986;43:344-5.
974
on 23 May 2018 by guest. P
rotected by copyright.http://jcp.bm
j.com/
J Clin P
athol: first published as 10.1136/jcp.45.11.968 on 1 Novem
ber 1992. Dow
nloaded from