climate services for marine applications in europe
TRANSCRIPT

General rights Copyright and moral rights for the publications made accessible in the public portal are retained by the authors and/or other copyright owners and it is a condition of accessing publications that users recognise and abide by the legal requirements associated with these rights.
Users may download and print one copy of any publication from the public portal for the purpose of private study or research.
You may not further distribute the material or use it for any profit-making activity or commercial gain
You may freely distribute the URL identifying the publication in the public portal If you believe that this document breaches copyright please contact us providing details, and we will remove access to the work immediately and investigate your claim.
Downloaded from orbit.dtu.dk on: Mar 24, 2022
Climate services for marine applications in Europe
Weisse, Ralf; Bisling, Peter; Gaslikova, Lidia; Geyer, Beate; Groll, Nikolaus; Hortamani, Mahboubeh;Matthias, Volker; Maneke, Moritz; Meinke, Insa; Meyer, Elke MITotal number of authors:14
Published in:Earth Perspectives
Link to article, DOI:10.1186/s40322-015-0029-0
Publication date:2015
Document VersionPublisher's PDF, also known as Version of record
Link back to DTU Orbit
Citation (APA):Weisse, R., Bisling, P., Gaslikova, L., Geyer, B., Groll, N., Hortamani, M., Matthias, V., Maneke, M., Meinke, I.,Meyer, E. MI., Schwichtenberg, F., Stempinski, F., Wiese, F., & Wöckner-Kluwe, K. (2015). Climate services formarine applications in Europe. Earth Perspectives, 2(1), 1-14. https://doi.org/10.1186/s40322-015-0029-0

Weisse et al. Earth Perspectives (2015) 2:3 DOI 10.1186/s40322-015-0029-0
RESEARCH ARTICLE Open Access
Climate services for marine applications inEuropeRalf Weisse1*, Peter Bisling1, Lidia Gaslikova1, Beate Geyer1, Nikolaus Groll1, Mahboubeh Hortamani2,Volker Matthias1, Moritz Maneke1, Insa Meinke1, Elke MI Meyer1, Fabian Schwichtenberg1,Florian Stempinski2, Frauke Wiese3 and Katja Wöckner-Kluwe4
Abstract
The term “climate services” is commonly used to refer to the generation of climate information, their transformationaccording to user needs and the subsequent use of the information in decision making processes. More generally, theconcept also involves contextualization of information and knowledge. In the following a series of examples from themarine sector is described covering the generation, transformation and the use of climate information in decisionmaking processes while contextualization is not considered. Examples comprise applications from naval architecture,offshore wind and more generally renewable energies, shipping emissions, and tidal basin water exchange andeutrophication levels. Moreover effects of climate change on coastal flood damages and the need for coastalprotection are considered. Based on the analysis of these examples it is concluded that reliable climate information indata sparse regions is urgently needed, that for many applications historical climate information may be as or evenmore important as future long-term projections, and that the specific needs of different sectors substantially dependon their planning horizons.
Keywords: Climate service; North Sea; Hindcast; Naval architecture; Ship emissions; Offshore wind; Renewableenergies; Coastal protection
IntroductionThe need to provide climate information to society hasbeen recognized for many decades of years. For exam-ple, the first World Climate Conference held in 1979 bythe World Meteorological Organization called for estab-lishing a World Climate Programme with the objectiveto improve our understanding of the climate system andits impacts on society (Vaughan and Dessai 2014). Morerecently, the phrase climate services became more com-mon to describe user-oriented approaches to make cli-mate information available.So far, there appears to be no generally accepted def-
inition of what constitutes a climate service. A rathercomprehensive and general definition was providedrecently by Vaughan and Dessai (2014) who referto climate services as the “generation, provision, and
*Correspondence: [email protected] Geesthacht, Center for Materials and Coastal Research,Max-Planck-Str. 1, 21502 Geesthacht, GermanyFull list of author information is available at the end of the article
contextualization of information and knowledge derivedfrom climate research for decision making at alllevels of society” targeted mainly “at informing adap-tation to climate variability and change”. According toVaughan and Dessai (2014) the objective of climateservices is “to provide people and organizations withtimely, tailored climate-related knowledge and infor-mation that they can use to reduce climate-relatedlosses and enhance benefits”. The process involves arange of different actors. Among them, the most crucialones are the climate service providers who supply cli-mate information and knowledge, and the climate ser-vice users who employ this information and knowledgefor their decision making and who may or may notbe involved in the development of the service itself(Vaughan and Dessai 2014).In recent years the concept of climate services has
received considerable attention, mainly as a central issueembedded in national or regional adaptation agendas. Forexample, the national German Strategy for Adaptation to
© 2015 Weisse et al.; licensee Springer. This is an Open Access article distributed under the terms of the Creative CommonsAttribution License (http://creativecommons.org/licenses/by/4.0), which permits unrestricted use, distribution, and reproductionin any medium, provided the original work is properly credited.
Weisse et al. Earth Perspectives (2015) 2:3 Page 2 of 14
Climate Change adopted by the German Federal Cabinetemphasizes the creation of a German Climate ServiceCenter focusing on “networking and coordinating func-tion in the field of evaluating and preparing climatescenario and model data, and disseminating them inthe form of suitable data products and advisory ser-vices” (Federal Ministry for the Environment, NatureConservation, Building and Nuclear Safety 2008). As such,the focus of most climate services is mostly on long-term projections and partly on decadal forecasts, whilehistorical information has received less attention.In this paper we bring together climate service providers
and users and discuss their experiences and needs. Wedemonstrate, by means of a range of user examples, thathistorical climate information is often as important asfuture projections and should receive more attention infuture frameworks for climate services. In particular, weconcentrate on climate services for marine applicationsin Europe for which we have a long experience (see e.g.Weisse et al. 2009). In the next section we briefly describethe coastDat-2 met-ocean data base that provides thebasic source of climate information provided to the users.Next we discuss specific examples from the users of theclimate service. This comprises examples from marineindustry such as offshore wind or naval architecture butalso more general cases such as ship-emissions or tidalbasin water exchange. Both, examples using historical cli-mate information and long-term climate projections areprovided. Finally our findings are summarized and dis-cussed and some key conclusions from our cooperationwith climate service users are provided.
The coastDat-2 met-ocean data baseStatistics of marine environmental conditions are neededby a variety of climate service users comprising marinescientists as well as providers of commercial near-shoreand offshore activities. The basis for deriving such statis-tics is reliable, consistent and homogeneous long-termdata. For marine areas, such data are often unavailable forvarious reasons: In many cases observational records aretoo short to cover the full spectrum of time scales. In somecases, sampling in space and time is insufficient or datafor the parameters of interest are unavailable. For exam-ple, within the North Sea (often referred to as one of themost densely monitored continental shelf seas) the num-ber of sea surface temperature measurements per yeardecreases rapidly with increasing distance from the coast(e.g. Loewe et al. 2002) leaving vast offshore areas thatare hardly monitored at all. When other parameters suchas wave heights or wave periods are considered the sit-uation is often worse as long-term measurements at asite are usually not launched before the site was selectedfor example, for commercial development. At the timewhen statistical analyzes are needed to further develop the
site, the length of the observational record is too short tocover the full range of variability and the record is henceunsuited as a basis for reliable statistics. In cases wherelonger records do exist, they are often not homogeneous;that is, technical changes, for example in measurementtechniques, exist and may introduce artificial variabilityor spurious trends in the data (for a discussion see e.g.Weisse and von Storch 2009). The coastDat approach wasdeveloped to address such problems.In the following we limit ourselves to a brief description
and discussion of the core simulations and data avail-able from the coastDat-2 data base that is the successorof coastDat-1 (Weisse et al. 2009). The core simulationsmost frequently used for marine climate services arethe consistent wind, waves and tide-surge hindcasts thatare complemented by corresponding long-term climatechange projections.We further only concentrate on exam-ples for the North Sea for which the longest experience inproviding climate services to users exists.The coastDat-2 data set is based upon the National
Centers for Environmental Prediction-National Centerfor Atmospheric Research (NCEP-NCAR) global reanal-ysis (Kalnay et al. 1996) that was used in combinationwith a spectral nudging technique (von Storch et al.2000) to first drive a regional atmosphere model for anarea covering most of Europe and the adjacent seas.The atmospheric model used was the COSMO modelin CLimate Mode (COSMO-CLM) version 4.8_clm11(Baldauf et al. 2011; Rockel et al. 2008; Steppeler et al.2003) which is a non-hydrostatic operational weather pre-diction model that is developed and applied by a numberof national weather services affiliated in the COnsortiumfor SMall-scale MOdeling (COSMO). The climate modeof this model is developed and applied by the ClimateLimited-area Modelling Community (The CLM commu-nity 2007-2015). For coastDat-2, the model was run at aspatial resolution of about 24 km × 24 km to hindcast theperiod 1948-2014 (Geyer 2014).From the atmospheric simulation, near-surface marine
wind fields and atmospheric sea level pressure wereused to drive high-resolution wave and tide-surge mod-els. For the waves, the most recent release of the wavemodel WAM (WAM 4.5.3) (WAMDI-Group 1988) wasused. The model was run in a nested mode with acoarse grid (approximately 50 km × 50 km) coveringmost of the Northeast Atlantic and a fine grid (about5.5 km × 5.5 km) covering the North Sea. For tide-surgesa 2D version of TRIM-NP (Kapitza 2008) was used, anested non-hydrostatic shelf sea model with spatial reso-lutions increasing from 12.8 km × 12.8 km in the NorthAtlantic to 1.6 km × 1.6 km in the German Bight. Tideswere included in the simulation by forcing the modelwith amplitudes and phases from a global tidal data set(Lyard et al. 2006). For all simulations, full model output

Weisse et al. Earth Perspectives (2015) 2:3 Page 3 of 14
was stored every hour providing a high-resolution (inspace and time) met-ocean data base that is continuouslyextended and updated.For the first version of coastDat validation is extensively
described in the peer-reviewed literature. For example,Weisse et al. (2005) compared wind speed percentiles andstorm counts derived from North Sea station data withdata obtained from coastDat-1 and generally found a goodagreement for both, average conditions and variability.Similar results for tide-surges and wind waves are inferredand described inWeisse and Pluess (2006) andWeisse andGünther (2007). Using both, in-situ wind speed measure-ments from a series of buoys and wind speeds derivedfrom different satellite products Winterfeldt and Weisse(2009); Winterfeldt et al. (2010); Winterfeldt et al. (2011)assessed the added value of coastDat-1 compared to thedriving global NCEP/NCAR reanalysis and found thatwind speeds from coastDat-1 are improved, in particu-lar in coastal areas and along coastlines with complexorography.Since coastDat-2 is a relatively recent product, less com-
prehensive results for validation are available so far. Vali-dation of the atmospheric hindcast is described in Geyer(2014) focusing mostly on the validation of near-surfacetemperatures and precipitation. For near-surface windspeeds Geyer (2014) compared results from coastDat-2with observations from two buoys confirming the goodoffshore quality of coastDat-2 wind fields and the find-ings of Winterfeldt et al. (2011) regarding the added valueof coastDat. In Geyer (2014) wind speeds derived fromcoastDat-2 were used to estimate wind energy potentialin the North Sea. Here generally good agreement wasfound with results published in the literature. In particu-lar the author demonstrated an improved representationof extreme wind speeds and wind speeds at typical hubheights while quality of near-surface marine wind fields iscomparable to that from coastDat-1.Figure 1 shows some additional validation for wind
speed, significant wave heights and tide-surges fromcoastDat-2. The so-called Taylor diagram shows a com-parison of validation statistics betweenmodeled andmea-sured data in terms of correlation (blue lines), centeredroot mean square error (green lines) and standard devi-ation (black lines). The latter two are normalized by thestandard deviation of the corresponding observationaldata sets. In general, correlations between hindcast andmodeled data vary between about 0.8 for wind speedsand 0.9 for high water levels for both, coastDat-1 andcoastDat-2. Centered root mean square errors range fromabout 0.4 for tide-surges to 0.6 for wave heights and theyare somewhat larger for wind speeds. For high water lev-els, the standard deviation of the modeled data is closeto the observed values, while for wave height and windspeed it appears to be somewhat larger with a tendency
towards higher values in coastDat-2. Generally, however,both versions of coastDat are hardly distinguishable inthe diagram indicating similar quality. The added value ofthe coastDat approach is further illustrated by a compar-ison with wind speeds derived directly from the drivingglobal NCEP reanalysis which show too small variabilitycompared to observations.
Climate services for marine applicationsIn the following some example of marine climate ser-vices utilizing data from coastDat are described.We beginwith a series of examples using mostly historical climateinformation. The section is concluded with two examplesconcentrating on long-term projections.
Applications using historical climate informationNaval architectureModern ship design is synonymous with tailor-made,customer oriented ship design. Thus, any new vesselshould optimally fit it’s designated tasks. Apart from ques-tions related to cargo capacity and deck layout, also thehydrodynamic abilities of the new vessel require specialattention. This includes, for example, an optimizationwith respect to speed/power, the design of a highly effi-cient propeller, or design modifications to warrant goodmaneuvering and sea-keeping abilities. The latter heavilydepends on the wave climate in the region the vessel isgoing to operate in. Historical information on the wave cli-mate in the designated sea-area are therefore essential tosimulate the behavior of the ship and to make assessmentsof the potential impact of any proposed design modifi-cation. For example, the combination of the simulatedship motions within a given sea state together with theprobability of its occurrence allows an evaluation of themotion behavior and the identification of critical aspectsrelated to, e.g., passenger comfort, safety against capsizingor special operation scenarios such as helicopter landings.Typically, the wave climate information needed for these
types of assessment are unavailable for many marineareas. Data from the met-ocean hindcasts described inthe previous section were therefore integrated into theoperational design system at the Flensburger SchiffbauGesellschaft (FSG), a shipyard situated in Flensburg,Germany. The data are typically used in the form ofscatter diagrams showing the long-term distribution ofexpected wave height/wave length combinations. Com-monly the most frequent combinations of wave height andwave length are used first to simulate the expected shipmotions. Subsequently, design modifications or the influ-ence of integrating additional roll-damping devices maybe tested.Further, the behavior of the vessel in extreme situations
can be assessed using wave climate extremes. As an exam-ple, Figure 2 shows one of the recent FSG RoPax ferry

Weisse et al. Earth Perspectives (2015) 2:3 Page 4 of 14
Figure 1 Validation statistics. Taylor diagram for wind speed (filled circles) and significant wave height (filled diamonds) at platform K13 as well asfor high water levels at Cuxhaven (open circles), Helgoland (open triangles) and Borkum (open squares) for 1980-1999 comparing results fromcoastDat-1 (blue) and coastDat-2 (red) with observations. For wind speed, also a comparison with the driving global NCEP reanalysis is shown(green). The black star denotes the location of a data set that would perfectly match observations.
Figure 2 Design of the Caledonian MacBrayne. The figure shows one of the recent FSG RoPax ferry designs developed for the Scottish routebetween Ullapool and Stornoway. The bow door can be inferred by the white lines on the right hand side of the figure.

Weisse et al. Earth Perspectives (2015) 2:3 Page 5 of 14
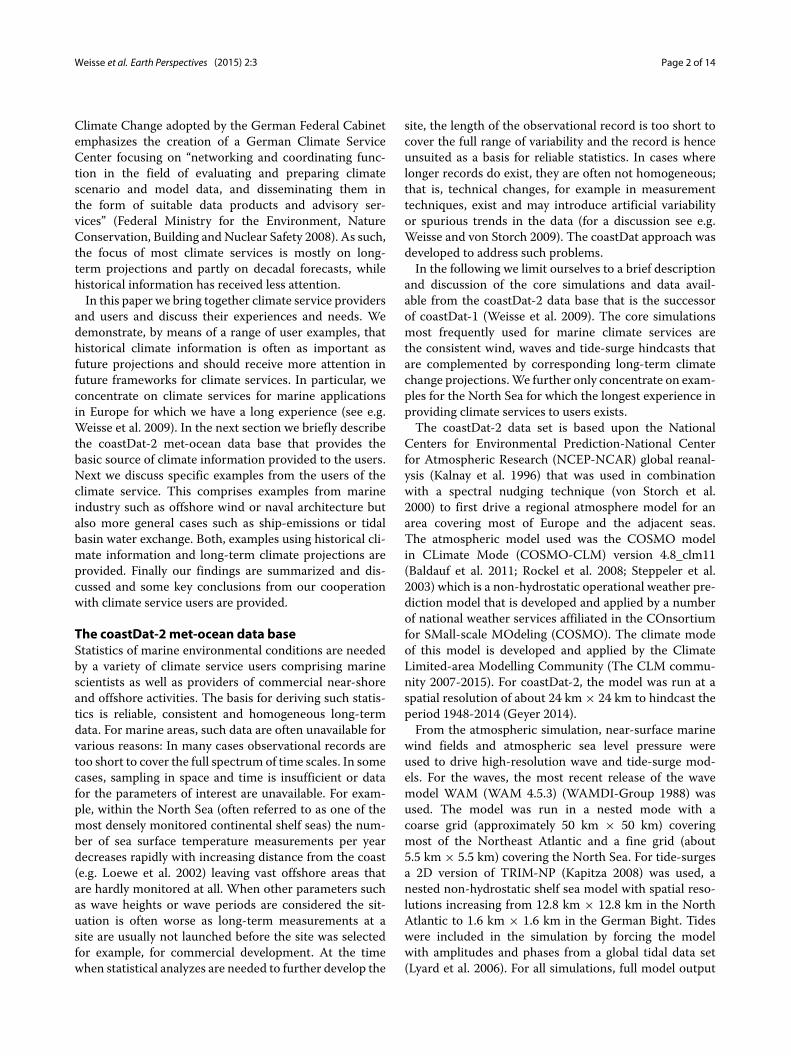
designs developed for the Scottish route between Ullapooland Stornoway. The vessel is equipped with a bow doorto facilitate loading and unloading of cars and trailers.Accidents, like the one of the MV Estonia indicate thatdynamic loads on such bow structures can be quite signifi-cant in severe sea conditions. Thus, a direct dimensioningof the bow-door was applied by FSG. The design pro-cedure consists of the following steps: First sea-keepingsimulations were performed using historical extremewaveclimate information from the coastDat-2 data base. Sub-sequently, from each simulation critical immersion eventsof the bow with respect to large impact velocities wereobtained and the probability distribution of the observedimpact velocities was determined. Next, in combinationwith the probability of occurrence of the sea state (derivedfrom the coastDat-2 data base) and the encounter angle,a probability level of each immersion event was obtainedto estimate how often such a situation could be expectedduring the lifetime of the vessel. Afterwards, the motionsequences from selected immersion events are used tocompute the wave induced loads acting on the bow withthe help of a viscous-flow simulation. These loads canfinally be used to determine the stresses and possibledeformations with a finite-element method. As a result,the dimensioning of the steel structure could be adaptedaccording to the expected loads during the design phase ofthe vessel. Figure 3 illustrates exemplarily the results fromthis procedure. On the upper panel, the bow of the vesselimmerses into a large wave. The lower panel illustrates thecorresponding pressure distribution on the bow door.
Renewable energiesEurope’s energy system is in a process of fundamentaltransition from a mainly fossil fuel based to a low car-bon energy system. Suggestions how future electricitysystems mainly based on renewable energies may looklike differ substantially (e.g. FVEE 2010; Klaus et al. 2010;German Advisory Council on the Environment 2014;Hohmeier and Bohm 2014; Pahle et al. 2012). However,despite their differences, the backbone of almost all pro-posed future systems are renewable energy sources, espe-cially the weather dependent solar, wind and water power.The latter are often referred to as variable renewable ener-gies (VRE). Due to their weather dependence not onlythe sources of energy supply but also the electricity feed-in characteristic will change. Due to the complexity andinterrelations of the electricity system, computer modelsare required to simulate effects of different combinationsof sources, flexibility options and grid infrastructure. Sofar, a wealth of energy systemmodels exist (Connolly et al.2010) all of them requiring climate information, in partic-ular weather sequences at high temporal and spatial detailand their probability of occurrence that are often unavail-able. To address this shortcoming, the Renewable Energy
Pathways Simulation System (renpass) developed at theUniversity of Flensburg utilizes historical climate informa-tion from the coastDat-2 data base. The model simulatesdifferent transition pathways between the present andfuture energy systems. To do so, first solar and wind feed-in are calculated on an hourly basis based on coastDat-2.In the simulation electricity feed-in of solar, wind and run-of-river power is then used first to supply the electricitydemand, since they are not associated with any fuel costs.The remaining so-called residual load is then supplied bydispatchable power plants. If, for any specific time, thesupply provided by VRE exceeds the demand it is eitherstored or remains unused. In a system with high sharesof VRE, their feed-in characteristics determine the flex-ibility required of the other components of the system.Thus, modeling the renewable feed-in time series in arealistic way is an essential prerequisite to address anyquestion regarding the efficiency of future systems. Forthis purpose, high resolution climate information such asprovided by coastDat-2 is urgently needed.More informa-tion about the model and example of application can befound in Wiese et al. (2014) and Wiese (2014).
Offshore windIncreasing the shares from renewable energies is a cen-tral target of the German Government. Offshore windenergy plays a crucial role within this concept. In theGerman Exclusive Economic Zone challenges associatedwith water depth and increasing distances to the shoremake the development of profitable projects particularlydifficult. In the following we demonstrate, by means oftwo examples, how historical climate information maysupport decision making during the project developmentphase.
Offshore wind logistics The serial installation of windfarms consisting of 90 wind turbines takes several monthsor more. Thus, offshore installation works have to takeplace even in the rough autumn and winter seasons whenwind and wave conditions bear one of the most promi-nent risks for the delay in the installation of offshorewind farms. For realistic project scheduling it is essen-tial to include realistic assessments of the probability ofthe weather downtime which is typically based on databases such as coastDat-2. In the following the procedureis described to some extent.Usually, jack-up vessels are utilized that travel to the off-
shore location carrying wind turbine components weigh-ing up to 1000 t on the deck. At the offshore location theinstallation vessels elevate their hull out of the water (jack-up) after a period of preloading to achieve a consolidationof the soil under the legs to have a firm stance. Installationworks are carried out by the main crane either by sea bedlifting and piling of foundation structures or by elevating
Weisse et al. Earth Perspectives (2015) 2:3 Page 6 of 14
Figure 3 Illustration of a severe immersion event. (a) Visualization of a simulation where the bow of the vessel immerses into a large wave;(b) corresponding pressures on the bow door in kPa as indicated in the color bar.
tower sections, nacelles, and blades in large heights. Eachoperation requires a so-called weather window; that is, aperiod of time in which operation dependent thresholdsfor wind speed and significant wave height are notexceeded. The limiting conditions have to be determinedfor each operation separately. Typical limits are shown inTable 1.Furthermore, an escape procedure needs to be estab-
lished in case survival conditions at the installation vessel(corresponding to the once-in-fifty-years wind speed incombination with the once-in-fifty-years wave height) areexceeded. If smaller vessels are chosen or if the soil condi-tions require so, lower survival criteria may be imperative.In order to schedule offshore installation projects, the
operational limits need to be combined with historical
climate information at the site that are often unavail-able. Therefore, time series of wind and waves derivedfrom data bases such as coastDat are frequently used.Using these data, logistic simulations may be carried outmany times depending on season providing correspond-ing frequency distributions which may subsequently beused in detailed development of the project. Figure 4shows an example from such simulations for an instal-lation sequence of 90 tripod foundations in the NorthSea starting on 26 October. The simulation has been exe-cuted 48 times showing that on average the installationwill take about 427 days while the minimum/maximumtime needed in the simulation were 335 days and 511 daysrespectively. Such statistics of expected project durationsrepresent essential factors not only for cost estimation,

Weisse et al. Earth Perspectives (2015) 2:3 Page 7 of 14
Table 1 Typical values of limiting weather conditions for offshore wind installations
Operation Weather window [h] Significant wave height [m] Wind speed [ms−1] Duration [h]
Loading at port 23 - 14 23
Transit offshore 18 2.5 18 12
Infield transit and jack up 18 2 18 3
Installation 3 × 10 - 14 49
Jack down 15 2 18 2
Transit to port 15 2.5 18 11
project risk management, and logistics planning but alsofor developing improvements of installation methods anddesign of future installation vessels.
EEG remuneration The Renewable Energies Act (EEG)is the central instrument for the development of renew-able electricity production in Germany. It regulates theremuneration by sector; that is, the power produced byrenewable energies will be rewarded according fixed feed-in rates. For offshore wind farms going into operationbefore 2020, the EEG 2014 currently provides for twodifferent remuneration models (Foundation Offshore-Windenergie 2014). Roughly speaking, the first modelallows the operator to claim 15.4 Cent/kWh over aninitial period of at least 12 years. The second so-called optional acceleration model plans for remunera-tion of 19.4 Cent/kWh for an initial period of 8 years.After the initial period has passed remuneration inboth models decreases to 3.9 Cent/kWh. Further reg-ulations depending on the water depth at the site and
its distance from the coast may further modify thesefigures.It may be interesting for any offshore wind farm oper-
ator to ask, which of the models would have been moresuccessful in the past; that is, in producing higher rev-enues taking the historical wind climate at the site intoaccount. Again such an estimate could be derived basedon information contained in the coastDat-2 data base.Figure 5 shows an example in which the revenues forboth remuneration models were computed for successive20 year periods for an offshore array in the German Exclu-sive Economic Zone. It can be inferred that the optionalacceleration model generally outperforms the standardmodel by providing, on average, 1.5% higher revenues.Effects caused by increasing distances from the coast andlarger water depths were ignored in this simple examplebut may be accounted for in detailed calculations for spe-cific wind farms. Similarly, other effects such as caused byweather dependent downtime or maintenance of the arrayshould be considered in more realistic simulations.
Figure 4 Frequency distribution of project duration. Shown is the distribution of project duration in days for an installation sequence of90 tripod foundations in the North Sea starting on 26 October based on 48 simulations using corresponding weather sequences from coastDat-2.The frequency distribution and corresponding estimates of the 5 and 95 percentile are shown in blue. Similarly a fitted Weibull distribution is shownin red. Summary statistics for both distributions are indicated on the right.

Weisse et al. Earth Perspectives (2015) 2:3 Page 8 of 14
Figure 5 EEG remuneration. Ratio per year [%] between revenues from the acceleration model and the standard model based on coastDat-2.Shown are revenues for successive 20 year periods starting in the years indicated in figure.
Shipping emissionsInternational trade is mainly done by large ships. Morethan 90% of the global trade volume is transported on theworld seas, thereby causing high emissions of pollutantsinto the atmosphere. In Europe, the biggest harbors are inthe North Sea area. Consequently, North Sea coastal areascan be highly affected by emissions from shipping.To investigate the effects of shipping emissions on
air quality and deposition of pollutants in the NorthSea, accurate emissions and information about trans-port and transformation of pollutants in the atmosphereare needed. In Aulinger et al. (2014) a comprehensiveinventory for shipping emissions in the North Sea basedon individual ship movements and detailed informationabout the ship’s technical specifications was developed.The emissions are fed into the three-dimensional Eulerianchemistry transport model (CTM) CMAQ (CommunityMultiscale Air Quality model system) (Byun and Ching1999). Moreover, a number of meteorological parame-ters have strong influence on the concentrations of theair pollutants calculated by CMAQ. The most impor-tant ones are wind speed and wind direction (horizontaltransport), planetary boundary layer height (vertical mix-ing), temperature and radiation (gas phase chemistry),and cloud coverage (liquid phase and aerosol chemistry).Therefore, accurate information about the meteorological
conditions in the model area is needed further as modelinput. CMAQ uses hourly input historical meteorologicaldata derived from coastDat-2 as input data. The meteo-rological variables and the results of the CTM have beenevaluated with good success in the European-Americanmodel intercomparison study AQMEII (Solazzo et al.2012, 2013; Vautard et al. 2012).The contribution of shipping on the concentrations
of nitrogen oxides, nitrate aerosol particles and ozonewas investigated for present conditions by Aulinger et al.(2014), future scenarios are analyzed in Matthias et al.(2014). Figure 6 shows the average NO2 concentrationsclose to ground and the contribution of ship emissionsto the modeled concentrations in the North Sea areaas average of three winter months (December, January,February). The model results show that ships contribute30-40% to the NO2 concentration in the southern NorthSea. At land, the contribution from ships decreases rapidlywith distance from the coast, however in Denmark forexample, ships contribute 10-30% to the NO2 concentra-tions in the entire country.
Tidal basin water exchange and eutrophication levelsEvaluation of Wadden Sea monitoring data revealedregional differences in eutrophication status (Bakker et al.1998). In general, eutrophication levels were highest in

Weisse et al. Earth Perspectives (2015) 2:3 Page 9 of 14
Figure 6 NO2 concentration and contributions from ships. (a) Average NO2 concentration in the North Sea area in winter in μg/m3 and (b) thecontribution from ships in %.
the southern Wadden Sea and lowest in the northernWadden Sea due to differences in organic matter importfrom the North Sea and the size of the receiving tidal basin(van Beusekom et al. 2012). In addition to water massexchange rates between the North Sea and the WaddenSea exchange rates between tidal basins will also impactthe eutrophication levels. In this context, the applicationof historical climate information from coastDat-2 cover-ing the monitored period can help to investigate the pre-vailing hydrodynamic conditions that may be responsiblefor the observed differences.The particle drift model PELETS (Callies et al. 2011)
was applied to compute backward trajectories of parti-cles entering three different tidal basins at the islands ofSchiermonnikoog, Norderney andWangerooge (Figure 7)using the historical hydrodynamic and atmospheric datafrom coastDat-2. The simulations were initialized at everyhigh tide corresponding to approximately 700 simulationsper year. As the simulations ran backward in time for 56days, it is possible to calculate how long the water was inany tidal basin at depths below 2 m for each simulationbefore reaching one of the three target basins. The latteris referred to as Wadden Sea impact. It was found thatthe Wadden Sea impact is decreasing from west to east,similarly to regional differences in eutrophication. Mostly,water masses in the tidal basin at Schiermonnikoog havealready stayed in other basins or even the same basin for asubstantial amount of time (Figure 7).Moreover, only little exchange between the Dutch and
the German part of theWadden Sea was foundmainly dueto the influence of the Ems estuary acting as a barrier forwater exchange between these two regions. As a conse-quence, water exchange with the North Sea was found to
be more dominant in the German tidal basins comparedto those in the Netherlands. These findings can providesubstantial aid for the interpretation of measurements ofbiogeochemical time series. For example, measurementsperformed during high tide can be alternately influencedby the North Sea or by other tidal basins. If sampled watermasses have high Wadden Sea signals they can have higheutrophication levels, although the respective eutrophica-tion processes took place in other tidal basins. Connectingmeasurements of eutrophication parameters with thesesimulations can help to further understand the WaddenSea system as a continuum of interconnected tidal basinsand the North Sea, influencing the biogeochemistry ineach other.
Applications using long-term projectionsEffects of climate change on coastal flood damageIn the re-insurance industry storm surges are a challeng-ing peril. So far the storm surge insurance coverage issporadic in most of the north-western European coun-tries. The lack of systematic insurance coverage put astrain on affordability for the small number of highlyexposed risks. Additionally, present day coasts are wellprotected and the absence of recent storm events withhigh damage impact limits the statistics necessary toestablish the insurance portfolio as well as awarenessof the potential risks. Moreover, possible changes inthe future atmospheric and sea level conditions increasethe uncertainty of the exposure extension and mag-nitude. To partially address these issues coastDat wasused in the joint Swiss Reinsurance Company (SwissRe) and Bern University coastal hazard assessment study(Gaslikova et al. 2011).

Weisse et al. Earth Perspectives (2015) 2:3 Page 10 of 14
Figure 7Major transport pathways. The arrows indicate the major pathways of particles over 56 days before reaching the tidal basins ofSchiermonnigkoog (red), Norderney (blue), and Wangerooge (green). The location of the tidal basins is indicated by the stars.
The coastDat water level for the reconstructed past andprojected future scenarios was used to establish the prob-abilistic storm surge loss model and to study the possiblefuture implications of the changing storm surge clima-tology and rising sea level on the coastal flood damagein the North Sea region. The study focused on a num-ber of countries which have considerable coastal areaspotentially exposed to the storms. Themodeling approachcombined the storm surge events with different sea levelrise estimates and various tidal phases to assess the haz-ard potential at the coastline. This further was trans-ferred into the inland flood damage estimates taking intoaccount present day coastal protection information andfailure probabilities, land elevation and potentially insur-able property distribution.The regular spatial and temporal coverage of the
long-term coastDat data allowed the selection of quasi-historical storm surge event set. Based on this, the hazardset of equally possible, physically plausible but not hap-pened in reality surge events was generated for the presentand future climate scenarios. The probabilities of eachevent were estimated for 200 locations along the NorthSea coasts. The hazard set was further expanded by con-sidering 0.5 m and 1 m sea level rise (SLR) scenarios. Theconstructed hazard sets were further used for the prob-abilistic dam failure estimates, based on the crest heightand facility safety data. Consequently, the extension anddepth of inland flooded areas were estimated based ona digital elevation model with 90 m spatial resolution.
The associated property damage was transferred in annualexpected losses (AEL) and aggregated country-wise.Figure 8 shows an AEL change for different future sce-
narios with respect to present-day conditions. The resultsfrom scenarios were combined and the error bars showthe uncertainties associated with each scenario. In gen-eral, an increase of AEL was found for all countries andall future development scenarios. Changes vary between5% and 200%. For some countries (e.g., Germany, UK)the changes of the storm surge climatology accordingto the selected scenarios have comparable effect on theinsurable losses as the 0.5 m SLR under the present-dayatmospheric conditions. The combinations of those, thus,almost double the estimated AEL. The expected lossesfor other countries, e.g. the Netherlands and Belgium,show almost no response on the changed climate condi-tions. This can be partially explained by the more frequentsouth-westerly rather than north-westerly winds and theirintensification in the considered future development sce-narios described e.g. in Sterl et al. (2009), which affectsmainly the eastern coast of the North Sea. The dispro-portional growth of the loss potential for the sea levelrise scenarios reflects the non-linearity in the coastalprotection facilities response to the considerably higherloads. The coastal defenses are designed to efficientlyprotect against the present day exposure and to have asafety margin for the case of the hazard intensification.However, when the hazard increases substantially, thetoday’s coastal protection is exhausting its initial design

Weisse et al. Earth Perspectives (2015) 2:3 Page 11 of 14
Figure 8 Expected annual losses. Increase of annual expected losses for future scenarios with respect to present day conditions in percent. Thebars show the mean value of the A2 and B2 estimates. The error bars show the uncertainty for each scenario around the corresponding mean.
capability resulting in abrupt growth of the loss potential,as can be seen to some extent for all countries by SLR sce-narios. Altogether, these results demonstrate a necessityto consider the storm surge statistics along with the SLRestimates for more accurate flood impact assessments.
The need for coastal protectionThe Northern German Climate Office maintains a long-term stakeholder dialog regarding regional climate changein Northern Germany (von Storch and Meinke 2008).Based on that experience, an interactive web tool availableat the Norddeutsches Klimabüro (2014) was developedthat provides an interactive map of the areas protectedby coastal defense along the German coast line for threedifferent situations: normal high tides and during stormsurge conditions under present and future climate condi-tions. Historical climate information and correspondinglong-term projections necessary to develop the data werederived from coastDat.Figure 9 shows a screen shot from the web tool. It can
be inferred that there is a substantial area which is alreadynowadays successfully protected during normal high tides(7,500 km2, 4.5 million inhabitants). When the effectsfrom storm surges are added, the area at risk substan-tially increases. Here these effects were simulated usingwater levels from the destructive North Sea storm surgeoccurring on 16-17 February 1962 along the GermanNorth Sea coast based on coastDat-2. The region nowa-days protected from such an event corresponds to about11,000 km2 including 5.3 million inhabitants.These water levels may further increase in the course of
anthropogenic climate change. The increase can be pri-marily due to two factors: an increase in mean sea levelincreasing the baseline upon which a storm surge mayact and a change in the storm surge climate itself. Both
effects were additionally accounted for in the web toolby including a maximum mean sea level rise of 80 cmuntil 2100 as suggested by (Bindoff et al. 2007) in the4th Assessment Report of the Intergovernmental Panel onClimate Change and a maximum wind-induced increasein storm surge water levels of 30 cm until 2100 (Gaslikovaet al. 2013). This increase only threatens a small addi-tional area. In total it covers about 12,000 km2 (comparedto the 11,000 km2 for the 1962 storm surge) which todayis inhabited by roughly 5.4 million people. However, inthis case coastal defense measures need to be adapted toensure the same level of safety as today.
Summary and discussionA number of marine climate services based on the met-ocean coastDat data base was presented and discussed.The data base consists of a series of consistent regionalmet-ocean hindcasts that are complemented with corre-sponding long-term projections. Data from coastDat weresuccessfully used for both, research and more economi-cally oriented questions sharing similar data needs. Bothrequire long, consistent and homogeneous data sets toderive statistics such as the mean, the variability or theextremes of marine environmental conditions and theirlong-term changes. Frequently such data are unavailableand the coastDat approach described here provides onepossibility to address such issues.As of mid-2014, there were about 80 registered users of
the coastDat data base with about 45% of them comingfrom the industrial sector while about 40% are from aca-demic and 15% from authorities. Added values derived aremanifold. In this paper examples from naval architecture,renewable energies and offshore wind farming, shippingemissions, tidal basin water exchange and eutrophication,and coastal flooding and risks were disccussed.

Weisse et al. Earth Perspectives (2015) 2:3 Page 12 of 14
Figure 9 Areas along the German North Sea coast protected from storm surges. Based on coastDat-2 data the map shows areas that areprotected by coastal defenses during twice daily normal high tides (yellow), present day storm surges (based on the data from the storm surge16-17 February 1962, light green) and future storm surge conditions (additional 1.1 m on top of present day conditions accounting for the effects ofrising mean sea levels and changing storm surge climate, dark green).
Following the terminology provided in Vaughan andDessai (2014), wemay refer to these as examples of marineclimate services; that is, the generation, the provision andthe contextualization of information derived from climateresearch for decision making at all levels. Our examplescomprise the generation and supply of climate informa-tion by climate providers (the coastDat data base) as wellas employing the information and knowledge for veryspecific decision making processes by the climate serviceusers while contextualization was not considered.Based on our experiences from the interaction between
climate service providers and users two major conclu-sions can be drawn: (i) Marine areas are often data sparseregions with insufficient data coverage to provide thebasis for reliable statistics often needed for any offshoreactivity. Met-ocean hindcasts and long-term projectionssuch as provided for example by coastDat are often anappropriate alternative in case observational data areinsufficient. (ii) Historical climate information is often asimportant as long-term projections. While scenarios aremostly important for sectors planning for long time hori-zons (e.g. coastal protection, policy regulations), hindcastsand historical data are more often requested from sectors
planning for shorter periods or operating in data sparseregions (e.g. offshore wind, naval architecture).This need for seamless climate information across time
scales is also clearly emphasized in the implementa-tion plan of the Global Framework for Climate Services(GFCS) (GFCS 2014a). In particular, in the annex focus-ing on the implementation of the research, modeling, andprediction component of the GFCS the need for reli-able and comprehensive information on past and currentclimate conditions including, statistical distributions ofrelevant meteorological and oceanographic variables suchas wind, wind waves, and storm surges is strongly high-lighted (GFCS 2014b). So far such aspects are frequentlyunaccounted for from climate service perspectives and weproposed that their value may be substantially enhancedtaking shorter time scales and natural climate variabilityinto account.
Competing interestsThe authors declare that they have no competing interests.
Authors’ contributionsRW conceived themanuscript and was responsible for drafting and writing. BG,LG, RW and NG provided the validation of the meteorological-oceanographicmodel data. LG further contributed the analysis of effects of climate change on

Weisse et al. Earth Perspectives (2015) 2:3 Page 13 of 14
coastal flood damage. KWK contributed the section on naval architecture, VMthe section on shipping emissions, FS and MH the section on offshore windlogistics, PB and EM the section on EEG remuneration, FW the section onrenewable energies, FS the section on tracer studies, and MM and IM thesection on coastal flood protection. All authors revised and approved the finalversion.
AcknowledgementsThe work leading to this publication has received funding from the EuropeanUnion’s Seventh Framework Programme (FP7/2007-2013) under grantagreement number 265240.
Responsible editor: Sophie Howard
Author details1Helmholtz-Zentrum Geesthacht, Center for Materials and Coastal Research,Max-Planck-Str. 1, 21502 Geesthacht, Germany. 2HOCHTIEF Solutions AG,Fuhlsbüttler Straße 399, 22309 Hamburg, Germany. 3Universität Flensburg,Zentrum für Nachhaltige Energiesysteme, Munketoft 3b, 24937 Flensburg,Germany. 4Flensburger Schiffbau-Gesellschaft mbH & Co. KG, Batteriestraße52, 24939 Flensburg, Germany.
Received: 29 October 2014 Accepted: 23 January 2015
References
Aulinger A, Matthias V, Zeretzke M, Geyer B, Bieser J, Quante M (2014) Theimpact of shipping emissions on air quality in the Greater North Searegion. Part I: Situation today, submitted
Baldauf M, Seifert A, Förstner J, Majewski D, Raschendorfer M, Reinhardt T(2011) Operational convective-scale numerical weather prediction withthe COSMOmodel: description and sensitivities. Mon Weather Rev139:3887–3905. doi:10.1175/MWR-D-10-05013.1
Bakker J, Kellermann A, Farke H, Laursen K, Knudsen T, Marencic H (1998)Implementation of the trilateral monitoring and assessment program(TMAP). Technical report, Germany, Common Wadden Sea Secretariat,Wilhelmshaven
Byun DW, Ching JKS (1999) Science algorithms of the EPA Models-3community multiscale air quality modeling system. Epa/600/r-99/030.Washington DC, US Environmental Protection Agency, Office of Researchand Development
Bindoff NL, Willebrand J, Artale V, Cazenave A, Gregory J, Gulev S, Hanawa K, LeQuéré C, Levitus S, Nojiri Y, Shum CK, Talley LD, Unnikrishnan A (2007)Observations: oceanic climate change and sea level. In: Climate Change2007: The physical science basis. Contribution of working group I to thefourth assessment report of the intergovernmental panel on climatechange. Cambridge University Press, Cambridge, United Kingdom andNew York, NY, USA. p 27
Callies U, Plüß A, Kappenberg J, Kapitza H (2011) Particle tracking in the vicinityof Helgoland, North Sea: a model comparison. Ocean Dyn 61:2121–2139.doi:10.1007/s10236-011-0474-8
Connolly D, Lund H, Mathiesen BV, Leathy M (2010) A review of computer toolsfor analysing the integration of renewable energy into various energysystems. Appl Energy 87:1059–1082. doi:10.1016/j.apenergy.2009.09.026
Federal Ministry for the Environment NatureConservation, Building andNuclear Safety (2008). German Strategy for Adaptation to Climate Change.http://www.bmub.bund.de/N42783-1/ Accessed 21 Oct 2014
Foundation Offshore-Windenergie (2014) EEG-remuneration. http://www.offshore-windenergie.net/en/politics/eeg-remuneration. Accessed 21 Oct2014
FVEE (2010) Energiekonzept 2050: Eine Vision für ein nachhaltigesEnergiekonzept auf Basis von Energieeffizienz und 100 Prozenterneuerbaren Energien. http://www.fvee.de/fileadmin/politik/10.06.vision_fuer_nachhaltiges_energiekonzept.pdf. Accessed 21 Oct 2014
Gaslikova L, Grabemann I, Groll N (2013) Changes in North Sea storm surgeconditions for four transient future climate realizations. Nat Hazards66:1501–1518. doi:10.1007/s11069-012-0279-1
Gaslikova L, Schwerzmann A, Raible C, Stocker T (2011) Future storm surgeimpacts on insurable losses for the north sea region. Nat Hazards Earth SystSci 11:1205–126. doi:10.5194/nhess-11-1205-2011
Geyer B (2014) High-resolution atmospheric reconstruction for Europe1948-2012: coastDat2. Earth Syst Sci Data 6:147–164.doi:10.5194/essd-6-147-2014
German Advisory Council on the Environment (2014) Pathways Towards a100% Renewable Electricity System - Special Report. http://www.umweltrat.de/SharedDocs/Downloads/EN/02_Special_Reports/2011_10_Special_Report_Pathways_renewables.pdf. Accessed 21 Sept2014
GFCS (2014a) Implementation Plan of the Global Framework for ClimateServices. http://www.gfcs-climate.org/sites/default/files/implementation-plan//GFCS-IMPLEMENTATION-PLAN-FINAL-14211_en.pdf. Accessed 12Jan 2015
GFCS (2014b) Annex to the Implementation Plan of the Global Framework forClimate Services - Research, Modelling, and Prediction Component. http://www.gfcs-climate.org/RMP. Accessed 12 Jan 2015
Hohmeyer O, Bohm S (2014) Trends towards 100% renewable energy supply inGermany and Europe - A paradigm shift in Energy policies. Wiley InterdiscipRev: Energy Environ 4(1):74-97. doi:10.1002/wene.128. Article firstpublished online: 24 JUN 2014 Article first published online: 24 JUN 2014
Kalnay E, Kanamitsu M, Kistler R, Collins W, Deaven D, Gandin L, Iredell M, SahaS, White G, Woollen J, Zhu Y, Chelliah M, Ebisuzaki W, Higgins W, JanowiakJ, Mo K. C, Ropelewski C, Wang J, Leetmaa A, Reynolds R, Jenne R, Joseph D(1996) The NCEP/NCAR reanalysis project. Bull Am Meteorological Soc77(3):437–471
Kapitza H (2008) High performance computing for computational science,lecture notes in computer science. In: Laginha J.M, Palma M, Amestoy P.R,Dayde M, Mattoso M, Lopez J (eds). Springer, Heidelberg, Berlin, New York.pp 63–68
Klaus T, Vollmer C, Werner K, Lehmann H, Müschen K (2010) 2050: 100%.Energy Target 2050: 100% Renewable Electricity Supply. http://www.umweltbundesamt.de/sites/default/files/medien/publikation/add/3997-0.pdf. Accessed 21 Oct 2014
Loewe P, Becker G, Brockmann U, Frohse A, Herkloz K, Klein H, Schulz A (2002)Nordsee und Deutsche Bucht 2002, Ozeanographischer Zustandsbericht.Bericht 33, Bundesamt für Seeschifffahrt und Hydrographie. http://www.bsh.de/de/Produkte/Buecher/Berichte_/Bericht33/index.jsp. Accessed 25Sept 2014
Lyard F, Lefevre F, Letellier T, Francis O (2006) Modelling the global oceantides: modern insights from FES2004. Ocean Dyn 56:394–415
Matthias V, Aulinger A, Zeretzke M, Bieser J, Geyer B, Quante M (2014) Theimpact of shipping emissions on air quality in the Greater North Searegion. Part II: Scenarios for 2030, submitted
Norddeutsches Klimabüro (2014) Küstenschutzbedarf. http://www.kuestenschutzbedarf.de. Accessed 21 Oct 2014
Pahle M, Knopf B, Tietjen O, Schmid E (2012) Kosten des Ausbaus erneuerbarerEnergien: Eine Metaanalyse von Szenarien. Report, Climate Change23/2012, 92 pages, Publisher: Umweltbundesamt, ISSN 1862-4359. http://www.uba.de/uba-info-medien/4351.html. Accessed 21 Oct 2014
Rockel B, Will A, Hense A (2008) The regional climate model COSMO-CLM(CCLM). Meteorol Z 17:347–348
Steppeler J, Doms G, Schättler U, Bitzer H, Gassmann A, Damrath U, Gregoric G(2003) Meso-gamma scale forecasts using the nonhydrostatic model LM.Meteorol Atmos Phys 82:75–96. doi:10.1007/s00703-001-0592-9
Solazzo E, Bianconi R, Pirovano G, Matthias V, Vautard R, Moran MD, Appel KW,Bessagnet B, Brandt J, Christensen JH, Chemel C, Coll I, Ferreira J, Forkel R,Francis XV, Grell G, Grossi P, Hansen AB, Miranda AI, Nopmongcol U, PrankM, Sartelet KN, Schaap M, Silver JD, Sokhi RS, Vira J, Werhahn J, Wolke R,Yarwood G, Zhang J, et al. (2012) Operational model evaluation forparticulate matter in Europe and North America in the context of AQMEII.Atmos Environ 53:75–92. doi:10.1016/j.atmosenv.2012.02.045
Solazzo E, Bianconi R, Pirovano G, Moran MD, Vautard R, Hogrefe C, Appel KW,Matthias V, Grossi P, Bessagnet B, Brandt J, Chemel C, Christensen JH,Forkel R, Francis XV, Hansen AB, McKeen S, Nopmongcol U, Prank M,Sartelet KN, Segers A, Silver JD, Yarwood G, Werhahn J, Zhang J, Rao ST,Galmarini S (2013) Evaluating the capability of regional-scale air qualitymodels to capture the vertical distribution of pollutants. GeoscientificModel Dev 6(3):791–818. doi:10.5194/gmd-6-791-2013
Sterl A, van den Brink H, de Vries H, Haarsma R, van Meijgaard E (2009) Anensemble study of extreme storm surge related water levels in the NorthSea in a changing climate. Ocean Sci 5:369–378. doi:10.5194/os-5-369-2009
The CLM community 2007-2015 Climate Limited-area Modelling Community.http://www.clm-community.eu

Weisse et al. Earth Perspectives (2015) 2:3 Page 14 of 14
van Beusekom J, Buschbaum C, Reise K (2012) Wadden Sea tidal basins andthe mediating role of the North Sea in ecological processes: scaling up ofmanagement?. Ocean Coastal Manag 68:69–78
Vautard R, Moran MD, Solazzo E, Gilliam RC, Matthias V, Bianconi R, Chemel C,Ferreira J, Geyer B, Hansen AB, Jericevic A, Prank M, Segers A, Silver JD,Werhahn J, Wolke R, Rao ST, Galmarini S (2012) Evaluation of themeteorological forcing used for the air quality model evaluationinternational initiative (AQMEII) air quality simulations. Atmos Environ53:15–37. doi:10.1016/j.atmosenv.2011.10.065
Vaughan D, Dessai S (2014) Climate services for society: origins, institutionalarrangements, and design elements for an evaluation framework. WIREsClimate Change 5:587–603. doi:10.1002/wcc.290
von Storch H, Langenberg H, Feser F (2000) A spectral nudging technique fordynamical downscaling purposes. Mon Wea Rev 128(10):3664–3673
von Storch H, Meinke I (2008) Regional climate offices and regionalassessment reports needed. Nat Geosci 1:78. doi:10.1038/ngeo111
WAMDI-Group (1988) The WAMmodel - a third generation ocean waveprediction model. J Phys Oceanogr 18:1776–1810
Weisse R, von Storch H, Feser F (2005) Northeast Atlantic and North Seastorminess as simulated by a regional climate model during 1958-2001and comparison with observations. J Climate 18(3):465–479.doi:10.1175/JCLI-3281.1
Weisse R, Pluess A (2006) Storm-related sea level variations along the NorthSea coast as simulated by a high-resolution model 1958-2002. Ocean Dyn56(1):16–25. doi:10.1007/s10236-005-0037-y
Weisse R, Günther H (2007) Wave climate and long-term changes for thesouthern North Sea obtained from a high-resolution hindcast 1958-2002.Ocean Dyn 57(3):161–172. doi:10.1007/s10236-006-0094-x
Weisse R, von Storch H, Callies U, Chrastansky A, Feser F, Grabemann I, GüntherH, Pluess A, Stoye T, Tellkamp J, Winterfeldt J, Woth K (2009) Regionalmeteorological-marine reanalyses and climate change projections: Resultsfor Northern Europe and potential for coastal and offshore applications.Bull Am Meteorological Soc 90:849–860. doi:10.1175/2008BAMS2713.1
Weisse R, von Storch H (2009) Marine climate and climate change. Storms,wind waves and storm surges. Springer, Heidelberg, Berlin, New York.doi:10.1007/978-3-540-68491-6
Wiese F, Bökamp G, Wingenbach C, Hohmeyer O (2014) An open sourceenergy system simulation model as an instrument for public participationin the development of strategies for a sustainable future. WIREs EnergyEnviron 3:490–504. doi:10.1002/wene.109
Wiese F (2014) Wiese: renpass - renewable energy pathways simulation system- open source as an approach to meet challenges in energy modeling, inpreparation
Winterfeldt J, Weisse R (2009) Assessment of value added for surface marinewind speed obtained from two regional climate models. Mon Weather Rev137(9):2955–2965. doi:10.1175/2009MWR2704.1
Winterfeldt J, Andersson A, Klepp C, Bakan S, Weisse R (2010) Comparison ofHOAPS, QuikSCAT, and buoy wind speed in the Eastern North Atlantic andthe North Sea. IEEE Trans Geosci Remote Sensing 48(1, Part 2):338–348.doi:10.1109/TGRS.2009.2023982
Winterfeldt J, Geyer B, Weisse R (2011) Using QuikSCAT in the added valueassessment of dynamically downscaled wind speed. Int J Climatology31(7):1028–1039
Submit your manuscript to a journal and benefi t from:
7 Convenient online submission
7 Rigorous peer review
7 Immediate publication on acceptance
7 Open access: articles freely available online
7 High visibility within the fi eld
7 Retaining the copyright to your article
Submit your next manuscript at 7 springeropen.com