climate lake management - new hampshire€¦ · current new hampshire ... • 25 years ago –...
TRANSCRIPT

Traditional Issues of Concernfor Lake Water Quality
• Population Growth & Development– Land Use Change from forests/fields to homes– Impervious Surface Cover-more pavement &
buildings– Non-Point Source Pollution –polluted runoff
• Resource Use– Excess withdrawals (water and aquatic species)
• Changes in Biological Communities– Invasive species– Algae Blooms -cyanobacteria
• Aging Infrastructure (e.g., dam safety)

Current New Hampshire Land Use Patterns
• Rapidly growing small towns• Scattered development• Dispersing population• Increasing rate of land development• Segregated land uses• Lack of activity centers• Poor accessibility

Development is Spreading Out!Population Density – 1950 to 2020
1950 1970
1998 2020
*Society for the Protection of New Hampshire Forests*Society for the Protection of New Hampshire Forests
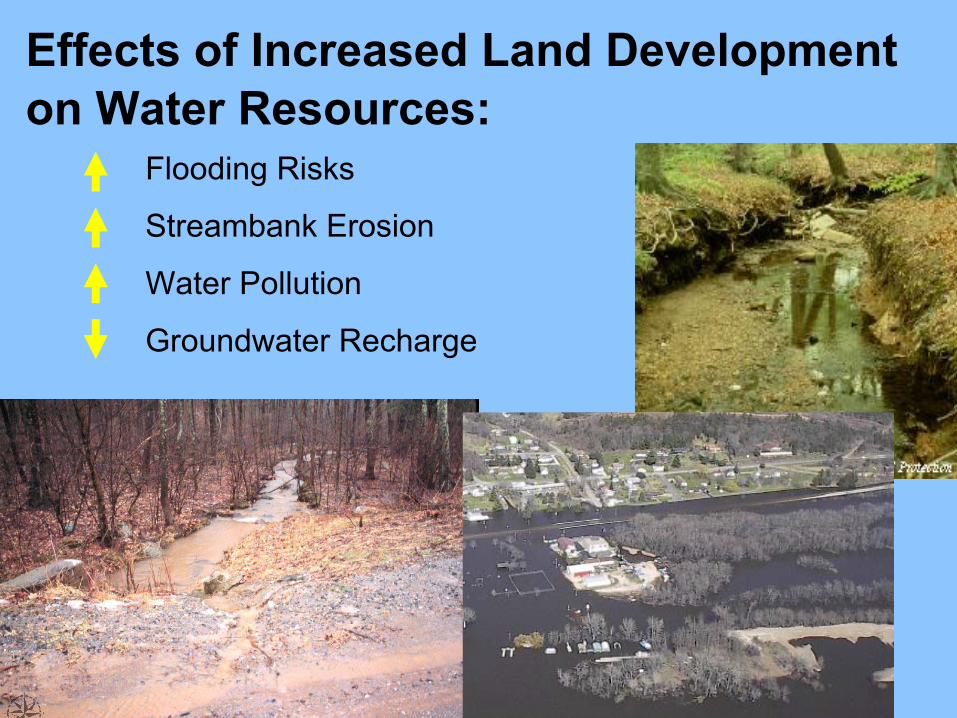
Flooding Risks
Streambank Erosion
Water Pollution
Groundwater Recharge
Effects of Increased Land Development on Water Resources:

“Landscape Services”we depend on
• Water supply• Water filtration and purification • Groundwater recharge• Flood and drought mitigation• Wildlife habitat • Recreation = Economy• Carbon sequestration

How might Climate Changeintensify the
Traditional Issues of Concernfor Lake Water Quality?
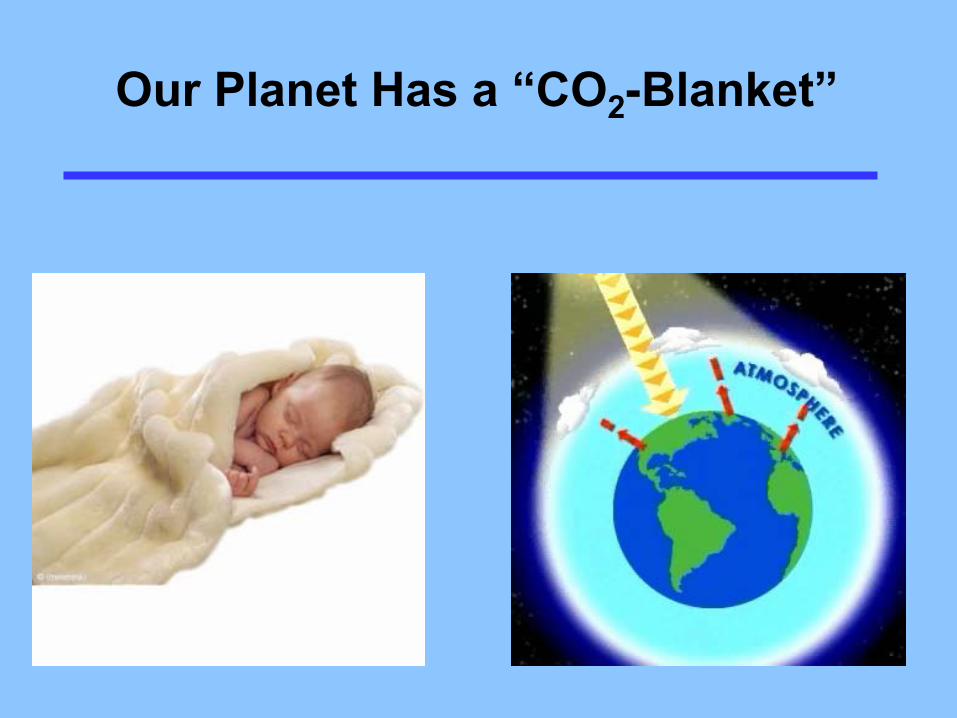
Our Planet Has a “CO2-Blanket”
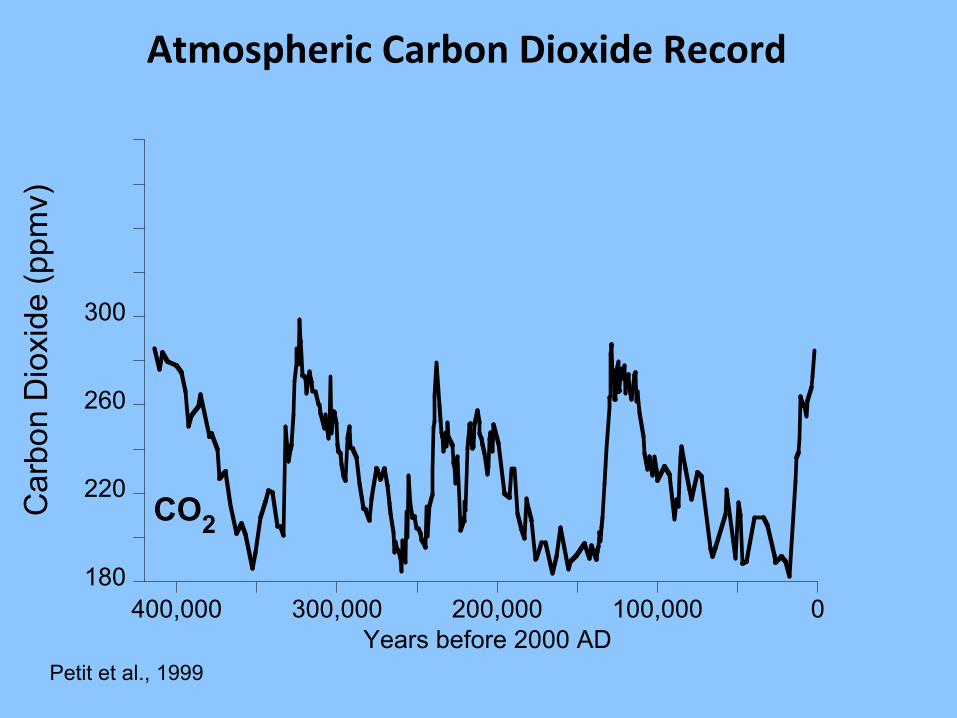
Atmospheric Carbon Dioxide Record
180
220
260
300
0100,000200,000300,000400,000
Car
bon
Dio
xide
(ppm
v)
Years before 2000 AD
CO2
Petit et al., 1999
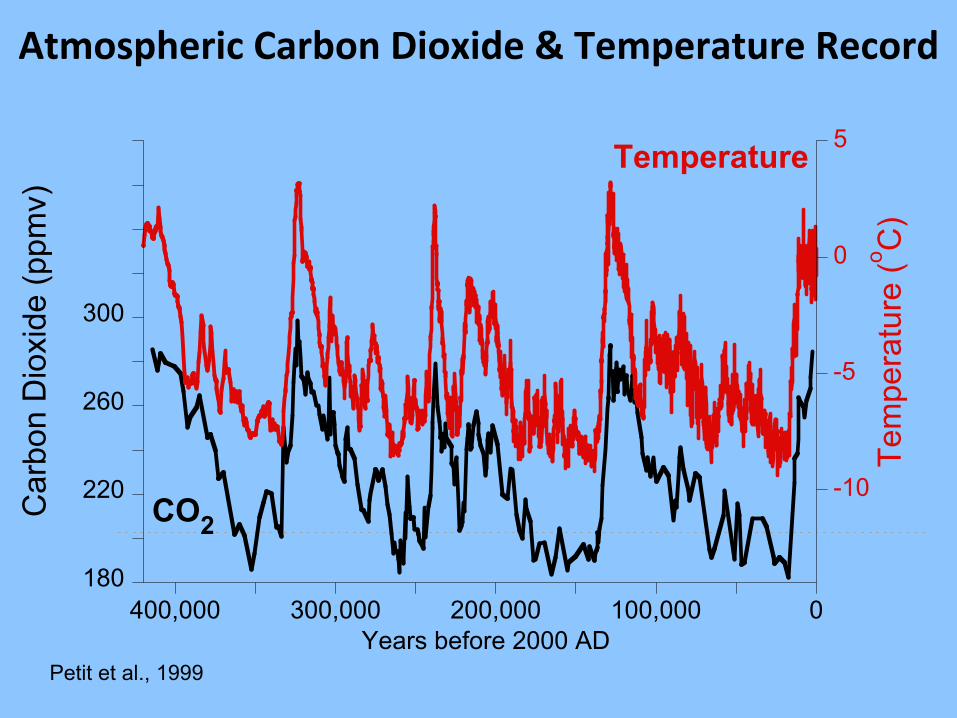
Atmospheric Carbon Dioxide & Temperature Record
Petit et al., 1999
180
220
260
300
0100,000200,000300,000400,000
-10
-5
0
5
Car
bon
Dio
xide
(ppm
v)
Years before 2000 AD
Tem
pera
ture
(o C)
CO2
Temperature
C h a l l e n g e s o f a C h a n g i n g E a r t h — J u l y 2 0 0 1
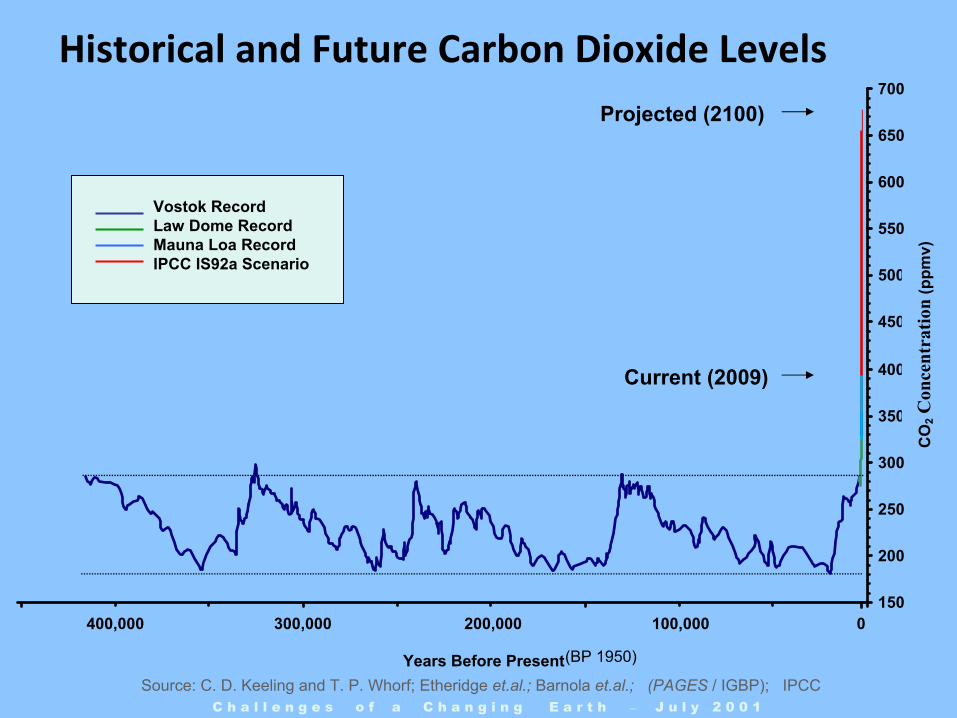
CO2 Concentration in Ice Core Samples andProjections for Next 100 Years
150
200
250
300
350
400
450
500
550
600
650
700
Years Before Present
Vostok RecordIPCC IS92a ScenarioLaw Dome RecordMauna Loa Record
Current(2001)
Projected(2100)
0100,000200,000300,000400,000
Source: C. D. Keeling and T. P. Whorf; Etheridge et.al.; Barnola et.al.; (PAGES / IGBP); IPCC
(BP 1950)
Current (2009)
CO
2Concentration
(ppm
v)
Vostok RecordLaw Dome RecordMauna Loa RecordIPCC IS92a Scenario
Historical and Future Carbon Dioxide LevelsProjected (2100)

-1
0
1
1880 1900 1920 1940 1960 1980 2000
Annual Mean5-year Mean
Tem
pera
ture
Ano
mal
y (o F)
Yearhttp://www.giss.nasa.gov
Global Temperature 1880‐2005

Summer (JJA) Arctic Sea Ice Extent
5
6
7
8
9
10
11
12
1900 1920 1940 1960 1980 2000
Ann
ual S
umm
er S
ea Ic
e E
xten
t
(milli
on k
m2 )
2006
University of Illinois The Cryosphere Today http://arctic.atmos.uiuc.edu/cryosphere/

Summer (JJA) Arctic Sea Ice Extent
5
6
7
8
9
10
11
12
1900 1920 1940 1960 1980 2000
Ann
ual S
umm
er S
ea Ic
e E
xten
t
(mill
ion
km2 )
2006
2007
2008
University of Illinois The Cryosphere Today http://arctic.atmos.uiuc.edu/cryosphere/

Projected Rise in Global Sea Level
http://www.northeastclimateimpacts.org/pdf/confronting‐climate‐change‐in‐the‐u‐s‐northeast.pdf
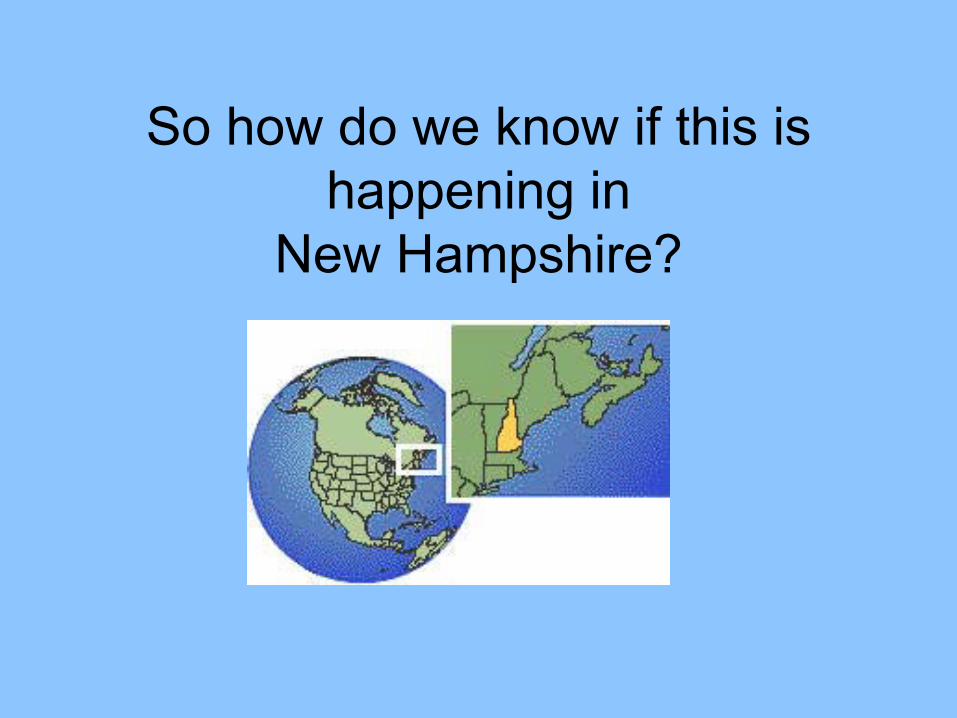
So how do we know if this is happening in
New Hampshire?

Indicators of Climate Change in the Northeast
Hodgkins et al., 2002; 2003; Wolfe et al., 2005; Wake and Markham, 2005; Wake et al., 2006
• More precipitation• More frequent extreme precipitation • Winter warming • Decreased snowfall• Fewer days with snow on ground• Lake ice out dates earlier• Earlier spring runoff• Extended growing season• Sea‐level rise• Drought

Relative Sea Level Rise 1856 ‐ 2005
Data from Permanent Service for Mean Sea Level http://www.pol.ac.uk/psmsl/
0
5
10
15
20
1850 1900 1950 2000
New York Boston
Rel
ativ
e S
ea L
evel
Ris
e (in
ches
)
Year
SW Shore, Nantucket, 18 Apr 2007
Saco. Maine 17 Apr 2007
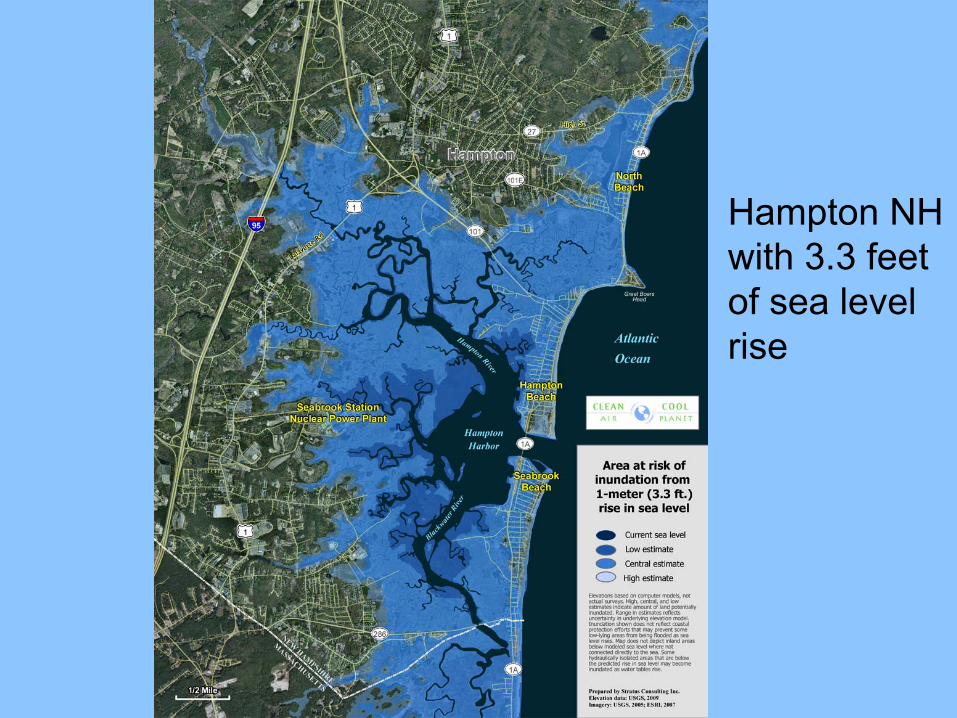
Hampton NH with 3.3 feet of sea level rise
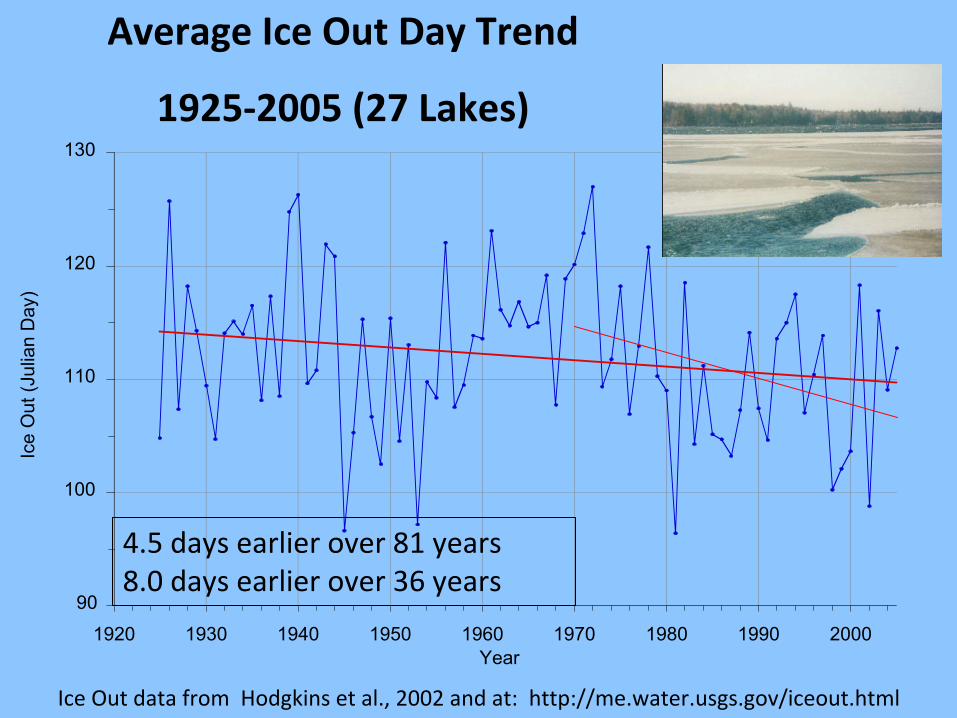
Average Ice Out Day Trend
1925‐2005 (27 Lakes)
Ice Out data from Hodgkins et al., 2002 and at: http://me.water.usgs.gov/iceout.html
90
100
110
120
130
1920 1930 1940 1950 1960 1970 1980 1990 2000
Ice
Out
(Jul
ian
Day
)
Year
4.5 days earlier over 81 years8.0 days earlier over 36 years
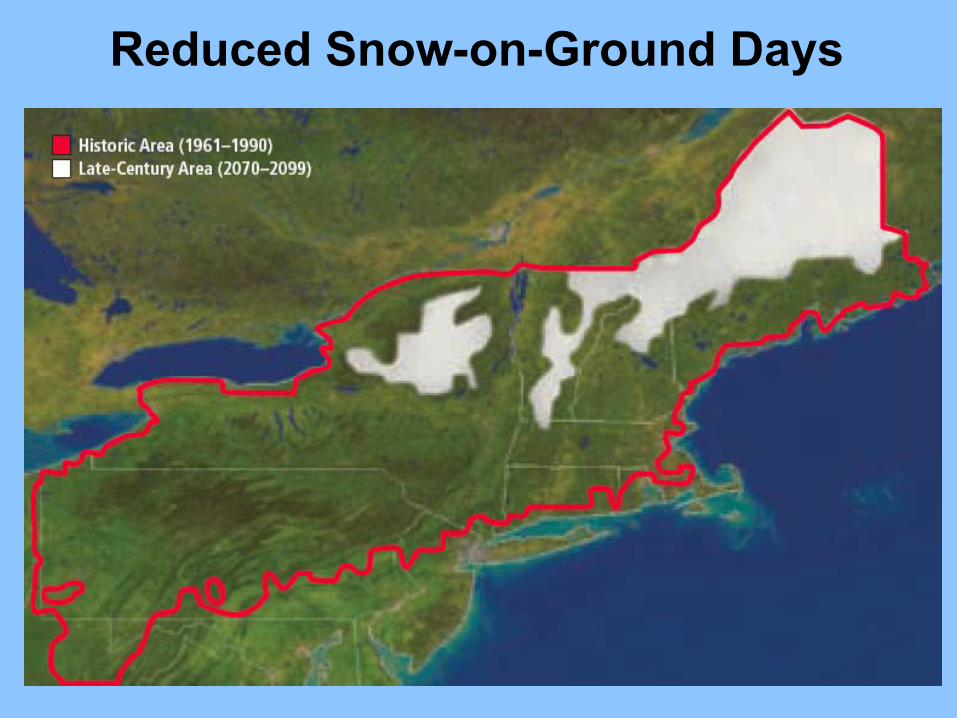
Reduced Snow-on-Ground Days
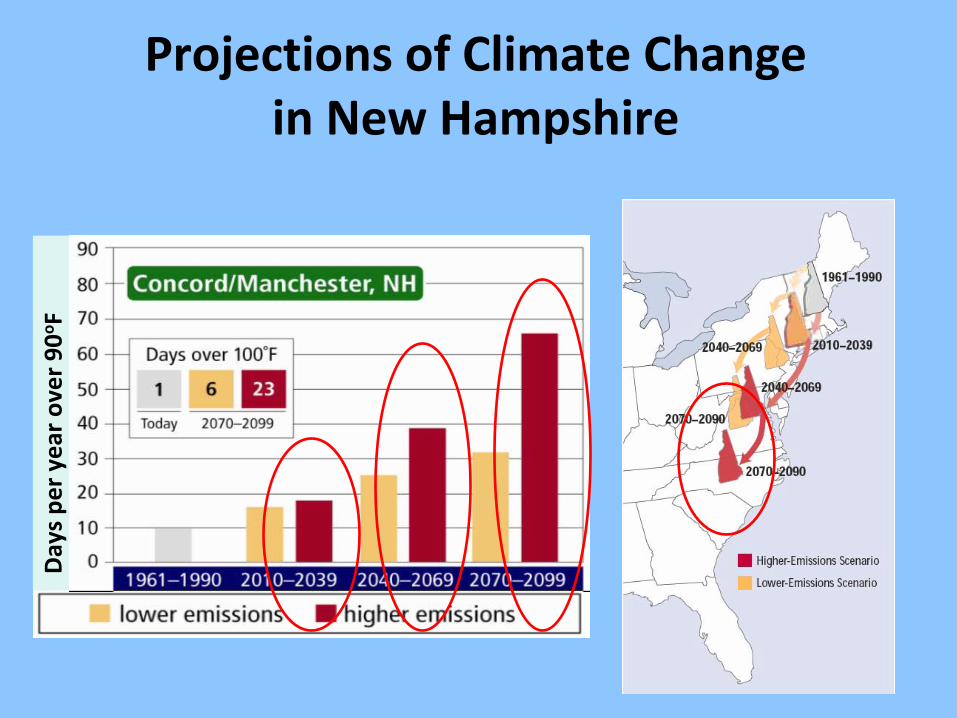
Projections of Climate Change in New Hampshire
Day
s pe
r ye
ar o
ver
90o F

Flooding in NH
• October 2005• May 2006• April 2007• September 2008• March 2010• August 2011• May 2012
Dover May, 2006
DoverApril, 2007
Surry Road, SurryMay 29, 2012
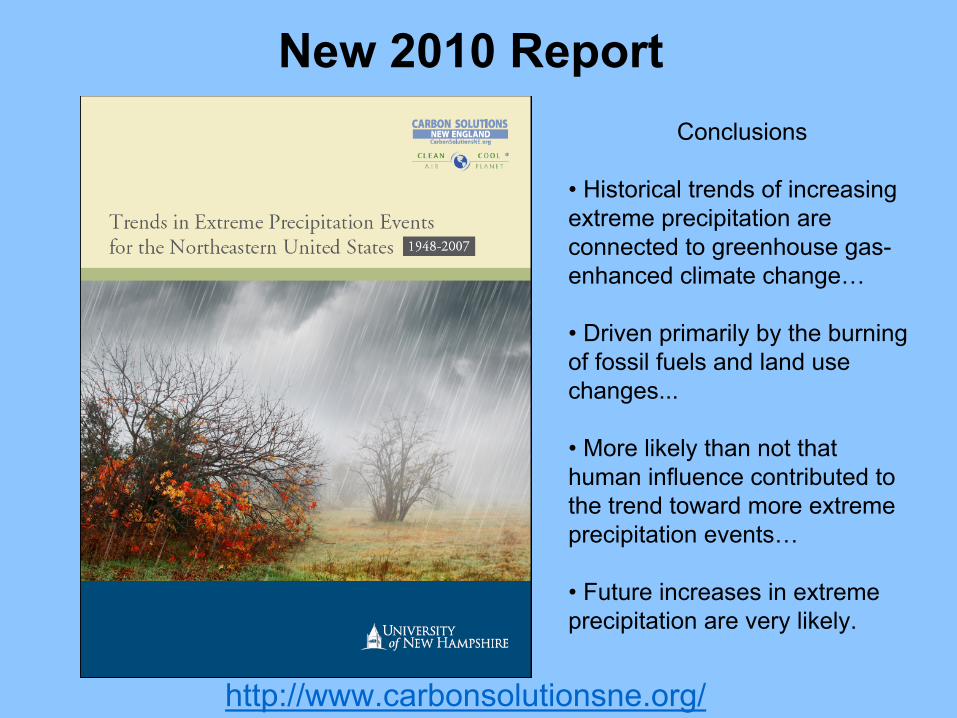
http://www.carbonsolutionsne.org/
New 2010 ReportConclusions
• Historical trends of increasing extreme precipitation are connected to greenhouse gas-enhanced climate change…
• Driven primarily by the burning of fossil fuels and land use changes...
• More likely than not that human influence contributed to the trend toward more extreme precipitation events…
• Future increases in extremeprecipitation are very likely.

February 2, 2011
• Historic winter storm, blizzard, thunder snow, ice storm, tornados• At least 3.9 billion dollars in damages• Affected over 100 million people; at least 36 fatalities• Max snow 27”, winds over 60 mph, over 1” of ice build up
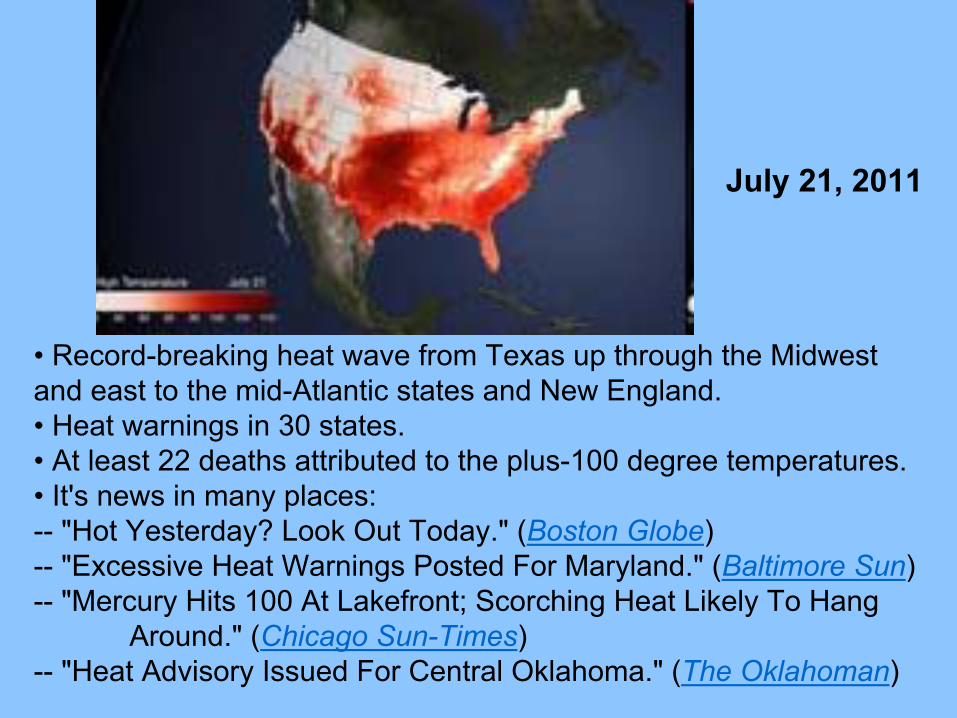
• Record-breaking heat wave from Texas up through the Midwest and east to the mid-Atlantic states and New England. • Heat warnings in 30 states.• At least 22 deaths attributed to the plus-100 degree temperatures.• It's news in many places:-- "Hot Yesterday? Look Out Today." (Boston Globe)-- "Excessive Heat Warnings Posted For Maryland." (Baltimore Sun)-- "Mercury Hits 100 At Lakefront; Scorching Heat Likely To Hang
Around." (Chicago Sun-Times)-- "Heat Advisory Issued For Central Oklahoma." (The Oklahoman)
July 21, 2011

•$7 billion in damages, 33 people killed•Power outages, bridges and roads washed out, agriculture devastated•"2011, even before Hurricane Irene, was going to go down as one of the most momentous in terms of natural catastrophes in the United States," Insurance Information Institute .
August 27, 2011
Hurricane Irene
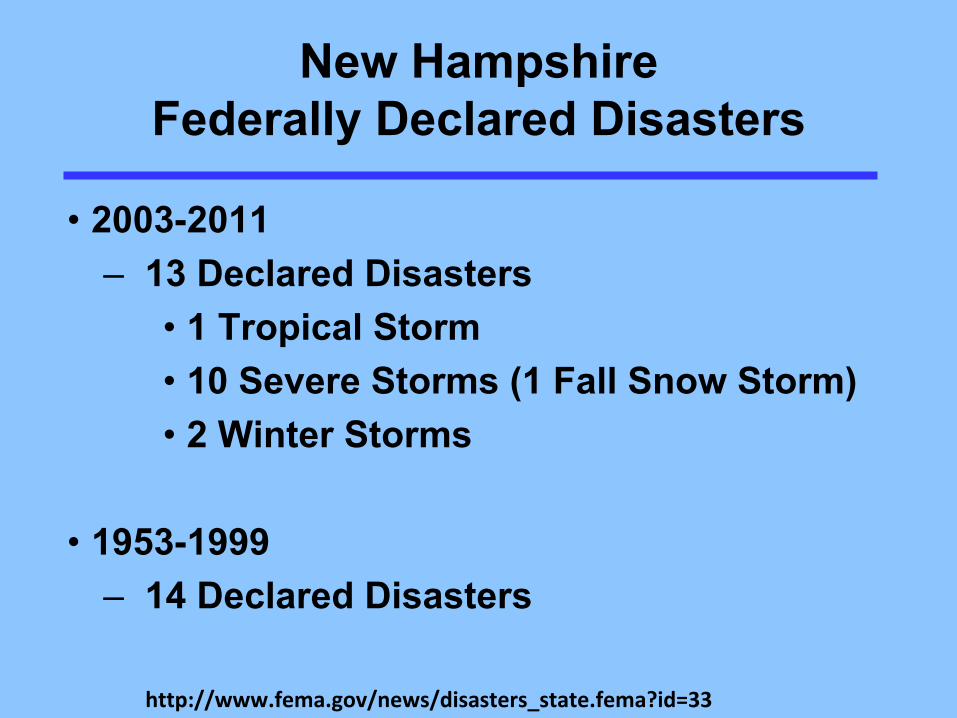
New Hampshire Federally Declared Disasters
• 2003-2011– 13 Declared Disasters
• 1 Tropical Storm• 10 Severe Storms (1 Fall Snow Storm)• 2 Winter Storms
• 1953-1999– 14 Declared Disasters
http://www.fema.gov/news/disasters_state.fema?id=33
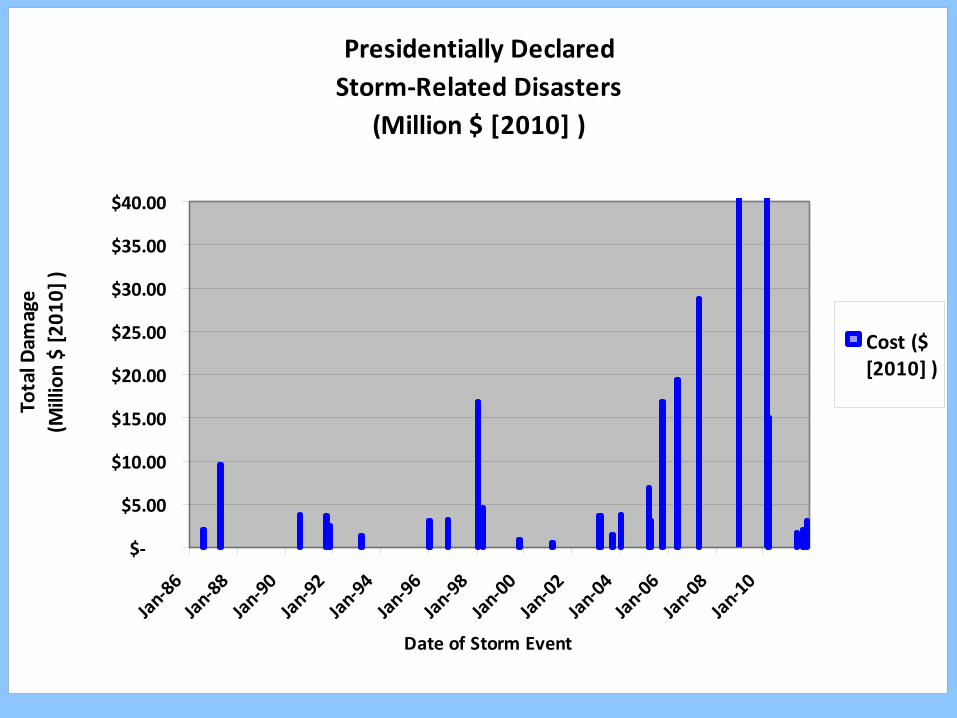
Presidentially Declared Storm‐Related Disasters
(Million $ [2010] )
$‐
$5.00
$10.00
$15.00
$20.00
$25.00
$30.00
$35.00
$40.00
Jan‐
86Ja
n‐88
Jan‐
90Ja
n‐92
Jan‐
94Ja
n‐96
Jan‐
98Ja
n‐00
Jan‐
02Ja
n‐04
Jan‐
06Ja
n‐08
Jan‐
10
Date of Storm Event
Tota
l Dam
age
(Mill
ion
$ [2
010]
)
Cost ($[2010] )
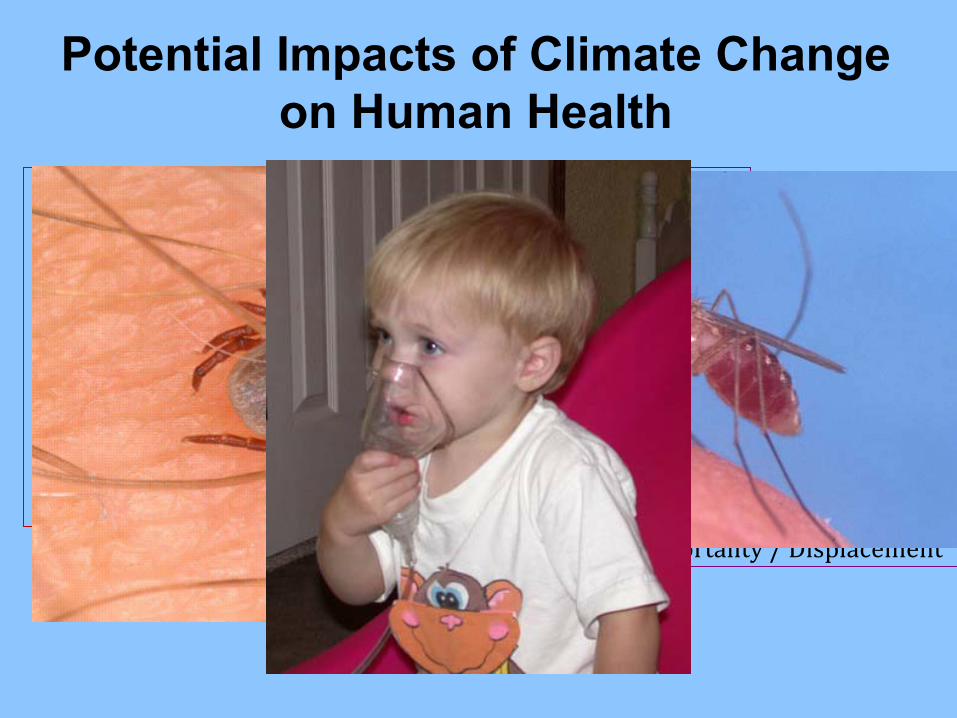
Potential Impacts of Climate Change on Human HealthClimate Change Effects:•Temperature• Sea Level• Precipitation• Extreme Weather Events
FoodWaterCoastal FloodingInfectious DiseaseAir QualityHeatCivil Conflict
MalnutritionDroughtDisplacementMorbidity / MortalityRespiratory DiseasesDirect EffectsMorbidity / Mortality / Displacement

CO2 Persists in the Atmosphere

Tornados and severe storm warnings
Flooding Ice storms

What does all this mean for the Future of Lake Management in
New Hampshire?
A Water-Rich New Hampshire
– 17,000+ miles of rivers and streams– 1,000+ lakes and ponds– 230+ miles of coastal/estuarine shoreline– 500,000 acres of wetlands– Groundwater
• Bedrock • Sands and gravels left by glaciers (14% of state)
– Down-side: N.H. economy more vulnerable to deteriorating water resources, being one of top 10 states in tourism as % of economy!

How will impacts from Climate Change add Concern for Lake Water Quality?
• More frequent extreme precipitation – turbidity, more runoff into lakes, dam safety
• Winter warming • Decreased snowfall - fewer days with snow on
ground• Lake ice out dates earlier• Lake warming – dissolved oxygen decrease,
cyanobacteria, impacts on fish• Earlier spring runoff• Extended growing season – invasive species• Sea-level rise – coastal storm surge• Drought
What can YOU do?As a VLAP volunteer:• Pay extra attention!• Document changes, note timings of things• Compare notes from year to year• When are plants or algae blooming• Water temperatures, lake levels etc…• What happened during drought conditions?• What happened after a big storm?
The more local information YOU collect, the better WE can plan for the future.

What can YOU do?As a concerned citizen:• Use energy efficiently
• Energy star appliances • Efficient light bulbs• Wash full loads, use clothes lines• Use fans in summer (4-6 degrees cooler)
• Eat local foods• Drive a fuel efficient vehicle (keep vehicle tuned, don’t
idle)• Better insulate your home (use drapes), home energy
audit• Cut the Carbon Kit, available at your local library• Support Local Energy Commissions
SAVE MONEY TOO!
About Climate Change• It is happening now – we can see it in our own
lives. Warmest March on record (9F higher than average). Collect lake data to help future planning.
• It is us – fossil fuels make CO2; CO2 traps heat
• We have a choice – solutions are happening right now. We have the technology!
• Wide scientific agreement – National Academy of Science, NOAA, American Geophysical Union, US Global Change Research Program, IPCC etc…)
Union of Concerned Scientists 4/2/12 webinar
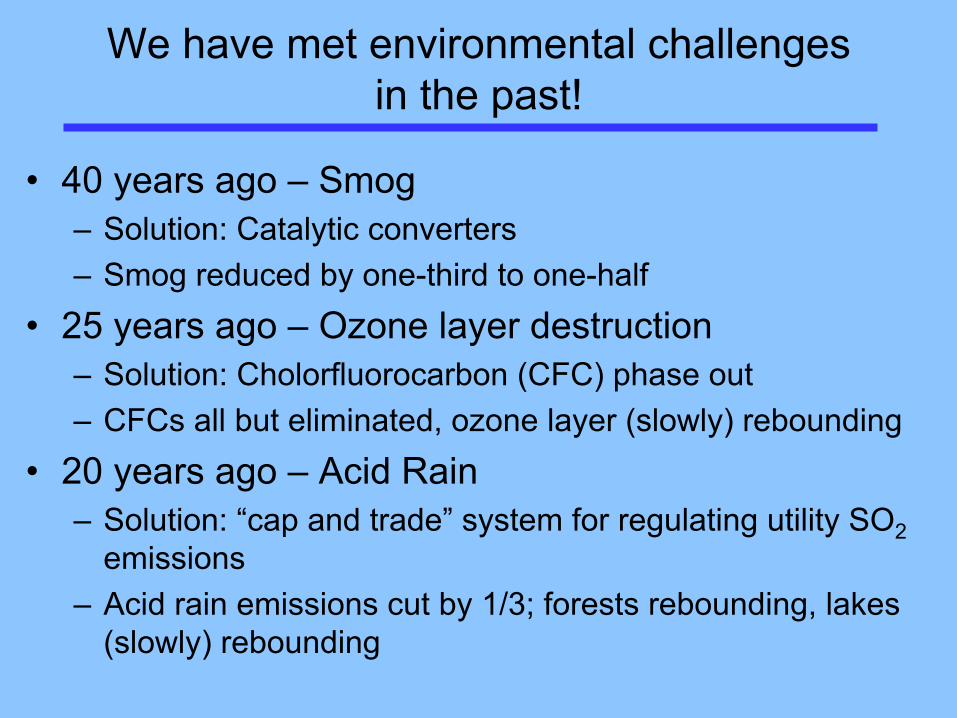
We have met environmental challenges in the past!
• 40 years ago – Smog– Solution: Catalytic converters– Smog reduced by one-third to one-half
• 25 years ago – Ozone layer destruction– Solution: Cholorfluorocarbon (CFC) phase out– CFCs all but eliminated, ozone layer (slowly) rebounding
• 20 years ago – Acid Rain– Solution: “cap and trade” system for regulating utility SO2
emissions– Acid rain emissions cut by 1/3; forests rebounding, lakes
(slowly) rebounding
Solutions to Climate Change
Solution: Households, industry & government working together!
• Energy Efficiency
• National Security
• Energy Independence
• Economic Vitality
