Climate Change and the Lower Coquille Watershed - …ecoadapt.org/data/documents/Darrin-ClimateChangeCoquilleWatershe… · Climate Change and the Lower Coquille Watershed ... •
54
Climate Change and the Lower Coquille Watershed Darrin Sharp David Rupp Oregon Climate Change Research Inst. (OCCRI) www.occri.net April 18, 2012 Bandon, Oregon
– Temperature and Precipitation – Ocean Acidification (OA) – Sea Level Rise (SLR) – Hydrology/Stream Flow – Upwelling – Waves/Storms
• Extremes • Wrap Up/Take Home
Climate Primer
Will Elder, NPS
Presenter
Presentation Notes
Pre-industrial (~late 1700s) = 280 ppm. Projections for 2100 = 550-900 ppm. Note the seasonal/yearly cycle.
Uncertainty (Range)
Three Components
Greenhouse Gas Emissions Natural Climate Variability
Climate Sensitivity
Manning et al. 2010
Presenter
Presentation Notes
Each “scenario” represents a particular “storyline” reflecting socioeconomic, political, demographic and technological assumptions. Actual emissions (black dots) are running near the top of the projected range.
Inman 2011
Representative Concentration Pathways (RCPs)
Presenter
Presentation Notes
2.6/4.5/6.0/8.5 refers to increase in forcing, in units of watts/meter2. For comparison, average solar radiation over the entire surface of the earth is 343 watts/m2. Doubling of CO2 to 560 ppm ~ 4 watts/m2 of forcing.
NASA GISS; Hansen et al. 2010
Anomaly Relative to 1951-1980
Presenter
Presentation Notes
Green bars are 2-sigma error estimates (95% CI). Note the “noisiness” of the year-to-year data, but the up and to the right trend. Also note the year 2011 is the 9th warmest in the GISS analysis. Nine of the ten warmest years are in the 21st century, the only exception being 1998, which was warmed by the strongest El Niño of the past century.
Presenter
Presentation Notes
Probability of climate sensitivities from various resources. Note (1) very low probability of < 2C (2) highest probability around 3.5C (3) non-zero probabilities out to 9-10C.
Putting It All Together
Hawkins and Sutton 2009
GREEN = Emissions Uncertainty ORANGE = Natural Climate Variability BLUE = Climate Sensitivity
Global Regional
Presenter
Presentation Notes
Points to note: Emissions uncertainty increases over time and contributes to >= ½ the total in 2100; natural variability contribution decreases as time increases; climate sensitivity contribution increases then decreases over time, and is greater in the regional case at 2100.
Processes/Historical Data/ Future Projections
Presenter
Presentation Notes
Projections, not Predictions. Projections illustrate one or more possible outcomes, but do not try to predict the future.
Temperature and Precipitation
Historical Climate Network, N. Bend David Rupp, OCCRI
Presenter
Presentation Notes
Statistically significant increase in the seasonal and annual temperature.
Historical Climate Network, N. Bend
David Rupp, OCCRI
Presenter
Presentation Notes
No statistically significant trends.
Lower Coquille – Projected Temperature Changes
Compared to 1971-1998 baseline. A2 emissions. David Rupp, OCCRI
Presenter
Presentation Notes
Red circles = NARCCAP; black circles = RegCLIM. Note how there is pretty good agreement amongst all the models. Error bars show the extremes. Black dot is the mean. Box is the 25th, 50th, and 75th percentile. NARCCAP = 50km, RegCLIM = 15km.
Lower Coquille – Projected Precipitation Changes
Compared to 1971-1998 baseline. A2 emissions. David Rupp, OCCRI
Presenter
Presentation Notes
Red circles = NARCCAP; black circles = RegCLIM. Note how there is pretty good agreement amongst all the models. Except for summer precip, not clear as to the sign of the changes. Error bars show the extremes. Black dot is the mean. Box is the 25th, 50th, and 75th percentile.
Take Home
Historic Trends Temperature Up 0.10 °C/decade (1.8 °F/20th Century)
Precipitation Flat
Future Projections (~2050) + 1-2.5 °C (1.8-4.5 °F) Greatest Increase in Summer
Probable Decrease in Summer Precipitation
Presenter
Presentation Notes
Data/Projections are for the N. Bend/Lower Coquille area. Summers are typically dry already.
Ocean Acidification
CO32- + Ca2+ <=> CaCO3
“Calcifiers”
(Photos of shell-building organisms)
Presenter
Presentation Notes
Calcifiers consume carbonate ions(CO3 2-) to produce and maintain their shells.
<
Presenter
Presentation Notes
Acidity increases with increasing H+ ions. Excess H+ ions “consume” carbonate ions, leaving fewer available for the calcifiers.
Effect of Acidification on Pacific Oysters in the Netarts Estuary
Barton et al. 2012
Increasing acidification (higher CO2)
Presenter
Presentation Notes
Acidification led to a significant decrease in the robustness and production of older Pacific oysters in the Netarts (c,d). No significant effect noted in the first two life stages (a,b).
Take Home
More Acidic
pH
Presenter
Presentation Notes
Probably negative impacts on at least some species of calcifiers.
Sea Level Rise
Presenter
Presentation Notes
Three components to SLR.
Thermal Expansion
Melting Glaciers/Ice Caps
Melting of Antarctic/ Greenland Ice Sheets
NASA Goddard Photo and Video
Tectonic Effects
www.platetectonics.com
Robert A. Rohde / Global Warming Art (Douglas 1997)
Presenter
Presentation Notes
About 20cm of SLR over the 20th century. IPCC estimates for the 20th century are 1.7 +/- 0.5 mm/yr; for 1993-2003 by satellite altimetry the rate is 3.1 +/- 0.7 mm/yr. IOW, the rate has increased.
Global Avg 20C ≈ 1.7 mm/yr (Holgate, 2007)
Komar et al, 2011
PNW Regional 20C ≈ 2.3 mm/yr (Burgette et al, 2009)
Emergent
Submergent
Bandon
Presenter
Presentation Notes
Tectonics in the southern OR (Coquille area) are such that the relative SLR has been ~0 to -1mm/yr recently.
Vermeer and Rahmstorf 2009
SLR Projections
Presenter
Presentation Notes
IPCC AR4 projections (0.2-0.6m by 2100) are considered by many to be very conservative. Higher projections based on an empirical relationship between global temperature and SLR, for instance, are much higher.
Take Home
Global SLR in 21st Century* ~20 – 60 cm (IPCC)
Other Sources – up to ~200 cm
Tectonics May Decrease Local SLR by 0-1mm/yr
* Very Active Research Topic
Presenter
Presentation Notes
The behavior of the Antarctic and Greenland ice sheets account for much of the range in the SLR projections, especially at the high end.
Hydrology/Stream Flow
0
200
400
600
800
1000
1200
1400
1600
1800
2000
Jan Feb Mar Apr May Jun Jul Aug Sep Oct Nov Dec
Cubi
c Fe
et/S
ec
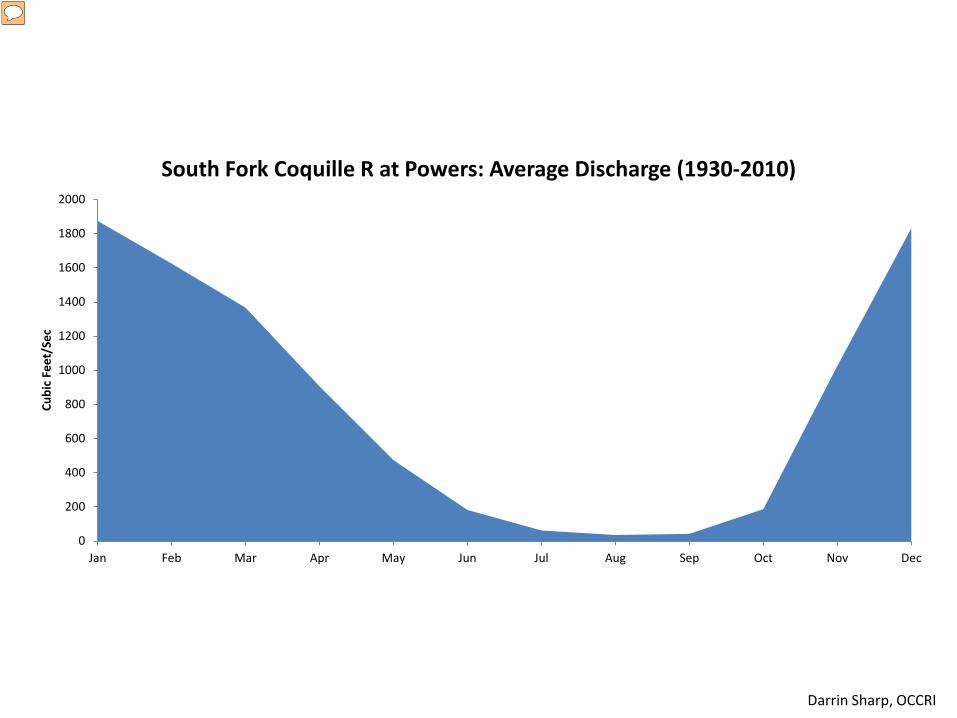
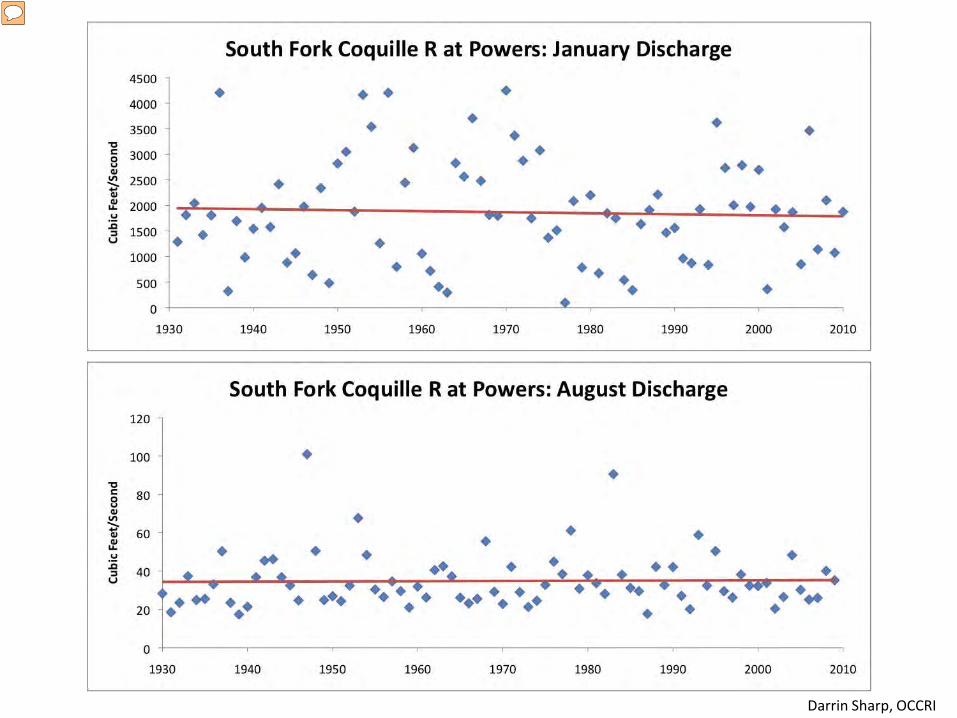
South Fork Coquille R at Powers: Average Discharge (1930-2010)
Darrin Sharp, OCCRI
Presenter
Presentation Notes
Note the very strong seasonal variation.
Darrin Sharp, OCCRI
Presenter
Presentation Notes
No real trend in the historic flow data.
Take Home
High Degree of Seasonality No Trend in Historical Data
Presenter
Presentation Notes
Based on a relatively limited number of climate models.
Upwelling
N
PNW Summer PNW Winter www.PISCO.org
Presenter
Presentation Notes
Deeper water brought to the surface via upwelling is colder, denser, more acidic, and has more nutrients.
Upwelling Index Anomaly
www.nwfsc.noaa.gov
Presenter
Presentation Notes
Hard to discern a long term trend. Other data suggests an increase in upwelling.
Take Home
Changes to Upwelling = ?
Deeper Waters = More Acidic
Increased Upwelling (hypothetical) = More Acidic Waters Alongshore
Presenter
Presentation Notes
Some indications that upwelling is increasing, but more research is needed before definitive conclusions can be drawn. If (hypothetically) there were an increase in upwelling, this could accentuate OA alongshore.
Waves/Storms
Young et al. 2011
Presenter
Presentation Notes
Note the slightly positive trend in wind speed and SWH. These are relatively short data sets, so one must use caution about drawing too strong a conclusion. But, there is other research which is mostly consistent.
Take Home
Research Suggests Increases in Wave Heights
Changes in Storminess Patterns
(No Definitive El Nino/
Climate Change Connection)
Presenter
Presentation Notes
“Storminess patterns” could include increases in intensity, but decreases in frequency. Also depends on the intensity of the storms being examined. El Nino/climate change is an active research area, but no conclusive results so far. Active research topic.
Extremes
Temperature
IPCC TAR 2001
Presenter
Presentation Notes
This illustration is for temperature, but can apply to other aspects of climate (precip, storms, etc). The previous climate for instance still had “hot” days, but with the new climate the probability of “hot” days is increased. With the new climate, one might see temps that wouldn’t have occurred with the previous climate.
Extremes Discussion
What extreme metrics are useful?
Number of Summer days (>25C/77F)? Warm Spell Duration (6 days > 90th Tmax)? Percentage of Days Tmin < 10th Percentile?
Others?
See “CLIMDEX” at www.climdex.org
Presenter
Presentation Notes
Climdex consists of 27 climate indices. This is an attempt at standardization of climate extreme metrics.
Wrap Up/Take Home
Temperature + 1-2.5 °C (1.8-4.5 °F) Greatest in Summer
Precipitation Suggestion of Drier Summers
Ocean Acidification Increased Acidity
Local Relative SLR Global Minus 0-1mm/year
Hydrology/Stream Flow Highly Seasonal; No Historic Trends
Upwelling Correlated with Winds; Difficult to Project
Waves/Storms Suggestion of Increased Waves/Storms
Citations • Barton, A., Hales, B., Waldbusser, G. G., Langdon, C., Feely, R. A., The Pacific oyster,
Crassostrea gigas, shows negative correlation to naturally elevated carbon dioxide levels: Implications for near-term ocean acidification effects, Limnology and Oceanography 57 (3), 698-710 (2012), doi:10.4319/lo.2012.57.3.0698
• Douglas, B., Global Sea Rise: A Redetermination, Surveys in Geophysics 18, 279-292 (1997)
• Hansen, J., Ruedy, R., Sato, M., Lo, K., Global surface temperature change, Reviews of Geophysics 48, (2010) RG4004, doi:10.1029/2010RG000345.
• Hawkins, E., Sutton, R., The potential to narrow uncertainty in regional climate predictions, Bulletin of the American Meteorological Society (BAMS) 90, 1095-1107 (2009), doi:10.1175/1009BAMS2607.1
• Inman, M., Opening the future, Nature Climate Change 1, 7–9 (2011), doi:10.1038/nclimate1058
• IPCC TAR (2001) http://www.ipcc.ch/ipccreports/tar/wg1/088.htm
Citations • Komar, P. D., Allan, J. C., Ruggiero, P., Sea Level Variations along the U.S. Pacific
Northwest Coast: Tectonic and Climate Controls, Journal of Coastal Research 27 (5), 808-823 (2011), doi:10.2112/JCOASTRES-D-10-00116.1
• Manning, M. R., Edmonds, J., Emori, S., Grubler, A., Hibbard, K., Joos, F., Kainuma, M., Keeling, R. F., Kram, T., Manning, A. C., Meinshausen, M., Moss, R., Nakicenovic, N., Riahi, K., Rose, S. K., Smith, S., Swart, R., van Vuuren, D. P., Misrepresentation of the IPCC CO2 emission scenarios, Nature Geoscience 3, 376 - 377 (2010), doi:10.1038/ngeo880
• Roe, G. H., Baker, M. B., Why Is Climate Sensitivity So Unpredictable?, Science 318, 629-632 (2007), doi:10.1126/science.1144735
• Vermeer, M., Rahmstorf, S., Global sea level linked to global temperature, Proceedings of the National Academy of Sciences (PNAS) 106, 21527-21532 (2009), doi:10.1073/pnas.0907765106
• Young, I. R., Zieger, S., Babanin, A. V., Global Trends in Wind Speed and Wave Height, Science 332, 451-455 (2011), doi:10.1126/science.1197219