climate and energy planning
TRANSCRIPT

May 12, 2010
Dr. Shailendra KumarNorthrop Grumman Information Systems
Climate and Energy Planning
Copyright 2011 Northrop Grumman Systems Corporation

Changing Environmental ConditionsImpact All Facets of Human Existence
2
Water
Climate Change Impacts
Agriculture
Growing season daysSoil moisture deficitCrop yield trendsField irrigation efficiency
Energy
Heating/Cooling Degree DaysElectricity/Natural Gas consumptionRenewables location
Fresh water availabilityWater consumptionDepth of snowpackPrecipitation evaporationPrecipitation trends
Public Health
Heat stress indexHeat wave frequencyRisk for occurrence of vector-borne diseases
Extreme precipitation eventsExtreme temperature eventsStorm Surge/Floods
Disaster Management
Sustainability
Anthropogenic impactAir, water, waste, impactControls and compliance
Transportation
Sea level rise impact on ports and shippingFood vs Fuel biofuels
National Security
Amplifies stress on weaker nationsGenerates geopolitical instabilityIncreases need for humanitarian assistance
Energy and water are central issuesCopyright 2011 Northrop Grumman Systems Corporation 5/12/11
3
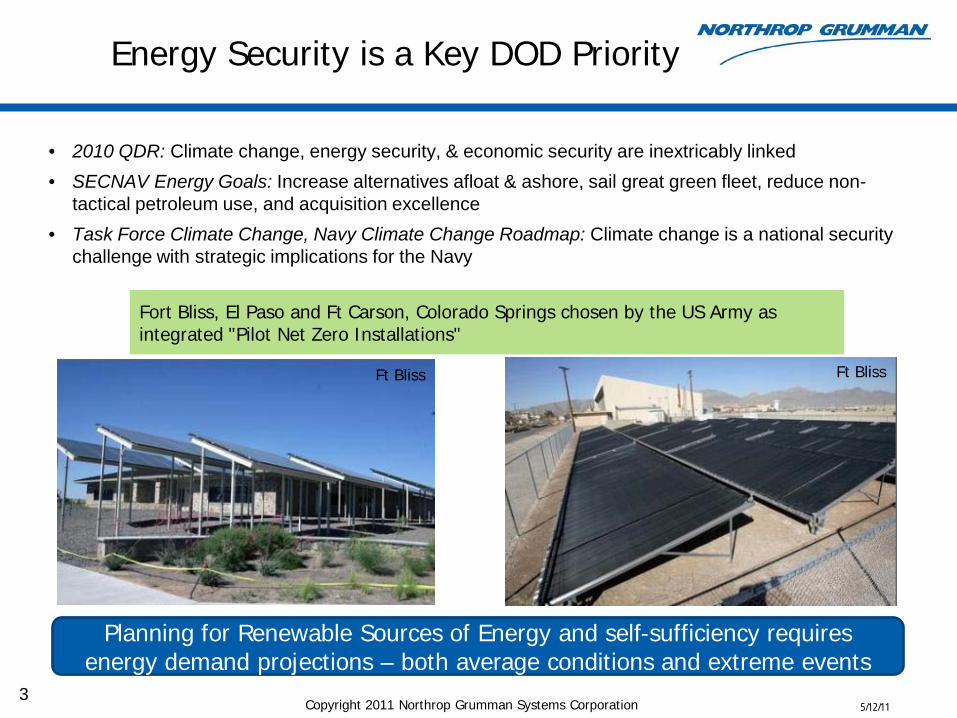
• 2010 QDR: Climate change, energy security, & economic security are inextricably linked• SECNAV Energy Goals: Increase alternatives afloat & ashore, sail great green fleet, reduce non-
tactical petroleum use, and acquisition excellence• Task Force Climate Change, Navy Climate Change Roadmap: Climate change is a national security
challenge with strategic implications for the Navy
Ft Bliss Ft Bliss
Planning for Renewable Sources of Energy and self-sufficiency requires energy demand projections – both average conditions and extreme events
Energy Security is a Key DOD Priority
Fort Bliss, El Paso and Ft Carson, Colorado Springs chosen by the US Army as integrated "Pilot Net Zero Installations"
Copyright 2011 Northrop Grumman Systems Corporation 5/12/11
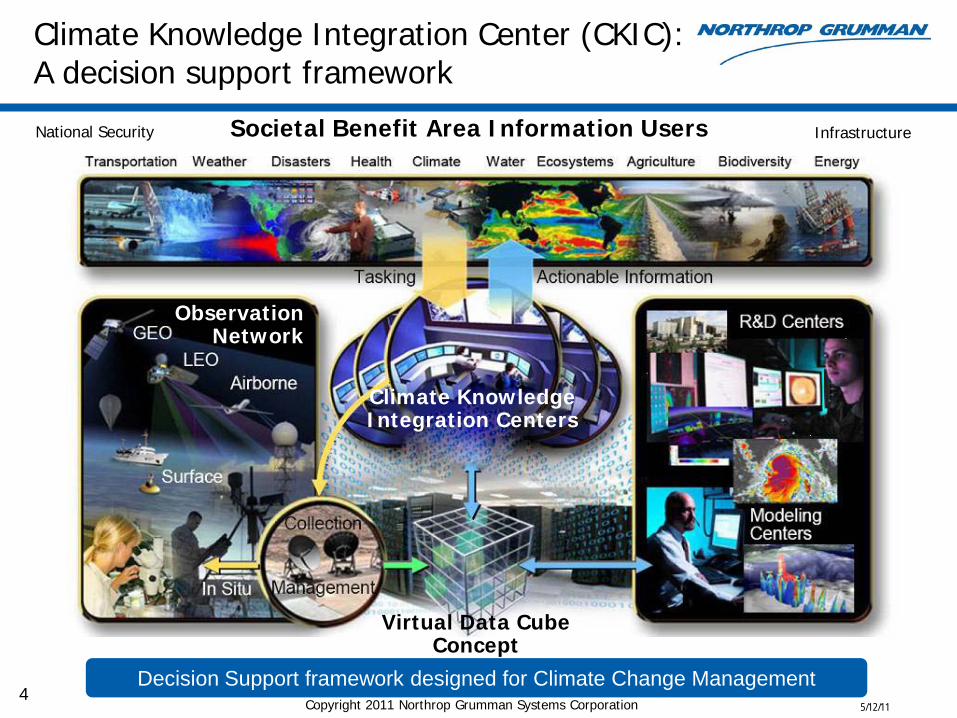
Climate Knowledge Integration Center (CKIC):A decision support framework
Observation NetworkGEO
LEOAirborne
Surface
In Situ
Societal Benefit Area Information Users
EnvironmentalPortals
Observation Network
Climate Knowledge Integration Centers
National Security Infrastructure
Virtual Data Cube Concept
4Decision Support framework designed for Climate Change Management
Copyright 2011 Northrop Grumman Systems Corporation 5/12/11

CKIC: A Systematic and Holistic Approach
Global Climate Models/ Observations
Regional Downscaling
Climate Parameters Analysis perUser Specified Bounds
Decision Support System Product Generation &
Visualization Tools
User DisplayCustomer GUI
Service requests
User experience
Uncertainty Quantification
User specific engineering output with uncertainty and risk assessment
User Requirements
(Open Standards)
Actionable information
System development
feedback
Model Data Records
Mission Specific Data
Application Data Records
User Needs DrivenDecision Support
System
User Engineering
Delivers climate science to the end user community … a standards based, repeatable and enduring solution
5
Composite dataset w/ means and variances
• Historical reanalysis• Model validation• Future period runs
Initial and Boundary Conditions
Copyright 2011 Northrop Grumman Systems Corporation 5/12/11
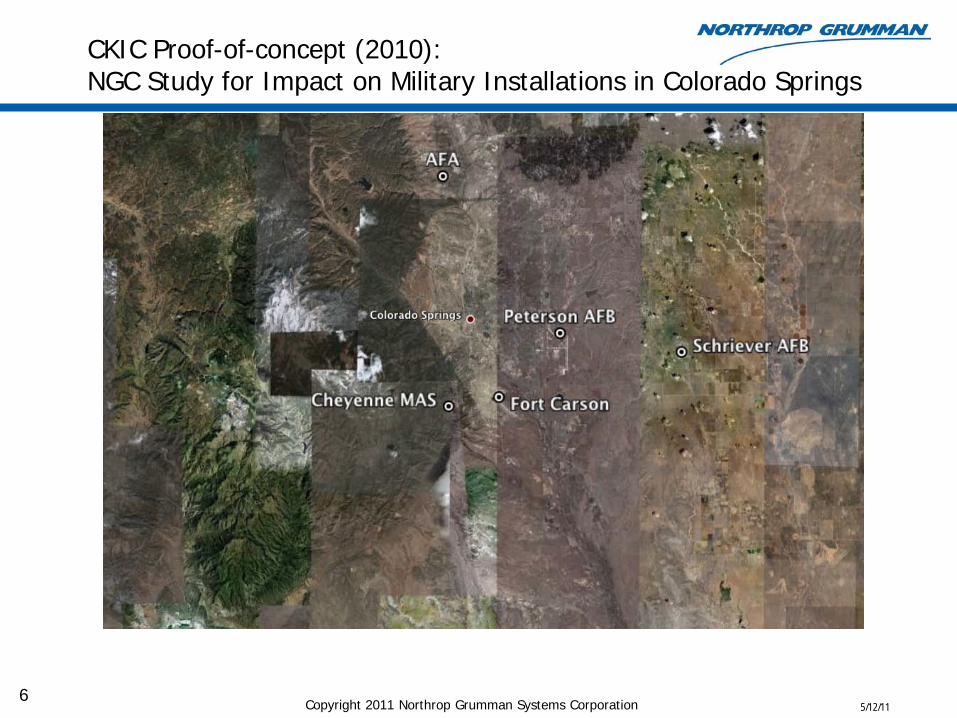
CKIC Proof-of-concept (2010):NGC Study for Impact on Military Installations in Colorado Springs
6Copyright 2011 Northrop Grumman Systems Corporation 5/12/11

Peterson AFB & Ft Carson:Natural Gas and Electrical Consumption
7
0
50000
100000
150000
200000
250000
300000
1992 1997 2002 2007
Ft Carson Natural Gas Consumption KCF
0
2000
4000
6000
8000
10000
12000
14000
16000
18000
1992 1997 2002 2007
Ft Carson Electrical Consumption MWH
Copyright 2011 Northrop Grumman Systems Corporation 5/12/11

8
CKIC Proof of Concept: Energy Use Modeling
1. Models Driven by Real World Data• Monthly Historical records of energy use• NCEP/WRF downscale historical HDDs and CDDs• Other user-provided data (e.g., square footage)
Result is an Accurate Model of Historical Energy Consumption
2. Modeling guided by Analytical Insights• Data show trends over time with complex shapes• Sensitivity of both Electrical and Gas use to both warm and cold temperatures• Fourteen parameter regression using time, floor space, and HDD/CDD data
3. Solving the Model• Robust Regression Solution• Outlier Detection• Goodness-of-fit
4. Future Energy Use from Model• Future climate data are bias corrected based upon the current period• Confidence data are produced by the model to bound uncertainty
Copyright 2011 Northrop Grumman Systems Corporation 5/12/11

9
CKIC Proof of Concept: Fort Carson & Peterson AFB Energy Demand
ECHAM5 / WRF Regional Modeling
Regional modeling builds HDD / CDD predictions which are then used to generate forecasts for changes in energy demand
Annual Energy use
Current2000-2009
Future2030-2039
Electricity GWhr 134.65 135.20
Natural Gas Millions CF 1192.16 1134.21
Peterson AFB
Fort Carson
Annual Energy use
Current2000-2009
Future2030-2039
Electricity GWhr 87.72 88.25
Natural Gas Millions CF 268.23 255.19
0
100
200
300
400
500currentfuture
0
200
400
600
800
1000
1200currentfuture
Monthly average cooling degree days Monthly average heating degree daysPeterson AFB/Fort Carson area
Note:Future EnergyDemand reflects climate change impact only!
Copyright 2011 Northrop Grumman Systems Corporation 5/12/11

US Southwest/ Military Installations: Uncertainty Representation (HDD/CDD, Energy usage)
Methodology:• Perform systematic statistical analysis to
estimate means, variances, extreme values, and standard errors
• Carry statistical analyses through to user-impact assessments
(b) Model Energy usage from Heating and Cooling degree days(c) Produce Graphical displays of Change
Signatures with confidence intervals(d) Provide detailed analytical reports for engineering-level analysis (probability distirbutions, parameterizations, as required by the specific users)
(a) Create statistical summary output databases for relevant derived parameters (expected value and standard error)
10
Engineering Level Uncertainty Expressed as Confidence IntervalsCDD σCDD
HDD σHDD
July
Janu
ary
Mill
ions
of
Cubi
c Fe
et
Copyright 2011 Northrop Grumman Systems Corporation 5/12/11

Climate Change Projections for US Southwest:Future (2030-2039) Minus Current (2000-2009)
inches
Average daily precipitation decrease by ~10-13 % Average snow fall decreases in mountain areas
Reduced annual mean accumulated snow in mountain ranges, snow falling at higher elevations creating less snowpack, and melting earlier in the year result in less fresh water availability.
When several dry years create drought conditions, reservoir levels can be reduced to levels lower than those required for hydroelectric power generation.
Hoover Dam hydropower generation may be impacted
Copyright 2011 Northrop Grumman Systems Corporation 5/12/1111

Summary
Both energy demand and supply need to be managed…
• Increased energy usage for cooling and air conditioning– Can lead to electricity shortages and blackouts – Requires conservation
• Limited energy availability for air conditioning and refrigeration– Heat stress affects operations– Increased risk of food-borne illnesses
• Climate change is projected to influence wind, cloud, and precipitation patterns– Affecting power levels from wind turbines, photovoltaics, and
hydropower – Reducing biomass feed-stocks due to decreased water levels and
increased wildfire
Integrated information management is needed to develop adaptation and mitigation strategies and planning energy security
Copyright 2011 Northrop Grumman Systems Corporation 5/12/1112