climate and air pollution in masterton - gw · this study examines the relationships between...
TRANSCRIPT

Influence of climate on air pollution in Masterton 2003 to 2015
Alex Pezza and Tamsin Mitchell Environmental Science Department
For more information, contact the Greater Wellington Regional Council:
Wellington PO Box 11646 T 04 384 5708 F 04 385 6960 www.gw.govt.nzWellington
Masterton PO Box 41 T 06 378 2484 F 06 378 2146 www.gw.govt.nzMasterton
GW/ESC-T-15/169
November 2016
www.gw.govt.nz [email protected]
Report prepared by: A. Pezza Senior Environmental Scientist, Climate
T Mitchell Team Leader, Air and Climate
Report reviewed by: K. Kozyniak Principal Scientist Climate and Air, Hawke’s Bay Regional Council
K. Kozyniak
Report approved for release by: L. Butcher Manager, Environmental Science
Date: November 2016
DISCLAIMER
This report has been prepared by Environmental Science staff of Greater Wellington Regional Council (GWRC) and as such does not constitute Council policy.
In preparing this report, the authors have used the best currently available data and have exercised all reasonable skill and care in presenting and interpreting these data. Nevertheless, GWRC does not accept any liability, whether direct, indirect, or consequential, arising out of the provision of the data and associated information within this report. Furthermore, as GWRC endeavours to continuously improve data quality, amendments to data included in, or used in the preparation of, this report may occur without notice at any time.
GWRC requests that if excerpts or inferences are drawn from this report for further use, due care should be taken to ensure the appropriate context is preserved and is accurately reflected and referenced in subsequent written or verbal communications. Any use of the data and information enclosed in this report, for example, by inclusion in a subsequent report or media release, should be accompanied by an acknowledgement of the source.
The report may be cited as:
Pezza, A. and T. Mitchell 2016. Climate and air pollution in Masterton. Greater Wellington Regional Council, Publication No. GW/ESCI-T-15/169, Wellington.
Executive summary
In Masterton, the number of high air pollution days per winter has fluctuated from year to year since monitoring began in 2003, with a dramatic reduction observed in 2015. This study examines the relationships between large-scale climate factors, local wind conditions and air pollution levels.
Although it is estimated that emissions from domestic heating in Masterton have reduced by 14% (between 2006 and 2013), this is not reflected as a steady decline in PM10 levels measured. The levels of winter PM10 fluctuate from year-to-year depending on local wind speeds and average minimum temperature. Local wind speeds are influenced by the pattern of large-scale winds that affect New Zealand. However, local wind speed and average minimum temperatures only explain some of the year-to-year variation in air pollution levels.
The intensity of extra-tropical cyclone activity in the Southern Ocean appears to exert a strong influence on year-to-year variability in PM10 levels. More intense extra-tropical cyclone activity is likely to be associated with an increased number of cold fronts passing over the country. This increased frontal activity may cause greater atmospheric instability which favours local dispersion of air pollution.
One of the driving factors behind the intensity of extra-tropical cyclone activity in a given winter is the phase and strength of the El Niño Southern Oscillation (ENSO). Between 2003 and 2015 there was one strong El Niño winter (2015). El Niño events are associated with much greater frequency of large-scale westerly winds. This study showed that the intense El Niño in 2015 coincided with much higher than average local wind speeds and very intense cyclone activity south of New Zealand. Therefore, despite colder than average temperatures in Masterton during winter 2015, the strong El Niño conditions most likely led to lower than expected number of PM10 exceedances of the National Environmental Standard for Air Quality (NES-AQ). It is expected that winter winds will return to more normal levels as the El Niño dissipates in mid-2016.


Contents
Executive summary i
1. Introduction 1
2. Background 2 2.1 Masterton’s climate and topography 2 2.2 Climate drivers 3
3. Objectives of this study 4
4. Methodology 5 4.1 Air quality and meteorological datasets 5 4.2 Definition of a high air pollution day 5 4.3 Analysis of climate drivers 6 4.3.1 Extra-tropical cyclone count 6 4.3.2 Global climate drivers 6 4.4 Statistical analysis 7
5. Results and discussion 8 5.1 Trends in air pollution and wood burner emissions 8 5.1.1 Trends in PM10 8 5.1.2 Trends in emissions from wood burning 10 5.2 Influence of local wind and temperature on PM10 11 5.2.1 Long term seasonal trends between 2003 and 2015 11 5.3 Influence of large-scale seasonal wind speed anomalies on PM10 13 5.4 New Zealand circulation indices 15 5.5 Influence of seasonal extra-tropical cyclone intensity on PM10 16 5.6 Influence of global climate drivers on PM10 16
6. Conclusion 19
Acknowledgements 21
Appendix 1: Winter PM10 metrics and climate variables 22
Appendix 2: Large-scale wind speed anomalies 23
Appendix 3: Correlation matrix of all variables 24
Appendix 4: Extra-tropical cyclone density 25
References 26


Influene of climate on air pollution in Masterton
PAGE 1 OF 27
1. Introduction The township of Masterton, located on the Wairarapa plains, is prone to air pollution in winter arising from the use of solid fuels for home heating, particularly during periods of cold temperatures and calm wind conditions. The Masterton urban area is designated as a “polluted airshed” under the National Environmental Standard for Air Quality (NES-AQ) because there are multiple days per year when the PM10 24-hour average of 50 µg/m3 is exceeded. The NES-AQ requires the number of PM10 exceedances to be reduced to three per year by 1 September 2016 and then to one per year by 1 September 2020.
The number of PM10 exceedances measured in Masterton fluctuates from year to year. Air quality has been measured in west Masterton (Masterton West monitoring site) since 2003, with the number of exceedances ranging from zero to five per year. In 2012 a second monitoring station was installed on the east side of Masterton (Masterton East site). This area experiences poorer air quality with more than 10 exceedances per year recorded between 2012 and 2014. However, in 2015 the number of exceedances recorded at Masterton East dropped to four. This is a significant reduction and it is not known whether this is due to a reduction in home heating emissions, climatic effects or some combination of the two.
The core purpose of this report is to test whether the annual variation in frequency of high air pollution days can be explained by seasonal climatic patterns, in particular the dramatic reduction in levels of air pollution observed in 2015 at the Masterton East site.
The results of this study will further our understanding of the influence of climate on air pollution trends and the likelihood of attaining the NES-AQ in Masterton.
Influence of climate on air pollution in Masterton
PAGE 2 OF 27
2. Background Masterton is an urban area in the Wairarapa with a population of 18,135 comprising 7,521 private dwellings (Statistics New Zealand, 2013). Masterton is situated 85 km north-east of Wellington City and 70 km south of Palmerston North. Around two-thirds (67%) of Masterton’s households report using solid fuels for heating during winter (Statistics New Zealand, 2013). The use of solid fuels for home heating leads to elevated levels of PM10 and PM2.5 in outdoor air during the months of May, June, July and August (Davy, 2007).
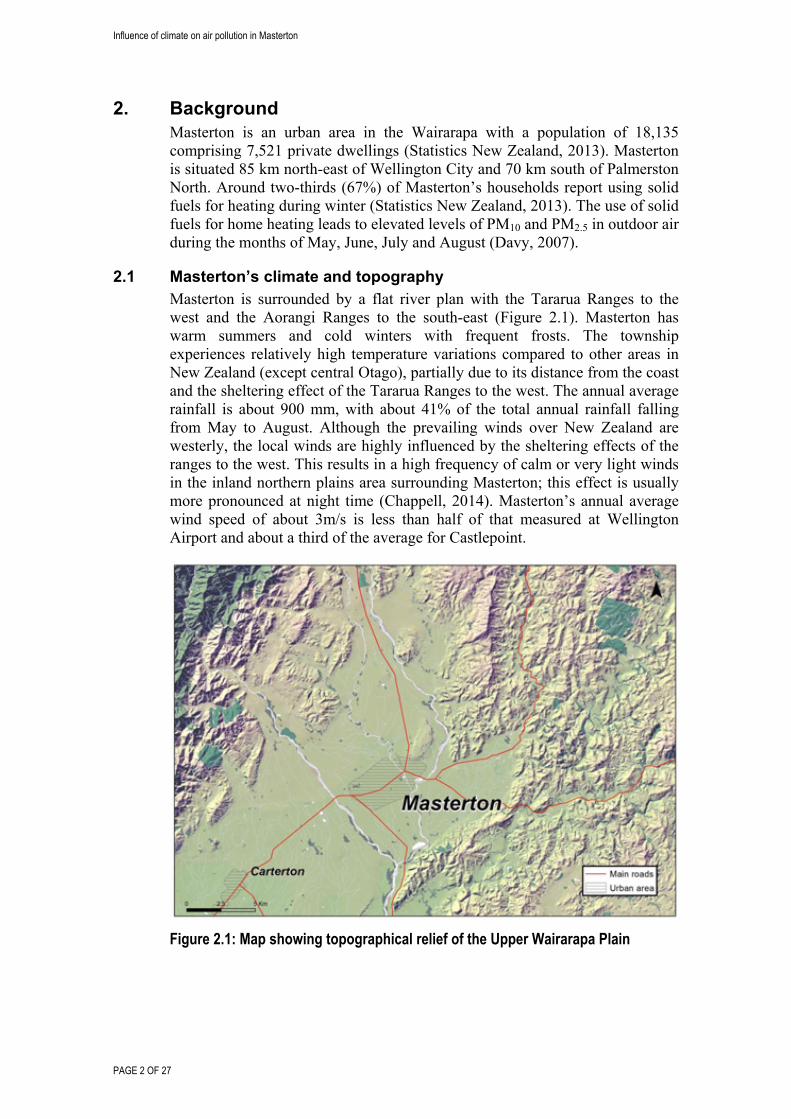
2.1 Masterton’s climate and topography Masterton is surrounded by a flat river plan with the Tararua Ranges to the west and the Aorangi Ranges to the south-east (Figure 2.1). Masterton has warm summers and cold winters with frequent frosts. The township experiences relatively high temperature variations compared to other areas in New Zealand (except central Otago), partially due to its distance from the coast and the sheltering effect of the Tararua Ranges to the west. The annual average rainfall is about 900 mm, with about 41% of the total annual rainfall falling from May to August. Although the prevailing winds over New Zealand are westerly, the local winds are highly influenced by the sheltering effects of the ranges to the west. This results in a high frequency of calm or very light winds in the inland northern plains area surrounding Masterton; this effect is usually more pronounced at night time (Chappell, 2014). Masterton’s annual average wind speed of about 3m/s is less than half of that measured at Wellington Airport and about a third of the average for Castlepoint.
Figure 2.1: Map showing topographical relief of the Upper Wairarapa Plain

Influene of climate on air pollution in Masterton
PAGE 3 OF 27
2.2 Climate drivers A large-scale influence on the New Zealand climate is the El Niño Southern Oscillation (ENSO). ENSO is a naturally occurring phenomenon that involves fluctuating ocean temperatures in the equatorial Pacific. ENSO has three phases: El Niño (warm phase), La Niña (cold phase) and a neutral phase. El Niño and La Niña occur irregularly, typically every two to seven years, and their relative strength can vary from phase to phase.
ENSO affects regional climate variation, in particular wind strength and amount of rain. When ENSO is in its warm phase (El Niño), westerly winds tend to increase over New Zealand (Gordon, 1986), with less likelihood of anticyclones becoming too persistent or stationary. Although ENSO has a periodicity of about two to seven years, it can be predicted by climate models six months to a year in advance. The strength of El Niño and La Niña events can be measured by the Southern Oscillation Index (SOI)1.
The Southern Annular Mode (SAM) is another important climate influencer for New Zealand. SAM describes the north-south movement of the westerly wind belt that circles Antarctica, dominating the middle to higher latitudes of the southern hemisphere. SAM has a week-to-week cycle causing either windier or calmer weather across New Zealand. The negative phase of SAM is associated with more frequent westerly winds, unsettled conditions and storm activity.
Trenberth (1976) defined a number of circulation indices for New Zealand to describe the strength of zonal (west/east) and meridional (north/south) wind flow over the country. The Z1 index is defined as the pressure difference between Auckland and Christchurch, relative to the long term average. In this study Trenberth Z1 indices produced by NIWA (Salinger et al. 1999) are used to represent large-scale wind behaviour (across the west/east gradient) through pressure measurements.
Another relevant climate indicator is the total extra-tropical cyclone counts representing the extension of the circumpolar trough between 60 and 40 degrees of latitude (Simmonds & Keay, 2000; Pezza & Ambrizzi, 2003). The extra-tropical cyclone counts are an indicator of how the atmosphere responds to the global climate drivers at the synoptic2 and seasonal scale. Drivers such ENSO change the way that mass (pressure) and temperature is distributed between the equator and the poles, and this distribution determines the intensity of extra-tropical cyclones and fronts. Those, in turn, influence seasonal winds as well as the daily weather patterns that can ultimately influence pollution dispersion at the microclimate scale.
1 Sustained positive SOI values above +8 indicate a La Niña event while sustained negative values below about -8 indicate an El Niño. 2 The synoptic scale covers a horizontal distance of about 1000 km, for example, most high and low pressure areas seen on weather maps.
Influence of climate on air pollution in Masterton
PAGE 4 OF 27
3. Objectives of this study i) Determine how much of the year-to-year difference in the number of
high pollution days and in the average winter PM10 recorded for Masterton can be explained by climatic factors.
ii) Investigate the influence of global climate drivers, ENSO and SAM, on climatic factors that affect air pollution levels in Masterton.
iii) Investigate possible climatic factors that might be responsible for the very low number of PM10 exceedances recorded in 2015 in Masterton.
Influene of climate on air pollution in Masterton
PAGE 5 OF 27
4. Methodology
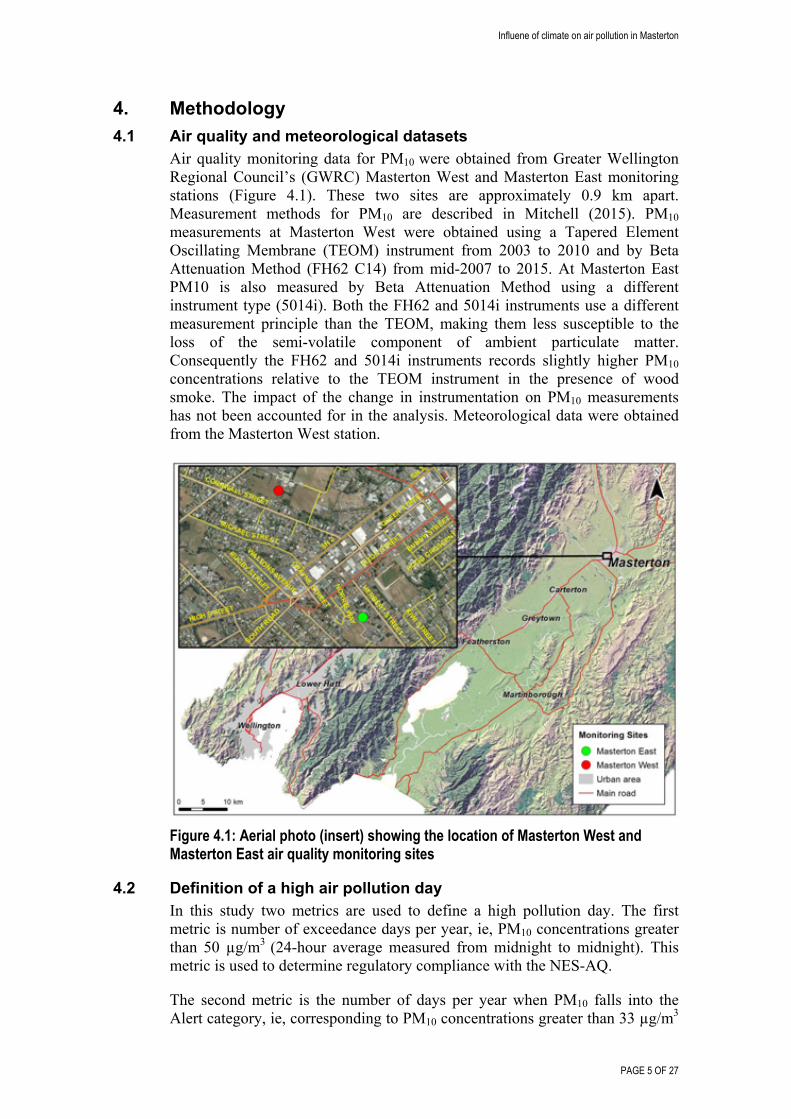
4.1 Air quality and meteorological datasets Air quality monitoring data for PM10 were obtained from Greater Wellington Regional Council’s (GWRC) Masterton West and Masterton East monitoring stations (Figure 4.1). These two sites are approximately 0.9 km apart. Measurement methods for PM10 are described in Mitchell (2015). PM10 measurements at Masterton West were obtained using a Tapered Element Oscillating Membrane (TEOM) instrument from 2003 to 2010 and by Beta Attenuation Method (FH62 C14) from mid-2007 to 2015. At Masterton East PM10 is also measured by Beta Attenuation Method using a different instrument type (5014i). Both the FH62 and 5014i instruments use a different measurement principle than the TEOM, making them less susceptible to the loss of the semi-volatile component of ambient particulate matter. Consequently the FH62 and 5014i instruments records slightly higher PM10 concentrations relative to the TEOM instrument in the presence of wood smoke. The impact of the change in instrumentation on PM10 measurements has not been accounted for in the analysis. Meteorological data were obtained from the Masterton West station.
Figure 4.1: Aerial photo (insert) showing the location of Masterton West and Masterton East air quality monitoring sites
4.2 Definition of a high air pollution day In this study two metrics are used to define a high pollution day. The first metric is number of exceedance days per year, ie, PM10 concentrations greater than 50 µg/m3 (24-hour average measured from midnight to midnight). This metric is used to determine regulatory compliance with the NES-AQ.
The second metric is the number of days per year when PM10 falls into the Alert category, ie, corresponding to PM10 concentrations greater than 33 µg/m3
Influence of climate on air pollution in Masterton
PAGE 6 OF 27
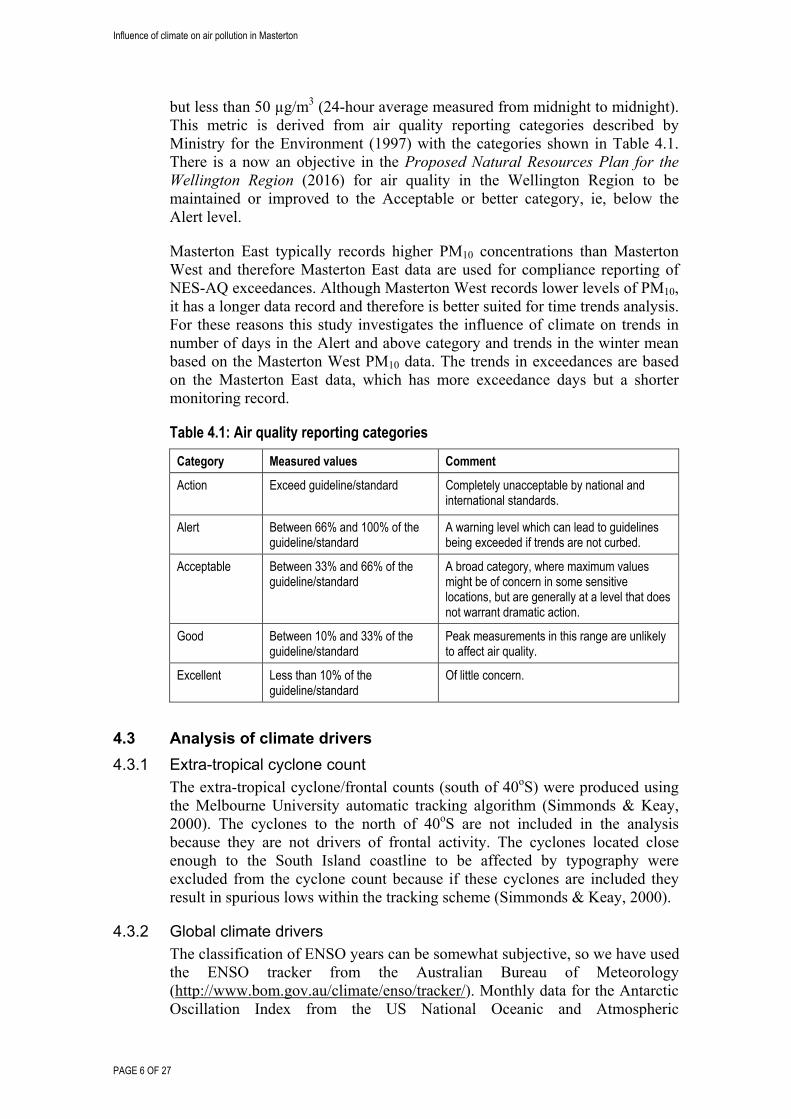
but less than 50 µg/m3 (24-hour average measured from midnight to midnight). This metric is derived from air quality reporting categories described by Ministry for the Environment (1997) with the categories shown in Table 4.1. There is a now an objective in the Proposed Natural Resources Plan for the Wellington Region (2016) for air quality in the Wellington Region to be maintained or improved to the Acceptable or better category, ie, below the Alert level.
Masterton East typically records higher PM10 concentrations than Masterton West and therefore Masterton East data are used for compliance reporting of NES-AQ exceedances. Although Masterton West records lower levels of PM10, it has a longer data record and therefore is better suited for time trends analysis. For these reasons this study investigates the influence of climate on trends in number of days in the Alert and above category and trends in the winter mean based on the Masterton West PM10 data. The trends in exceedances are based on the Masterton East data, which has more exceedance days but a shorter monitoring record.
Table 4.1: Air quality reporting categories
Category Measured values Comment
Action Exceed guideline/standard Completely unacceptable by national and international standards.
Alert Between 66% and 100% of the guideline/standard
A warning level which can lead to guidelines being exceeded if trends are not curbed.
Acceptable Between 33% and 66% of the guideline/standard
A broad category, where maximum values might be of concern in some sensitive locations, but are generally at a level that does not warrant dramatic action.
Good Between 10% and 33% of the guideline/standard
Peak measurements in this range are unlikely to affect air quality.
Excellent Less than 10% of the guideline/standard
Of little concern.
4.3 Analysis of climate drivers
4.3.1 Extra-tropical cyclone count The extra-tropical cyclone/frontal counts (south of 40oS) were produced using the Melbourne University automatic tracking algorithm (Simmonds & Keay, 2000). The cyclones to the north of 40oS are not included in the analysis because they are not drivers of frontal activity. The cyclones located close enough to the South Island coastline to be affected by typography were excluded from the cyclone count because if these cyclones are included they result in spurious lows within the tracking scheme (Simmonds & Keay, 2000).
4.3.2 Global climate drivers The classification of ENSO years can be somewhat subjective, so we have used the ENSO tracker from the Australian Bureau of Meteorology (http://www.bom.gov.au/climate/enso/tracker/). Monthly data for the Antarctic Oscillation Index from the US National Oceanic and Atmospheric
Influene of climate on air pollution in Masterton
PAGE 7 OF 27
Administration (NOAA) (representing the strength SAM) and the Trenberth Z1 index (representing the strength of the westerly wind) produced by NIWA were also used. The Trenberth index was normalised over the 1981-2010 reference period.
4.4 Statistical analysis Simple and multiple linear regressions were performed using R version 3.1.3 (R Core Team, 2015). Data aggregation, time series, scatterplots, correlation plots were produced using the R package Openair (Carslaw & Ropkins, 2012).
Pearson’s correlation coefficients are used to test for presence of linear relationships between variables noting that correlation does not imply causation. The small sample size (n = 13) due to only 13 years of data being available for analysis at the seasonal level means the confidence intervals for the correlation coefficients will be quite wide. Correlation coefficients between +/- 0.5 and +/- 0.8 are described as moderate strength, and above +/- 0.8 as strong (Devore & Farnum, 2005). All correlation coefficients were tested to ensure that they were significantly different from zero at the 95% confidence level, ie, p ≤ 0.05.
Influence of climate on air pollution in Masterton
PAGE 8 OF 27
5. Results and discussion This section examines and discusses:
Trends in the number of high air pollution days, average winter PM10 and emissions between 2003 and 2015 (Section 5.1)
Influence of local wind speed and minimum temperature on inter-annual variation in average winter PM10 (Section 5.2)
Influence of large-scale seasonal wind anomalies on local wind speed and PM10 levels (Section 5.3)
Correlations between PM10 metrics and a New Zealand circulation index (Section 5.4) and extra-tropical cyclone intensity (Section 5.5)
The impact of global climate drivers (ENSO and SAM) on large-scale winds and extra-tropical cyclone intensity and the potential influence on local air pollution (Section 5.6).
5.1 Trends in air pollution and wood burner emissions
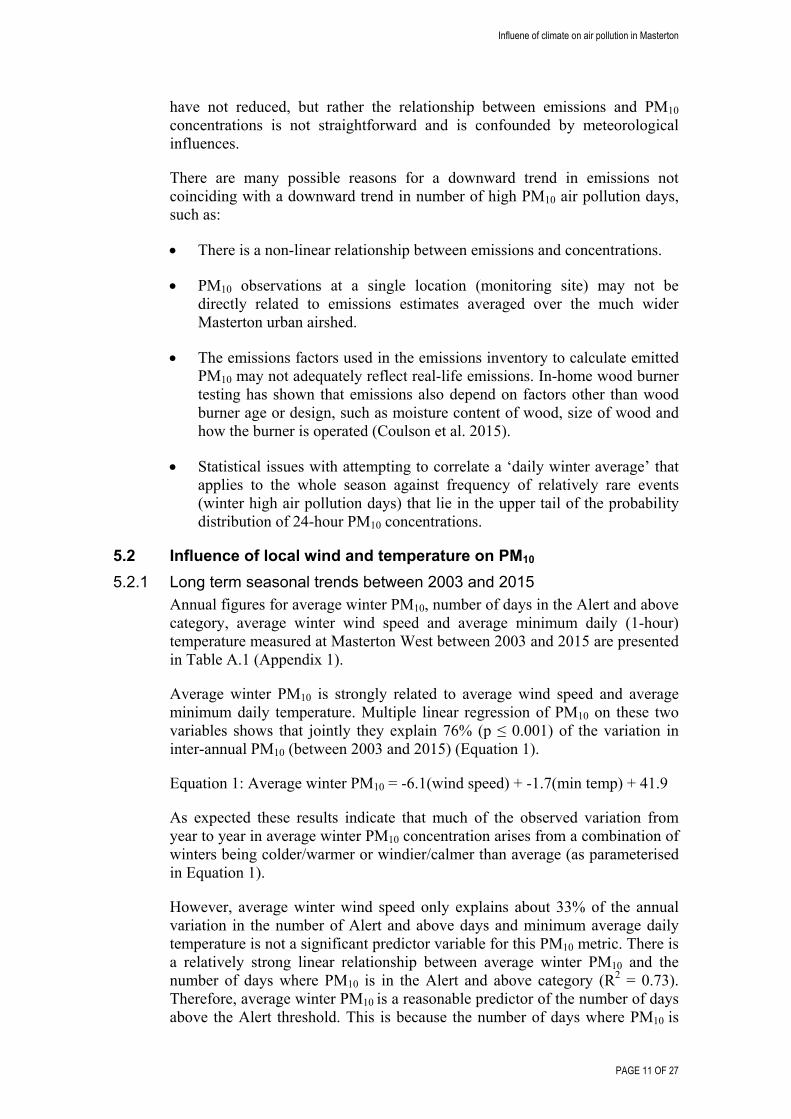
5.1.1 Trends in PM10 Daily PM10 observed at Masterton West and Masterton East (Figure 5.1) showed strong seasonality due to the influence of emissions from home heating during the winter period. There appears to be a downward trend in annual average PM10 measured at Masterton West (Figure 5.2). A trend in average winter PM10 (Figure 5.2) is less clear due to inter-annual variability, particularly the influence of 2012 which was the highest air pollution year measured to date. There is also no evidence of long-term trends in the number of high air pollution days per year at Masterton West (Figure 5.3), although they have decreased at both the East and the West sites since 2012, particularly between 2014 and 2015 at Masterton East (Figure 5.4).

Influene of climate on air pollution in Masterton
PAGE 9 OF 27
Figure 5.1: Time series of 24-hour average PM10 at Masterton West and Masterton East with NES-AQ threshold shown as solid red line and Alert threshold shown as dashed red line
Figure 5.2: PM10 annual average and winter average from 2003 to 2015 at Masterton West
0
5
10
15
20
25
2003 2004 2005 2006 2007 2008 2009 2010 2011 2012 2013 2014 2015
PM
10(µg/m
3)
Winter average Annual average
Influence of climate on air pollution in Masterton
PAGE 10 OF 27
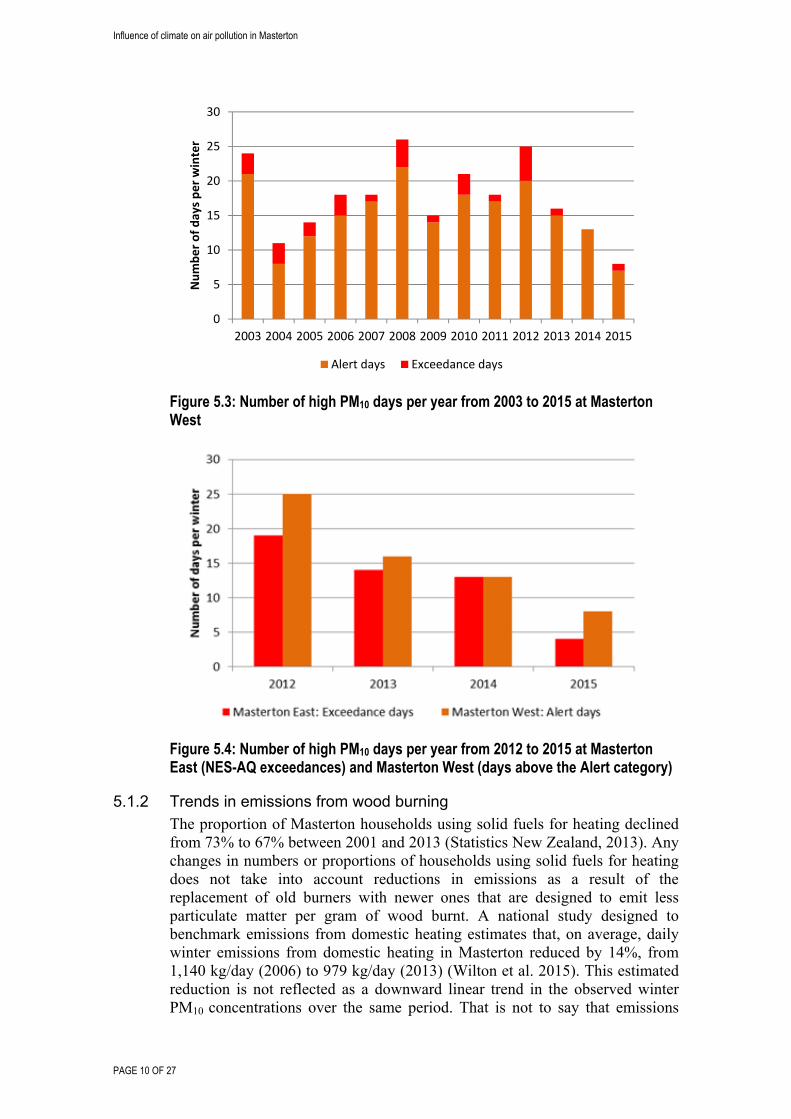
Figure 5.3: Number of high PM10 days per year from 2003 to 2015 at Masterton West
Figure 5.4: Number of high PM10 days per year from 2012 to 2015 at Masterton East (NES-AQ exceedances) and Masterton West (days above the Alert category)
5.1.2 Trends in emissions from wood burning The proportion of Masterton households using solid fuels for heating declined from 73% to 67% between 2001 and 2013 (Statistics New Zealand, 2013). Any changes in numbers or proportions of households using solid fuels for heating does not take into account reductions in emissions as a result of the replacement of old burners with newer ones that are designed to emit less particulate matter per gram of wood burnt. A national study designed to benchmark emissions from domestic heating estimates that, on average, daily winter emissions from domestic heating in Masterton reduced by 14%, from 1,140 kg/day (2006) to 979 kg/day (2013) (Wilton et al. 2015). This estimated reduction is not reflected as a downward linear trend in the observed winter PM10 concentrations over the same period. That is not to say that emissions
0
5
10
15
20
25
30
2003 2004 2005 2006 2007 2008 2009 2010 2011 2012 2013 2014 2015
Number of days per winter
Alert days Exceedance days
Influene of climate on air pollution in Masterton
PAGE 11 OF 27
have not reduced, but rather the relationship between emissions and PM10 concentrations is not straightforward and is confounded by meteorological influences.
There are many possible reasons for a downward trend in emissions not coinciding with a downward trend in number of high PM10 air pollution days, such as:
There is a non-linear relationship between emissions and concentrations.
PM10 observations at a single location (monitoring site) may not be directly related to emissions estimates averaged over the much wider Masterton urban airshed.
The emissions factors used in the emissions inventory to calculate emitted PM10 may not adequately reflect real-life emissions. In-home wood burner testing has shown that emissions also depend on factors other than wood burner age or design, such as moisture content of wood, size of wood and how the burner is operated (Coulson et al. 2015).
Statistical issues with attempting to correlate a ‘daily winter average’ that applies to the whole season against frequency of relatively rare events (winter high air pollution days) that lie in the upper tail of the probability distribution of 24-hour PM10 concentrations.
5.2 Influence of local wind and temperature on PM10
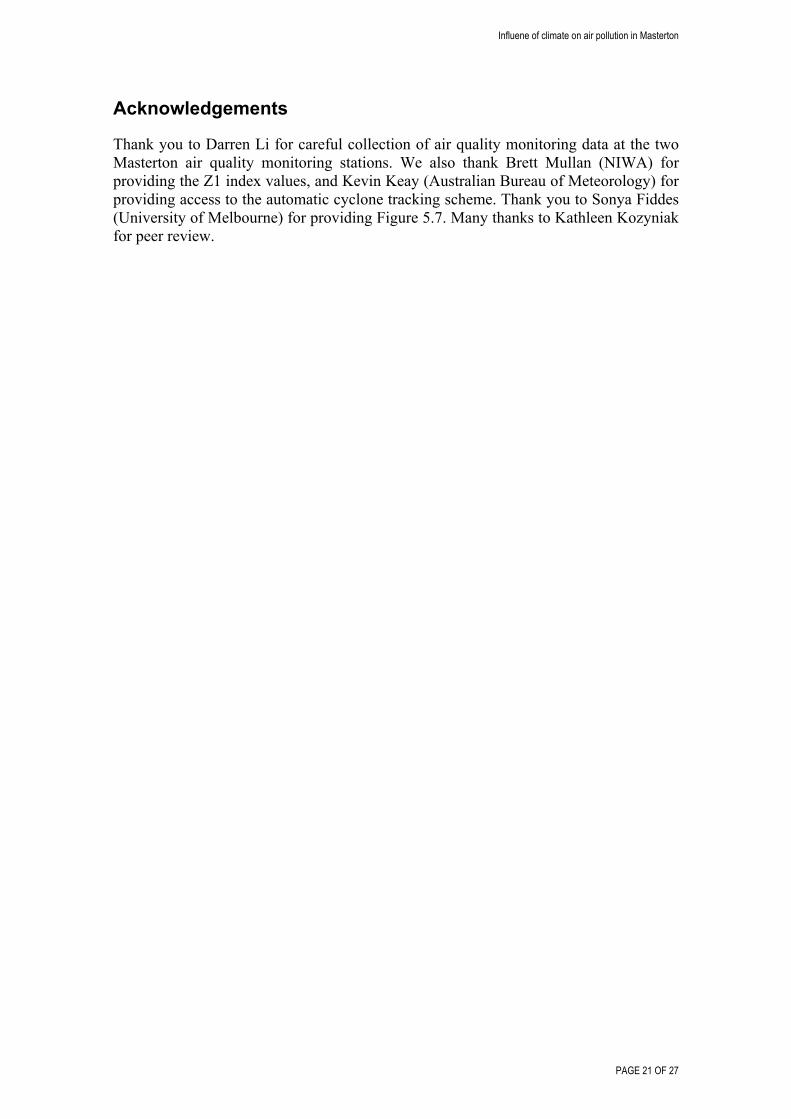
5.2.1 Long term seasonal trends between 2003 and 2015 Annual figures for average winter PM10, number of days in the Alert and above category, average winter wind speed and average minimum daily (1-hour) temperature measured at Masterton West between 2003 and 2015 are presented in Table A.1 (Appendix 1).
Average winter PM10 is strongly related to average wind speed and average minimum daily temperature. Multiple linear regression of PM10 on these two variables shows that jointly they explain 76% (p ≤ 0.001) of the variation in inter-annual PM10 (between 2003 and 2015) (Equation 1).
Equation 1: Average winter PM10 = -6.1(wind speed) + -1.7(min temp) + 41.9
As expected these results indicate that much of the observed variation from year to year in average winter PM10 concentration arises from a combination of winters being colder/warmer or windier/calmer than average (as parameterised in Equation 1).
However, average winter wind speed only explains about 33% of the annual variation in the number of Alert and above days and minimum average daily temperature is not a significant predictor variable for this PM10 metric. There is a relatively strong linear relationship between average winter PM10 and the number of days where PM10 is in the Alert and above category (R2 = 0.73). Therefore, average winter PM10 is a reasonable predictor of the number of days above the Alert threshold. This is because the number of days where PM10 is
Influence of climate on air pollution in Masterton
PAGE 12 OF 27
above 33 µg/m3 is related to the average, ie, a greater number of days above 33 µg/m3 shifts the distribution to the right.
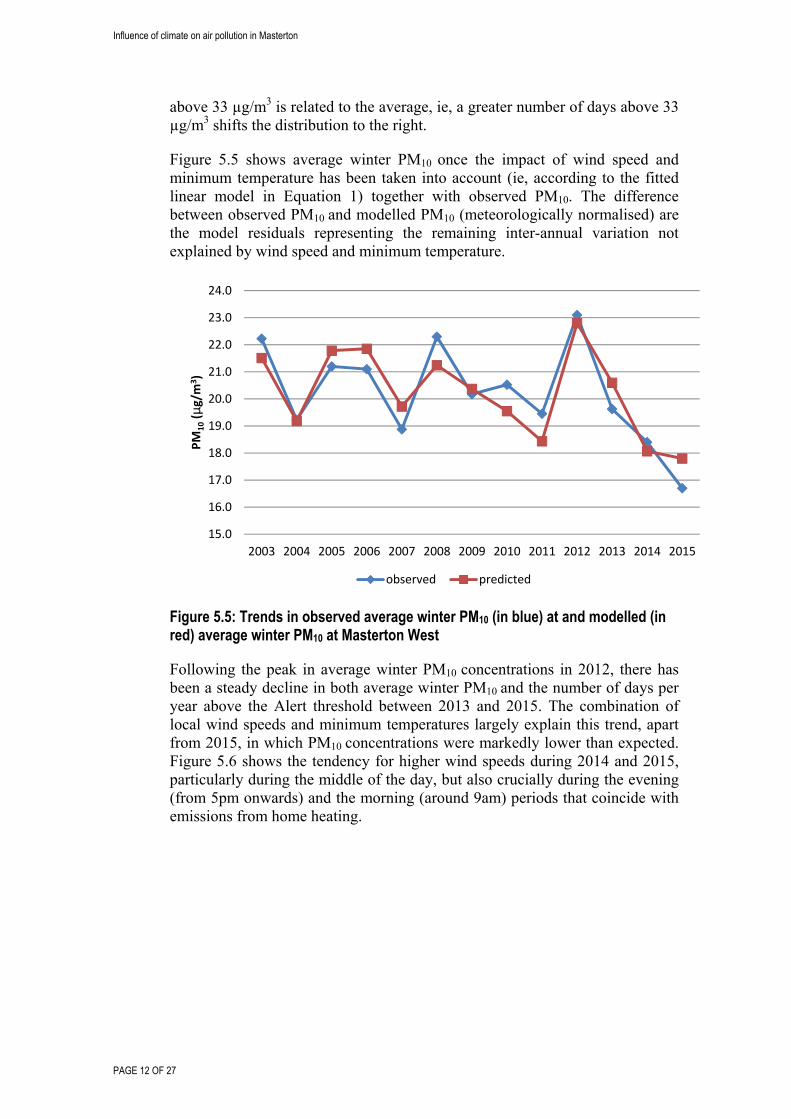
Figure 5.5 shows average winter PM10 once the impact of wind speed and minimum temperature has been taken into account (ie, according to the fitted linear model in Equation 1) together with observed PM10. The difference between observed PM10 and modelled PM10 (meteorologically normalised) are the model residuals representing the remaining inter-annual variation not explained by wind speed and minimum temperature.
Figure 5.5: Trends in observed average winter PM10 (in blue) at and modelled (in red) average winter PM10 at Masterton West
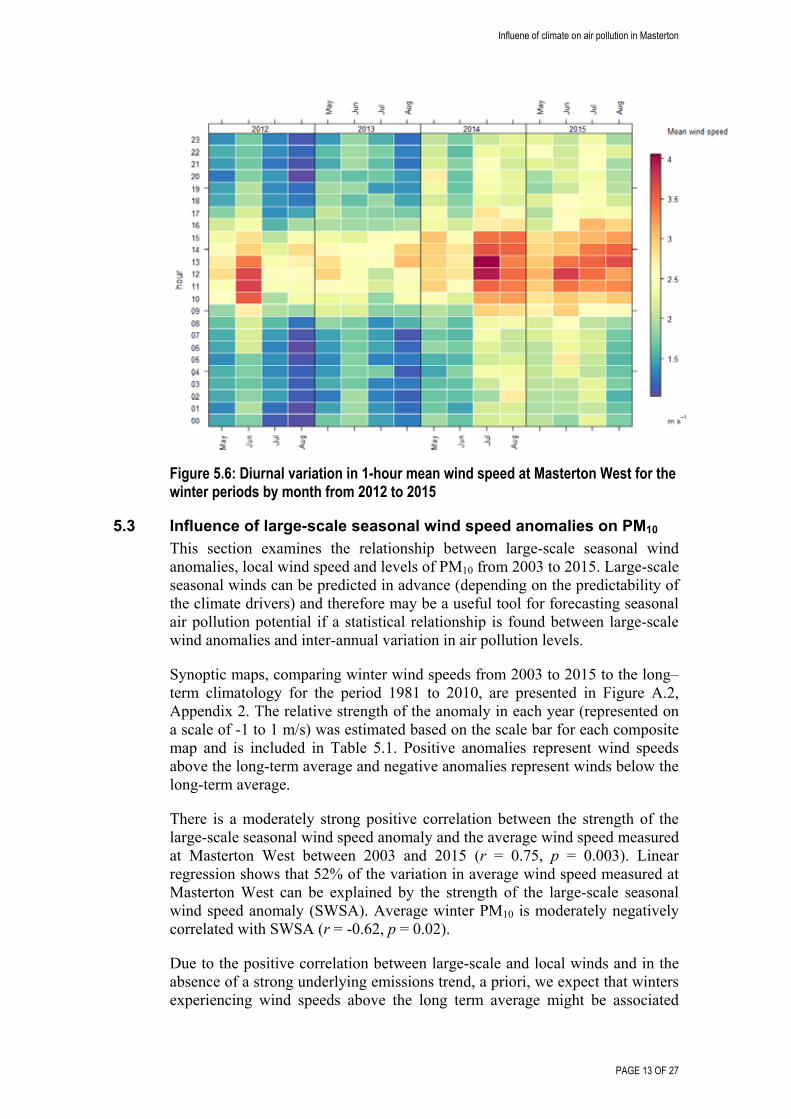
Following the peak in average winter PM10 concentrations in 2012, there has been a steady decline in both average winter PM10 and the number of days per year above the Alert threshold between 2013 and 2015. The combination of local wind speeds and minimum temperatures largely explain this trend, apart from 2015, in which PM10 concentrations were markedly lower than expected. Figure 5.6 shows the tendency for higher wind speeds during 2014 and 2015, particularly during the middle of the day, but also crucially during the evening (from 5pm onwards) and the morning (around 9am) periods that coincide with emissions from home heating.
15.0
16.0
17.0
18.0
19.0
20.0
21.0
22.0
23.0
24.0
2003 2004 2005 2006 2007 2008 2009 2010 2011 2012 2013 2014 2015
PM
10(µg/m
3)
observed predicted
Influene of climate on air pollution in Masterton
PAGE 13 OF 27
Figure 5.6: Diurnal variation in 1-hour mean wind speed at Masterton West for the winter periods by month from 2012 to 2015
5.3 Influence of large-scale seasonal wind speed anomalies on PM10 This section examines the relationship between large-scale seasonal wind anomalies, local wind speed and levels of PM10 from 2003 to 2015. Large-scale seasonal winds can be predicted in advance (depending on the predictability of the climate drivers) and therefore may be a useful tool for forecasting seasonal air pollution potential if a statistical relationship is found between large-scale wind anomalies and inter-annual variation in air pollution levels.
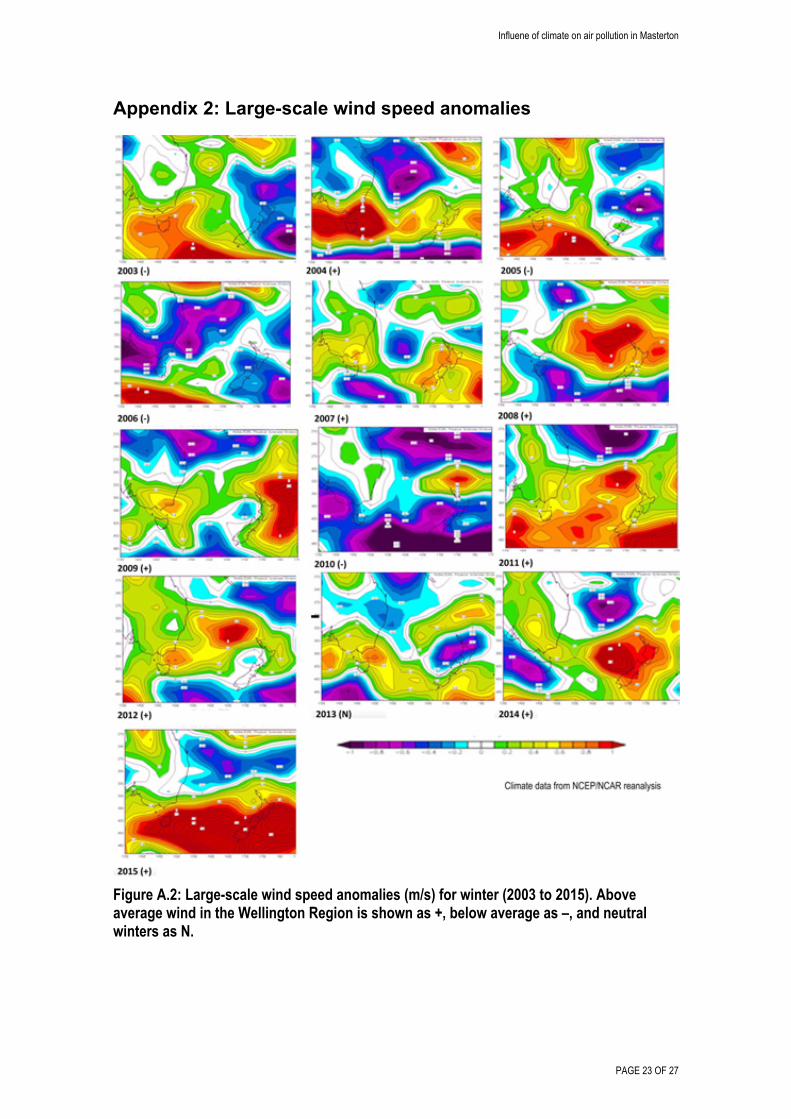
Synoptic maps, comparing winter wind speeds from 2003 to 2015 to the long–term climatology for the period 1981 to 2010, are presented in Figure A.2, Appendix 2. The relative strength of the anomaly in each year (represented on a scale of -1 to 1 m/s) was estimated based on the scale bar for each composite map and is included in Table 5.1. Positive anomalies represent wind speeds above the long-term average and negative anomalies represent winds below the long-term average.
There is a moderately strong positive correlation between the strength of the large-scale seasonal wind speed anomaly and the average wind speed measured at Masterton West between 2003 and 2015 (r = 0.75, p = 0.003). Linear regression shows that 52% of the variation in average wind speed measured at Masterton West can be explained by the strength of the large-scale seasonal wind speed anomaly (SWSA). Average winter PM10 is moderately negatively correlated with SWSA (r = -0.62, p = 0.02).
Due to the positive correlation between large-scale and local winds and in the absence of a strong underlying emissions trend, a priori, we expect that winters experiencing wind speeds above the long term average might be associated
Influence of climate on air pollution in Masterton
PAGE 14 OF 27
with lower concentrations of PM10 due to increased dispersive capacity of the atmosphere.
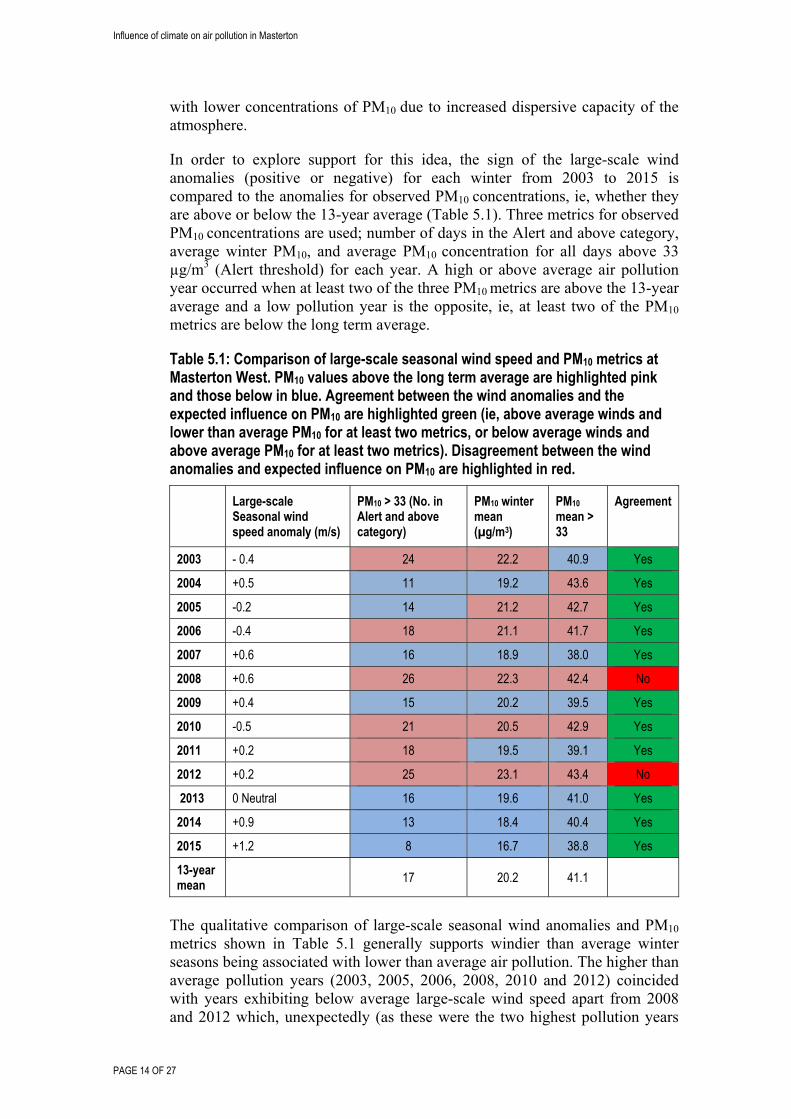
In order to explore support for this idea, the sign of the large-scale wind anomalies (positive or negative) for each winter from 2003 to 2015 is compared to the anomalies for observed PM10 concentrations, ie, whether they are above or below the 13-year average (Table 5.1). Three metrics for observed PM10 concentrations are used; number of days in the Alert and above category, average winter PM10, and average PM10 concentration for all days above 33 µg/m3 (Alert threshold) for each year. A high or above average air pollution year occurred when at least two of the three PM10 metrics are above the 13-year average and a low pollution year is the opposite, ie, at least two of the PM10
metrics are below the long term average.
Table 5.1: Comparison of large-scale seasonal wind speed and PM10 metrics at Masterton West. PM10 values above the long term average are highlighted pink and those below in blue. Agreement between the wind anomalies and the expected influence on PM10 are highlighted green (ie, above average winds and lower than average PM10 for at least two metrics, or below average winds and above average PM10 for at least two metrics). Disagreement between the wind anomalies and expected influence on PM10 are highlighted in red.
Large-scale Seasonal wind speed anomaly (m/s)
PM10 > 33 (No. in Alert and above category)
PM10 winter mean (µg/m3)
PM10 mean > 33
Agreement
2003 - 0.4 24 22.2 40.9 Yes
2004 +0.5 11 19.2 43.6 Yes
2005 -0.2 14 21.2 42.7 Yes
2006 -0.4 18 21.1 41.7 Yes
2007 +0.6 16 18.9 38.0 Yes
2008 +0.6 26 22.3 42.4 No
2009 +0.4 15 20.2 39.5 Yes
2010 -0.5 21 20.5 42.9 Yes
2011 +0.2 18 19.5 39.1 Yes
2012 +0.2 25 23.1 43.4 No
2013 0 Neutral 16 19.6 41.0 Yes
2014 +0.9 13 18.4 40.4 Yes
2015 +1.2 8 16.7 38.8 Yes
13-year mean
17 20.2 41.1
The qualitative comparison of large-scale seasonal wind anomalies and PM10 metrics shown in Table 5.1 generally supports windier than average winter seasons being associated with lower than average air pollution. The higher than average pollution years (2003, 2005, 2006, 2008, 2010 and 2012) coincided with years exhibiting below average large-scale wind speed apart from 2008 and 2012 which, unexpectedly (as these were the two highest pollution years
Influene of climate on air pollution in Masterton
PAGE 15 OF 27
on record) are associated with above average large-scale wind speed. All of the years classified as having lower than average PM10 concentrations (2004, 2007, 2009, 2014, 2015) are associated with higher than average large-scale wind speed, except 2013 which had neutral conditions but with an area of enhanced winds just south of Masterton.
Possible reasons for 2008 and 2012 experiencing higher than average pollution, despite positive anomalies for large-scale winds, will be explored in Section 5.6.
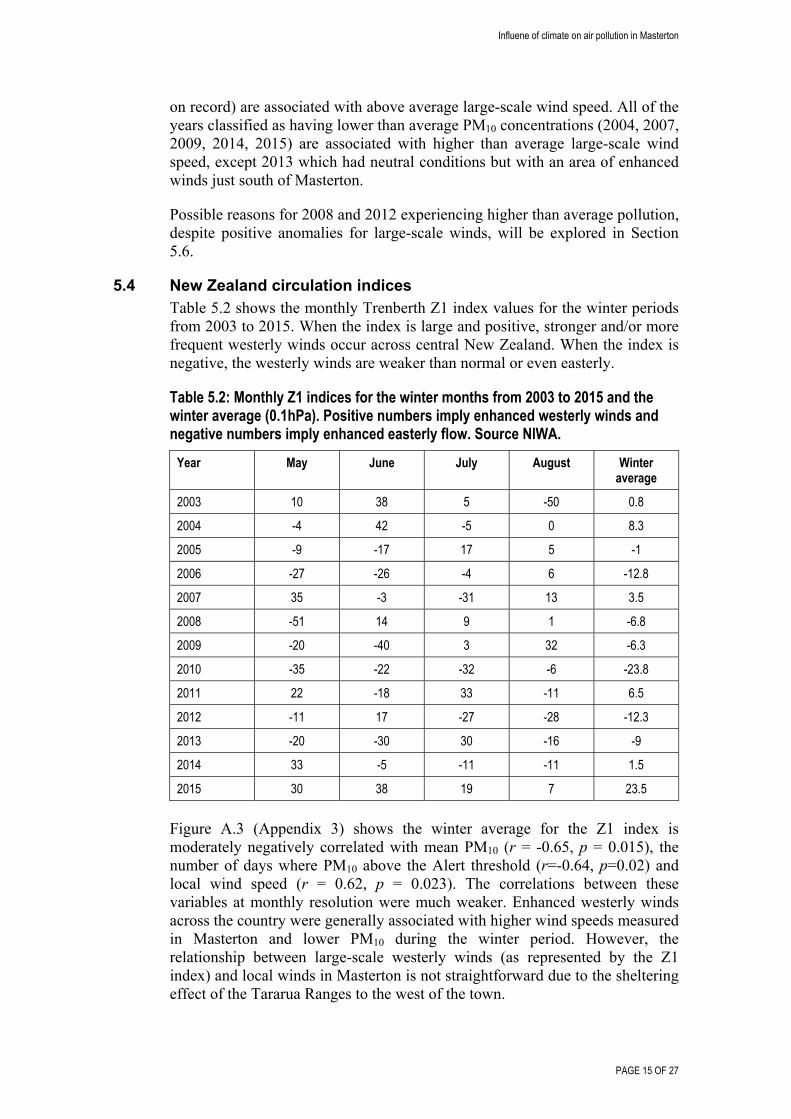
5.4 New Zealand circulation indices Table 5.2 shows the monthly Trenberth Z1 index values for the winter periods from 2003 to 2015. When the index is large and positive, stronger and/or more frequent westerly winds occur across central New Zealand. When the index is negative, the westerly winds are weaker than normal or even easterly.
Table 5.2: Monthly Z1 indices for the winter months from 2003 to 2015 and the winter average (0.1hPa). Positive numbers imply enhanced westerly winds and negative numbers imply enhanced easterly flow. Source NIWA.
Year May June July August Winter average
2003 10 38 5 -50 0.8
2004 -4 42 -5 0 8.3
2005 -9 -17 17 5 -1
2006 -27 -26 -4 6 -12.8
2007 35 -3 -31 13 3.5
2008 -51 14 9 1 -6.8
2009 -20 -40 3 32 -6.3
2010 -35 -22 -32 -6 -23.8
2011 22 -18 33 -11 6.5
2012 -11 17 -27 -28 -12.3
2013 -20 -30 30 -16 -9
2014 33 -5 -11 -11 1.5
2015 30 38 19 7 23.5
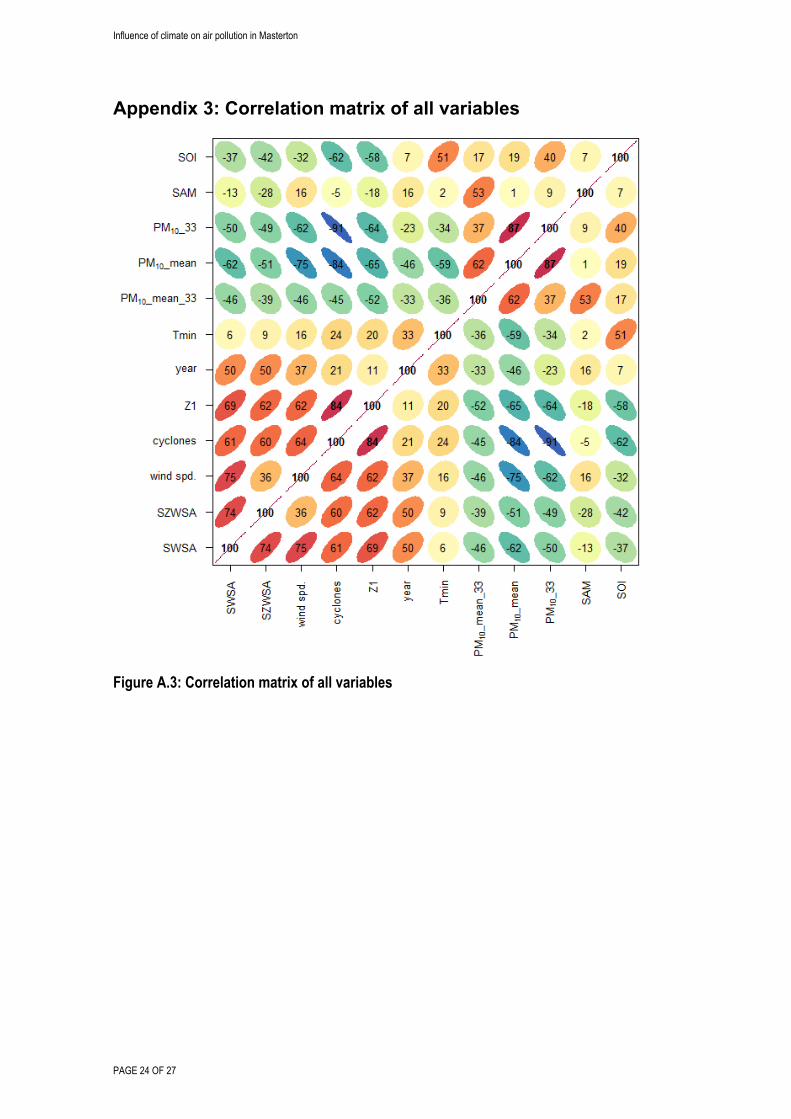
Figure A.3 (Appendix 3) shows the winter average for the Z1 index is moderately negatively correlated with mean PM10 (r = -0.65, p = 0.015), the number of days where PM10 above the Alert threshold (r=-0.64, p=0.02) and local wind speed (r = 0.62, p = 0.023). The correlations between these variables at monthly resolution were much weaker. Enhanced westerly winds across the country were generally associated with higher wind speeds measured in Masterton and lower PM10 during the winter period. However, the relationship between large-scale westerly winds (as represented by the Z1 index) and local winds in Masterton is not straightforward due to the sheltering effect of the Tararua Ranges to the west of the town.
Influence of climate on air pollution in Masterton
PAGE 16 OF 27
5.5 Influence of seasonal extra-tropical cyclone intensity on PM10 This section uses the cyclone counts generated by the Melbourne University automatic cyclone-tracking scheme (Simmonds & Keay, 2000). Figure A.4 (Appendix 4) shows cyclone activity for each winter season compared to the long-term average with areas of enhanced cyclone activity in red or suppressed activity in blue. A seasonal extra-tropical cyclone index was generated for each year by counting the number of areas of enhanced cyclonic activity and this is represented by the number of “+” superimposed on the density plots. The index values are presented in Table A.1 (Appendix 1).
The extra-tropical cyclone index is:
Strongly negatively correlated with average winter PM10 (r = -0.84, R2 = 0.71, p ≤ 0.001) and the number days of PM10 was above the Alert threshold (r = -0.91, R2 = 0.83, p ≤ 0.001). The correlation is strong because four years with the highest number of Alert days and above, 2003, 2008, 2010 and 2012 all had the lowest cyclone indices and the year with the lowest number of Alert and above days had the highest cyclone index.
Strongly positively correlated with the Z1 index (r = 0.84, p ≤ 0.001), an indicator of westerly winds.
Moderately positively correlated with local wind speeds (r = 0.62, p = 0.02), and seasonal wind speed anomalies (SWSA) (r = 0.61, p = 0.03).
Multiple linear regression results found that 92% of the inter-annual variation in average winter PM10 was explained by local average wind speed, local average daily temperature minima and extra-tropical cyclone intensity. However, inter-annual variation in the number of days where PM10 was above the Alert threshold was best explained by cyclone intensity alone (82%).
Based on the above correlations and linear regressions it appears that annual variation in extra-tropical cyclone frequency/intensity is associated in some way with the air pollution dispersal potential during winter time. Correlation does not necessarily imply causation and it is not known exactly how the cyclone frequency over the Southern Ocean affects the specific evolution of synoptic conditions (eg, their sequencing and persistence) in order to create local condition conducive to the dispersion of air pollution. Seasons with increased extra-tropical cyclone activity would be associated with a greater number of cold fronts passing. Such increased frontal activity is likely to result in longer and/or more frequent periods of atmospheric instability, with less blocking and therefore less favourable conditions for air pollution to accumulate.
5.6 Influence of global climate drivers on PM10 This section explores the relationship between ENSO (as measured by the Southern Oscillation Index), SAM, extra-tropical cyclone intensity, local wind speeds and PM10 levels. It is postulated that these drivers may influence air pollution dispersion potential at the local scale through their influence on the westerly wind belt across New Zealand.
Influene of climate on air pollution in Masterton
PAGE 17 OF 27
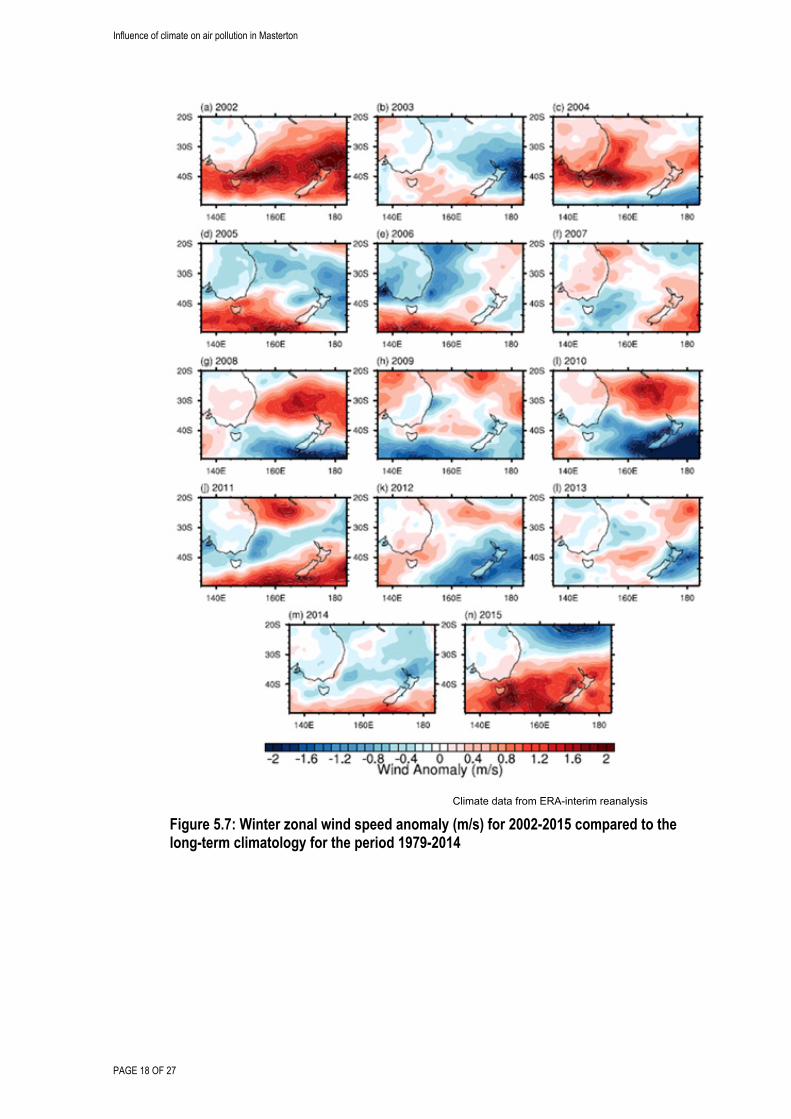
The zonal wind describes the large-scale westerly wind component that is neither cyclonic nor anticyclonic measured at 1000 hPa which corresponds to near sea-level elevation. Zonal winds represent both the frequency and strength of the west-east component of the wind. A positive anomaly indicates an increase in the frequency and/or strength of the westerlies relative to the long term average. Figure 5.7 shows the inter-annual variation in winter zonal wind anomalies for the period 2002 to 20153 compared to long-term climatology (1979-2014). The extremes in zonal wind anomalies can be related to the strength of the ENSO phase, for example, the much lower than average westerly wind component for New Zealand in 2010 coincided with a strong La Niña (winter SOI of 12.8) and the much higher than average westerly component observed in 2015 coincided with the strong El Niño (winter SOI of -15.1).
Over the period 2003 to 2015 the correlation between the winter SOI and the zonal wind speed anomaly was not statistically different from zero. This is because most of the winters were neutral (ie, SOI values ranging between -8 and +8) and therefore exhibited a mixed climate signal. The winter zonal wind anomalies were also not correlated with local wind speeds or winter average PM10 at the 95% confidence level (ie, p > 0.05).
Local-scale wind speeds measured in Masterton were strongly correlated with PM10 levels. Local wind speeds were most highly correlated with the large-scale seasonal wind speed anomalies (r = 0.75, p = 003) followed by cyclone intensity (r = 0.64, p = 0.019) and Z1 (r = -0.62, p = 0.02). Local wind speed was not correlated with the zonal wind speed anomalies. SAM was not correlated with any of these variables and is not a useful predictor at the seasonal scale.
Over the period 2003 to 2015, 2015 stands out as an unusual climate year with the highest winter average wind speed (2.4 m/s), the most positive winter wind speed anomaly (1.2 m/s), the highest cyclone intensity (11) and the most negative SOI (-15.1). Therefore it is likely that the strong El Niño during winter 2015 was a major factor leading to the much lower than average PM10 levels and fewest number of high pollution days recorded since measurements began in 2003. Conversely, 2012 was the highest pollution year on record but is unremarkable in terms of large-scale winds and SOI, although recorded the lowest winter wind speed (1.8 m/s) and lowest equal average daily temperature minima (4.8 oC) over the period. The very strong La Niña winter of 2010 did not result in above average levels of air pollution nor particularly low local wind speeds. An unusual feature in 2010 was the very high negative Z1 index (ie, easterly wind component).
3 Figure 5.7 provided by Sonya Fiddes (University of Melbourne) was produced for another research study. No air pollution data is available for winter 2002 for Masterton West so the analysis in this report is restricted to 2003 to 2015.
Influence of climate on air pollution in Masterton
PAGE 18 OF 27
Climate data from ERA-interim reanalysis
Figure 5.7: Winter zonal wind speed anomaly (m/s) for 2002-2015 compared to the long-term climatology for the period 1979-2014
Influene of climate on air pollution in Masterton
PAGE 19 OF 27
6. Conclusion This study finds that there are important climatic influences on the air pollution levels in Masterton on different temporal and spatial scales. Not unexpectedly, the strength of the large-scale wind speed anomaly influences the average PM10
levels observed during winter. This is because the large-scale wind anomalies are correlated with local wind speeds. Although this relationship does not hold for 2008 and 2012, the results show that winters with stronger winds are more likely to have below average PM10 levels, while winters with weaker winds are more likely to have above average PM10 levels. Of the two years that had higher than expected air pollution (2008 and 2012), based on the large-scale seasonal wind regime, only 2012 could be explained by the joint influence of local wind speeds and temperature (Figure 5.6).
The extra-tropical cyclone index helps explain the inter-annual variation in PM10 as this is an indicator of the level of frontal activity. Years with the greatest number of days where PM10 was above the Alert threshold (2003, 2008, 2010 and 2012) had the lowest cyclone intensity, and the year with the lowest number of days above the Alert threshold (2015) had the highest level of cyclone intensity.
The low number of high PM10 air pollution days observed in Masterton in 2015 is related to climatic factors, particularly the El Niño. The onset of a strong El Niño in 2015 led to windier days and colder temperatures, with lower than normal pressures to the south-east of New Zealand and higher pressures to the west. These are the typical ‘climate signatures’ of El Niño years. Over the period of this study there was only one strong El Niño (2015) and one La Niña-like winter (2010). In contrast to the El Niño, the effect of the La Niña on air pollution levels was not evident, possibly because the La Niña is accompanied by warmer than average temperatures. At the local scale it appears that the strong El Niño has an impact on reducing air pollution potential, however a much longer time frame of air pollution measurements is required for this relationship to be explored robustly.
There is also likely to be a declining trend in wood burner emissions (due to the wood burners that have reached the end of their working life being replaced by new lower emitting models), but this alone is unlikely to be the reason for dramatic difference in air quality between 2014 and 2015. Climate conditions in winter 2015 were unusual having the largest values for: positive large-scale wind speed anomalies, negative SOI, extra-tropical intensity index and positive Trenberth Z1 index, compared to the other winters from 2003 to 2014.
It is possible that the recent climatic conditions favouring low PM10 levels will not continue into the next few years, particularly as the El Niño phenomenon peaked in December 2015, is now declining, and is predicted to return to neutral conditions by mid-2016. Therefore the current surge of stronger than normal winds over New Zealand is expected to slowly subside back to normal over the next two winters.
This study shows there is potential for using large-scale wind analysis in conjunction with climate drivers and the extra-tropical cyclone index to develop a method for predicting future air pollution ‘potential’ at a seasonal

Influence of climate on air pollution in Masterton
PAGE 20 OF 27
scale. Finer scale prediction of high air pollution days will likely require air dispersion modelling (using a 3-D model) or statistical modeling of pollution potential based on local meteorological variables at a daily or hourly scale.
Influene of climate on air pollution in Masterton
PAGE 21 OF 27
Acknowledgements
Thank you to Darren Li for careful collection of air quality monitoring data at the two Masterton air quality monitoring stations. We also thank Brett Mullan (NIWA) for providing the Z1 index values, and Kevin Keay (Australian Bureau of Meteorology) for providing access to the automatic cyclone tracking scheme. Thank you to Sonya Fiddes (University of Melbourne) for providing Figure 5.7. Many thanks to Kathleen Kozyniak for peer review.
Influence of climate on air pollution in Masterton
PAGE 22 OF 27
Appendix 1: Winter PM10 metrics and climate variables
Table A.1: Winter PM10 and values for climate variables and indices
Year PM10 average winter (µg/m3)
PM10 No. days at and above Alert category
Temp min (oC)
Wind speed (m/s)
SWSA (m/s)
cyclone activity index
Z1 (0.1hPa)
SAM SOI
2003 22.2 24 5.2 1.9 -0.4 5 0.8 0.3 -4.6
2004 19.2 11 5.5 2.2 0.5 8 8.3 0.8 -4.2
2005 21.2 14 5.4 1.8 -0.2 7 -1 -0.4 -4.5
2006 21.1 18 5 1.9 -0.4 6 -12.8 0.3 -9.9
2007 18.9 16 5.9 2 0.6 7 3.5 -1.1 0.0
2008 22.3 26 5 2 0.6 4 -6.8 0.3 3.0
2009 20.2 15 4.8 2.2 0.4 6 -6.3 -0.8 -3.3
2010 20.5 21 6 2 -0.5 4 -23.8 1.8 12.8
2011 19.5 18 6.3 2.1 0.2 6 6.5 -0.4 3.8
2012 23.1 25 4.8 1.8 0.2 4 -12.3 0.4 -5.0
2013 19.6 16 6.1 1.8 0 6 -9 -0.1 7.5
2014 18.4 13 5.8 2.3 0.9 7 1.5 0.1 -2.9
2015 16.7 8 5.6 2.4 1.2 11 23.5 1.0 -15.1
Influene of climate on air pollution in Masterton
PAGE 23 OF 27
Appendix 2: Large-scale wind speed anomalies
Figure A.2: Large-scale wind speed anomalies (m/s) for winter (2003 to 2015). Above average wind in the Wellington Region is shown as +, below average as –, and neutral winters as N.
Influence of climate on air pollution in Masterton
PAGE 24 OF 27
Appendix 3: Correlation matrix of all variables
Figure A.3: Correlation matrix of all variables

Influene of climate on air pollution in Masterton
PAGE 25 OF 27
Appendix 4: Extra-tropical cyclone density
Figure A.4: Winter extra-tropical cyclone density (2003 to 2015) with enhanced activity shown as +. Units in cyclones x10-3 per degree of latitude squared counted on a daily (synoptic) basis.

Influence of climate on air pollution in Masterton
PAGE 26 OF 27
References
Carslaw DC and Ropkins K. 2012. Openair — an R package for air quality data analysis. Environmental Modelling & Software. Volume 27-28, pp. 52–61.
Chappell PR. 2014. National Institute of Water and Atmospheric Research. The climate and weather of Wellington 2nd Edition. NIWA Science and Technology Series Number 65.
Coulson G, Bian R, Somervell, E. 2015. An investigation of the variability of particulate emissions from woodstoves in New Zealand. Aerosol and Air Quality Research, 15: 2346-2356.
Davy PK. 2007. Composition and Sources of aerosol in the Wellington Region of New Zealand. PhD thesis, Victoria University of Wellington.
Devore J and Farnum N. 2005. Applied statistics for engineers and scientists. 2nd ed. Brools/Cole Thomson Learning, CA.
Gordon N. 1986. The Southern Oscillation and New Zealand Weather. Monthly Weather Review, 14, 371-387.
Ministry for the Environment. 1997. Environmental performance indicators: Proposals for air, fresh water, and land. Ministry for the Environment, Wellington.
Mitchell T. 2015. Air quality State of the Environment monitoring programme. Annual data report, 2014. Greater Wellington Regional Council. GW/ESCI-T-15/1.
Pezza AB and Ambrizzi T. 2003: Variability of Southern Hemisphere Cyclone and Anticyclone Behavior: Further Analysis. Journal of Climate, 16, 1075-1083.
R Core Team. 2015. R: A language and environment for statistical computing. R Foundation for Statistical Computing, Vienna, Austria. URL http://www.R-project.org/.
Salinger MJ and Mullan AB. 1999. New Zealand climate: temperature and precipitation variations and their links with atmospheric circulation 1930-1994. Int. J. Climatol., 19, 1049-1071. Simmonds I and Keay K. 2000: Mean Southern Hemisphere extratropical cyclone behavior in the 40-year NCEP-NCAR reanalysis. Journal of Climate, 13, 873-885. Statistics New Zealand. 2013. 2013 census meshblock dataset: Wellington region. http://www.stats.govt.nz/Census/2013-census/data-tables/meshblock-dataset.aspx#variables Trenberth KE. 1976. Fluctuations and trends in indices of the southern hemisphere circulation. Quarterly Journal of the Royal Meteorological Society, 102: 639–653.
Influene of climate on air pollution in Masterton
PAGE 27 OF 27
Wilton E, Bluett J and Chilton R. 2015. Home heating emission inventory and other sources evaluation. Prepared for the Ministry for the Environment and Statistics New Zealand. January 2015.