clean water and sanitation 2018€¦ · 6.1 progress on implementation of integrated water...
TRANSCRIPT

GLOBAL BASELINE FOR SDG 6 INDICATOR 6.5.1:
DEGREE OF IWRM IMPLEMENTATION
2018CLEAN WATERAND SANITATION
CLEAN WATERAND SANITATION
PROGRESS ON
INTEGRATED WATER
RESOURCES MANAGEMENT

PRESENTING THE UN-WATER INTEGRATED MONITORING INITIATIVE FOR SDG 6
Through the UN-Water Integrated Monitoring Initiative for Sustainable Development Goal (SDG) 6, the United Nations seeks to support countries in monitoring water- and sanitation-related issues within the framework of the 2030 Agenda for Sustainable Development, and in compiling country data to report on global progress towards SDG 6.
1 http://www.sdg6monitoring.org/about/components/jmp/2 http://www.sdg6monitoring.org/about/components/presenting-gemi/3 http://www.sdg6monitoring.org/about/components/glaas/
The Initiative brings together the United Nations organizations that are formally mandated to compile country data on the SDG 6 global indicators, who organize their work within three complementary initiatives:
• WHO/UNICEF Joint Monitoring Programme for Water Supply, Sanitation and Hygiene (JMP)1
Building on its 15 years of experience from Millennium Development Goals (MDG) monitoring, the JMP looks after the drinking water, sanitation and hygiene aspects of SDG 6 (targets 6.1 and 6.2).
• Integrated Monitoring of Water and Sanitation-Related SDG Targets (GEMI)2
GEMI was established in 2014 to harmonize and expand existing monitoring efforts focused on water, wastewater and ecosystem resources (targets 6.3 to 6.6).
• UN-Water Global Analysis and Assessment of Sanitation and Drinking-Water (GLAAS)3
The means of implementing SDG 6 (targets 6.a and 6.b) fall under the remit of GLAAS, which monitors the inputs and the enabling environment required to sustain and develop water and sanitation systems and services.
The objectives of the Integrated Monitoring Initiative are to:
• Develop methodologies and tools to monitor SDG 6 global indicators
• Raise awareness at the national and global levels about SDG 6 monitoring
• Enhance technical and institutional country capacity for monitoring
• Compile country data and report on global progress towards SDG 6
The joint effort around SDG 6 is especially important in terms of the institutional aspects of monitoring, including the integration of data collection and analysis across sectors, regions and administrative levels.
To learn more about water and sanitation in the 2030 Agenda for Sustainable Development, and the Integrated Monitoring Initiative for SDG 6, visit our website: www.sdg6monitoring.org

PROGRESS ON
INTEGRATED WATER RESOURCES MANAGEMENT
GLOBAL BASELINE FOR SDG 6 INDICATOR 6.5.1:
DEGREE OF IWRM IMPLEMENTATION
2018

d Progress on integrated water resources management 2018
ACKNOWLEDGEMENTS
This report is entirely dependent on the substantial efforts and contributions of government officials and other stakeholders from more than 170 UN member states in reporting on SDG indicator 6.5.1. National focal points coordinated the country reporting processes. In addition, 36 of these countries held multi-stakeholder workshops which provided invaluable insights into the degree of implementation of integrated water resources management in those countries. These country workshops were co-facilitated by Country Water Partnerships of the Global Water Partnership (GWP).
The identification of national focal points and subsequent training and support were facilitated by UN Environment, UN Environment-DHI Centre, Cap-Net, the Global Water Partnership, and UN-Water.
Data analysis and development of this report were carried out by a working group with the following members: Paul Glennie (coordinating lead author), Maija Bertule (head of country support and lead data analyst), Paul Taylor (lead free-text analyst), Peter Koefoed Bjørnsen, Gareth James Lloyd and Nisha Gill Hansted, all from the UN Environment – DHI Centre on Water and Environment; and Alexander Egholm Møller, Nisha Midha and Lilian Neuer as interns with UN Environment – DHI Centre; and (the following in alphabetical order of affiliation) Josh Newton from the Global Water Partnership (GWP), James Dalton from the International Union for the Conservation of Nature (IUCN), Håkan Tropp and Oriana Romano from the Organisation for Economic Co-operation and Development (OECD), Marianne Kjellen from the UN Development Programme (UNDP), Alistair Rieu-Clarke from the UN Economic Commission for Europe (UNECE), Joakim Harlin from UN Environment, and Marina Takane from the World Health Organisation (WHO / GLAAS).
Review comments were gratefully received from (in alphabetical order): Akmal Abdurazakov, Jeremy Bird, Torkil Jønch Clausen, Ricard Gine, Themba Gumbo, and Claudia Pahl-Wostl, as well as from UN-Water Members and Partners. The list of UN-Water Members and Partners can be found on the following website – www.unwater.org.
This document is published by UN Environment on behalf of UN-Water. It is part of a series of reports on SDG indicators 6.3.1, 6.3.2, 6.4.1, 6.4.2, 6.5.1, 6.5.2 and 6.6.1, coordinated by UN-Water through the GEMI programme.
Financial support was provided by the Danish International Development Agency (DANIDA), and, through the GEMI programme, the German Federal Ministry for Economic Cooperation and Development (BMZ), the Dutch Ministry of Infrastructure and Water Management, the Swedish International Development Cooperation Agency (Sida) and the Swiss Agency for Development and Cooperation (SDC).
SUGGESTED CITATION
UN Environment (2018). Progress on integrated water resources management. Global baseline for SDG 6 Indicator 6.5.1: degree of IWRM implementation.
Copyright © United Nations Environment Programme, 2018
This publication may be reproduced in whole or in part and in any form for educational or non-profit purposes without special permission from the copyright holder, provided acknowledgement of the source is made. UN Environment would appreciate receiving a copy of any publication that uses this publication as a source. No use of this publication may be made for resale or for any other commercial purpose whatsoever without prior permission in writing from the United Nations Environment Programme.
DISCLAIMER
The contents of this report do not necessarily reflect the views or policies of UN Environment, or contributing organizations. The designations employed and the presentations of material in this report do not imply the expression of any opinion whatsoever on the part of UN Environment or contributory organizations, or publishers concerning the legal status of any country, territory, city area or its authorities, or concerning the delimitation of its frontiers or boundaries or the designation of its name, frontiers or boundaries. The mention of a commercial entity or product in this publication does not imply endorsement by UN Environment.
EDITING: Karen Brandon
DESIGN AND LAYOUT: Phoenix Design Aid
ISBN No: 978-92-807-3710-3
Job No: DEP/2187/NA

i
TABLE OF CONTENTS
2
1
3
4
5
6
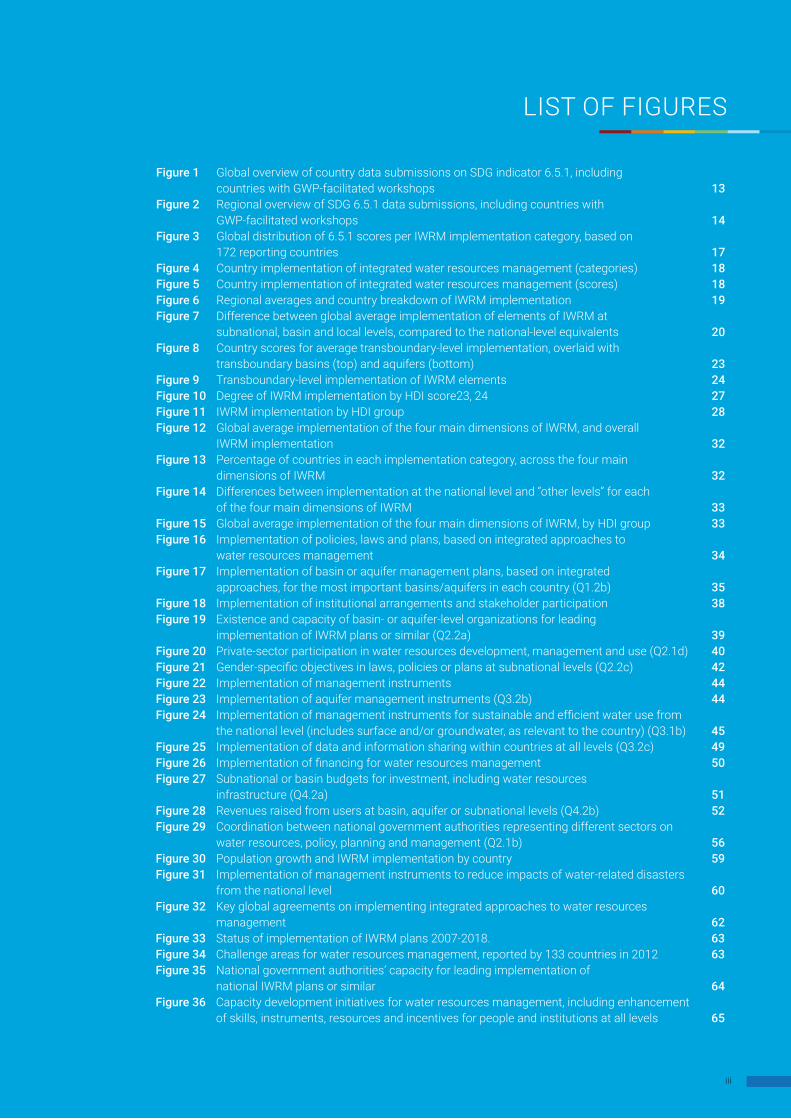
List of Figures iiiList of Boxes ivList of Tables ivForeword vi
EXECUTIVE SUMMARY 1
WATER MANAGEMENT AND THE 2030 AGENDA 51.1 The 2030 vision for water 61.2 IWRM for sustainable management of water resources 71.3 Report overview 8
MONITORING INTEGRATED WATER RESOURCES MANAGEMENT IN THE SDGs 92.1 Overview of survey on IWRM implementation and indicator calculation 102.2 Addressing objectivity, transparency, and comparability of survey responses 112.3 National and global data-collection processes 13
STATUS OF IMPLEMENTATION OF INTEGRATED WATER RESOURCES MANAGEMENT 153.1 Country and regional status 163.2 Implementing IWRM at all levels 20 3.2.1 National vs subnational, basin and local levels 20 3.2.2 Transboundary implementation of IWRM 223.3 Factors influencing IWRM implementation 26
ELEMENTS OF INTEGRATED WATER RESOURCES MANAGEMENT IMPLEMENTATION 304.1 Comparison of the four main dimensions of integrated water resources management 314.2 Laws, policies and plans (Survey Section 1) 344.3 Institutions and stakeholders (Survey Section 2) 374.4 Management instruments (Survey Section 3) 434.5 Financing (Survey Section 4) 50
THE IMPORTANCE OF IMPLEMENTING IWRM ACROSS SECTORS FOR AGENDA 2030 545.1 Implementing IWRM across sectors 555.2 Sustainable agriculture and food security programmes. Main SDG: 2 585.3 Sustainable cities and developments. Main SDG: 11 585.4 Disaster risk reduction and resilience programmes. Main SDG: 11 605.5 National contexts are critical for cross-sectoral coordination 60
TOWARDS FULL IMPLEMENTATION OF INTEGRATED WATER RESOURCES MANAGEMENT 616.1 Progress on implementation of integrated water resources management 626.2 Addressing barriers and constraints to progress 636.3 Actions identified by countries to advance sustainable management of water resources 666.4 Next steps for implementing water resources management 686.5 Key messages and recommendations 69

TABLE OF CONTENTS
ii Progress on integrated water resources management 2018
© i
Stoc
kpho
to
ANNEXES A-1A. 6.5.1 Questionnaire A-2 A.1 6.5.1 Questionnaire overview A-2 A.2 6.5.1 Questionnaire with threshold descriptions A-3B. Global distribution of IWRM implementation by question A-11C. National 6.5.1 data: IWRM implementation A-12D. Data coverage and breakdowns A-18E. Development of the 6.5.1 indicator methodology A-19 E.1 Methodology development to date A-19 E.2 Future review of methodology A-19F. National workshop processes for data collection A-20G. Quality Control process for data collection A-21
iii
LIST OF FIGURES
iii
Figure 1 Global overview of country data submissions on SDG indicator 6.5.1, including countries with GWP-facilitated workshops 13
Figure 2 Regional overview of SDG 6.5.1 data submissions, including countries with GWP-facilitated workshops 14
Figure 3 Global distribution of 6.5.1 scores per IWRM implementation category, based on 172 reporting countries 17
Figure 4 Country implementation of integrated water resources management (categories) 18Figure 5 Country implementation of integrated water resources management (scores) 18Figure 6 Regional averages and country breakdown of IWRM implementation 19Figure 7 Difference between global average implementation of elements of IWRM at
subnational, basin and local levels, compared to the national-level equivalents 20Figure 8 Country scores for average transboundary-level implementation, overlaid with
transboundary basins (top) and aquifers (bottom) 23Figure 9 Transboundary-level implementation of IWRM elements 24Figure 10 Degree of IWRM implementation by HDI score23, 24 27Figure 11 IWRM implementation by HDI group 28Figure 12 Global average implementation of the four main dimensions of IWRM, and overall
IWRM implementation 32Figure 13 Percentage of countries in each implementation category, across the four main
dimensions of IWRM 32Figure 14 Differences between implementation at the national level and “other levels” for each
of the four main dimensions of IWRM 33Figure 15 Global average implementation of the four main dimensions of IWRM, by HDI group 33Figure 16 Implementation of policies, laws and plans, based on integrated approaches to
water resources management 34Figure 17 Implementation of basin or aquifer management plans, based on integrated
approaches, for the most important basins/aquifers in each country (Q1.2b) 35Figure 18 Implementation of institutional arrangements and stakeholder participation 38Figure 19 Existence and capacity of basin- or aquifer-level organizations for leading
implementation of IWRM plans or similar (Q2.2a) 39Figure 20 Private-sector participation in water resources development, management and use (Q2.1d) 40Figure 21 Gender-specific objectives in laws, policies or plans at subnational levels (Q2.2c) 42Figure 22 Implementation of management instruments 44Figure 23 Implementation of aquifer management instruments (Q3.2b) 44Figure 24 Implementation of management instruments for sustainable and efficient water use from
the national level (includes surface and/or groundwater, as relevant to the country) (Q3.1b) 45Figure 25 Implementation of data and information sharing within countries at all levels (Q3.2c) 49Figure 26 Implementation of financing for water resources management 50Figure 27 Subnational or basin budgets for investment, including water resources
infrastructure (Q4.2a) 51Figure 28 Revenues raised from users at basin, aquifer or subnational levels (Q4.2b) 52Figure 29 Coordination between national government authorities representing different sectors on
water resources, policy, planning and management (Q2.1b) 56Figure 30 Population growth and IWRM implementation by country 59Figure 31 Implementation of management instruments to reduce impacts of water-related disasters
from the national level 60Figure 32 Key global agreements on implementing integrated approaches to water resources
management 62Figure 33 Status of implementation of IWRM plans 2007-2018. 63Figure 34 Challenge areas for water resources management, reported by 133 countries in 2012 63Figure 35 National government authorities’ capacity for leading implementation of
national IWRM plans or similar 64Figure 36 Capacity development initiatives for water resources management, including enhancement
of skills, instruments, resources and incentives for people and institutions at all levels 65
iv Progress on integrated water resources management 2018
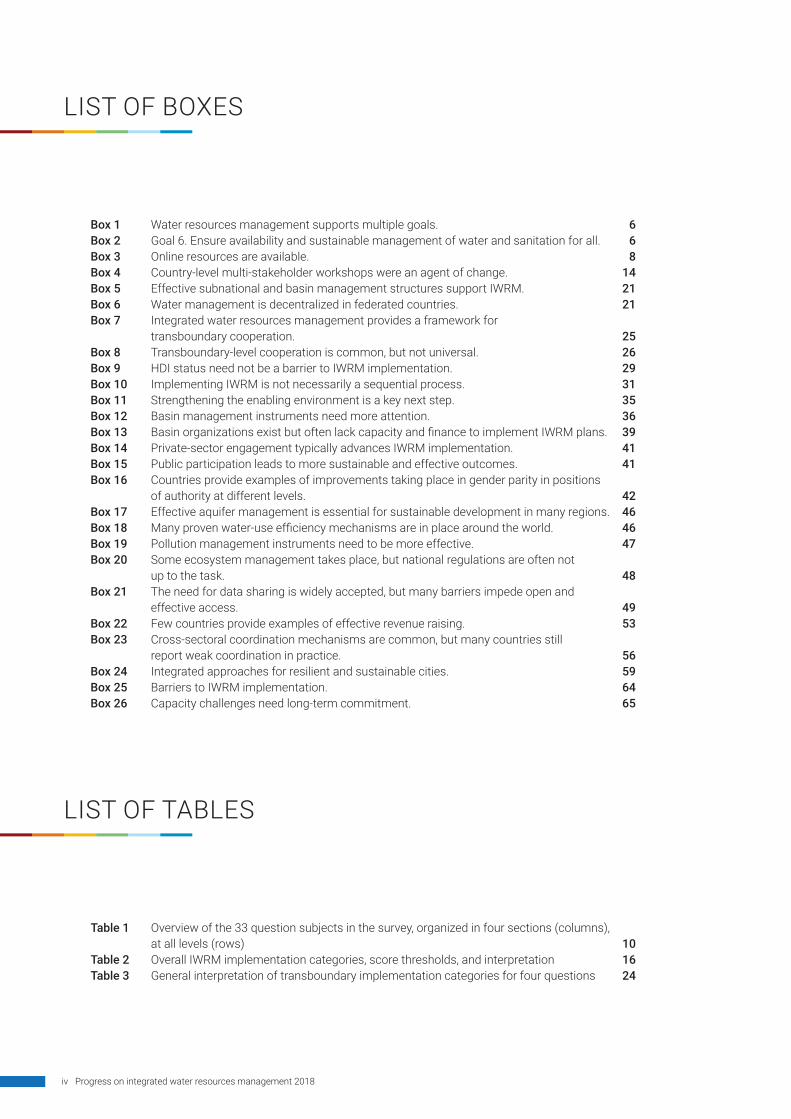
LIST OF BOXES
LIST OF TABLES
Table 1 Overview of the 33 question subjects in the survey, organized in four sections (columns), at all levels (rows) 10
Table 2 Overall IWRM implementation categories, score thresholds, and interpretation 16Table 3 General interpretation of transboundary implementation categories for four questions 24
Box 1 Water resources management supports multiple goals. 6Box 2 Goal 6. Ensure availability and sustainable management of water and sanitation for all. 6Box 3 Online resources are available. 8Box 4 Country-level multi-stakeholder workshops were an agent of change. 14Box 5 Effective subnational and basin management structures support IWRM. 21Box 6 Water management is decentralized in federated countries. 21Box 7 Integrated water resources management provides a framework for
transboundary cooperation. 25Box 8 Transboundary-level cooperation is common, but not universal. 26Box 9 HDI status need not be a barrier to IWRM implementation. 29Box 10 Implementing IWRM is not necessarily a sequential process. 31Box 11 Strengthening the enabling environment is a key next step. 35Box 12 Basin management instruments need more attention. 36Box 13 Basin organizations exist but often lack capacity and finance to implement IWRM plans. 39Box 14 Private-sector engagement typically advances IWRM implementation. 41Box 15 Public participation leads to more sustainable and effective outcomes. 41Box 16 Countries provide examples of improvements taking place in gender parity in positions
of authority at different levels. 42Box 17 Effective aquifer management is essential for sustainable development in many regions. 46Box 18 Many proven water-use efficiency mechanisms are in place around the world. 46Box 19 Pollution management instruments need to be more effective. 47Box 20 Some ecosystem management takes place, but national regulations are often not
up to the task. 48Box 21 The need for data sharing is widely accepted, but many barriers impede open and
effective access. 49Box 22 Few countries provide examples of effective revenue raising. 53Box 23 Cross-sectoral coordination mechanisms are common, but many countries still
report weak coordination in practice. 56Box 24 Integrated approaches for resilient and sustainable cities. 59Box 25 Barriers to IWRM implementation. 64Box 26 Capacity challenges need long-term commitment. 65

v
© Shutterstock

vi Progress on integrated water resources management 2018
FOREWORD
SDG 6 INDICATOR REPORT SERIES
Water is the lifeblood of ecosystems, vital to human health and well-being and a precondition for economic prosperity. That is why it is at the very core of the 2030 Agenda for Sustainable Development. Sustainable Development Goal 6 (SDG 6), the availability and sustainable management of water and sanitation for all, has strong links to all of the other Goals.
In this series of progress reports under the UN-Water Integrated Monitoring Initiative for SDG 6, we evaluate progress towards this vital goal. The United Nations agencies are working together to help countries monitor water and sanitation across sectors and compile data so that we can report on global progress.
SDG 6 expands the Millennium Development Goal focus on drinking water and basic sanitation to include the management of water and wastewater and ecosystems, across boundaries of all kinds. Bringing these aspects together is an essential first step towards breaking-down sector fragmentation and enabling coherent and sustainable management, and hence towards a future where water use is sustainable.
This report is part of a series that track progress towards the various targets set out in SDG 6 using the SDG global indicators. The reports are based on country data, compiled and verified by the United Nations agencies responsible, sometimes complemented by data from other sources. The main beneficiaries of better data are countries. The 2030 Agenda specifies that global follow-up and review “will be primarily based on national official data sources”, so we sorely need stronger national statistical systems. That will involve developing technical and institutional capacity and infrastructure for more effective monitoring.
To review overall progress towards SDG 6 and identify interlinkages and ways to accelerate progress, UN-Water produced the SDG 6 Synthesis Report 2018 on Water and Sanitation. It concluded that the world is not on track to achieve SDG 6 by 2030. This finding was discussed by Member States during the High-level Political Forum on Sustainable Development (HLPF) in July 2018. Delegates sounded the alarm about declining official development aid to the water sector and stressed the need for finance, high-level political support and leadership and enhanced collaboration within and across countries if SDG 6 and its targets are to be achieved.
To achieve SDG 6 we need to monitor and report progress. That will help decision-makers identifying and prioritize where, when, how and at what interventions are needed to improve implementation. Information on progress is also essential to ensure accountability and generate political, public and private sector support for investment. The UN-Water Integrated Monitoring Initiative for SDG 6 is an essential element of the United Nations’ determination to ensure the availability and sustainable management of water and sanitation for all by 2030.
Gilbert F. Houngbo, UN-Water Chair and President
of the International Fund for Agricultural Development

viiFOREWORD
INDICATOR 6.5.1 IMPLEMENTATION OF INTEGRATED WATER RESOURCES MANAGEMENTFor villages near the Lingmutey-chu stream in Bhutan, water scarcity and food shortages used to be common. Conflicts between farmers located upstream and downstream were also frequent. But when the community led the conceptualization and adoption of a water resource management strategy that involved everyone concerned, the results were inspiring. Water supply for irrigation and food security improved, and agricultural productivity of farmers increased.
UN Environment is proud to support a series of reports that assess the world’s progress on Sustainable Development Goal number 6, which aims to ensure availability and sustainable management of water and sanitation for all. In this Report, we report on the efforts of 172 countries to put in place integrated water resources management such as successfully demonstrated in Bhutan.
Taking such an integrated approach to water resources management can have multiple benefits including sustainable and efficient agriculture, economic stability, ecosystem protection, and peace and security. However 60 percent of countries are unlikely to achieve this important target at all levels, including transboundary cooperation, unless we significantly accelerate progress.
The Report illustrates examples from countries highlighting key challenges, and importantly examples of success that are highly relevant for other countries in the world. It also aims to support countries and stakeholders in prioritizing action to advance sustainable water management in each country.
Erik Solheim, UN Environment Executive
Director and Under-Secretary-General of the United Nations

1 Progress on integrated water resources management 2018
EXECUTIVE SUMMARYDecisions about how to allocate and use water are fundamental to sustainable development. Such measures underlie all essential aspects of the human endeavour: human health and well-being, agriculture, business, and the quality of life in rural and urban areas. At the same time, water scarcity is becoming more commonplace. Pollution is increasing. Natural ecosystems are under growing pressure. Thus, the matter of determining how to allocate and use water in an efficient, sustainable and equitable manner is foundational.
It is also complex. Successful managing of water resources is a long-term and unceasing process. It requires the input and interaction of governments, agencies and organizations at international, national, regional and local levels, the private sector, charitable enterprises and dedicated individuals. Recognizing this, nations agreed to adopt integrated approaches to water resources management (IWRM) at the 1992 Earth Summit. The passing years have only underscored the importance of pursuing and implementing these measures to achieve the United Nations 2030 Agenda for Sustainable Development. Integrated water resources management provides an essential framework to achieve not only SDG 6 – to “ensure availability and sustainable management of water and sanitation for all” – but also to achieve all Sustainable Development Goals (SDGs).
With but a dozen years remaining until the target year, understanding the progress that has been made – and the tasks that remain – is urgent. This report aims to examine these issues in detail. It represents the work of 172 countries that provided information on efforts to implement integrated water resource management. Their assessments of successes and challenges are the core of this report. Through quantitative data and qualitative discussion, the report presents a global picture of the current state of affairs on water management. Though the report covers the subject in detail, its central message can be distilled into two words: ACCELERATE PROGRESS.
The very participation of the vast majority of the relevant world community in the assessments that underpin this report suggests a recognition of the importance of the task, a desire to achieve aims, and a willingness to move forward apace. The task is great: to come up with a network of policies and laws that create an enabling environment; to coordinate diverse players with different and often competing interests; to generate data to make effective decisions; and to find the financial wherewithal to transform plans into realities. The findings of this report demonstrate that the world’s nations can learn from one another, and that the insights they have gained thus far can chart the way forward. As the report underscores, nations of the world should act now – with urgency and speed.
KEY MESSAGES
The vast majority, 80 per cent, of countries have laid the foundations for integrated water resources management. Implementation must now be the focus.
y At the lower end, 20 per cent of countries have started developing IWRM approaches. They need to prioritize activities that will have the greatest impact in the national context.
y In the mid-range, 40 per cent of countries have institutionalized most IWRM elements. They need to focus on implementation.
y Another 20 per cent of countries are generally implementing most elements of IWRM in long-term programmes. They need to expand coverage and stakeholder engagement.
y The top 20 per cent of countries are generally achieving their policy objectives for integrated water resources management. They need to remain focused to consolidate and strengthen gains.
IWRM implementation needs to accelerate to realize the 2030 Agenda.
Integrated approaches help to coordinate sus-tainable development and water management for the full spectrum of users: residents in urban and rural areas, agriculture, industries and natural ecosystems. This coordination is critical for the full 2030 Agenda. With water scarcity and pollution increasing, finding ways to address conflicts and trade-offs is critical to allocate and use water in an efficient, sustainable and equitable manner.
Collective action that builds on the multi-stakeholder monitoring and reporting processes can accelerate implementation.
Multi-stakeholder processes for completing the survey that forms the basis of this report identify challenge areas and actions in line with national priorities and planning processes across sectors. Moving forward, all countries can build on these experiences. They can make full use of the integrated, multi-stakeholder approach to advance progress and set national targets where appropriate.
2EXECUTIVE SUMMARY
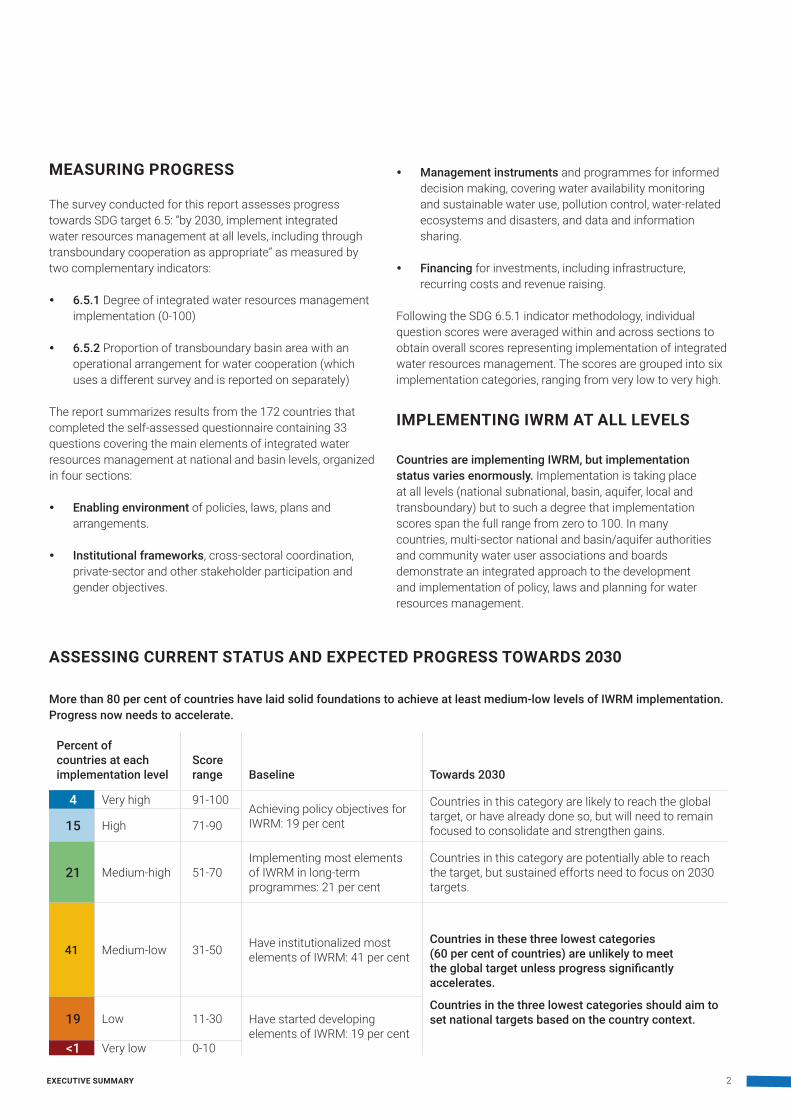
MEASURING PROGRESS
The survey conducted for this report assesses progress towards SDG target 6.5: “by 2030, implement integrated water resources management at all levels, including through transboundary cooperation as appropriate” as measured by two complementary indicators:
y 6.5.1 Degree of integrated water resources management implementation (0-100)
y 6.5.2 Proportion of transboundary basin area with an operational arrangement for water cooperation (which uses a different survey and is reported on separately)
The report summarizes results from the 172 countries that completed the self-assessed questionnaire containing 33 questions covering the main elements of integrated water resources management at national and basin levels, organized in four sections:
y Enabling environment of policies, laws, plans and arrangements.
y Institutional frameworks, cross-sectoral coordination, private-sector and other stakeholder participation and gender objectives.
y Management instruments and programmes for informed decision making, covering water availability monitoring and sustainable water use, pollution control, water-related ecosystems and disasters, and data and information sharing.
y Financing for investments, including infrastructure, recurring costs and revenue raising.
Following the SDG 6.5.1 indicator methodology, individual question scores were averaged within and across sections to obtain overall scores representing implementation of integrated water resources management. The scores are grouped into six implementation categories, ranging from very low to very high.
IMPLEMENTING IWRM AT ALL LEVELS
Countries are implementing IWRM, but implementation status varies enormously. Implementation is taking place at all levels (national subnational, basin, aquifer, local and transboundary) but to such a degree that implementation scores span the full range from zero to 100. In many countries, multi-sector national and basin/aquifer authorities and community water user associations and boards demonstrate an integrated approach to the development and implementation of policy, laws and planning for water resources management.
ASSESSING CURRENT STATUS AND EXPECTED PROGRESS TOWARDS 2030
More than 80 per cent of countries have laid solid foundations to achieve at least medium-low levels of IWRM implementation. Progress now needs to accelerate.
Percent of countries at each implementation level
Score range Baseline Towards 2030
4 Very high 91-100Achieving policy objectives for IWRM: 19 per cent
Countries in this category are likely to reach the global target, or have already done so, but will need to remain focused to consolidate and strengthen gains. 15 High 71-90
21 Medium-high 51-70Implementing most elements of IWRM in long-term programmes: 21 per cent
Countries in this category are potentially able to reach the target, but sustained efforts need to focus on 2030 targets.
41 Medium-low 31-50 Have institutionalized most elements of IWRM: 41 per cent
Countries in these three lowest categories (60 per cent of countries) are unlikely to meet the global target unless progress significantly accelerates.
Countries in the three lowest categories should aim to set national targets based on the country context. 19 Low 11-30 Have started developing
elements of IWRM: 19 per cent <1 Very low 0-10

3 Progress on integrated water resources management 2018
Subnational, basin, aquifer and local levels tend to lag national-level implementation. Capacity and resources are often lacking at the basin and aquifer levels for institutions and planning, management instruments and revenue raising.
Coordination among levels is important. Integration among all levels is key to ensuring that resources flow to where they are most needed, and where they can be most effective.
Most countries report that arrangements and organizational frameworks are in place for cooperation in most of their significant transboundary basins and aquifers. However, significant differences in capacity and development priorities between countries sharing transboundary basins and aquifers may hamper cooperation. Reporting on SDG indicator 6.5.2 addresses this issue in more detail.
ACHIEVING WIDER IMPLEMENTATION ACROSS SECTORS
Adopt integrated approaches to water supply and wastewater treatment measures. Water resources management encompasses water supply for different sectors (such as agriculture, industry, energy and municipalities), and sanitation, wastewater treatment and water-related disaster-risk reduction. Nevertheless, IWRM is often erroneously perceived as a separate concept to be implemented alongside such activities. Countries should continue implementing these activities. However, implementation should proceed in an integrated manner that considers sector impacts on other water uses and the environment. This is key for achieving more sustainable, equitable and efficient use of water resources, as well as for providing opportunities for joint investments and benefits.
Identify opportunities to integrate water into sectoral programmes and planning processes. There is a need to identify where water resources are being managed within national programmes and planning processes across all sectors that use or pollute water resources – such as those related to agriculture, urban areas, energy generation, and
Country implementation of integrated water resources management (categories)
Very low Low Medium-low Medium-high High Very high No data
IWRM implementation SDG 6.5.1 score
The global target is to reach “very high” implementation levels. Countries may need to set context-specific national targets to drive implementation towards 2030.

4EXECUTIVE SUMMARY
consumption and production. There is also a need to ensure that water is being managed in a way that considers impacts across sectors, including the environment, and assures long-term sustainability. The SDGs provide a useful framework for coordinated action.
Find and adopt innovative, blended and multi-sector financing approaches to achieve sustainable water resources management for the 2030 Agenda. Some progress has been made in setting up institutions, the enabling environment, and management instruments for water resources management in many countries. Nevertheless, their potential to create positive impacts for societies and ecosystems will not be realized unless investments are secured, allocated and mobilized to ensure water is managed in a sustainable, efficient, and equitable way.
ACCELERATING PROGRESS
Integrated water resources management is an ongoing process with incremental impacts. Any steps a country can take to advance implementation will likely enhance sustainable and equitable management and use of water for all, leading to impacts such as improved allocation, water use efficiency, pollution control, enforcement of regulations and cost recovery. This kind of management is an ongoing process, and, as such, even countries that have “reached” the global target should perpetually review, revise and improve on the various elements of integrated water resources management.
Each country can identify pathways to make progress. There is no “one-size-fits-all” approach to implementing integrated water resources management. In the process of completing the 6.5.1 survey, countries have identified areas requiring action to advance sustainable management of water resources. For countries in which governmental and non-governmental stakeholders across sectors and levels of governance worked together on the survey to reach consensus, this collaboration can be developed to jointly identify actions in line with national priorities. These are significant outcomes of the SDG monitoring process.
For many countries, significant ground can be made by focusing on some of the weaker scores from the monitoring, such as improving basin and aquifer management, gender objectives, financial arrangements and capacity development. Section 6.3 of the full report includes a collection of proposed actions from several countries to provide a sense of how they will further implementation of IWRM towards 2030. While country-specific, these proposals will resonate with many other countries. These actions include very practical operational measures (increase monitoring stations, improve enforcement mechanisms), as well as more challenging ones (increase cost recovery for water-related services). They send a clear message that countries know what they want to achieve and the steps they must take to progress.
Integrated water resources management balances the competing demands and impacts of all users to achieve sustainable development. © Alamy

5 Progress on integrated water resources management 2018
WATER MANAGEMENT AND THE 2030 AGENDA
1
© i
Stoc
kpho
to
6CHAPTER 1 Water management and the 2030 Agenda
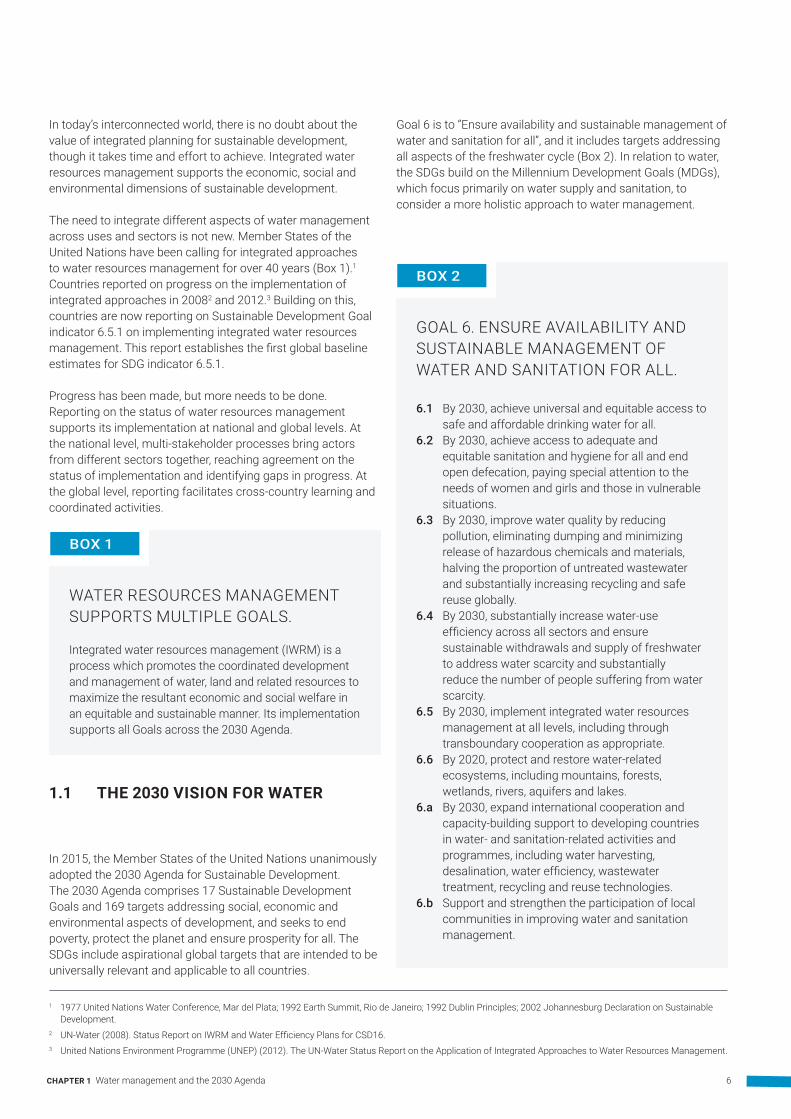
In today’s interconnected world, there is no doubt about the value of integrated planning for sustainable development, though it takes time and effort to achieve. Integrated water resources management supports the economic, social and environmental dimensions of sustainable development.
The need to integrate different aspects of water management across uses and sectors is not new. Member States of the United Nations have been calling for integrated approaches to water resources management for over 40 years (Box 1).1 Countries reported on progress on the implementation of integrated approaches in 20082 and 2012.3 Building on this, countries are now reporting on Sustainable Development Goal indicator 6.5.1 on implementing integrated water resources management. This report establishes the first global baseline estimates for SDG indicator 6.5.1.
Progress has been made, but more needs to be done. Reporting on the status of water resources management supports its implementation at national and global levels. At the national level, multi-stakeholder processes bring actors from different sectors together, reaching agreement on the status of implementation and identifying gaps in progress. At the global level, reporting facilitates cross-country learning and coordinated activities.
1.1 THE 2030 VISION FOR WATER
In 2015, the Member States of the United Nations unanimously adopted the 2030 Agenda for Sustainable Development. The 2030 Agenda comprises 17 Sustainable Development Goals and 169 targets addressing social, economic and environmental aspects of development, and seeks to end poverty, protect the planet and ensure prosperity for all. The SDGs include aspirational global targets that are intended to be universally relevant and applicable to all countries.
1 1977 United Nations Water Conference, Mar del Plata; 1992 Earth Summit, Rio de Janeiro; 1992 Dublin Principles; 2002 Johannesburg Declaration on Sustainable Development.
2 UN-Water (2008). Status Report on IWRM and Water Efficiency Plans for CSD16.3 United Nations Environment Programme (UNEP) (2012). The UN-Water Status Report on the Application of Integrated Approaches to Water Resources Management.
Goal 6 is to “Ensure availability and sustainable management of water and sanitation for all”, and it includes targets addressing all aspects of the freshwater cycle (Box 2). In relation to water, the SDGs build on the Millennium Development Goals (MDGs), which focus primarily on water supply and sanitation, to consider a more holistic approach to water management.
WATER RESOURCES MANAGEMENT SUPPORTS MULTIPLE GOALS.
Integrated water resources management (IWRM) is a process which promotes the coordinated development and management of water, land and related resources to maximize the resultant economic and social welfare in an equitable and sustainable manner. Its implementation supports all Goals across the 2030 Agenda.
BOX 1
GOAL 6. ENSURE AVAILABILITY AND SUSTAINABLE MANAGEMENT OF WATER AND SANITATION FOR ALL.
6.1 By 2030, achieve universal and equitable access to safe and affordable drinking water for all.
6.2 By 2030, achieve access to adequate and equitable sanitation and hygiene for all and end open defecation, paying special attention to the needs of women and girls and those in vulnerable situations.
6.3 By 2030, improve water quality by reducing pollution, eliminating dumping and minimizing release of hazardous chemicals and materials, halving the proportion of untreated wastewater and substantially increasing recycling and safe reuse globally.
6.4 By 2030, substantially increase water-use efficiency across all sectors and ensure sustainable withdrawals and supply of freshwater to address water scarcity and substantially reduce the number of people suffering from water scarcity.
6.5 By 2030, implement integrated water resources management at all levels, including through transboundary cooperation as appropriate.
6.6 By 2020, protect and restore water-related ecosystems, including mountains, forests, wetlands, rivers, aquifers and lakes.
6.a By 2030, expand international cooperation and capacity-building support to developing countries in water- and sanitation-related activities and programmes, including water harvesting, desalination, water efficiency, wastewater treatment, recycling and reuse technologies.
6.b Support and strengthen the participation of local communities in improving water and sanitation management.
BOX 2

7 Progress on integrated water resources management 2018
The targets agreed upon by Member States focus on improving the standard of water supply, sanitation and hygiene services (6.1 and 6.2); increasing treatment, recycling and reuse of wastewater (6.3); improving efficiency and ensuring sustainable withdrawals (6.4); and protecting water-related ecosystems (6.6), all as part of an integrated approach to water resources management (6.5). They also address the means of implementation for achieving these development outcomes (6a and 6b). See inside front and back covers for further information on other SDG 6 targets and indicators, and the roles and responsibilities of custodian agencies and programmes.
Direct and indirect interdependencies connect Goal 6 targets, all of the 17 Sustainable Development Goals, and more than one-third of the 169 targets (see Chapter 5).4 Integrated approaches to water resources management (target 6.5), can help to harness synergies, and to address potential trade-offs, with and between Goals on, for example: sustainable agriculture and food security (2), health and well-being (3), gender equality (5), energy (7), decent work and economic growth (8), industry, innovation and infrastructure (9), reduced inequalities (10), sustainable cities and communities (11), responsible consumption and production (12), climate action (13), life below water (14), life on land (15), and peace, justice and strong institutions (16).
Two indicators measure progress towards target 6.5 (“implement integrated water resources management at all levels, including through transboundary cooperation as appropriate”):
y 6.5.1 Integrated water resources management implementation (0-100) (see Chapter 2)
y 6.5.2 Proportion of transboundary basin area with an operational arrangement for water cooperation
The two indicators support each other by addressing the two main aspects of the target. Indicator 6.5.2 has a separate indicator report, though linkages are explored in both this report (Section 3.2.2), and in the 6.5.2 indicator report.5
Indicator 6.5.1 links to all Goal 6 indicators, such as those on water use efficiency, water supply, sanitation, wastewater treatment, ambient water quality and freshwater ecosystems. As more of a process-based indicator, it also closely links to the “means of implementation” indicators 6.a.1 (water and sanitation-related official development assistance) and 6.b.1 (procedures for local community participation).
4 UN-Water (2016). Water and Sanitation Interlinkages across the 2030 Agenda for Sustainable Development. Geneva.5 United Nations Economic Commission for Europe (ECE) and the United Nations Educational, Scientific and Cultural Organization (UNESCO) (2018). Progress on
Transboundary Water Cooperation – Global baseline for SDG 6 indicator 6.5.2.6 Smith, M. and Clausen, T.J. (2018). Revitalising IWRM for the 2030 Agenda: World Water Council Challenge Paper for the High-Level Panel on IWRM at the Eighth
World Water Forum. Brasilia. 7 Shah, T. (2016). Increasing water security: the key to implementing the Sustainable Development Goals. Global Water Partnership, TEC Background Paper nr. 22.
1.2 IWRM FOR SUSTAINABLE MANAGEMENT OF WATER RESOURCES
SDG 6 aims to “ensure availability and sustainable management of water and sanitation for all”. Achieving Goal 6 will require adaptive water governance to address the intertwined aspirations of the SDGs, and to accelerate current progress.
IWRM provides a holistic framework for addressing different demands and pressures on water resources, across sectors and at different scales. At its core, IWRM provides a framework to ensure that water resources are developed, managed and used in equitable, sustainable and efficient manner. It generally consists of:
y An enabling environment of policies laws and plans
y Institutional arrangements for cross-sectoral and multilevel coordination, and stakeholder involvement
y Management instruments such as data collection and assessments and instruments for water allocation that facilitate better decisions
y Financing for water infrastructure and ongoing costs of water resources management.
Though the concept of IWRM is relatively simple, implementation has proved challenging, and countries have reported mixed results. With the adoption of the SDGs and recognition of the potential for IWRM to mobilize synergies among goals, and to manage trade-offs in targets, the demands on IWRM are now much larger than they were in the past. IWRM in the 2030 Agenda must deliver more tangible progress and must do so more quickly and at larger scale than previously achieved. To achieve SDG 6, there is a need for increased focus on the mechanisms for implementing and operationalising IWRM, including sustainable financing, and pragmatic problem solving.6
IWRM has sometimes been seen as an end in itself, and as following a one-size-fits-all approach.7 In truth, IWRM is an extensive, ongoing process that can and must be tailored to individual situations. Furthermore, the various elements of IWRM can be applied in a range of ways by a range of actors, and at different speeds. Implementing these elements of IWRM should consider the local political, economic and social realities in each country. While the IWRM approach can provide the overarching framework, numerous other approaches

8CHAPTER 1 Water management and the 2030 Agenda
and mechanisms can support the implementation of IWRM. They are therefore complementary, rather than in conflict, and should be seen as catalysts for achieving IWRM objectives. For example (see Chapter 5 for more information):
y Programmes and plans related to sustainable agriculture and food security, sustainable cities and developments, and disaster risk reduction
y The nexus approach, which can provide an excellent mechanism for facilitating dialogue between relevant sectors (e.g. food, energy, water, ecosystems) in a given context
y Source to sea / ridge to reef approaches, which are useful for considering upstream-downstream implications, and land management impacts on the marine environment.
y Ecosystems approach / nature-based solutions
y Corporate water stewardship
y Implementation of water supply, sanitation, wastewater treatment and reuse services
y Integrated flood and/or drought management activities.
In addition to these mechanisms, other governance approaches and measures complement the IWRM framework. These include the 12 OECD Water Governance Principles, which cover the effectiveness, efficiency, and trust and engagement in water governance.8
In summary, implementing IWRM should not be seen solely as the task of a water ministry, though it will have a coordinating role to play. While there are no perfect indicators of water governance, an indicator that addresses different elements of IWRM provides a useful feedback mechanism to facilitate the implementation of the core aspects of good water management.
8 Organisation for Economic Co-operation and Development (2015). OECD Principles on Water Governance.
1.3 REPORT OVERVIEW
This baseline report aims to assess the status of IWRM implementation. It includes country examples, an estimate of progress towards the target, and some guidance to countries and the international community to accelerate implementation.
y Chapter 2 describes the indicator methodology, including country data-collection processes and calculation of the indicator.
y Chapter 3 provides the global and regional baseline overview for SDG 6.5.1, as well as an estimate of progress towards the target.
y Chapter 4 provides more detail on the four IWRM dimensions. It includes questions from the survey, and examples of barriers, enablers, and good practices provided from participating countries.
y Chapter 5 describes how water management can be implemented across sectors to support the 2030 Agenda.
y Chapter 6 provides some practical guidance for countries and the international community on implementation of IWRM.
Throughout the report, boxes highlight country experiences with, and examples of, different aspects of IWRM implementation. Boxes contain content developed from the free text responses to the questionnaires, and findings from country workshops. This material provides a snapshot only. (It was not possible to name all potentially relevant countries in given boxes. Further information can be found by downloading the full country responses from the IWRM data portal (Box 3).)
ONLINE RESOURCES ARE AVAILABLE.
The monitoring methodology and all results and support-ing documentation are available through the IWRM Data Portal at http://iwrmdataportal.unepdhi.org.
BOX 3

9 Progress on integrated water resources management 2018
MONITORING INTEGRATED WATER RESOURCES MANAGEMENT IN THE SDGS
2
© S
hutte
rsto
ck
10CHAPTER 2 Monitoring integrated water resources management in the SDGs
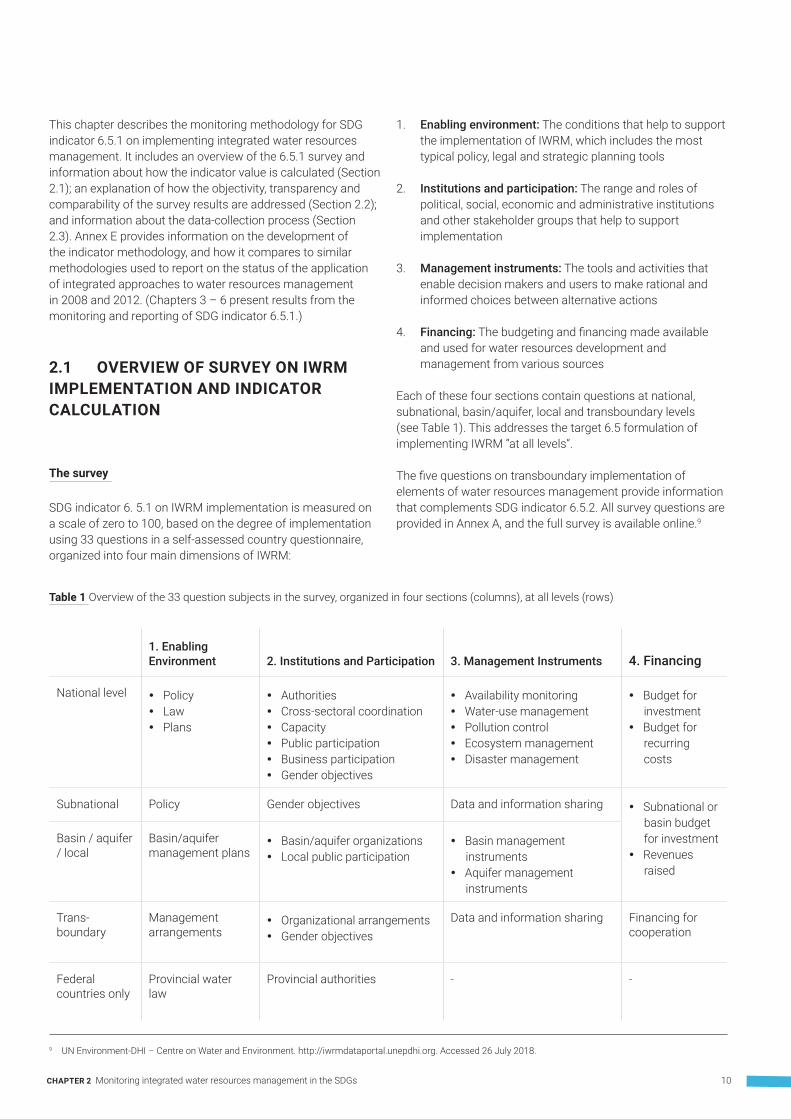
This chapter describes the monitoring methodology for SDG indicator 6.5.1 on implementing integrated water resources management. It includes an overview of the 6.5.1 survey and information about how the indicator value is calculated (Section 2.1); an explanation of how the objectivity, transparency and comparability of the survey results are addressed (Section 2.2); and information about the data-collection process (Section 2.3). Annex E provides information on the development of the indicator methodology, and how it compares to similar methodologies used to report on the status of the application of integrated approaches to water resources management in 2008 and 2012. (Chapters 3 – 6 present results from the monitoring and reporting of SDG indicator 6.5.1.)
2.1 OVERVIEW OF SURVEY ON IWRM IMPLEMENTATION AND INDICATOR CALCULATION
The survey
SDG indicator 6. 5.1 on IWRM implementation is measured on a scale of zero to 100, based on the degree of implementation using 33 questions in a self-assessed country questionnaire, organized into four main dimensions of IWRM:
9 UN Environment-DHI – Centre on Water and Environment. http://iwrmdataportal.unepdhi.org. Accessed 26 July 2018.
1. Enabling environment: The conditions that help to support the implementation of IWRM, which includes the most typical policy, legal and strategic planning tools
2. Institutions and participation: The range and roles of political, social, economic and administrative institutions and other stakeholder groups that help to support implementation
3. Management instruments: The tools and activities that enable decision makers and users to make rational and informed choices between alternative actions
4. Financing: The budgeting and financing made available and used for water resources development and management from various sources
Each of these four sections contain questions at national, subnational, basin/aquifer, local and transboundary levels (see Table 1). This addresses the target 6.5 formulation of implementing IWRM “at all levels”.
The five questions on transboundary implementation of elements of water resources management provide information that complements SDG indicator 6.5.2. All survey questions are provided in Annex A, and the full survey is available online.9
1. Enabling Environment 2. Institutions and Participation 3. Management Instruments 4. Financing
National level y Policy y Law y Plans
y Authorities y Cross-sectoral coordination y Capacity y Public participation y Business participation y Gender objectives
y Availability monitoring y Water-use management y Pollution control y Ecosystem management y Disaster management
y Budget for investment
y Budget for recurring costs
Subnational Policy Gender objectives Data and information sharing y Subnational or basin budget for investment
y Revenues raised
Basin / aquifer / local
Basin/aquifer management plans
y Basin/aquifer organizations y Local public participation
y Basin management instruments
y Aquifer management instruments
Trans-boundary
Management arrangements
y Organizational arrangements y Gender objectives
Data and information sharing Financing for cooperation
Federal countries only
Provincial water law
Provincial authorities - -
Table 1 Overview of the 33 question subjects in the survey, organized in four sections (columns), at all levels (rows)

11 Progress on integrated water resources management 2018
Calculating the indicator score
Each survey question is scored on a scale of zero to 100, in increments of 10, guided by specific threshold descriptions (see Section 2.2). Question scores in each section are averaged to give a section average for each of the four sections, rounded to the nearest whole number. The four section averages are then averaged to calculate the final indicator 6.5.1 score for each country, on a scale of zero to 100.
National benefits of completing the questionnaire
While a single indicator score is calculated for the purposes of tracking progress on target 6.5 at the global level, the scores and free text for each question are more important at the country level. This is because the scores provide a diagnostic tool for identifying key elements of integrated water resources management where implementation can be advanced in line with national priorities. Furthermore, the process of bringing together multiple stakeholders to reach consensus on responses to the survey can provide a valuable mechanism for intersectoral coordination and collaboration. Both aspects are touched on in Section 2.3 and Chapter 6.
2.2 ADDRESSING OBJECTIVITY, TRANSPARENCY, AND COMPARABILITY OF SURVEY RESPONSES
The objectivity, transparency and comparability of the survey responses are addressed in three main ways:
1. Countries have been encouraged to organize multi-stakeholder processes to reach consensus on responses to each question (see Section 2.3). These processes serve the dual purposes of establishing cross-sectoral and multi-level dialogue (Chapter 5), and of ensuring that most key stakeholders in the country agree on the responses, resulting in a more realistic assessment of implementation. While there is no way to systematically and accurately cross-check country reports, these multi-stakeholder processes are the best way of achieving more robust results. Countries reported that it was easier to reach consensus on the scores when they could be based on evidence.
2. For each question, specific guidance is provided for the degree of implementation for the following six thresholds: zero, 20, 40, 60, 80 and 100. An example of the threshold descriptions is provided below for the question on the status of the national-level water resources policy, or similar (q.1.1a):
© S
hutte
rsto
ck
12CHAPTER 2 Monitoring integrated water resources management in the SDGs
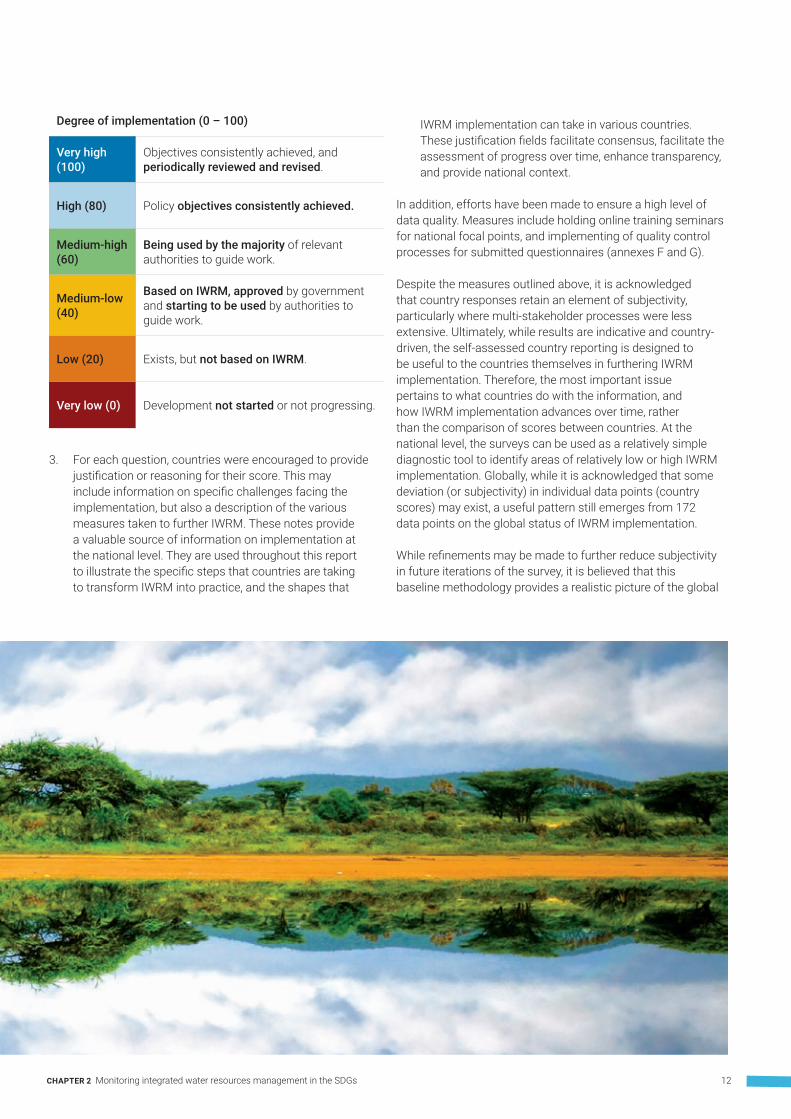
Degree of implementation (0 – 100)
Very high (100)
Objectives consistently achieved, and periodically reviewed and revised.
High (80) Policy objectives consistently achieved.
Medium-high (60)
Being used by the majority of relevant authorities to guide work.
Medium-low (40)
Based on IWRM, approved by government and starting to be used by authorities to guide work.
Low (20) Exists, but not based on IWRM.
Very low (0) Development not started or not progressing.
3. For each question, countries were encouraged to provide justification or reasoning for their score. This may include information on specific challenges facing the implementation, but also a description of the various measures taken to further IWRM. These notes provide a valuable source of information on implementation at the national level. They are used throughout this report to illustrate the specific steps that countries are taking to transform IWRM into practice, and the shapes that
IWRM implementation can take in various countries. These justification fields facilitate consensus, facilitate the assessment of progress over time, enhance transparency, and provide national context.
In addition, efforts have been made to ensure a high level of data quality. Measures include holding online training seminars for national focal points, and implementing of quality control processes for submitted questionnaires (annexes F and G).
Despite the measures outlined above, it is acknowledged that country responses retain an element of subjectivity, particularly where multi-stakeholder processes were less extensive. Ultimately, while results are indicative and country-driven, the self-assessed country reporting is designed to be useful to the countries themselves in furthering IWRM implementation. Therefore, the most important issue pertains to what countries do with the information, and how IWRM implementation advances over time, rather than the comparison of scores between countries. At the national level, the surveys can be used as a relatively simple diagnostic tool to identify areas of relatively low or high IWRM implementation. Globally, while it is acknowledged that some deviation (or subjectivity) in individual data points (country scores) may exist, a useful pattern still emerges from 172 data points on the global status of IWRM implementation.
While refinements may be made to further reduce subjectivity in future iterations of the survey, it is believed that this baseline methodology provides a realistic picture of the global

13 Progress on integrated water resources management 2018
implementation of integrated water resources management, that comparisons can be made between countries, and progress can be measured over time.
Indicator 6.5.1 has been classified as a Tier 1 indicator by the Inter-Agency and Expert Group on SDG Indicators (IAEG-SDGs), meaning that the “indicator is conceptually clear, has an internationally established methodology and standards are available, and data are regularly produced by countries for at least 50 per cent of countries and of the population in every region where the indicator is relevant.”10
2.3 NATIONAL AND GLOBAL DATA-COLLECTION PROCESSES
National data-collection processes
The data-collection process aimed to build on existing monitoring efforts in countries, and to encourage country-led processes for national data collection to the extent possible. Each UN member state was invited to appoint a national
10 Inter-agency Expert Group on Sustainable Development Goals Indicators. https://unstats.un.org/sdgs/iaeg-sdgs/tier-classification/. Accessed 26 July 2018.11 UN Environment supported the national and global data-collection processes by providing online training opportunities for the national focal points, offering
in-country support (stakeholder workshops), and establishing a helpdesk. The UN Environment Helpdesk was responsible for the quality assurance of national data submissions, most of which have been revised and finalized in close collaboration with the national focal points (Annex H).
focal point (FP) for indicator 6.5.1, responsible for coordinating data collection and submission to UN Environment, serving as the UN Custodian Agency for indicator 6.5.1. About 75 per cent of the focal points are affiliated with national ministries responsible for water management (e.g. ministry of water, ministry of environment, or similar) (see Annex G for full breakdown).
Global data-collection status and support
Focal points were advised to design a process that included multiple stakeholder groups to the extent possible, ensuring that the survey responses represent a consensus amongst stakeholders. In most cases the survey response information has been collected from government officials and various sectoral stakeholders via means of direct communication or workshops.
In 36 countries, stakeholder workshops were held in collaboration with the Global Water Partnership (GWP), together with the national focal points and GWP country water partnerships (Figure 1).11Over 1,000 stakeholders participated in these workshops. These country workshops have provided
A total of 172 countries, covering roughly 90 per cent of the 193 UN member states, reported on the degree of implementation of IWRM.11
Complete submission (w. stakeholder workshop) Complete submission Incomplete submission No data
Figure 1 Global overview of country data submissions on SDG indicator 6.5.1, including countries with GWP-facilitated workshops

14CHAPTER 2 Monitoring integrated water resources management in the SDGs
not only a platform for stakeholder discussions and consensus building, but also information on the barriers to implementation, and examples of actions taken to further IWRM in countries (Box 4 below, Section 6.3 and Annex F).
The 172 countries cover more than 80 per cent of the countries in most regions and each Human Development Index group,
around 75 per cent of total global population, and around 80 per cent of country area. Notable exceptions in terms of population and/or area include India, Thailand, Canada and the United States (Figure 1, and see Annex D for further information on data coverage).
COUNTRY-LEVEL MULTI-STAKEHOLDER WORKSHOPS WERE AN AGENT OF CHANGE.
In all, 36 countries held multi-stakeholder workshops, facilitated by Country Water Partnerships, to complete the ques-tionnaire. In all cases, the workshop included a range of relevant government ministries and agencies, and some also included other stakeholders such as NGOs, and business. The benefits from the workshop approach were very prominent:
y The questionnaire was seen as a useful tool to assess in an objective way their progress with management and sustainable utilization of water resources using an IWRM approach (e.g. Mozambique, Armenia, Cambodia). However, Sudan participants found the questionnaire too complicated. Tanzania participants expressed a need for a more coordinated approach to monitoring and reporting of all SDG6 targets and indicators.
y In most cases participants discussed, negotiated and finalized scores for the questions at the meeting (e.g. Ukraine, Uzbekistan, Ethiopia, Honduras). El Salvador noted that consensus was greatest when technical data could back the score, as was the case with the issue of management instruments.
y In some cases (probably more but not reported), the process stimulated individuals and groups to work together to help overcome identified problems, to advance progress through their own institutions, or to lobby for change (e.g. Argentina, Chile). Stakeholders in the Gambia agreed that the exercise had raised their awareness on IWRM and its implementation, and participants promised to do their best to advocate for the promotion of IWRM in their various institutions. Zambian participants emphasized that the main takeaway of the process was a recognition that furthering IWRM implementation will positively affect economic, environmental, and human development. Mauritania, Malawi, Mongolia and others provided specific recommendations to advance IWRM.
The results demonstrate how the integrated approach works, in that a negotiated outcome is more likely to reflect reality, garner wider acceptance, and provide focus for the most important next steps.
BOX 4
Each region is well covered by the 172 reporting countries.
35
16
2
5
4
5
3
137
29
8
20
24
39
8
7
2
5
1
1
1
1
1
16
2
3
1
4
2
3
0% 20% 40% 60% 80% 100%
WorldSub-Saharan Africa
Oceania
Northern Africa and Western AsiaLatin America and the Caribbean
Europe and Northern AmericaEastern and South-Eastern Asia
Central and Southern AsiaAustralia and New Zealand
Response completed (w. stakeholder workshop) Response completed Incomplete response No data
LABELS SHOW NUMBER OF COUNTRIES
Percentage of countries by region
Figure 2 Regional overview of SDG 6.5.1 data submissions, including countries with GWP-facilitated workshops

15 Progress on integrated water resources management 2018
STATUS OF IMPLEMENTATION OF INTEGRATED WATER RESOURCES MANAGEMENT
3
© U
N P
hoto
/ Ki
ba P
ark

16CHAPTER 3 Status of implementation of integrated water resources management
In line with Target 6.5 (“By 2030, implement integrated water resources management at all levels, including through transboundary cooperation as appropriate”), the global, aspirational target for indicator 6.5.1, is to reach a “very high” degree of implementation, or a global average score of 91 to 100. Recognizing that countries are at very different stages of implementation, it may be useful for countries to set national targets, guided by the global level of ambition but considering national circumstances (see Section 6.4).
The general interpretations of the implementation categories for the overall 6.5.1 indicator score, provided below, are based on the threshold descriptions from the individual questions. Individual question thresholds are provided in Annex A-2, and some questions are discussed in Chapter 4.
Table 2 Overall IWRM implementation categories, score thresholds, and interpretation
Score range
General interpretation for overall IWRM score
Very high
91 - 100 Vast majority of IWRM elements are fully implemented, with objectives consistently achieved, and plans and programmes periodically assessed and revised.
High 71 - 90 IWRM objectives of plans and programmes are generally met, and geographic coverage and stakeholder engagement is generally good.
Medium-high
51 - 70 Capacity to implement elements of IWRM is generally adequate, and elements are generally being implemented under long-term programmes.
Medium-low
31 - 50 Elements of IWRM are generally institutionalized, and implementation is underway.
Low 11 - 30 Implementation of elements of IWRM has generally begun, but with limited uptake across the country, and potentially low engagement of stakeholder groups.
Very low 0 - 10 Development of elements of IWRM has generally not begun, or has stalled.
3.1 COUNTRY AND REGIONAL STATUS
KEY FINDINGS AND RECOMMENDATIONS
1. Country implementation of integrated water resources management ranges from very low to very high, with a global average 6.5.1 score of 49 on a scale of zero to 100:
y An estimated 40 per cent of countries are implementing most elements of IWRM through long-term programmes (medium-high and above).
y Another 41 per cent of countries have adopted most elements of IWRM and implementation is underway, but uptake of arrangements and stakeholder engagement may be relatively low (medium-low).
y The remaining 19 per cent of countries have only started developing elements of IWRM (low and very low).
In total, 60 per cent of countries are at risk of using water resources with negative environmental, social, and ultimately economic consequences unless water resources management implementation is significantly advanced.
2. While this is the SDG baseline, comparison with similar previous surveys indicates that 60 per cent of countries are not likely to reach the global target, at current rates of implementation. Implementation needs to significantly accelerate in these countries, and they are encouraged to set national targets based on the country context.
3. Each region contains a spread of IWRM implementation, with medium-high implementation and above in all regions. Latin America and the Caribbean, Central and Southern Asia, Oceania, and Sub-Saharan Africa have the lowest average implementation levels. There are learning opportunities between regional neighbours with similar political, economic, or cultural contexts.

17 Progress on integrated water resources management 2018
Results show that 40 per cent of countries are implementing most elements of IWRM through long-term programmes (medium-high and above), 41 per cent have institutionalized most elements of IWRM and implementation is underway (medium-low), and 19 per cent of countries have started developing elements of IWRM.
Countries per categoryScore range Baseline Towards 2030% Nr.
4 Very high 7 91 - 100 Countries that have fully established IWRM processes, and review and revise programmes. (4 per cent) Likely to reach the global target, or
have already done so, but will need to remain focussed to consolidate and strengthen gains. 15 High 26 71 - 90
Countries that are generally achieving policy objectives for IWRM. Geographic coverage and stakeholder involvement generally good. (15 per cent)
21 Medium-high 36 51 - 70 Countries that are implementing most elements of
IWRM in long-term programmes. (21 per cent)
Potentially able to reach the global target, but efforts need to be focussed and sustained towards 2030.
41 Medium-low 70 31 - 50
Countries that have institutionalized most elements of IWRM. Implementation is underway, but uptake of arrangements is not widespread. (41 per cent)
A majority (60 per cent) of countries unlikely to meet the global target unless progress is significantly accelerated.
Countries should aim to set national targets based on the country context. 19 Low 32 11 - 30
Countries that have started developing elements of IWRM. Limited uptake across the country and potentially low stakeholder participation. (19 per cent)
<1 Very low 1 0 - 10
Figure 3 Global distribution of 6.5.1 scores per IWRM implementation category, based on 172 reporting countries
12 United Nations Environment Programme (UNEP) (2012). The UN-Water Status Report on the Application of Integrated Approaches to Water Resources Management.
As this is the SDG baseline for 6.5.1, it is not possible to state whether countries are “on track” to meet the global target. However, findings from similar status reports on integrated approaches to water resources management in 2008 and 2012,12 as well as experience on the ground, indicate that full implementation of IWRM takes decades to achieve. Therefore, at current rates of progress, the 60 per cent of countries with medium-low implementation and below are unlikely to reach the global target of “very high” implementation (see Chapter 6 for further discussion on progress towards the target, and discussion of national target setting).

18CHAPTER 3 Status of implementation of integrated water resources management
A total of 103 countries report medium-low IWRM implementation or below. While some institutional arrangements may be in place, implementation of various arrangements may be limited, with generally low capacity, geographic coverage, and stakeholder participation.
Very low Low Medium-low Medium-high High Very high No data
IWRM implementation SDG 6.5.1 score
Figure 4 Country implementation of integrated water resources management (categories)
There is a continuum of country scores for indicator 6.5.1 from 10 to 100, with a global average of 49.
0
10
20
30
40
50
60
70
80
90
100
Hig
hM
ediu
m
high
Med
ium
lo
wLo
wVe
ry
low
Very
Hig
h
GLOBAL AVERAGE IWRM IMPLEMENTATION = 49
COUNTRY POINTS EVENLY SPACED ON X-AXIS, ORDERED LEFT TO RIGHT IN INCREASING LEVELS OF IMPLEMENTATION-
INDI
CATO
R 6.
5.1
SCO
RES:
DEG
REE
OF
IWRM
IMPL
EMEN
TATI
ON
Figure 5 Country implementation of integrated water resources management (scores)

19 Progress on integrated water resources management 2018
General interpretation of the implementation categories is given in Table 2 and Figure 3. More specific interpretation for each question is provided in the questionnaire, as discussed in Chapter 4.
Each region has countries with a range of IWRM implemen-tation, from low to high in most cases (Figures 4 and 6). This presents learning opportunities and potential peer-to-peer capacity building between countries that may have similar cultural, political and economic contexts.
13 Standard SDG regions are defined by the United Nations Statistical Division. 14 While “Northern America” is in the same regional grouping as Europe, neither Canada nor the United States of America have reported on 6.5.1. Therefore, results
from this region represent Europe only.
Figure 6 shows the average scores for the SDG regions,13 as well as a breakdown of IWRM implementation for countries in each region. Latin America and the Caribbean, Central and Southern Asia, Oceania, and Sub-Saharan Africa have similar average scores (35-40), indicating medium-low implementation on average. Eastern and South-Eastern Asia, Northern Africa and Western Asia, and Europe have medium-high implementation on average, though with a fairly wide spread from 53 to 67.14 Australia and New Zealand average high implementation (72).
Each region contains a range of IWRM implementation, often providing learning opportunities between neighbouring countries.
0% 20% 40% 60% 80% 100%
World
Australia and New Zealand
Europe and Northern America
Northern Africa and Western AsiaEastern and South-Eastern Asia
Sub-Saharan Africa
Oceania
Central and Southern AsiaLatin America and the Caribbean
REGION
49
67
55
40
38
53
35
72
37
AVE. SCORE PERCENTAGE OF COUNTRIES PER IWRM IMPLEMENTATION CATEGORY
IWRM Implementation Very low Low Medium-low Medium-high High Very high
Figure 6 Regional averages and country breakdown of IWRM implementation
The above figure indicates that the level of IWRM implementation is somewhat, but not entirely, linked to overall levels of development. Section 3.3 briefly discusses the factors influencing IWRM implementation.

20CHAPTER 3 Status of implementation of integrated water resources management
3.2 IMPLEMENTING IWRM AT ALL LEVELS
Implementing IWRM “at all levels” is a key part of SDG target 6.5, as spatial scales are not only closely related, but also interdependent. More specifically, action or inaction at one level can have a direct impact on the quantity and quality of water at another. Given that embarking on IWRM is a decision made by national governments, it is perhaps understandable that the focus of attention typically starts at the national level, with other levels following on. The challenge in this approach is to ensure that IWRM implementation at transboundary and subnational/local levels does not lag the national level to the extent that it hinders development. The following two sub-sections compare implementation at the national level first with subnational/basin/local level (Section 3.2.1) and then with transboundary levels (Section 3.2.2).
3.2.1 NATIONAL VS SUBNATIONAL, BASIN AND LOCAL LEVELS
Countries have reported that IWRM is being implemented at national, subnational, basin/aquifer and local levels. However, subnational, basin or local implementation lags national implementation in every comparable instance, with differences ranging from 12 points (basin/aquifer institutions) to four points (subnational gender objectives) (Figure 7). These notable
differences across the board raise concerns, as resource use takes place and the most hands-on management needs to happen at these lower levels. There are, however, many good examples (Box 5).
Subnational-, basin- and local-level implementation lags national implementation, with capacity of basin and aquifer organizations of particular concern.
KEY FINDINGS AND RECOMMENDATIONS
1. Implementation of IWRM at the subnational level is generally slightly lower than at the national level in all comparable areas. Areas of particular concern include institutional capacity at the basin or aquifer level. Efforts need to focus on advancing elements of IWRM implementation at subnational, basin, and local levels.
2. In federated countries, water management tends to be decentralized from the federal to the state level, though in some cases state differences in capacity and approaches need to be addressed.
-12 -10 -8 -6 -4 -2 0
Basin/aquifer organisations
Sub-national policy
Basin/aquifer management plans
Sub-national budget for investment
Local level stakeholder participation
Sub-national gender objectives
Figure 7 Difference between global average implementation of elements of IWRM at subnational, basin and local levels, compared to the national-level equivalents

21 Progress on integrated water resources management 2018
Federated countries
Water resources management in federated states can have an extra layer of complexity (Box 6). The 27 federated states that reported on 6.5.1 address two questions specifically related to institutions (q.2.2f) and laws (q.1.2d) at the provincial/state level in federated countries. For other elements of IWRM, questions at subnational level are likely to refer to the provincial/state level for federate countries. For these two
questions, implementation is comparable to the national level, with country scores ranging from zero to 100, and global averages of 55 and 59, respectively. However, the federated countries which reported on 6.5.1 tend to have levels at the two extremes of development (either high or low levels), and, hence, the degree of IWRM implementation tends to be concentrated in the top and bottom two implementation categories, with far fewer countries in the middle two categories.
EFFECTIVE SUBNATIONAL AND BASIN MANAGEMENT STRUCTURES SUPPORT IWRM.
Managing water using a watershed approach has been adopted widely (Algeria, Armenia, China, Kenya, Zimbabwe) with various titles such as basin commissions, catchment councils who may be elected (Mexico, Morocco, Zimbabwe, Namib-ia), or supported by a multisector committee (Norway).
Sub-catchment structures are frequently found under the basin level such as watershed committees, community or stakeholder structures (Burkina Faso, Kenya, Mexico). In the case of Bangladesh, which has no basin organizations, the country’s “Guidelines for Participatory Water Resources Management” led to the formation of around 2,000 water man-agement organizations at the local level.
Countries with a lower level of IWRM implementation may not have any subnational water management structures yet in place (DR Congo, Cameroon, Equatorial Guinea, Niger, Madagascar, Timor-Leste). The presence of subnational water management structures suggests that local water management exists, but that, in many cases, its full potential is not realized because of various capacity constraints (Argentina, Armenia, Guatemala, Guyana, Zimbabwe).
BOX 5
WATER MANAGEMENT IS DECENTRALIZED IN FEDERATED COUNTRIES.
In federated countries water management has usually been decentralized, and is a responsibility of each State. Argentina has 24 jurisdictions each with the responsibility to lead IWRM implementation but with varying capacity when the regu-latory process has not been coupled with the implementation of the management instruments and resources. A similar situation was reported for Malaysia with the added complication that state water resource-related enactments differ in jurisdiction, scope and powers, which may lead to gaps, conflicts and duplication in the enactments with federal and neighbouring state laws.
Mexico may have avoided some of these problems when the National Water Commission proposed to each state a mod-el state water law that included the concept of IWRM to promote the coordinated management and development of wa-ter, land, and resources without compromising the sustainability of vital ecosystems. Sudan also prepared a framework law to guide states to develop its water laws. Its Water Law of 1995 delegated states to manage aquifers and watersheds within their respective jurisdictions under state water corporations. However, these institutions have little capacity to develop IWRM plans.
State water-related laws are fully implemented across the United Arab Emirates, and authorities have the capacity to effectively lead periodic IWRM plan revision. Similarly, in Micronesia, water contamination and pollution laws are approved and enforced in most states, which have the authority to act for the conservation of water resources through site-based management systems and protected-areas networks.
BOX 6

22CHAPTER 3 Status of implementation of integrated water resources management
3.2.2 TRANSBOUNDARY IMPLEMENTATION OF IWRM
15 While 132 countries report on the question regarding transboundary data and information sharing (q.3.2d), the remaining 40 respond “not applicable” (“n/a”). However, the number of countries reporting on the other transboundary questions varies: arrangements = 128 countries; organizational frameworks = 126 countries; financing = 116 countries. Furthermore, a few countries that share transboundary basins or aquifers with other countries report “n/a”, and one island state reports on transboundary questions. To address this variability in the next round of data collection, further explanation may be required in the survey, as well as more rigorous quality-control procedures.
16 A fifth question addresses gender objectives at the transboundary level, though almost twice the proportion of countries report “not applicable” for this question compared to the other transboundary-level questions. This question is addressed in Section 4.3.
In the survey, 132 countries report on transboundary-level issues by answering four main questions, one for each of the four main aspects of IWRM: 15
y Arrangements (q.1.2c): such as treaties, conventions, agreements or memorandum of understanding
y Organizational frameworks (q.2.2e): such as joint bodies, join mechanisms or commissions
y Data and information sharing (q.3.2d): institutional and technical mechanisms in place
y Financing for transboundary cooperation (q.4.2c). (see Figure 9 for results)16
KEY FINDINGS AND RECOMMENDATIONS
1. Approximately three quarters of countries with shared waters report that they have established some form of agreements, organizational frameworks, data sharing and financial arrangements for transboundary water management. However, the degree of implementation, or operationalization, of these aspects varies greatly: y For transboundary arrangements such as treaties, conventions or agreements, almost half of all countries
report limited implementation of the provisions in these arrangements, while about a third of countries report implementing most of the provisions.
y For transboundary organizational frameworks such as joint bodies, joint mechanisms and commissions, 40 per cent of countries report only partly fulfilling the organizations’ mandates, with 37 per cent of countries mostly or fully fulfilling the mandates.
y For transboundary data and information sharing, 57 per cent of countries report some data and information sharing according to arrangements, while only 20 per cent report effective data and information sharing.
y For agreements on financing for transboundary cooperation, almost half of countries report providing less than 50 per cent of agreed funds, and a third of countries report providing more than 50 per cent of agreed funds.
Significant effort is needed to ensure that arrangements are fully implemented and operational.
2. Estimates are likely to be optimistic because countries have been asked to report only on the status of transboundary water management for the majority of what they consider to be their most significant transboundary basins and aquifers. Cross-reference with SDG indicator 6.5.2 on transboundary cooperation, and future harmonization of reporting approaches between the two indicators are needed.
3. There are significant differences in reported levels of transboundary implementation of IWRM between neighbouring countries, indicating potential differences in priorities and perceptions concerning shared basins and aquifers. Neighbouring country differences are also found in SDG indicator 6.5.2. Increased dialogue and harmonization between countries on reporting is encouraged, and can be used a platform for enhanced understanding and cooperation.

23 Progress on integrated water resources management 2018
With 153 countries sharing over 600 transboundary rivers, aquifers and lakes, transboundary cooperation is essential for sustainable development. 17,18 Most countries have some transboundary arrangements in place, though priorities and capacities differ within countries sharing the same waters. As illustrated by indicators 6.5.1 and 6.5.2, a significant effort is needed to ensure that such arrangements are fully implemented and operational.
17 United Nations Economic Commission for Europe (ECE) and the United Nations Educational, Scientific and Cultural Organization (UNESCO) (2018). Progress on Transboundary Water Cooperation – Global baseline for SDG 6 indicator 6.5.2.
18 United Nations Environment Programme (UNEP) (2016). Transboundary Waters Systems: Status and Trends: Crosscutting Analysis. Transboundary Waters Assess-ment Programme (TWAP), Volume 6. Nairobi.
The above figures show some basins and aquifers with considerable differences on the average levels of implementation of transboundary elements across countries. This implies that countries sharing a basin or aquifer may have different perspectives on either the importance of transboundary cooperation, or on the status of transboundary
cooperation. There may also be differences in capacity and strength of the respective national enabling environments and institutions. These differences need to be investigated in more detail, cross-checked with the results of SDG indicator 6.5.2, and addressed by the countries concerned, to achieve effective and transparent transboundary cooperation.
Not applicable Transboundary river basinsVery low Low Medium-low Medium-high High Very high No data
Average transboundary scores
Not applicable Transboundary aquifersVery low Low Medium-low Medium-high High Very high No data
Average transboundary scores
Figure 8 Country scores for average transboundary-level implementation, overlaid with transboundary basins (top) and aquifers (bottom)

24CHAPTER 3 Status of implementation of integrated water resources management
Approximately three quarters of countries report having established some form of agreements, organizational frameworks, data sharing (all medium-low and above) and financial arrangements (low and above) for transboundary water management, but the likely coverage and degree of implementation vary greatly (see also key findings).
Table 3 General interpretation of transboundary implementation categories for four questions
Very High High Medium-high Medium-low Low Very low
Arrangements / organizational frameworks / data and info sharing
Fully implemented, mandates fully fulfilled.
Mostly implemented, mandates mostly fulfilled
Partly implemented, mandates partly fulfilled.
Adopted Being developed
None
Financing arrangements
Agreed contributions fully met.
Funding more than 75% of agreed contributions.
Funding less than 75% of agreed contributions.
Funding less than 50% of agreed contributions.
Adopted None
11%
12%
10%
24%
13%
13%
17%
26%
14%
13%
30%
17%
31%
27%
23%
10%
21%
24%
15%
12%
11%
13%
5%
11%
0% 20% 40% 60% 80% 100%
Arrangements (1.2c)
Organisational frameworks (2.2e)
Data and information sharing (3.2d)
Financing for transboundary cooperation (4.2c)
Transboundary:
48
56
AVE. SCORE
57
40
PERCENTAGE OF COUNTRIES PER IMPLEMENTATION CATEGORY
IWRM Implementation Very low Low Medium-low Medium-high High Very high
Figure 9 Transboundary-level implementation of IWRM elements
Significant effort is needed to ensure transboundary arrangements are fully implemented. Juba, South Sudan, on the Nile River.© Shutterstock

25 Progress on integrated water resources management 2018
Countries report a range of drivers and enablers for transboundary-level implementation of IWRM (Box 7):
y Regional frameworks and platforms: such as the revised protocol on shared water resources in the Southern African Development Community (SADC) (Botswana, Democratic Republic of the Congo, Lesotho, Malawi, Swaziland, Zambia, Zimbabwe), the EU Water Framework Directive (France, Germany, Greece), and the Economic Community of West African States (ECOWAS) (Benin, Burkina Faso).
y International conventions: the Convention on the Protection and Use of Transboundary Watercourses and International Lakes (Water Convention), and the UN Convention on the Law of the Non-navigational Uses of International Watercourses (Bosnia and Herzegovina, Croatia, France, Greece, Lithuania, Slovakia, Slovenia, Ukraine, Uzbekistan).
y National processes and priorities: such as IWRM plans, information systems, and financing arrangements that can contribute to transboundary cooperation (Burkina Faso, Guyana, Guatemala, Slovenia).
y Donor or third-party facilitated activities: Bosnia and Herzegovina (Sava River Basin), Kazakhstan, Sierra Leone.
While notable progress has been made in many transboundary basins and aquifers, the results from 6.5.1 and 6.5.2 both suggest that a significant effort is needed to strengthen transboundary water cooperation (Box 8).
SDG indicator 6.5.2 measures the proportion of transboundary basin area in each country with an operational arrangement for water cooperation. For SDG indicator 6.5.2, four criteria
19 United Nations Economic Commission for Europe (ECE) and the United Nations Educational, Scientific and Cultural Organization (UNESCO) (2018). Progress on Transboundary Water Cooperation – Global baseline for SDG 6 indicator 6.5.2.
are used to determine whether the arrangements are considered “operational”: a joint body or mechanism must exist; meetings between countries must be held at least annually; joint management plans or objectives must have been set; and exchanges of data and information must take place at least annually. Based on the 62 countries where data are available on indicator 6.5.2, the average national proportion of transboundary basin area covered by an operational arrangement is 59 per cent (though results range from zero to 100 per cent).19
The “high” and “very high” implementation categories from the 6.5.1 questions can be compared with “operational” arrangements measured by 6.5.2. Only around one third of the 132 countries that report on the transboundary questions for 6.5.1, report high to very high implementation of arrangements and organizational frameworks, and only one fifth of those countries report high to very high levels for data and information sharing and financing arrangements. This is comparable to results from 6.5.2, where roughly one third of countries reported having operational arrangements in place for 90-100 per cent of their transboundary basin area. However, in 6.5.1, countries could decide which were the “most important” transboundary basins and aquifers in terms of economic, social or environmental value to the country (or neighbouring countries). Furthermore, only the majority of the basins and aquifers had to meet the criteria in the threshold descriptions. Thus, the representation of transboundary-level implementation in 6.5.1 may be an over-estimation. These issues should be considered in future review of the 6.5.1 survey.
Country reporting and data analysis for indicator 6.5.1 and 6.5.2 occurred simultaneously, so opportunities for detailed cross-analysis have been limited by the time frame of this reporting cycle. However, initial analysis has revealed a strong agreement
INTEGRATED WATER RESOURCES MANAGEMENT PROVIDES A FRAMEWORK FOR TRANSBOUNDARY COOPERATION.
Several countries reported having developed IWRM plans at the transboundary basin level. For instance, Bolivia and Peru have developed IWRM plans for the Titicaca-Desaguadero-Poopó-Salar de Coipasa System (TDPS). In 2017, Colombia and Ecuador adopted a binational plan related to IWRM in the Carachi-Guaitara and Mira-Mataje basins. An agreement on IWRM for all basins shared between Ecuador and Peru is being developed. In the lower Mekong, an IWRM project is being implemented under the auspices of the 1995 Mekong Agreement. In 2007, countries of the Congo-Uubangui-Sangha basin adopted a protocol to the 1994 Congo Basin accord related, in part, to the implementation of IWRM. A basin-wide IWRM plan has been developed in the Orange-Senqu Basin through the Orange-Senqu River Commission (ORASECOM). A joint technical committee for IWRM has been operational in the Volta basin since 2007. In June 2016, Azerbaijan and Georgia initiated a project to advance IWRM across the Kura River Basin.
BOX 7

26CHAPTER 3 Status of implementation of integrated water resources management
between the two indicator results for many countries. For others, differences may be due to variation in methodologies, reporting processes, and stakeholder involvement, expertise, and opinions expressed. Opportunities for harmonizing the indicator methodologies and reporting processes should be investigated before the next round of data collection.
3.3 FACTORS INFLUENCING IWRM IMPLEMENTATION
Although most regions contain countries with a wide range of implementation levels, a number have made more limited progress. Not surprisingly this group includes many less-developed countries, but surprisingly also includes a number of more-developed countries. In addition, some less-developed countries have achieved a comparatively advanced level of implementation. This situation warrants closer analysis.
The Human Development Index (HDI) is a summary measure of achievement in key dimensions including life expectancy, education and standard of living.20 In contrast to measures such as GDP that focus on economic development, HDI reflects a country’s capacity to implement health and education measures. If a country has capacity in these areas, then in theory it also has the capacity to implement IWRM, even if the level of economic development is not that high, and even if countries are likely to prioritize health and education
20 United Nations Development Programme (2016). Human Development Index. http://hdr.undp.org/en/content/human-development-index-hdi. Accessed 26 July 2018.
TRANSBOUNDARY-LEVEL COOPERATION IS COMMON, BUT NOT UNIVERSAL.
Most countries with transboundary rivers, lakes and aquifers report one or more transboundary agreements. Large rivers and aquifers (Zambezi, Mekong, Niger, Nile rivers, and North Western Sahara Aquifer System and Guarani Aquifer) have transboundary agreements in place, and varying levels of cooperation and management. Algeria has surface water man-agement agreements with Tunisia and Morocco. Azerbaijan has agreements with Russia and Iran. Transboundary coop-eration is well developed in Europe where several large rivers such as the Danube and the Rhine cross many countries, and river basin management plans and flood risk management plans have been established along with well-functioning institutions. Usually cooperation is at the highest level of ministers or Heads of State.
Armenia was an exception in explicitly identifying political factors as a reason for lack of cooperation with some of its neighbours, though this is likely to be the case in other situations. Bangladesh has 57 transboundary rivers (54 enter from India, and three from Myanmar) but only one transboundary agreement. The agreement, for sharing the water of the Ganges River, has been signed with India. As a result, Bangladesh reports very limited hydro-meteorological data/informa-tion sharing to manage water-related disasters such as flooding, riverbank erosion and drought, and other water manage-ment issues such as irrigation, environmental flow, water allocation, and pollution.
BOX 8
KEY FINDINGS
1. While overall levels of development, wealth, and governance obviously have an influence on levels of IWRM implementation, they are not necessarily the most important factors. This may imply that the level of political engagement and priority given to IWRM implementation is an influencing factor.
2. About 30 countries have high or very high IWRM implementation (scores of 71 to 100), and very high Human Development Index scores. This implies that most countries that reach the highest levels of IWRM implementation have a certain level of development.
3. Geophysical factors such water scarcity, country area, and population size do not appear to be strong influences on IWRM implementation globally, though they may be drivers for some countries.

27 Progress on integrated water resources management 2018
over IWRM. Figure 10 compares countries’ IWRM scores with their HDI scores and shows some interesting results. Countries in the low, medium and high HDI groups exhibit a very similar spread of IWRM implementation (the line of best fit is relatively flat through these HDI groups).21 In the very high HDI group, most countries exhibit a rapid increase in IWRM implementation, though there are exceptions. The figure facilitates the identification of those countries that are likely to have potential to improve (those below the line of best fit), and those countries that are performing above average in their HDI group (those above the line of best fit).
A cluster analysis can identify groups of countries with similar characteristics across a number of parameters.
21 HDI explains about half the variation in IWRM implementation (Pearson’s correlation coefficient 0.56).22 The Fund for Peace (2018). Fragile States Index. http://fundforpeace.org/fsi/. Accessed 26 July 2018.23 While a degree of subjectivity in country reporting is acknowledged, this was addressed through a range of measures (Section 2.2). 24 Six countries did not have HDI values in 2017, so they are not included in this figure (IWRM scores in brackets): Somalia (10), Marshall Islands (33), Democratic Peo-
ple’s Republic of Korea (38), Tuvalu (47), San Marino (66), Monaco (90). Seven countries were not assigned a group in this analysis as they did not have Fragile State Index values (orange markers).
A cluster analysis was used to investigate the relationship between IWRM score, HDI score, and the Fragile States Index.22 This index was chosen as a proxy indicator for e23,24
several factors such as economic, political, and social stability. Four groups of countries emerge, as shown in Figure 10:
1. Group 1, top-left: those with low to high HDI, yet medium-high IWRM implementation. These countries appear to have more advanced IWRM implementation compared to the average for similar levels of development.
2. Group 2, bottom-left: those with low and medium HDI, with low IWRM implementation. These countries are likely to be facing a range of current or
Figure 10 Degree of IWRM implementation by HDI score23, 24
COUN
TRY
IWRM
IMPL
EMEN
TATI
ON
No group assignedGroup 1 Group 2 Group 3 Group 4
Hig
h M
ediu
m-h
igh
Med
ium
-low
Lo
w Ve
ry
low
Ve
ry
high
HDI CATEGORY
Low Medium High Very high
AFG TLS GABLBR SURGUY
SLE BLZHND SLV KNAMKD
CHLSTPGIN GNQ
GTMTTO
PNGGRDIRQ LKA
COM SLB
MMRHTI
TONPER
GMBSRBATG
KAZ
CAF
CODETH
MDA
TCDPRYTGO COG
BDI CIVLBNBTNLSO NPL OMNBHS
CMR
MNERWA NGA GEOMDV ANDDOM
ARM
MDG
PANAGO VNM
BLRFSM ARGSSDVUT
UKRYEMPOLLCA BHR
SDN
DMA
MWI EGYBWA BRBECU
MYSJAM
MNG
ALB CRISYCUZBMRT
KHM ZMB
LBY
IDN
DZAGHA BOL MEXNER
PAK
BGDTZA
COL BRAPHL ISLKEN
SWZMLI
SEN TUN
ITAMOZ LTU
SAUNZL
SVNUGA
IRNNAM
BGRBIHZWE
BFA
BEN
JORNOR
MAR
LVACPV
MUSZAFSVKAZE KOR
TURWSM LIEROU
HUNPRT
CHNFIN
ARE MLT GBRBELRUS CZE
ESTCUBIRL
CHE
AUSKWT
QATESP
GRCISR
DEUSWE
HRV
LUX
CYPAUT
DNK
JPNFRA SGP
0
10
20
30
40
50
60
70
80
90
100
0.3 0.4 0.5 0.6 0.7 0.8 0.9 1
While overall levels of development, wealth, and governance obviously have an influence on levels of IWRM implementation, they are not necessarily the most important factors. However, only countries with “very high” HDI have reported very high IWRM implementation.
* For three-letter codes, see Annex C.

28CHAPTER 3 Status of implementation of integrated water resources management
historic political instability or conflict, and have the highest average Fragile States Index.
3. Group 3, bottom-right: those with high HDI, yet medium-low or low IWRM. There may be other reasons why these countries have not reached a higher level of IWRM implementation, despite theoretically having the capacity and resources to do so.
4. Group 4, top-right: those with very high HDI and high IWRM. These countries appear to have more advanced IWRM than many others with similar HDI.
To investigate if there are other factors that influence the implementation of IWRM, some correlation analyses and cluster analyses were undertaken for a range of parameters. These included factors related to levels of development and governance such as: PPP-adjusted GDP,25 Corruption Perceptions Index,26 Fragile States Index,27 Human Development Index (HDI), the Worldwide Governance Indicators28, and level of water-related Official Development Assistance (ODA); and geophysical parameters such as country area, population size, and water stress.
In general, the governance and development-related parameters resulted in similar groupings of countries, which are broadly comparable with the four groups described above. Countries in the “top right”, with both very high HDI and high IWRM,
25 PPP = Purchasing-Power Parity, GDP = Gross Domestic Product. 26 Transparency International. Corruption Perceptions Index 2017. https://www.transparency.org/news/feature/corruption_perceptions_index_2017. Accessed 26 July
2018.27 The Fund for Peace (2018). Fragile States Index. http://fundforpeace.org/fsi/. Accessed 26 July 2018. 28 Including six indicators: voice and accountability, political stability, regulatory quality, rule of law, control of corruption, government effectiveness. World Bank. World-
wide Governance Indicators project. http://info.worldbank.org/governance/wgi/#home. Accessed 26 July 2018.
appear to be most closely related; namely, they are generally wealthy, and have effective, stable governance, and low perception of corruption. However, countries in other groups appear to be less similar, implying that such parameters are not necessarily a barrier or enabler of IWRM implementation, but perhaps political will may be an important factor.
No strong patterns emerged in relation to the geophysical parameters. There appears to be very little correlation between IWRM implementation and water scarcity, population size, or country area. This implies that these parameters do not strongly influence the degree of IWRM implementation.
Of the countries in the very high HDI group, 87 per cent report at least medium-high IWRM implementation. In the other three HDI groups, less than 25 per cent of countries had reached this level of implementation (Figure 11). Fortunately, the countries with at least medium-high implementation in each HDI group, and region, may provide opportunities for learning for countries in similar situations.
HDI is clearly not the sole factor determining level of progress. Many of the less-developed countries with higher implementation scores have placed strong focus on IWRM in recent years. This suggests that political support for promoting IWRM implementation is also a key factor (Box 9). Further analysis on the factors influencing IWRM implementation is warranted, as it may shed more light on enablers to progress.
1% 17%
24%
30%
24%
2%
36%
54%
52%
51%
11%
19%
22%
18%
20%
23%
13%
4%
49%
4%
15%
0% 20% 40% 60% 80% 100%
World
Low
Medium
High
Very high
HDI GROUP
49
38
43
38
72
AVE. SCORE PERCENTAGE OF COUNTRIES IN EACH IMPLEMENTATION CATEGORY
IWRM Implementation Very low Low Medium-low Medium-high High Very high
Figure 11 IWRM implementation by HDI group
IWRM implementation in countries with low, medium and high HDI levels is similar, with a significant increase in IWRM implementation in the very high HDI group.
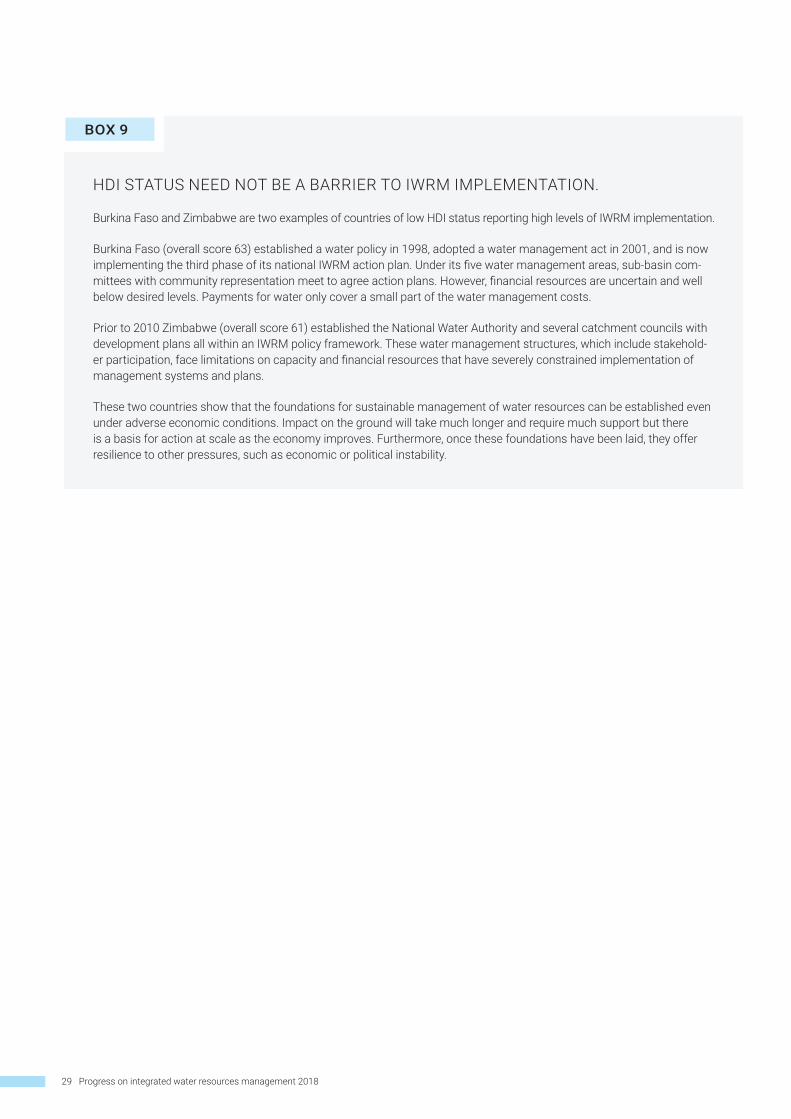
29 Progress on integrated water resources management 2018
HDI STATUS NEED NOT BE A BARRIER TO IWRM IMPLEMENTATION.
Burkina Faso and Zimbabwe are two examples of countries of low HDI status reporting high levels of IWRM implementation.
Burkina Faso (overall score 63) established a water policy in 1998, adopted a water management act in 2001, and is now implementing the third phase of its national IWRM action plan. Under its five water management areas, sub-basin com-mittees with community representation meet to agree action plans. However, financial resources are uncertain and well below desired levels. Payments for water only cover a small part of the water management costs.
Prior to 2010 Zimbabwe (overall score 61) established the National Water Authority and several catchment councils with development plans all within an IWRM policy framework. These water management structures, which include stakehold-er participation, face limitations on capacity and financial resources that have severely constrained implementation of management systems and plans.
These two countries show that the foundations for sustainable management of water resources can be established even under adverse economic conditions. Impact on the ground will take much longer and require much support but there is a basis for action at scale as the economy improves. Furthermore, once these foundations have been laid, they offer resilience to other pressures, such as economic or political instability.
BOX 9
© iS
tock
phot
o

30CHAPTER 4 Elements of integrated water resources management implementation
ELEMENTS OF INTEGRATED WATER RESOURCES
MANAGEMENT IMPLEMENTATION
4
© iS
tock
phot
o

31 Progress on integrated water resources management 2018
Effective implementation of integrated water resources management involves a wide range of elements, from establishing a water quality monitoring system, to engaging with the private sector, to creating laws that address the equitable and sustainable use of water resources. The major elements, relevant to most countries, are captured through the 33 questions in the 6.5.1 questionnaire, arranged into the four main aspects of: enabling environment, institutions, management instruments, and financing (see Section 2.1 and Annex A for more detail). This section first compares the four main aspects of IWRM implementation (Section 4.1), then goes into each aspect in more detail (Sections 4.2 to 4.5). Country examples are provided in boxes throughout.
Note that the order of presentation of enabling environment, institutions, management instruments, and financing does NOT imply an order of priority for implementing integrated water resources management (Box 10).
4.1 COMPARISON OF THE FOUR MAIN DIMENSIONS OF INTEGRATED WATER RESOURCES MANAGEMENT
IMPLEMENTING IWRM IS NOT NECESSARILY A SEQUENTIAL PROCESS.
Countries that give themselves a low score on the enabling environment for IWRM (“have not established or fully implemented a formal IWRM policy, law or plan”) may still report significant levels of implementation in terms of management instruments, institutions or funding (Andorra, Barbados, Costa Rica, Dominica, Iraq, Jamaica, Ghana, Saudi Arabia).
In Andorra, management instruments score in the medium-high range; water quantity and quality balances, surveys of wetlands and riparian vegetation are carried out annually. In Dominica, telemetry assists in water monitoring. Barbados has a long-running system of regular groundwater monitoring for quantity and quality; it applies block water tariffs, and monitors swamps and springs. Though Ghana has no clear-cut water resources law, it has a national IWRM plan and basin water management boards in place. Costa Rica has legal, technical and economic mechanisms to carry out groundwater monitoring, improve water use efficiency, and control water pollution, though national IWRM policies and plans are not yet implemented.
These examples show that water managers are able to maintain and advance good water management practices under existing legal and institutional systems. These experiences demonstrate that it is not necessary to see IWRM as a linear process from laws to institutions to instruments to financing as implied by the structure of the questionnaire.
Adoption of effective water management systems is essential to enable better water allocation, pollution control and/or improved water use efficiency. IWRM principles may influence the objective of these decisions and how they are made, but the management instruments are required regardless of whether IWRM principles are applied.
BOX 10
KEY FINDINGS AND RECOMMENDATIONS
1. Most countries report similar levels of implementation for: policies, laws, and plans; institutions and participation; and management instruments. The global averages of these three dimensions are similar (51-53), though with wide variation between countries.
2. Roughly twice the proportion of countries report very low or low implementation of financing, compared to the other three main dimensions of IWRM (40 per cent compared to 20 per cent). The global average implementation of financing (41) is about 10 points lower than the implementation levels of the other three dimensions. Financing needs to increase for water resources management and monitoring, particularly through improved cost-recovery.

32CHAPTER 4 Elements of integrated water resources management implementation
The global average implementation scores are similar for policies, laws and plans (51), institutions and participation (53), and management instruments (51). Financing lags the other dimensions by about 10 points (41) (Figure 12).
Financing lags the other three main dimensions of IWRM implementation by about 10 points.
However, these are global averages. At the country level, section average scores range from zero to 100, showing the need for each country to carefully assess their own strengths and weaknesses for progressing with IWRM implementation. About one third of all countries are in the medium-low implementation category (average scores of 31-50) for each section (Figure 13). About 20 per cent of countries are in the high or very high implementation categories. Interpretation of the implementation categories depends on the threshold descriptions for each question, as shown in the questionnaire (Annex A-2). Sections 4.2 to 4.5 discuss this issue.
In each of the four main dimensions of IWRM, implementation at the national level is seven to three points above implementation at other levels, including subnational, basin, local, and transboundary (see Figure 14 and Section 3.2 for more information).
1. Policy, Laws, Plans: 51
2. Institutions & Participation: 53
3. Management Instruments: 51
4. Financing: 41
Overall IWRM Score: 49
0 20 40 60 80 100
Figure 12 Global average implementation of the four main dimensions of IWRM, and overall IWRM implementation
For the first three dimensions, about 50 per cent of countries average medium-low or lower levels, and 50 per cent of countries average medium-high levels or above. For financing, 70 per cent of countries average medium-low or lower levels, and 30 per cent average medium-high levels or above.
1%
1%
1%
6%
1%
22%
16%
16%
34%
19%
33%
32%
35%
29%
41%
22%
30%
25%
16%
21%
15%
14%
19%
9%
15%
7%
8%
3%
5%
4%
0% 50% 100%
Policies, laws, plans (I)
Institutions & Participation (II)
Management Instruments (III)
Financing (IV)
Overall IWRM score
Section PERCENTAGE OF COUNTRIES PER CATEGORY
IWRM Implementation Very low Low Medium-low Medium-high High Very high
Figure 13 Percentage of countries in each implementation category, across the four main dimensions of IWRM

33 Progress on integrated water resources management 2018
For the first three dimensions, the countries in the very high HDI group have average scores of just over 70, approximately 30 points above implementation scores of countries in the other
three HDI groups. Average implementation of financing is about 10 points lower in each case (Figure 15).
Global average implementation at the national level is seven to three points higher than implementation at “other” levels.
3942
48
5349
56
47
53
30
40
50
60
4.2Otherlevels
4.1National
levels
3.2Otherlevels
3.1National
level
2.2.Otherlevels
2.1National
level
1.2Otherlevels
1.1National
level
Figure 14 Differences between implementation at the national level and “other levels” for each of the four main dimensions of IWRM
Countries whose HDI levels range from low to high show similar levels of implementation across the four main dimensions of IWRM. Only the very high HDI group has considerably higher implementation.
0
20
40
60
80
100
IWRM overall score
Enablingenvironment
Institutions andparticipation
Managementinstruments
Financing
Low Medium High Very highHDI groups
Figure 15 Global average implementation of the four main dimensions of IWRM, by HDI group

34CHAPTER 4 Elements of integrated water resources management implementation
4.2 LAWS, POLICIES AND PLANS (SURVEY SECTION 1)
Policies, laws and plans provide the enabling environment for implementation of integrated water resources management. This section covers: national policies (q.1.1a), laws (q.1.1b), and IWRM plans (q.1.1c), and subnational policies (q.1.2a), basin and/or aquifer management plans (q.1.2b), arrangements for transboundary water management (q.1.2c), and provincial/state laws in federated countries (q.1.2d). The distribution of country scores is shown in Figure 16.
The global average implementation levels of national water resources policies (55) and laws (56) are very similar. This indicates that, on average, policies and laws are based in IWRM principles, and that a significant proportion of authorities use and apply these measures. The implementation of provincial or state laws in federated countries is slightly higher than the global national average. The average score for implementation of IWRM plans, or similar, is slightly lower (49), indicating that the plans are approved by government, and authorities are starting to implement them (Box 11).
The average score for implementation of subnational policies is 10 points lower than scores at the national level, implying that subnational implementation often follows national implementation (Section 3.2.1). Although the implementation of basin or aquifer management plans appears to be relatively low (42, Q1.2b), this degree of implementation (medium-low) still indicates that plans are approved in the majority of basins and aquifers, and that authorities are starting to use them. In fact, 37 per cent of countries report that basin or aquifer plans based on integrated approaches, approved by authorities, are being implemented in the majority of basins/aquifers (medium-high and above) (Figure 18). However, 47 per cent of countries report that basin/aquifer plans are either being prepared, or that development of plans has not yet started or has been delayed in the majority of basins (Box 12) or aquifers (Box 17, section 4.3). The importance and status of aquifer management is discussed in more detail in Section 4.4.
KEY FINDINGS AND RECOMMENDATIONS
1. In approximately 50 per cent of countries, national policies, laws and plans have reached medium-high implementation, indicating that the majority of relevant authorities are applying these measures. Attention should focus on the other 50 per cent of countries that have not yet reached medium-high implementation to ensure that the enabling environment for IWRM is established.
2. While 37 per cent of countries report that basin or aquifer plans are based on integrated approaches approved by authorities and being implemented in the majority of basins/aquifers (medium-high, high or very high implementation), another 47 per cent report that basin/aquifer plans are either being prepared, or development of plans has not yet started or has been delayed in the majority of basins/aquifers (low or very low implementation). Significant efforts are needed in half of all countries to ensure that basin and aquifer management plans and programmes are completed so that implementation can begin.
Most countries report having policies, plans and laws based on integrated principles in place and approved by relevant authorities at all levels (medium-low implementation and above).
0% 20% 40% 60% 80% 100%
National policy (1.1.a.)
National laws (1.1.b)National IWRM plans (1.1.c)
Basin/aquifer management plans (1.2.b )Transboundary arrangements (1.2.c)
Subnational policies (1.2.a)
Provincial laws in federated countries (1.2.d)Section 1. Policies, laws, plans (average)
Section 1 AVE. SCORE
49
56
51
55
56
42
45
59
PERCENTAGE OF COUNTRIES PER IMPLEMENTATION CATEGORY
IWRM Implementation Very low Low Medium-low Medium-high High Very high
Figure 16 Implementation of policies, laws and plans, based on integrated approaches to water resources management
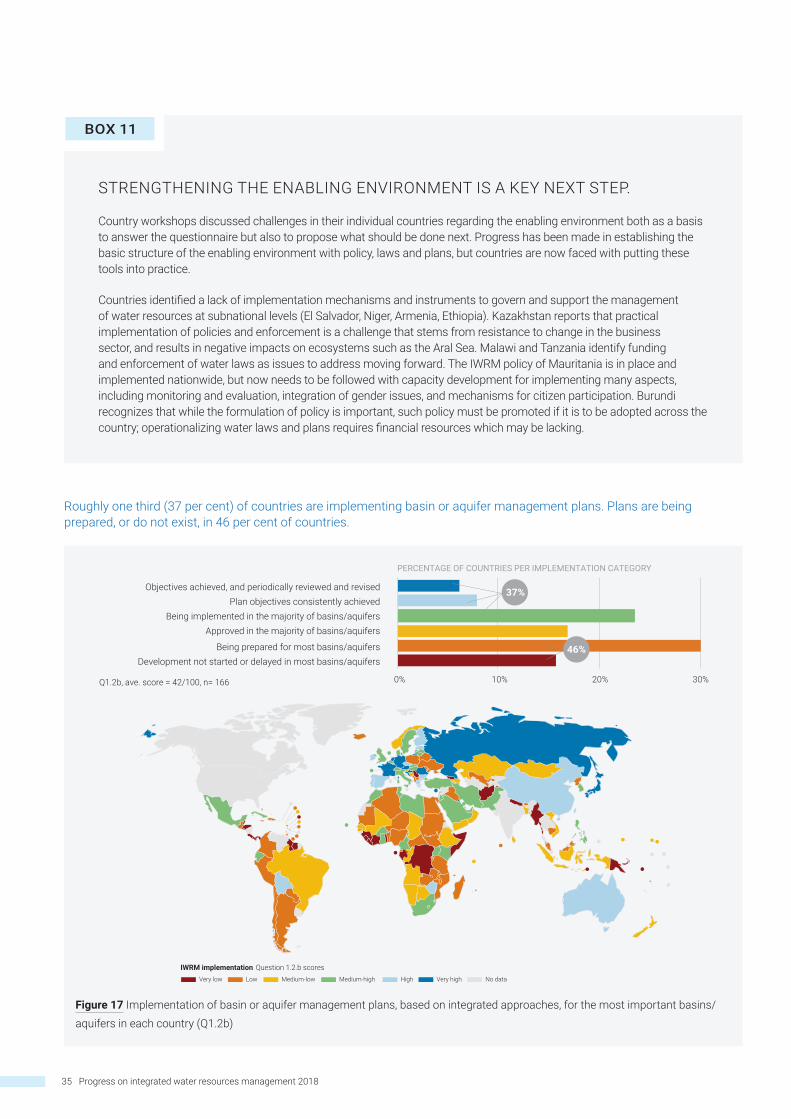
35 Progress on integrated water resources management 2018
Roughly one third (37 per cent) of countries are implementing basin or aquifer management plans. Plans are being prepared, or do not exist, in 46 per cent of countries.
0% 10% 20% 30%
Development not started or delayed in most basins/aquifersBeing prepared for most basins/aquifers
Approved in the majority of basins/aquifersBeing implemented in the majority of basins/aquifers
Plan objectives consistently achievedObjectives achieved, and periodically reviewed and revised 37%
PERCENTAGE OF COUNTRIES PER IMPLEMENTATION CATEGORY
Q1.2b, ave. score = 42/100, n= 166
46%
Figure 17 Implementation of basin or aquifer management plans, based on integrated approaches, for the most important basins/aquifers in each country (Q1.2b)
Very low Low Medium-low Medium-high High Very high No data
IWRM implementation Question 1.2.b scores
STRENGTHENING THE ENABLING ENVIRONMENT IS A KEY NEXT STEP.
Country workshops discussed challenges in their individual countries regarding the enabling environment both as a basis to answer the questionnaire but also to propose what should be done next. Progress has been made in establishing the basic structure of the enabling environment with policy, laws and plans, but countries are now faced with putting these tools into practice.
Countries identified a lack of implementation mechanisms and instruments to govern and support the management of water resources at subnational levels (El Salvador, Niger, Armenia, Ethiopia). Kazakhstan reports that practical implementation of policies and enforcement is a challenge that stems from resistance to change in the business sector, and results in negative impacts on ecosystems such as the Aral Sea. Malawi and Tanzania identify funding and enforcement of water laws as issues to address moving forward. The IWRM policy of Mauritania is in place and implemented nationwide, but now needs to be followed with capacity development for implementing many aspects, including monitoring and evaluation, integration of gender issues, and mechanisms for citizen participation. Burundi recognizes that while the formulation of policy is important, such policy must be promoted if it is to be adopted across the country; operationalizing water laws and plans requires financial resources which may be lacking.
BOX 11
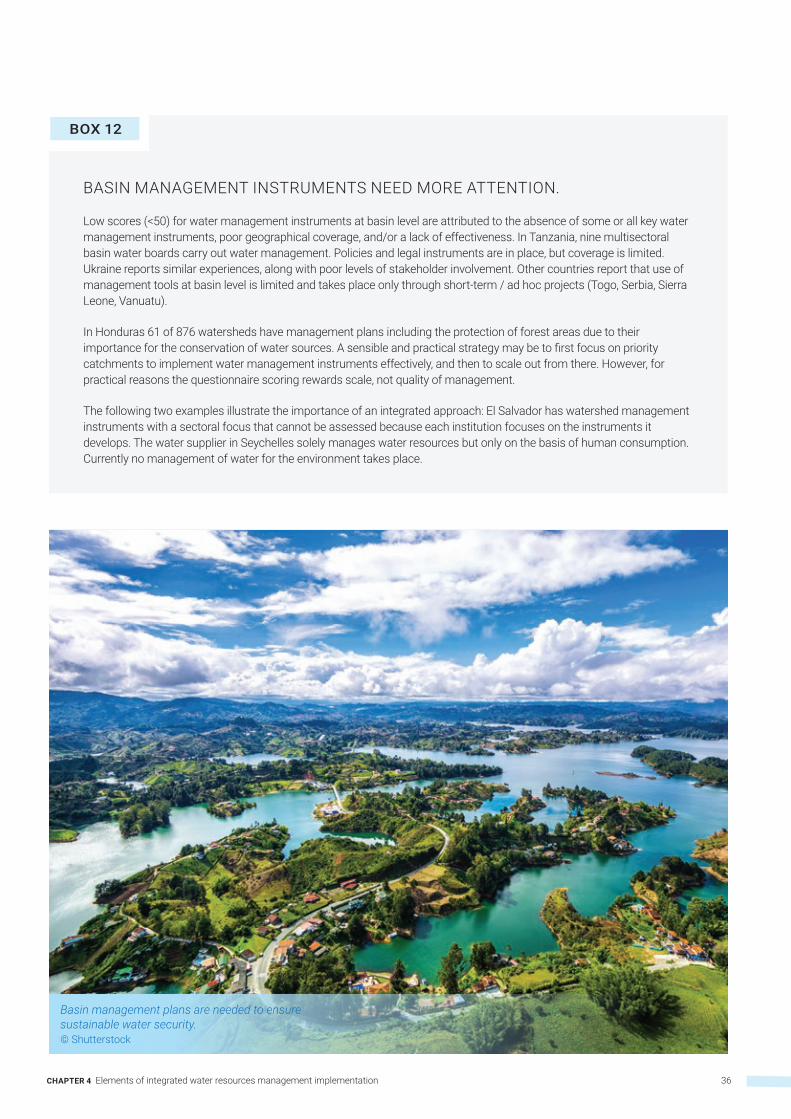
36CHAPTER 4 Elements of integrated water resources management implementation
BASIN MANAGEMENT INSTRUMENTS NEED MORE ATTENTION.
Low scores (<50) for water management instruments at basin level are attributed to the absence of some or all key water management instruments, poor geographical coverage, and/or a lack of effectiveness. In Tanzania, nine multisectoral basin water boards carry out water management. Policies and legal instruments are in place, but coverage is limited. Ukraine reports similar experiences, along with poor levels of stakeholder involvement. Other countries report that use of management tools at basin level is limited and takes place only through short-term / ad hoc projects (Togo, Serbia, Sierra Leone, Vanuatu).
In Honduras 61 of 876 watersheds have management plans including the protection of forest areas due to their importance for the conservation of water sources. A sensible and practical strategy may be to first focus on priority catchments to implement water management instruments effectively, and then to scale out from there. However, for practical reasons the questionnaire scoring rewards scale, not quality of management.
The following two examples illustrate the importance of an integrated approach: El Salvador has watershed management instruments with a sectoral focus that cannot be assessed because each institution focuses on the instruments it develops. The water supplier in Seychelles solely manages water resources but only on the basis of human consumption. Currently no management of water for the environment takes place.
BOX 12
Basin management plans are needed to ensure sustainable water security.© Shutterstock

37 Progress on integrated water resources management 2018
4.3 INSTITUTIONS AND STAKEHOLDERS (SURVEY SECTION 2)
A central element of integrated approaches to water resources management is that water should be managed at a range of levels, from national through to local. Adaptive and effective institutions are typically required at all levels. These institutions need to ensure that planning and decision making involves a participatory approach with the full range of relevant stakeholders.
This section includes: institutions at the national level (Q2.1a), basin/aquifer level (Q2.2a), provincial/state level for federated countries (Q2.2f), and transboundary level (Q2.2e); national-level arrangements for cross-sectoral coordination (Q2.1b) and capacity building (Q2.1f); stakeholder participation at national (Q2.1c) and local levels (Q2.2b); business participation (Q2.2d); and gender considerations at national (Q2.1e), subnational (Q2.2c), and transboundary (Q2.2d) levels.
Globally, average implementation of each of these elements ranges from 63 (both cross-sectoral coordination and national-level public participation) to 33 (gender considerations at the transboundary level. At the country level, scores vary greatly between zero and 100 for most questions, and the distribution of country scores varies between most questions (Figure 18). Most questions are addressed below.
KEY FINDINGS AND RECOMMENDATIONS
1. The vast majority, 83 per cent, of countries report that basin- and aquifer-level organizations exist for their most important basins and aquifers (low implementation and above). However, the capacity of these organizations needs to increase in 43 per cent of countries to ensure they can effectively lead IWRM implementation (low and medium-low); such organizations need to be established in 17 per cent of countries (very low).
2. The degree of implementation of private-sector participation in water resources management is fairly evenly spread between the implementation categories:
y Roughly one third report limited communication between government and business (very low and low implementation).
y One third report regular consultation and some opportunities for involvement (medium-low and medium-high).
y One third report regular opportunities for involvement or established and effective mechanisms for private sector involvement (high and very high).
In two thirds of countries, effective private-sector participation needs to significantly increase to help advance sustainable water resources management.
3. The extent to which gender objectives are developed and addressed at national, subnational and transboundary levels is relatively low (global average scores of 32 to 46). However, differences in interpretation of the questions in the national context led to mixed approaches to scoring. Harmonizing responses to these questions will be a significant area for improvement in subsequent surveys, to ensure reliable data are available to support progress on the gender aspect of the Dublin Principles, as well as SDG 5. Advancing gender objectives in water resources management should be a matter of urgency.
4. More than 50 per cent of countries report that government authorities at least regularly request information, experiences and opinions of stakeholders in water resources planning and management (medium-high implementation and above). Attention should focus on the almost half of all countries in which stakeholder participation in water resources management is rather limited at national and local levels (medium-low and below).

38CHAPTER 4 Elements of integrated water resources management implementation
Public authorities that have the capacity to lead IWRM implementation are a cornerstone of water resources management. Authorities could be a ministry or ministries, or other organizations/institutions/agencies/bodies with a mandate and funding from government. Capacity for implementation in this context means that the responsible authorities should be adapted to the complexity of water challenges to be met, and should have the required knowledge, technical facilities and skills, including planning, rule-making, project management, finance, budgeting, data collection and monitoring, risk management and evaluation. Responsible authorities should also have the ability to manage potential conflicts of interest between different sectors and/or stakeholder groups, particularly at the basin/aquifer level, with established coordination procedures in place.
It is encouraging that these two aspects of IWRM implementation – national institutional capacity and cross-sectoral coordination – received two of the highest average global implementation scores (58 and 63, respectively). These scores imply that institutions have the capacity to lead IWRM implementation, and that there are opportunities for different sectors to take part in policy, planning and management processes. Indeed, 41 per cent of countries report that there is formal consultation between different government sectors with the objective of agreeing on collective decisions on important issues and activities (high and very high implementation) (Figure 29, Chapter 5). On the other hand, capacity
development initiatives are reported as rather less advanced (50), implying that countries, on average, report that some long-term capacity development initiatives are being implemented, but that geographic and stakeholder coverage is limited. With long-term progression and sustainability of water resources management in mind, this offers a clear area for improvement in many countries (Box 26, Chapter 6).
While national institutional capacity is important, a key principle of IWRM is that water resources also need to be managed according to hydrological boundaries, not administrative boundaries. More than three quarters of countries report having basin- or aquifer-level institutions in place, though the capacity of these institutions varies significantly between countries (Figure 19 and Box 13).
In most countries, authorities exist at relevant levels, and there are opportunities for cross-sector participation from governmental, private-sector, and other stakeholders (medium-low implementation and above).
0% 20% 40% 60% 80% 100%
National institutions (2.1.a)
Basin/aquifer institutions (2.2.a )
Provincial institutions in federated countries (2.2.f)
Transboundary institutions (2.2.e)
Cross-sector coordination (2.1.b)
National capacity building (2.1.f)
Public participation - national (2.1.c)
Public participation - local (2.2.b)
Private sector participation (2.1.d)
Gender objectives - national (2.1.e)
Gender objectives - sub-national (2.2.c)
Gender objectives - transboundary (2.2.d)
Section 2. Institutions & stakeholders (average)
Section 2 AVE. SCORE
63
55
50
46
57
62
58
56
55
46
32
41
53
PERCENTAGE OF COUNTRIES PER IMPLEMENTATION CATEGORY
IWRM Implementation Very low Low Medium-low Medium-high High Very high
Figure 18 Implementation of institutional arrangements and stakeholder participation

39 Progress on integrated water resources management 2018
While cross-sectoral coordination in this context addresses government stakeholder participation, effective water resources management requires wider stakeholder participation, including all interested parties who are, or may be, affected by any water resources issue or intervention. Stakeholders include the private sector, organizations, institutions, academia, civil society and individuals. Beyond water resources management, Agenda 2030 stresses the importance of establishing partnerships, which require public participation, and creating synergies with the business sector.
Six questions address stakeholder participation and gender aspects (Figure 18, from “public participation – national” to “gender objectives – transboundary”).
About a third (34 per cent) of countries report that there are established mechanisms for regular private-sector participation in water resources development, management and use (Figure 20 and Box 14). Encouragingly, another 38 per cent of countries report conducting regular consultation or at least having some established mechanisms for private-sector participation.
The vast majority (83 per cent) of countries report that basin- and aquifer-level organizations exist for their most important basins and aquifers (low implementation and above). However, only 40 per cent of countries report that the organizations have the capacity to effectively lead IWRM plan implementation (medium-high and above).
0% 10% 20% 30%
No dedicated basin authorities for WRMAuthorities exist, with mandate to lead WRMAuthorities have capacity to formulate plans
Authorities have capacity to lead implementationAuthorities have capacity to lead evaluation
Authorities have capacity to lead IWRM plan revision
Q2.2a, ave. score = 46/100, n= 161
PERCENTAGE OF COUNTRIES PER IMPLEMENTATION CATEGORY
40%
43%
Figure 19 Existence and capacity of basin- or aquifer-level organizations for leading implementation of IWRM plans or similar (Q2.2a)
BASIN ORGANIZATIONS EXIST BUT OFTEN LACK CAPACITY AND FINANCE TO IMPLEMENT IWRM PLANS.
Many countries have water management structures at the basin or aquifer level. Though established under widely different circumstances, these structures nonetheless confront similar challenges. In Argentina, basin authorities have the capacity to lead IWRM plan formulation, but they do not have full capacity to effectively lead periodic monitoring and evaluation. Similar reports identify a crucial need to enhance the personnel (numbers, qualifications, or pay) (Bulgaria, Hungary, Armenia, Guatemala, Ethiopia) to be able to plan and implement IWRM, to carry out basic water management functions, or to be able to extend across the full geographic area.
Honduras sums up the problems of many countries that are trying to implement basin management of water resources: “Even though the establishment of Basin Organizations is considered at legislation level (basin councils, sub-basin and micro-basins), the existing organizations require strengthening and lack financial support. There are management plans at basin level, but these are mostly not implemented, the plans are realized mainly under the guidance of cooperation projects and others, but once they have been implemented, the sustainability of the Basin Organizations is hindered due to difficulties in their financial and technical sustainability.”
Nevertheless, countries scoring over 80 can be found in all regions (Kenya, Burkina Faso, Lesotho, Brazil, Lebanon, Libya, Italy, Latvia, China, Morocco, Netherlands, Tuvalu, Russia, Australia), and can provide a learning experience for others. In Burkina Faso, each water management area has its own water agency, which develops an annual action programme for implementing IWRM actions. Burundi, Ethiopia and Cambodia are implementing in pilot areas or selected basins. This piloting approach is one strategy that countries struggling with capacity constraints could adopt.
BOX 13
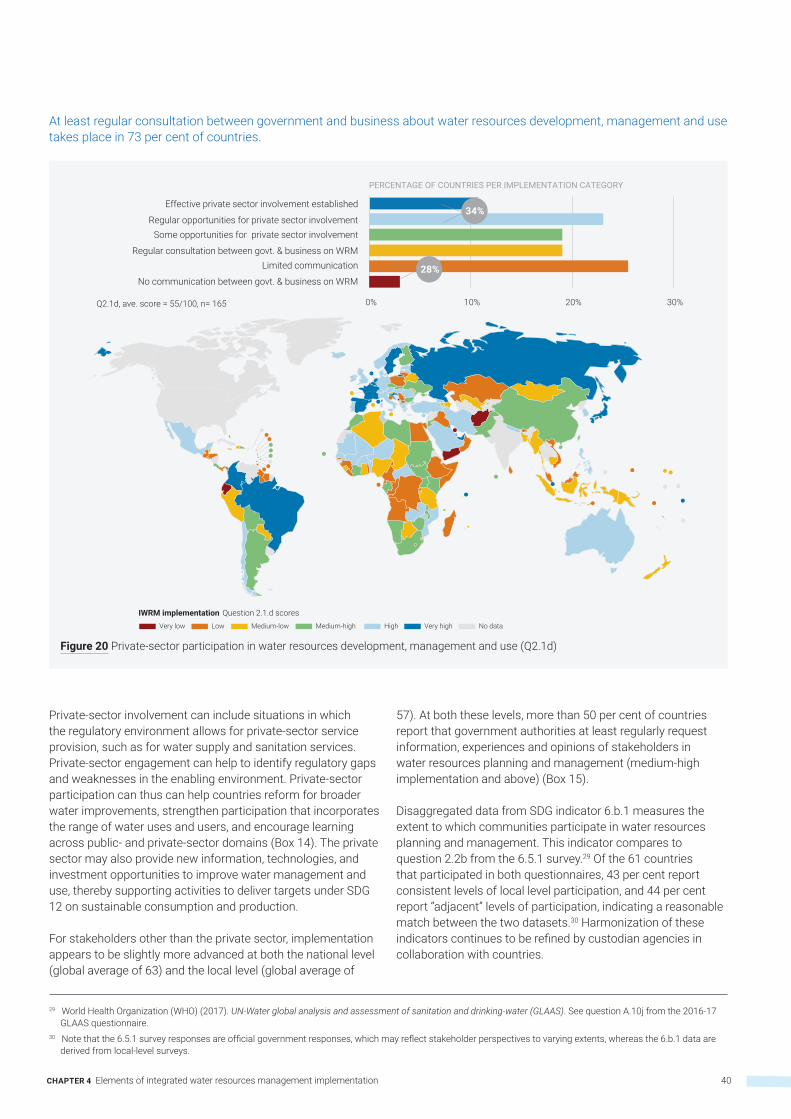
40CHAPTER 4 Elements of integrated water resources management implementation
Private-sector involvement can include situations in which the regulatory environment allows for private-sector service provision, such as for water supply and sanitation services. Private-sector engagement can help to identify regulatory gaps and weaknesses in the enabling environment. Private-sector participation can thus can help countries reform for broader water improvements, strengthen participation that incorporates the range of water uses and users, and encourage learning across public- and private-sector domains (Box 14). The private sector may also provide new information, technologies, and investment opportunities to improve water management and use, thereby supporting activities to deliver targets under SDG 12 on sustainable consumption and production.
For stakeholders other than the private sector, implementation appears to be slightly more advanced at both the national level (global average of 63) and the local level (global average of
29 World Health Organization (WHO) (2017). UN-Water global analysis and assessment of sanitation and drinking-water (GLAAS). See question A.10j from the 2016-17 GLAAS questionnaire.
30 Note that the 6.5.1 survey responses are official government responses, which may reflect stakeholder perspectives to varying extents, whereas the 6.b.1 data are derived from local-level surveys.
57). At both these levels, more than 50 per cent of countries report that government authorities at least regularly request information, experiences and opinions of stakeholders in water resources planning and management (medium-high implementation and above) (Box 15).
Disaggregated data from SDG indicator 6.b.1 measures the extent to which communities participate in water resources planning and management. This indicator compares to question 2.2b from the 6.5.1 survey.29 Of the 61 countries that participated in both questionnaires, 43 per cent report consistent levels of local level participation, and 44 per cent report “adjacent” levels of participation, indicating a reasonable match between the two datasets.30 Harmonization of these indicators continues to be refined by custodian agencies in collaboration with countries.
At least regular consultation between government and business about water resources development, management and use takes place in 73 per cent of countries.
0% 10% 20% 30%
No communication between govt. & business on WRM
Limited communicationRegular consultation between govt. & business on WRM
Some opportunities for private sector involvementRegular opportunities for private sector involvement
Effective private sector involvement established
PERCENTAGE OF COUNTRIES PER IMPLEMENTATION CATEGORY
Q2.1d, ave. score = 55/100, n= 165
28%
34%
Figure 20 Private-sector participation in water resources development, management and use (Q2.1d)
Very low Low Medium-low Medium-high High Very high No data
IWRM implementation Question 2.1.d scores

41 Progress on integrated water resources management 2018
Developing and implementing gender objectives in water resources management as called for in the Dublin Principles31 not only enhances gender equality and empowerment, but can also support effectiveness and efficiency in projects, environmental sustainability, and more accurate analyses of water use.32 Establishing and implementing gender objectives also support SDG 5 on gender equality. National
31 International Conference on Water and the Environment (1992). The Dublin statement on water and sustainable development. Dublin, Ireland.32 UNDP (2006). Resource guide: mainstreaming gender in water management. http://www.undp.org/content/undp/en/home/librarypage/environment-energy/wa-
ter_governance/resource-guide-mainstreaming-gender-in-water-management.html. Accessed 26 July 2018.
and subnational implementation of gender objectives for water resources management have global averages of 46 and 41, respectively, equivalent to medium-low implementation (Figure 21, Box 16). Gender objectives at the transboundary level received the lowest average of all questions (32).
The level of confidence in these results is relatively low.
PRIVATE-SECTOR ENGAGEMENT TYPICALLY ADVANCES IWRM IMPLEMENTATION.
Countries with higher levels of water resources management are more likely to have strong engagement with the private sector (Kuwait, UK, United Arab Emirates, Saudi Arabia, Sweden, Singapore). Across the European Union, the private sector has become closely involved in supporting countries in the implementation of the Water Framework Directive. In only one case is private-sector engagement in the water sector identified as forbidden by law (Uzbekistan).
At the basic level, governments consult the private sector as a stakeholder/consumer in the water management decision structures at national and regional/basin levels, and as a contractor for construction projects (Trinidad and Tobago, Uganda, Turkey). In more advanced stages the private sector engages as partners in implementation, or they contribute financial support to water management. Zambia reports private-sector activities regarding catchment protection, private irrigation dams, and mining and water quality. In Nepal and Tanzania, the private sector engages in hydropower development and service delivery. The private sector runs water supply and sanitation services in many countries (Malaysia, Malawi, Lebanon).
Only a few countries identify specific financing measures with engagement of the private sector. The Dominican Republic has enabled the implementation of pilot initiatives on Payment for Environmental Services (PES), which support the establishment of a national system of compensation and payment for environmental services. This system is intended to contribute to the conservation of natural resources and to the reduction of poverty levels of rural communities.
BOX 14
PUBLIC PARTICIPATION LEADS TO MORE SUSTAINABLE AND EFFECTIVE OUTCOMES.
Formal, ongoing mechanisms are in place for stakeholder engagement in countries such as Burkina Faso, Botswana, Guyana, Lebanon, Maldives, Singapore, Uganda, Trinidad and Tobago, and Uzbekistan. In Uzbekistan, law stipulates that public authorities “may consider” proposals from the Association of Water Users, other NGOs, and citizens. This wording provides an incentive for NGOs to clearly define problems and suggested solutions so that their proposals will be considered and adopted by public authorities. The Maldives formulated a national strategy and five-year (2017-2021) campaign to promote awareness about and increase public participation in water and sewerage issues. The key objective of the campaign is to enable the public to become more knowledgeable about, responsible for, and involved in water resources, water supply and sewerage systems management.
BOX 15

42CHAPTER 4 Elements of integrated water resources management implementation
Many countries report in different ways on these questions: responses could have been zero, 100, or “not applicable” if countries consider gender objectives to be addressed by national constitutional arrangements rather than by provisions at the level of the water resources sector, or if national arrangements also apply at subnational levels. Furthermore, a significant proportion of countries respond “not applicable” (n/a) to the gender questions at national (13 per cent), subnational (27 per cent) and transboundary (44 per cent) levels, respectively. At the national level, the main reasons given by countries for responding “n/a” are that gender
equity is addressed through other national laws and policies, which therefore include the water sector. The increase in “n/a” responses at the subnational level is mainly explained by the fact that national laws or policies apply at all levels, and by the tendency of very small countries to respond “n/a” to many subnational questions. Harmonizing the way countries understand and respond to these questions will be a major area for improvement in subsequent surveys. Countries need to ensure that water resources management and programmes incorporate their gender objectives.
COUNTRIES PROVIDE EXAMPLES OF IMPROVEMENTS TAKING PLACE IN GENDER PARITY IN POSITIONS OF AUTHORITY AT DIFFERENT LEVELS.
The proportion of women in decision-making roles is increasing. In Algeria, the number of female staff in the provincial water resources directorates grew from 26 per cent in 2009 to 37 per cent in 2016. In Australia, the proportion of women on Queensland government boards grew from 31 per cent to 39 percent over a two-year period. Management structures take gender into account in many countries (Burkina Faso, Azerbaijan, Zambia). Tanzania requires that at least one third of the representatives serving on its basin water boards are female. Jamaica reports that its water board has a female-to-male ratio of 5 to 4. Niger has a law, rigorously enforced, prescribing the gender quota in elective bodies and at administrative levels.
Many countries, including Armenia and Uzbekistan, state that while policy prohibits gender discrimination, the share of women in decision-making roles of management bodies nonetheless remains very small. They suggest that steps should be taken to enhance the role of women and to improve working conditions in the water sector. Even where gender strategies are in place some countries identify limited progress (El Salvador, Ghana, Guatemala) due to limited budget and implementation.
Social norms hinder policy reform in some countries, such as Egypt, where women often have less access to and fewer rights over natural resources because of customs, traditional roles, and land-titling and inheritance laws and practices that favour men.
BOX 16
Subnational laws, policies or plans in 44 per cent of countries include gender objectives, but with limited or no funding or implementation. Gender objectives are not explicitly addressed in 23 per cent of countries.
0% 10% 20% 30%
Gender not explicitly addressedIn laws, policies or plans
In plans, limited budget & implementationPartially funded, objectives partly achieved
Adequately funded, objectives mostly achievedObjectives fully achieved, address issues
Q2.2c, ave. score = 41/100, n= 124
PERCENTAGE OF COUNTRIES PER IMPLEMENTATION CATEGORY
34%
44%
Figure 21 Gender-specific objectives in laws, policies or plans at subnational levels (Q2.2c)

43 Progress on integrated water resources management 2018
4.4 MANAGEMENT INSTRUMENTS (SURVEY SECTION 3)
33 Data not shown. 34 Smith, M., Cross, K., Paden, M. and Laban, P. ( 2016). Spring: managing groundwater sustainably. Gland, Switzerland: International Union for Conservation of Nature.
Management instruments refer to the tools and activities that provide information that enable stakeholders to make rational and informed choices for water management, and that provide the framework to implement management activities.
This section includes (question numbers in brackets): national water availability monitoring (3.1a), management programmes and tools for sustainable and efficient water-use management (3.1b), pollution control (3.1c), water-related ecosystems (3.1d), and reduction of the impact of water-related disasters (3.1e), basin management instruments (3.2a), aquifer management instruments (3.2b), data and information sharing within countries (3.2c), and transboundary data and information sharing between countries (3.2d).
The global average and distribution of results in this section are relatively similar for each question, with averages ranging from 58 (national water-availability monitoring) down to 42 (implementation of aquifer management instruments) (Figure 22). For most questions, a significant proportion of countries (20-30 per cent) report very low or low implementation. In these countries, either the respective management instruments are not being implemented, or they rely on ad hoc, short-term, or project-based measures, rather than long-term initiatives.
As is the case in other sections, the pattern for each Human Development Index (HDI) group is similar for each question, with the very high HDI countries reporting significantly higher
degrees of implementation (generally 30-40 points higher for each question) compared to the countries in the other three HDI groups (generally 30-40 points higher for each question).33
Aquifers are increasingly recognized as critically important for sustainable development, often with implications for the poor. At the same time, they are too often poorly understood and used unsustainably.34 Only eight countries report aquifer management instruments as “not applicable” (Q3.2b). Of the remaining 162 countries, 45 per cent report either having no aquifer management instruments in place, or relying on short-term or ad hoc projects (Figure 23). Another 19 per cent of countries report effective or highly effective outcomes from their aquifer management programmes, with very good or excellent geographic and stakeholder coverage (Box 17). Most countries in Latin America report limited use of aquifer management instruments, and generally only through short-term, ad hoc projects (low implementation). The status in Africa and other regions is more mixed. There is an urgent need to ensure that surface water and groundwater are managed in an integrated manner.
The implementation of management instruments for river or lake basins is somewhat more advanced, with only 26 per cent of countries reporting either that basin instruments don’t exist, or instruments are limited to short-term projects. Still, as per aquifer management, only 20 per cent of countries reported effective or highly effective outcomes from basin management
KEY FINDINGS AND RECOMMENDATIONS
1. For most questions, a significant proportion of countries (20-30 per cent) report very low or low implementation. In these countries, the respective management instruments are either not being implemented, or they are ad hoc, short-term, or project-based, rather than long-term initiatives. In these cases, management instruments need to either be established, or transformed from short-term projects to long-term programmes. These actions will require innovative and sustainable financing.
2. In all, 73 countries (45 per cent) report that they have no aquifer management instruments, or that they rely on limited, short-term projects. Sustainable aquifer management programmes need to be established and financed as a matter of priority, particularly in countries with significant groundwater use.
3. Management instruments for sustainable water use, pollution control, ecosystem management, and disaster risk reduction are not being sufficiently implemented to support other SDG targets. In these areas, more than half (50-60 per cent) of countries report that they have no instruments in place (very low), or that they are limited to short-term projects (low), or that stakeholder or geographic coverage is limited (medium-low). Long-term programmes need to be established and expanded to support countries to achieve targets on water efficiency and sustainable withdrawals (target 6.4), good ambient water quality (target 6.3), freshwater ecosystem management (target 6.6), and water-related disasters (target 11.5).

44CHAPTER 4 Elements of integrated water resources management implementation
For most management instruments, 20-30 per cent of countries report either that none exist, or that management instruments occur in short-term projects rather than via ongoing initiatives (very low or low implementation).
0% 20% 40% 60% 80% 100%
Aquifer management instruments (3.2.b)Basin management instruments (3.2.a)
Ecosystem management (3.1d)Disaster risk reduction (3.1.d)
Pollution control (3.1.c)
Sustainable and efficient use management (3.1.b) National availability monitoring (3.1.a)
Data sharing (in country) (3.2.c)Transboundary data sharing (3.2.d)
Section 3. Management instruments (average)
Section 3 AVE. SCORE PERCENTAGE OF COUNTRIES PER IMPLEMENTATION CATEGORY
IWRM Implementation Very low Low Medium-low Medium-high High Very high
53
49
52
42
46
52
58
52
48
51
Figure 22 Implementation of management instruments
Almost half of reporting countries (73 countries) either have no aquifer management instruments, or are limited to short-term projects.
0% 10% 20% 30%
No aquifer management instrumentsLimited use, short-term/ad-hoc projects only
Some long-term progs., limited geog/stakeh'r coverageLong-term programmes, adequate coverage
Effective outcomes, very good coverageHighly effective outcomes, excellent coverage 19%
PERCENTAGE OF COUNTRIES PER IMPLEMENTATION CATEGORY
Q3.2b, ave. score = 42/100, n= 162
45%
Figure 23 Implementation of aquifer management instruments (Q3.2b)
Very low Low Medium-low Medium-high High Very high No data
IWRM implementation Question 3.2.b scores

45 Progress on integrated water resources management 2018
programmes with very good or excellent coverage (Box 12, Section 4.2).
Sustainable and efficient water use and monitoring of water availability is critical to achieving Goal 6, as expressed through Target 6.4: “By 2030, substantially increase water-use efficiency across all sectors and ensure sustainable withdrawals and supply of freshwater to address water scarcity and substantially reduce the number of people suffering from water scarcity.”
35 See indicator reports for SDGs 6.4.1 and 6.4.2: The Food and Agriculture Organization of the United Nations (FAO) and UN-Water (2018). Progress on water use efficiency. Global baseline for SDG6 Indicator 6.4.1: Change in water use efficiency over time. FAO and UN-Water (2018). Progress on level of water stress. Global baseline for SDG 6 Indicator 6.4.2: Level of water stress: freshwater withdrawal as a proportion of available freshwater resources.
Future reporting would benefit from coordinating reporting and analysis of SDG indicators 6.4.1(efficiency) and 6.4.2 (water stress)35 with related questions in the 6.5.1 survey, particularly 3.1a (monitoring) and 3.1b (sustainable and efficient water-use management instruments).
Pollution-control programmes include regulations, water quality guidelines, economic tools (e.g. taxes and fees), water-quality trading programmes, water-quality monitoring, education, consideration of point and non-point (e.g. agricultural) pollution
Half (50 per cent) of countries report implementing some management instruments for sustainable and efficient water use either through short-term projects or through more long-term programmes that have limited coverage across water users and the country (medium-low and low). Efforts need to focus on converting projects into more long-term initiatives, and prioritizing uptake across users and areas of countries.
0% 10% 20% 30% 40%
No management instruments being implementedLimited, through short-term / ad-hoc projects or similar
Some instruments on long-term basis, but limited coverageLong-term, adequate coverage across users & country
Long-term basis, effective, very good coverageLong-term basis, highly effective, excellent coverage
Q3.1b, ave. score = 52/100, n= 171
PERCENTAGE OF COUNTRIES PER IMPLEMENTATION CATEGORY
50%
46%
MANAGEMENT INSTRUMENTS
Figure 24 Implementation of management instruments for sustainable and efficient water use from the national level (includes surface and/or groundwater, as relevant to the country) (Q3.1b)
Very low Low Medium-low Medium-high High Very high No data
IWRM implementation Question 3.1.b scores

46CHAPTER 4 Elements of integrated water resources management implementation
EFFECTIVE AQUIFER MANAGEMENT IS ESSENTIAL FOR SUSTAINABLE DEVELOPMENT IN MANY REGIONS.
Groundwater is an important source of drinking and irrigation water, especially for small islands and countries with low, or very seasonal, rainfall. Aquifers at risk of over-exploitation or pollution, and those shared between two or more countries attract the highest management attention. For example, Mexico has defined 653 aquifers that serve as the primary source of water for its rural population, for irrigation of approximately 2 million hectares of agricultural land, and for cities with a combined population of roughly 60 million. Though 80 per cent of these aquifers have good quality water, 40 aquifers are degraded due to human activities or natural causes. Kuwait, Libya, the United Arab Emirates, and Saudi Arabia are implementing aquifer management plans and monitoring programs in most aquifers. Australia has commenced development of a new Great Artesian Basin Strategic Management Plan within which state and territory governments coordinate the management of basin resources.
At the transboundary level, Algeria and Tunisia positively describe the cooperation on the management of the North Sahara Aquifer system that has been operational since 2008. The consultation mechanism contributed to the improvement of knowledge and technical collaboration, the emergence of shared basin awareness, and the transition to political cooperation between the three countries that share the aquifer (Tunisia-Libya-Algeria). Since the 1990s, Argentina, Brazil, Paraguay and Uruguay have engaged in many cooperative initiatives under the Agreement on the Guarani Aquifer.
In some cases, basin management plans encompass aquifer management (Slovakia, Turkey, Trinidad and Tobago). Other countries identify a lack of any aquifer management plans (Malaysia, Guatemala). Belize notes the lack of any scientific data from which to develop management plans for aquifers.
BOX 17
MANY PROVEN WATER-USE EFFICIENCY MECHANISMS ARE IN PLACE AROUND THE WORLD.
Water allocation permits, tariff systems for water supply and sanitation, and education programmes are the most commonly reported tools for promoting water use efficiency (Kenya, Namibia, Hungary, Greece, Lesotho, Ghana, Jamaica, Marshall Islands). However, some countries report challenges with these same tools. Lesotho reports difficulties with monitoring adherence to permits. Kenya reports low levels of public awareness about efficient water use, though permit systems are in place.
Uganda reports that effective and efficient water-use management in the form of water permits for surface and groundwater use has been ongoing since 1999, with very good coverage across the country and among different water users. Botswana is starting a national water accounting exercise to assess the efficiency of water use by different sectors of economy. Malaysia, with low tariffs, low awareness levels and low irrigation efficiency, is focusing action in key river basins. New Zealand is aiming to adjust the national policy framework to address over-allocation, and to provide a more efficient water allocation framework.
Australia reports large investments aimed at increasing water-use efficiency in the Murray-Darling Basin. Over 2,000 projects help farmers improve their on-farm water-use efficiency, and large-scale improvements benefit more than 10,000 individual irrigators. For households, legislation requires showers, taps, toilets, urinals, clothes washing machines, dishwashers and flow controllers sold in Australia to carry a water efficiency rating and consumption details so purchasers can make informed decisions. Estimates suggest that these measures have reduced total household water consumption by 8 per cent.
However, many countries report that they have no programmes to promote efficient water use (Guatemala, Liberia, Nepal, Suriname, Myanmar). Iceland, with abundant supplies of fresh water, may question whether the benefits of achieving more efficient use is worth the cost. Latvia, while noting that it has no real need to restrict water demand, uses pricing of water services to restrict use.
Countries in all regions report effective systems in place to improve water use efficiency. Their experiences present opportunities to share benefits and strategies to boost action in nearby countries.
BOX 18

47 Progress on integrated water resources management 2018
sources, construction and operation of wastewater treatment plants, and watershed management. Encouragingly, 36 per cent of countries report that some pollution-management instruments are being implemented on a more long-term basis, even if these programmes or instruments still need to be rolled out to include more sectors and a greater proportion of the country (medium-low) (data shown in Annex B, Q3.1c) (Box 19). Roughly a quarter (24 per cent) of countries report that pollution-management instruments are effective, and are implemented on a long-term basis, with very good coverage across sectors and the country.
Many pollution-management instruments are likely to overlap with ecosystem-management instruments, which can include tools such as management plans, the assessment of Environmental Water Requirements (EWR), and protection of areas and species. Monitoring includes measuring the extent and quality of the ecosystems over time. Ecosystem-management instruments lag pollution-control instruments (global average score of 45 compared to 51). Still, 41 per cent of countries report that some ecosystem-management instruments are being implemented on a more long-term basis, though with limited coverage across different ecosystem types and the country (data shown in Annex B, Q3.1d) (Box 20).
36 See indicator reports for SDG 6.3.2 and 6.6.1: UN Environment (2018). Progress on monitoring ambient water quality: piloting the monitoring methodology and initial findings for SDG 6 Indicator 6.3.2. UN Environment (2018). Progress on monitoring water-related ecosystems: piloting the monitoring methodology and initial findings for SDG 6 Indicator 6.6.1.
For both pollution control and ecosystem management, more than 70 per cent of countries are implementing at least some instruments on a more long-term basis (medium-low and above). This means that there is some capacity to implement these instruments. The challenge lies in scaling up implementation to achieve better coverage across the country.
Both of pollution control and ecosystem management support targets 6.3 (improve water quality by reducing pollution) and 6.6 (protect and restore water-related ecosystems). In future reporting, it would be helpful to coordinate reporting and analysis of SDG indicators 6.3.2 (ambient water quality) 6.6.1 (ecosystem extent)36 with related questions in the 6.5.1 survey, particularly on pollution control (3.1d) and ecosystem management (3.1e).
For a discussion on Disaster Risk Reduction, see Chapter 5.
POLLUTION MANAGEMENT INSTRUMENTS NEED TO BE MORE EFFECTIVE.
One of the more challenging aspects of water resources management is pollution management, which usually involves licensing, monitoring and legal enforcement based upon laboratory testing able to withstand legal scrutiny. Most European countries report scores of 80 or higher, but low scores are the norm in other regions. In African countries, pollution systems remain in a developmental stage. Exceptions are: Botswana and Uganda (both at 80), Mali and Tunisia (at 70), and Madagascar (60). Laws and standards may be in place but with limited geographical application and effectiveness. Latin America and the Caribbean report more pollution control systems in place and some high- performing countries (Jamaica and Cuba (at 80), Ecuador (70) and Mexico (60)), but some large countries in the region have low scores (Argentina (30), Brazil (40)). A similar situation exists in Asia.
As mentioned by Costa Rica (30) the presence of many legal, technical and economic instruments with adequate coverage does not assure successful pollution control. Pollution management usually lies within the mandate of the environment agency, but coordination is a challenge. In Argentina, pollution control lies with the provinces, and, thus, providing a national scenario is difficult.
In Botswana (80) the Ministry of Environment, Natural Resources Conservation and Tourism is mandated to prevent environmental pollution through the Waste Management Act. However, the Department of Water Affairs also monitors pollution to protect the water resources through the Water Act, and the Ministry of Health and Wellness also monitors pollution through the Public Health Act to prevent water-borne diseases.
In summary, much more work remains to be done to translate the presence of pollution- management instruments into effective tools for the sustainable management of water resources.
BOX 19

48CHAPTER 4 Elements of integrated water resources management implementation
SOME ECOSYSTEM MANAGEMENT TAKES PLACE, BUT NATIONAL REGULATIONS ARE OFTEN NOT UP TO THE TASK.
Few countries refer to environmental management laws, and many refer only to wetlands or water- quality monitoring in assigning their scores. In Argentina and Malaysia, the use of water ecosystems- management instruments at the provincial level is limited to short-term or special projects.
However, laws and regulations are in place in some countries. In Bhutan, forest and nature conservation rules require maintaining a minimum of 60 per cent forest coverage, and prohibit the destruction of wetlands. Costa Rica protects wild areas related to water. China allocates water for environmental use. The EU Water Framework Directive provides a legal framework to protect and improve the status of water-related ecosystems, and has been incorporated into national legislation in many countries (Cyprus, Norway, Slovakia). Dominica has environmental health and land use policies and legislation, and has designated national parks, forest reserves and protected forests.
Biodiversity protection has expanded and intensified in the Philippines, one of the world’s 17 megadiverse countries, containing 70 percent of the world’s plants and animal species. In Uganda, some ecosystem management takes place through catchment-management plans on a short-term basis, but coverage is limited across different ecosystem types and areas in the country.
The Sustainable Development Strategy of Latvia has a defined priority of long-term action for “management of natural capital”. This approach provides for sustainable management of natural resources, the development of ecosystems services, and the reduction of pollution and waste flows. The focus of the 2018 World Water Development Report on nature-based solutions suggests that the link between water resources management and ecosystems deserves more attention.
BOX 20
Pollution management instruments need to be more effective.© iStockphoto

49 Progress on integrated water resources management 2018
Data availability and sharing across relevant stakeholders are a prerequisite to sustainable and equitable water resources management.
THE NEED FOR DATA SHARING IS WIDELY ACCEPTED, BUT MANY BARRIERS IMPEDE OPEN AND EFFECTIVE ACCESS.
The large majority of respondents confirmed that they collect data on water, and that they share at least some data with other national agencies and the public. However, the nature of the data (e.g. whether it addresses quantity, quality, allocation, compliance, and/or groundwater/ surface water) is not identified in the survey. Moreover, coverage, quality and formats vary widely. About 20 per cent of countries add some caveat to their response on data sharing.
Zimbabwe reports that accessing data can entail complex and expensive procedures. The Philippines provides data only upon request. Panama provides data only to state institutions. Uzbekistan and Malaysia report that they may require payment for provision of data. Solomon Islands and Serbia do not regulate data and information sharing. Many countries determine data access on an ad hoc basis (Sierra Leone, St Kitts and Nevis, Guinea, Guatemala, Ethiopia).
Confidence in the quality of data is essential for good water management (e.g. for investment decisions, allocation or prosecution of polluters). The integrated approach may also suffer if stakeholders mistrust the data provided (Armenia). A lack of information to accurately assess progress hampered the completion of the questionnaire (Ukraine).
In addition, progress is needed in countries that report suboptimal data-management systems (Togo, Tonga, Kazakhstan), incompatible formats (Malaysia), or a lack of up-to-date information (Tanzania).
BOX 21
Nearly half (49 per cent) of countries report short-term or limited coverage of data and information sharing across users and parts of the country (low and medium-low). Focus should be given to making more long-term arrangements, and to increasing coverage.
0% 10% 20% 30%
No data and information sharingLimited data and information sharing on an ad-hoc basis
Arrangements exist between major data providers / usersLong-term, adequate coverage across sectors & country
Arrangements implemented long-term, very good coverageRelevant data & info online, accessible to all
Q3.2c, ave. score = 52/100, n= 168
PERCENTAGE OF COUNTRIES PER IMPLEMENTATION CATEGORYIN-COUNTRY DATA AND INFORMATION SHARING
48%
49%
Figure 25 Implementation of data and information sharing within countries at all levels (Q3.2c)

50CHAPTER 4 Elements of integrated water resources management implementation
4.5 FINANCING (SURVEY SECTION 4)
Effective water resources management requires financing for both initial investments and ongoing costs. Investments for water resources development and management. These include both more traditional “hard/grey” projects such as infrastructure for water supply (e.g. dams, pipes and pumps), and flood management (levees and dykes) infrastructure; and “soft/green” projects such as restored or constructed wetlands for water supply, water treatment, and flood management; investments in land-management practices for water resources; and nature-based solutions, among them, the reconnecting of rivers with their floodplains. Financing is also required for investments, and ongoing costs, in institutions and people to raise capacity across the board.
These aspects are captured through questions in this section on: national and subnational budgets for investments in water resources management, including infrastructure (Q.4.1a and 4.2a); national budgets for the recurring costs of IWRM (Q4.1b) and subnational- or basin-level revenue raising for IWRM elements (Q.4.2b); and financing for transboundary cooperation (Q.4.2c) (Figure 26).37
37 Note that reporting on Indicator 6.5.1 includes investments covering all aspects of water resources development and management, but excludes any related to drinking water supply and sanitation services, which are reported under indicators 6.1.1 and 6.2.1. Further harmonization and cross analyses are recommended in future reporting.
KEY FINDINGS AND RECOMMENDATIONS
1. A staggering three quarters of countries report insufficient funds reaching the planned investments for water resources management at national and subnational levels (72 and 79 per cent of countries, respectively). Financing must significantly increase in these countries. Otherwise Target 6.5 and most of the targets under Goal 6 are not likely to be met.
2. Two thirds (66 per cent) of countries report either that revenue is not raised at basin, aquifer or subnational levels, or that limited revenue is raised but not spent on IWRM activities. Revenue raising for water resources management warrants urgent attention.
3. Investments must be secured, allocated and mobilized so that institutions, the enabling environment and management instruments can deliver sustainable, efficient, and equitable water management.
Approximately 70 per cent of countries report medium-low implementation or below across different aspects of financing.
0% 20% 40% 60% 80% 100%
National budget for investment (4.1.a)
Sub-national budget for investment (4.2.a)
Budget for recurrent costs (4.1.b)
Revenues raised from users (4.2.b)
Transboundary financing (4.2.c)
Section 4. Financing (average)
Section 4
43
40
42
AVE. SCORE
35
40
41
PERCENTAGE OF COUNTRIES PER IMPLEMENTATION CATEGORY
IWRM Implementation Very low Low Medium-low Medium-high High Very high
Figure 26 Implementation of financing for water resources management

51 Progress on integrated water resources management 2018
As discussed in Section 4.1, financing for water resources management on average lags the other three main aspects of IWRM by about 10 points.
The lowest-scoring question in the questionnaire concerns the status of subnational or basin budgets for investment in water resources management, including water resources infrastructure (Q.4.2a), with an average implementation of 35 out of 100.38 More than half (57 per cent) of countries report either not allocating any budget at the subnational level, or that the budget allocated only partly covered planned investments (very low and low). A further 22 per cent of countries report that, even when budget is allocated, insufficient funds are
38 The average global average implementation level for gender objectives at the transboundary level is 32; however, that question has some methodological challenges, as discussed in Section 4.3.
39 World Health Organization (WHO) (2017). Financing universal water, sanitation and hygiene under the Sustainable Development Goals. UN-Water Global Analysis and Assessment of Sanitation and Drinking-Water (GLAAS) 2017 report. Geneva.
disbursed for the planned investments (medium-low). In total, then, a staggering 79 per cent of countries report insufficient funds reaching the planned investments for water resources management at subnational levels (Figure 27).
The lack of funding for water resources management compares to the situation for water supply, sanitation and hygiene (WASH), for which over 80 per cent of countries report insufficient financing to meet national targets.39
National-level budgets for investment in water resources management fare slightly better, with an average score of 40. Nevertheless, roughly half (51 per cent) of countries report
The vast majority (79 per cent) of countries have insufficient budget (allocated or disbursed) at subnational or basin levels to cover planned investment in water resources management. This will significantly hinder the achievement of Goal 6 and its targets, as well as other targets across the SDGs.
0% 10% 20% 30% 40%
No budget allocatedBudget only partly covers investments
Insufficient funds disbursedSufficient funds disbursed for all work
Funding available, all projects under implementationBudget used, programmes completed & reviewed
Q4.2a, ave. score = 35/100, n= 151
PERCENTAGE OF COUNTRIES PER IMPLEMENTATION CATEGORY
79%
Figure 27 Subnational or basin budgets for investment, including water resources infrastructure (Q4.2a)
Very low Low Medium-low Medium-high High Very high No data
IWRM implementation Question 4.2.a scores

52CHAPTER 4 Elements of integrated water resources management implementation
either that no budget is allocated, or that the budget only partly covers planned investments (Annex B, Q.4.1a). A similar picture emerges for national budgets for recurring costs of IWRM activities, with 48 per cent of countries reporting that budget allocations are made for only a few of the elements, and that implementation is at an early stage (Annex B, Q4.1b).
The responses clearly demonstrate that major tools to achieve target 6.5 are financial; accessing financial resources, allocating sufficient budget, and ensuring that all funds are disbursed would be major enablers to progress:
1. Public funding will always be limited in both scale and allocation to simultaneously invest across the full range of the SDGs. Revenue generation and allocation are therefore priorities for sustainable development more broadly, and interventions that can impact across the SDG’s should be prioritized.
2. Though funds may flow from national levels, important actions to tackle water management problems take place at basin and local scales. Thus, the situation requires a clear national commitment to address water management challenges, so that institutions and agencies at basin and municipal levels have the mandate to coordinate management and planning activities across other sectors.
3. Diversifying funding streams, including through the private sector, will be critical for sustaining and advancing integrated water resources management (see Section 6.2).
Roughly a third (36 per cent) of countries report that revenue sources do not include dedicated levies on water users at basin, aquifer or subnational levels (Figure 28). A further 30 per cent report that these sources do provide limited revenues, but these are not spent on water resources management activities.
Nearly all countries (90 per cent) report insufficient revenue raising to cover most IWRM activities. Roughly one third (36 per cent) of countries report that no revenue is raised for such activities at basin, aquifer or subnational levels.
0% 10% 20% 30%
No revenues raisedProcesses in place to raise revenue but not implementedLimited revenues raised from charges, not used for IWRM
Some revenues raised from charges cover some activitiesRevenues raised from charges cover most IWRM activities
Funds raised fully cover costs of IWRM activities
Q4.2b, ave. score = 40/100, n= 154
PERCENTAGE OF COUNTRIES PER IMPLEMENTATION CATEGORY
10%
66%
Figure 28 Revenues raised from users at basin, aquifer or subnational levels (Q4.2b)
Very low Low Medium-low Medium-high High Very high No data
IWRM implementation Question 4.2.b scores

53 Progress on integrated water resources management 2018
Means of raising revenue include charges for water abstraction and bulk water, and environmental fees such as pollution charges, Payment for Ecosystem Services (PES) plans, and the sale of secondary products and services. Only 10 per cent of countries report that local authorities raise funds from multiple sources, and that the funds mostly or fully cover the costs of IWRM activities (high and very high) (Figure 28
40 Covering the majority of operating and maintenance costs for water, sanitation and hygiene (WASH) was defined as recovering more than 80 percent of such costs. See Figure 26 in: World Health Organization (WHO) (2017). Financing universal water, sanitation and hygiene under the Sustainable Development Goals. UN-Water Global Analysis and Assessment of Sanitation and Drinking-Water (GLAAS) 2017 report. Geneva.
and Box 22). The vast majority (90 per cent of countries) report insufficient revenue raising to cover most IWRM activities. By contrast, 55 per cent to 76 percent of countries indicate that revenues from tariffs cover the majority of operations and basic maintenance costs for WASH services (as measured by responses concerning drinking water and sanitation for rural and urban areas).40
FEW COUNTRIES PROVIDE EXAMPLES OF EFFECTIVE REVENUE RAISING.
Most countries have legal provision for applying charges for at least some of: water use, water abstraction, water pollution permits or offences, or wastewater management. Nevertheless, some countries still lack provision for raising revenue from water (Togo, Tuvalu, Swaziland, South Sudan, Serbia, Lesotho, Guatemala, Uzbekistan).
In most cases, revenue is collected for or by the national structures (Barbados, Croatia, Mauritius, Malawi, Mexico, Slovenia). The national treasury, rather than the water agency may receive and disperse such revenues (Uganda, St Kitts and Nevis). Most countries state that revenues are very small and seldom used for IWRM. In Sudan, the bulk of revenues are allocated for operations and maintenance. In Nepal, the revenues provide less than 5 per cent of the costs of supplying irrigation water. In Mali, the collection of subnational water-related fees and charges is low. Meanwhile, 30-40 per cent failure rates of water-related public works there reveal the lack of sorely needed maintenance. In Mongolia, though revenues from water users at the basin level increase every year, financing and investment for water do not.
On the positive side, the Republic of Korea and Algeria both state that at least some revenues generated support a specific fund for IWRM. The Dominican Republic has a new law promoting pilot initiatives on Payment for Environmental Services (PES). This aims to be a national system of compensation and payment that contributes to natural resources conservation, and to poverty reduction in rural communities. The European Water Framework Directive established the principle of cost recovery of water services, and European Union member countries provide the lone examples in which costs of IWRM are reported to be fully covered by revenues (Denmark, France, Monaco, Sweden).
BOX 22
© iS
tock
phot
o

54CHAPTER 5 The importance of implementing IWRM across sectors for Agenda 2030
THE IMPORTANCE OF IMPLEMENTING IWRM ACROSS
SECTORS FOR AGENDA 2030
5
© iS
tock
phot
o

55 Progress on integrated water resources management 2018
5.1 IMPLEMENTING IWRM ACROSS SECTORS
41 UN-Water (2016). Water and sanitation interlinkages across the 2030 agenda for sustainable development. Geneva.42 UN-Water (2016). Water and sanitation interlinkages across the 2030 agenda for sustainable development. Geneva.43 United Nations (2018). Sustainable Development Goal 6 Synthesis Report 2018 on water and sanitation. New York.
Direct and indirect interdependencies link Goal 6 targets and every other Sustainable Development Goal.41 As the demand for water brings together different sectors. So, each sector has an interest in its sustainable management and supply. The very essence of integrated approaches to water resources management is making sure that different sectors speak to each other, and seeing that they coordinate key plans and actions.
The implementation of integrated approaches to water resources management (Target 6.5) supports the achievement of the other targets in Goal 6 in an equitable and sustainable manner. Such integration helps to balance the demands on water resources from various sectors, to increase the visibility of potential impacts of different targets on each other, and to form a coordinated planning and management framework. Only by treating each target in an integrated fashion can Goal 6 be achieved. For example, increased access to sanitation must be matched by increased wastewater treatment to sustain good ambient water quality and healthy water-related ecosystems. Good ambient water quality greatly facilitates the provision of safe drinking water, which, in turn. must be provided sustainably, without negative consequences for water-related ecosystems. Increasing recycling and safe reuse and water-use efficiency under the right governance structures makes more water available for drinking and other uses, and can reduce impacts on water-related ecosystems.42
An assessment the interdependence between the Goal 6 targets, through a cross analysis of the indicators, would
help to understand the impacts, benefits, and challenges of working towards the targets in an integrated fashion. However, within the timeframe of this reporting cycle, this has not been possible, partly due to simultaneous data collection and reporting periods across indicators, and partly due to the relatively low data coverage for some indicators at the time of writing. While the 2018 SDG 6 indicator reports and synthesis report were developed somewhat in parallel, more data should become available as the monitoring efforts across the indicators gather momentum, and as more robust national and global datasets are developed.43 Nonetheless, many countries may already have the information and incentive to explore interlinkages and impacts as part of their planning and management processes at national, subnational, and even transboundary levels.
Similarly, a data-based assessment of interlinkages between SDG 6.5.1 and the other goals beyond Goal 6 has not been possible for this report. However, this type of analysis is recommended, and will be considered in future reporting.
Thus, this section draws on data from 6.5.1 that reflects on cross-sectoral coordination, as well as some more conceptual ways in which IWRM may be implemented across sectors. This can be explored in more detail in future reporting as more data from other SDG indicators become available.
KEY RECOMMENDATIONS FOR IMPLEMENTATION ACROSS SECTORS
1. Various projects and programmes of different sectors implement water resources management; thus, critically, these sectors need to adopt integrated approaches to water resources management. Water resources authorities should facilitate coordination – and foster dialogue and understanding – within and among sectors where possible.
2. Accelerating water resources management implementation will require increased attention and funding in most cases. There are innovative opportunities for joint financing of projects and programmes across sectors to achieve multiple objectives and to maximize positive impacts.
3. Efforts should be made towards shared decision-making power and responsibility between sectors on joint policy, planning and management activities.
4. Implementing programmes for water supply, wastewater treatment, water-use efficiency, and ecosystem protection, as addressed through each of the Goal 6 targets, all provide opportunities for implementing elements of integrated water resources management. These should all go ahead as fast as possible to reach Goal 6, with actions coordinated to ensure equity and sustainability.

56CHAPTER 5 The importance of implementing IWRM across sectors for Agenda 2030
Cross-sectoral coordination
In 69 per cent of countries there are currently opportunities for different sectors to actively participate in policy, planning and management processes related to water resources management (medium-high and above, Figure 29). This indicates that the foundations for cross-sectoral coordination are already in place in most countries (Box 23). Efforts should be made towards shared power and responsibility between sectors on policy, planning and management activities.
A further 30 per cent of countries report that there is at least some communication or consultation between government authorities (medium-low and low implementation). Only 1 per cent of countries reported no communication between government sectors.
CROSS-SECTORAL COORDINATION MECHANISMS ARE COMMON, BUT MANY COUNTRIES STILL REPORT WEAK COORDINATION IN PRACTICE.
Most countries report the existence of coordination structures at the national level. These take various forms, such as inter-ministerial committees (Uganda, Turkey, Norway, France), constituted councils (Afghanistan) that may include stakeholders beyond government agencies (Belize, Benin), and other formal and informal inter-ministerial and public consultations and exchanges (Australia, the United Kingdom). The water authority itself may include a mix of inter-sectoral, inter-ministerial, regional, and stakeholder representation (Zimbabwe, Peru, Niger). The recognition of water as a complex resource with competing and sometimes conflicting uses and benefits appears to have been well understood at a policy level.
In practice a good number of countries report relatively weak coordination (Armenia, Ethiopia, Guatemala, Lebanon). Even when IWRM is well established, conflicting interests surface (Netherlands). This is to be expected, and it underscores the rationale that an integrated approach to water management needs to be a continuous process that takes place beyond planning stages. As shown from the workshops (Box 4, Section 2.3) integration works well at the consultation stage. Coordination of implementation becomes more problematic due to mistrust (Armenia), the absence of formal mechanisms (Ethiopia), a lack of information exchange (Serbia, Seychelles), or a lack of power sharing (Zimbabwe).
BOX 23
Roughly two thirds (69 per cent) of countries have at least opportunities for different sectors to actively participate in policy, planning and management related to water resources management.
0% 10% 20% 30% 40%
No communication between government sectorsCommunication: info. on water resources is accessible
Consultation: information, opinions are sharedParticipation: opportunities for sectors to take part
Representation: formal consultation for collective decisionsCo-decisions & co- production: shared power in mangt
Q2.1b, ave. score = 63/100, n= 172
PERCENTAGE OF COUNTRIES PER IMPLEMENTATION CATEGORY
69%
31%
Figure 29 Coordination between national government authorities representing different sectors on water resources, policy, planning and management (Q2.1b)

57 Progress on integrated water resources management 2018
All sectors implement water resources management
Working towards the common goals of Agenda 2030 provides further impetus and a framework for integrating across sectors. It is generally accepted that working towards the SDGs in an integrated fashion offers the best chance to achieve them.44
Integrated water resources management provides a framework to ensure that the key elements of sustainable water management are considered in a holistic fashion. But the implementation of these elements is likely to require operating mechanisms that provide platforms to bring stakeholders together to collaborate, negotiate and innovate.45 Some of these operating mechanisms may be familiar to the water “sector”, while others will be more familiar to other water-dependent sectors such as agriculture, manufacturing and power generation. In these sectors, water will seldom be placed at the centre, but rather will be seen as one factor out of many to consider in balancing the three dimensions of sustainable development.
There are numerous areas of sustainable development, as highlighted through the SDGs, that can provide opportunities
44 International Council for Science and the International Social Science Council (2015). Review of targets for the Sustainable Development Goals: the science perspec-tive. Paris.
45 Smith, M. and Clausen, T.J. (2018). Revitalising IWRM for the 2030 Agenda: World Water Council Challenge Paper for the High-Level Panel on IWRM at the Eighth World Water Forum. Brasilia.
for implementing IWRM. While it is beyond the scope of this report to discuss them all, some key areas include:
y Sustainable agriculture and food security (SDG 2) y Sustainable cities and communities (SDG 11) y Disaster risk reduction and resilience (SDG 11)
Examples of ways to support these areas:
y National or subnational programmes and planning processes related to the above areas
y Water-food-energy-ecosystems nexus activities y Appropriate and sustainable corporate water stewardship
approaches y The ecosystem approach / nature-based solutions
activities y Implementation of water supply, sanitation, wastewater
treatment and reuse services y Source-to-sea and ridge-to-reef activities y Integrated flood and/or drought-management projects
Many of the above will be important for countries working towards target 6.5, as discussed in Chapter 6.
© U
N P
hoto
/ M
artin
e Pe
rret
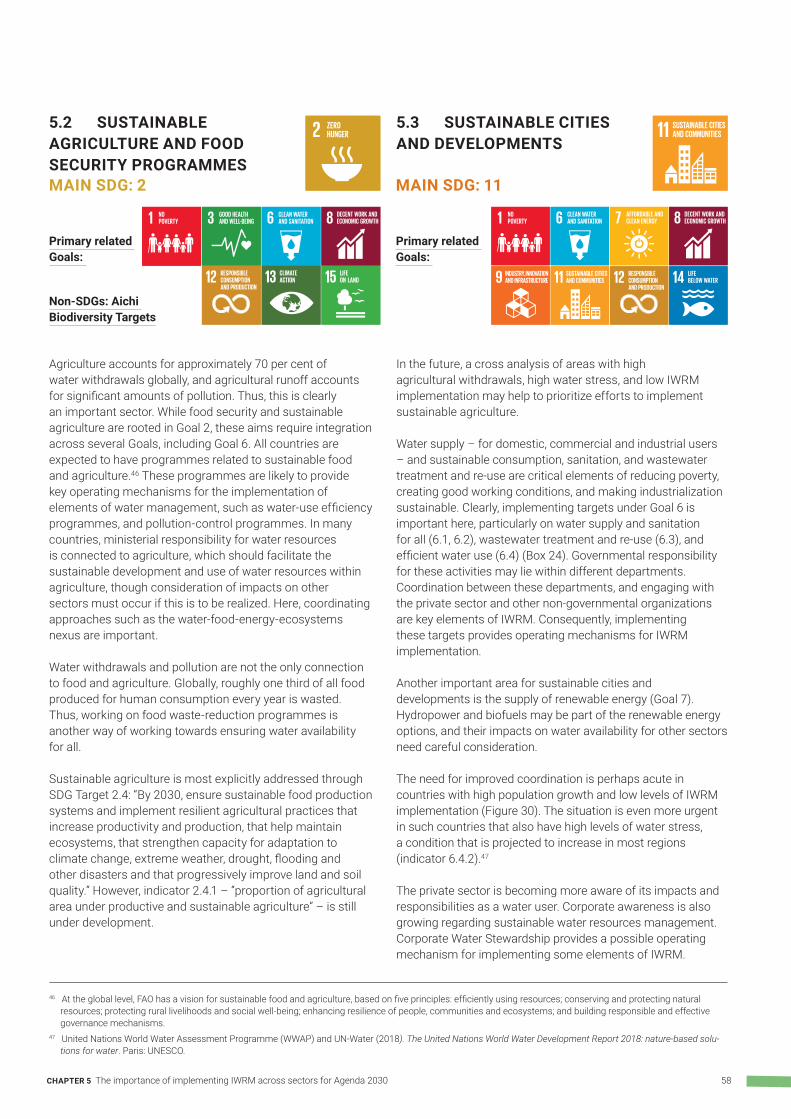
58CHAPTER 5 The importance of implementing IWRM across sectors for Agenda 2030
Agriculture accounts for approximately 70 per cent of water withdrawals globally, and agricultural runoff accounts for significant amounts of pollution. Thus, this is clearly an important sector. While food security and sustainable agriculture are rooted in Goal 2, these aims require integration across several Goals, including Goal 6. All countries are expected to have programmes related to sustainable food and agriculture.46 These programmes are likely to provide key operating mechanisms for the implementation of elements of water management, such as water-use efficiency programmes, and pollution-control programmes. In many countries, ministerial responsibility for water resources is connected to agriculture, which should facilitate the sustainable development and use of water resources within agriculture, though consideration of impacts on other sectors must occur if this is to be realized. Here, coordinating approaches such as the water-food-energy-ecosystems nexus are important.
Water withdrawals and pollution are not the only connection to food and agriculture. Globally, roughly one third of all food produced for human consumption every year is wasted. Thus, working on food waste-reduction programmes is another way of working towards ensuring water availability for all.
Sustainable agriculture is most explicitly addressed through SDG Target 2.4: “By 2030, ensure sustainable food production systems and implement resilient agricultural practices that increase productivity and production, that help maintain ecosystems, that strengthen capacity for adaptation to climate change, extreme weather, drought, flooding and other disasters and that progressively improve land and soil quality.” However, indicator 2.4.1 – “proportion of agricultural area under productive and sustainable agriculture” – is still under development.
46 At the global level, FAO has a vision for sustainable food and agriculture, based on five principles: efficiently using resources; conserving and protecting natural resources; protecting rural livelihoods and social well-being; enhancing resilience of people, communities and ecosystems; and building responsible and effective governance mechanisms.
47 United Nations World Water Assessment Programme (WWAP) and UN-Water (2018). The United Nations World Water Development Report 2018: nature-based solu-tions for water. Paris: UNESCO.
In the future, a cross analysis of areas with high agricultural withdrawals, high water stress, and low IWRM implementation may help to prioritize efforts to implement sustainable agriculture.
Water supply – for domestic, commercial and industrial users – and sustainable consumption, sanitation, and wastewater treatment and re-use are critical elements of reducing poverty, creating good working conditions, and making industrialization sustainable. Clearly, implementing targets under Goal 6 is important here, particularly on water supply and sanitation for all (6.1, 6.2), wastewater treatment and re-use (6.3), and efficient water use (6.4) (Box 24). Governmental responsibility for these activities may lie within different departments. Coordination between these departments, and engaging with the private sector and other non-governmental organizations are key elements of IWRM. Consequently, implementing these targets provides operating mechanisms for IWRM implementation.
Another important area for sustainable cities and developments is the supply of renewable energy (Goal 7). Hydropower and biofuels may be part of the renewable energy options, and their impacts on water availability for other sectors need careful consideration.
The need for improved coordination is perhaps acute in countries with high population growth and low levels of IWRM implementation (Figure 30). The situation is even more urgent in such countries that also have high levels of water stress, a condition that is projected to increase in most regions (indicator 6.4.2).47
The private sector is becoming more aware of its impacts and responsibilities as a water user. Corporate awareness is also growing regarding sustainable water resources management. Corporate Water Stewardship provides a possible operating mechanism for implementing some elements of IWRM.
5.2 SUSTAINABLE AGRICULTURE AND FOOD SECURITY PROGRAMMESMAIN SDG: 2
Primary related Goals:
Non-SDGs: Aichi Biodiversity Targets
Primary related Goals:
5.3 SUSTAINABLE CITIES AND DEVELOPMENTS
MAIN SDG: 11

59 Progress on integrated water resources management 2018
INTEGRATED APPROACHES FOR RESILIENT AND SUSTAINABLE CITIES.
Few references to urban areas emerged from the questionnaires. The Dominican Republic describes the Santo Domingo Water Fund created to guarantee investment resources aimed at the restoration and conservation of ecosystems in the watersheds that supply water to the city of Santo Domingo. The objective of the fund is to guarantee water availability in sufficient quantity and quality to meet the needs of users of the city. The fund operates through capital contributions made voluntarily by large water users, as well as with donations from companies and individuals. Such water funds are being established in other countries to raise revenue to address local water management issues, both urban and rural. They provide one mechanism to address some of the funding challenges in IWRM implementation (Section 4.5).
BOX 24
The need for improvements in coordination between governmental and non-governmental organizations is most acute in countries with high population growth and low IWRM implementation (bottom-right quadrant).
Afghanistan
Andorra Angola
Australia
Austria
Bahrain
Belize
Benin
Brazil
BurundiChad
China
Croatia
DRC
Equatorial Guinea
France
Gabon
Gambia
Germany
Guatemala
Guinea
Guyana
HondurasIraq
IrelandIsrael
Italy
Japan
JordanLatvia
Lithuania
Luxembourg
Malawi
Malta
Mauritania
Morocco
Niger
Oman
Qatar
Serbia
Sierra Leone
Singapore
Somalia
Sudan
Suriname
Turkey
Uganda
Zambia
0
10
20
30
40
50
60
70
80
90
100
-2 -1 0 1 2 3 4 5 6
COUN
TRY
IWRM
IMPL
EMEN
TATI
ON
POPULATION GROWTH RATES % ANNUALLY
0-1% growth 1-2% growth <0% (decrease) >3% growth2-3% growth
Hig
h M
ediu
m-h
igh
Med
ium
-low
Lo
w Ve
ry
low
Ve
ry
high
Figure 30 Population growth and IWRM implementation by country

60CHAPTER 5 The importance of implementing IWRM across sectors for Agenda 2030
Countries may have different capacities, perspectives, and mechanisms to mobilize stewardship programmes at the basin or national levels. At the global level the CEO Water Mandate provides a framework for private-sector participation in water resources management and use.48
Many SDG targets mention resilience, which is generally characterized as related to either physical (climatic/geophysical) or societal/political stresses. Between 1980 and 2016, 90 per cent of disaster events were weather related, and 80 per cent of economic losses stemmed from floods, droughts and storms.49 Collaboration over water resources, both within countries and across borders, can be an important element in conflict management in many regions, particularly in times of weather-related crisis.50
Therefore, disaster risk programmes, and increased resilience across various sectors at different levels provide operating mechanisms for implementing elements of IWRM. Globally, the implementation of management instruments to reduce the impacts of water-related disasters is relatively evenly distributed between the implementation categories (Figure 31).
48 https://ceowatermandate.org 49 Global Water Partnership (2018). Climate insurance and water-related disaster risk management – unlikely partners in promoting development? 50 World Bank, United Nations Department of Economic and Social Affairs (2018). Making every drop count: an agenda for water action. New York: High Level Panel on
Water.51 World Bank, United Nations Department of Economic and Social Affairs (2018). Making every drop count: an agenda for water action. New York: High Level Panel on
Water.52 United Nations (2015). The Sendai framework for disaster risk reduction 2015-2030. Sendai, Japan.
It has been suggested that financing for water-related disaster risk reduction should double globally in the next five years.51
Water-related disasters are most explicitly addressed in the SDGs through Target 11.5: “By 2030, significantly reduce the number of deaths and the number of people affected and substantially decrease the direct economic losses relative to global gross domestic product caused by disasters, including water-related disasters, with a focus on protecting the poor and people in vulnerable situations.” Indicators 11.5.1 and 11.5.2 deal with the human and economic impacts of disasters, respectively. While the overall indicators include all disasters, it should be possible to disaggregate by types of disasters, including water-related disasters. It is recommended that UN Environment works with the custodian agencies of indicators 11.5.1 and 11.5.2 to obtain this information in the future. These indicators are also monitored under the Sendai Framework for Disaster Risk Reduction.52
5.5 NATIONAL CONTEXTS ARE CRITICAL FOR CROSS-SECTORAL COORDINATION
Ultimately, countries understand the main challenges they face in terms of cross-sectoral coordination to balance needs and impacts across sectors. Thus, while global analyses are useful for broad-scale overviews and prioritization, national and subnational activities are imperative to identify needs for coordination, identify mechanisms and financing for IWRM implementation, and implement plans across sectors.
While 27 per cent of countries report implementing effective management instruments, another 25 per cent either have no instruments, or have only short-term, ad hoc projects for disaster risk reduction. Significant effort and financing are required to increase resilience to water-related disasters in these countries.
0% 10% 20% 30%
No management instruments being implementedShort-term / ad-hoc projects
Some instruments long-term, limited coverageLong-term, adequate coverage of at-risk areas
Long-term, very good coverage, effectiveLong-term, excellent coverage, highly effective
Q3.1e, ave. score = 53/100, n= 171
PERCENTAGE OF COUNTRIES PER IMPLEMENTATION CATEGORY
25%
27%
Figure 31 Implementation of management instruments to reduce impacts of water-related disasters from the national level
5.4 DISASTER RISK REDUCTION AND RESILIENCE PROGRAMMESMAIN SDG: 11
Primary related Goals:
Non-SDGs: Sendai Framework and Paris Accord.

61 Progress on integrated water resources management 2018
TOWARDS FULL IMPLEMENTATION OF INTEGRATED WATER RESOURCES MANAGEMENT
6
© U
N P
hoto
/ Ky
Chu
ng

62CHAPTER 6 Towards full implementation of integrated water resources management
6.1 PROGRESS ON IMPLEMENTATION OF INTEGRATED WATER RESOURCES MANAGEMENT53
53 Sources: United Nations (1977). Report of the United Nations Water Conference. Mar del Plata, Argentina United Nations (1992). The Rio Declaration on Environment and Development, Rio de Janeiro; United Nations (2002). Plan of implementation of the World Summit on Sustainable Development. Johannesburg; United Nations (2012). The future we want: outcome document of the United Nations Conference on Sustainable Development; United Nations (2015). Transforming our world: the 2030 agenda for sustainable development.
54 See, for example, the Global Water Partnership’s Water Governance Results Map. https://www.gwp.org/en/interactivemap/. Accessed 26 July 2018.55 UN-Water (2008). Status Report on Integrated Water Resource Management and Water Efficiency Plans.56 United Nations Environment Programme (UNEP) (2012). The UN-Water Status Report on the Application of Integrated Approaches to Water Resources Management.
Encouraged by the above agreements, all countries have been implementing elements of integrated water resources management over the years.54 Global status reporting in 200855 and 201256 showed that the 2005 target for completion of national IWRM plans had been only partly met. Nonetheless, the 2012 status report concluded that 80 per cent of the 134 countries included in the survey had embarked on reforms to policies and laws based on IWRM.
IWRM implementation was included as a separate target under SDG 6 because countries found that this process-oriented target was crucial for the achievement of the desired impacts captured under the other SDG 6 targets (see Box 2, section 1), and because countries acknowledged the continued challenges in implementing IWRM on the ground. The IWRM implementation status reported by countries during this baseline survey must be interpreted in the light of an aspirational target and a long-term process.
The global average (from the 172 reporting countries) of the overall IWRM implementation score is 49 on a scale from zero to 100. As described in Chapters 3 and 4, this global average value masks a very wide range of scores among countries – from 10 to 100 – and considerable variation between sub-scores within countries.
A direct comparison between the current global baseline survey reported here and previous global IWRM status surveys is not straightforward. Survey instruments include slightly different questions, and the response options are not the same. One way to assess progress is to compare the similar questions on development and implementation of IWRM plans posed in the 2007, 2011 and 2017/18 surveys for a set of 57 countries that participated in all three surveys (Figure 33).
It is not possible, based on the available survey data, to conclude whether the progress towards IWRM implementation has slowed, maintained a steady pace, or accelerated – or whether countries are on track to achieve SDG target 6.5 by 2030. Such an analysis will have to await the results of subsequent reporting of SDG indicator 6.5.1, using a methodology that is directly comparable to the one used in this baseline.
What we can conclude based on country reporting is that, given the long-term and, thus, slow progress experienced over the past decades, and given the wide spread of baseline scores, a business-as-usual approach will likely result in only a minority of countries achieving SDG Target 6.5 by 2030. Countries likely to achieve the global SDG 6.5 target are predominantly high and very high Human Development Index (HDI) countries.
Countries have long recognized the benefits of implementing integrated approaches to water resources management, which has resulted in several global agreements.
Figure 32 Key global agreements on implementing integrated approaches to water resources management53
1977 Mar del PlataUN Water Conference
1992Rio Earth summitAgenda 21, Ch.18
2002Johannesburg Plan of Implementation
2012Rio +20The Future We Want
2015The 2030 Agenda
Foundations laid for the principles of IWRM.
Call for integrated water resources development and management formalized.
Call to develop national IWRM and water efficiency plans by 2005.
Reaffirmed commitments to develop integrated water resources management.
Target 6.5 to implement IWRM by 2030.

63 Progress on integrated water resources management 2018
Barriers need to be removed or reduced to accelerate progress, and to enable more countries to achieve the target. (Box 25 identifies some common barriers.) The most serious
obstacles – capacity and financial constraints – are discussed below. (Chapter 5 discusses coordination challenges and opportunities across sectors.)
Countries have made significant progress in implementing IWRM plans over the last 10 years. (More countries are now in higher green-blue categories. Fewer countries are in red-orange categories.)
3%
15%
22%
9%
10%
9%
16%
7%
19%
15%
12%
5%
10%
2%
9%
3%
5%
2017
2011
2007 31
47
56
AVE. SCORE PERCENTAGE OF COUNTRIES IN EACH IMPLEMENTATION CATEGORY
IWRM Implementation Very low Low Medium-low Medium-high High Very high No data
Figure 33 Status of implementation of IWRM plans 2007-2018. Information is based on 57 common countries. Results from 2007 and 2017 are rescaled to allow comparison with 2017/18 survey results.
In 2012, countries reported a wide range of challenges that constitute IWRM implementation barriers, including financing, institutional capacity, stakeholder engagement, knowledge and information sharing, and coordination between levels and sectors57
13%
20%
5%
4%
9%
2%
5%
6%
1%
3%
2%
4%
5%
3%
23%
9%
5%
5%
6%
5%
3%
5%
5%
6%
5%
4%
5%
2%
46%
22%
30%
28%
21%
26%
22%
17%
23%
19%
18%
17%
13%
11%
14%
38%
45%
47%
43%
47%
54%
50%
44%
49%
51%
49%
47%
44%
4%
11%
15%
17%
21%
21%
15%
22%
27%
23%
24%
27%
31%
39%
Management through private enterprise
Transboundary capacity (nat & sub-nat)
Stakeholder particpation
Knowledge sharing
Legislation
Cross-sector coordination (nat & sub-nat)
Coordination between levels
Institutional capacity (national & sub-national)
Climate change adaptation management
Water use efficiency management
Disaster management
Monitoring the resource
Financing water resources management
Infrastructure development & financing
0% 20% 40% 60% 80% 100%
Challenge category Highest priorityHighMediumLowNot a problem
PERCENTAGE OF COUNTRIES PER CHALLENGE CATEGORY
Figure 34 Challenge areas for water resources management, reported by 133 countries in 2012
6.2 ADDRESSING BARRIERS AND CONSTRAINTS TO PROGRESS57
57 United Nations Environment Programme (UNEP) (2012). The UN-Water Status Report on the Application of Integrated Approaches to Water Resources Management.

64CHAPTER 6 Towards full implementation of integrated water resources management
For the 6.5.1 indicator baseline in 2017/18, countries were not specifically asked to reflect on their main challenge areas for water resources management. Nevertheless, through workshop reports and free text responses to questions, many countries confirm that these challenges continue to pose barriers to implementation (Box 25). In future review of the 6.5.1 methodology, it is recommended to consider incorporating into the survey the identification of key challenge areas, and reflections on barriers and enablers to progress.
Capacity Constraints
Countries often emphasize limited capacity as an important, long-term barrier to IWRM (Box 26). Just over half of all countries report having government authorities with the capacity to lead IWRM plan implementation (medium-high implementation and above) (Figure 35).
BARRIERS TO IWRM IMPLEMENTATION.
Achieving sustainable water resources management through an IWRM approach has been high on the international water agenda for over 25 years. Previous reports have shown huge progress in most countries and regions. However, it is clear that obstacles, whether political, social, economic or ideological, can halt further advancement for years. Several countries report that policies, laws or plans are either not adopted almost a decade after being drafted (Guyana, Kazakhstan), or are not being implemented by the majority of authorities a decade after adoption (Iceland, Kazakhstan), although this need not stop progress being made on other elements of IWRM (Box 10, Chapter 4). Barriers most frequently reported are:
y The failure to operationalize, enforce and monitor compliance with laws (Sudan, Tanzania, Zimbabwe, Armenia) y Unclear or overlapping responsibilities that result in reduced interagency cooperation from conflicting interests or
policies (Netherlands, Sudan, Serbia, Suriname) y A shortage of funding, sometimes due to donors withdrawing because of political instability (Burundi, Cote d’Ivoire),
but usually stemming from national budget limitations (Iceland, Malawi, Togo). These budget limitations become much more evident at subnational levels (Botswana, Malaysia, Tanzania, Yemen)
y A shortage of human capacity for planning or implementation, especially at subnational levels, which affects the status of water management structures, and impedes their ability to plan, assess and monitor activities (Kazakhstan, El Salvador, Ghana, Tanzania, Macedonia, Swaziland, Papua New Guinea, Malaysia).
Capacity development is one of the more important elements needed to speed progress with IWRM. Such development should go along with realistic appraisals of funding and revenue-generation opportunities.
BOX 25
Nearly half (43 per cent) of countries have national authorities for leading IWRM plan implementation, but their capacity is insufficient for implementation.
0% 10% 20% 30%
No dedicated authorities for water resources managementAuthorities exist, with clear mandate to lead WRM
Authorities have capacity to formulate IWRM plansAuthorities have capacity to lead IWRM implementation
Authorities have capacity to lead M&E of IWRM plansAuthorities have capacity for IWRM plan revision
Q2.1a, ave. score = 58/100, n= 168
PERCENTAGE OF COUNTRIES PER IMPLEMENTATION CATEGORY
55%
43%
Figure 35 National government authorities’ capacity for leading implementation of national IWRM plans or similar

65 Progress on integrated water resources management 2018
CAPACITY CHALLENGES NEED LONG-TERM COMMITMENT.
Many countries have introduced IWRM into formal education, either as new stand-alone programmes or as components of other programmes (Cameroon, Austria, Ethiopia). However, countries repeatedly raise concerns over shortages of capacity. Though ad hoc courses are common (Benin, Bulgaria, El Salvador) widespread concerns remain about the lack of sustainable capacity development, and the lack of penetration/ outreach to actors on the ground. Burkina Faso has a human resources development plan in place, and it has implemented training throughout the water management structures. By contrast, Benin has restricted training to pilot areas, and it identifies an unmet need for capacity development at the national level. Some countries target school children (Argentina, Burkina Faso). Several countries report significant benefits from transboundary capacity development programmes, especially where there is a lack of national capacity development (Botswana, Cambodia, Côte d’Ivoire).
Little evidence from the questionnaires suggests capacity development in sustainable management of water resources has penetrated into water-use sectors, such as agriculture, environment, and urban planning – all of which have a large influence on sustainable use of water resources. This lack of information may be due to the limited target group for the questionnaire and the formulation of the questions themselves.
The report makes clear the consequences of a lack of capacity. Countries report problems with enforcement of regulations, an inability to prepare and implement plans, and inadequate management capacity to address technical and financial issues. The implementation of IWRM plans at basin/aquifer levels (Box 13) represents one specific area in which countries repeatedly identify a lack of capacity development as responsible for impeding progress. Overall, the variation in capacity-related problems – which arise from a mix of conditions of service, recruitment processes, staff management, educational quality and the wide scope of the possible target groups – means that solutions need to be designed in the national context. Typically, solutions require more reliable and increased finance.
BOX 26
More than half (58 per cent) of countries report either occasional, short-term capacity development activities, or some long-term initiatives, but with limited geographic and stakeholder coverage.
0% 10% 20% 30% 40%
No capacity development for water resources managementOccasional short-term / ad-hoc activities
Some long-term initiatives, limited areal & stakeh'r coverageLong-term initiatives, adequate areal & stakeh'r coverageLong-term initiatives, effective outcomes, good coverage
Long-term initiatives, highly effective outcomes
PERCENTAGE OF COUNTRIES PER IMPLEMENTATION CATEGORY
Q2.1f, ave. score = 50/100, n= 170
CAPACITY DEVELOPMENT INITIATIVES
41%
58%
Figure 36 Capacity development initiatives for water resources management, including enhancement of skills, instruments, resources and incentives for people and institutions at all levels

66CHAPTER 6 Towards full implementation of integrated water resources management
Financing
Access to adequate finance is a general constraint for development, and IWRM is no exception. As described in Section 4.5, country scores on finance average 10 points lower than scores in the other sections of the survey. The need to allocate financial resources specifically towards water resources management often goes unrecognized, leaving countries entirely reliant on sparse government budgets supplemented by ad hoc project funding. For many countries, overseas development assistance (ODA) may provide an important source of financing. (Indicator 6.a.1 addresses this issue.) Overseas development disbursements for the water sector grew by 67 per cent over a 10-year period, reaching a level of US$ 8.6 billion in 2015. Yet, as a proportion of total ODA, water-sector disbursements have remained relatively constant at about 5 per cent since 2005.58 To achieve sustainable financing, revenue raising from user charges is a critical element, and needs to be drastically improved (Section 4.5, Figure 28).
Investment by the private sector in basin management actions remains relatively low. Nevertheless, rapid progress is taking place in this area, with some notable activities in Africa (including South Africa and Tanzania) and California, to mobilize collective action for water resources management using private interests and finance to spark investment in activities to improve river basin management.59
Blended financing approaches should also be considered to help mobilize a wider range of financial sources. The advantages of intersectoral collaboration are the ability to coordinate and prioritize financing, and the opportunity to attract a range of investors, such as regional, national and local banks, and private-sector and philanthropic finance. A lack of innovation and institutional will to diversify and mobilize finance represents a serious impediment to implementing effective water resources management. Some countries report on related initiatives, which may serve as inspiration (see, for example, boxes 14 (Section 4.3) and 24 (Chapter 5)).60
58 These figures for the water sector captured under Goal 6 include: WASH, wastewater treatment, water resources conservation, development and management, agricultural water resources, flood protection, and hydroelectric power. See Annex C of World Health Organization (WHO) (2017). Financing universal water, sanitation and hygiene under the Sustainable Development Goals. UN-Water Global Analysis and Assessment of Sanitation and Drinking-Water (GLAAS) 2017 report. Geneva.
59 Newborne, P. and Dalton, J. (2016). Water management and stewardship: taking stock of corporate water behaviour. Overseas Development Institute.60 See also descriptions of “water funds”, which are multi-stakeholder platforms developed by cities and conservation practitioners to help resolve water and watershed
governance issues by bridging jurisdictional and financial gaps, in Abell, R., et al. (2017). Beyond the source: the environmental, economic and community benefits of source water protection. Arlington, Virginia: The Nature Conservancy.
6.3 ACTIONS IDENTIFIED BY COUNTRIES TO ADVANCE SUSTAINABLE MANAGEMENT OF WATER RESOURCES
Countries can take many actions and steps to advance the management of their water resources. No recipe dictates a fixed sequence for these steps (Box 10, Chapter 4). Countries should move ahead with initiatives and actions that respond to their specific needs. They should seize opportunities. As part of the country reporting on which this status report is based, countries provide a wealth of examples of practical IWRM initiatives that may inspire other countries to act. This is a significant outcome of the SDG monitoring process.
Most countries will identify with the actions being taken elsewhere because they face, or have already addressed, similar issues. The list below is intended to be inspirational, rather than exhaustive, arising as it does from only a modest number of countries. Actions should be determined and prioritized by individual countries.
Enabling environment of laws, policies and plans.
1. Advance national water policies, plans and laws into operation through awareness raising and supporting regulations (Burundi, Argentina, Armenia, Cambodia, El Salvador, The Gambia, Tanzania, Ukraine).
2. Develop watershed management plans (Argentina).
3. Establish or improve enforcement and oversight mechanisms (Armenia, Mongolia, Guatemala).
4. Elaborate and formulate groundwater legislation (China, Burundi).
5. Harmonize transboundary water laws (Burundi).
Institutions and stakeholders
1. Ensure that national and subnational structures are in place, and that they have the capacity to carry out their functions.
y Increase the status and coordination capacity of the Water Committee (Kazakhstan, Mongolia).
y Give the water regulator independent status by separating it from the Ministry of Agriculture and Water Resources (Uzbekistan).

67 Progress on integrated water resources management 2018
y Strengthen the responsibility of local authorities for water-use efficiency (Uzbekistan).
2. Improve the enabling environment for both horizontal integration (between economic sectors, such as agriculture, forestry, and urban and other land use) and vertical integration (from national to local) for effective communication, coordination and collaboration (Bulgaria, China, Guatemala).
3. Establish procedures for managing IWRM projects at central- and municipal-government levels (Guatemala).
4. Build capacity of sector institutions and relevant stakeholders to participate in water management (Guatemala, Ukraine, Mongolia, El Salvador, Cambodia, Burundi, Armenia).
5. Enhance coordination by establishing multisectoral forums as a coordination mechanism for implementation of river basin management plans; strengthen sharing of information, experiences and opinions between different sectors (Mongolia, Tanzania, Armenia, Burundi).
6. Invest in people: improve the recruitment procedures of state water management agencies to ensure qualified staff; develop staff capacity to fully equip them with skills needed to improve IWRM implementation (Armenia, Burundi); provide education and training to raise public awareness on the importance of water and water conservation (China).
7. Encourage participation of women in water resources management at national- and river-basin-management levels; increase the number of women decision makers (Mongolia, Armenia).
8. Strengthen arrangements for transboundary water management in priority basins (Mongolia, Armenia); build mutual trust (Tanzania).
9. Improve the participation of the private sector and all stakeholders in water resources development and planning (China, Kazakhstan, Armenia).
Management instruments
1. Establish effective mechanisms for the application of management instruments for institutional coordination, and for human and financial resources (El Salvador, Bulgaria, Guatemala, Tanzania).
2. Continue strengthening the capacities of staff and stakeholders on the application of management instruments at appropriate levels (Cambodia, Burundi, Guatemala, Kazakhstan, Mongolia).
3. Encourage and establish modalities for the private sector and civil society to collaborate with basin water
administration offices to support priority areas in management of water resources (Tanzania).
4. Improve the communication and cooperation between scientists and experts from administration and business to apply new technologies that boost water efficiency (Bulgaria).
5. Increase the number of (automatic) monitoring stations; improve data management (Bulgaria, Burundi, Guatemala, Mongolia, Pakistan, Tanzania), and establish laboratories for control and monitoring of water quality (Burundi, Pakistan).
6. Establish a national water resources information system (DRC).
7. Establish data-sharing arrangements between significant data providers and users (Tanzania).
8. Protect ecosystems, watersheds, water reservoirs, buffer zones and water reservoirs (Burundi).
9. Establish a joint coordination structure for disaster management and early warning related to water; develop contingency plans (Burundi, Tanzania).
Financing
1. Introduce dedicated legislation on water sector financing (DRC); establish sustainable financing mechanisms and budget allocation for implementation of national IWRM and river basin management plans (Mongolia).
2. Promote, lobby and influence municipal governments and development councils to develop IWRM infrastructure projects (Guatemala); seek prioritization of water management and infrastructure in the national budget (Tanzania, Pakistan).
3. Develop an investment strategy for rehabilitation of water infrastructure (Ukraine).
4. Increase cost recovery for water-related services by applying realistic water pricing, and by collecting revenues systematically (Pakistan, Uzbekistan, Armenia, Mongolia, Guatemala, El Salvador, DRC); provide for water trading at different levels to contribute towards improving cost recovery (Pakistan).
5. Improve the coordination and synergy between financial (market-based) instruments and command-and-control instruments; improve implementation of financial instruments in the water sector (fees, taxes, sanctions, subsidies, etc.); improve enforcement of legislation (Bulgaria).
6. Promote public-private partnerships in water resources management (Tanzania, Pakistan).

68CHAPTER 6 Towards full implementation of integrated water resources management
6.4 NEXT STEPS FOR IMPLEMENTING WATER RESOURCES MANAGEMENT
The above country examples of actions to accelerate IWRM implementation can provide inspiration to others. Countries that have not yet identified action areas should now do so. In conjunction with this, most countries may now also wish to set national targets that consider the global aspirational targets but are in line with national contexts and priorities. The country reporting based on the survey instruments for SDG indicators 6.5.1 and 6.5.2 can serve as a platform for a dialogue between IWRM stakeholders to identify action areas and set national targets. Following this, the challenge for countries lies in designing, securing resources for, and implementing activities that will support action areas and will move towards targets.
The 2030 Agenda resolution encourages each Government to set “its own national targets guided by the global level of ambition but taking into account national circumstances.”61 Though the resolution encourages this approach, countries seeking to address the challenging task of setting national targets across the SDGs will find no fixed instructions. Some initiatives and examples may provide a starting point:
y The UN Development Group provides guidance and a toolkit on tailoring SDGs to national, subnational and local contexts.62
y Some countries are currently going through processes to set national targets for drinking water, sanitation and hygiene. A briefing note providing lessons learned and recommendations is in development.63
y The European regional protocol on water and health provides guidelines on national target setting and evaluation of progress.64
y The Framework for Freshwater Ecosystem Management provides a holistic framework, which includes advice on setting objectives and targets with a focus on ecosystem health for sustainable development.65
As a practical suggestion, countries could use multi-stakeholder processes to fill out the 6.5.1 survey with ambitious yet realistic target scores for individual questions.
61 United Nations (2015). Transforming our world: the 2030 agenda for sustainable development. Resolution adopted by the United Nations General Assembly on 25 September 2015. A/RES/70/1, 15-16301 (E). Paragraphs 54 – 59.
62 United Nations Development Group. Tailoring SDG to National, Subnational and Local Contexts. https://undg.org/2030-agenda/mainstreaming-2030-agenda/tailor-ing-sdg-to-national-context/#Purpose%20,%20found%20via%20HOME%20%C2%BB%202030%20AGENDA%20%C2%BB%20MAINSTREAMING%202030%20AGENDA. Accessed 26 July 2018.
63 For example, Rural Water Supply Network, WHO/UNICEF Joint Monitoring Programme webinar, The SDGs at the national level: how countries nationalise targets and indicators. https://vimeo.com/272921443. Accessed 26 July 2018.
64 United Nations Economic Commission for Europe and the World Health Organization Regional Office for Europe (2010). Guidelines on the setting of targets, evalua-tion of progress and reporting. Protocol on Water and Health to the Convention on the Protection and Use of Transboundary Watercourses and International Lakes.
65 UN Environment (2017). A framework for freshwater ecosystem management. Volume 1: Overview and country guide for implementation. Volume 2: Technical guide for classification and target-setting. Nairobi.
These targets can be aggregated to provide an overall country target score. This approach could be used to set targets for 2030, as well as to set interim targets, if desired – as and beyond 2030, if required – to ultimately reach the very high IWRM implementation category.
International organizations can support national processes as requested. The reporting from countries on the core indicators for SDG-6, including indicator 6.5.1 on IWRM implementation, provides an excellent platform for a dialogue with and within countries on how to strengthen water resources management across sectors and stakeholders, and on how to identify specific needs for capacity development, technology transfer and piloting investments. This dialogue would also provide opportunities for a knowledge exchange between countries, and a more direct link to solution providers across the world.
© Shutterstock

69 Progress on integrated water resources management 2018
6.5 KEY MESSAGES AND RECOMMENDATIONS
The following IWRM implementation categories are used in this baseline assessment:
Implementation Categories
Score range
General interpretation for overall IWRM score
Very high 91 - 100 Plans and programmes are reviewed and revised.
High 71 - 90 Most IWRM objectives are generally met.
Medium-high 51 - 70Most IWRM elements are being implemented under long-term programmes.
Medium-low 31 - 50IWRM elements are institutionalized, and implementation is underway.
Low 11 - 30 Some implementation of IWRM elements has begun.
Very low 0 - 10Development of IWRM elements has generally not begun, or has stalled.
Implementing integrated water resources management for the 2030 Agenda
1. Integrated approaches to water resources management help to coordinate sustainable development, and help to determine how water is managed across agriculture, urban uses and ecosystems: these approaches are hugely important for the full 2030 Agenda. With increasing water scarcity and pollution, addressing conflicts and trade-offs is critical to allocate and use water in an efficient, sustainable and equitable manner. Recognizing the value of integrated approaches to water resources management at the political level is critical to achieving the 2030 Agenda.
Baseline status
2. The vast majority (80 per cent) of countries have laid solid foundations for integrated water resources management:
y Some 40 per cent of countries have institutionalized most elements of IWRM (medium-low implementation). They now need to focus on implementation;
y Another 20 per cent of countries are generally implementing most elements of IWRM in long-term programmes (medium-high implementation). They need to expand coverage and stakeholder engagement.
y The top 20 per cent of countries are generally achieving their policy objectives for integrated water resources management (high and very high implementation).
The lowest 20 per cent have started the process. They need to prioritize activities that will have the greatest impact in the national context.
Progress towards the global target
3. Under business-as-usual scenarios, most countries are unlikely to meet the global, aspirational target of very high implementation by 2030.
y The bottom 60 per cent of countries (medium-low implementation and below) are unlikely to reach the global target by 2030 unless implementation is significantly accelerated. These countries should set national, interim targets and prioritize activities which can have the greatest impact.
y Another 20 per cent of countries (medium-high implementation) are potentially in a position to reach the global target, but efforts need to focus on, and to sustain momentum towards 2030.
y Only the top 20 per cent of countries are likely to meet the global target. Most of these countries have very high levels of development.
Actions towards achieving target 6.5
4. Multi-stakeholder processes for completing the SDG indicator 6.5.1 survey have helped to identify challenge areas and actions in line with national priorities and planning processes across sectors. Unless more sophisticated national-level assessments and plans exist, all countries can learn from and build on the 6.5.1 reporting experience and make full use of the integrated (multi-stakeholder) approach to advance progress.
A-1ANNEXES
ANNEXES
A 6.5.1 QUESTIONNAIRE A-2
A.1 6.5.1 QUESTIONNAIRE OVERVIEW A-2
A.2 6.5.1 QUESTIONNAIRE WITH THRESHOLD DESCRIPTIONS A-3
B GLOBAL DISTRIBUTION OF IWRM IMPLEMENTATION BY QUESTION A-10
C NATIONAL 6.5.1 DATA: IWRM IMPLEMENTATION A-11
D DATA COVERAGE AND BREAKDOWNS A-15
E DEVELOPMENT OF THE 6.5.1 INDICATOR METHODOLOGY A-16
E.1 METHODOLOGY DEVELOPMENT TO DATE A-16
E.2 FUTURE REVIEW OF METHODOLOGY A-17
F NATIONAL WORKSHOP PROCESSES FOR DATA COLLECTION A-17
G QUALITY CONTROL PROCESS FOR DATA COLLECTION A-19

A-2 Progress on integrated water resources management 2018
A. 6.5.1 QUESTIONNAIRE
A.1 6.5.1 QUESTIONNAIRE OVERVIEW
Section 1: Enabling Environment. Assessment of Degree of implementation (0 – 100)
1.1 What is the status of policies, laws and plans to support IWRM at the national level?
a National water resources policy, or similar
b National water resources law(s)
c National integrated water resources management (IWRM) plans, or similar
1.2 What is the status of policies, laws and plans to support IWRM at other levels?
a Subnational water resources policies or similar
b Basin/aquifer management plans or similar, based on IWRM
c Arrangements for transboundary water management in most important basins / aquifers
d FEDERAL COUNTRIES ONLY: Provincial/state water resources laws
Section 2: Institutions and Participation. Assessment of Degree of implementation (0 – 100)2.1 What is the status of institutions for IWRM implementation at the national level?
a National government authorities’ capacity for leading implementation of national IWRM plans or similar
b Coordination between government authorities from different sectors on water resources
c Public participation in water resources, policy, planning and management at national level
d Business participation in water resources development, management and use at national level
e Gender-specific objectives for water resources management at national level
f Developing IWRM capacity at the national level
2.2 What is the status of institutions for IWRM implementation at other levels?
a Basin/aquifer level organizations for leading implementation of IWRM plans or similar
b Public participation in water resources, policy, planning and management at the local level
c Gender-specific objectives at subnational levels
d Gender-specific objectives and plans at transboundary level
e Organizational framework for transboundary water management for most important basins / aquifers
f FEDERAL COUNTRIES ONLY: Provincial / State authorities responsible for water resources management
Section 3: Management Instruments. Assessment of Degree of implementation (0 – 100)
3.1 What is the status of management instruments to support IWRM implementation at the national level?
a National monitoring of water availability (includes surface and/or groundwater, as relevant to the country)
b Sustainable and efficient water-use management from the national level
c Pollution control from the national level
d Management of water-related ecosystems from the national level
e Management instruments to reduce impacts of water-related disasters from the national level
3.2 What is the status of management instruments to support IWRM implementation at other levels?
a Basin management instruments
b Aquifer management instruments
c Data and information sharing within countries at all levels
d Transboundary data and information sharing between countries
Section 4: Financing. Assessment of Degree of implementation (0 – 100)
4.1 What is the status of financing for water resources development and management at the national level?
a National budget for investment including water resources infrastructure
b National budget for the recurrent costs of the IWRM elements
4.2 What is the status of financing for water resources development and management at other levels?
a Subnational or basin budgets for investment including water resources infrastructure
b Revenues raised from dedicated levies on water users at basin, aquifer or subnational levels
c Financing for transboundary cooperation

A-3ANNEXES
A.2
6.
5.1
QU
ESTI
ON
NA
IRE
WIT
H T
HR
ESH
OLD
DES
CR
IPTI
ON
S
The
shor
tene
d ve
rsio
n of
the
ques
tionn
aire
bel
ow c
onta
ins
the
full
wor
ding
of t
he q
uest
ions
and
the
thre
shol
d de
scrip
tions
. How
ever
, it d
oes
not c
onta
in th
e gl
ossa
ries
and
expl
anat
ory
note
s co
ntai
ned
in th
e fu
ll qu
estio
nnai
re, w
hich
can
be
dow
nloa
ded
from
http
://iw
rmda
tapo
rtal
.une
pdhi
.org
. The
thre
shol
d de
scrip
tions
are
incl
uded
her
e as
they
are
use
ful f
or th
e in
terp
reta
tion
of
prog
ress
from
eac
h of
the
ques
tions
.
1. E
NA
BLI
NG
EN
VIR
ON
MEN
T
De
gree
of i
mpl
emen
tatio
n (0
– 1
00)
Very
low
(0)
Low
(20)
Med
ium
-low
(40)
Med
ium
-hig
h (6
0)H
igh
(80)
Very
hig
h (1
00)
1.1
Wha
t is
the
stat
us o
f pol
icie
s, la
ws
and
plan
s to
sup
port
Inte
grat
ed W
ater
Res
ourc
es M
anag
emen
t (IW
RM) a
t the
nat
iona
l lev
el?
a. N
atio
nal w
ater
re
sour
ces
polic
y, or
si
mila
r
Deve
lopm
ent n
ot
star
ted
or n
ot
prog
ress
ing.
Exis
ts, b
ut n
ot b
ased
on
IWRM
.Ba
sed
on IW
RM, a
ppro
ved
by g
over
nmen
t and
sta
rtin
g to
be
used
by
auth
oriti
es to
gu
ide
wor
k.
Bein
g us
ed b
y th
e m
ajor
ity o
f rel
evan
t au
thor
ities
to g
uide
w
ork.
Polic
y ob
ject
ives
co
nsis
tent
ly a
chie
ved.
Obj
ectiv
es c
onsi
sten
tly
achi
eved
, and
pe
riodi
cally
revi
ewed
and
re
vise
d.
b. N
atio
nal w
ater
re
sour
ces
law
(s)
Deve
lopm
ent n
ot
star
ted
or n
ot
prog
ress
ing.
Exis
ts, b
ut n
ot b
ased
on
IWRM
.Ba
sed
on IW
RM, a
ppro
ved
by g
over
nmen
t and
sta
rtin
g to
be
appl
ied
by a
utho
ritie
s.
Bein
g ap
plie
d by
the
maj
ority
of r
elev
ant
auth
oriti
es.
All
law
s ar
e be
ing
appl
ied
acro
ss th
e co
untr
y.
All
law
s ar
e en
forc
ed
acro
ss th
e co
untr
y, an
d al
l peo
ple
and
orga
niza
tions
are
hel
d ac
coun
tabl
e.
c. N
atio
nal i
nteg
rate
d w
ater
reso
urce
s m
anag
emen
t (IW
RM)
plan
s, o
r sim
ilar
Deve
lopm
ent n
ot
star
ted
or n
ot
prog
ress
ing.
Bein
g pr
epar
ed, b
ut
not a
ppro
ved
by
gove
rnm
ent.
Appr
oved
by
gove
rnm
ent
and
star
ting
to b
e im
plem
ente
d by
aut
horit
ies.
Bein
g im
plem
ente
d by
th
e m
ajor
ity o
f rel
evan
t au
thor
ities
.
Plan
obj
ectiv
es
cons
iste
ntly
ach
ieve
d.O
bjec
tives
con
sist
ently
ac
hiev
ed, a
nd
perio
dica
lly re
view
ed a
nd
revi
sed.
1.2
Wha
t is
the
stat
us o
f pol
icie
s, la
ws
and
plan
s to
sup
port
IWRM
at o
ther
leve
ls?
a. S
ubna
tiona
l wat
er
reso
urce
s po
licie
s or
si
mila
r
Deve
lopm
ent n
ot
star
ted
or d
elay
ed
in m
ost s
ubna
tiona
l ju
risdi
ctio
ns.
Exis
t in
mos
t ju
risdi
ctio
ns, b
ut n
ot
nece
ssar
ily b
ased
on
IWRM
.
Base
d on
IWRM
, app
rove
d by
the
maj
ority
of
auth
oriti
es a
nd s
tart
ing
to
be u
sed
to g
uide
wor
k.
Bein
g us
ed b
y th
e m
ajor
ity o
f rel
evan
t au
thor
ities
to g
uide
w
ork.
Polic
y ob
ject
ives
co
nsis
tent
ly a
chie
ved
by a
maj
ority
of
auth
oriti
es.
Obj
ectiv
es c
onsi
sten
tly
achi
eved
by
all
auth
oriti
es, a
nd
perio
dica
lly re
view
ed
and
revi
sed.
b. B
asin
/aqu
ifer
man
agem
ent p
lans
or
sim
ilar,
base
d on
IW
RM
Deve
lopm
ent n
ot
star
ted
or d
elay
ed
in m
ost b
asin
s/aq
uife
rs o
f nat
iona
l im
port
ance
.
Bein
g pr
epar
ed fo
r m
ost b
asin
s/aq
uife
rs o
f na
tiona
l im
port
ance
.
Appr
oved
in th
e m
ajor
ity o
f ba
sins
/aqu
ifers
and
sta
rtin
g to
be
used
by
auth
oriti
es.
Bein
g im
plem
ente
d in
th
e m
ajor
ity o
f bas
ins/
aqui
fers
.
Plan
obj
ectiv
es
cons
iste
ntly
ach
ieve
d in
maj
ority
of b
asin
s/aq
uife
rs.
Obj
ectiv
es c
onsi
sten
tly
achi
eved
in a
ll ba
sins
/aq
uife
rs, a
nd p
erio
dica
lly
revi
ewed
and
revi
sed.
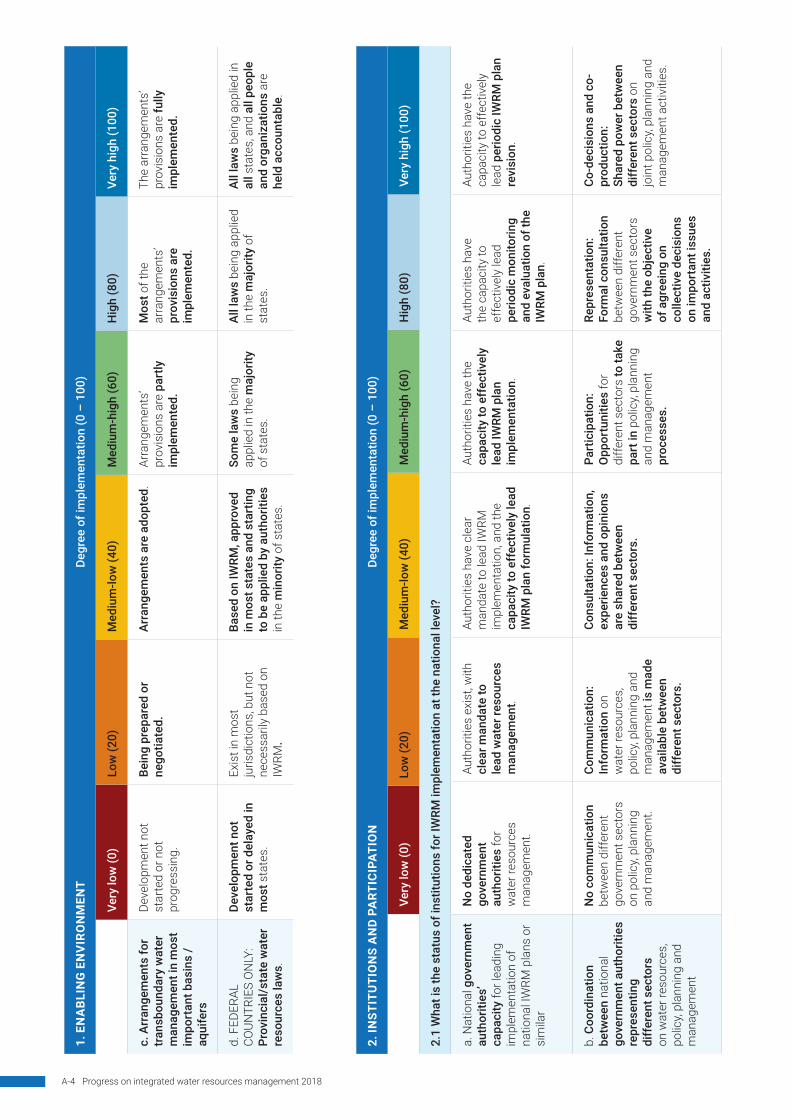
A-4 Progress on integrated water resources management 2018
1. E
NA
BLI
NG
EN
VIR
ON
MEN
T
De
gree
of i
mpl
emen
tatio
n (0
– 1
00)
Very
low
(0)
Low
(20)
Med
ium
-low
(40)
Med
ium
-hig
h (6
0)H
igh
(80)
Very
hig
h (1
00)
c. A
rran
gem
ents
for
tran
sbou
ndar
y w
ater
m
anag
emen
t in
mos
t im
port
ant b
asin
s /
aqui
fers
Deve
lopm
ent n
ot
star
ted
or n
ot
prog
ress
ing.
Bein
g pr
epar
ed o
r ne
gotia
ted.
A
rran
gem
ents
are
ado
pted
.Ar
rang
emen
ts’
prov
isio
ns a
re p
artly
im
plem
ente
d.
Mos
t of t
he
arra
ngem
ents
’ pr
ovis
ions
are
im
plem
ente
d.
The
arra
ngem
ents
’ pr
ovis
ions
are
fully
im
plem
ente
d.
d. F
EDER
AL
COUN
TRIE
S O
NLY
: Pr
ovin
cial
/sta
te w
ater
re
sour
ces
law
s.
Deve
lopm
ent n
ot
star
ted
or d
elay
ed in
m
ost s
tate
s.
Exis
t in
mos
t ju
risdi
ctio
ns, b
ut n
ot
nece
ssar
ily b
ased
on
IWRM
.
Base
d on
IWRM
, app
rove
d in
mos
t sta
tes
and
star
ting
to b
e ap
plie
d by
aut
horit
ies
in th
e m
inor
ity o
f sta
tes.
Som
e la
ws
bein
g ap
plie
d in
the
maj
ority
of
sta
tes.
All
law
s be
ing
appl
ied
in th
e m
ajor
ity o
f st
ates
.
All
law
s be
ing
appl
ied
in
all s
tate
s, a
nd a
ll pe
ople
an
d or
gani
zatio
ns a
re
held
acc
ount
able
.
2. IN
STIT
UTI
ON
S A
ND
PA
RTIC
IPAT
ION
Degr
ee o
f im
plem
enta
tion
(0 –
100
)
Very
low
(0)
Low
(20)
Med
ium
-low
(40)
Med
ium
-hig
h (6
0)H
igh
(80)
Very
hig
h (1
00)
2.1
Wha
t is
the
stat
us o
f ins
titut
ions
for I
WRM
impl
emen
tatio
n at
the
natio
nal l
evel
?
a. N
atio
nal g
over
nmen
t au
thor
ities
’ ca
paci
ty fo
r lea
ding
im
plem
enta
tion
of
natio
nal I
WRM
pla
ns o
r si
mila
r
No
dedi
cate
d go
vern
men
t au
thor
ities
for
wat
er re
sour
ces
man
agem
ent.
Auth
oriti
es e
xist
, with
cl
ear m
anda
te to
le
ad w
ater
reso
urce
s m
anag
emen
t.
Auth
oriti
es h
ave
clea
r m
anda
te to
lead
IWRM
im
plem
enta
tion,
and
the
capa
city
to e
ffec
tivel
y le
ad
IWRM
pla
n fo
rmul
atio
n.
Auth
oriti
es h
ave
the
capa
city
to e
ffec
tivel
y le
ad IW
RM p
lan
impl
emen
tatio
n.
Auth
oriti
es h
ave
the
capa
city
to
effe
ctiv
ely
lead
pe
riodi
c m
onito
ring
and
eval
uatio
n of
the
IWRM
pla
n.
Auth
oriti
es h
ave
the
capa
city
to e
ffect
ivel
y le
ad p
erio
dic
IWRM
pla
n re
visi
on.
b. C
oord
inat
ion
betw
een
natio
nal
gove
rnm
ent a
utho
ritie
s re
pres
entin
g di
ffer
ent s
ecto
rs
on w
ater
reso
urce
s,
polic
y, pl
anni
ng a
nd
man
agem
ent
No
com
mun
icat
ion
betw
een
diffe
rent
go
vern
men
t sec
tors
on
pol
icy,
plan
ning
an
d m
anag
emen
t.
Com
mun
icat
ion:
Info
rmat
ion
on
wat
er re
sour
ces,
po
licy,
plan
ning
and
m
anag
emen
t is
mad
e av
aila
ble
betw
een
diff
eren
t sec
tors
.
Cons
ulta
tion:
Info
rmat
ion,
ex
perie
nces
and
opi
nion
s ar
e sh
ared
bet
wee
n di
ffer
ent s
ecto
rs.
Part
icip
atio
n:
Opp
ortu
nitie
s fo
r di
ffere
nt s
ecto
rs to
take
pa
rt in
pol
icy,
plan
ning
an
d m
anag
emen
t pr
oces
ses.
Repr
esen
tatio
n:
Form
al c
onsu
ltatio
n be
twee
n di
ffere
nt
gove
rnm
ent s
ecto
rs
with
the
obje
ctiv
e of
agr
eein
g on
co
llect
ive
deci
sion
s on
impo
rtan
t iss
ues
and
activ
ities
.
Co-d
ecis
ions
and
co-
pr
oduc
tion:
Sh
ared
pow
er b
etw
een
diff
eren
t sec
tors
on
join
t pol
icy,
plan
ning
and
m
anag
emen
t act
iviti
es.

A-5ANNEXES
2. IN
STIT
UTI
ON
S A
ND
PA
RTIC
IPAT
ION
Degr
ee o
f im
plem
enta
tion
(0 –
100
)
Very
low
(0)
Low
(20)
Med
ium
-low
(40)
Med
ium
-hig
h (6
0)H
igh
(80)
Very
hig
h (1
00)
c. P
ublic
par
ticip
atio
n in
wat
er re
sour
ces,
po
licy,
plan
ning
and
m
anag
emen
t at
natio
nal l
evel
.
No
com
mun
icat
ion
betw
een
gove
rnm
ent
and
stak
ehol
ders
on
polic
y, pl
anni
ng a
nd
man
agem
ent.
Com
mun
icat
ion:
Info
rmat
ion
on
wat
er re
sour
ces,
po
licy,
plan
ning
and
m
anag
emen
t is
mad
e av
aila
ble
to
stak
ehol
ders
.
Cons
ulta
tion:
G
over
nmen
t aut
horit
ies
occa
sion
ally
requ
est
info
rmat
ion,
exp
erie
nces
an
d op
inio
ns o
f st
akeh
olde
rs.
Cons
ulta
tion:
G
over
nmen
t au
thor
ities
regu
larly
re
ques
t inf
orm
atio
n,
expe
rienc
es
and
opin
ions
of
stak
ehol
ders
.
Part
icip
atio
n:
Regu
lar o
ppor
tuni
ties
for s
take
hold
ers
to
take
par
t in
rele
vant
po
licy,
plan
ning
an
d m
anag
emen
t pr
oces
ses.
Repr
esen
tatio
n:
Form
al re
pres
enta
tion
of s
take
hold
ers
in
gove
rnm
ent p
roce
sses
co
ntrib
utin
g to
dec
isio
n m
akin
g on
impo
rtan
t is
sues
and
act
iviti
es, a
s ap
prop
riate
.
d. B
usin
ess
part
icip
atio
n in
wat
er
reso
urce
s de
velo
pmen
t, m
anag
emen
t and
use
at
nat
iona
l lev
el.
No
com
mun
icat
ion
betw
een
gove
rnm
ent
and
busi
ness
abo
ut
wat
er re
sour
ces
deve
lopm
ent,
man
agem
ent a
nd u
se.
Lim
ited
com
mun
icat
ion
betw
een
gove
rnm
ent
and
busi
ness
abo
ut
wat
er re
sour
ces
deve
lopm
ent,
man
agem
ent a
nd u
se.
Regu
lar c
onsu
ltatio
n be
twee
n go
vern
men
t and
bu
sine
ss a
bout
wat
er
reso
urce
s de
velo
pmen
t, m
anag
emen
t and
use
.
Lim
ited
oppo
rtun
ities
fo
r priv
ate
sect
or
invo
lvem
ent e
stab
lishe
d fo
r wat
er re
sour
ces
deve
lopm
ent,
man
agem
ent a
nd u
se
activ
ities
.
Regu
lar o
ppor
tuni
ties
for p
rivat
e se
ctor
in
volv
emen
t es
tabl
ishe
d fo
r w
ater
reso
urce
s de
velo
pmen
t, m
anag
emen
t and
use
ac
tiviti
es.
Effe
ctiv
e pr
ivat
e se
ctor
invo
lvem
ent
esta
blis
hed
for w
ater
re
sour
ces
deve
lopm
ent,
man
agem
ent a
nd u
se
activ
ities
.
e. G
ende
r-sp
ecifi
c ob
ject
ives
for w
ater
re
sour
ces
man
agem
ent
at n
atio
nal l
evel
.
Gen
der n
ot e
xplic
itly
addr
esse
d th
roug
hout
na
tiona
l law
s, p
olic
y or
pla
ns.
Gen
der p
artia
lly
addr
esse
d th
roug
hout
na
tiona
l law
s, p
olic
ies
or
plan
s.
Gen
der a
ddre
ssed
in
natio
nal p
lans
but
with
lim
ited
budg
et a
nd
impl
emen
tatio
n.
Gen
der a
ddre
ssed
in
natio
nal p
lans
, par
tially
fu
nded
and
obj
ectiv
es
part
ly a
chie
ved.
Activ
ities
ade
quat
ely
fund
ed, a
nd o
bjec
tives
m
ostly
ach
ieve
d.
Obj
ectiv
es fu
lly a
chie
ved
and
adeq
uate
ly a
ddre
ss
gend
er is
sues
.
f. De
velo
ping
IWRM
ca
paci
ty a
t the
nat
iona
l le
vel
No
capa
city
de
velo
pmen
t spe
cific
to
wat
er re
sour
ces
man
agem
ent.
Occ
asio
nal c
apac
ity
deve
lopm
ent,
gene
rally
lim
ited
to
shor
t-ter
m /
ad h
oc
activ
ities
.
Som
e lo
ng-te
rm c
apac
ity
deve
lopm
ent i
nitia
tives
are
be
ing
impl
emen
ted,
but
ge
ogra
phic
and
sta
keho
lder
co
vera
ge is
lim
ited.
Long
-term
cap
acity
de
velo
pmen
t ini
tiativ
es
are
bein
g im
plem
ente
d,
and
geog
raph
ic a
nd
stak
ehol
der c
over
age
is
adeq
uate
.
Long
-term
cap
acity
de
velo
pmen
t in
itiat
ives
are
bei
ng
impl
emen
ted,
with
ef
fect
ive
outc
omes
, an
d ge
ogra
phic
and
st
akeh
olde
r cov
erag
e is
ver
y go
od.
Long
-term
cap
acity
de
velo
pmen
t ini
tiativ
es
are
bein
g im
plem
ente
d w
ith h
ighl
y ef
fect
ive
outc
omes
, and
ge
ogra
phic
and
st
akeh
olde
r cov
erag
e is
ex
celle
nt.
2.2
Wha
t is
the
stat
us o
f ins
titut
ions
for I
WRM
impl
emen
tatio
n at
oth
er le
vels
?
a. B
asin
/aqu
ifer
leve
l org
aniz
atio
ns
for l
eadi
ng
impl
emen
tatio
n of
IW
RM p
lans
or s
imila
r.
No
dedi
cate
d ba
sin
auth
oriti
es fo
r w
ater
reso
urce
s m
anag
emen
t.
Auth
oriti
es e
xist
, with
cl
ear m
anda
te to
le
ad w
ater
reso
urce
s m
anag
emen
t.
Auth
oriti
es h
ave
clea
r m
anda
te to
lead
IWRM
im
plem
enta
tion,
and
the
capa
city
to e
ffec
tivel
y le
ad
IWRM
pla
n fo
rmul
atio
n.
Aut
horit
ies
have
the
capa
city
to e
ffec
tivel
y le
ad IW
RM p
lan
impl
emen
tatio
n.
Auth
oriti
es h
ave
the
capa
city
to
effe
ctiv
ely
lead
pe
riodi
c m
onito
ring
and
eval
uatio
n of
the
IWRM
pla
n.
Auth
oriti
es h
ave
the
capa
city
to e
ffec
tivel
y le
ad p
erio
dic
IWRM
pla
n re
visi
on.

A-6 Progress on integrated water resources management 2018
2. IN
STIT
UTI
ON
S A
ND
PA
RTIC
IPAT
ION
Degr
ee o
f im
plem
enta
tion
(0 –
100
)
Very
low
(0)
Low
(20)
Med
ium
-low
(40)
Med
ium
-hig
h (6
0)H
igh
(80)
Very
hig
h (1
00)
b. P
ublic
par
ticip
atio
n in
wat
er re
sour
ces,
po
licy,
plan
ning
and
m
anag
emen
t at t
he
loca
l lev
el
No
com
mun
icat
ion
betw
een
loca
l go
vern
men
t and
st
akeh
olde
rs o
n po
licy,
plan
ning
and
m
anag
emen
t.
Com
mun
icat
ion:
Loca
l lev
el in
form
atio
n on
wat
er re
sour
ces,
po
licy,
plan
ning
and
m
anag
emen
t is
mad
e av
aila
ble
to
stak
ehol
ders
.
Cons
ulta
tion:
G
over
nmen
t aut
horit
ies
occa
sion
ally
requ
est
loca
l lev
el in
form
atio
n,
expe
rienc
es a
nd o
pini
ons
of
stak
ehol
ders
.
Cons
ulta
tion:
G
over
nmen
t aut
horit
ies
regu
larly
requ
est
loca
l lev
el in
form
atio
n,
expe
rienc
es
and
opin
ions
of
stak
ehol
ders
.
Part
icip
atio
n:
Regu
lar o
ppor
tuni
ties
for s
take
hold
ers
to ta
ke p
art i
n re
leva
nt lo
cal l
evel
po
licy,
plan
ning
an
d m
anag
emen
t pr
oces
ses.
Repr
esen
tatio
n: F
orm
al
repr
esen
tatio
n of
st
akeh
olde
rs o
n lo
cal
auth
ority
pro
cess
es
cont
ribut
ing
to d
ecis
ion-
mak
ing
on im
port
ant
loca
l iss
ues
and
activ
ities
, as
appr
opria
te.
c. G
ende
r-spe
cific
ob
ject
ives
at
subn
atio
nal l
evel
s
Gen
der n
ot e
xplic
itly
addr
esse
d th
roug
hout
su
bnat
iona
l law
s,
polic
y or
pla
ns.
Gen
der p
artia
lly
addr
esse
d in
su
bnat
iona
l law
s,
polic
ies
or p
lans
.
Gen
der a
ddre
ssed
in
subn
atio
nal p
lans
but
w
ith li
mite
d bu
dget
and
im
plem
enta
tion.
Gen
der a
ddre
ssed
in
sub
natio
nal p
lans
, pa
rtia
lly fu
nded
and
ob
ject
ives
par
tly
achi
eved
.
Activ
ities
ade
quat
ely
fund
ed, a
nd o
bjec
tives
m
ostly
ach
ieve
d.
Obj
ectiv
es fu
lly a
chie
ved
and
adeq
uate
ly a
ddre
ss
subn
atio
nal g
ende
r is
sues
.
d. G
ende
r-spe
cific
ob
ject
ives
and
pla
ns a
t tr
ansb
ound
ary
leve
l
Gen
der n
ot e
xplic
itly
addr
esse
d in
tra
nsbo
unda
ry
polic
ies
or p
lans
.
Gen
der p
artia
lly
addr
esse
d in
tra
nsbo
unda
ry p
olic
ies
or p
lans
.
Gen
der a
ddre
ssed
in
trans
boun
dary
pla
ns b
ut
with
lim
ited
budg
et a
nd
impl
emen
tatio
n.
Gen
der a
ddre
ssed
in
trans
boun
dary
pla
ns,
part
ially
fund
ed a
nd
obje
ctiv
es p
artly
ac
hiev
ed.
Activ
ities
ade
quat
ely
fund
ed, a
nd o
bjec
tives
m
ostly
ach
ieve
d.
Obj
ectiv
es fu
lly a
chie
ved
and
adeq
uate
ly a
ddre
ss
tran
sbou
ndar
y ge
nder
is
sues
.
e. O
rgan
izat
iona
l fr
amew
ork
for
tran
sbou
ndar
y w
ater
m
anag
emen
t for
mos
t im
port
ant b
asin
s /
aqui
fers
No
orga
niza
tiona
l fra
mew
ork(
s).
Org
aniz
atio
nal
fram
ewor
k(s)
bei
ng
deve
lope
d.
Org
aniz
atio
nal f
ram
ewor
k(s)
es
tabl
ishe
d.O
rgan
izat
iona
l fra
mew
ork(
s)’ m
anda
te
is p
artly
fulfi
lled.
Org
aniz
atio
nal
fram
ewor
k(s)
’ m
anda
te is
fulfi
lled
for t
he m
ost p
art.
Org
aniz
atio
nal
fram
ewor
k(s)
’ man
date
is
fully
fulfi
lled.
f. FE
DERA
L CO
UNTR
IES
ON
LY:
Prov
inci
al /
Stat
e au
thor
ities
resp
onsi
ble
for w
ater
reso
urce
s m
anag
emen
t
No
dedi
cate
d pr
ovin
cial
/sta
te
auth
oriti
es fo
r w
ater
reso
urce
s m
anag
emen
t.
Auth
oriti
es e
xist
, with
cl
ear m
anda
te to
le
ad w
ater
reso
urce
s m
anag
emen
t.
Auth
oriti
es h
ave
clea
r m
anda
te to
lead
IWRM
im
plem
enta
tion,
and
the
capa
city
to e
ffect
ivel
y le
ad
IWRM
pla
n fo
rmul
atio
n.
Aut
horit
ies
have
the
capa
city
to e
ffect
ivel
y le
ad IW
RM p
lan
impl
emen
tatio
n.
Auth
oriti
es h
ave
the
capa
city
to
effe
ctiv
ely
lead
pe
riodi
c m
onito
ring
and
eval
uatio
n of
the
IWRM
pla
n.
Auth
oriti
es h
ave
the
capa
city
to e
ffect
ivel
y le
ad p
erio
dic
IWRM
pla
n re
visi
on.

A-7ANNEXES
3. M
AN
AG
EMEN
T IN
STR
UM
ENTS
Degr
ee o
f im
plem
enta
tion
(0 –
100
)
Very
low
(0)
Low
(20)
Med
ium
-low
(40)
Med
ium
-hig
h (6
0)H
igh
(80)
Very
hig
h (1
00)
3.1
Wha
t is
the
stat
us o
f man
agem
ent i
nstr
umen
ts to
sup
port
IWRM
impl
emen
tatio
n at
the
natio
nal l
evel
?
aN
atio
nal m
onito
ring
of w
ater
ava
ilabi
lity
(incl
udes
sur
face
an
d/or
gro
undw
ater
, as
rele
vant
to th
e co
untr
y).
No
natio
nal
mon
itorin
g sy
stem
s in
pla
ce.
Mon
itorin
g sy
stem
s es
tabl
ishe
d fo
r a
limite
d nu
mbe
r of
shor
t-ter
m /
ad h
oc
proj
ects
or s
imila
r.
Long
-term
nat
iona
l m
onito
ring
is
carr
ied
out b
ut w
ith
limite
d co
vera
ge
and
limite
d us
e by
st
akeh
olde
rs.
Long
-term
nat
iona
l m
onito
ring
is c
arrie
d ou
t w
ith a
dequ
ate
cove
rage
but
lim
ited
use
by s
take
hold
ers.
Long
-term
nat
iona
l m
onito
ring
is c
arrie
d ou
t w
ith v
ery
good
cov
erag
e an
d ad
equa
te u
se b
y st
akeh
olde
rs.
Long
-term
nat
iona
l m
onito
ring
is c
arrie
d ou
t w
ith e
xcel
lent
cov
erag
e an
d ex
celle
nt u
se b
y st
akeh
olde
rs.
bSu
stai
nabl
e an
d ef
ficie
nt w
ater
-use
m
anag
emen
t fro
m
the
natio
nal l
evel
, (in
clud
es s
urfa
ce
and/
or g
roun
dwat
er,
as re
leva
nt to
the
coun
try)
.
No
man
agem
ent
inst
rum
ents
bei
ng
impl
emen
ted.
Use
of
man
agem
ent
inst
rum
ents
is
limite
d an
d on
ly
thro
ugh
shor
t-ter
m
/ ad
hoc
proj
ects
or
sim
ilar.
Som
e m
anag
emen
t in
stru
men
ts
impl
emen
ted
on
a m
ore
long
-term
ba
sis,
but
with
lim
ited
cove
rage
ac
ross
diff
eren
t w
ater
use
rs a
nd th
e co
untr
y.
Man
agem
ent i
nstru
men
ts
are
impl
emen
ted
on a
long
-te
rm b
asis
, with
ade
quat
e co
vera
ge a
cros
s di
ffere
nt
wat
er u
sers
and
the
coun
try.
Man
agem
ent i
nstru
men
ts
are
impl
emen
ted
on a
long
-te
rm b
asis
, with
ver
y go
od
cove
rage
acr
oss
diffe
rent
w
ater
use
rs a
nd th
e co
untr
y, an
d ar
e ef
fect
ive.
Man
agem
ent i
nstru
men
ts
are
impl
emen
ted
on a
long
-te
rm b
asis
, with
exc
elle
nt
cove
rage
acr
oss
diffe
rent
w
ater
use
rs a
nd th
e co
untr
y, an
d ar
e hi
ghly
eff
ectiv
e.
cPo
llutio
n co
ntro
l fro
m th
e na
tiona
l le
vel
No
man
agem
ent
inst
rum
ents
bei
ng
impl
emen
ted.
Use
of
man
agem
ent
inst
rum
ents
is
limite
d an
d on
ly
thro
ugh
shor
t-ter
m
/ ad
hoc
proj
ects
or
sim
ilar.
Som
e m
anag
emen
t in
stru
men
ts
impl
emen
ted
on
a m
ore
long
-term
ba
sis,
but
with
lim
ited
cove
rage
ac
ross
sec
tors
and
th
e co
untr
y.
Man
agem
ent i
nstru
men
ts
are
impl
emen
ted
on a
long
-te
rm b
asis
, with
ade
quat
e co
vera
ge a
cros
s se
ctor
s an
d th
e co
untr
y.
Man
agem
ent i
nstru
men
ts
are
impl
emen
ted
on a
long
-te
rm b
asis
, with
ver
y go
od
cove
rage
acr
oss
sect
ors
and
the
coun
try,
and
are
effe
ctiv
e.
Man
agem
ent i
nstru
men
ts
are
impl
emen
ted
on a
long
-te
rm b
asis
, with
exc
elle
nt
cove
rage
acr
oss
sect
ors
and
the
coun
try,
and
are
high
ly e
ffec
tive.
dM
anag
emen
t of
wat
er-r
elat
ed
ecos
yste
ms
from
th
e na
tiona
l lev
el
No
man
agem
ent
inst
rum
ents
bei
ng
impl
emen
ted.
Use
of
man
agem
ent
inst
rum
ents
is
limite
d an
d on
ly
thro
ugh
shor
t-ter
m
/ ad
hoc
proj
ects
or
sim
ilar.
Som
e m
anag
emen
t in
stru
men
ts
impl
emen
ted
on
a m
ore
long
-term
ba
sis,
but
with
lim
ited
cove
rage
ac
ross
diff
eren
t ec
osys
tem
type
s an
d th
e co
untr
y.
Man
agem
ent i
nstru
men
ts
are
impl
emen
ted
on a
long
-te
rm b
asis
, with
ade
quat
e co
vera
ge a
cros
s di
ffere
nt
ecos
yste
m ty
pes
and
the
coun
try.
Envi
ronm
enta
l W
ater
Req
uire
men
ts (E
WR)
an
alys
ed in
som
e ca
ses.
Man
agem
ent i
nstru
men
ts
are
impl
emen
ted
on a
long
-te
rm b
asis
, with
ver
y go
od
cove
rage
acr
oss
diffe
rent
ec
osys
tem
type
s an
d th
e co
untr
y, an
d ar
e ef
fect
ive.
EW
R an
alys
ed fo
r mos
t of
coun
try.
Man
agem
ent i
nstru
men
ts
are
impl
emen
ted
on a
long
-te
rm b
asis
, with
exc
elle
nt
cove
rage
acr
oss
diffe
rent
ec
osys
tem
type
s an
d th
e co
untr
y, an
d ar
e hi
ghly
ef
fect
ive.
EW
R an
alys
ed fo
r w
hole
cou
ntry
.

A-8 Progress on integrated water resources management 2018
3. M
AN
AG
EMEN
T IN
STR
UM
ENTS
Degr
ee o
f im
plem
enta
tion
(0 –
100
)
Very
low
(0)
Low
(20)
Med
ium
-low
(40)
Med
ium
-hig
h (6
0)H
igh
(80)
Very
hig
h (1
00)
eM
anag
emen
t in
stru
men
ts to
re
duce
impa
cts
of w
ater
-rel
ated
di
sast
ers
from
the
natio
nal l
evel
No
man
agem
ent
inst
rum
ents
bei
ng
impl
emen
ted.
Use
of
man
agem
ent
inst
rum
ents
is
limite
d an
d on
ly
thro
ugh
shor
t-ter
m
/ ad
hoc
proj
ects
or s
imila
r.
Som
e m
anag
emen
t in
stru
men
ts
impl
emen
ted
on
a m
ore
long
-term
ba
sis,
but
with
lim
ited
cove
rage
of
at-ri
sk a
reas
.
Man
agem
ent i
nstru
men
ts
are
impl
emen
ted
on a
long
-te
rm b
asis
, with
ade
quat
e co
vera
ge o
f at-r
isk
area
s.
Man
agem
ent i
nstru
men
ts
are
impl
emen
ted
on a
long
-te
rm b
asis
, with
ver
y go
od
cove
rage
of a
t-ris
k ar
eas,
an
d ar
e ef
fect
ive.
Man
agem
ent i
nstru
men
ts
are
impl
emen
ted
on a
long
-te
rm b
asis
, with
exc
elle
nt
cove
rage
of a
t-ris
k ar
eas,
an
d ar
e hi
ghly
eff
ectiv
e.
3.2
Wha
t is
the
stat
us o
f man
agem
ent i
nstr
umen
ts to
sup
port
IWRM
impl
emen
tatio
n at
oth
er le
vels
?
aBa
sin
man
agem
ent
inst
rum
ents
.N
o ba
sin
leve
l m
anag
emen
t in
stru
men
ts b
eing
im
plem
ente
d.
Use
of b
asin
leve
l m
anag
emen
t in
stru
men
ts is
lim
ited
and
only
th
roug
h sh
ort-t
erm
/ a
d ho
c pr
ojec
ts.
Som
e ba
sin
leve
l m
anag
emen
t in
stru
men
ts
impl
emen
ted
on
a m
ore
long
-term
ba
sis,
but
with
lim
ited
geog
raph
ic
and
stak
ehol
der
cove
rage
.
Basi
n le
vel m
anag
emen
t in
stru
men
ts im
plem
ente
d on
a
mor
e lo
ng-te
rm b
asis
, with
ad
equa
te g
eogr
aphi
c an
d st
akeh
olde
r cov
erag
e.
Basi
n le
vel m
anag
emen
t in
stru
men
ts im
plem
ente
d on
a m
ore
long
-term
bas
is,
with
eff
ectiv
e ou
tcom
es a
nd
very
goo
d ge
ogra
phic
and
st
akeh
olde
r cov
erag
e.
Basi
n le
vel m
anag
emen
t in
stru
men
ts im
plem
ente
d on
a
mor
e lo
ng-te
rm b
asis
, with
hi
ghly
eff
ectiv
e ou
tcom
es
and
exce
llent
geo
grap
hic
and
stak
ehol
der c
over
age.
bA
quife
r m
anag
emen
t in
stru
men
ts.
No
aqui
fer l
evel
m
anag
emen
t in
stru
men
ts b
eing
im
plem
ente
d.
Use
of a
quife
r le
vel m
anag
emen
t in
stru
men
ts is
lim
ited
and
only
th
roug
h sh
ort-t
erm
/ a
d ho
c pr
ojec
ts.
Som
e aq
uife
r le
vel m
anag
emen
t in
stru
men
ts
impl
emen
ted
on
a m
ore
long
-term
ba
sis,
but
with
lim
ited
geog
raph
ic
and
stak
ehol
der
cove
rage
.
Aqui
fer l
evel
man
agem
ent
inst
rum
ents
impl
emen
ted
on
a m
ore
long
-term
bas
is, w
ith
adeq
uate
geo
grap
hic
and
stak
ehol
der c
over
age.
Aqui
fer l
evel
man
agem
ent
inst
rum
ents
impl
emen
ted
on a
mor
e lo
ng-te
rm b
asis
, w
ith e
ffec
tive
outc
omes
and
ve
ry g
ood
geog
raph
ic a
nd
stak
ehol
der c
over
age.
Aqui
fer l
evel
man
agem
ent
inst
rum
ents
impl
emen
ted
on
a m
ore
long
-term
bas
is, w
ith
high
ly e
ffec
tive
outc
omes
an
d ex
celle
nt g
eogr
aphi
c an
d st
akeh
olde
r cov
erag
e.
cDa
ta a
nd
info
rmat
ion
shar
ing
with
in c
ount
ries
at
all l
evel
s
No
data
and
in
form
atio
n sh
arin
g.Li
mite
d da
ta a
nd
info
rmat
ion
shar
ing
on a
n ad
hoc
bas
is.
Data
and
in
form
atio
n sh
arin
g ar
rang
emen
ts
exis
t on
a m
ore
long
-term
bas
is
betw
een
maj
or d
ata
prov
ider
s an
d us
ers.
Data
and
info
rmat
ion
shar
ing
arra
ngem
ents
im
plem
ente
d on
a m
ore
long
-term
bas
is, w
ith
adeq
uate
cov
erag
e ac
ross
se
ctor
s an
d th
e co
untr
y.
Data
and
info
rmat
ion
shar
ing
arra
ngem
ents
im
plem
ente
d on
a m
ore
long
-term
bas
is, w
ith v
ery
good
cov
erag
e ac
ross
se
ctor
s an
d th
e co
untr
y.
All
rele
vant
dat
a an
d in
form
atio
n ar
e on
line
and
free
ly a
cces
sibl
e to
all.

A-9ANNEXES
3. M
AN
AG
EMEN
T IN
STR
UM
ENTS
Degr
ee o
f im
plem
enta
tion
(0 –
100
)
Very
low
(0)
Low
(20)
Med
ium
-low
(40)
Med
ium
-hig
h (6
0)H
igh
(80)
Very
hig
h (1
00)
dTr
ansb
ound
ary
data
and
in
form
atio
n sh
arin
g be
twee
n co
untr
ies
No
data
and
in
form
atio
n sh
arin
g.Li
mite
d da
ta a
nd
info
rmat
ion
shar
ing
on a
n ad
hoc
or
info
rmal
bas
is.
Data
and
in
form
atio
n sh
arin
g ar
rang
emen
ts
exis
t, bu
t sha
ring
is
limite
d.
Data
and
info
rmat
ion
shar
ing
arra
ngem
ents
im
plem
ente
d ad
equa
tely.
Data
and
info
rmat
ion
shar
ing
arra
ngem
ents
im
plem
ente
d ef
fect
ivel
y.
All r
elev
ant d
ata
and
info
rmat
ion
are
onlin
e an
d ac
cess
ible
bet
wee
n co
untr
ies.
4. F
INA
NC
ING
De
gree
of i
mpl
emen
tatio
n (0
– 1
00)
Very
low
(0)
Low
(20)
Med
ium
-low
(40)
Med
ium
-hig
h (6
0)H
igh
(80)
Very
hig
h (1
00)
4.1
Wha
t is
the
stat
us o
f fina
ncin
g fo
r wat
er re
sour
ces
deve
lopm
ent a
nd m
anag
emen
t at t
he n
atio
nal l
evel
?
aN
atio
nal b
udge
t fo
r inv
estm
ent
incl
udin
g w
ater
re
sour
ces
infr
astr
uctu
re.
No
budg
et
allo
cate
d in
nat
iona
l in
vest
men
t pla
ns.
Budg
et a
lloca
ted
but o
nly
part
ly
cove
rs p
lann
ed
inve
stm
ents
.
Suffi
cien
t bu
dget
allo
cate
d fo
r pla
nned
in
vest
men
ts b
ut
insu
ffici
ent f
unds
di
sbur
sed
or m
ade
avai
labl
e.
Suffi
cien
t bud
get a
lloca
ted
and
fund
s di
sbur
sed
for
all p
lann
ed p
rogr
amm
es
or p
roje
cts.
Fund
ing
avai
labl
e an
d al
l pl
anne
d pr
ojec
ts u
nder
im
plem
enta
tion.
Plan
ned
prog
ram
mes
co
mpl
eted
, pos
t-eva
luat
ion
carr
ied
out a
nd n
ew fu
ndin
g cy
cle
for p
rogr
amm
es
unde
rway
.
bN
atio
nal b
udge
t fo
r the
recu
rren
t co
sts
of th
e IW
RM e
lem
ents
No
budg
et
allo
catio
ns m
ade
for r
ecur
rent
co
sts
of th
e IW
RM e
lem
ents
.
Allo
catio
ns m
ade
for o
nly
a fe
w o
f th
e el
emen
ts a
nd
impl
emen
tatio
n at
an
ear
ly s
tage
.
Allo
catio
ns m
ade
for a
t lea
st h
alf
of th
e el
emen
ts
but i
nsuf
ficie
nt
for o
ther
s.
Allo
catio
ns fo
r mos
t of
the
elem
ents
and
som
e im
plem
enta
tion
unde
r way
.
Allo
catio
ns in
clud
e al
l ele
men
ts a
nd
impl
emen
tatio
n re
gula
rly
carr
ied
out.
Plan
ned
budg
et a
lloca
tions
fo
r all
elem
ents
of t
he IW
RM
appr
oach
fully
util
ized
.
4.2
Wha
t is
the
stat
us o
f fina
ncin
g fo
r wat
er re
sour
ces
deve
lopm
ent a
nd m
anag
emen
t at o
ther
leve
ls?
aSu
bnat
iona
l or
basi
n bu
dget
s fo
r inv
estm
ent
incl
udin
g w
ater
re
sour
ces
infr
astr
uctu
re.
No
budg
et a
lloca
ted
In s
ubna
tiona
l or
basi
n in
vest
men
t pl
ans.
Budg
et a
lloca
ted
but o
nly
part
ly
cove
rs p
lann
ed
inve
stm
ents
.
Suffi
cien
t bu
dget
allo
cate
d fo
r pla
nned
in
vest
men
ts b
ut
insu
ffici
ent f
unds
di
sbur
sed
or
mad
e av
aila
ble.
Suffi
cien
t bud
get a
lloca
ted
and
fund
s di
sbur
sed
for a
ll pl
anne
d pr
ogra
mm
es o
r pr
ojec
ts.
Fund
ing
avai
labl
e an
d al
l pl
anne
d pr
ojec
ts u
nder
im
plem
enta
tion.
Budg
et fu
lly u
tiliz
ed,
prog
ram
mes
com
plet
ed a
s pl
anne
d an
d po
st e
valu
atio
n ca
rrie
d ou
t.

A-10 Progress on integrated water resources management 2018
4. F
INA
NC
ING
De
gree
of i
mpl
emen
tatio
n (0
– 1
00)
Very
low
(0)
Low
(20)
Med
ium
-low
(40)
Med
ium
-hig
h (6
0)H
igh
(80)
Very
hig
h (1
00)
bRe
venu
es ra
ised
fro
m d
edic
ated
le
vies
on
wat
er
user
s at
bas
in,
aqui
fer o
r su
bnat
iona
l lev
els.
No
reve
nues
rais
ed
at th
e su
bnat
iona
l le
vel.
Proc
esse
s in
pl
ace
to ra
ise
loca
l re
venu
e bu
t not
yet
im
plem
ente
d.
Lim
ited
reve
nues
ra
ised
from
ch
arge
s, b
ut a
re
not u
sed
for I
WRM
ac
tiviti
es.
Lim
ited
reve
nues
rais
ed
from
cha
rges
cov
er s
ome
IWRM
act
iviti
es.
Reve
nues
rais
ed fr
om
char
ges
cove
r mos
t IW
RM
activ
ities
.
Loca
l aut
horit
ies
rais
e fu
nds
from
mul
tiple
so
urce
s an
d fu
lly c
over
co
sts
of IW
RM a
ctiv
ities
.
cFi
nanc
ing
for
tran
sbou
ndar
y co
oper
atio
n
No
spec
ific
fund
ing
allo
cate
d fro
m th
e M
S bu
dget
s no
r fro
m o
ther
regu
lar
sour
ces.
MS
agre
emen
t on
cou
ntry
sha
re
of c
ontri
butio
ns
in p
lace
and
in-
kind
sup
port
for
the
coop
erat
ion
orga
niza
tion
/ ar
rang
emen
t.
Fund
ing
less
th
an 5
0% o
f tha
t ex
pect
ed a
s co
ntrib
utio
ns a
nd b
y re
gula
tion.
Fund
ing
less
than
75%
of
that
exp
ecte
d as
co
ntrib
utio
ns a
nd b
y re
gula
tion.
Fund
ing
mor
e th
an
75%
of t
hat e
xpec
ted
as c
ontri
butio
ns a
nd b
y re
gula
tion.
Full
fund
ing
of th
at
expe
cted
as
cont
ribut
ions
an
d by
regu
latio
n.

A-11ANNEXES
B. GLOBAL DISTRIBUTION OF IWRM IMPLEMENTATION BY QUESTION
4%
3%
10%
16%
16%
11%
12%
2%
8%
2%
3%
15%
17%
5%
23%
32%
12%
7%
5%
3%
4%
4%
8%
4%
8%
17%
4%
10%
3%
4%
4%
8%
19%
19%
24%
6%
7%
12%
1%
17%
22%
19%
22%
30%
13%
20%
22%
16%
24%
23%
15%
13%
25%
21%
22%
24%
12%
21%
23%
13%
33%
16%
13%
21%
9%
18%
17%
17%
22%
18%
28%
24%
17%
16%
10%
21%
44%
38%
38%
17%
26%
34%
36%
33%
19%
25%
22%
28%
22%
17%
14%
12%
33%
31%
27%
20%
15%
26%
19%
25%
36%
19%
28%
23%
25%
13%
11%
32%
28%
30%
35%
32%
35%
39%
25%
30%
17%
24%
30%
35%
38%
38%
24%
20%
22%
29%
17%
29%
26%
26%
41%
30%
20%
25%
24%
23%
31%
8%
22%
24%
22%
22%
27%
19%
19%
19%
23%
17%
24%
16%
9%
27%
4%
30%
30%
23%
18%
19%
15%
19%
23%
24%
19%
22%
23%
25%
24%
18%
12%
18%
8%
25%
10%
16%
15%
15%
21%
16%
22%
8%
14%
8%
21%
28%
15%
19%
15%
18%
34%
27%
23%
7%
13%
11%
22%
9%
4%
24%
22%
14%
20%
13%
29%
21%
25%
15%
22%
16%
15%
18%
15%
19%
20%
16%
11%
13%
11%
6%
12%
9%
12%
8%
15%
0% 20% 40% 60% 80% 100%
National policy (1.1.a.)National laws (1.1.b)
National IWRM plans (1.1.c)Subnational policies (1.2.a)
Basin/aquifer management plans (1.2.b )Transboundary arrangements (1.2.c)
Provincial laws in federated countries (1.2.d)Section 1: Policies, laws, plans (average)
1.1 National level1.2 Other levels
National institutions (2.1.a)Cross-sector coordination (2.1.b)
Public participation - national (2.1.c)Private sector participation (2.1.d)
Gender objectives - national (2.1.e)National capacity building (2.1.f)Basin/aquifer institutions (2.2.a )Public participation - local (2.2.b)
Gender objectives - sub-national (2.2.c)Gender objectives - transboundary (2.2.d)
Transboundary institutions (2.2.e)Provincial institutions in federated countries (2.2.f)
2. Institutions & Participation (average)2.1 National level
2.2 Other levels National availability monitoring (3.1.a)
Sustainable and efficient use management (3.1.b)Pollution control (3.1.c)
Ecosystem management (3.1d)Disaster risk reduction (3.1.d)
Basin management instruments (3.2.a)Aquifer management instruments (3.2.b)
Data sharing (in country) (3.2.c)Transboundary data sharing (3.2.d)
Section 3. Management instruments (average)Section 3.1 National level average
Section 3.2 Other levels averageNational budget for investment (4.1.a)
Budget for recurrent costs (4.1.b)Sub-national budget for investment (4.2.a)
Revenues raised from users (4.2.b)Transboundary financing (4.2.c)
Section 4: Financing averageSection 4.1 national level average
Section 4.2 Other levels averageOverall IWRM Score
IWRM Implementation
Overall IWRM
Very low Low Medium-low Medium-high High Very high
AVE. SCORE PERCENTAGE OF COUNTRIES PER IMPLEMENTATION CATEGORY
46
42
57
35
50
56
52
42
45
49
56
59
56
51
56
62
55
55
63
58
47
53
39
42
40
40
41
53
46
32
41
51
48
52
49
53
46
52
58
49
55
43
48
53
42
49
20%
15%
13%
13%
22%
8%
11%
9%
3%
6%
11%
7%
8%
5%
8%
11%
12%
5%
12%
9%
9%
7%
8%
8%
8%
5%
6%
4%
2%
5%
4%
4%
8%
5%
3%
5%
3%
5%
4%
2%
4%
11%
5%
4%
5%
4%

A-12 Progress on integrated water resources management 2018
C. NATIONAL 6.5.1 DATA: IWRM IMPLEMENTATION
IWRM implementation categories and score thresholds
Very low Low Medium-low Medium-high High Very high
0 - 10 11 - 30 31 - 50 51 - 70 71 - 90 91 - 100
66 See Annex G – Quality Control Process, especially point 7 and footnotes.
Scores based on 33 questions across four sections (see Annex A). For full results for each question for each country, see http://iwrmdataportal.unepdhi.org
A number of measures have been implemented to address objectivity, transparency, and comparability of the survey results (see section 2.2 of the main report). However, it is acknowledged that there is still an element of subjectivity in the country responses, particularly in countries where multi-stakeholder processes were less extensive. Ultimately, while results are indicative and country-driven,66 the self-assessed
country reporting is designed to be useful to the countries to furthering IWRM implementation. Therefore, rather than comparing scores between countries, the more important issue is what countries do with the information, and how IWRM implementation is advanced over time. At the national level, the surveys can be used as a relatively simple diagnostic tool to identify areas of relatively low or high IWRM implementation. Globally, while it is acknowledged that there may be some deviation (or subjectivity) in individual data points (country scores), a useful pattern still emerges from 172 data points on the global status of IWRM implementation.
Country ISO codes
Final IWRM Score
Section 1 Section 2 Section 3 Section 4
Average Average Average Average
Enabling environment
Institutions and participation
Management instruments Financing
Afghanistan AFG 12 23 12 9 2
Albania ALB 43 40 65 51 16
Algeria DZA 48 40 42 51 60
Andorra AND 36 23 41 43 35
Angola AGO 37 45 38 38 28
Antigua and Barbuda ATG 30 32 33 40 15
Argentina ARG 38 39 48 34 32
Armenia ARM 36 42 40 28 34
Australia AUS 86 83 88 88 83
Austria AUT 91 100 95 100 70
Azerbaijan AZE 66 55 59 72 78
Bahamas BHS 33 34 31 36 33
Bahrain BHR 40 28 48 43 40
Bangladesh BGD 50 50 49 56 45
Barbados BRB 42 30 48 59 30
Belarus BLR 38 36 35 58 24
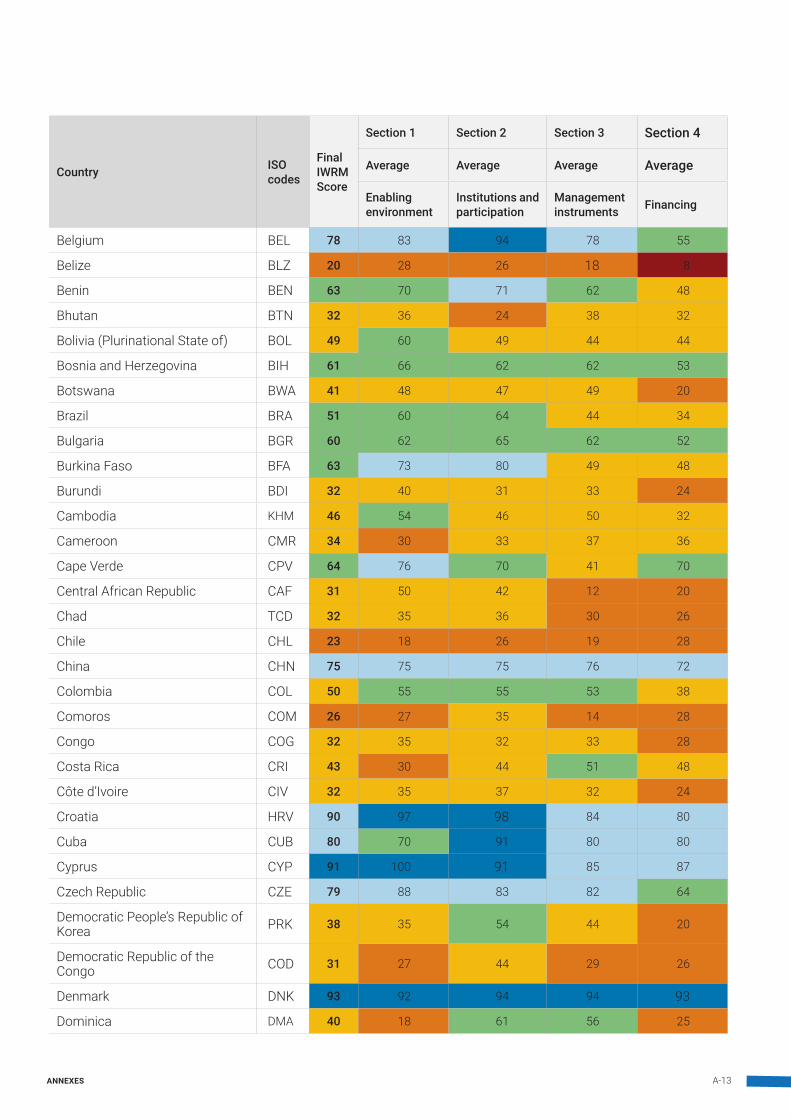
A-13ANNEXES
Country ISO codes
Final IWRM Score
Section 1 Section 2 Section 3 Section 4
Average Average Average Average
Enabling environment
Institutions and participation
Management instruments Financing
Belgium BEL 78 83 94 78 55
Belize BLZ 20 28 26 18 8
Benin BEN 63 70 71 62 48
Bhutan BTN 32 36 24 38 32
Bolivia (Plurinational State of) BOL 49 60 49 44 44
Bosnia and Herzegovina BIH 61 66 62 62 53
Botswana BWA 41 48 47 49 20
Brazil BRA 51 60 64 44 34
Bulgaria BGR 60 62 65 62 52
Burkina Faso BFA 63 73 80 49 48
Burundi BDI 32 40 31 33 24
Cambodia KHM 46 54 46 50 32
Cameroon CMR 34 30 33 37 36
Cape Verde CPV 64 76 70 41 70
Central African Republic CAF 31 50 42 12 20
Chad TCD 32 35 36 30 26
Chile CHL 23 18 26 19 28
China CHN 75 75 75 76 72
Colombia COL 50 55 55 53 38
Comoros COM 26 27 35 14 28
Congo COG 32 35 32 33 28
Costa Rica CRI 43 30 44 51 48
Côte d’Ivoire CIV 32 35 37 32 24
Croatia HRV 90 97 98 84 80
Cuba CUB 80 70 91 80 80
Cyprus CYP 91 100 91 85 87
Czech Republic CZE 79 88 83 82 64
Democratic People’s Republic of Korea PRK 38 35 54 44 20
Democratic Republic of the Congo COD 31 27 44 29 26
Denmark DNK 93 92 94 94 93
Dominica DMA 40 18 61 56 25
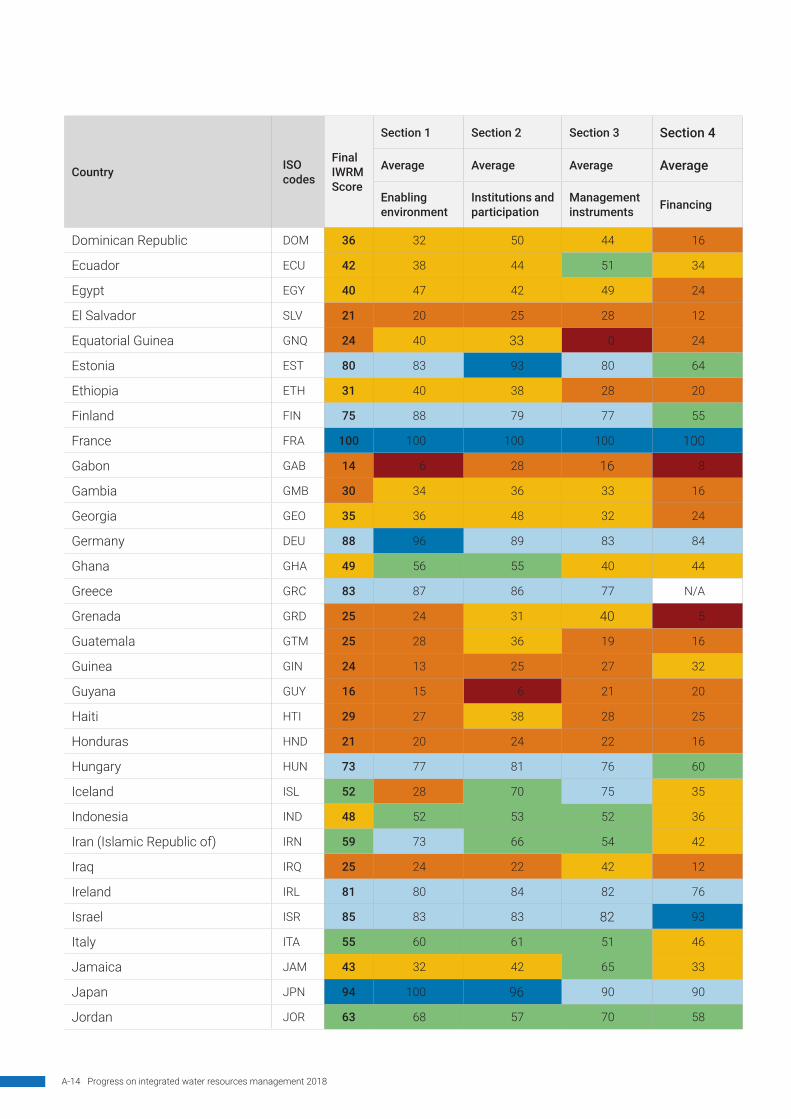
A-14 Progress on integrated water resources management 2018
Country ISO codes
Final IWRM Score
Section 1 Section 2 Section 3 Section 4
Average Average Average Average
Enabling environment
Institutions and participation
Management instruments Financing
Dominican Republic DOM 36 32 50 44 16
Ecuador ECU 42 38 44 51 34
Egypt EGY 40 47 42 49 24
El Salvador SLV 21 20 25 28 12
Equatorial Guinea GNQ 24 40 33 0 24
Estonia EST 80 83 93 80 64
Ethiopia ETH 31 40 38 28 20
Finland FIN 75 88 79 77 55
France FRA 100 100 100 100 100
Gabon GAB 14 6 28 16 8
Gambia GMB 30 34 36 33 16
Georgia GEO 35 36 48 32 24
Germany DEU 88 96 89 83 84
Ghana GHA 49 56 55 40 44
Greece GRC 83 87 86 77 N/A
Grenada GRD 25 24 31 40 5
Guatemala GTM 25 28 36 19 16
Guinea GIN 24 13 25 27 32
Guyana GUY 16 15 6 21 20
Haiti HTI 29 27 38 28 25
Honduras HND 21 20 24 22 16
Hungary HUN 73 77 81 76 60
Iceland ISL 52 28 70 75 35
Indonesia IND 48 52 53 52 36
Iran (Islamic Republic of) IRN 59 73 66 54 42
Iraq IRQ 25 24 22 42 12
Ireland IRL 81 80 84 82 76
Israel ISR 85 83 83 82 93
Italy ITA 55 60 61 51 46
Jamaica JAM 43 32 42 65 33
Japan JPN 94 100 96 90 90
Jordan JOR 63 68 57 70 58
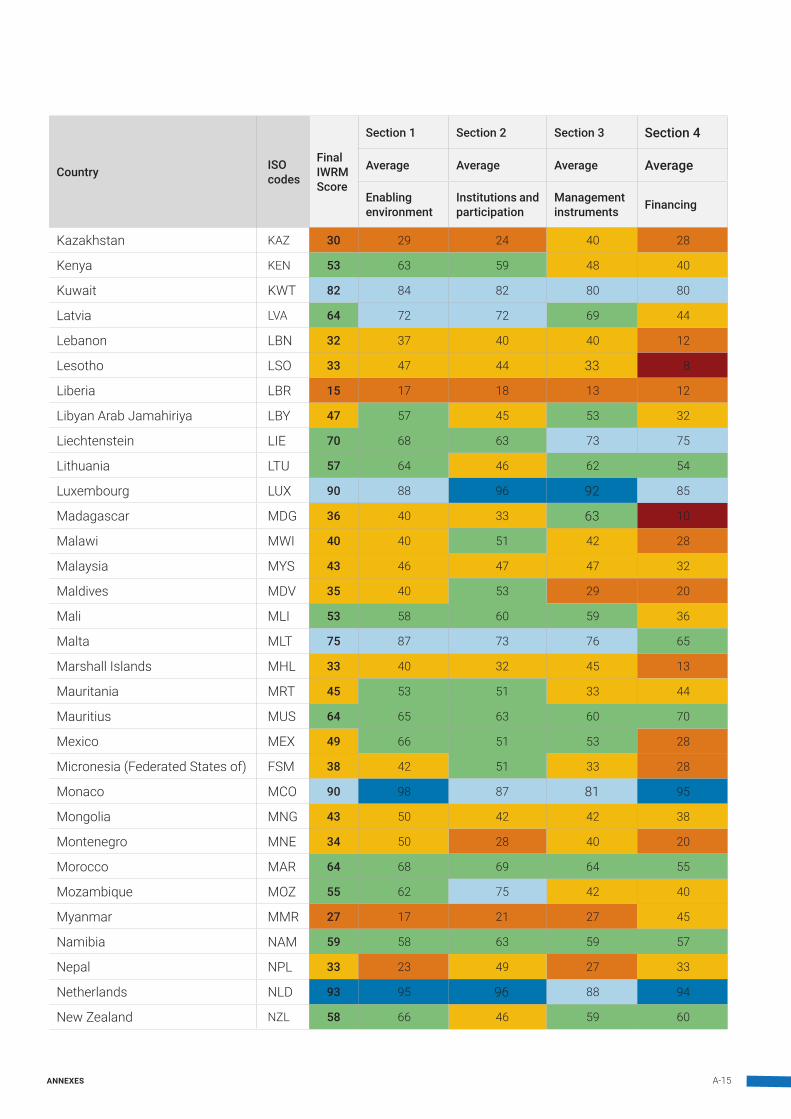
A-15ANNEXES
Country ISO codes
Final IWRM Score
Section 1 Section 2 Section 3 Section 4
Average Average Average Average
Enabling environment
Institutions and participation
Management instruments Financing
Kazakhstan KAZ 30 29 24 40 28
Kenya KEN 53 63 59 48 40
Kuwait KWT 82 84 82 80 80
Latvia LVA 64 72 72 69 44
Lebanon LBN 32 37 40 40 12
Lesotho LSO 33 47 44 33 8
Liberia LBR 15 17 18 13 12
Libyan Arab Jamahiriya LBY 47 57 45 53 32
Liechtenstein LIE 70 68 63 73 75
Lithuania LTU 57 64 46 62 54
Luxembourg LUX 90 88 96 92 85
Madagascar MDG 36 40 33 63 10
Malawi MWI 40 40 51 42 28
Malaysia MYS 43 46 47 47 32
Maldives MDV 35 40 53 29 20
Mali MLI 53 58 60 59 36
Malta MLT 75 87 73 76 65
Marshall Islands MHL 33 40 32 45 13
Mauritania MRT 45 53 51 33 44
Mauritius MUS 64 65 63 60 70
Mexico MEX 49 66 51 53 28
Micronesia (Federated States of) FSM 38 42 51 33 28
Monaco MCO 90 98 87 81 95
Mongolia MNG 43 50 42 42 38
Montenegro MNE 34 50 28 40 20
Morocco MAR 64 68 69 64 55
Mozambique MOZ 55 62 75 42 40
Myanmar MMR 27 17 21 27 45
Namibia NAM 59 58 63 59 57
Nepal NPL 33 23 49 27 33
Netherlands NLD 93 95 96 88 94
New Zealand NZL 58 66 46 59 60

A-16 Progress on integrated water resources management 2018
Country ISO codes
Final IWRM Score
Section 1 Section 2 Section 3 Section 4
Average Average Average Average
Enabling environment
Institutions and participation
Management instruments Financing
Niger NER 50 40 64 51 44
Nigeria NGA 35 34 38 34 34
Norway NOR 63 58 65 64 66
Oman OMN 33 33 18 57 24
Pakistan PAK 50 67 51 41 40
Panama PAN 37 30 35 42 40
Papua New Guinea PNG 25 27 23 20 30
Paraguay PRY 32 33 36 38 20
Peru PER 30 34 26 34 24
Philippines PHL 51 64 53 52 37
Poland POL 40 50 40 40 28
Portugal PRT 74 76 83 78 60
Qatar QAT 82 55 100 89 85
Republic of Korea KOR 68 44 70 80 78
Republic of Moldova MDA 32 43 33 31 20
Romania ROU 72 96 65 84 44
Russian Federation RUS 79 86 70 84 76
Rwanda RWA 35 47 31 33 28
Saint Kitts and Nevis KNA 22 15 20 33 20
Saint Lucia LCA 40 30 64 44 23
Samoa WSM 70 73 69 70 68
San Marino SMR 66 67 60 68 70
Sao Tome and Principe STP 23 24 22 25 20
Saudi Arabia SAU 57 42 68 71 46
Senegal SEN 53 60 66 49 38
Serbia SRB 30 33 25 37 24
Seychelles SYC 45 43 55 58 25
Sierra Leone SLE 19 20 25 20 10
Singapore SGP 100 100 100 100 100
Slovakia SVK 66 68 76 66 54
Slovenia SVN 58 58 55 62 56
Solomon Islands SLB 26 25 28 30 20
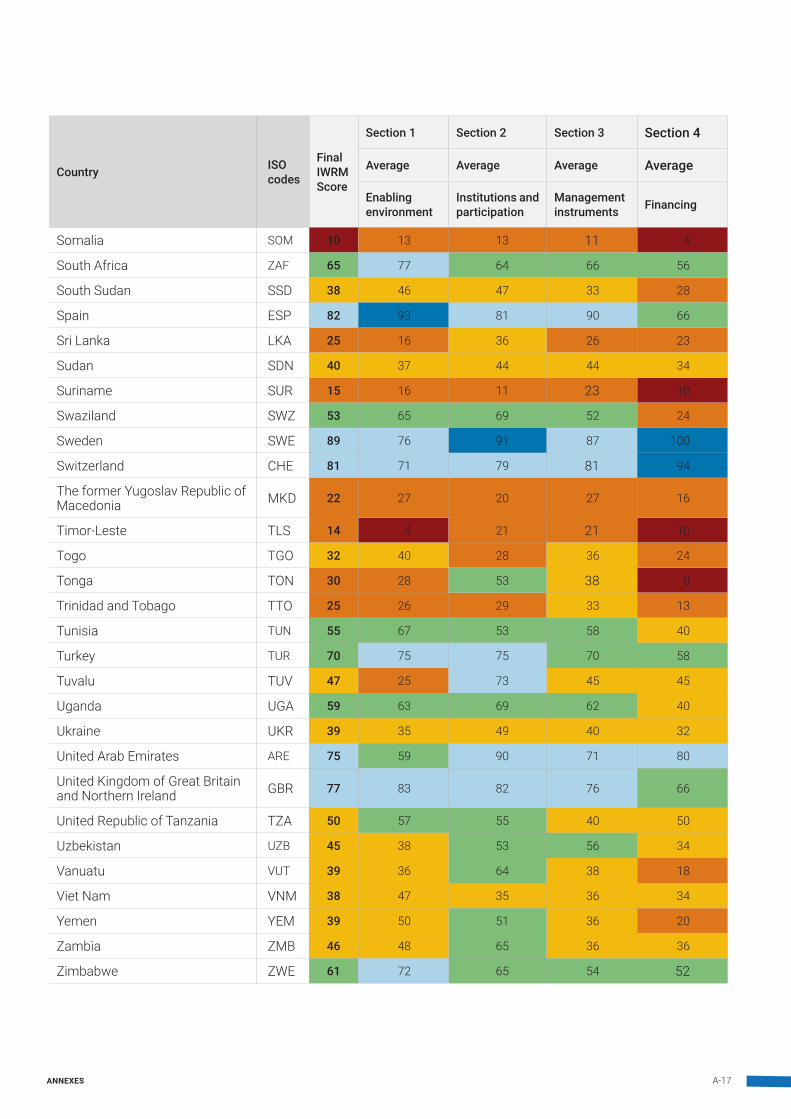
A-17ANNEXES
Country ISO codes
Final IWRM Score
Section 1 Section 2 Section 3 Section 4
Average Average Average Average
Enabling environment
Institutions and participation
Management instruments Financing
Somalia SOM 10 13 13 11 4
South Africa ZAF 65 77 64 66 56
South Sudan SSD 38 46 47 33 28
Spain ESP 82 93 81 90 66
Sri Lanka LKA 25 16 36 26 23
Sudan SDN 40 37 44 44 34
Suriname SUR 15 16 11 23 10
Swaziland SWZ 53 65 69 52 24
Sweden SWE 89 76 91 87 100
Switzerland CHE 81 71 79 81 94
The former Yugoslav Republic of Macedonia MKD 22 27 20 27 16
Timor-Leste TLS 14 4 21 21 10
Togo TGO 32 40 28 36 24
Tonga TON 30 28 53 38 0
Trinidad and Tobago TTO 25 26 29 33 13
Tunisia TUN 55 67 53 58 40
Turkey TUR 70 75 75 70 58
Tuvalu TUV 47 25 73 45 45
Uganda UGA 59 63 69 62 40
Ukraine UKR 39 35 49 40 32
United Arab Emirates ARE 75 59 90 71 80
United Kingdom of Great Britain and Northern Ireland GBR 77 83 82 76 66
United Republic of Tanzania TZA 50 57 55 40 50
Uzbekistan UZB 45 38 53 56 34
Vanuatu VUT 39 36 64 38 18
Viet Nam VNM 38 47 35 36 34
Yemen YEM 39 50 51 36 20
Zambia ZMB 46 48 65 36 36
Zimbabwe ZWE 61 72 65 54 52

A-18 Progress on integrated water resources management 2018
D. DATA COVERAGE AND BREAKDOWNS
A total of 172 countries (89 per cent) reported on the baseline for SDG indicator 6.5.1 (as described in Section 2.3 of the main report). The 21 countries that did not report, or submitted incomplete reports, are listed below.
Incomplete submission No submission
Brunei Darussalam Canada Lao People’s Democratic Republic Thailand
Djibouti Eritrea Nauru Turkmenistan
Kiribati Fiji Nicaragua Uruguay
Tajikistan Guinea-Bissau Palau Venezuela (Bolivarian Republic of)
United States of America India Saint Vincent and the Grenadines
Kyrgyzstan Syrian Arab Republic
The countries listed above are from a range of regions, sizes, and levels of development (see also figure below). As such, their omission from the baseline reporting is not expected to have significant impacts on the global findings in this report. A number of these countries started completing the survey. Reasons provided by countries for not completing the survey include: lack of capacity (e.g. Guinea-Bissau, Venezuela),
that the indicator was not high priority (e.g. Kyrgyzstan), or simply running out of time (e.g. Fiji, Uruguay), for reporting on indicator 6.5.1. Some federated countries (e.g. India, Canada, and USA) reported challenges to filling out the survey, including the complex arrangements required for data collection and reporting and lack of assigned responsible entity for reporting.
Country representation by HDI group (number of countries in bar labels, percentage of countries along x-axis)
13
10
8
43
41
23
24
6
2
2
1
1
6
5
3
1
0% 20% 40% 60% 80% 100%
Very high
High
Medium
Low
No ranking available
HDI
Gro
up
Response completed (w. stakeholder workshop) Response completed Incomplete response No data

A-19ANNEXES
E. DEVELOPMENT OF THE 6.5.1 INDICATOR METHODOLOGY
E.1 METHODOLOGY DEVELOPMENT TO DATE
While this is a “new” indicator for the SDG period, the development of the methodology has a long history. The approach builds on global status reporting on the application of integrated approaches to water resources management in 2008 and 2012.67 The 2008 report covered 104 countries, and the 2012 report covered 133 countries,68 showing high levels of engagement from countries, and providing extensive experience on the monitoring approach.
The main considerations for developing the indicator 6.5.1 methodology, were to:
y Create a single indicator score: all SDG indicators were required to have a single indicator value, to be able to track progress against the targets. This contrasted with reporting in 2008 and 2012, which reported on various aspects of integrated water resources management, but made no attempt to aggregate them to a single score.
y Balance between level of detail and reducing reporting burden on countries: acknowledging that countries would be reporting on 169 targets, efforts were made to reduce the number of questions in the survey (from over 100 in 2012 to 33 in 2017), whilst still capturing the main elements of IWRM.
y Improve objectivity, transparency and comparability in responses: this was addressed in four main ways:
y Introduction of threshold descriptions: in the 2012 survey, there were five possible common responses to each question, with the following thresholds: Under development; Developed but implementation not yet started; Implementation started; Implementation advanced; Fully implemented. In the 6.5.1 survey, unique and detailed descriptions were provided for six thresholds for each question.
y Increasing the number of possible responses: from five in 2012 to eleven in 2017, with possible scores of zero to 100 in increments of 10 (and threshold descriptions for the scores of 0, 20, 40, 60, 80 and 100). The greater number of gradations of implementation allows countries to better track progress over time.
67 These reports were prepared at the request of the UN Commission on Sustainable Development: UN-Water 2008. Status Report on Integrated Water Resources Management and Water Efficiency Plans. Prepared for the 16th session of the Commission on Sus tainable Development. UNEP 2012. The UN-Water Status Report on the Application of Integrated Approaches to Water Resources Management.
68 Compared to 172 countries in 2017/18 for the SDG baseline. 69 The 2017 6.5.1 survey and step-by-step methodology can be downloaded from the IWRM data portal http://iwrmdataportal.unepdhi.org
y Introduction of free-text fields for each question: countries were encouraged to provide justification or evidence for the scores provided for each question.
y Encouraging multi-stakeholder reporting processes (see Annex F).
Work on indicator development began in August 2014, with the establishment of a Task Team with representatives across UN agencies and partners. A series of drafting and review processes occurred over the next two years, with online and physical meetings. It included a workshop in November 2015, involving country representatives from Pakistan and Estonia. Pilot testing of the 6.5.1 survey was held in five countries (Jordan, the Netherlands, Peru, Senegal and Uganda), in collaboration with the UN-Water integrated monitoring initiative (GEMI). Additional feedback was received from Armenia, Indonesia and Trinidad and Tobago. The methodology was finalized in January 2017.69
E.2 FUTURE REVIEW OF METHODOLOGY
Following the baseline monitoring and reporting process, a period of review and revision is expected for both the indicator methodology and monitoring process. This is likely to include an analysis of whether the key elements of IWRM are included in the survey, any questions or thresholds that need clarifying, and making the in-country data collection processes more participatory and robust. The review will include national focal points, regional and global organizations, and the 6.5.1 indicator team and partners. Any changes to the methodology should consider impacts on comparability to this baseline assessment.

A-20 Progress on integrated water resources management 2018
F. NATIONAL WORKSHOP PROCESSES FOR DATA COLLECTION
Webinars and step-by-step indicator guidelines were available in six languages (Arabic, Chinese, English, French, Spanish, and Russian)70 to provide national focal points with the knowledge needed to coordinate national processes to produce high quality data. All national focal points were encouraged to design multi-stakeholder processes, as appropriate in the national context and as resources allowed, to fill out the survey. Multi-stakeholder processes were supported by Global Water Partnership (GWP) via their national and regional partnerships, and the UN Environment - DHI Centre, and UN Environment in 36 countries (table below). The workshops were facilitated by GWP country water partnerships, in collaboration with national Focal Points. The main criteria for selection of workshop countries was country interest in receiving such support, as well as presence of country water partnerships to facilitate the workshops.71 72
Brief workshop reports were submitted from 31 countries, following a common template.73 The workshop reports included: the completed country questionnaires and final 6.5.1 score (one per country), participants covering a range of stakeholder groups, discussions and differences in views for scores for each question, any major barriers to implementation,
70 http://iwrmdataportal.unepdhi.org71 Guidance for the design of the country workshops can be downloaded here: http://iwrmdataportal.unepdhi.org 72 While Uruguay completed the workshop, the report was not submitted in time to be included in this baseline report.73 http://iwrmdataportal.unepdhi.org
and priorities for further implementation. The breakdown of participants in each workshop is available on request. To keep reporting requirements to a minimum, focal points from the remaining countries were not asked to report on the actual processes used. Nevertheless, through anecdotal evidence available from correspondence with focal points, it is estimated that the vast majority of countries at least consulted across government departments to fill out the survey. In future review of the data-collection process, it is advised that keeping a record of the country processes is considered.
A summary of focal point affiliation is provided in the below figure. Focal point contact details are available on request.
Angola Congo Malaysia Slovenia
Argentina Democratic Republic of the Congo Mauritania South Africa
Armenia El Salvador Mongolia Sudan
Bulgaria Ethiopia Mozambique Tanzania
Burundi Gambia Niger Ukraine
Cambodia Guatemala Pakistan Uruguay72
Cameroon Honduras Philippines Uzbekistan
Chile Kazakhstan Sao Tome and Principe Zambia
China Malawi Slovakia Zimbabwe
74%2%
5%
10%
9%
IWRM Focal Point affiliation
Ministry of natural resurces,agriculture, water or similar
Ministry of foreign affairs
National Satistical Office
Designated (government) agency
Other

A-21ANNEXES
G. QUALITY CONTROL PROCESS FOR DATA COLLECTION
Quality Assurance steps undertaken for SDG indicator 6.5.1 country submissions
1. Focal point: Cross-check if the person submitting is the formal national focal point as nominated or confirmed by country. Submission from substitute is acceptable if the national focal point (FP) is included in CC.
2. Question responses: Check that: a. All questions are answered – i.e. all questions
should be answered (either with a score or n/a). Acceptable corrections include: a) for questions for ‘federal countries’ only (1.2d and 2.2f), and if not a federal country, can correct from blank to n/a; b) for transboundary questions, if country is an island state, can correct from blank to n/a. Always send no-objection email to country to notify of manual adjustments made.
b. Scores are in range from 0-100, in increments of 10. If only ‘even’ scores (e.g. 0, 20, 40 etc.) are given verify that FP has understood the guidelines that ‘odd’ scores (10, 30, 50 etc.) are also possible.
c. Check that n/a (not applicable) is used appropriately. i.e. only if the question is not applicable to the country. Where N/A is given for no obvious reasons, inquire justification field (e.g. if N/A response added to gender-related questions). Update the justification or change to 0, or a score, as appropriate in dialogue with FP.
3. Justification/evidence fields: a. Check that the free text responses are appropriate
explanations in the context of the score (and vice versa). In case of significant discrepancies, consider asking the country to revise either the score or the free text.
b. Special attention should be given to responses scored as N/A, 0 or 100, where countries should be encouraged to provide justification at all times.
4. Calculations: Check that section averages are calculated correctly, and that the final score is calculated correctly. Acceptable manual corrections include adjustments to section average scores, that do not affect the final score (always no objection notification to countries). For larger deviations and adjustments in final score, suggest countries make corrections and re-submit.
74 In some cases, for example where insufficient justification was given for a score of 100 or ‘n/a’, and the Focal Point was asked to reconsider the response, there was either no response, or they declined to revise their response. In these cases, the original responses were still accepted and included in this report, as the benefits of including the results in the baseline reporting were deemed to outweigh any disadvantages of excluding the results.
75 After data submission and drafting of this report, some reviewers have asked whether the quality control process could be made more rigorous, including cross-checking of certain responses. This may be considered in a review of the data-collection process, though the best way of ensuring more robust or realistic responses is to encourage countries to engage in a multi-stakeholder process to review and finalize their country responses. Countries that did this in baseline reporting reported that initial draft responses were often revised to the satisfaction of the majority of stakeholders.
5. General comparison with the national 2011 global IWRM survey response: Flag major deviations and discuss with team as necessary, if final scores are considerably lower or higher than previous global survey results. May enquire for further justifications and verifications from countries on an ad hoc basis.
6. Transboundary issues:a. Check that countries have completed ‘transboundary
basins’ table in the introductory section. A full list of transboundary basins can be found here: http://twap-rivers.org/indicators/Report.ashx?type=IndicatorResultsSummary. Maps can be accessed via http://twap-rivers.org/indicators/ for verification on whether the basin is likely to be important for that country, or if there is only a small portion of the basin in their country (in which case acceptable that basin is not listed as one of the most important basins).
b. Check the transboundary questions: 1.2c; 2.2d; 2.2e; 3.2d; and 4.2c, and see if these make sense in the context of the country. Island states (without land borders) should score N/A for all of these questions.
7. Cross-checking / validation of country responses: a. In case of any of the above criteria not being met, a
dialogue should be initiated with the FP to address such issues.74
b. Where country responses satisfy the above criteria, the scores are to be accepted as country judgement, and should not be interrogated further.75

NOTES

NOTES

LEARN MORE ABOUT PROGRESS TOWARDS SDG 6
SDG 6 expands the MDG focus on drinking water and basic sanitation to include the more holistic management of water, wastewater and ecosystem resources, acknowledging the importance of an enabling environment. Bringing these aspects together is an initial step towards addressing sector fragmentation and enabling coherent and sustainable management. It is also a major step towards a sustainable water future.
The monitoring of progress towards SDG 6 is a means to making this happen. High-quality data help policy- and decision makers at all levels of government to identify challenges and opportunities, to set priorities for more effective and efficient implementation, to communicate progress and ensure accountability, and to generate political, public and private sector support for further investment.
In 2016–2018, following the adoption of the global indicator framework, the UN-Water Integrated Monitoring Initiative focused on establishing the global baseline for all SDG 6 global indicators, which is essential for effective follow-up and review of progress towards SDG 6. Below is an overview of the resultant indicator reports produced in 2017–2018. UN-Water has also produced the SDG 6 Synthesis Report 2018 on Water and Sanitation, which, building on baseline data, addresses the cross-cutting nature of water and sanitation and the many interlinkages within SDG 6 and across the 2030 Agenda, and discusses ways to accelerate progress towards SDG 6.
Progress on Drinking Water, Sanitation and Hygiene – 2017 Update and SDG Baselines (including data on SDG indicators 6.1.1 and 6.2.1)
By WHO and UNICEF
One of the most important uses of water is for drinking and hygiene purposes. A safely managed sanitation chain is essential to protecting the health of individuals and communities and the environment. By monitoring use of drinking water and sanitation services, policy- and decision makers can find out who has access to safe water and a toilet with handwashing facilities at home, and who requires it. Learn more about the baseline situation for SDG indicators 6.1.1 and 6.2.1 here: http://www.unwater.org/publication_categories/whounicef-joint-monitoring-programme-for-water-supply-sanitation-hygiene-jmp/.
Progress on Safe Treatment and Use of Wastewater – Piloting the monitoring methodology and initial findings for SDG indicator 6.3.1
By WHO and UN-Habitat on behalf of UN-Water
Leaking latrines and raw wastewater can spread disease and provide a breeding ground for mosquitoes, as well as pollute groundwater and surface water. Learn more about wastewater monitoring and initial status findings here: http://www.unwater.org/publications/progress-on-wastewater-treatment-631.
Progress on Ambient Water Quality – Piloting the monitoring methodology and initial findings for SDG indicator 6.3.2
By UN Environment on behalf of UN-Water
Good ambient water quality ensures the continued availability of important freshwater ecosystem services and does not negatively affect human health. Untreated wastewater from domestic sources, industry and agriculture can be detrimental to ambient water quality. Regular monitoring of freshwaters allows for the timely response to potential sources of pollution and enables stricter enforcement of laws and discharge permits. Learn more about water quality monitoring and initial status findings here: http://www.unwater.org/publications/progress-on-ambient-water-quality-632.
Progress on Water-Use Efficiency – Global baseline for SDG indicator 6.4.1
By FAO on behalf of UN-Water
Freshwater is used by all sectors of society, with agriculture being the biggest user overall. The global indicator on water-use efficiency tracks to what extent a country’s economic growth is dependent on the use of water resources, and enables policy- and decision makers to target interventions at sectors with high water use and low levels of improved efficiency over time. Learn more about the baseline situation for SDG indicator 6.4.1 here: http://www.unwater.org/publications/progress-on-water-use-efficiency-641.

Progress on Level of Water Stress – Global baseline for SDG indicator 6.4.2
By FAO on behalf of UN-Water
A high level of water stress can have negative effects on economic development, increasing competition and potential conflict among users. This calls for effective supply and demand management policies. Securing environmental water requirements is essential to maintaining ecosystem health and resilience. Learn more about the baseline situation for SDG indicator 6.4.2 here http://www.unwater.org/publications/progress-on-level-of-water-stress-642.
Progress on Integrated Water Resources Management – Global baseline for SDG indicator 6.5.1
By UN Environment on behalf of UN-Water
Integrated water resources management (IWRM) is about balancing the water requirements of society, the economy and the environment. The monitoring of 6.5.1 calls for a participatory approach in which representatives from different sectors and regions are brought together to discuss and validate the questionnaire responses, paving the way for coordination and collaboration beyond monitoring. Learn more about the baseline situation for SDG indicator 6.5.1 herehttp://www.unwater.org/publications/progress-on-integrated-water-resources-management-651.
Progress on Transboundary Water Cooperation – Global baseline for SDG indicator 6.5.2
By UNECE and UNESCO on behalf of UN-Water
Most of the world’s water resources are shared between countries; where the development and management of water resources has an impact across transboundary basins, cooperation is required. Specific agreements or other arrangements between co-riparian countries are a precondition to ensuring sustainable cooperation. The methodology for SDG indicator 6.5.2 measures both transboundary river and lake basins, and transboundary aquifers. Learn more about the baseline situation for SDG indicator 6.5.2 here: http://www.unwater.org/publications/progress-on-transboundary-water-cooperation-652.
Progress on Water-related Ecosystems – Piloting the monitoring methodology and initial findings for SDG indicator 6.6.1
By UN Environment on behalf of UN-Water
Ecosystems replenish and purify water resources and need to be protected to safeguard human and environmental resilience. Ecosystem monitoring, including that of ecosystem health, highlights the need to protect and conserve ecosystems and enables policy- and decision makers to set de facto management objectives. Learn more about ecosystem monitoring and initial status findings here: http://www.unwater.org/publications/progress-on-water-related- ecosystems-661.
UN-Water Global Analysis and Assessment of Sanitation and Drinking-Water (GLAAS) 2017 report – Financing universal water, sanitation and hygiene under the Sustainable Development Goals (including data on SDG indicators 6.a.1 and 6.b.1)
By WHO on behalf of UN-Water
Human and financial resources are needed to implement SDG 6, and international cooperation is essential to making it happen. Defining the procedures for local communities to participate in water and sanitation planning, policy, law and management is vital to ensuring that the needs of everyone in the community are met, and to ensuring the long-term sustainability of water and sanitation solutions. Learn more about the monitoring of international cooperation and stakeholder participation here: http://www.unwater.org/publication_categories/glaas/.
SDG 6 Synthesis Report 2018 on Water and Sanitation
By UN-Water
This first synthesis report on SDG 6 seeks to inform discussions among Member States during the High-level Political Forum on Sustainable Development in July 2018. It is an in-depth review and includes data on the global baseline status of SDG 6, the current situation and trends at the global and regional levels, and what more needs to be done to achieve this goal by 2030. Read the report here: http://www.unwater.org/publication_categories/sdg-6-synthesis-report-2018-on-water-and-sanitation/.


UN-Water coordinates the efforts of United Nations entities and international organizations working on water and sanitation issues. By doing so, UN-Water seeks to increase the effectiveness of the support provided to Member States in their efforts towards achieving international agreements on water and sanitation. UN-Water publications draw on the experience and expertise of UN-Water’s Members and Partners.
PERIODIC REPORTS
UN-WATER REPORTS
Sustainable Development Goal 6 Synthesis Report 2018 on Water and Sanitation
The SDG 6 Synthesis Report 2018 on Water and Sanitation was published in June 2018 ahead of the High-level Political Forum on Sustainable Development, where Member States reviewed SDG 6 in depth. Representing a joint position from the United Nations family, the report offers guidance to understanding global progress on SDG 6 and its interdependencies with other goals and targets. It also provides insight into how countries can plan and act to ensure that no one is left behind when implementing the 2030 Agenda for Sustainable Development.
Sustainable Development Goal 6 Indicator Reports
This series of reports shows the progress towards targets set out in SDG 6 using the SDG global indicators. The reports are based on country data, compiled and verified by the United Nations organizations serving as custodians of each indicator. The reports show progress on drinking water, sanitation and hygiene (WHO/UNICEF Joint Monitoring Programme for Water Supply, Sanitation and Hygiene for targets 6.1 and 6.2), wastewater treatment and ambient water quality (UN Environment, UN-Habitat and WHO for target 6.3), water-use efficiency and level of water stress (FAO for target 6.4), integrated water resources management and transboundary cooperation (UN Environment, UNECE and UNESCO for target 6.5), ecosystems (UN Environment for target 6.6) and means for implementing SDG 6 (UN-Water Global Analysis and Assessment of Sanitation and Drinking-Water for targets 6.a and 6.b).
World Water Development Report
This annual report, published by UNESCO on behalf of UN-Water, represents the coherent and integrated response of the United Nations system to freshwater-related issues and emerging challenges. The theme of the report is harmonized with the theme of World Water Day (22 March) and changes annually.
Policy and Analytical Briefs
UN-Water’s Policy Briefs provide short and informative policy guidance on the most pressing freshwater-related issues, which draw upon the combined expertise of the United Nations system. Analytical Briefs provide an analysis of emerging issues and may serve as a basis for further research, discussion and future policy guidance.
UN-WATER PLANNED PUBLICATIONS 2018
• Update of UN-Water Policy Brief on Water and Climate Change
• UN-Water Policy Brief on the Water Conventions
• UN-Water Analytical Brief on Water Efficiency
More information on UN Water Reports at www.unwater.org/publications

This status report provides the SDG baseline for indicator 6.5.1 “Degree of integrated water resources management implementation”. It represents the work of 172 countries.
Decisions about how to allocate and use water are fundamental to sustainable development. They are also complex. Successful managing of water resources requires the interaction of governments, organizations and the private sector at all levels.
Target 6.5 of the Sustainable Development Goals is to, “by 2030, implement integrated water resources management at all levels, including through transboundary cooperation as appropriate”. Integrated water resources management helps to balance and support the economic, social and environmental dimensions of sustainable development.
80 per cent of countries have laid the foundations for integrated water resources management. Accelerating implementation must now be the focus.
By looking into different aspects of water resources management, this report identifies areas of progress and those which need urgent attention. It explains how countries, and the international community, can build on multi-stakeholder reporting process to prioritize actions to work towards the 2030 target.
This report was produced as part of a series of reports on SDG 6 indicators, coordinated by UN-Water through the GEMI programme.
SDG 6 website: www.sdg6monitoring.org Indicator 6.5.1 website: http://iwrmdataportal.unepdhi.org