monitoring progress in the water sector
TRANSCRIPT

1
UN-Water Task Force on Indicators, Monitoring and Reporting
Monitoring progress in the water sector: A selected set of indicators
ANNEXES: Indicators in use
2
Table of contents
1. Introduction...........................................................................................................................4
2. A snapshot of the water sector using the UN-Water set of key indicators ......................5 2.1 Population growth: water competition or water crowding?...................................................................... 6 2.2 Climate: variability and vulnerability? ....................................................................................................... 8 2.3 Changing realities of water uses................................................................................................................. 10 2.4 Intensity of water use .................................................................................................................................. 12 2.5 The intensity of direct usages of on-stream water services: the example of fisheries............................ 13 2.6 Trade and food production......................................................................................................................... 14 2.7 Water services to society ............................................................................................................................. 15 2.8 Water services to the economy ................................................................................................................... 17 2.9 Freshwater quality....................................................................................................................................... 19 2.10 Water services at risk: functioning and health of key water systems ..................................................... 21 2.11 Mapping the governance of the water sector at global, regional and national levels – first elements .22
3. Annex B –Indicators Methodology Sheets........................................................................27 The annexes with country data on the indicators, governance information and the list of global information systems are available in Excel format and are not included in this document. All references are listed in the main document.

3
List of Figures
Figure 1. Actual renewable water resources per capita................................................................................................ 7 Figure 2. Annual Precip[itation trends, 1900-2000.................................................................................................... 18 Figure 32. Large storage capacity compared to total surface water in countries with higher risk ............................... 9 Figure 3. Natural storage underground – groundwater ................................................................................................ 9 Figure 5. Sources of water use globally and for major sectors, 2000 ........................................................................ 10 Figure 6. Total water withdrawals and major sectors of water use ............................................................................ 11 Figure 7. Percentage of sectoral uses in the world..................................................................................................... 11 Figure 8. The proportion of renewable water resources withdrawn (MDG water indicator). .................................... 12 Figure 9. Global freshwater fish production evolution (FAO fishery division, in WWDR3 chapter 7) .................... 13 Figure 10. Average national water footprint per capita, 1997-2001 .......................................................................... 14 Figure 11. Percentage of blue, green and virtual water demand (agri. Sector, Med. countries, 2005....................... 14 Figure 12. Percentage of the population using an improved drinking water source 1990 and 2006, ) ..................... 15 Figure 13. population using an improved drinking water -changes (1990 to 2006) at regional level ........................ 15 Figure 14. Percentage of the population using an improved sanitation facility, 1990 and 2006................................ 16 Figure 15. population using an improved sanitation facility -changes (1990 to 2006) at regional level.................... 16 Figure 16. Value added in irrigated agriculture (30 irrigation schemes around the world) ...................................... 17 Figure 17. Industrial water productivity in US$/m3 used in the industrial sector ...................................................... 18 Figure 18. Population connected to public wastewater treatment plants .................................................................. 19 Figure 19. Evolution of lebel of connection in OECD countries .............................................................................. 19 Figure 20. Level of wastewater reuse is closely linked to water stress...................................................................... 19 Figure 21. Ramsar wetlands sites and extension....................................................................................................... 20 Figure 22. Change in freshwater species in the living planet index.......................................................................... 21
4
1. Introduction Use for global reporting: The collective purpose of UN-Water is to monitor the performance of the water sector from the perspective of a sustainable development objective. UN-Water also follows a set of more specific objectives related to specific dimensions of water management and related Millennium Development Goals (particularly Goal 7) that also require performance assessments. Presentation: The Task Force report 1 proposes a representation of the water sector, intrinsically linked to the development of a given territory. It classify water indicators as ‘context indicators‘, ‘functioning indicators’ and ‘governance indicators‘. Considered jointly, these three dimensions allow the performance of the water sector to be assessed, leading to the definition of related ‘performance indicators’.
Four categories of indicators to understand the water sector (ref. ‘UN-Water Task Force IMR, 2009b2’) Context Some indicators relate to the natural context (e.g. water availability, rainfall), to infrastructure (such as water
treatment capacity, or storage), or to human and economic capitals. ‘Context indicators’ are required to act as benchmarks when assessing the achievements of another territory with a comparable context.
Functioning
Functioning relates to inputs, outputs and outcomes (e.g. water use intensity). A number of indicators relate to describing the dynamic functioning of the water sector at the national level (e.g. water withdrawals, water depletion or wastewater actually treated).
Governance A set of governance indicators is required to track the possible explanations behind the different levels of performance achieved between the given territory and different benchmark territories. The breadth of governance indicators must embrace territorial water resources and water uses management to provide an insightful diagnosis of possible weak spots in need of further investigation and possible improvement or reforms.
Performance Performance adds an element of evaluation. Performance assessment relates to considering the functioning of the sector in relation to its objectives and within a given context. Issues of efficiency/productivity, effectiveness and impact can be considered (e.g. access to water supply and sanitation or value added in agriculture or industry).
Level: The implicit geographical scale adopted by UN-Water is the national level, although some indicators could be monitored at other levels as well. Indeed, other levels are necessary for more detailed assessments (regional, basins, local) or benchmarking objectives (cities, irrigations schemes, industries). Periodicity: The indicators should be updated regularly (1 to 5 years according to the data set). Data: These indicators build on the databases of UN-Water members and partners, updated with information provided by authorities from Member States or from internal UN and other international or regional sources (e.g. OECD, Eurostat, European Environmental Agency, Blue Plan/MAP/UNEP). These annexes (completed by an excel document) provide examples of what could be a regular snapshot of the ‘water sector situation, context and functioning’ – provided supporting data are improved in terms of coverage and updates, as well as elements on the existence of key governance means at global, regional and national levels. In addition, it provides a statistical Annex, as well as a summary of existing global initiatives concerning monitoring, reporting and the development of indicators; as well as more elements of definitions and detailed methodology sheets for the short term indicator set.
1 UN-Water TF-IMR. 2009a. ‘Monitoring progress in the Water sector, A limited indicator set to inform on the situation : Draft report of the Task Force 30/7/2009 . 2 UN-Water TF-IMR. 2009b. ‘Assessing the water sector’, concept paper prepared for UN-Water Task Force.
5
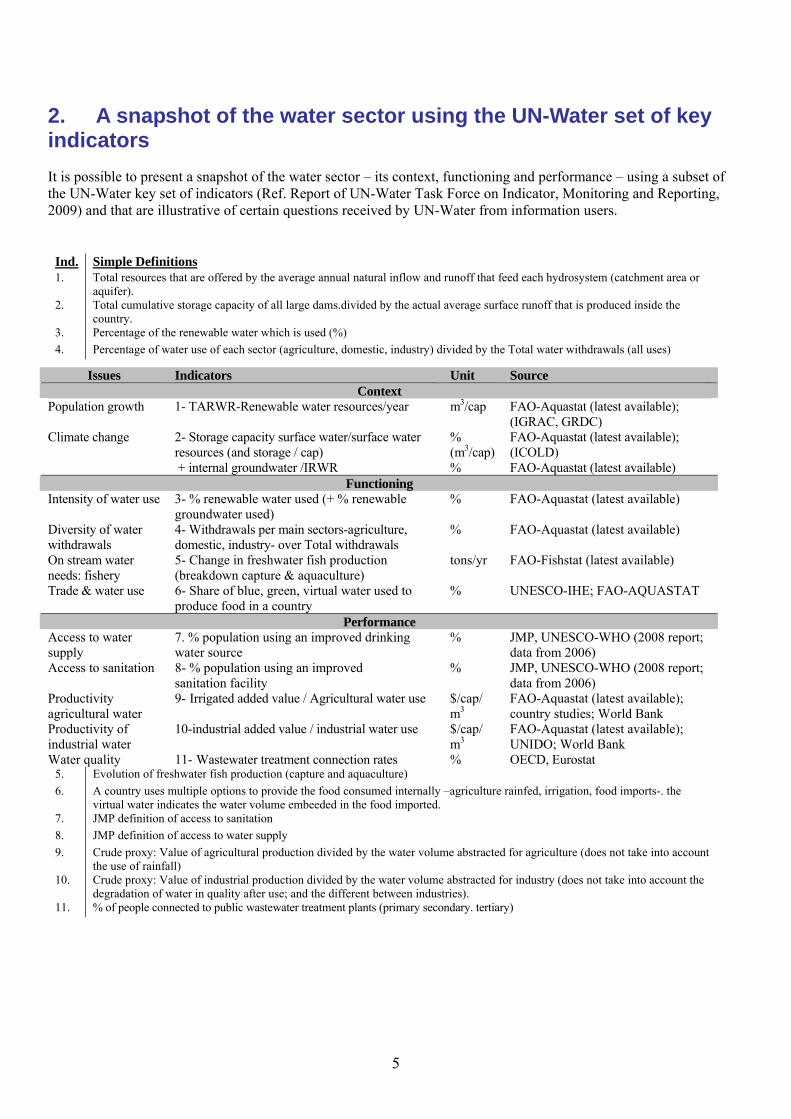
2. A snapshot of the water sector using the UN-Water set of key indicators It is possible to present a snapshot of the water sector – its context, functioning and performance – using a subset of the UN-Water key set of indicators (Ref. Report of UN-Water Task Force on Indicator, Monitoring and Reporting, 2009) and that are illustrative of certain questions received by UN-Water from information users.
Ind. Simple Definitions 1. Total resources that are offered by the average annual natural inflow and runoff that feed each hydrosystem (catchment area or
aquifer). 2. Total cumulative storage capacity of all large dams.divided by the actual average surface runoff that is produced inside the
country. 3. Percentage of the renewable water which is used (%) 4. Percentage of water use of each sector (agriculture, domestic, industry) divided by the Total water withdrawals (all uses)
5. Evolution of freshwater fish production (capture and aquaculture) 6. A country uses multiple options to provide the food consumed internally –agriculture rainfed, irrigation, food imports-. the
virtual water indicates the water volume embeeded in the food imported. 7. JMP definition of access to sanitation 8. JMP definition of access to water supply 9. Crude proxy: Value of agricultural production divided by the water volume abstracted for agriculture (does not take into account
the use of rainfall) 10. Crude proxy: Value of industrial production divided by the water volume abstracted for industry (does not take into account the
degradation of water in quality after use; and the different between industries). 11. % of people connected to public wastewater treatment plants (primary secondary. tertiary)
Issues Indicators Unit Source Context
Population growth 1- TARWR-Renewable water resources/year m3/cap FAO-Aquastat (latest available); (IGRAC, GRDC)
2- Storage capacity surface water/surface water resources (and storage / cap)
% (m3/cap)
FAO-Aquastat (latest available); (ICOLD)
Climate change
+ internal groundwater /IRWR % FAO-Aquastat (latest available) Functioning
Intensity of water use 3- % renewable water used (+ % renewable groundwater used)
% FAO-Aquastat (latest available)
Diversity of water withdrawals
4- Withdrawals per main sectors-agriculture, domestic, industry- over Total withdrawals
% FAO-Aquastat (latest available)
On stream water needs: fishery
5- Change in freshwater fish production (breakdown capture & aquaculture)
tons/yr FAO-Fishstat (latest available)
Trade & water use 6- Share of blue, green, virtual water used to produce food in a country
% UNESCO-IHE; FAO-AQUASTAT
Performance Access to water supply
7. % population using an improved drinking water source
% JMP, UNESCO-WHO (2008 report; data from 2006)
Access to sanitation 8- % population using an improved sanitation facility
% JMP, UNESCO-WHO (2008 report; data from 2006)
Productivity agricultural water
9- Irrigated added value / Agricultural water use $/cap/ m3
FAO-Aquastat (latest available); country studies; World Bank
Productivity of industrial water
10-industrial added value / industrial water use $/cap/ m3
FAO-Aquastat (latest available); UNIDO; World Bank
Water quality 11- Wastewater treatment connection rates % OECD, Eurostat
6
2.1 Population growth: water competition or water crowding?
Population growth and its development needs drive water development – direct water demands for various needs, or indirect through migration or urbanisation. Population growth represents a main driver of pressure on the renewable but limited water resources in a given territory.
Less than 1% of the total freshwater resources on earth (about 200 000 km3 of water) is theoretically usable by humans and ecosystems and it is very unequally distributed. In an average year, it rains from a few millimetres (e.g. 61 mm in Egypt) to more than 10 metres, according to where we are. This diversity is amplified between climatic areas, and years – dry and wet. The ‘resources’ theoretically accessible to humans are assimilated to actual renewable freshwater resources, TARWR, defined as the average annual flow of rivers and recharge of aquifers generated from precipitation. TARWR gives the maximum theoretical amount of water annually available for each country in cubic kilometres. TARWR is based on a long-term period (30 years) and indicates a renewable but finite amount of water ‘potentially available’. TARWR estimates are the basis for planning water development.
The indicator (water resources per capita) is frequently used to show the mismatch between freshwater resources – a renewable but finite resource- and population, and a sense of the level of competition. It indicates a risk of scarcity3 when population (and its needs) are high when compared with the water ‘availability‘ of water. A country is said to be rich in water when it has more than 1700 m3 /inhabitant/year4, while a water scarce country is below 1000 m3 (and becomes extremely water scarce when below 500 m3/inhab/year).
The reverse indicator, the ‘water crowding’ indicator (population per m3), gives a stronger image of the level of competition over the finite resource. Countries with 600 people per million m3 of the resource are considered water scarce.
These indicators provide an estimate of the maximum theoretical amount of water resources in a country. The available water resources will be less, according to various factors, but the indicators are an overall measure of the country’s resources. This also provides an average annual per capita volume of water available to individuals within the country. Within the indicator are five important dependencies, which relate to each nation’s TARWR as to how much of that water resource volume is:
• flowing from outside the country (a security & political issue) • generated surface water runoff ( a precipitation issue) • generated groundwater recharge (a sustainability issue) • shared in both the groundwater and surface water regimes (a sustainability issue) • committed to downstream nations. (a security & political issue)
These indicators can be used in scenario exercises using population projections for 2050 and considering TARWR stable. However, climate change may change the TARWR values and change the water competition landscape, particularly in areas scarce in water and where population growth is faster
With fast population growth, the gap increases between ‘water rich’ and ‘water scarce’ countries. People are not living where resources are the most abundant: 364 million are water poor (living in areas with less than 1000 m3/inhab/year) and 127 million are water stressed (in areas of less than 500 m3/inhab/year). Population growth has been faster in arid and semi-arid areas. By 2050, 1,282 million people will be living in countries or regions with absolute water scarcity, and two-thirds of the world’s population could be under stress conditions.
Improving the indicator
Climate is changing precipitation patterns and temperatures. The impacts on natural resources are unknown but the long term average of water resources (TARWR estimates) may need to be revised for future planning. in addition, human uses have also an impact on water runoff and evaporation. A specific project is proposed by the WWAP EG IMD to revise these estimates.
Humans can in fact access only part of the resource. Differences in water accessibility (storing flood water, reaching water stored 1000m below the ground), variability (between dry and wet years) and quality (between freshwater to brackish or saline resources) are increasing the gaps between rich and poor countries. Only part of the total actual renewable resources (TARWR) is in fact ‘exploitable’ – due to technical, economical, political or environmental constraints. Criteria and definitions change from country to country, but they enable us to calculate ‘environmental flow assessments’. Calculating the total exploitable RWR per capita or its reverse would give a darker but more objective indication. For the Mediterranean region, the Blue Plan/MAP/UNEP calculates exploitable water resources per capita from country estimates of their ‘exploitable resources’.
3 Water scarcity is a relative concept and can occur at any level of supply and demand.. 4 The criteria were defined by Malin Falkenmark on the basis of the water necessary for all uses and in particular irrigation needs. It is more relevant for arid and semi arid context.
7
Measurability
The indicator is defined as the total resources that are offered by the average annual inflow and runoff that feed each hydrosystem (catchment are or aquifer) and that is ‘available in theory’ per person. The reverse indicator gives a sense of crowding over a finite resource. A national figure, however, can hide great differences within the country, particularly in large countries with very diverse climates. The indicator would be most significative at the sub-regional level.
Data sets of TARWR are available for 174 countries in the AQUASTAT database. The 28 countries of the database where data are missing are mostly small islands. The compilation of TARWR estimates was prepared in 2003 through a critical review of multiple national and international sources for the different data items necessary to compute TARWR. The estimates are revised only if new data sets are available.
Total actual renewable water resources (TARWR in km3/yr) is calculated in the AQUASTAT database as follows =(External inflows + Surface water runoff + Groundwater recharge) – (Overlap +Treaty obligations).
Comment: TARWR is a fixed value (rarely updated), therefore it simply indicates a growing population pressure.
Experts (WWAP, 2009b) indicate that there is a need to revise the national estimates of TARWR, and look at: - how hydrology data are produced at national level (measurements, estimations, monitoring networks functional) - ‘changes in the long term as averages – 30 years’ that would account for the change in water cycle and improvement in measurements and estimations for some of the data items using modern technologies.
Detailed global information systems are being compiled on sub-components of TARWR, in particular on groundwater resources by the International Groundwater resources Centre (IGRAC), and on river flows by the Global runoff data centre (GRDC). Additional elements can be found with regional organizations or thematic networks such as (UNESCO/FRIEND, & HELP).
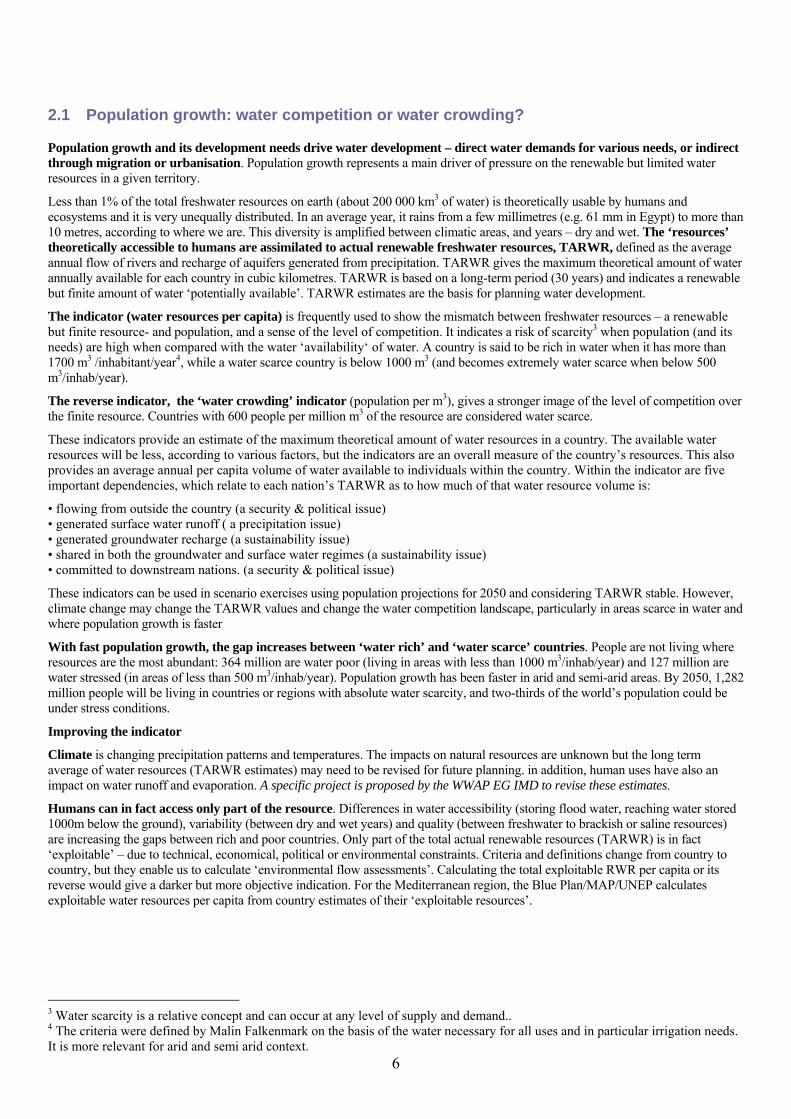
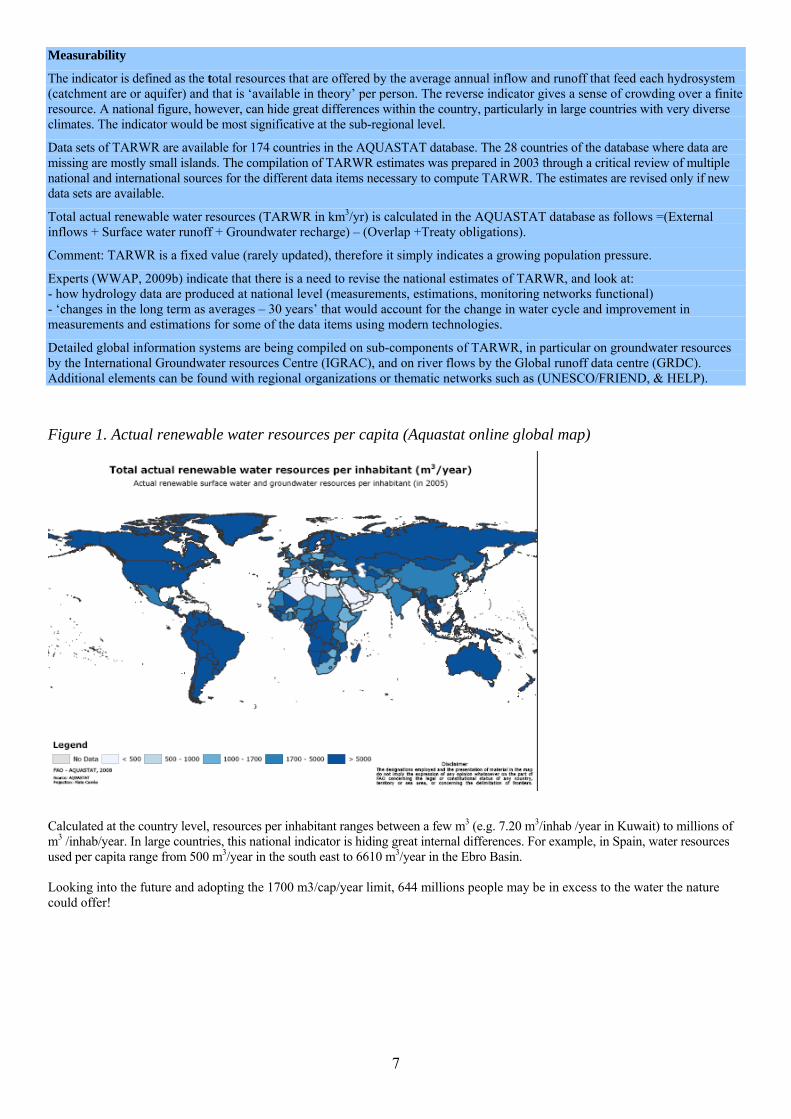
Figure 1. Actual renewable water resources per capita (Aquastat online global map)
Calculated at the country level, resources per inhabitant ranges between a few m3 (e.g. 7.20 m3/inhab /year in Kuwait) to millions of m3 /inhab/year. In large countries, this national indicator is hiding great internal differences. For example, in Spain, water resources used per capita range from 500 m3/year in the south east to 6610 m3/year in the Ebro Basin. Looking into the future and adopting the 1700 m3/cap/year limit, 644 millions people may be in excess to the water the nature could offer!
8
2.2 Climate: variability and vulnerability?
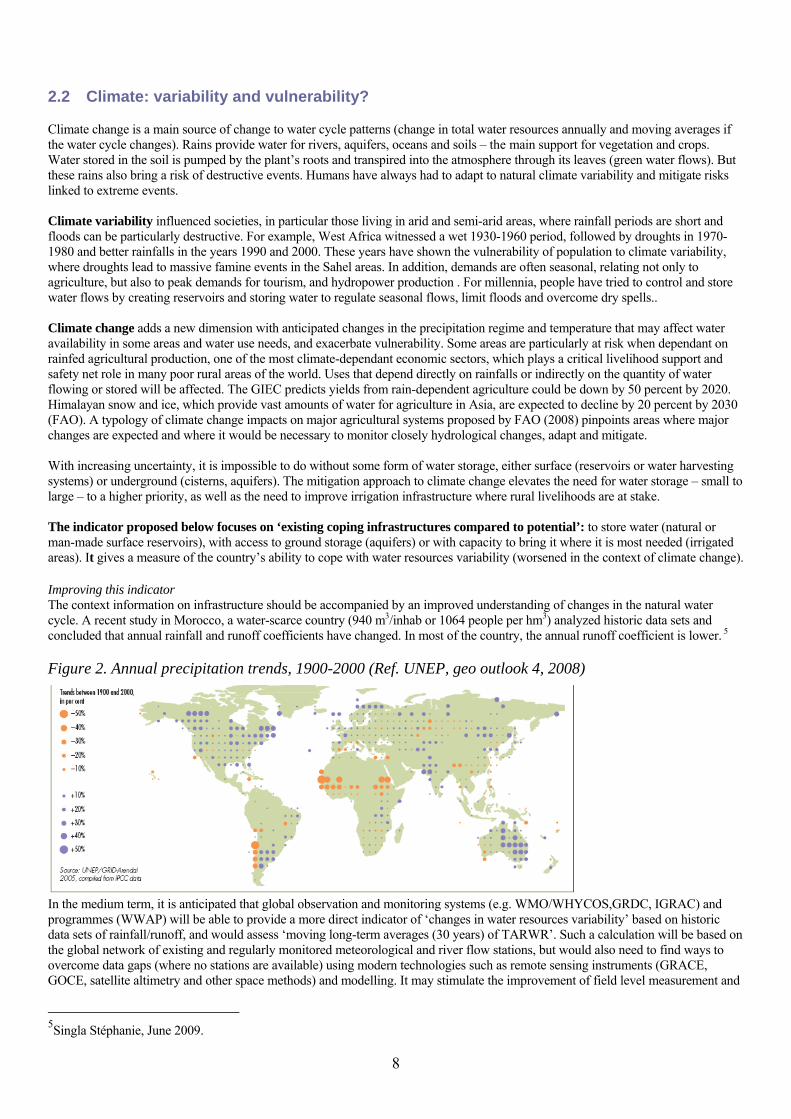
Climate change is a main source of change to water cycle patterns (change in total water resources annually and moving averages if the water cycle changes). Rains provide water for rivers, aquifers, oceans and soils – the main support for vegetation and crops. Water stored in the soil is pumped by the plant’s roots and transpired into the atmosphere through its leaves (green water flows). But these rains also bring a risk of destructive events. Humans have always had to adapt to natural climate variability and mitigate risks linked to extreme events. Climate variability influenced societies, in particular those living in arid and semi-arid areas, where rainfall periods are short and floods can be particularly destructive. For example, West Africa witnessed a wet 1930-1960 period, followed by droughts in 1970-1980 and better rainfalls in the years 1990 and 2000. These years have shown the vulnerability of population to climate variability, where droughts lead to massive famine events in the Sahel areas. In addition, demands are often seasonal, relating not only to agriculture, but also to peak demands for tourism, and hydropower production . For millennia, people have tried to control and store water flows by creating reservoirs and storing water to regulate seasonal flows, limit floods and overcome dry spells.. Climate change adds a new dimension with anticipated changes in the precipitation regime and temperature that may affect water availability in some areas and water use needs, and exacerbate vulnerability. Some areas are particularly at risk when dependant on rainfed agricultural production, one of the most climate-dependant economic sectors, which plays a critical livelihood support and safety net role in many poor rural areas of the world. Uses that depend directly on rainfalls or indirectly on the quantity of water flowing or stored will be affected. The GIEC predicts yields from rain-dependent agriculture could be down by 50 percent by 2020. Himalayan snow and ice, which provide vast amounts of water for agriculture in Asia, are expected to decline by 20 percent by 2030 (FAO). A typology of climate change impacts on major agricultural systems proposed by FAO (2008) pinpoints areas where major changes are expected and where it would be necessary to monitor closely hydrological changes, adapt and mitigate. With increasing uncertainty, it is impossible to do without some form of water storage, either surface (reservoirs or water harvesting systems) or underground (cisterns, aquifers). The mitigation approach to climate change elevates the need for water storage – small to large – to a higher priority, as well as the need to improve irrigation infrastructure where rural livelihoods are at stake. The indicator proposed below focuses on ‘existing coping infrastructures compared to potential’: to store water (natural or man-made surface reservoirs), with access to ground storage (aquifers) or with capacity to bring it where it is most needed (irrigated areas). It gives a measure of the country’s ability to cope with water resources variability (worsened in the context of climate change). Improving this indicator The context information on infrastructure should be accompanied by an improved understanding of changes in the natural water cycle. A recent study in Morocco, a water-scarce country (940 m3/inhab or 1064 people per hm3) analyzed historic data sets and concluded that annual rainfall and runoff coefficients have changed. In most of the country, the annual runoff coefficient is lower. 5
Figure 2. Annual precipitation trends, 1900-2000 (Ref. UNEP, geo outlook 4, 2008)
In the medium term, it is anticipated that global observation and monitoring systems (e.g. WMO/WHYCOS,GRDC, IGRAC) and programmes (WWAP) will be able to provide a more direct indicator of ‘changes in water resources variability’ based on historic data sets of rainfall/runoff, and would assess ‘moving long-term averages (30 years) of TARWR’. Such a calculation will be based on the global network of existing and regularly monitored meteorological and river flow stations, but would also need to find ways to overcome data gaps (where no stations are available) using modern technologies such as remote sensing instruments (GRACE, GOCE, satellite altimetry and other space methods) and modelling. It may stimulate the improvement of field level measurement and
5Singla Stéphanie, June 2009.

9
pinpoint a representative sample of rainfall stations and natural flow measurement points (selected where more critical changes are expected, and where long historic data sets exist today and will be maintained). Measurability WWDR3 indicates that for terrestrial hydrologic observation systems, data is inadequate and deteriorating. Many systems lack adequate quality insurance and control standards for calibrating instruments. Basic capacity to assess, interpret and apply water cycle information from both terrestrial and satellite observation system is often insufficient. (chapter 13, pp 229).
Data on rainfall are gathered by the GPCC/WMO and updated every two years. Data on river flows of main rivers are gathered by the Global runoff data centre (GRDC /managed in Koblenz for WMO) with a biannual updating. Data on disasters are gathered by CRE/WMO (http://www.emdat.be/ ). A web based global groundwater information systems with a global groundwater monitoring network is developed by IGRAC and would be a good base for groundwater data. These global information systems provide very useful point information that may be use in sub-national analysis. They do not provide directly ‘national figures‘, apart from values such as long term average (30 years) but are essential elements of modelling exercises at global level.
Data on large storage are gathered by ICOLD (large storage), but no regular gathering of information of small and middle storages.Data on irrigated infrastructures are gathered by AQUASTAT on a global scale and updated regularly through a survey process.
Figure 3. Countries with the largest storage capacity compared to their internal surface water (Aquastat)
0102030405060708090
Nig
erD
omin
ican
Lith
uani
aS
ri La
nka
Togo
Nam
ibia
Chi
naE
l Sal
vado
rK
enya
Indi
aN
iger
iaS
waz
iland
Uni
ted
Ven
ezue
laB
angl
ades
hK
orea
(Rep
)M
ali
Cub
aS
udan
Uru
guay
Iran
(Isla
mic
Arm
enia
Sau
di A
rabi
aTh
aila
ndTa
jikis
tan
Bot
swan
aK
yrgy
zsta
nM
exic
oC
ote
d'Iv
oire
Cyp
rus
Leso
tho
Jord
anA
lger
iaB
urki
naM
ozam
biqu
eS
outh
Afri
caA
rgen
tina
Mor
occo
Uni
ted
Ara
bTu
nisi
a
countries
shar
e of
inte
rnal
sur
face
wat
er
stor
ed in
larg
e re
serv
oirs
Figure 4. Natural storage underground –countries with the highest and the lowest share of groundwater in total Internal renewable water resources (%).(Aquastat)
0 10 20 30 40 50 60 70 80 90
100
Tong
aC
hile
Mon
golia
Dom
inic
anBh
utan
Jord
anAr
gent
ina
Sain
t Kitt
sH
aiti
New
Gui
nea
Hol
y Se
eC
entra
lLi
byan
Ara
bC
anad
aH
unga
ryM
alay
sia
Indo
nesi
aIta
lyBo
tsw
ana
Vene
zuel
aSa
moa
Egyp
tTr
inid
ad a
ndno
rther
nEc
uado
rBo
snia
and
britis
h vi
rgin
Ando
rra
Sao
Tom
eAz
erba
ijan
Belg
ium Fiji
Shar
e of
gro
undw
ater
in IR
WR
(%)
10
2.3 Changing realities of water uses
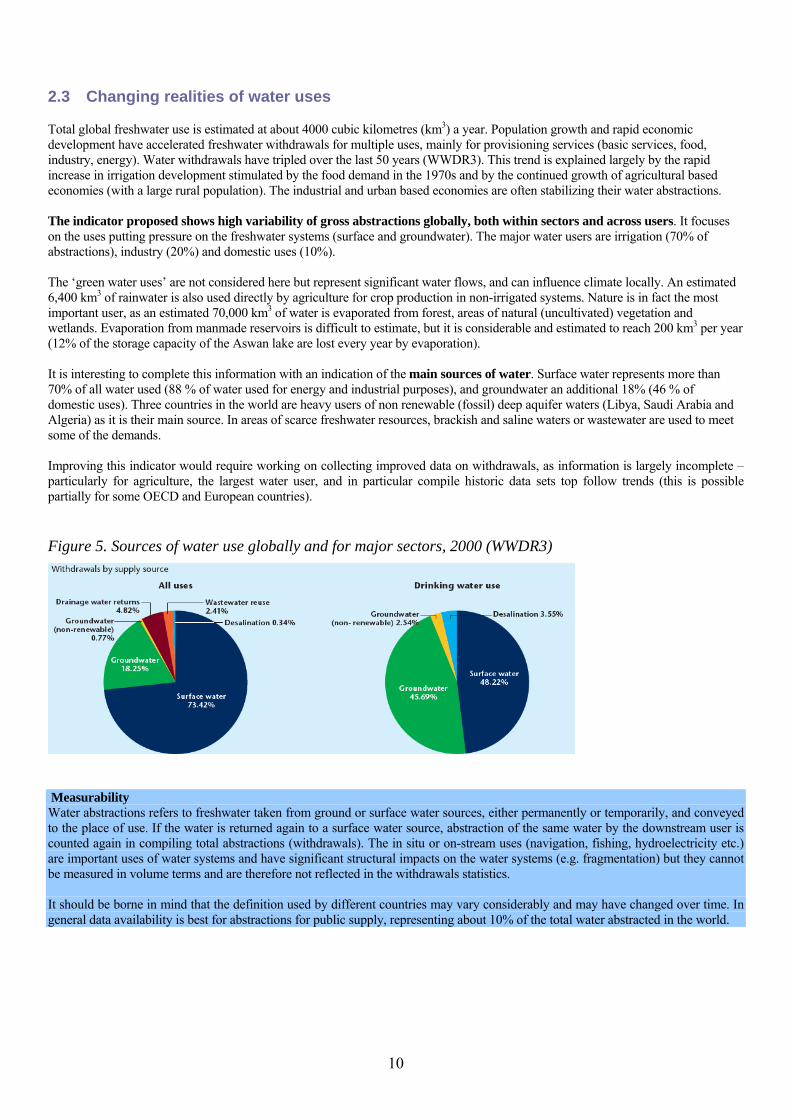
Total global freshwater use is estimated at about 4000 cubic kilometres (km3) a year. Population growth and rapid economic development have accelerated freshwater withdrawals for multiple uses, mainly for provisioning services (basic services, food, industry, energy). Water withdrawals have tripled over the last 50 years (WWDR3). This trend is explained largely by the rapid increase in irrigation development stimulated by the food demand in the 1970s and by the continued growth of agricultural based economies (with a large rural population). The industrial and urban based economies are often stabilizing their water abstractions. The indicator proposed shows high variability of gross abstractions globally, both within sectors and across users. It focuses on the uses putting pressure on the freshwater systems (surface and groundwater). The major water users are irrigation (70% of abstractions), industry (20%) and domestic uses (10%). The ‘green water uses’ are not considered here but represent significant water flows, and can influence climate locally. An estimated 6,400 km3 of rainwater is also used directly by agriculture for crop production in non-irrigated systems. Nature is in fact the most important user, as an estimated 70,000 km3 of water is evaporated from forest, areas of natural (uncultivated) vegetation and wetlands. Evaporation from manmade reservoirs is difficult to estimate, but it is considerable and estimated to reach 200 km3 per year (12% of the storage capacity of the Aswan lake are lost every year by evaporation). It is interesting to complete this information with an indication of the main sources of water. Surface water represents more than 70% of all water used (88 % of water used for energy and industrial purposes), and groundwater an additional 18% (46 % of domestic uses). Three countries in the world are heavy users of non renewable (fossil) deep aquifer waters (Libya, Saudi Arabia and Algeria) as it is their main source. In areas of scarce freshwater resources, brackish and saline waters or wastewater are used to meet some of the demands. Improving this indicator would require working on collecting improved data on withdrawals, as information is largely incomplete – particularly for agriculture, the largest water user, and in particular compile historic data sets top follow trends (this is possible partially for some OECD and European countries).
Figure 5. Sources of water use globally and for major sectors, 2000 (WWDR3)
Measurability Water abstractions refers to freshwater taken from ground or surface water sources, either permanently or temporarily, and conveyed to the place of use. If the water is returned again to a surface water source, abstraction of the same water by the downstream user is counted again in compiling total abstractions (withdrawals). The in situ or on-stream uses (navigation, fishing, hydroelectricity etc.) are important uses of water systems and have significant structural impacts on the water systems (e.g. fragmentation) but they cannot be measured in volume terms and are therefore not reflected in the withdrawals statistics. It should be borne in mind that the definition used by different countries may vary considerably and may have changed over time. In general data availability is best for abstractions for public supply, representing about 10% of the total water abstracted in the world.
11
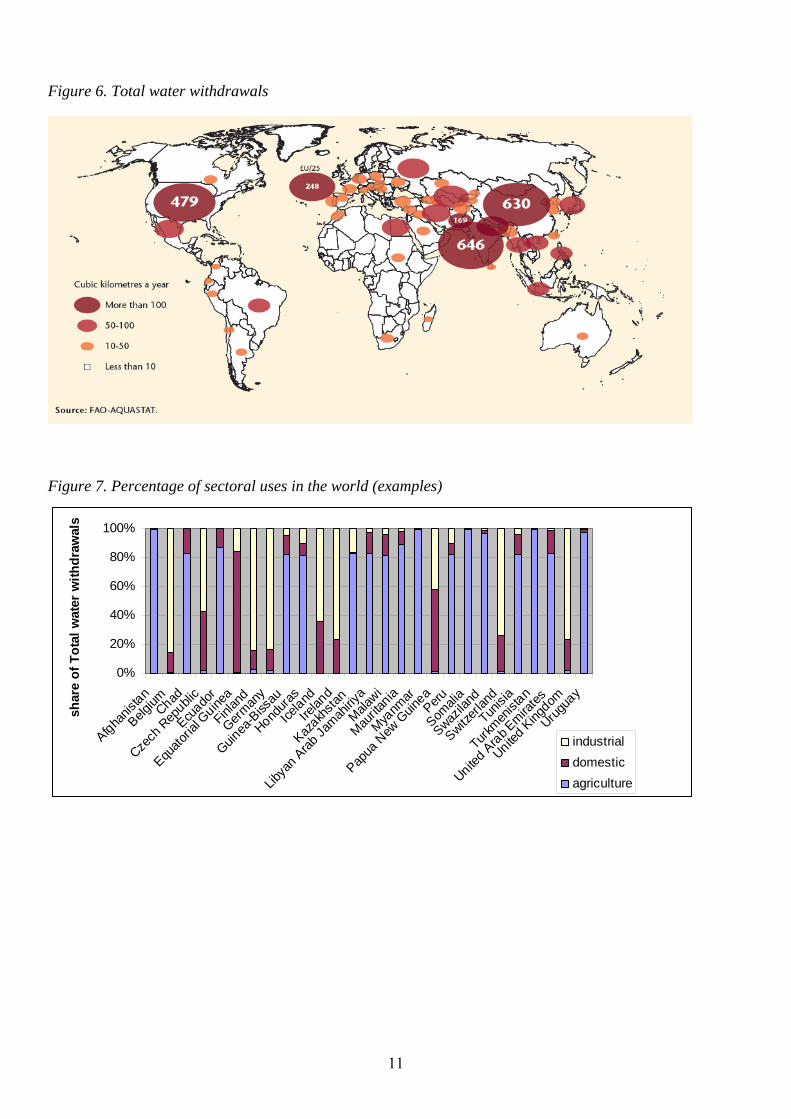
Figure 6. Total water withdrawals
Figure 7. Percentage of sectoral uses in the world (examples)
0%
20%
40%
60%
80%
100%
Afghanis
tan
BelgiumChad
Czech
Rep
ublic
Ecuado
r
Equato
rial G
uinea
Finlan
d
German
y
Guinea
-Biss
au
Hondura
s
Iceland
Irelan
d
Kazakh
stan
Libya
n Arab
Jamah
iriya
Malawi
Maurita
nia
Myanm
ar
Papua
New
Guin
eaPeru
Somali
a
Swazila
nd
Switzerl
and
Tunisi
a
Turkmen
istan
United Arab E
mirates
United King
dom
Urugua
y
shar
e of
Tot
al w
ater
with
draw
als
industrialdomesticagriculture
12
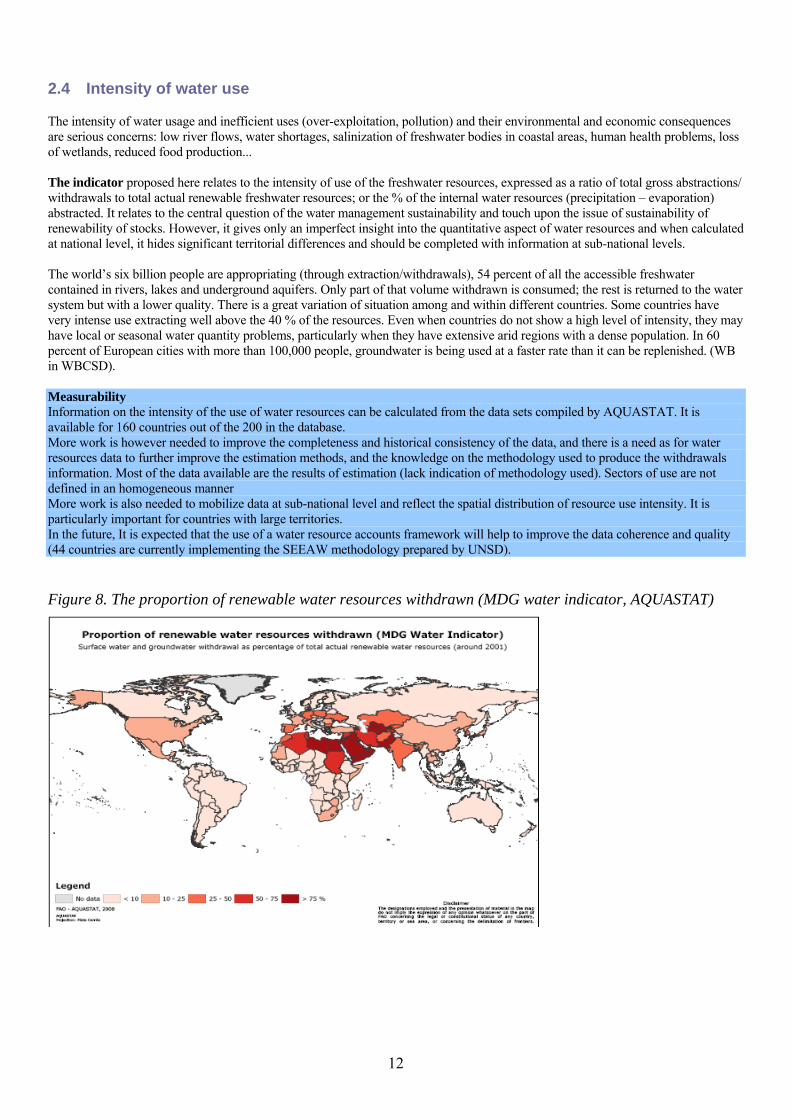
2.4 Intensity of water use
The intensity of water usage and inefficient uses (over-exploitation, pollution) and their environmental and economic consequences are serious concerns: low river flows, water shortages, salinization of freshwater bodies in coastal areas, human health problems, loss of wetlands, reduced food production... The indicator proposed here relates to the intensity of use of the freshwater resources, expressed as a ratio of total gross abstractions/ withdrawals to total actual renewable freshwater resources; or the % of the internal water resources (precipitation – evaporation) abstracted. It relates to the central question of the water management sustainability and touch upon the issue of sustainability of renewability of stocks. However, it gives only an imperfect insight into the quantitative aspect of water resources and when calculated at national level, it hides significant territorial differences and should be completed with information at sub-national levels. The world’s six billion people are appropriating (through extraction/withdrawals), 54 percent of all the accessible freshwater contained in rivers, lakes and underground aquifers. Only part of that volume withdrawn is consumed; the rest is returned to the water system but with a lower quality. There is a great variation of situation among and within different countries. Some countries have very intense use extracting well above the 40 % of the resources. Even when countries do not show a high level of intensity, they may have local or seasonal water quantity problems, particularly when they have extensive arid regions with a dense population. In 60 percent of European cities with more than 100,000 people, groundwater is being used at a faster rate than it can be replenished. (WB in WBCSD). Measurability Information on the intensity of the use of water resources can be calculated from the data sets compiled by AQUASTAT. It is available for 160 countries out of the 200 in the database. More work is however needed to improve the completeness and historical consistency of the data, and there is a need as for water resources data to further improve the estimation methods, and the knowledge on the methodology used to produce the withdrawals information. Most of the data available are the results of estimation (lack indication of methodology used). Sectors of use are not defined in an homogeneous manner More work is also needed to mobilize data at sub-national level and reflect the spatial distribution of resource use intensity. It is particularly important for countries with large territories. In the future, It is expected that the use of a water resource accounts framework will help to improve the data coherence and quality (44 countries are currently implementing the SEEAW methodology prepared by UNSD).
Figure 8. The proportion of renewable water resources withdrawn (MDG water indicator, AQUASTAT)
13
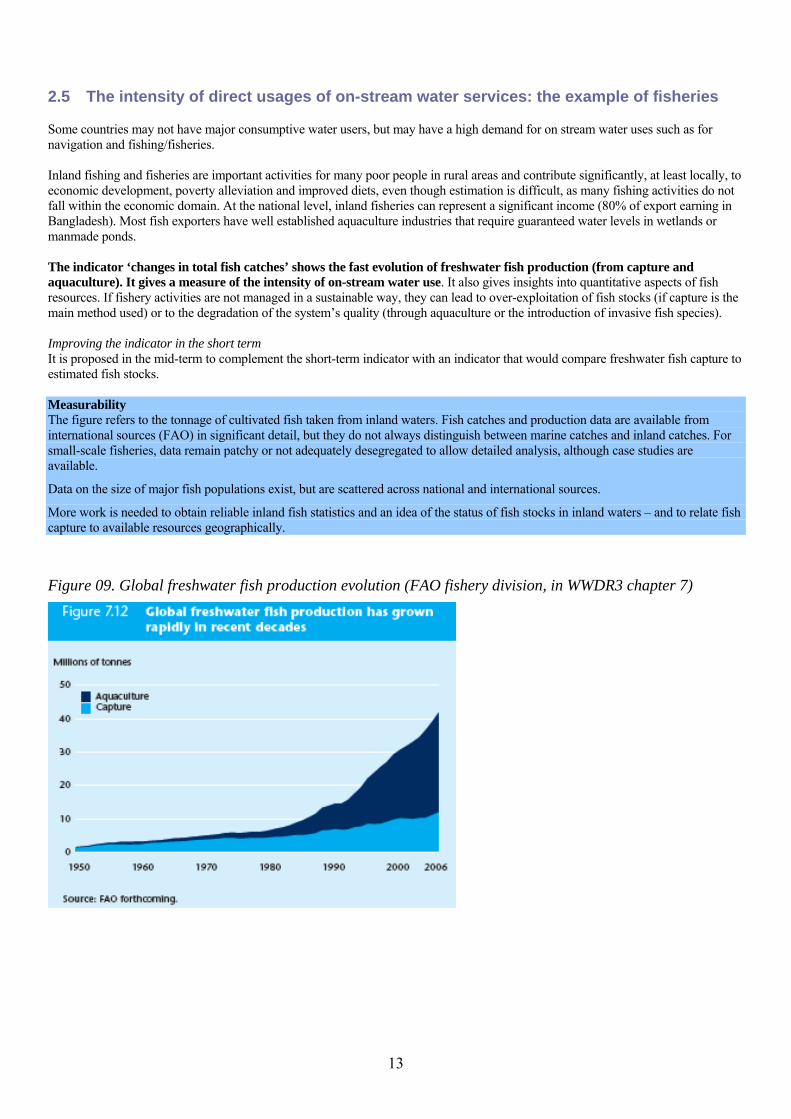
2.5 The intensity of direct usages of on-stream water services: the example of fisheries
Some countries may not have major consumptive water users, but may have a high demand for on stream water uses such as for navigation and fishing/fisheries. Inland fishing and fisheries are important activities for many poor people in rural areas and contribute significantly, at least locally, to economic development, poverty alleviation and improved diets, even though estimation is difficult, as many fishing activities do not fall within the economic domain. At the national level, inland fisheries can represent a significant income (80% of export earning in Bangladesh). Most fish exporters have well established aquaculture industries that require guaranteed water levels in wetlands or manmade ponds. The indicator ‘changes in total fish catches’ shows the fast evolution of freshwater fish production (from capture and aquaculture). It gives a measure of the intensity of on-stream water use. It also gives insights into quantitative aspects of fish resources. If fishery activities are not managed in a sustainable way, they can lead to over-exploitation of fish stocks (if capture is the main method used) or to the degradation of the system’s quality (through aquaculture or the introduction of invasive fish species). Improving the indicator in the short term It is proposed in the mid-term to complement the short-term indicator with an indicator that would compare freshwater fish capture to estimated fish stocks. Measurability The figure refers to the tonnage of cultivated fish taken from inland waters. Fish catches and production data are available from international sources (FAO) in significant detail, but they do not always distinguish between marine catches and inland catches. For small-scale fisheries, data remain patchy or not adequately desegregated to allow detailed analysis, although case studies are available.
Data on the size of major fish populations exist, but are scattered across national and international sources.
More work is needed to obtain reliable inland fish statistics and an idea of the status of fish stocks in inland waters – and to relate fish capture to available resources geographically.
Figure 09. Global freshwater fish production evolution (FAO fishery division, in WWDR3 chapter 7)

14
2.6 Trade and food production
With increasing globalization, it is no longer sufficient to examine water issues only in a national context. Local decisions on water use in agriculture and industry are increasingly driven by decisions outside the local water domain. For example, the water footprint of inhabitants of Europe and North America has been externalized to other parts of the world (Figure 12). The concepts of water footprints and virtual water are used to describe the relations among water management, international trade and politics and policies, and water resources use as it pertains to human consumption. Water footprints measure how much water is used in the production and consumption of goods and services (as well as how much pollution is generated), while virtual water is a tool for determining the movement of water through international trade. The four major factors determining a country’s water footprint are volume of consumption, consumption pattern (for example, high or low meat consumption), climate (growing conditions) and agricultural practices (water use efficiency). Water-intensive products are heavily traded over large distances, as countries import and export water in virtual form as agricultural and industrial commodities. The global volume of virtual water flows in commodities is estimated to 1,625 billion cubic metres (m3) a year, accounting for about 40% of total water consumption. About 80% of these virtual water flows relate to agricultural products trade, and the remainder to industrial products trade. Global virtual water trade can save water if products are traded from countries with high water productivity to countries with low productivity.. But it can also put more strain on scarce water resources. Through the global market European and U.S. consumption relies on water resources available outside Europe’s boundaries, and thus European and North American consumers influence agricultural and industrial strategies elsewhere. Through patterns of consumption and imports, countries can aggravate water shortages and pollution of their water supplies . With increasing water demand, the underground water tables are sometimes overexploited, which lowers their levels excessively. We are, in a way, borrowing the ‘natural capital of water’ from future generations. Such ‘overexploitation’ has been diagnosed and inventoried in most Mediterranean countries, even if it has not always been defined according to standardized criteria. The indicator proposed is the percentage of blue, green and virtual water demand. It gives a measure of the importance of water use in the countries (blue-irrigated water use, green-rainfed agriculture) and outside the country through products traded into the countries.. The Blue plan (2009) shows that water stressed countries are mostly importing their food in the Mediterranean countries. But water-scarce countries such as Greece and Spain also use large volumes of water to produce fruit and oil crops for export. The rationale for such uses will become increasingly questionable where climate change leads to reductions in water availability. In the future, it would be good to look at the ratio of internal-use of domestic water resources- to external-importing virtual water - water footprints for all traded commodities (food, manufacture, energy). It is relevant because externalizing the water footprint means increasing dependence on foreign water resources but also passing on environmental impacts.. Whether water consumed by rainfed agriculture should be accounted for in calculating water footprints is a subject of debate. More methodological work remains to be able to define the water footprint concept for all commodities, account for the “degradation in water quality” and clarify remaining debates about the “rainfed agriculture”water footprint to be accounted or not. .
Figure 10. Average national water footprint per capita, 1997-2001 (Hoekstra and Chapagrain, 2008 cited in WWDR3, Chapter 7)
Figure 11. Percentage of blue, green and virtual water demand (agri. Sector, Med. countries, 2005)
Ref.: Plan Bleu, 2008 & Fernandez, S., ENGREF (2007).
15
2.7 Water services to society
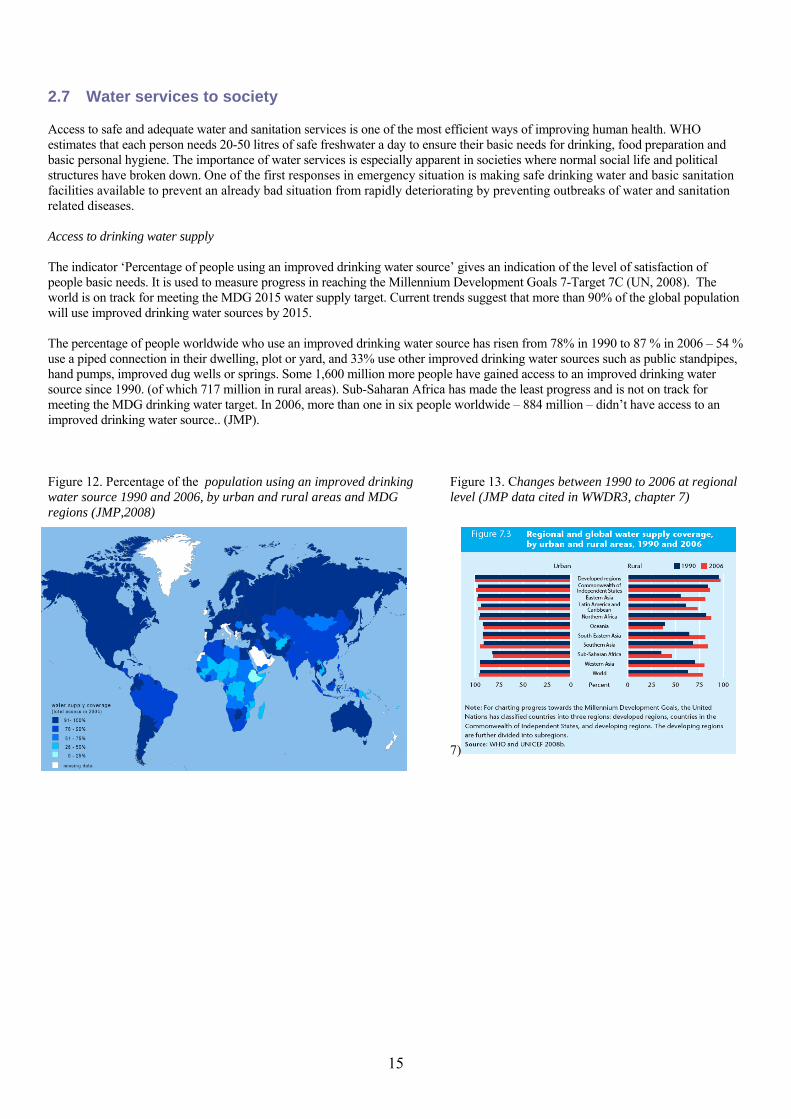
Access to safe and adequate water and sanitation services is one of the most efficient ways of improving human health. WHO estimates that each person needs 20-50 litres of safe freshwater a day to ensure their basic needs for drinking, food preparation and basic personal hygiene. The importance of water services is especially apparent in societies where normal social life and political structures have broken down. One of the first responses in emergency situation is making safe drinking water and basic sanitation facilities available to prevent an already bad situation from rapidly deteriorating by preventing outbreaks of water and sanitation related diseases. Access to drinking water supply The indicator ‘Percentage of people using an improved drinking water source’ gives an indication of the level of satisfaction of people basic needs. It is used to measure progress in reaching the Millennium Development Goals 7-Target 7C (UN, 2008). The world is on track for meeting the MDG 2015 water supply target. Current trends suggest that more than 90% of the global population will use improved drinking water sources by 2015. The percentage of people worldwide who use an improved drinking water source has risen from 78% in 1990 to 87 % in 2006 – 54 % use a piped connection in their dwelling, plot or yard, and 33% use other improved drinking water sources such as public standpipes, hand pumps, improved dug wells or springs. Some 1,600 million more people have gained access to an improved drinking water source since 1990. (of which 717 million in rural areas). Sub-Saharan Africa has made the least progress and is not on track for meeting the MDG drinking water target. In 2006, more than one in six people worldwide – 884 million – didn’t have access to an improved drinking water source.. (JMP).
Figure 12. Percentage of the population using an improved drinking water source 1990 and 2006, by urban and rural areas and MDG regions (JMP,2008)
Figure 13. Changes between 1990 to 2006 at regional level (JMP data cited in WWDR3, chapter 7)
7)
16
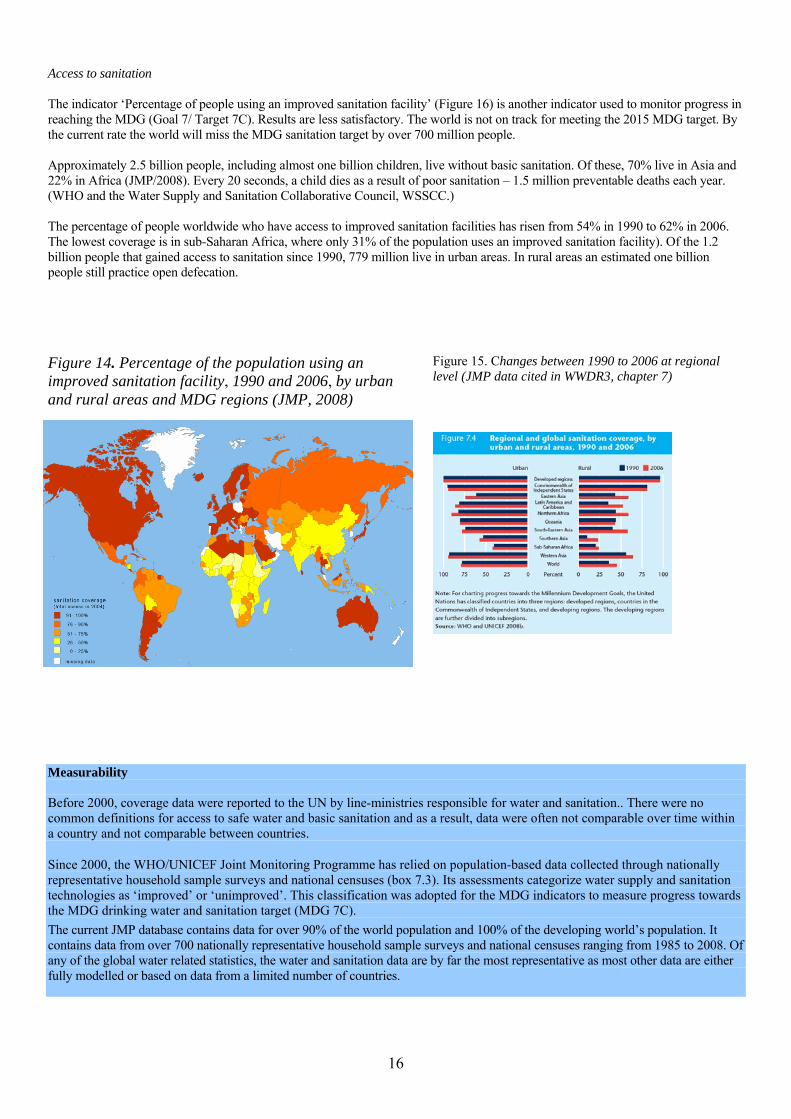
Access to sanitation The indicator ‘Percentage of people using an improved sanitation facility’ (Figure 16) is another indicator used to monitor progress in reaching the MDG (Goal 7/ Target 7C). Results are less satisfactory. The world is not on track for meeting the 2015 MDG target. By the current rate the world will miss the MDG sanitation target by over 700 million people. Approximately 2.5 billion people, including almost one billion children, live without basic sanitation. Of these, 70% live in Asia and 22% in Africa (JMP/2008). Every 20 seconds, a child dies as a result of poor sanitation – 1.5 million preventable deaths each year. (WHO and the Water Supply and Sanitation Collaborative Council, WSSCC.) The percentage of people worldwide who have access to improved sanitation facilities has risen from 54% in 1990 to 62% in 2006. The lowest coverage is in sub-Saharan Africa, where only 31% of the population uses an improved sanitation facility). Of the 1.2 billion people that gained access to sanitation since 1990, 779 million live in urban areas. In rural areas an estimated one billion people still practice open defecation.
Figure 14. Percentage of the population using an improved sanitation facility, 1990 and 2006, by urban and rural areas and MDG regions (JMP, 2008)
Figure 15. Changes between 1990 to 2006 at regional level (JMP data cited in WWDR3, chapter 7)
Measurability Before 2000, coverage data were reported to the UN by line-ministries responsible for water and sanitation.. There were no common definitions for access to safe water and basic sanitation and as a result, data were often not comparable over time within a country and not comparable between countries.
Since 2000, the WHO/UNICEF Joint Monitoring Programme has relied on population-based data collected through nationally representative household sample surveys and national censuses (box 7.3). Its assessments categorize water supply and sanitation technologies as ‘improved’ or ‘unimproved’. This classification was adopted for the MDG indicators to measure progress towards the MDG drinking water and sanitation target (MDG 7C). The current JMP database contains data for over 90% of the world population and 100% of the developing world’s population. It contains data from over 700 nationally representative household sample surveys and national censuses ranging from 1985 to 2008. Of any of the global water related statistics, the water and sanitation data are by far the most representative as most other data are either fully modelled or based on data from a limited number of countries.

17
2.8 Water services to the economy
The daily drinking water requirement per person is 2–4 litres, but it takes 2000 to 5000 litres of water to produce one person’s daily food. The FAO estimates that, on average, 2800 kcal /person need to be produced to ensure a reasonable level of food security. Because of the low energy efficiency of the food chain, protein rich diets require substantially more water than vegetarian diets. In 2007, the estimated number of undernourished people worldwide was 923 million. Over the period to 2050 the world’s water will have to support the agricultural systems that will feed and create livelihoods for an additional 2.7 billion people. The requirements for water in agriculture in developing countries will need to increase in order to meet the Millennium Development Goal 1, target 2 ‘Halve, between 1990 and 2015, the proportion of people who suffer from hunger’. Irrigation increases yields of most crops by 100 to 400 percent, and irrigated agriculture on 20% of cropland (277 million ha) currently contributes to 40 percent of the world’s food production. The rest is produced in rainfed agricultural systems (but in some cases with supplementary irrigation in dry periods) (FAO). The indicator proposed follows change in total value added from irrigated agriculture per cubic metre. With current statistics, it is not possible to separate between irrigated and rainfed production and therefore to calculate that indicator except at the level of an individual irrigation scheme. In a short term, it is proposed for values at national level to use as a proxy the value added from agriculture but only in countries where irrigation represents the main agricultural systems and it can be considered that the majority of water used goes to irrigation. Examples from FAO field appraisal complete the picture for some of the major irrigation schemes in the world. In the future, it may be more relevant to monitor a sample of representative irrigation schemes around the world rather than using national data sets, except when irrigation production data are produced and water withdrawals data sets are robust. Measurability Data on agricultural production are available with FAO every year but does not provide the breakdown between irrigated and rainfed production.
Data on value added in agriculture area available with the World Bank every year.nData on agricultural water withdrawals is compiled by AQUASTAT with an average frequency of 5 years. Data on a sample of irrigation schemes is available for one year for those schemes that went through a modernization process. It would be good to have regular (every 5 years) review process to assess changes in those schemes and calculate precisely the indicator.
Figure 16. Value added in irrigated agriculture (30 irrigation schemes around the world)(FAO, by R. Wahaj, 2009)
0.00
0.20
0.40
0.60
0.80
1.00
1.20
1.40
Fulle
li-G
uni
Cau
Son
-Cam
Son
Jam
rao
Akra
mW
ah
Dau
Tie
ng
MAR
IIS
Alm
atti
- ALB
C
Mah
akal
i Irr
igat
ion
Syst
em
Gho
tki
Nam
Hou
m
Hem
avat
i
Koup
ing
puoy
Nar
ayan
i Irr
igat
ion
Syst
em
Suns
ari M
oran
g Irr
igat
ion
Syst
em
Janp
ur
Lak
Bok
Lodo
yo
Wes
t Kris
hna
Upp
er g
anga
can
al (m
eeru
t)
Bhad
ra
MAD
A
Benn
itora
Mou
nsha
at A
l-Asa
d
Gan
dori
Nal
a
Gha
tapr
abha
Lef
t Ban
k C
anal
(GBL
C)
Zhan
ghe
Tadl
a
Sang
anhe
JVIS
Jiam
akou
Out
put p
er u
nit s
urfa
ce ir
rigat
ion
wat
er s
uppl
ied
(US$
/m3)
Industry – zoom on industrial countries

18
Water is used by industry in multiple ways: for cleaning, heating and cooling; for generating steam; for transporting dissolved substances or particulates; as a raw material; as a solvent; and as a constituent part of products (as in the beverage industry). The volume of water used by industry is low, but there are large differences in efficiency of use. Industry creates more pressure on water resources from the impacts of wastewater discharges and their pollution potential than by the quantity used in production. Cooling in the energy sector is one of the main industrial water uses, with final consumption (evaporation) estimated at around 5% of withdrawals. Outflows of water used in cooling nuclear power plants demand sufficient river flow to reduce the temperature in order to mitigate adverse ecological impacts. Thus non-directly productive but substantial flows are required. There is no simple relation between a country’s production index (volume, value and jobs) and its total industrial demand for water. Demand depends first on the composition of the industrial sector, the processes in use and the degree of recycling that is in place in each sector. Different industries demand different water quality (the high-technology industry requires water of a higher quality than drinking water) and quantities. The diminishing quality of water supplies, increasing costs of water purchases and strict environmental effluent standards are forcing industries to target greater water efficiency and report on their progress (as in the Global Reporting Initiative, for example). The industrial water productivity (the ratio of value of water withdrawn to value of industrial output using the water) is a general indicator of performance in water use. The intensity of water use in industry, in overall terms, is believed to be increasing, as is the value added by industry per unit of water use. Industrial water use is only partially linked to a country’s level of industrialization, as exemplified by the large difference in water productivity between two high-income countries: more than $138 per cubic metre in Denmark and less than $10 per cubic metre in the United States. After rising between 1960 and 1980, water withdrawal for industrial use in developed countries has stabilized and has even started to decline in some countries, as industrial output continues to expand while falling in absolute terms (because of efficiency gains and the economy transition). In Eastern Europe demand for water in the industrial sector fell following advances in production technology and structural change. In emerging market economies industrial demand for water is expected to rise with the region’s rapid growth in manufacturing output. Measurability Data on industrial production are available with UNIDO every year but does not provide the volume of water used and discharged.
Data on value added in industry area available with the World Bank every year.
Data on industrial water withdrawals is compiled by AQUASTAT with an average frequency of 5 years.
On the WBCSD, there is a broad selection of water related best practices and illustrated cases at local levels where progress is monitored and documented.
Figure 17. Industrial water productivity in US$/m3 used in the industrial sector (World Bank and AQUASTAT data sets)
020406080
100120140160180
USA
Philipp
ines
France
Nigeria
Italy
Brazil
Mexico
German
y
Argenti
na
Netherlan
ds
Bangla
desh
Malays
ia
Finlan
d
Portug
alIra
n
Algeria
Spain
Norway
Morocc
o
Austra
liaCuba
United King
dom
Sweden
Venez
uela
Austria
Colombia
South
Africa
New-Zealand
Korea (
Rep)
Greece
Japa
n
Indon
esia
indu
stria
l wat
er p
rodu
ctiv
ity (U
S$/m
3)
19
2.9 Freshwater quality
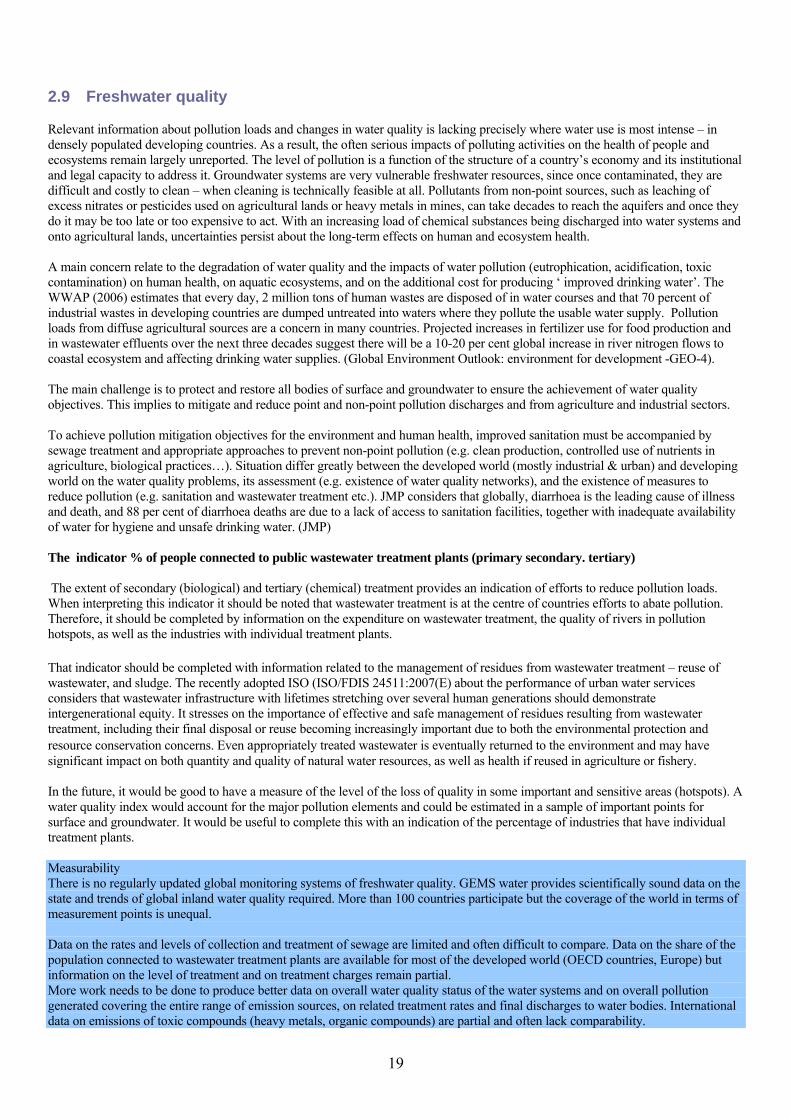
Relevant information about pollution loads and changes in water quality is lacking precisely where water use is most intense – in densely populated developing countries. As a result, the often serious impacts of polluting activities on the health of people and ecosystems remain largely unreported. The level of pollution is a function of the structure of a country’s economy and its institutional and legal capacity to address it. Groundwater systems are very vulnerable freshwater resources, since once contaminated, they are difficult and costly to clean – when cleaning is technically feasible at all. Pollutants from non-point sources, such as leaching of excess nitrates or pesticides used on agricultural lands or heavy metals in mines, can take decades to reach the aquifers and once they do it may be too late or too expensive to act. With an increasing load of chemical substances being discharged into water systems and onto agricultural lands, uncertainties persist about the long-term effects on human and ecosystem health. A main concern relate to the degradation of water quality and the impacts of water pollution (eutrophication, acidification, toxic contamination) on human health, on aquatic ecosystems, and on the additional cost for producing ‘ improved drinking water’. The WWAP (2006) estimates that every day, 2 million tons of human wastes are disposed of in water courses and that 70 percent of industrial wastes in developing countries are dumped untreated into waters where they pollute the usable water supply. Pollution loads from diffuse agricultural sources are a concern in many countries. Projected increases in fertilizer use for food production and in wastewater effluents over the next three decades suggest there will be a 10-20 per cent global increase in river nitrogen flows to coastal ecosystem and affecting drinking water supplies. (Global Environment Outlook: environment for development -GEO-4). The main challenge is to protect and restore all bodies of surface and groundwater to ensure the achievement of water quality objectives. This implies to mitigate and reduce point and non-point pollution discharges and from agriculture and industrial sectors. To achieve pollution mitigation objectives for the environment and human health, improved sanitation must be accompanied by sewage treatment and appropriate approaches to prevent non-point pollution (e.g. clean production, controlled use of nutrients in agriculture, biological practices…). Situation differ greatly between the developed world (mostly industrial & urban) and developing world on the water quality problems, its assessment (e.g. existence of water quality networks), and the existence of measures to reduce pollution (e.g. sanitation and wastewater treatment etc.). JMP considers that globally, diarrhoea is the leading cause of illness and death, and 88 per cent of diarrhoea deaths are due to a lack of access to sanitation facilities, together with inadequate availability of water for hygiene and unsafe drinking water. (JMP) The indicator % of people connected to public wastewater treatment plants (primary secondary. tertiary) The extent of secondary (biological) and tertiary (chemical) treatment provides an indication of efforts to reduce pollution loads. When interpreting this indicator it should be noted that wastewater treatment is at the centre of countries efforts to abate pollution. Therefore, it should be completed by information on the expenditure on wastewater treatment, the quality of rivers in pollution hotspots, as well as the industries with individual treatment plants. That indicator should be completed with information related to the management of residues from wastewater treatment – reuse of wastewater, and sludge. The recently adopted ISO (ISO/FDIS 24511:2007(E) about the performance of urban water services considers that wastewater infrastructure with lifetimes stretching over several human generations should demonstrate intergenerational equity. It stresses on the importance of effective and safe management of residues resulting from wastewater treatment, including their final disposal or reuse becoming increasingly important due to both the environmental protection and resource conservation concerns. Even appropriately treated wastewater is eventually returned to the environment and may have significant impact on both quantity and quality of natural water resources, as well as health if reused in agriculture or fishery. In the future, it would be good to have a measure of the level of the loss of quality in some important and sensitive areas (hotspots). A water quality index would account for the major pollution elements and could be estimated in a sample of important points for surface and groundwater. It would be useful to complete this with an indication of the percentage of industries that have individual treatment plants. Measurability There is no regularly updated global monitoring systems of freshwater quality. GEMS water provides scientifically sound data on the state and trends of global inland water quality required. More than 100 countries participate but the coverage of the world in terms of measurement points is unequal. Data on the rates and levels of collection and treatment of sewage are limited and often difficult to compare. Data on the share of the population connected to wastewater treatment plants are available for most of the developed world (OECD countries, Europe) but information on the level of treatment and on treatment charges remain partial. More work needs to be done to produce better data on overall water quality status of the water systems and on overall pollution generated covering the entire range of emission sources, on related treatment rates and final discharges to water bodies. International data on emissions of toxic compounds (heavy metals, organic compounds) are partial and often lack comparability.
20
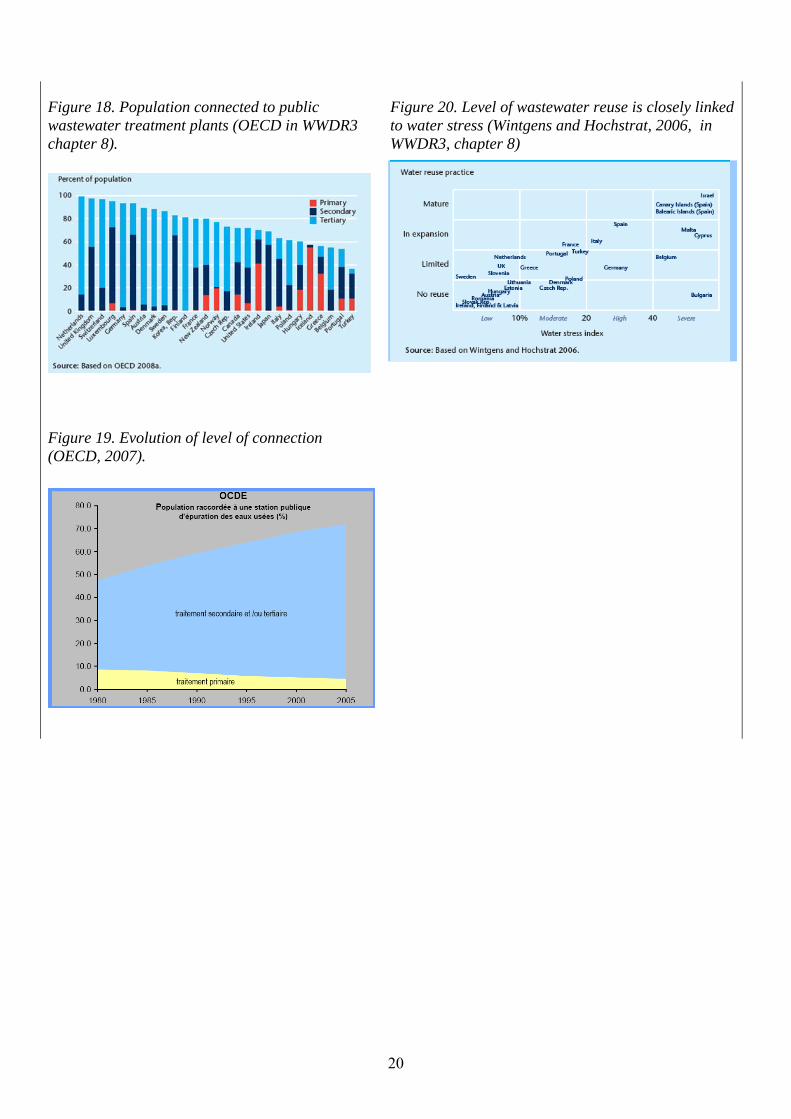
Figure 18. Population connected to public wastewater treatment plants (OECD in WWDR3 chapter 8).
Figure 19. Evolution of level of connection (OECD, 2007).
Figure 20. Level of wastewater reuse is closely linked to water stress (Wintgens and Hochstrat, 2006, in WWDR3, chapter 8)

21
2.10 Water services at risk: functioning and health of key water systems
Scarce and over-used water resources, hydro-water systems and unique landscapes are threatened with depletion and degradation. Research in recent decades has illustrated the importance of species diversity for ecosystem functioning. The general theory is that a more diverse system contributes to more stable productivity by providing a means of coping with variation. However, it is not so much species diversity, but the existence of functional groups together (predators, pollinators, herbivores, decomposers) that creates a stable system. This is a reason to look at the ‘health of wetlands systems’. (CBD) Half of the world’s wetlands have been lost since 1900 as a result of a number of different threats. During the first half of the previous century, this mostly occurred in the northern temperate zone. Loss and degradation of wetlands is caused by overfishing, invasive species, pollution, and the creation of dams and water diversion. The Ramsar Site Database provides insight into the main threats to wetlands. In 1999, 84% of Ramsar-listed wetlands had undergone or were threatened by ecological change. (Ramsar, UNEP/ WCMC). Poor drainage and irrigation practices have led to wetland creation, but also to water-logging and the salinization of approximately 10 percent of the world’s irrigated lands. (World Water Development Report II, WWAP) Regularly updated data on wetland health are not available, but they may be in the medium term. In the short term, however, it is proposed to use as an indicator the freshwater component of the living planet index produced every two years by the WWF. This indicator relates to the number of threatened species compared to the number of known or assessed species. ‘threatened’ refers to endangered species, critically endangered species and vulnerable species. The decline of biodiversity globally is most severely manifested in freshwater systems (MEA, 2005b in CA pp 242). The freshwater index shows that populations of species in inland waters decreased on average by 35 per cent from 1970 to 2005 in 1,463 populations of 458 species. (WWF, 2008). As a complement, information about the importance of the Ramsar wetlands is provided. When interpreting this indicator it should be kept in mind that it provides only a limited vision of the health of biodiversity; it should be read in connection with indicators of the sustainable use of biodiversity as a resource (e.g. fish) and on habitat alteration. It should also be completed by information on the density of population and human activities. Analysis of current trends and different plausible scenarios both indicate that biodiversity loss is likely to continue in the foreseeable future, and certainly beyond 2010. Unprecedented additional efforts at all levels will be needed to achieve the MDG -2010 Biodiversity Target. Measurability Data on threatened species are available for most of the countries of the world in the UNEP-WCMC database, with varying degrees of completeness. The number of species known or assessed does not always accurately reflect the number of species in existence, and the definitions that would follow IUCN standards are applied with various degrees of rigour. Historical data are generally not comparable. On key wetlands ecosystems that would be representative of the health of wetlands, no worldwide data sets are available.
There is a need to develop indicators that better reflect the state and changes in biodiversity at the habitat/ecosystem level.
Figure 21. Ramsar wetlands sites and extension http://www.wetlands.org/reports/rammap/mapper.cfm
Figure 22. Change in freshwater species in the living planet index (WWDR3, chap 8)

22
2.11 Mapping the governance of the water sector at global, regional and national levels – first elements6
As indicated before, it is not possible to construct governance indicators in the short term, as this would require specific country-level auditing to consider whether the instruments applied are appropriate to their context. However, it is possible to start mapping relevant country-level governance means to the work of UN-Water at three levels – global, regional and national. At the country level, a preliminary assessment of the existence and administration of key IWRM management instruments (policies and legislations supporting 3Es objectives, financial instruments) can be done on the basis of the existing web-based country water profiles (AQUASTAT) and reports (UNDESA-CSD13), and by reviewing specific databases (FAO Lex and Water Lex, Transboundary freshwater dispute database). In addition, although governance and performance are considered through a different process, the existence of monitoring systems and the availability of data on water resources and water use are in themselves powerful indicators of the quality of water governance (WWAP EG IMD).
2.11.1 Mapping global, regional governance instruments At the global and the regional level, the focus is on the adoption and implementation of conventions, agreements. The situation of each country was reviewed for each of the following international and regional instruments. This section provides a snapshot of the level of commitments of countries to international and regional agreements that have implication on water management. Additional details are provided in the companion excel document.
Table 4. List of international commitments considered. * excludes countries that to date have only signed agreements
Name Content No. of countries Global/
Regional International Conventions and commitments of relevance to the water sector
accession, ratified, or in force
Biodiversity Ramsar convention 159
The Convention on Biological Diversity (CBD) 151* Climate UNCCD Convention 189
The Convention on Climate Change 191
Resources UN Convention on the Law of the Non-navigational Uses of International Watercourses UNECE on the protection and use of transboundary water course
15 34
Sanitation eThekwini Declaration 16 Pollution Rotterdam convention 126*
Conventions Related to Land-Based Pollution (regional seas conventions) 133 (at least one regional convention)
Regional Transboundary treaties in three or more countries
Africa: Nile, Joint Management (1977) amended 1981, Quality (1994) Inkomati, Quantity (1983, 1991), Joint Management (2002)
5 (at least 1) 3 countries
Asia: Mekong, Quantity (1995)
4 countries
The Middle East: Aral sea basin, Quality (1993, 1995, 1998), Irrigation (1999), Joint Management (1998), Hydro-power (1999) Jordan basin Quality (1955)
5 countries (at least 1) 4 countries
Europe: Rhine, Quality (1991, 1996, 1998, 2002) Danube, Joint Management (1994)
6 10
- America: La Plata, Joint Management (1970) Amazon Econ-Dev’t (1978)
AMERICA 4 countries 8 countries
6 This section was prepared by Christopher List, with guidance from Stefano Burchi, formerly at FAO-Legal department. Comments will be shared with them.
23
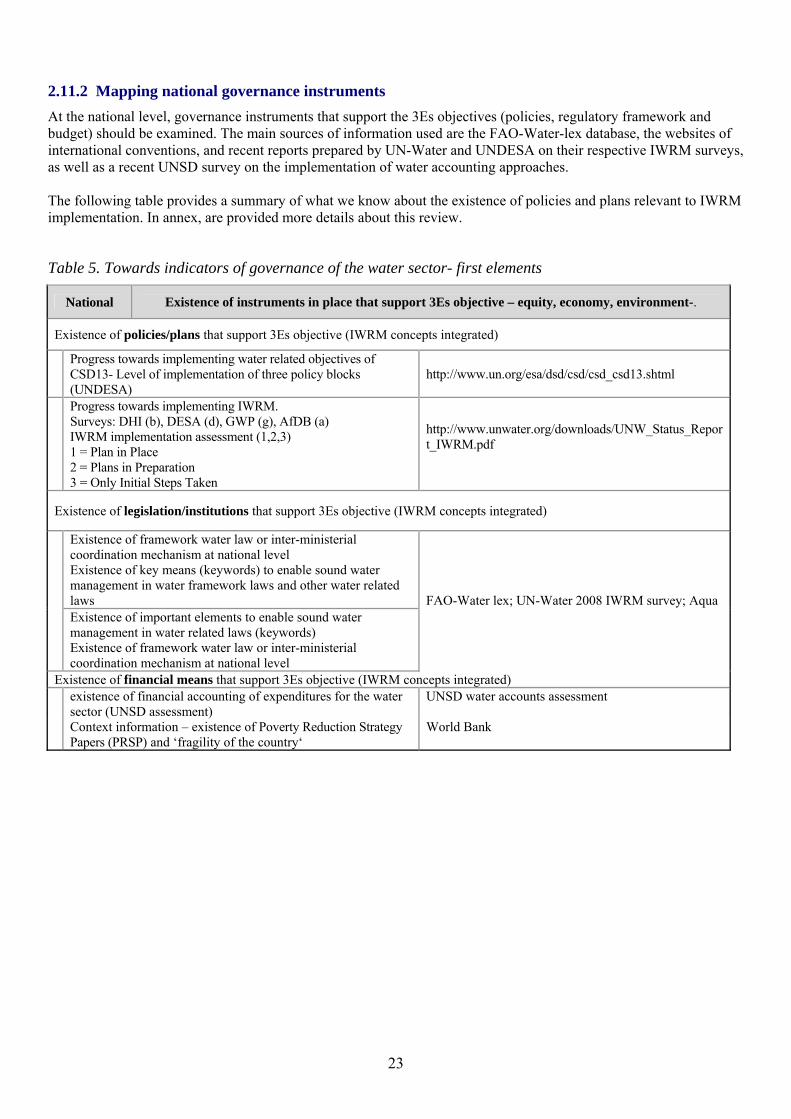
2.11.2 Mapping national governance instruments At the national level, governance instruments that support the 3Es objectives (policies, regulatory framework and budget) should be examined. The main sources of information used are the FAO-Water-lex database, the websites of international conventions, and recent reports prepared by UN-Water and UNDESA on their respective IWRM surveys, as well as a recent UNSD survey on the implementation of water accounting approaches. The following table provides a summary of what we know about the existence of policies and plans relevant to IWRM implementation. In annex, are provided more details about this review.
Table 5. Towards indicators of governance of the water sector- first elements
National Existence of instruments in place that support 3Es objective – equity, economy, environment-.
Existence of policies/plans that support 3Es objective (IWRM concepts integrated)
Progress towards implementing water related objectives of CSD13- Level of implementation of three policy blocks (UNDESA)
http://www.un.org/esa/dsd/csd/csd_csd13.shtml
Progress towards implementing IWRM. Surveys: DHI (b), DESA (d), GWP (g), AfDB (a) IWRM implementation assessment (1,2,3) 1 = Plan in Place 2 = Plans in Preparation 3 = Only Initial Steps Taken
http://www.unwater.org/downloads/UNW_Status_Report_IWRM.pdf
Existence of legislation/institutions that support 3Es objective (IWRM concepts integrated)
Existence of framework water law or inter-ministerial coordination mechanism at national level Existence of key means (keywords) to enable sound water management in water framework laws and other water related laws Existence of important elements to enable sound water management in water related laws (keywords) Existence of framework water law or inter-ministerial coordination mechanism at national level
FAO-Water lex; UN-Water 2008 IWRM survey; Aqua
Existence of financial means that support 3Es objective (IWRM concepts integrated)
existence of financial accounting of expenditures for the water sector (UNSD assessment)
UNSD water accounts assessment
Context information – existence of Poverty Reduction Strategy Papers (PRSP) and ‘fragility of the country‘
World Bank

24
Comments on the review of legislation: A preliminary desk survey of the water resources legislation on the statute books of 195 countries has revealed that the legislation of 70 of them, i.e., more than one-third, scores above average on a scoreboard of pre-defined features of state-of-the-art water resources legislation. The finding that state-of-the-art water resources legislation exists in any given country’s statute books is not indicative, however, of the actual performance of the legislation on the ground, nor of its ultimate effectiveness. Research is therefore required to test a set of pre-defined water legislation performance indicators in a number of pilot countries selected from among those which have scored above-average in the preliminary desk survey alluded to earlier. Comments on the review of IWRM implementation: Surveys undertaken so far stress the difficulties encountered in assessing governance systems. The UNDESA project followed an approach which is consistent with what is proposed in this report, as illustrated in the 2 national cases below. Governance data (in fact ‘the level of implementation of CSD 13 policy decisions on water resources, water supply and sanitation‘) are analysed in the light of 2 complementary data set on ‘context‘ and ‘performance‘. It allows exploring linkages between governance and performance for countries having comparable context. The following examples from UNDESA 2008 review uses a limited set of indicators and could be completed on specific issues related to water management for agriculture – statistics, institutions, legislations- using AQUASTAT country updated (Jordan updated in 2008 and Zambia updated in 2005) available online. To assess the administration, implementation of the regulatory framework, elements can be found on Water lex.

25

26
27
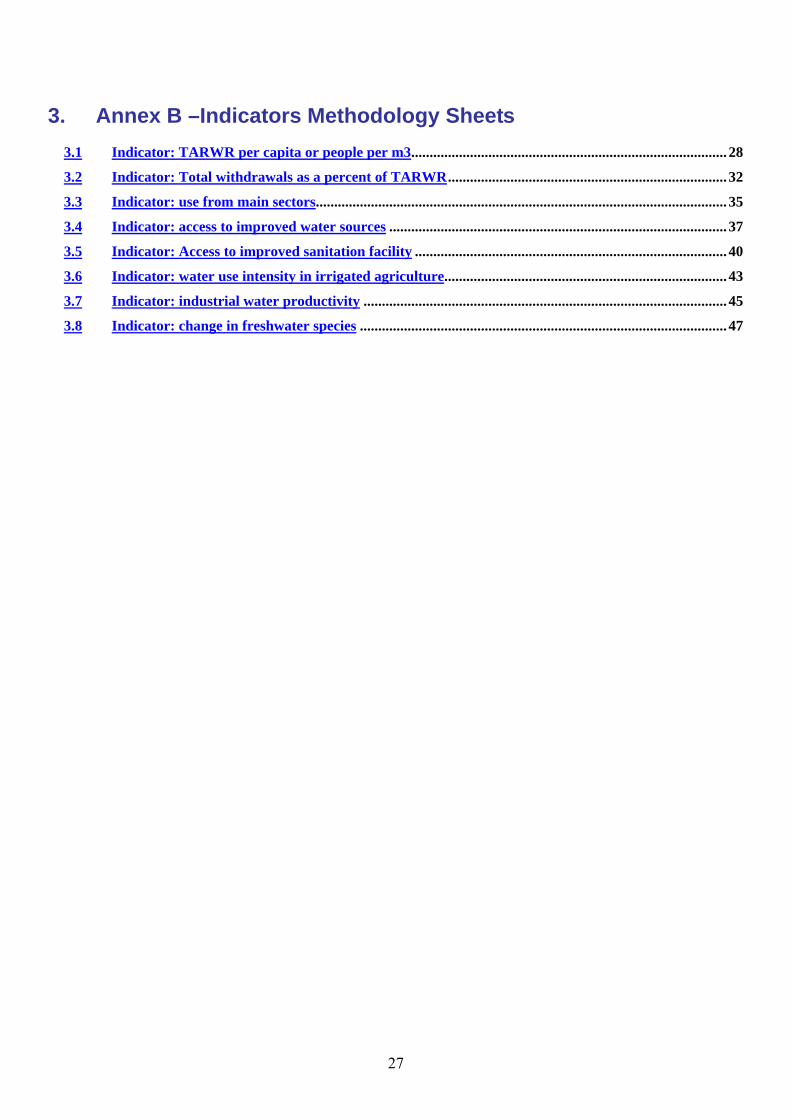
3. Annex B –Indicators Methodology Sheets 3.1 Indicator: TARWR per capita or people per m3...................................................................................... 28 3.2 Indicator: Total withdrawals as a percent of TARWR............................................................................ 32 3.3 Indicator: use from main sectors................................................................................................................ 35 3.4 Indicator: access to improved water sources ............................................................................................ 37 3.5 Indicator: Access to improved sanitation facility ..................................................................................... 40 3.6 Indicator: water use intensity in irrigated agriculture............................................................................. 43 3.7 Indicator: industrial water productivity ................................................................................................... 45 3.8 Indicator: change in freshwater species .................................................................................................... 47
28
3.1 Indicator: TARWR per capita or people per m3
Indicator: Total Actual Renewable Water Resources (TARWR) per capita Methodology sheet
based on WWDR2 methodology sheet Prepared by UNESCO-IHP* in 2006 (based on AQUASTAT definitions),
Examples of illustrations
Status 2005 –global map on water resources par capita (AQUASTAT ) http://www.fao.org/nr/water/aquastat/globalmaps/index.stm Trends 1990 to 2007: graph to be produced using AQUASTAT online datasets
Challenge area
State of the Resource
Rationale / aspect of the challenge area:
The amount of potentially available water resources is an important knowledge for planning in all sectors. The comparison between countries of water resources per capita gives a measure of “water wealth”. Countries are considered poor or scarce in water if they have less than 1000 m3/cap; and water stressed if less have less than 500 m3/cap.
Position in DPSIR chain
State
Definition of indicator
The annualized total actual renewable water resource is the theoretical maximum annual volume of water resources available in a country divided by the total number of people of the same country.
Underlying definitions and concepts
TARWR per capita = (TARWR / population) 109 m3/km3 Units of measurements of total Annual Volume: km3/year Per capita measure: m3/capita/year The maximum theoretical amount of water actually available for the country is calculated from: (a) Sources of water within a country itself; (b) Water flowing into a country (c) Water flowing out of a country (treaty commitments). Availability, defined as the surface and ground water resource volume renewed each year in each country, is how much water is theoretically available for use on a sustainable basis. Exploitability is a different matter as it relates to physical, economic, social and environmental criteria’s specific to a given system. While availability undoubtedly exceeds exploitability, there is unlikely adequate data to define the degree of exploitability at this stage. In more specific terms TARWR is: The sum of: � External water resources entering the country � Surface water runoff (SWAR) volumes generated in the country � Ground water recharge (GAR) taking place in the country Less: � The volume in the country of the total resource effectively shared as it interacts and flows in both the groundwater and surface water systems. Not to subtract this volume would result in its being counted twice. FAO refers to it as “Overlap” (5) and, � The volume that flows to downstream countries based on formal or informal agreements or treaties.
Specification of determinants needed
The specific determinants required are: (1) Actual/natural: indicates whether it corresponds to a natural situation, i.e. a measure of the water balance without human influence, or an actual situation, i.e. the conditions at a given time taking into account human influence either through uptake abstraction of water or through agreements or treaties. Natural conditions are considered stable over time while actual situations may vary with time and refer to a given period. (FAO, 2003, p xi.) (2) Renewable water resources: Total resources that are offered by the average annual natural inflow and runoff that feed each hydrosystem (catchment area or aquifer). (FAO, 2003, p xi.) (3) Internal renewable water resources (km3/year): Average annual flow of rivers and recharge of aquifers generated from (endogenous) precipitation that originates within the countries borders. (FAO, 2003, p xi) (4) External renewable water resources (km3/year): That part of the country’s renewable water resources which is not generated in the country which includes inflows from upstream countries (groundwater and surface water), and part of the water of border lakes or rivers. (FAO, 2003) (5) Overlap between surface water and groundwater resources (km3/year): Overlap defines the part of the country’s water resources that is common to surface waters and to aquifers. Surface water flows can contribute to groundwater as recharge from, for example, river beds or lakes or reservoirs or wetlands. Aquifers can discharge into rivers, lakes and wetlands and can be manifest as base

29
flow, the sole source of river flow during dry periods, or can be recharged by lakes or rivers during wet periods. Therefore, the respective flows of both systems are neither additive nor deductible.
Computation TARWR (in km3/yr) = (External inflows + Surface water runoff + Groundwater Recharge) - (Overlap +Treaty obligations) TARWR PC = (TARWR / population) 109 m3/km3
Units of measurements
Total Annual Volume: km3/year Per capita measure: m3/capita/year
Data sources, availability and quality
Water resources Source: FAO, computed on the basis of available country water resources data sheets and country water balance computational spreadsheets. For more information, please refer to the original data source, or to the 2003 print publication Review of World Water Resources by Country in FAO's AQUASTAT Programme. Availability: 2007- Latest version online – FAO/AQUASTAT. Quality: FAO refers to the data as the "Best Estimate" and updates the data when further information is provided. While AQUASTAT represents the most complete and careful compilation of water resources statistics to date, freshwater data are generally of poor quality. Information sources are various but rarely complete. Access to information on water resources is still sometimes restricted for reasons related to sensitivity at the regional level. The accuracy and reliability of the information vary greatly among regions, countries, and categories of information, as does the year in which the information was gathered. As a result, no consistency can be ensured at the regional level on the duration and dates of the period of reference. Population Source: Population Division of the Department of Economic and Social Affairs of the United Nations Secretariat, 2005. World Population Prospects: The 2004 Revision. Dataset on CD-ROM. New York: United Nations. Available on-line at http://www.un.org/esa/population/ordering.htm. Quality: based on national population census and best estimates
Scale of application:
Data available at country level.
Geographical coverage:
Global
Interpretation: This indicator provides an estimate of the maximum theoretical amount of water resources in a country. The available water resources will be less according various factors but it is an overall measure of the country’s resources which is also normalized to provide an average annual per capita volume available to individuals within the country. Within the indicator are five important dependencies which relate to each nation’s TARWR as to how much of that water resource volume is: • flowing from outside the country (a security & political issue) • generated surface water runoff ( a precipitation issue) • generated groundwater recharge (a sustainablity issue) • shared in both the groundwater and surface water regimes (a sustainablity issue) • committed to downstream nations. (a security & political issue) Limitations on the indicator: 1. See extensive notes from FAO in publication and at web site. 2. Does not yet apply at the level of basins or hydrographical units although some work in this regard has been started by FAO. (Africa, Asia partial) 3. Does not include non-renewable groundwater. 4. Size of large countries can mask high range in variability. 5. Quality of data is variable by country as qualified in FAO database and country datasheets. 6. In the determinant “External renewable water resources”, groundwater outflows through transboundary aquifers can be substantial in some countries even if they in general are small compared with surface water flows. Transboundary groundwater flows are difficult to quantify. Suggested future modifications: • Determine ratio by country where shared basins exist (significant number) • For the largest area countries (the 12 over 2 million km2 or the 30 over 1 million km2) break down the distribution according to the next lower level of administrative governance. (e.g. Canada & China, Provinces, USA, Russia – States) • Breakdown into smaller (significant) sub-basins to assess basin-wide variability.
Linkage with other indicators
Precipitation (FAO data is calculated from IPCC data unless considered not representative. Approximately 80% of FAO’s precipitation data originates from IPCC).
30
Water use (WU) by different sectors (is included as part of the AQUASTAT Data base)
Alternative methods and definitions
The computation of actual renewable water resources requires the assessment of both internal and external water resources. Internal renewable water resources are computed by adding up average annual surface runoff and groundwater recharge occurring within a country's borders. Surface water resources are usually computed by measuring or assessing total river flow occurring in a country on a yearly basis. Groundwater resources are estimated by measuring rainfall in arid areas where rainfall is assumed to infiltrate into aquifers. In humid areas, groundwater is estimated by looking at the surface low flow of rivers. Special care is taken to avoid double counting resources that are common to both surface and groundwater, called overlap. Two types of exchanges create overlap: contribution of aquifers to surface flow, and recharge of aquifers by surface runoff. External flows include both natural and actual incoming flows. Natural incoming flow is the average amount of water which would flow into the country without human influence. Actual incoming flow is the average annual quantity of water entering the country, taking into account extraction by upstream countries. It also accounts for the portion of the flow secured through treaties or agreements. The figure may vary with time. It may be negative when the flow reserved to downstream countries is more than the incoming flow. Actual flows in humid countries are likely to be close to natural flows because of low water consumption relative to available resources in these countries. Conversely, in arid and semi-arid countries, the actual flows are much lower than natural flows. AQUASTAT collects its information from a number of sources--national water resources and irrigation master plans; national yearbooks, statistics and reports; reports from FAO; international surveys; and, results from surveys made by national or international research centers. In most cases, the information was analyzed to ensure consistency between the different data collected for a given country with the help of local experts. When possible, cross-checking of information between countries was used to improve assessment in countries where information was limited. When several sources give different or contradictory figures, preference was always given to information collected at national or sub-national level. This preference is based on the assumption that no regional information can be more accurate than studies carried out at the country level. Unless proven to be wrong, official rather than unofficial sources were used. In the case of shared water resources, a comparison between countries was made to ensure consistency at river-basin level. For more information, please refer to the following publication: Food and Agriculture Organization of the United Nations (FAO), Water Resources, Development and Management Service. 2003. AQUASTAT Information System on Water and Agriculture: Review of World Water Resources by Country. Available on-line at http://www.fao.org/nr/water/aquastat/water_res/index.stm. Rome: FAO. (It presents the methodology developed and rules established to compute the different elements of national water balances. From those data, FAO has compiled a comparative analysis of available country water resources data.) Original data were actually collected over a period of 15 to 25 years and have been compiled since 2003 by the AQUASTAT global information system of water and agriculture. The current AQUASTAT database provides data per 5-year period if available. Data are presented by WRI as a single value for 1960-2007 because, for this variable, AQUASTAT lists only one number for each country over the entire time period covered by the database. AQUASTAT updates its website as new data become available, or when FAO conducts special regional studies.
Related indicator sets
FAO’s AQUASTAT
Sources of further information
http://www.fao.org/nr/water/aquastat/water_res/index.stm
Other institutions involved
Water resource data by country are compiled by other international institutions: • World resources institute
(http://earthtrends.wri.org/searchable_db/index.php?theme=2&variable_ID=694&action=select_countries)
• The Pacific institute (total renewable water supply per country -http://www.worldwater.org/data20082009/table1.xls
31
• the St Petersburg State Hydrological Institute (I. Shiklomanov) , http://webworld.unesco.org/water/ihp/db/shiklomanov/summary/html/summary.html#Renewable%20water%20resources
• the University of New Hampshire (http://www.wsag.unh.edu/inlandwaters.html) • and several regional institutions.
NOTE: WRI has this information on web site with link and credit for the data to FAO/AQUASTAT. WRI indicates that the AQUASTAT database also contains estimates of per capita actual renewable water resources that include estimates for most countries for most 5-year periods prior to the values published here; population estimates used in per capita calculations, however, may differ. The Pacific institute uses various sources, including FAO reports (=AQUASTAT but not the latest updates) I. Shiklomanov published regional and global values not at country level.
32
3.2 Indicator: Total withdrawals as a percent of TARWR
Indicator: MDG water indicator (Annual withdrawals/abstractions of freshwater as a Percent of Total Renewable water resources)
Challenge area Status and change of water uses Other names Water exploitation indicator ; water use intensity indicator Examples of illustrations
Status 2005: Global map on MDG indicator (MDG report provided by AQUASTAT/FAO) http://www.fao.org/nr/water/aquastat/globalmaps/index.stm At basin level (named : water scarcity map, 2007 – CA) Trends 1990 to 2007: graph to be produced using existing online datasets (AQUASTAT: possible for some countries for 2 to 3 dates ; AEE also possible for European countries)
Rationale / aspect of the challenge area:
Policy question: The pressure on renewable water resources is increasing in many countries with growing population and their multiple demands. Is the abstraction rate of water use sustainable? Ojective/targets: Environmental performance can be assessed against domestic objectives and international commitments. Agenda 21 adopted at UNCED (Rio Janeiro, 1992) explicitly considers items such as the protection and preservation of freshwater resources. This was reaffirmed as the WSSD (Johannesburg, 2002). The MDG reporting process has now included this MDG water indicator under its strategic Objective/Goal 7 (ensure environmental sustainability).
Position in DPSIR chain
Pressure
Definition of indicator
The MDG water indicator, It is the total annual volume of total annual withdrawals/abstraction of freshwater (groundwater and surface water) from its sources for human use (e.g. agricultural, domestic, industrial sectors) divided by the annual total actual renewable freshwater resource, expressed in percentage terms.
Underlying definitions and concepts
This indicator combines data on water availability and water withdrawals, and has thus also been referred to as withdrawals-to-availability index but also water exploitation index (WEI) by the European Environment Agency or intensity of use of water resources by OECD.
Specification of determinants needed
This indicator measures the relative pressure of annual abstraction or withdrawals (A) over the actual renewable natural water resources (TARWR). A (based on technical notes in http://earthtrends.wri.org/): Annual Total Water Withdrawals (or abstractions) is the gross amount of water extracted from any source, either permanently or temporarily, for a given use. It can be either diverted towards distribution networks or directly used. It includes consumptive use, conveyance losses, and return flow. Total water withdrawals are the sum of estimated water use by the agricultural, domestic, and industrial sectors.
• Irrigation is the primary agricultural use of water. To estimate the pressure of irrigation on the available water resources, an assessment has to be made both of irrigation water requirements and of water withdrawal for agriculture. Data on country water withdrawal for agriculture are collected through AQUASTAT country surveys. Data on water requirement ratios are generally not easily available at field, irrigation scheme or river basin levels. At country level, only very scattered and unreliable information is available. For this reason, a regional rather than national approach was used to assess water requirement ratios. For more information on the determination of agricultural water use please refer to AQUASTAT’s methodology.
• Domestic water uses include drinking water plus water withdrawn for homes, municipalities, commercial establishments, and public services (e.g. hospitals). To calculate the domestic use, AQUASTAT has scaled the data according to GDP per person. For example if the GDP per person increases, water use per person increases. For poor countries, AQUASTAT considers an almost linear relationship, the richer the countries get, the less linear the relationship (the percent increase in water withdrawal is much less than the percent increase in GDP/person).
• Industrial water uses include cooling machinery and equipment, producing energy, cleaning and washing goods produced as ingredients in manufactured items, and as a solvent. To calculate the industrial water use, AQUASTAT has scaled increase in water withdrawal according to increase in GDP. This relationship is almost linear for poor countries and almost flat for rich countries.
TARWR: is the annual long term volume of actual renewable freshwater resources. It is in million of cubic metres per year. See INDIC 1 for detailed definition of TARWR.

33
Changes in annual water availability volumes indicates a change in estimates of freshwater resources in a country or river basin over a given time period. It is primarily due to better knowledge (measurements and estimation methods). It can also be linked to estimates accounting for the changes in upstream water use of the effect of climate change.
Computation INDIC 3 = (A / TAWR) x 100 Units of measurements
Unit: Percentage
Data sources, availability and quality
Data source: AQUASTAT (FAO) provides information at national level for 160 countries. AQUASTAT was developed by the Food and Agriculture Organization of the United Nations in 1993; data have been available on-line since 2001. Most freshwater data are not available in a time series, and the global data set contains data collected over a time span of up to 30 years. AQUASTAT updates their website as new data become available, or when FAO conducts special regional studies. Most data updates include revisions of past data. Data availability: The indicator can be calculated for 160 countries (out of 195 in AQUASTAT data base). Trends are available only for few countries and data at different dates commonly come from different national sources (a problem of comparability). Quality: Data are compiled by AQUASTAT through national experts using a single questionnaire. While AQUASTAT represents the most complete and careful compilation of country-level water resources statistics and withdrawals to date, the primary information on which it relies is of variable quality. Information sources are various but rarely complete. Some governments will keep internal water resources information confidential because they are competing for water resources with bordering countries. Many instances of water scarcity are highly localized and are not reflected in national statistics. In addition, the accuracy and reliability of information vary greatly among regions, countries, and categories of information, as does the year in which the information was gathered. As a result, no consistency can be ensured among countries on the duration and dates of the period of reference. All data on freshwater resources should be considered order-of-magnitude estimates. Withdrawal data at national level are also of uneven quality as they frequently come from multiple national sources – agriculture water use from the administration if charge of agriculture, domestic supply from another institutions etc. In addition, only few countries collect water abstraction on a regular basis (mostly developed countries). Therefore to improve quality, more work is needed to
• improve completeness and historical consistency of the data and to further improve estimation methods.
• mobilise data at sub-national level, and to reflect the spatial distribution of the resources use intensity. This is particularly important for countries with larger territories where resources are unevenly distributed as well as population.
Scale of application:
This indicator can be computed at the country level or, preferably, by river basin.
Geographical coverage:
NATIONAL LEVEL CATCHMENT AREAS
Interpretation: The significance of this indicator applies to basins and regions as well as countries, and indicates risks of over-abstraction of underground water resources as well as basin closure (if at basin level). The indicator shows the degree to which total renewable water resources are being used to meet the country’s water demands and is thus a measure of “water scarcity” (resources compared to demands). Limited water could have negative effects on sustainability constraining economic and regional development, and leading to loss of biodiversity. It is an important measure of a country’s vulnerability to water shortages. It is considered that a region or country is :
• Little or no water scarcity. Abundant water resources relative to use, with less than 25% of freshwater water withdrawn for human purposes.
• Already under water stress when the water exploitation index exceeds 25 %, • Approaching physical water scarcity or under severe water stress when more than 60% of
freshwater are withdrawn. The water systems (aquifers and basins) will experience physical water scarcity in the near future.
• Physical water scarcity (water resources development is approaching or has exceeded sustainable limits). More than 75% of freshwater are withdrawn for agriculture, industry, and domestic purposes (accounting for recycling of return flows). This definition—relating water availability to water demand—implies that dry areas are not necessarily water scarce.
The renewable resources exploitation index can sometimes exceed 100%. It is not necessarily an indicator of shortage or global «overuse» of resources. It can be the case when freshwater resources are very limited (arid zones) and other water sources to face water demands (e.g. non renewable groundwater in Libya,

34
Saudi Arabia; desalination in Malta; waste water use, or reuse…). Adversely, exploitation indices under 100% do not exclude potential local over-consumption, particularly as regards depletion of groundwater reserves. Precaution for use: When interpreting this indicator, it should be noted that relating resource abstraction to renewal of stocks is a central question concerning sustainable water resources management. It should however be kept in mind that it only gives insights into quantitative aspects of water resources and that a national level indicator may hide significant territorial differences and should be completed with information at sub-national levels. This indicator should be read in connection with other additional indicators, and in particular on water supply prices and water quality. In some countries or basins, water resources are abundant relative to water use, with less than 25% of water from rivers withdrawn for human purposes, but malnutrition exists. The Comprehensive assessment (CA, 2007) speaks of “Economic water scarcity” when human, institutional, and financial capital limit access to water even though water in nature is available locally to meet human demands (map 2, pp 11 in summary for decision makers, International Water Management Institute analysis done for the Comprehensive Assessment of Water Management in Agriculture using the Watersim model; chapter 2).
Linkage with other indicators
• It is related to the water availability index (UN-Water INDIC 1) defined as the average freshwater resources available per person. Regions can be labelled as water scarce if this value drops below 1000 m3 per person — however as the indicator uses population as a proxy for water uses it is less accurate.
• It can be presented separately for different socio-economic activities, i.e. water for domestic use, for use in manufacturing and electricity production, and for agricultural purposes. It enables to see which sector is responsible for the major part of the pressure.
• It could also be presented separately for the main water supply sources: river flows, groundwater. It enables to see which part of the water cycle is more under pressure.
• It would be closer to reality if calculated as the ratio of total water consumption (gross withdrawals – returns) over exploitable freshwater resources (implies definition of exploitability criterias –technical, economical, environmental).
Alternative methods and definitions
Also called: (need to agree on the same terminology) MDG water indicator (Exploitation Indicator of renewable resources) (FAO/AQUASTAT ; MDG) Water exploitation indicator (Blue Plan/MAP/UNEP) Water resource use intensity (OECD) water stress indicator (WWDR2; MSSD 3 / WAT_P03); (UNECE) Water stress index (UNU-New Hampshire) Water scarcity indicators water scarcity map at basin level based on total withdrawals over river flows volume (CA, 2007; IWMI)
Related indicator sets
Interpretation of this indicators is completed by the information on • change in water abstractions, total and by sectors (Index 1990=100) • gross abstraction/withdrawal per person in a country or river basins. • gross abstraction/withdrawals as % of internal water resources (this is the indicator used by
WRI/earthtrends) Sources of further information
FAO/AQUASTAT
Other institutions involved
Water withdrawals data by country are compiled by other international institutions: • World resources institute (use total withdrawals as a % of internal resources-
(http://earthtrends.wri.org/searchable_db/index.php?theme=2&variable_ID=6&action=select_countries) but sources are aquastat
• The Pacific institute (total renewable water supply per country - http://www.worldwater.org/data.html but source indicated are aquastat (but not latest update)
• the University of New Hampshire (global level / http://wwdrii.sr.unh.edu/download.html) and several regional institutions for group of countries.
• the University of New Hampshire for Africa (DSS world water resource atlas / http://www.wwap-dss.sr.unh.edu/africa/index.html)
• OECD; EUROSTAT, European Environmental Agency (annual environmental compendium) • Blue Plan/MAP/UNEP (regional compilation for countries of the Mediterranean Action Plan)
NOTE: WRI has this information on web site with link and credit for the data to FAO/AQUASTAT. The Pacific institute uses various sources, including FAO reports (=AQUASTAT but not the latest updates)
35
3.3 Indicator: use from main sectors
Indicator: Use by abstraction from main sector Adapted from methodology sheet prepared by FAO (WWDR2, 2006) Challenge area WWDR2-Water for Food, Agriculture and Rural livelihoods; water for industry; water for cities; Sharing
water Other names Examples of illustrations
Global map 2005- AQUASTAT – Proportion of Total water resources withdrawn for agriculture (http://www.fao.org/nr/water/aquastat/globalmaps/index.stm) Trend information is available for some countries
Rationale
To have a measure of the importance of the various sectors in the country’s water allocation.
Position in DPSIR chain
Pressure
Definition of indicator
This indicator is composed of sub-indicators, one for each of the sectors. It is composed of three or 4 sub-indicators:
• Water withdrawn for irrigation in a given year, expressed in percent of the total water withdrawals. • Industry water withdrawals as a percentage of total water withdrawal (suggested separating the
water used for the energy sector from the other industries); then, another indicator could be added for Energy water withdrawals for cooling as a percentage of total withdrawals
• Domestic water withdrawal as percentage of total water withdrawals Underlying definitions and concepts
• Annual quantity of freshwater withdrawn for agricultural, industrial and domestic purposes. It includes renewable freshwater resources as well as potential over-abstraction of renewable groundwater or withdrawal of fossil groundwater and eventual use of desalinated water or treated wastewater. It does not include other categories of water use, such as for cooling of power plants, mining, recreation, navigation, fisheries, etc., which are sectors that are characterized by a very low net consumption rate.
• Annual quantity of water withdrawn for irrigation and livestock purposes. It includes renewable freshwater resources as well as potential over-abstraction of renewable groundwater or withdrawal of fossil groundwater, use of agricultural drainage water, desalinated water and treated wastewater. It includes water withdrawn for irrigation purposes and for livestock watering, although depending on the country this last category sometimes is included in domestic water withdrawal.
• Annual quantity of water withdrawn for industrial uses. It includes renewable water resources as well as potential over-abstraction of renewable groundwater or withdrawal of fossil groundwater and potential use of desalinated water or treated wastewater. Usually, this sector refers to self-supplied industries not connected to any distribution network. The ratio between net consumption and withdrawal is estimated at less than 5%.
• Annual quantity of water withdrawn for domestic purposes. It includes renewable freshwater resources as well as potential over-abstraction of renewable groundwater or withdrawal of fossil groundwater and the potential use of desalinated water or treated wastewater. It is usually computed as the total water withdrawn by the public distribution network. It can include that part of the industries, which is connected to the domestic network. The ratio between the net consumption and the water withdrawn can vary from 5 to 15% in urban areas and from 10 to 50% in rural areas.
• The Total water withdrawals is the annual quantity of water withdrawn for agricultural, industrial and domestic purposes. This is either expressed as a single total (if no desegregation is available by sectors of use) or as the sum of agricultural, domestic and industrial withdrawals. It does not include other categories of water used, such as for cooling of water plants, navigation, recreation, mining, etc, which are sectors that are characterized by a very low net consumption rate.
Specification of determinants needed
Irrigation is the primary use of water in the agricultural sector. Methods for computing agricultural water withdrawal vary from country to country. To estimate the pressure of irrigation on the available water resources, an assessment has to be made both of irrigation water requirements and of water withdrawal for agriculture. Data on country water withdrawal for agriculture have been collected through AQUASTAT country surveys. Data on water requirement ratios are generally not easily available at field, irrigation scheme or river basin levels. At country level, only very scattered and unreliable information is available. For this reason, a regional rather than national approach was used to assess water requirement ratios. For more information on the determination of agricultural water withdrawals please refer to AQUASTAT’s methodology.
Computation • Water withdrawal for agriculture (AWW): [Agricultural water withdrawal as % of total water withdrawals] = 100 * [Agricultural water withdrawal] / [Water resources: totalwithdrawals]
• Water withdrawal for industry (IWW): [Industrial water withdrawal as % of total water

36
withdrawals] = 100 * [industrial water withdrawal] / [total water withdrawals] • Water withdrawal for domestic supply (DWW); [domestic water withdrawal as % of total water
withdrawals] = 100 * [domestic water withdrawal] / [total water withdrawals] Units of measurements
Percent
Data sources, availability and quality
Source: FAO AQUASTAT AQUASTAT collects its information from a number of sources--national water resources and irrigation master plans; national yearbooks, statistics and reports; reports from FAO; international surveys; and, results from surveys made by national or international research centers. In most cases, the information was analyzed to ensure consistency between the different data collected for a given country. When possible, cross-checking of information between countries was used to improve assessment in countries where information was limited. When several sources give different or contradictory figures, preference was always given to information collected at national or sub-national level. This preference is based on the assumption that no regional information can be more accurate than studies carried out at the country level. Unless proven to be wrong, official rather than unofficial sources were used. In the case of shared water resources, a comparison between countries was made to ensure consistency at river-basin level. Constraints to computation of this indicator lie in the facts that sectoral water use are estimation for a large proportion (particularly agricultural water use). Raw data measurements are not available which illustrates the need for modelling.
Scale of application:
All scales; data available at country level. Relevant also at basin level Geographical coverage Global
Geographical coverage:
Interpretation: Knowing the importance of a sector in the total demand will give an indication of the vulnerability of this sector and the economy to any variability in water supplies.
Linkage with other indicators
Irrigated land as a percentage of cultivated land Relative importance of agriculture in the country’s economy
Sources of further information
www.fao.org/ag/aquastat/
Other institutions involved
Water withdrawals data by country are compiled by other international institutions: • World resources institute (use total withdrawals as a % of internal resources-
(http://earthtrends.wri.org/searchable_db/index.php?theme=2&variable_ID=6&action=select_countries) but sources are aquastat
• The Pacific institute (- http://www.worldwater.org/data.html but source indicated are aquastat (but not latest update)
• the University of New Hampshire (global level / http://wwdrii.sr.unh.edu/download.html) and several regional institutions for group of countries.
• the University of New Hampshire for Africa (DSS world water resource atlas / http://www.wwap-dss.sr.unh.edu/africa/index.html)
• OECD; EUROSTAT, European Environmental Agency (annual environmental compendium) • Blue Plan/MAP/UNEP (regional compilation for countries of the Mediterranean Action Plan)
Sectoral data sets, at local level agriculture: ICID, IWMI Industry: WBCSD, UNIDO, IEA Domestic: UN-Habitat, WHO, UNICEF

37
3.4 Indicator: access to improved water sources
Indicator: Proportion of population with an improved access to improved water sources
Methodology sheet prepared by
WHO/UNICEF, JMP (based on WWDR2 methodology sheet prepared by UNICEF, 2006 & MDG indicators guidelines http://mdgs.un.org/unsd/mdg/Resources/Attach/Indicators/HandbookEnglish.pdfhttp://mdgs.un.org/unsd/mdg/Resources/Attach/Indicators/HandbookEnglish.pdf
Examples of illustrations :
used in WWDR3 Chapter 7 ; used in MDG report 2008 ; JMP global and regional reports (2008, 2006, 2004…)
Challenge area : Health Rationale / aspect of the challenge area
:The indicator monitors access to improved water sources based on the assumption that improved sources are more likely to provide safe water. Contaminated drinking water is a major cause of illness and mortality, as a result of exposures both to infectious agents and to chemical pollutants. Inadequate access to water in the home is also a source of economic disadvantage by requiring large commitment of human resources to fetching and carrying water. This indicator provides a proxy measure both of exposure, in terms of access to safe drinking water and the effectiveness of actions to improve access.
Position in DPSIR chain:
Impact
Targets/ Objectives :
MDG Goal 7/ Target 10 : Halve, by 2015, the proportion of people without sustainable access to safe drinking water and basic sanitationTarget 7.C: Halve, by 2015, the proportion of people without sustainable access to safe drinking water and basic sanitation.
Definition of indicator
The proportion of the population (total, urban and rural) with sustainable access to an "improved" water source is the percentage of the population who use any of the following types of water supply for drinking: piped water, public tap, borehole or pump, protected well, protected spring or rainwater. Improved water sources do not include vendor-provided water, bottled water, tanker trucks or unprotected wells and springs.
Underlying definitions and concepts
The Joint Monitoring Programme defines access to water supply and sanitation in terms of the types of technology and levels of service afforded.http://www.wssinfo.org/en/40_MDG2008.html
Definitions used for urban and rural areas are defined by individual countries Drinking water supply can be broken down into there categories, which is illustrated in the form of a
"drinking water ladder". The category “improved” source includes sources that, by nature of their construction or through active intervention, are protected from outside contamination, particularly faecal matter. These include piped water to a dwelling, plot or yard, and other improved sources. "unimproved sources" make up the third part of the ladder.
The drinking water ladder (1) & (2) Improved water sources
(1) water piped on premises: piped household water connection located inside the user's dwelling, plot or yard.
(2) improved drinking water sources other than piped water: public taps or standpipes, tube wells, boreholes, protected dug wells, protected springs and rainwater collection.
(3) unimproved drinking water sources bottled water unprotected dug well unprotected spring cart with small tank/drum, tanker truck surface water (river, dam, lake, pond, stream, canal, irrigation channels) Specification of determinants needed
The use of the main source of drinking water for a household. Household sizes are computed into population figures. National population figures used are those provided by the UN-Population Division; Population projections used are based on medium variant population growth rate
Computation Population based data regarding the use of the main source of drinking water, obtained from nationally representative household surveys is used to calculate the proportion of the population with access to improved drinking water. Results of several household surveys are plotted against a time scale. A linear regression line is drawn through these points to estimate the coverage for a certain year. As a rule projections from the last data point are made up to a maximum of six years.
Units of measurements
Percentage
Data sources, availability and quality
Data source: Since the late 1990s, data have routinely been collected at the national and subnational levels in more than 100 countries using censuses and surveys by national Governments, often with support from international development agencies. The data sources used to calculate this indicator are nationally

38
representative household surveys. Data sources include household surveys, such as: - The Demographic and Health Surveys (DHS) - Multiple Indicator Cluster Surveys (MICS) - National Censuses- Reproductive Health Surveys - World Health Surveys (WHS) - Health and Nutrition surveys Living Standards and Measurements Surveys (LSMS) When surveys are not available, administrative records are used.
Availability: Household surveys are generally conducted every three to five years. WHO and UNICEF annually compile international data and prepare regional and global estimates based on household survey data. The frequency of all surveys combined amounts to one survey conducted per country in every 3-4 years. This frequency is adequate to determine actual changes in access to safe drinking water. Before the population-based data were available, provider-based data were used. Evidence suggests that data from surveys are more reliable than administrative records and provide information on facilities actually used by the population.
Issues Gender: Women and men usually have different roles in water and sanitation activities. The differences are particularly pronounced in rural areas. Women are most often the users, providers and managers of water in rural households and the guardians of household hygiene. If a water system breaks down, women are more likely to be affected than men because they have to travel farther for water or use other means to meet the household’s water and sanitation needs.
Desegregation: The indicator should be monitored separately for urban and rural areas. Because of national differences in characteristics that distinguish urban from rural areas, the distinction between urban and rural population is not amenable to a single definition applicable to all countries. National definitions are most commonly based on size of locality, with rural population as the residual of population that is not considered urban.
Limitations: When data from administrative sources are used, they generally refer to existing sources, whether used or
not. Despite official WHO definitions, the judgment about whether a water source is safe is often subjective. In addition, the existence of a water supply does not necessarily mean that it is safe or that local people use it.
For those and other reasons, household survey data are generally better than administrative data, since survey data are based on actual use of sources by the surveyed population rather than the simple existence of the sources. While access is the most reasonable indicator for water supply, it still involves severe methodological and practical problems. Among them:
The data are not routinely collected by “the sector” but by others outside the sector as part of more general surveys.
Water quality is not systematically addressed. The timing of collection and analysis of household survey data is irregular, with long intervals between
surveys. Scale of application:
At national and global level For urban and rural areas: By service level or facility type By household income level, determined by the wealth index – a composite of household assets and characteristics of the dwelling
Geographical coverage:
Urban, Rural, National, Regional and Global
Interpretation: According to the definition of the WHO: Safe drinking water implies that the water meets accepted drinking water quality standards and poses no significant threat to health. Determining the micro-biological and chemical safety of drinking water of each household is too costly and practically and technologically too challenging. The use of an “improved” facility type as a proxy for the safety of drinking water is therefore accepted as the best alternative given the current information available.
With regard to access: (1) The questions in household surveys specifically ask about the use of a source to obtain drinking water. Broken hand pumps or public standpipes that no longer provide water are thus not counted in household surveys and therefore not reflected in the indicator.
(2) In addition to good quality of water, accessibility to water as defined in the Right to Water includes a continuous supply of a minimum amount of water sufficient for drinking, personal and domestic hygiene, for an affordable price, within a reasonable distance. These issues like continuity (including seasonality), quantity, affordability and distance to a source are not taken into account in the current indicator. The reasons for this are the following: - Non-availability of historic data - Questionable reliability of data collected through household surveys assessing the available water quantity or actual quantity used per person per day. - Non-availability of data on continuity combined with the lack of a definition for continuity and the difficulty of interpreting continuity when e.g. intermitted supply is dealt with through storage at household level.
Linkage with other Safe water being a basic need for survival as well as a determinant of health, should be considered with the
39
indicators use of sanitary facilities and practices of appropriate hygiene behavior if positive health outcomes are to be maximized.
The indicator relates to most other health indicators, in particular those on water related diseases, as well as the under-five mortality. Recent studies show the importance of safe drinking water and sanitation for the survival of people living with HIV/AIDS.
Alternative methods and definitions
The MDG target is formulated in terms of sustainable access. Though officially not further defined, sustainable access refers to a continuous and affordable drinking water supply. There is no widely accepted standard of what is an affordable drinking water supply, neither is continuity sufficiently defined yet, as to make it measurable.
Access to safe water refers to the percentage of the population with reasonable access to an adequate supply of safe water in their dwelling or within a convenient distance of their dwelling. The Sanitation Assessment 2000 Report defines reasonable access as “the availability of 20 litres per capita per day at a distance no longer than 1,000 metres”. However, access and volume of drinking water are difficult to measure, so sources of drinking water that are thought to provide safe water are used as a proxy.
The United Nations Children’s Fund (UNICEF) and the World Health Organization (WHO), through the Joint Monitoring Programme, assess trends in “access to improved drinking water sources” by drawing a regression line through the available household survey and census data for each country (details are available at and global estimates are aggregated from the national estimates, using population-weighted averages.
Related indicator sets
Access to basic sanitation
Incidence of diarrhoeal disease in children under five years of age Under-five mortality Prevalence of stunting in children under five years of age Prevalence of underweight children under five years of age Sources of further information
WHO/UNICEF Joint Monitoring Programme (JMP), 2008. http://www.wssinfo.org/en/40_MDG2008.html
WHO/UNICEF JMP website: www.wssinfo.org UN-HABITAT, 2003. Water and Sanitation in the World’s Cities Other institutions involved WHO/UNICEF Joint Monitoring Programme for Water Supply and Sanitation UN-Habitat

40
3.5 Indicator: Access to improved sanitation facility
Indicator Proportion of population with access to improved sanitation, urban, and rural Methodology sheet
WHO/UNICEF, JMP (based on WWDR2 methodology sheet prepared by UNICEF, 2006 & MDG indicators guidelines http://mdgs.un.org/unsd/mdg/Resources/Attach/Indicators/HandbookEnglish.pdfhttp://mdgs.un.org/unsd/mdg/Resources/Attach/Indicators/HandbookEnglish.pdf
Example of illustration
used in WWDR3 Chapter 7 ; used in MDG report 2008 JMP global and regional reports (2008, 2006, 2004…)- http://www.wssinfo.org/en/40_MDG2008.html
Challenge area health Rationale / aspects of the challenge area
Access to adequate excreta disposal facilities is an important requirement if adverse health effects of poor sanitation are to be avoided. This indicator thus provides a measurement of both the potential exposure of the population to infectious agents associated with poor sanitation, and of the action taken to improve domestic sanitation. The indicator can be used: to help target and plan efforts to improve access to sanitation and to monitor progress of such measures to assess levels of social inequality and deprivation to help investigate associations between sanitary conditions and specific health effects. Good sanitation is important for urban and rural populations, but the risks are greater in urban areas where it is more difficult to avoid contact with waste.
DPSIR framework
impact
Goal and Target
Goal 7. Ensure environmental sustainability Target 10. Halve, by 2015, the proportion of people without sustainable access to safe drinking water and basic sanitation
Definition
Proportion of the urban and rural population with access to improved sanitation refers to the percentage of the population with access to facilities that hygienically separate human excreta from human, animal and insect contact.
Underlying definition and concepts
The Joint Monitoring Programme defines access to water supply and sanitation in terms of the types of technology and levels of service afforded. Improved sanitation facilities are facilities that ensure hygienic separation of human excreta from human contact. To be effective, facilities must be correctly constructed and properly maintained Sanitation is presented as a four step ladder that includes the proportion of population (1) using Improved sanitation facilities > Flush or pour flush toilet/latrine to : piped sewer system, septic tank, pit latrine > Ventilated improved pit (VIP) latrine > Pit latrine with stab > composting toilet 2) using a Shared sanitation facilities: sanitation facilities of an otherwise acceptable type shared between two or more households. shared facilities include public toilet (3) using Unimproved sanitation facilities: facilities that do not ensure hygienic separation of human excreta from human contact. Unimproved facilities include pit latrines without a slab or platform, hanging latrines and bucket latrines. (4) practicing open defecation: defecation in fields, forests, bushes, bodies of water or other open spaces, or disposal of human faeces with solid waste.
Specifications of the determinants needed
Information on what toilet facility members of a household usually use. Household sizes are computed into population figures. National population figures used are those provided by the UN-Population Division. Population projections used are based on medium variant population growth rate. Definitions for urban and rural areas are those defined by individual countries.
Computation The indicator is computed as the ratio of the number of people in urban or rural areas with access to improved excreta-disposal facilities to the total urban or rural population, expressed as a percentage. Population based data about the use of an improved sanitary facility, obtained from nationally representative household surveys, are used to calculate the proportion of the population with access to basic sanitation. Results of several household surveys are plotted against a time scale. A linear regression line is drawn through these points to estimate the coverage for a certain year. As a rule projections from the last data point are made up to a maximum of six years.
Unit of measurement
percentage
Data collection and source
Since the late 1990s, data have routinely been collected at national and sub national levels in more than 100 countries using censuses and surveys by national Governments, often with support from international
41
development agencies. Two data sources are common: administrative or infrastructure data that report on new and existing facilities, and data from household surveys, such as: - The Demographic and Health Surveys (DHS) - Multiple Indicator Cluster Surveys (MICS) - National Censuses - Reproductive Health Surveys - World Health Surveys (WHS) - Health and Nutrition surveys. The data sources used to calculate this indicator are nationally representative household surveys. Before those population-based data were available, provider-based data were used. Rural and urban population statistics come directly from population censuses.
Availability and quality
Evidence suggests that data from surveys are more reliable than administrative records and provide information on facilities actually used by the population.
Periodicity of measurement
Administrative data are often available annually. Household surveys are generally conducted every three to five years. WHO and UNICEF annually compile international data and prepare regional and global estimates based on household survey data. The frequency of all surveys combined amounts to one survey conducted per country in every 3-4 years. This frequency is adequate to determine actual changes in access to basic sanitation.
Scale of application
At national and global level For urban and rural areas By service level or facility type By household income level, determined by the wealth index – a composite of household assets and characteristics of the dwelling.
Geographical coverage
Urban, Rural, National, Regional and Global
Interpretation The question in the main household surveys specifically asks about what toilet facility members of the [your] household usually use. Unused or broken toilet facilities are therefore not recorded in household surveys. Whether usage includes usage all the time, by all members of households for both defecation and urinating is not assessed, but assumed. The improved sanitation types identified by the WHO/UNICEF JMP, by nature of their design should ensure a clean and healthful environment. Where wastewater from a public sewer ends up and if it is being treated, however, is not monitored systematically and can not be assessed by a household survey. It is up to every individual country or programme to monitor access to basic sanitation in more detail, taking into account gender aspects and important issues like privacy and cleanliness. Doing so at global scale would be too costly as lengthy observation and inspection times are required to adequately assess these parameters.
Issues GENDER ISSUES: Women and men usually have different roles in water and sanitation activities. The differences are particularly pronounced in rural areas. Women are most often the users, providers and managers of water in rural households and the guardians of household hygiene. If a water system breaks down, women are more likely to be affected than men because they have to travel farther for water or use other means to meet the household’s water and sanitation needs. DISAGGREGATION ISSUES:The indicator should be monitored separately for urban and rural areas. Owing to national differences in characteristics that distinguish urban from rural areas, the distinction between urban and rural population is not amenable to a single definition applicable to all countries. National definitions are most commonly based on size of locality, with rural population as the residual of population that is not considered urban. COMMENTS AND LIMITATIONS: When data are from administrative sources, they generally refer to existing sanitation facilities, whether used or not. Household survey data are therefore generally better than administrative data, since survey data are based on actual use of facilities by the surveyed population rather than the simple existence of the facilities. While access is the most reasonable indicator for sanitation facilities, it still involves severe methodological and practical problems, including the following: The data are not routinely collected by “the sector” but by others outside the sector as part of more general surveys Facility quality is not systematically addressed The timing of collection and analysis of household survey data is irregular, with long intervals between surveys The definition of access to improved sanitation facilities and methods for assessing it are even more contentious than those for water, with national definitions of “acceptable” sanitation varying widely.
Linkage with other indicators
Though not directly a basic need for survival like drinking water, indirectly indiscriminate defecation and improper excreta disposal are principal determinants for both morbidity and mortality. The use of a sanitary facility is closely linked to appropriate hygiene behavior, and availability of clean drinking water. These three interventions combined maximize the positive effect in health. The indicator relates to most other health indicators, in particular those on water and sanitation related diseases, as well as the under-five
42
mortality. Recent studies show the importance of safe drinking water and sanitation for the survival of people living with HIV/AIDS.
Alternative methods and definition
UN-Habitat in the WWDR-I proposed a definition for safe and convenient sanitation specifically designed for people in urban slum and other high-density poor neighbourhoods: A provision for defecation that eliminates their (and others’) contact with human excreta and wastewater that are convenient, clean, easily accessed and affordable by all. UN-Habitat does not rule out public facilities that are often the only hygienic option in high-density areas, with limited space for individual hygienic facilities and without a central sewer system. Although Sulabh International operates several hundreds of thousands well maintained public facilities in India, there are currently no monitoring instruments to allow separating well-maintained and hygienic public or shared facilities from the inadequate unhygienic ones. The UN-Millennium Project has defined basic sanitation as: Access to, and use of excreta and wastewater facilities and services that provide privacy and dignity while at the same time ensuring a clean and healthful living environment both at home and in the immediate neighborhood of users. There are too many variables in this definition to be monitored cost-effectively at national and global level and to be interpreted unambiguously. Each variable needs to be further defined and likely requires a series of questions or observations to assess privacy, dignity or cleanliness. It is useful to have an ideal conceptual definition of what constitutes access to basic sanitation as a design standard or an ultimate goal to work towards to. But for national and international monitoring an operational definition or indicator is needed that is measurable in a cost-effective way and that provides a good approximation to the ideal definition.
Related indicator set
Access to safe drinking water Incidence of diarrhoeal disease in children under five years of age Under-five mortality Prevalence of stunting in children under five years of age Prevalence of underweight children under five years of age
REFERENCES AND INTERNATIONAL DATA COMPARISONS
ORC MACRO (2003). Demographic and Health Surveys – Providing Information for Informed Decisions in Population, Health and Nutrition. Internet site http://www. measuredhs.com. Calverton, Maryland. UNITED NATIONS (1998). Principles and Recommendations for Population and Housing Censuses, Revision 1, Series M, No. 67, Rev. 1. Sales No. E.98.XVII.1. Available from http://unstats.un.org/unsd/pubs (A,E, F, S). UNITED NATIONS (2001). Indicators of Sustainable Development: Guidelines and Methodologies. Sales No. E.01.II.A.6. Available from http://www.un.org/esa/ sustdev/natlinfo/indicators/isd.htm. UNITED NATIONS (2003). Millennium Indicators Database. Statistics Division Internet site http://millenniumindicators.un.org. UNITED NATIONS CHILDREN’S FUND (2003). Progress since the World Summit for Children. New York. Available from http://www.childinfo.org . WORLD BANK (2003) The Living Standards Measurement Study of the World Bank(LSMS). Internet site http://www.worldbank.org/lsms. Washington, D.C. WORLD HEALTH ORGANIZATION AND UNITED NATIONS CHILDREN’S FUND (2000). GlobalWater Supply and Sanitation Assessment2000 Report. Geneva. Available from http://www.who.int/docstore/ water_sanitation_ health/Globassessment/GlobalTOC.htm. WHO/UNICEF JMP, 2000. Global Water Supply and Sanitation Assessment 2000 WHO/UNICEF JMP website: www.wssinfo.org UN-HABITAT, 2003. Water and Sanitation in the World’s Cities.
AGENCIES responsible for data collection
National statistical offices United Nations Children’s Fund World Health Organization
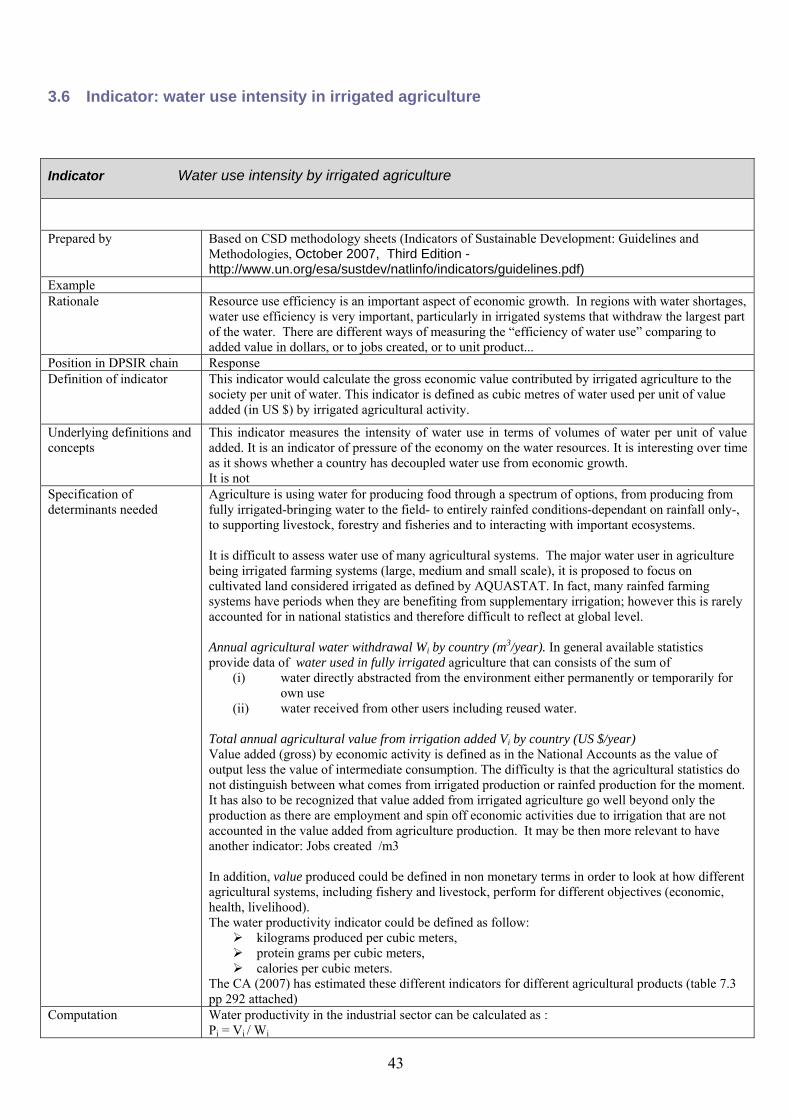
43
3.6 Indicator: water use intensity in irrigated agriculture
Indicator Water use intensity by irrigated agriculture
Prepared by Based on CSD methodology sheets (Indicators of Sustainable Development: Guidelines and Methodologies, October 2007, Third Edition - http://www.un.org/esa/sustdev/natlinfo/indicators/guidelines.pdf)
Example Rationale Resource use efficiency is an important aspect of economic growth. In regions with water shortages,
water use efficiency is very important, particularly in irrigated systems that withdraw the largest part of the water. There are different ways of measuring the “efficiency of water use” comparing to added value in dollars, or to jobs created, or to unit product...
Position in DPSIR chain Response Definition of indicator This indicator would calculate the gross economic value contributed by irrigated agriculture to the
society per unit of water. This indicator is defined as cubic metres of water used per unit of value added (in US $) by irrigated agricultural activity.
Underlying definitions and concepts
This indicator measures the intensity of water use in terms of volumes of water per unit of value added. It is an indicator of pressure of the economy on the water resources. It is interesting over time as it shows whether a country has decoupled water use from economic growth. It is not
Specification of determinants needed
Agriculture is using water for producing food through a spectrum of options, from producing from fully irrigated-bringing water to the field- to entirely rainfed conditions-dependant on rainfall only-, to supporting livestock, forestry and fisheries and to interacting with important ecosystems. It is difficult to assess water use of many agricultural systems. The major water user in agriculture being irrigated farming systems (large, medium and small scale), it is proposed to focus on cultivated land considered irrigated as defined by AQUASTAT. In fact, many rainfed farming systems have periods when they are benefiting from supplementary irrigation; however this is rarely accounted for in national statistics and therefore difficult to reflect at global level. Annual agricultural water withdrawal Wi by country (m3/year). In general available statistics provide data of water used in fully irrigated agriculture that can consists of the sum of
(i) water directly abstracted from the environment either permanently or temporarily for own use
(ii) water received from other users including reused water. Total annual agricultural value from irrigation added Vi by country (US $/year) Value added (gross) by economic activity is defined as in the National Accounts as the value of output less the value of intermediate consumption. The difficulty is that the agricultural statistics do not distinguish between what comes from irrigated production or rainfed production for the moment. It has also to be recognized that value added from irrigated agriculture go well beyond only the production as there are employment and spin off economic activities due to irrigation that are not accounted in the value added from agriculture production. It may be then more relevant to have another indicator: Jobs created /m3 In addition, value produced could be defined in non monetary terms in order to look at how different agricultural systems, including fishery and livestock, perform for different objectives (economic, health, livelihood). The water productivity indicator could be defined as follow:
kilograms produced per cubic meters, protein grams per cubic meters, calories per cubic meters.
The CA (2007) has estimated these different indicators for different agricultural products (table 7.3 pp 292 attached)
Computation Water productivity in the industrial sector can be calculated as : Pi = Vi / Wi

44
Units of measurements US $/m3 Data sources, availability and quality
Primary data source: - Water use data from FAO’s AQUASTAT, data based on irregular national survey (every 5 to 10 years); data patchy for certain countries, up to 2006 only. - Value added for agricultural sector from world bank the World bank (http://www.worldbank.org/data/) and UNEP/GRID/DEWA (http://geodata.grid.unep.ch) Availability: the indicator was not compiled yet as lack data on value added from irrigation. (any suggestion on how to overcome this difficulty?) For the moment this indicator may be calculated where most of cultivated areas are irrigated. In that case, all value added from agriculture could be attributed to irrigated agriculture. Quality: data on agricultural water use are of irregular quality and often estimated. Questions have been added by FAO to the 2010 World agricultural census to improve the knowledge on water use but result cannot be expected for the next 5 years. It would also be useful to have more insights
Scale of application National Geographical coverage Global Interpretation As irrigation technology and agricultural practices improves, in particular with less water inputs,
reuse systems, crop pattern change, agricultural water productivity rises. Hence it is a measure of the socio-technological response to water scarcity. Low levels of agricultural water productivity may indicate countries where water is undervalued, and used for low value purposes, or simply where water is abundant. Agricultural water productivity is highest in irrigated agriculture (in comparaison to other production systems) and where water withdrawals are minimized from the onset.
Linkage with other indicators
This indicator links with other water uses, and could be compared to water productivity measured in other economic sectors (such as industry), or other agricultural systems water use. It is a well known fact that water productivity is higher in industry than in agriculture, therefore the comparison does not serve a purpose; however it may be interesting to compare the trends (speed of change). It seems interesting to link it up to changes in agricultural sector performance (reuse waste water, drainage water, recycling, etc) at the irrigation scheme level and to the water footprint of agriculture at national level.
Alternative methods and definitions
It is possible to represent agricultural water productivity as the agricultural value added per unit of water consumed by agriculture (i.e. using the national data for water consumption rather than water withdrawals).
Related indicator sets World Bank : World Development Indicators (http://www.worldbank.org/data/) FAO’s AQUASTAT indicators;
Sources of further information
Compilations : UNEP’s GEO-GRID; World Resources Institute’s Earth trends database
Other institutions involved IWMI, ICID, World Bank
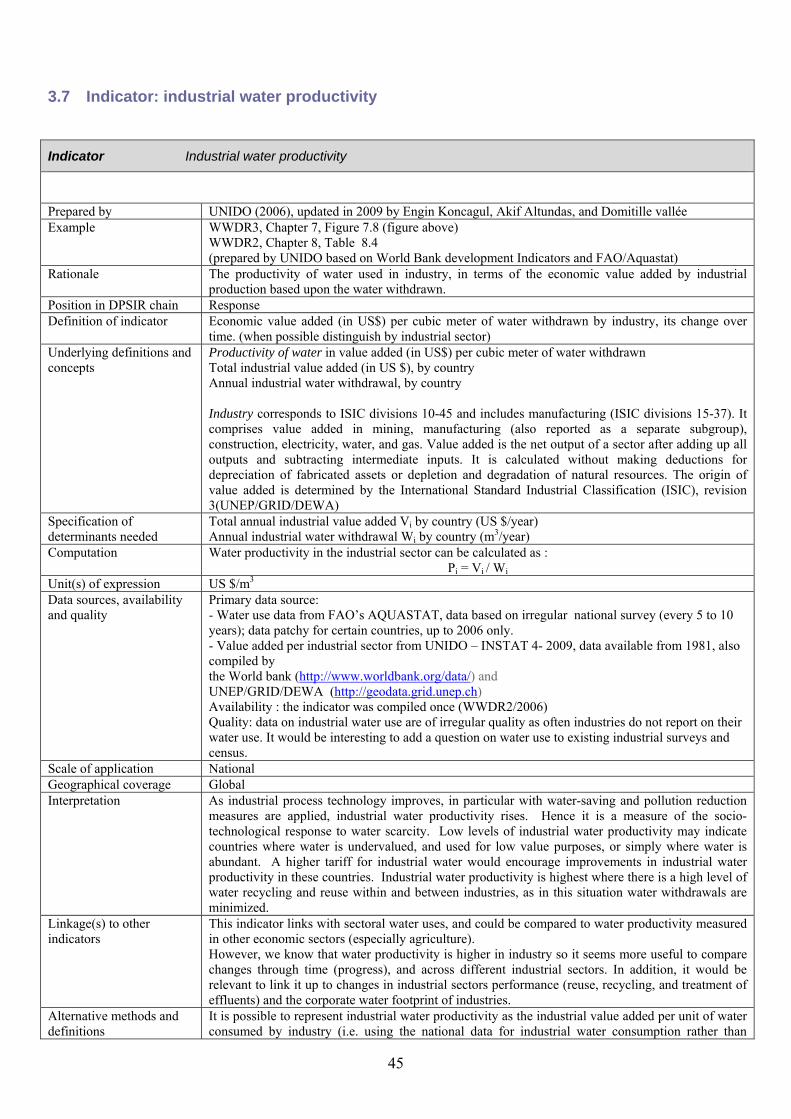
45
3.7 Indicator: industrial water productivity
Indicator Industrial water productivity
Prepared by UNIDO (2006), updated in 2009 by Engin Koncagul, Akif Altundas, and Domitille vallée Example WWDR3, Chapter 7, Figure 7.8 (figure above)
WWDR2, Chapter 8, Table 8.4 (prepared by UNIDO based on World Bank development Indicators and FAO/Aquastat)
Rationale The productivity of water used in industry, in terms of the economic value added by industrial production based upon the water withdrawn.
Position in DPSIR chain Response Definition of indicator Economic value added (in US$) per cubic meter of water withdrawn by industry, its change over
time. (when possible distinguish by industrial sector) Underlying definitions and concepts
Productivity of water in value added (in US$) per cubic meter of water withdrawn Total industrial value added (in US $), by country Annual industrial water withdrawal, by country Industry corresponds to ISIC divisions 10-45 and includes manufacturing (ISIC divisions 15-37). It comprises value added in mining, manufacturing (also reported as a separate subgroup), construction, electricity, water, and gas. Value added is the net output of a sector after adding up all outputs and subtracting intermediate inputs. It is calculated without making deductions for depreciation of fabricated assets or depletion and degradation of natural resources. The origin of value added is determined by the International Standard Industrial Classification (ISIC), revision 3(UNEP/GRID/DEWA)
Specification of determinants needed
Total annual industrial value added Vi by country (US $/year) Annual industrial water withdrawal Wi by country (m3/year)
Computation Water productivity in the industrial sector can be calculated as : Pi = Vi / Wi
Unit(s) of expression US $/m3 Data sources, availability and quality
Primary data source: - Water use data from FAO’s AQUASTAT, data based on irregular national survey (every 5 to 10 years); data patchy for certain countries, up to 2006 only. - Value added per industrial sector from UNIDO – INSTAT 4- 2009, data available from 1981, also compiled by the World bank (http://www.worldbank.org/data/) and UNEP/GRID/DEWA (http://geodata.grid.unep.ch) Availability : the indicator was compiled once (WWDR2/2006) Quality: data on industrial water use are of irregular quality as often industries do not report on their water use. It would be interesting to add a question on water use to existing industrial surveys and census.
Scale of application National Geographical coverage Global Interpretation As industrial process technology improves, in particular with water-saving and pollution reduction
measures are applied, industrial water productivity rises. Hence it is a measure of the socio-technological response to water scarcity. Low levels of industrial water productivity may indicate countries where water is undervalued, and used for low value purposes, or simply where water is abundant. A higher tariff for industrial water would encourage improvements in industrial water productivity in these countries. Industrial water productivity is highest where there is a high level of water recycling and reuse within and between industries, as in this situation water withdrawals are minimized.
Linkage(s) to other indicators
This indicator links with sectoral water uses, and could be compared to water productivity measured in other economic sectors (especially agriculture). However, we know that water productivity is higher in industry so it seems more useful to compare changes through time (progress), and across different industrial sectors. In addition, it would be relevant to link it up to changes in industrial sectors performance (reuse, recycling, and treatment of effluents) and the corporate water footprint of industries.
Alternative methods and definitions
It is possible to represent industrial water productivity as the industrial value added per unit of water consumed by industry (i.e. using the national data for industrial water consumption rather than

46
industrial water withdrawals). However, this would make it more difficult to compare productivity figures with agricultural water productivity, which is based upon water withdrawals.
Related indicator sets Data sources World Bank : World Development Indicators (http://www.worldbank.org/data/) FAO’s AQUASTAT; Compilations : UNEP’s GEO-GRID; World Resources Institute’s Earth trends database
Sources of further information
World Bank, UNIDO, OECD
Other institutions involved World Bank, UNECE, UNIDO, WWAP
47
3.8 Indicator: change in freshwater species
Indicator name % change in sample freshwater species
Prepared by 2010 Biodiversity Indicator partnership Example WWDR2, Rationale The abundance and distribution of selected species are an indicator of ecosystem quality. Several
assessments have revealed that the population size and/or geographic range of the majority of species assessed is declining. Exceptions include domestic species, invasive species, and species that have been protected through specific measures.
Position in DPSIR chain Definition of indicator % change in sample species
Species: A group of organisms that differ from all other groups of organisms and that are capable of breeding and producing fertile offspring. This is the smallest unit of classification for plants and animals. (Source: OceanLink Glossary of Common Terms and Definitions in Marine Biology)
More: An interbreeding group of organisms that is reproductively isolated from all other organisms, although there are many partial exceptions to this rule in particular taxa. Operationally, the term species is a generally agreed fundamental taxonomic unit, based on morphological or genetic similarity, that once described and accepted is associated with a unique scientific name. Source: Millennium Ecosystem Assessment Glossary