clean technology abc india global research - solar for india · pdf filethis report must be...
TRANSCRIPT

abcGlobal Research
We expect recovery on the back of
improvement in policy framework and other supporting factors
Wind is now cost competitive with new coal while solar will likely reach parity over 2016-18, in our view; we raise our solar installation forecasts
Reiterate UW(V) on Suzlon (TP: INR9) and N(V) on Gamesa (TP: EUR3.15), the two wind OEMs; estimate capacity additions across key developers over 2013-15
The worst is behind us
After a lull in 2012, we expect a recovery in 2013 and record-
high installations in 2014, as the investment climate improves.
Favourable policies. The policy framework for the clean
energy sector has improved over the past few months. Key
developments include: (i) increase in wind feed-in-tariffs across
six of the seven key wind states; and (ii) re-instatement of the
Generation Based Incentive (GBI) for wind projects. We expect
details on GBI before end-May.
Cost competitiveness of wind. Wind is now cost competitive
with new coal capacity, though solar is likely to reach parity
with new coal over 2016-18, in our view. India currently has
1.2GW of installed solar capacity and over 4GW of capacity is
at various stages of tariff bidding. We expect commissioning of
selected projects within two years.
After Coal, now water stress to provide a thrust. Coal stress
has been a key driver of renewables in India. We now see water
stress as also supporting renewables growth. For the third
consecutive year in a row, some coal-based capacity has been
closed down during the pre-monsoon period driven by water
shortages. We note that thermal power generation is the largest
water consumer within the industry segment in India.
Stocks. In our coverage of the wind sector, Suzlon (UW(V),
TP INR9) and Gamesa (N(V), TP EUR3.15) have relatively
high exposure to the Indian market and are the likely
beneficiaries of the renewables growth trend. In 2007-12
Suzlon’s market share in India fell 18% to 34%, while for
Gamesa it increased to 10% from nil. We list the expansion
plans of key renewable developers and key equity transactions
since early 2012 on pages 15-17.
Clean Technology India
India Renewables
Good bye winter, hello spring
30 April 2013 Charanjit Singh* Analyst HSBC Bank plc +91 80 3001 3776 [email protected]
Jenny Cosgrove* Analyst The Hongkong and Shanghai Banking Corporation Limited +852 2996 6619 [email protected]
Nick Robins* Analyst HSBC Bank plc +44 20 7991 6778 [email protected]
Sean McLoughlin* Analyst
HSBC Bank plc
+44 20 7991 3464 [email protected]
Monica Shrivastava* Associate, Bangalore
Our two wind stocks with material exposure to the India market
Company Bloomberg Ticker
Rating Current price Target price
Suzlon SUEL IN UW(V) INR14.30 INR9.0Gamesa GAM SM N(V) EUR3.02 EUR3.15
Note: Price as of close of 29 April 2013. Source: HSBC estimates, Bloomberg
View HSBC Global Research at: http://www.research.hsbc.com
*Employed by a non-US affiliate of HSBC Securities (USA) Inc, and is not registered/qualified pursuant to FINRA regulations
Issuer of report: HSBC Bank plc
Disclaimer & Disclosures This report must be read with the disclosures and the analyst certifications in the Disclosure appendix, and with the Disclaimer, which forms part of it

2
Clean Technology India 30 April 2013
abc
Gaining share
The GoI has doubled its renewable installation
target over the XII Five-Year Plan period (April
2013-March 2017) to 30GW from that in the XI
Five-Year Plan period. The plan targets to
generate 15GW from wind; 10GW from solar;
2.1GW from small hydro; and the balance from
other renewables, primarily biomass (refer to table
1). The additional renewable generation capacity
in the XII Five-Year Plan as a percentage of total
generation capacity is 25% vs. 21% in the XI plan
period (refer to chart 1).
The country’s share of renewable generation in
total electricity mix has also increased to c6% in
the last financial year (refer to chart 2). The GoI is
targeting to take this to 20% by the end of 2020,
which is unlikely in our view. During the first
year of the XII plan period, renewable
investments were down c50% y-o-y. However,
this was reflecting the effect of expiry of
incentives for wind, fewer project approvals for
solar and a decline in solar capital costs. We see
the situation recovering from the current financial
year (April 2013-March 2014).
Getting on track
GoI is targeting 30GW of renewable capacity addition during the
XII five-year plan period; this is c50% of the coal capacity
addition target
Total clean investments were down c50% y-o-y in 2012; we now
see multiple drivers for sector recovery
We forecast 5.6GW of new wind capacity and 2.8GW of new solar
capacity addition over 2013-14
Chart 1: Comparison of a percentage share of REN capacity during XI and XII FYP
Chart 2: Increasing share of REN in total electricity generation
20%
21%
22%
23%
24%
25%
26%
XI Plan (actual) XII Plan (proposal)
3.0%
3.5%
4.0%
4.5%
5.0%
5.5%
6.0%
6.5%
2007 2008 2009 2010 2011 2012e
Source: XII five-year plan document, Government of India (GoI)
Note: 2007 means financial year April 2007 to March 2008 and so on, 2012e is HSBC estimate Source: Central Electricity Authority, India, HSBC estimates

3
Clean Technology India 30 April 2013
abc
Table 1: Renewable capacity addition target under XI and XII five-year plans (GW)
XI Plan (April 2007-March 12)
XII Plan (April 2013-March 2017)
Wind 10.3 15.0 Solar 0.9 10.0 Small hydro 1.4 2.1 Biomass 2.0 2.9
Total 14.7 30
Source: XI and XII Five-Year Plan India
Policy support improves
Key developments over the past 12 months, which
in our view, support renewable growth are:
Wind feed in tariffs (FiTs) revised across
key states: Over the past 12 months, across
key wind states, except Karnataka, the wind
tariff has been raised. Six key states – Andhra
Pradesh, Gujarat, Madhya Pradesh,
Maharashtra, Rajasthan and Tamil Nadu –
have increased tariffs in the range of 2-36%
(refer to table 2). Karnataka’s wind tariff
approved in December 2009 is applicable for
five years. Hence, we expect a review next
year. A few other states such as Kerala have
also increased tariffs.
Table 2: Increase in Wind FiTs across states over past 12 months
State Old tariff (INR/kWh)
New tariff (INR/kWh)
% increase Tariff revised on
Tamil Nadu 3.39 3.51 4% Aug 2012 Gujarat 3.56 4.15 17% Aug 2012 Rajasthan 4.46 - 4.69 5.18 - 5.44 16% Sept 2012 Andhra Pradesh
3.5 4.7 34% Nov 2012
Kerala 3.64 4.77 31% Jan 2013 Madhya Pradesh
4.35 5.92 36% Mar 2013
Maharashtra 3.78 - 5.67 3.88 - 5.81 2% Mar 2013
Note: Rajasthan – INR 5.18/kwh for Jaipur, Jodhpur and Barmer districts and INR5.44/ kwh for the remaining state; Maharashtra – INR5.81/kwh (Wind Zone 1), INR5.05/kwh (Wind Zone 2)), INR4.31/kwh (Wind Zone 3),INR3.88/kWh Source: State electricity regulatory commissions
Generation Based Incentive (GBI) restored:
In its FY2014 (April 2013-March 2014) budget
the GoI reintroduced GBI for wind power. The
GoI has allocated INR8bn (USD160m) to the
Ministry of New and Renewable Energy
(MNRE) to support the reintroduction of GBI
for wind energy projects. However, few details
of the GBI scheme such as value; subsidy cap
per MW; term period; the maximum capacity
for which the benefit is available; clarification
on the depreciation rate; and other conditions
are still pending. Clarification on these details is
essential for investors to make informed
investment decisions.
State targets: Electricity is a state level subject
under the Indian Constitution. While the GoI
can make targets and provide incentives, unless
the states are interested in implementing this, the
GoI targets are unlikely to be achieved. During
the past 12 months, we have seen various states
announcing their wind and/or solar installation
targets (refer to table 3).
Wind Mission: The GoI has long been
forecasting a wind potential of c50GW across
India. However, studies conducted over the
past two years indicate a potential of more than
100GW to a few hundred GWs. Some
stakeholders are lobbying for a National Wind
Mission similar to the National Solar Mission.
The Wind Mission was not a part of the eight
missions mentioned under the National Action
on Climate Change (NAPCC). The formation
of a separate mission is likely to provide
further impetus to the wind sector’s growth.
Table 3: State wind and solar installation targets
State State Target
Wind Gujarat 2.1GW installations during XII FYPMaharashtra 1.8 GW installations during XII FYPTamil Nadu 5 GW installations during XII FYPSolarAndhra Pradesh
1.35GW of solar bids submitted against a target of 1.16GW allocations in 2013
Gujarat 0.8GW installed by Dec 2012 against a target of 0.5GW by 2014
Karnataka 0.125GW up to March 2014 and 0.2GW up to March 2016
Kerala 0.5 GW by 2017 and 1.5GW by 2030 (Draft policy) Madhya Pradesh
0.3GW by 2014 (Draft plan)
Maharashtra 0.2GW projects are announced and plan is to add another 0.2GW by 2015
Rajasthan 12GW by 2022Tamil Nadu 3GW by 2015Uttar Pradesh 1GW by 2017Orissa 0.05GW for 2012-13, 5GW by 2020
Source: State Electricity Commissions, MNRE

4
Clean Technology India 30 April 2013
abc
Reduced interest rate for renewables: The
GoI has committed to providing low interest-
bearing funds from the National Clean Energy
Fund (NCEF) for five years to the Indian
Renewable Energy Development Agency
(IREDA), the nodal agency providing debt
finance to renewable projects in India. India’s
Power Finance Corporation (PFC), another
lender to the power sector, has cut its lending
rate to renewable energy power projects by
50bp vis-à-vis a cut of 25bp for conventional
power plants to encourage the deployment of
more renewable energy capacity (source:
Bloomberg, 13 February 2013).
Other key drivers Renewables growth in India is driven by a
combination of factors listed in table 4 below:
Table 4: Key factors supporting renewable growth (other than the policy framework)
Factors Remarks
Coal constraints Supply constraints likely to persist Gas constraints Poor reserves and supply constraints Large hydro issues Limited resource, rehabilitation issues dominate Nuclear constraints Public concern, Nuclear liability bill issues
Cost competitiveness
Wind is now cost competitive with coal ; Solar costs have declined by c70% over the past four years and we expect that by 2016-18, solar will be competitive with new coal
Water Stress India is now a water stressed country; situation is likely to worsen further with economic growth and increasing population
Source: HSBC
Coal supply constraints and pricing risk
India has the fifth-largest global reserves of coal.
However, coal imports increased from c43m tonnes
to c118m tonnes in FY12, implying a CAGR of
c22%. Imports now meet c18% of the country’s
demand and have been up from c9% five years back.
Imports are likely to grow at a CAGR of 13% over
FY12 to FY17 and meet c21% of demand in FY17
(refer to Coal India Limited, Production growth key
to stock performance, 12 October 2012). With
international coal prices much higher than the
domestic coal price, the performance of generators
relying on imported coal has been
adversely affected.
Gas shortage and high price
India has less than 1% of the world’s gas reserves.
Over the past five years, domestic supply has
increased 54%, but way below the government and
industry expectations. Currently, India has c20GW
of gas-based generation capacity. In spite of a power
deficit in the country, average plant load factor
(PLF) of gas-based generation projects continues to
remain low (declined from 60% in FY11-12 to 40%
in FY12-13). On the imported gas price, these
projects are unviable, and domestic supply is likely
to remain constrained given the limited reserves and
supply issues.
Nuclear facing twin challenges
Public opposition and the Nuclear Liability Bill are
the two key challenges faced by the nuclear sector
in India. Post Fukushima, we have seen agitations
around existing and proposed nuclear project sites.
The Kudankulum nuclear plant site in Tamil Nadu,
where the construction was around 90% complete
when the Fukushima disaster struck Japan in March
2011, has still not started operations. The first unit
of the project is likely to commence operations
over a couple of months and the second unit in
December 2013.
Global nuclear OEMs are concerned about the
provisions of the Nuclear Liability Bill passed by the
GoI. No contracts have been awarded to date since
the passage of the Bill in August 2010.
India previously had been targeting a cumulative
capacity of c22GW by FY2022 (April 2022).
Seemingly, the target appears to have been scaled
down, as the GoI in its XII five-year plan is targeting
new capacity addition of 5.3GW by FY2017-end,
implying a cumulative capacity of only c10GW.
Declining cost of renewables
In our estimates, wind is now competitive with new
coal and solar is likely to reach that stage over
2016-19 (more details in the wind and solar sections
on page 6 and 7). Given the power deficit situation
in most of the states consumers rely on their own

5
Clean Technology India 30 April 2013
abc
diesel generators during power cuts. With off-grid
solar power generation now cheaper than diesel
power, we expect it to replace a significant
proportion of diesel generators over this decade.
Water stress aggravating
India is now a water-stressed nation (per capita water
availability less than 1700cu m). According to
available estimates by the Centre for Science and
Environment, c88% of the country’s industrial water
demand is taken up by thermal power plants. Over
the past few years, we have observed closures of
coal-based power stations and other water-intensive
facilities owing to the shortage of water primarily
during the pre-monsoon period (April- June). We
had highlighted the closures of coal-based
generating capacity of c6GW in 2011 and c1.5GW
capacity in 2012 (The resource efficiency mantra,
14 September 2011 and Escaping India’s resource
crunch, July 2012). The most severe black-out faced
by the country in 2012 was attributed to water
supply shortages (Water, are you stressed yet,
July 2012).
Currently, a couple of states - Maharashtra and
Kerala - are reporting severe draught. In
Maharashtra, the Parli thermal power plant with an
installed capacity of 1130 MW was partially shut
down in October 2012. Since February 2013, the
plant has been completely shut down owing to water
supply constraints. According to available plans,
c17GW of new coal-based generation capacity
addition is proposed to be added in Maharashtra over
the next five years. With observed capacity closures
in the state over the past few years, we see water
stress rising and increasing risk for new and existing
water-intensive facilities in the state. The water
stress issue in the Vidarbha region of Maharashtra is
also highlighted in the Greenpeace India report
entitled Coal Power Plants in Vidarbha,
December 2012.
Kerala is currently resorting to load shedding of two
hours per day, as the water level in its dams is
sufficient only for 25 days of hydro generation at the
current generation rate (source: Daily Pioneer,
22 April 2013). Various others such as Tamil Nadu,
Karnataka, Uttar Pradesh, Gujarat and Delhi are also
reporting water shortages. Weather forecasts are
predicting a normal monsoon in India, this year
(source: The Times of India, 26 April 2013).
However, any delay in rainfall is likely to worsen the
situation further.
For the first time, India’s five-year plan has
identified water as a scarce natural resource. The
plan mentions that under the business-as-usual
conditions, India’s water demand is expected to rise
50% by 2031 from current levels. It also estimates
that up to 20% of this increase can be met through
augmenting supply, primarily through storage and
ground water retention. The remaining gap has to be
bridged through water use efficiency. There are
proposals to improve water use efficiency within
industry through rationing and enforcing annual
water returns similar to tax returns. Many of the
industry leaders are also highlighting the impending
water crisis. Tata Steel (TATA IN, INR305,
Neutral), one of India’s key players in the metals and
mining sector, last year had set a target of reducing
water utilisation by half over 2005-20. The
Chairman of another key metal company Rashtriya
Ispat Nigam recently noted that water availability is
going to be an even bigger issue in the coming days
(source: Bloomberg, 22 April 2013).
Power supply deficit
India currently has a peak deficit of 12GW, which is
c9% of its demand, according to the Central
Electricity Authority (CEA). With electricity
demand expected to grow and conventional power
capacity facing its own challenges, we expect
developers and investors to favour renewable
capacity addition.

6
Clean Technology India 30 April 2013
abc
Wind competing with new coal
The tariff bids for new coal capacity submitted in
December 2012 in the state of Uttar Pradesh are in
the range of INR4.5-7/kwh (USDc8-13/kwh)
(refer to Indian Power: Power generators getting
risk averse = higher power cost, 20 December
2012). This is a significant increase over the tariff
bids range of INR3.3-5.6/kwh (USDc6-10/kwh)
received in 2011.
Wind FiTs across seven key wind states in the
country range from INR3.51-5.92/kwh (USDc6-
11/kwh), with four of them having a tariff lower
than INR4.5/kwh (USDc8/kwh), which is the lower
end of the tariff bids received in 2012 for the new
coal capacity. These four states together account for
c70% of India’s installed wind capacity.
We therefore note that wind is now cost
competitive with new coal-based generation
capacity. We also note that the upper end of the
wind FiT range is c15% lower than the upper end
of tariff bids received for new coal capacity
contracts in December 2012 (refer to chart 3).
Retain our wind installation forecasts
Owing to the expiry of wind incentives in April
2012, we have cut our 2012 and 2013 forecasts.
As we were expecting reinstatement of the GBI
during the current year, we have therefore
included the impact in our 2013 and 2014
forecast. The GBI is now approved in the budget
document; however, a Ministry notification with
details of the GBI scheme is still pending. We
expect this to be released before May-end, post
which we expect the installation rate to pick up.
However, this is likely to benefit more the
installations in 2014 than 2013 (refer to table
below). With our forecasts unchanged there is no
change our company forecasts.
Table 5: Wind installation forecasts (MW)
2013e 2014e 2015e
Capacity installation
2600 3200 3400
Source: HSBC estimates
Chart 3: Current Wind FITs across seven key states in India are lower than the bid price range of new coal capacity in the state of UP conducted in December 2012
0
1
2
3
4
5
6
7
MP
Mah
aras
htra
Raj
asth
an AP
Guj
arat
Karn
atak
a
Tam
il N
adu
INR/kWh
Bids submitted in Feb 2011
Bids for new coal capacity
submitted in Dec 2012
Note: Red Bar denotes that the state has a single tariff value. Few states such as Maharashtra and Rajasthan offer a tariff range based on wind conditions across the state. For such states the top of the grey bar denotes the upper end of tariff range. Source: State electricity regulatory commissions

7
Clean Technology India 30 April 2013
abc
Solar: Parity with new coal over 2016-18
The cost of solar systems has declined 70% over
2008-12. This is also reflected in the solar tariff
decline observed in India for solar projects over the
past three years (refer to Chart 4). The GoI has
recently announced that under Phase II of the
National Solar Mission, project developers are likely
to be paid INR5.45/kWh (USDc11/kwh), and they
can bid for capital support if they need. This support
will come through a Viability Gap Funding (VGF)
mechanism from the GoI. VGF could cover up to
c30% of the cost of project. Earlier, in December
solar tariff bids in the three states during December
2012, three states which went for tariff bids, have
seen prices dropping to cINR6.5/kwh
(USD0.12/kwh) and even lower in one particular
case. For the total bid capacity of c1.8GW only
c130MW was bid for a price lower than INR7/kwh
(USD0.13/kwh) and the majority of the capacity
(c750MW) was bid for a price range of INR7-8/kwh
(USD0.13-0.15/kwh). However, the state utilities
(buyers of solar power) across these states have fixed
a tariff of cINR6.5/kwh and are asking generators to
accept the mentioned price. We broadly expect
c0.9GW capacity (c50% of the bid capacity)
agreeing to this arrangement.
We now forecast grid parity for solar over 2016-18.
Earlier we had been forecasting grid parity over
2018-20 (refer to Global Solar Power, Solar
eclipsed, September 2009).
Updating installation forecasts In 2012, India installed around one GW of solar
capacity. In December 2012, the Ministry of New
and Renewable Energy (MNRE) released a draft
policy document for Phase II of the National Solar
Mission (NSM). In order to provide some respite to
lenders, the GoI is suggesting new supporting
mechanisms such as Viability Gap Funding (VGF)
and a change in the bundling scheme for utility scale
projects. Over 2013-2016, the GoI is targeting
c10GW of solar installations, which include 3.6GW
capacity under the Central Government (GoI)
Programme and another 5.4GW from the state
programmes. Of the 3.6GW capacity, 1.65GW of
grid-connected projects are scheduled to be allocated
this year and the remaining 1.95GW are planned to
be allocated next year. Considering the delay in
projection allotment under Phase II, we modify our
forecasts. A comparison of our old and new forecasts
is provided in table 6.
Chart 4: Solar tariff bids observed in India
0
5
10
15
20
25
Apr10 - (CERCtariff)
Nov10 - (1streverse bidding)
Dec11 - (2ndreverse bidding)
Dec12 - (Raj bids) Dec12 - (APBids)
Dec12 - (TN bids) Apr13 - (Phase IISolar M ission)
INR/kWh
Electricity price range from
Diesel generators
Price range for new coal capacity
bids submitted in Dec 2012
Source: CERC, PVTech, JNNSM, Economic Times, www.re-solve.in, HSBC
Table 6: Comparison of our new and old solar installation forecasts (MW)
2013e 2014e 2015e
New forecast 1,000 1,800 2,200 Old forecast 1,000 1,500 2,000
Source: HSBC estimates

8
Clean Technology India 30 April 2013
abc
Key challenges
We highlight some of the key challenges, which
once resolved, would we believe boost
investments in the sector.
GBI notification: The GBI has been approved
in the Central Government Budget; however,
notification is pending providing the details of
the GBI scheme such as value; subsidy cap
per MW; term period and the maximum
capacity for which the benefit is available;
clarification on the depreciation rate and other
conditions. Developers are unlikely to be
comfortable unless these details are available,
which could delay their investment decision.
Renewable Portfolio Obligations (RPO)
enforcement: Renewable Portfolio
Obligations enforcement across various states
remains weak. A total of 2.57m Renewable
Energy Certificates (RECs) were traded in the
previous financial year (April 2012-March
2013) at a weighted average price of
cINR1690/mwh. The REC closing inventory
on 31 March 2013 was 1.77m, which is c70%
of the RECs traded last year, clearly implying
significant oversupply. This has adversely
affected REC prices, which have continued to
trade at floor price since August 2012. This
has hit investor confidence (refer to Chart 5).
Lenders who were beginning to finance
projects using the REC mechanism are now
likely to do a U turn and stop funding projects
taking the REC route, unless any action is
taken to rectify the problem.
Grid infrastructure: Renewable projects are
relatively small and their location is driven by
the resource potential (wind/solar/hydro).
Hence, the government needs to boost the
grid and other infrastructure for exploiting the
resource potential across the country and
strengthen the existing grid infrastructure to
support increased intake of renewable
electricity. Failing to do this will lead to grid
stability concerns as being observed in the
state of Tamil Nadu. The grid issues are
limiting further wind capacity addition, where
a wind resource is available.
Poor health of distribution companies: The state
utilities are in poor financial health, with
payables in excess of cINR1.2trn as of 31
March 2012, from the seven major states. The
key reason for this has been the widening gap
between the average retail tariff and average
cost of supply, as most of the states have not
increased tariffs owing to political pressures.
However, post the measures undertaken by the
GoI, many states have increased retail tariffs in
FY2012-13 (April 2012-March2013). Around
Chart 5: Oversupply in the REC market adversely affected REC trading price over the past three quarters
0
500
1000
1500
2000
Apr-12 May -12 Jun-12 Jul-12 Aug-12 Sep-12 Oct-12 Nov -12 Dec-12 Jan-13 Feb-13 Mar-13
0
500
1000
1500
2000
2500
3000
3500
Sell Bid Volume Cleared Price Floor Price Forbearance Price
INR/MWh
Floor Price
Forbearance(Cap) PriceNo. ofNon solar RECs ('000 MWh)
Source: Indian Energy Exchange, Power Exchange India Limited, Reconnect

9
Clean Technology India 30 April 2013
abc
18 states have already filed tariff petitions for
FY2013-14 (April 2013- March 2014). Of these,
nine states have already passed the tariff hike
order (refer to India Power, Stocks re-rating
possible as sector reforms, 22 April 2013). We
note that this problem is common for both the
conventional and renewable energy generators.
Dispute on domestic content requirement:
Clean energy now features in a growing array
of disputes around the world. The GoI also
wants to promote domestic manufacturing and
supply of solar systems. It has therefore
introduced some domestic content requirements
for the Phase I projects under the National Solar
Mission (NSM). Though no decision has been
taken to introduce a similar requirement for
Phase II of the NSM, the US still raised the
issue at the World Trade Organisation (WTO)
meeting in February 2013. The US view point
is that the provision of domestic content
requirement violates the free trade agreement
norms. Delay in a decision on the matter could
delay project installations under the
programme, in our view.

10
Clean Technology India 30 April 2013
abc
Suzlon losing market share
In 2012, Suzlon had 34% market share in India,
followed by Wind World India (25%), Regen
(15%) and Gamesa (10%) respectively. However,
we note that Suzlon’s market share has been eaten
away by other wind OEMs over the last few years.
Since 2007, its share has fallen 18% (52% in 2009 to
34% in 2012) (refer to charts 6 and 7). However,
Gamesa’s market share has increased to 10%
from nil.
Suzlon (UW(V), TP INR9)
Investments thesis
Suzlon recently announced that it will issue new
shares to lenders and promoters for equity infusion.
The number of shares issued will increase to c2.91bn
by September 2014 (currently c1.78bn). We estimate
that BVPS will be c INR9 as of 31 March 2013(vs.
INR29 on 31 March 2012), thereby implying a 2/3rd
value loss in one year. Suzlon defaulted on its
October 2012 FCCB repayments, which further
resulted in a cross-default on its other FCCBs.
Suzlon is negotiating a restructuring package with
cUSD407m FCCB holders. In our view, further
equity dilution and increase is a possibility. For
further details on the stock refer to our company note
Suzlon - UW (V): Beware the dilution effect,
12 March, 2013.
Beneficiaries
Among our global wind coverage, Suzlon and Gamesa have
relatively strong exposure to the India market
Estimated expansion plan of key wind developers covers over
70% of our wind installation forecasts for 2013-15
We list some of the key equity transactions since early 2012
Chart 6: Wind OEMs – Market share in India (CY11) (1780 MW) Chart 7: Wind OEMs – Market share in India (CY12) (c2300MW)
Suzlon
52%
Others
2%
Pioneer
Wincon
1%
Enercon
26%
Vestas
RRB
Vestas
11%
NEPC
2%
Suzlon
34%
WWI
25%
Others
7%GE
5%
Regen
15%
Gamesa
10%Vestas
4%
Source: Make Consulting Source: Make Consulting

11
Clean Technology India 30 April 2013
abc
Valuation
We value the stock on one-year forward PB
multiple. Give the recent volatility, we value the
stock using a long-term (last four years) average PB
multiple of 1x; we value the stock at INR9, implying
no change to our target price.
Valuation based on DCF approach: On our
current forecasts using two DCF methodologies, the
HSBC four-stage ROIC-based DCF and a ‘classic’
FCF-based DCF, using an unchanged WACC of
12% (beta of 1.4, EMRP of 7.5% and gross cost of
debt of 11.0) yield values of INR11.7 and INR10.23
per share. The average of the two DCF values is
INR11.
Under our research model, for stocks with a
volatility indicator, the Neutral band is 10 ppts above
and below the hurdle rate for India stocks of 11%.
Or 12-month target price of INR9 implies potential
return of c-37%, which is below the Neutral band:
thus, we maintain our Underweight (V) rating on
the stock.
Potential return equals the percentage difference
between the current share price and the target price,
including the forecast dividend yield when indicated.
Risks
Upside Risks: Improvement in operations at a faster
rate than expectations; sufficient cash inflows from
operations and asset sales; higher-than-expected
ASP and profitability; higher than expected
synergies with REpower.
Gamesa (N(V), TP EUR3.15)
Investments thesis
Gamesa’s Q1 results delivered robust support to the
recent strong share price performance: a return to
profitability, underlining the effectiveness of
restructuring; an improving orderbook, easing the
risk of a volume shortfall (74% sales coverage in
2013); and reiteration of 2013 guidance (3-5% EBIT
margin on 1.8-2GW of turbine sales and positive
FCF). For further details on the stock refer to our
company note Gamesa - N(V): Q1 signals good
progress, 30 April 2013 (published prior to
this report).
Valuation
We value Gamesa on our RoE-implied price/book
multiple based on a 2015e RoE of 6.9%. A CoE of
10% (RFR 3%, ERP 6%, beta 1.2) gives us a target
forward book multiple of 0.69x , which yields a
price per share of EUR3.15.
Under our research model, for stocks with a
volatility indicator, the Neutral band is 10ppts above
and below the hurdle rate for eurozone stocks of 9%.
Our target price of EUR3.15 yields a c4% potential
return. We therefore maintain our Neutral (V) rating
on Gamesa.
Potential return equals the percentage difference
between the current share price and the target price,
including the forecast dividend yield when indicated.
Risks
Upside risks: We believe, these include better-than-
expected pricing and execution, any successful
M&A bid at a premium to the current price and
supportive policy announcements.
Downside risks: These include a slowdown of
orders, in particular in Latin America; higher-than-
expected restructuring costs and higher-than-
anticipated development costs for new turbines.
Analyst: Sean Mcloughlin, +44 20 7991 3464,

12
Clean Technology India 30 April 2013
abc
Suzlon’s premium to the peer group seems unjustified
Suzlon is trading at a premium to its global peers on
CY2013e EV/EBITDA multiple. It trades at an
EV/EBITDA multiple of 7.1x against a sector
average of 6.3x in CY2013 (refer to table 8). We
also plot a one-year forward ROE vs PB chart for the
four covered stocks (refer to chart 8). We believe
Suzlon’s premium to the peer group is unjustified
given its debt default and balance sheet issues.
Table 8: Relative valuation - Global wind turbine manufacturers
Company Bloomberg Rating Current price Target price __________ EV/EBITDA __________ ______________ PE _____________ 2012 2013e 2014e 2012 2013e 2014e
Suzlon SUEL IN UW(V) INR14.30 INR9.0 n.m. 7.1 5.2 n.m. n.m. 13.3 Nordex NDX1 GR UW(V) EUR5.57 EUR2.8 n.m. 6.5 5.9 n.m. 34.7 24.0 Gamesa GAM SM N(V) EUR3.02 EUR3.15 n.m. 5.0 4.4 n.m. 25.8 13.8 Vestas VWS DC UW(V) DKK48.92 DKK42.0 n.m. 6.5 3.5 n.m. n.m. 11.9 Sector average
6.3 4.7 30.2 15.7
Note: Price as of close of 29 April 2013. Data for Suzlon are for FY13, FY14 and FY15 respectively. Suzlon data are for the period April-March (2013e data are for April 2013-March 2014), whereas for other companies date are CY ; Source: HSBC estimates, Bloomberg
Chart 8: P/B vs ROE (one year forward)
Vestas
Gamesa
NordexSuzlon
0.0
0.2
0.4
0.6
0.8
1.0
1.2
1.4
1.6
-20% -15% -10% -5% 0% 5%
P/B ratio
RoE(%)
Source: Thomson Reuters DataStream, HSBC estimates

13
Clean Technology India 30 April 2013
abc
Financial statements
Year to 03/2012a 03/2013e 03/2014e 03/2015e
Profit & loss summary (INRm)
Revenue 210,824 191,852 273,471 295,041EBITDA 18,212 -9,933 22,948 28,853Depreciation & amortisation -6,612 -7,411 -7,372 -7,496Operating profit/EBIT 11,600 -17,344 15,576 21,358Net interest -16,547 -19,787 -18,133 -15,969PBT -1,332 -35,595 -1,517 6,429HSBC PBT -3,690 -35,581 -1,517 6,429Taxation -3,308 -3,069 -1,702 -3,351Net profit -4,367 -38,664 -3,219 3,077HSBC net profit -6,640 -38,650 -3,219 3,077
Cash flow summary (INRm)
Cash flow from operations -5,886 -40,407 -4,853 14,725Capex -8,947 -4,579 -4,401 -4,404Cash flow from investment -7,260 -2,379 5,599 -4,404Dividends -44 0 0 0Change in net debt 22,585 39,308 -2,448 -14,963FCF equity -22,789 -36,706 -23,405 7,130
Balance sheet summary (INRm)
Intangible fixed assets 2,243 2,243 2,243 2,243Tangible fixed assets 126,021 120,989 108,018 104,926Current assets 184,733 165,592 192,615 194,160Cash & others 26,325 20,000 20,000 20,000Total assets 326,300 302,127 316,179 314,631Operating liabilities 101,863 89,709 94,614 98,160Gross debt 140,340 173,323 170,875 155,912Net debt 114,015 153,323 150,875 135,912Shareholders funds 51,868 15,904 25,735 33,702Invested capital 184,809 179,115 188,262 183,169
Ratio, growth and per share analysis
Year to 03/2012a 03/2013e 03/2014e 03/2015e
Y-o-y % change
Revenue 17.9 -9.0 42.5 7.9EBITDA 131.5 -154.5 25.7Operating profit 797.6 -249.5 37.1PBT HSBC EPS
Ratios (%)
Revenue/IC (x) 1.2 1.1 1.5 1.6ROIC 4.9 -11.2 7.6 9.7ROE -11.3 -114.1 -15.5 10.4ROA 17.1 -5.5 11.4 3.4EBITDA margin 8.6 -5.2 8.4 9.8Operating profit margin 5.5 -9.0 5.7 7.2EBITDA/net interest (x) 1.1 1.3 1.8Net debt/equity 216.4 916.4 568.0 393.6Net debt/EBITDA (x) 6.3 -15.4 6.6 4.7CF from operations/net debt 10.8
Per share data (INR)
EPS Rep (fully diluted) -2.46 -21.75 -1.33 1.07HSBC EPS (fully diluted) -3.74 -21.75 -1.33 1.07DPS 0.00 0.00 0.00 0.00Book value 29.18 8.95 9.80 11.58
Key forecast drivers
Year to 03/2012a 03/2013e 03/2014e 03/2015e
Suzlon shipments (MW) 1,583 280 1,560 1,650Repower shipments (MW) 1,510 1,983 2,182 2,400Suzlon - Blended ASP* (Euro/W) 1 1 1 1Repower - Blended ASP* (Euro/W 1 1 1 1Suzlon order backlog (MW) 2,056 2,186 2,313 2,449Repower order backlog (MW) 3,675 2,225 2,337 2,257
Valuation data
Year to 03/2012a 03/2013e 03/2014e 03/2015e
EV/sales 0.6 0.9 0.6 0.5EV/EBITDA 7.0 7.1 5.2EV/IC 0.7 0.9 0.9 0.8PE* 13.3P/Book value 0.5 1.6 1.5 1.2FCF yield (%) -177.3 -285.6 -182.1 55.5Dividend yield (%) 0.0 0.0 0.0 0.0
Note: * = Based on HSBC EPS (fully diluted)
Issuer information
Share price (INR)14.30 Target price (INR)9.00 -
36.8
Reuters (Equity) SUZL.NS Bloomberg (Equity) SUEL INMarket cap (USDm) 467 Market cap (INRm) 25,327Free float (%) 43 Enterprise value (INRm) 166176Country India Sector Electrical EquipmentAnalyst Charanjit Singh Contact 91 80 3001 3776
Price relative
7
17
27
37
47
57
67
2011 2012 2013 2014
7
17
27
37
47
57
67
Suzlon Energy Ltd Rel to BOMBAY SE SENSITIVE INDEX
Source: HSBC Note: price at close of 29 Apr 2013
Financials & valuation: Suzlon Energy Ltd Underweight (V)
14
Clean Technology India 30 April 2013
abc
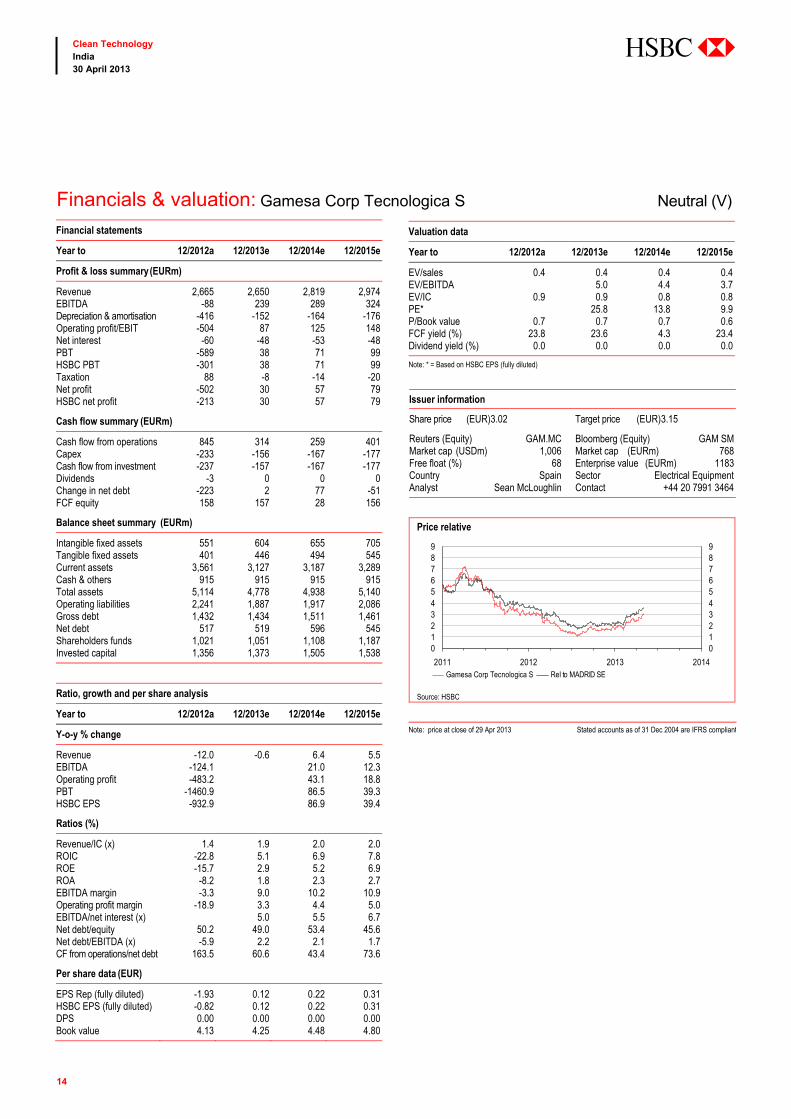
Financials & valuation: Gamesa Corp Tecnologica S Neutral (V) Financial statements
Year to 12/2012a 12/2013e 12/2014e 12/2015e
Profit & loss summary (EURm)
Revenue 2,665 2,650 2,819 2,974EBITDA -88 239 289 324Depreciation & amortisation -416 -152 -164 -176Operating profit/EBIT -504 87 125 148Net interest -60 -48 -53 -48PBT -589 38 71 99HSBC PBT -301 38 71 99Taxation 88 -8 -14 -20Net profit -502 30 57 79HSBC net profit -213 30 57 79
Cash flow summary (EURm)
Cash flow from operations 845 314 259 401Capex -233 -156 -167 -177Cash flow from investment -237 -157 -167 -177Dividends -3 0 0 0Change in net debt -223 2 77 -51FCF equity 158 157 28 156
Balance sheet summary (EURm)
Intangible fixed assets 551 604 655 705Tangible fixed assets 401 446 494 545Current assets 3,561 3,127 3,187 3,289Cash & others 915 915 915 915Total assets 5,114 4,778 4,938 5,140Operating liabilities 2,241 1,887 1,917 2,086Gross debt 1,432 1,434 1,511 1,461Net debt 517 519 596 545Shareholders funds 1,021 1,051 1,108 1,187Invested capital 1,356 1,373 1,505 1,538
Ratio, growth and per share analysis
Year to 12/2012a 12/2013e 12/2014e 12/2015e
Y-o-y % change
Revenue -12.0 -0.6 6.4 5.5EBITDA -124.1 21.0 12.3Operating profit -483.2 43.1 18.8PBT -1460.9 86.5 39.3HSBC EPS -932.9 86.9 39.4
Ratios (%)
Revenue/IC (x) 1.4 1.9 2.0 2.0ROIC -22.8 5.1 6.9 7.8ROE -15.7 2.9 5.2 6.9ROA -8.2 1.8 2.3 2.7EBITDA margin -3.3 9.0 10.2 10.9Operating profit margin -18.9 3.3 4.4 5.0EBITDA/net interest (x) 5.0 5.5 6.7Net debt/equity 50.2 49.0 53.4 45.6Net debt/EBITDA (x) -5.9 2.2 2.1 1.7CF from operations/net debt 163.5 60.6 43.4 73.6
Per share data (EUR)
EPS Rep (fully diluted) -1.93 0.12 0.22 0.31HSBC EPS (fully diluted) -0.82 0.12 0.22 0.31DPS 0.00 0.00 0.00 0.00Book value 4.13 4.25 4.48 4.80
Valuation data
Year to 12/2012a 12/2013e 12/2014e 12/2015e
EV/sales 0.4 0.4 0.4 0.4EV/EBITDA 5.0 4.4 3.7EV/IC 0.9 0.9 0.8 0.8PE* 25.8 13.8 9.9P/Book value 0.7 0.7 0.7 0.6FCF yield (%) 23.8 23.6 4.3 23.4Dividend yield (%) 0.0 0.0 0.0 0.0
Note: * = Based on HSBC EPS (fully diluted)
Issuer information
Share price (EUR)3.02 Target price (EUR)3.15 4
.1
Reuters (Equity) GAM.MC Bloomberg (Equity) GAM SMMarket cap (USDm) 1,006 Market cap (EURm) 768Free float (%) 68 Enterprise value (EURm) 1183Country Spain Sector Electrical EquipmentAnalyst Sean McLoughlin Contact +44 20 7991 3464
Price relative
0123456789
2011 2012 2013 2014
0123456789
Gamesa Corp Tecnologica S Rel to MADRID SE
Source: HSBC Note: price at close of 29 Apr 2013 Stated accounts as of 31 Dec 2004 are IFRS compliant

15
Clean Technology India 30 April 2013
abc
Key developers: estimating capacity expansion
Historically, a significant proportion of
installations in the Indian renewables market have
been by non-utilities/non developers. However,
the past three to four years have seen the
emergence of various renewable developers. We
estimate the proposed wind and solar capacity
additions over 2013-15 by using the announced
plans/indicative targets of some key developers
whose data we could gather (refer to tables 9 and
10). In cases where we believe that expansion
plans are aggressive and have downside risk –
primarily given likely issues around project
implementation and financing – we have applied a
discount to company targets. In cases where
companies have only announced short- to
medium-term targets, we have extrapolated the
targets to 2015.
Wind: 20 developers can contribute over 70% of our installation forecasts
Our analysis implies that over 2013-15, c6.6 GW of
new wind capacity is likely to be installed by the top
20 developers (refer table 9). This accounts for over
70% of our installation forecasts over 2013-15.
Solar: 20 developers could contribute c50% of our installation forecast
Unlike wind, the current size of solar developers is
relatively small and the current installations are
spread across a higher number of developers. Our
analysis implies that, over 2013-15, c2.4GW of new
solar capacity will be installed by around 20
developers listed in the table 10. This accounts for
c50% of our installation forecasts over 2013-15.
.
Table 9: Estimated wind installations over 2013-2015 for 20 key developers (MW)
Company Estimated capacity as at 31.03.2013
Est. installation target Est. target Year Estimated new capacity over 2013-15
CLP Power India. 482 725 2013 545 Continuum Energy 43 500 NA 350 Fersa Energias Renovables SA
82 100* 2013 70
Green Infra 270 2500 2015 300 Greenko Group 66 1015 NA 352 IIL&FS Renewables 170 330 NA 160 Inox Renewables 230 3000 2017 600 KSK Energy Ventures 71 NA NA 100 Leap Energy 100 300 2013 200 Mytrah Energy 310 5000 2017-2018 1150 NSL Power 150 750 NA 339 NuPower 68 1000 NA 150 Orient Green Power 342 450 NA 150 Panama Wind Energy 15 400 NA 200 Reliance Power 94 400 2014 300 RENew Power 25 1000 2015 475 Tata Power 397 580 NA 270 Techno Electric & Engineering
207 1250 2020 450
TVS Motors 27 200 2014 173 Welspun Energy 220 1000 2014 300 Total incremental capacity 6635
Average incremental capacity per annum
2211
Note: * denotes HSBC estimates Source: Company data, The Hindu Business Line, Times of India, www.energynext.in, Economic Times, Bloomberg , Livemint, The Hindu, Dealcurry, ICRA, Business Standard, HSBC estimates

16
Clean Technology India 30 April 2013
abc
Equity transactions: expecting pick up
Clean energy investments in 2012 declined c50%
y-o-y to cUSD6.5bn reflecting the effect of expiry
of incentives for wind, fewer project approvals for
solar and a decline in capital costs of solar per
MW (refer to Chart 9). We noticed no significant
new equity raises in the primary listed markets
and lower venture capital and private equity
investments, which declined c65% to USD123m
in 2012. We list the top private equity and venture
capital deals for wind and solar technologies in
tables 11 and 12 from 2012 to date.
Table 10: Estimated solar installations over 2013-2015 for 20 key developers (MW)
Company Estimated capacity as at 31.03.2013
Est. installation target Est. target Year Estimated new capacity over 2013-15
Adani Power 40 160 NA 120 Aditya Birla 0 100 2014 200 Alex group of companies 30 100-150 NA 70 Astonfield 24 50* NA 50 Azure Power 55 100 2014 95 Essel Energy 0 NA NA 50 Green Infra 35 250 2015 75 Kiran Energy Solar Power 80 300* 2015 220 Lanco Solar 95 395 NA 100 Mahindra Solar One 5 100 2014 95 Moser Baer Group 90 1000 2015 300 NTPC 10 301 2014 110 PLG Power Ltd 70 NA NA 20 Reliance Power 40 140 2013 300 SunBorne Energy 20 1000 2017-2019 105 Sun Edison 50 NA NA 50 Sunkon Energy 10 NA NA 20 Suryachakra Power 0 20* 2015 20 Tata Power Ltd. 30 NA NA 100 Welspun Energy 80 750 NA 260 Total incremental capacity 2360 Average incremental capacity per annum
787
Note: * denotes HSBC estimates Source: Company data, The Hindu Business Line, Business Wire India, The Hindu, Times of India, Bloomberg, Business Standard, www.energynext.in, Reuters, Gujarat Energy Development Agency, Economic Times, PR Newswire India, HSBC estimates
Chart 9: Clean energy investments in India decline c50% in 2012 vis-à-vis 2011
0
2
4
6
8
10
12
14
2011 2012e
Q1 Q2 Q3 Q4
USDbn
Source: Bloomberg New Energy Finance

17
Clean Technology India 30 April 2013
abc
Table 11: Key equity transactions in wind companies since early 2012
Quarter Company / Developer Investor Amount Type of financing
Q1 2012
Green Infra Tata Communications to buy 5.76% stake in Green Infra NA Equity investment RegenPower Tech IDFC PE and MCap Fund Advisors invest in ReGen Powertech USD 20mn (INR 1bn) Equity investment
Q2 2012
Inox Renewables International Finance Corporation (IFC) investment in Inox Renewables USD 40mn (INR 2bn) Equity investmentContinuum Wind Energy
Morgan Stanley Infrastructure Partners bought a 51% stake (we believe it is a milestone linked investment)
USD 240mn (INR 12bn). Equity investment
Welspun Energy Welspun Energy was in talks with renewable energy funds to sell a small stake. No updates post this.
USD 150mn to USD 200mn(INR 7.5bn to INR 12.5bn)
Equity investment
Q4 2012 Global Wind Power China Ming Yang Wind Power Group acquired 55% stake in Global Wind Power
NA Equity investment
Q1 2013
Suzlon Morgan Stanley bought 6.2% stake in Suzlon. USD 45mn (INR 2.2 bn) Equity investmentLeap Green Energy JP Morgan Asset Management invested in Leap Green Energy USD 18.2mn (INR 1bn) Equity investmentBharat Light and Power Draper Fisher Jurvetson, UTI Venture Funds Management and Ventureast.
Invested in Bharat Light & Power USD 18.6m (INR 989m) Equity investment
Greenko GIC Singapore invested in Greenko Group with the initial investment equivalent to a minimum of 19.5% of Greenko on a fully diluted basis
USD 150 mn(INR 8250mn) Equity investment
Green Infra IDFC PE invested in Green Infra USD 18mn (INR 900mn) Equity investmentQ2 2013
Orient Green Power Shriram group to pump in about USD 60m (INR 3bn) in OGPL. Already infused USD 30mn (INR 1.5bn)
USD 60mn (INR 3bn) Equity investment
Green Infra Piramal Enterprises is investing in Green Infra in a structured deal with debt and equity components
cUSD 100mn (INR 5bn) Equity and debt funding
Mytrah Energy Mytrah Energy is planning to list on the Singapore Exchange Securities Trading Ltd. (SEST)
NA Equity investment
Source: Company data, IFC, BNEF Bloomberg ,The Hindu Business India, Economic Times, Livemint, Dealcurry
Table 12: Key equity transactions in solar companies since early 2012
Quarter Company / Developer Project details Amount Type of financing
Q2 2012 Sunborne Energy Raised funds through VC funding as a part of its plan to raise USD 20mn(INR 1bn) equity funding.
USD 5mn (INR 284mn) Equity investment
Q3 2012 Flareum Technologies Zephyr Peacock fund invested in Gadhia Solar Energy Systems USD 1m (INR 50mn) Equity investmentQ3 2012 Solar Industries Oman India Joint Investment Fund acquired 4.28% stake in Solar
Industries. USD 13mn (INR 650 mn) Equity investment
Q1 2013 HHV Solar Technologies
Swelect Energy Systems acquired a 49% stake in HHV Solar Technologies USD 4.1m (INR 220m) Equity investment
Source: Company data, VC Circle, BNEF, Dealcurry

18
Clean Technology India 30 April 2013
abc
Disclosure appendix Analyst Certification The following analyst(s), economist(s), and/or strategist(s) who is(are) primarily responsible for this report, certifies(y) that the opinion(s) on the subject security(ies) or issuer(s) and/or any other views or forecasts expressed herein accurately reflect their personal view(s) and that no part of their compensation was, is or will be directly or indirectly related to the specific recommendation(s) or views contained in this research report: Charanjit Singh, Jenny Cosgrove, Nick Robins and Sean McLoughlin
Important disclosures
Equities: Stock ratings and basis for financial analysis
HSBC believes that investors utilise various disciplines and investment horizons when making investment decisions, which depend largely on individual circumstances such as the investor's existing holdings, risk tolerance and other considerations. Given these differences, HSBC has two principal aims in its equity research: 1) to identify long-term investment opportunities based on particular themes or ideas that may affect the future earnings or cash flows of companies on a 12 month time horizon; and 2) from time to time to identify short-term investment opportunities that are derived from fundamental, quantitative, technical or event-driven techniques on a 0-3 month time horizon and which may differ from our long-term investment rating. HSBC has assigned ratings for its long-term investment opportunities as described below.
This report addresses only the long-term investment opportunities of the companies referred to in the report. As and when HSBC publishes a short-term trading idea the stocks to which these relate are identified on the website at www.hsbcnet.com/research. Details of these short-term investment opportunities can be found under the Reports section of this website.
HSBC believes an investor's decision to buy or sell a stock should depend on individual circumstances such as the investor's existing holdings and other considerations. Different securities firms use a variety of ratings terms as well as different rating systems to describe their recommendations. Investors should carefully read the definitions of the ratings used in each research report. In addition, because research reports contain more complete information concerning the analysts' views, investors should carefully read the entire research report and should not infer its contents from the rating. In any case, ratings should not be used or relied on in isolation as investment advice.
Rating definitions for long-term investment opportunities
Stock ratings HSBC assigns ratings to its stocks in this sector on the following basis:
For each stock we set a required rate of return calculated from the cost of equity for that stock’s domestic or, as appropriate, regional market established by our strategy team. The price target for a stock represents the value the analyst expects the stock to reach over our performance horizon. The performance horizon is 12 months. For a stock to be classified as Overweight, the potential return, which equals the percentage difference between the current share price and the target price, including the forecast dividend yield when indicated, must exceed the required return by at least 5 percentage points over the next 12 months (or 10 percentage points for a stock classified as Volatile*). For a stock to be classified as Underweight, the stock must be expected to underperform its required return by at least 5 percentage points over the next 12 months (or 10 percentage points for a stock classified as Volatile*). Stocks between these bands are classified as Neutral.
Our ratings are re-calibrated against these bands at the time of any 'material change' (initiation of coverage, change of volatility status or change in price target). Notwithstanding this, and although ratings are subject to ongoing management review, expected returns will be permitted to move outside the bands as a result of normal share price fluctuations without necessarily triggering a rating change.

19
Clean Technology India 30 April 2013
abc
*A stock will be classified as volatile if its historical volatility has exceeded 40%, if the stock has been listed for less than 12 months (unless it is in an industry or sector where volatility is low) or if the analyst expects significant volatility. However, stocks which we do not consider volatile may in fact also behave in such a way. Historical volatility is defined as the past month's average of the daily 365-day moving average volatilities. In order to avoid misleadingly frequent changes in rating, however, volatility has to move 2.5 percentage points past the 40% benchmark in either direction for a stock's status to change.
Rating distribution for long-term investment opportunities
As of 30 April 2013, the distribution of all ratings published is as follows: Overweight (Buy) 44% (35% of these provided with Investment Banking Services)
Neutral (Hold) 38% (35% of these provided with Investment Banking Services)
Underweight (Sell) 18% (28% of these provided with Investment Banking Services)
Share price and rating changes for long-term investment opportunities
Gamesa Corp Tecnologica S (GAM.MC) Share Price performance EUR Vs
HSBC rating history
Recommendation & price target history
From To Date
Overweight (V) Neutral (V) 31 August 2010 Neutral (V) Overweight (V) 04 August 2011 Overweight (V) Neutral (V) 31 January 2012 Target Price Value Date
Price 1 5.34 31 August 2010 Price 2 5.05 27 October 2010 Price 3 7.04 31 March 2011 Price 4 6.79 04 August 2011 Price 5 3.15 31 January 2012 Price 6 2.67 27 February 2012 Price 7 1.30 14 August 2012 Price 8 1.65 31 October 2012 Price 9 2.00 24 January 2013 Price 10 2.30 13 February 2013 Price 11 3.15 30 April 2013
Source: HSBC
1
6
11
16
21
26
31
Apr-0
8
Apr-0
9
Apr-1
0
Apr-1
1
Apr-1
2
Apr-1
3
Source: HSBC Suzlon Energy Ltd (SUZL.NS) Share Price performance INR Vs HSBC rating
history
Recommendation & price target history
From To Date
Underweight (V) Neutral (V) 07 February 2011 Neutral (V) Underweight (V) 13 February 2012 Target Price Value Date
Price 1 42.00 31 August 2010 Price 2 43.00 29 September 2010 Price 3 40.00 01 November 2010 Price 4 50.00 07 February 2011 Price 5 60.00 02 August 2011 Price 6 20.00 04 January 2012 Price 7 10.00 11 June 2012 Price 8 9.00 13 November 2012
Source: HSBC
9
59
109
159
209
259
309
359
409
Apr-0
8
Apr-0
9
Apr-1
0
Apr-1
1
Apr-1
2
A pr-1
3
Source: HSBC

20
Clean Technology India 30 April 2013
abc
HSBC & Analyst disclosures Disclosure checklist
Company Ticker Recent price Price Date Disclosure
GAMESA CORP TECNOLOGICA S GAM.MC 3.02 29-Apr-2013 5, 7Source: HSBC
1 HSBC* has managed or co-managed a public offering of securities for this company within the past 12 months. 2 HSBC expects to receive or intends to seek compensation for investment banking services from this company in the next
3 months. 3 At the time of publication of this report, HSBC Securities (USA) Inc. is a Market Maker in securities issued by this
company. 4 As of 31 March 2013 HSBC beneficially owned 1% or more of a class of common equity securities of this company. 5 As of 31 March 2013, this company was a client of HSBC or had during the preceding 12 month period been a client of
and/or paid compensation to HSBC in respect of investment banking services. 6 As of 31 March 2013, this company was a client of HSBC or had during the preceding 12 month period been a client of
and/or paid compensation to HSBC in respect of non-investment banking securities-related services. 7 As of 31 March 2013, this company was a client of HSBC or had during the preceding 12 month period been a client of
and/or paid compensation to HSBC in respect of non-securities services. 8 A covering analyst/s has received compensation from this company in the past 12 months. 9 A covering analyst/s or a member of his/her household has a financial interest in the securities of this company, as
detailed below. 10 A covering analyst/s or a member of his/her household is an officer, director or supervisory board member of this
company, as detailed below. 11 At the time of publication of this report, HSBC is a non-US Market Maker in securities issued by this company and/or in
securities in respect of this company HSBC and its affiliates will from time to time sell to and buy from customers the securities/instruments (including derivatives) of companies covered in HSBC Research on a principal or agency basis.
Analysts, economists, and strategists are paid in part by reference to the profitability of HSBC which includes investment banking revenues.
For disclosures in respect of any company mentioned in this report, please see the most recently published report on that company available at www.hsbcnet.com/research.
* HSBC Legal Entities are listed in the Disclaimer below.
Additional disclosures 1 This report is dated as at 30 April 2013. 2 All market data included in this report are dated as at close 29 April 2013, unless otherwise indicated in the report. 3 HSBC has procedures in place to identify and manage any potential conflicts of interest that arise in connection with its
Research business. HSBC's analysts and its other staff who are involved in the preparation and dissemination of Research operate and have a management reporting line independent of HSBC's Investment Banking business. Information Barrier procedures are in place between the Investment Banking and Research businesses to ensure that any confidential and/or price sensitive information is handled in an appropriate manner.

21
Clean Technology India 30 April 2013
abc
Disclaimer * Legal entities as at 8 August 2012 ‘UAE’ HSBC Bank Middle East Limited, Dubai; ‘HK’ The Hongkong and Shanghai Banking Corporation Limited, Hong Kong; ‘TW’ HSBC Securities (Taiwan) Corporation Limited; 'CA' HSBC Bank Canada, Toronto; HSBC Bank, Paris Branch; HSBC France; ‘DE’ HSBC Trinkaus & Burkhardt AG, Düsseldorf; 000 HSBC Bank (RR), Moscow; ‘IN’ HSBC Securities and Capital Markets (India) Private Limited, Mumbai; ‘JP’ HSBC Securities (Japan) Limited, Tokyo; ‘EG’ HSBC Securities Egypt SAE, Cairo; ‘CN’ HSBC Investment Bank Asia Limited, Beijing Representative Office; The Hongkong and Shanghai Banking Corporation Limited, Singapore Branch; The Hongkong and Shanghai Banking Corporation Limited, Seoul Securities Branch; The Hongkong and Shanghai Banking Corporation Limited, Seoul Branch; HSBC Securities (South Africa) (Pty) Ltd, Johannesburg; HSBC Bank plc, London, Madrid, Milan, Stockholm, Tel Aviv; ‘US’ HSBC Securities (USA) Inc, New York; HSBC Yatirim Menkul Degerler AS, Istanbul; HSBC México, SA, Institución de Banca Múltiple, Grupo Financiero HSBC; HSBC Bank Brasil SA – Banco Múltiplo; HSBC Bank Australia Limited; HSBC Bank Argentina SA; HSBC Saudi Arabia Limited; The Hongkong and Shanghai Banking Corporation Limited, New Zealand Branch incorporated in Hong Kong SAR
Issuer of report
HSBC Bank plc 8 Canada Square
London, E14 5HQ, United Kingdom
Telephone: +44 20 7991 8888
Fax: +44 20 7992 4880
Website: www.research.hsbc.com
In the UK this document has been issued and approved by HSBC Bank plc (“HSBC”) for the information of its Clients (as defined in the Rules of FCA) and those of its affiliates only. It is not intended for Retail Clients in the UK. If this research is received by a customer of an affiliate of HSBC, its provision to the recipient is subject to the terms of business in place between the recipient and such affiliate. HSBC Securities (USA) Inc. accepts responsibility for the content of this research report prepared by its non-US foreign affiliate. All U.S. persons receiving and/or accessing this report and wishing to effect transactions in any security discussed herein should do so with HSBC Securities (USA) Inc. in the United States and not with its non-US foreign affiliate, the issuer of this report. In Singapore, this publication is distributed by The Hongkong and Shanghai Banking Corporation Limited, Singapore Branch for the general information of institutional investors or other persons specified in Sections 274 and 304 of the Securities and Futures Act (Chapter 289) (“SFA”) and accredited investors and other persons in accordance with the conditions specified in Sections 275 and 305 of the SFA. This publication is not a prospectus as defined in the SFA. It may not be further distributed in whole or in part for any purpose. The Hongkong and Shanghai Banking Corporation Limited Singapore Branch is regulated by the Monetary Authority of Singapore. Recipients in Singapore should contact a "Hongkong and Shanghai Banking Corporation Limited, Singapore Branch" representative in respect of any matters arising from, or in connection with this report. In Australia, this publication has been distributed by The Hongkong and Shanghai Banking Corporation Limited (ABN 65 117 925 970, AFSL 301737) for the general information of its “wholesale” customers (as defined in the Corporations Act 2001). Where distributed to retail customers, this research is distributed by HSBC Bank Australia Limited (AFSL No. 232595). These respective entities make no representations that the products or services mentioned in this document are available to persons in Australia or are necessarily suitable for any particular person or appropriate in accordance with local law. No consideration has been given to the particular investment objectives, financial situation or particular needs of any recipient. This publication has been distributed in Japan by HSBC Securities (Japan) Limited. It may not be further distributed, in whole or in part, for any purpose. In Hong Kong, this document has been distributed by The Hongkong and Shanghai Banking Corporation Limited in the conduct of its Hong Kong regulated business for the information of its institutional and professional customers; it is not intended for and should not be distributed to retail customers in Hong Kong. The Hongkong and Shanghai Banking Corporation Limited makes no representations that the products or services mentioned in this document are available to persons in Hong Kong or are necessarily suitable for any particular person or appropriate in accordance with local law. All inquiries by such recipients must be directed to The Hongkong and Shanghai Banking Corporation Limited. In Korea, this publication is distributed by The Hongkong and Shanghai Banking Corporation Limited, Seoul Securities Branch ("HBAP SLS") for the general information of professional investors specified in Article 9 of the Financial Investment Services and Capital Markets Act (“FSCMA”). This publication is not a prospectus as defined in the FSCMA. It may not be further distributed in whole or in part for any purpose. HBAP SLS is regulated by the Financial Services Commission and the Financial Supervisory Service of Korea. This publication is distributed in New Zealand by The Hongkong and Shanghai Banking Corporation Limited, New Zealand Branch incorporated in Hong Kong SAR. This document is not and should not be construed as an offer to sell or the solicitation of an offer to purchase or subscribe for any investment. HSBC has based this document on information obtained from sources it believes to be reliable but which it has not independently verified; HSBC makes no guarantee, representation or warranty and accepts no responsibility or liability as to its accuracy or completeness. The opinions contained within the report are based upon publicly available information at the time of publication and are subject to change without notice. Nothing herein excludes or restricts any duty or liability to a customer which HSBC has under the Financial Services and Markets Act 2000 or under the Rules of FCA and PRA. A recipient who chooses to deal with any person who is not a representative of HSBC in the UK will not enjoy the protections afforded by the UK regulatory regime. Past performance is not necessarily a guide to future performance. The value of any investment or income may go down as well as up and you may not get back the full amount invested. Where an investment is denominated in a currency other than the local currency of the recipient of the research report, changes in the exchange rates may have an adverse effect on the value, price or income of that investment. In case of investments for which there is no recognised market it may be difficult for investors to sell their investments or to obtain reliable information about its value or the extent of the risk to which it is exposed. In Canada, this document has been distributed by HSBC Bank Canada and/or its affiliates. Where this document contains market updates/overviews, or similar materials (collectively deemed “Commentary” in Canada although other affiliate jurisdictions may term “Commentary” as either “macro-research” or “research”), the Commentary is not an offer to sell, or a solicitation of an offer to sell or subscribe for, any financial product or instrument (including, without limitation, any currencies, securities, commodities or other financial instruments). HSBC Bank plc is registered in England No 14259, is authorised by the Prudential Regulation Authority and regulated by the Financial Conduct Authority and the Prudential Regulation Authority and is a member of the London Stock Exchange. (070905) © Copyright 2013, HSBC Bank plc, ALL RIGHTS RESERVED. No part of this publication may be reproduced, stored in a retrieval system, or transmitted, on any form or by any means, electronic, mechanical, photocopying, recording, or otherwise, without the prior written permission of HSBC Bank plc. MICA (P) 118/04/2013, MICA (P) 068/04/2013 and MICA (P) 110/01/2013

abc
Climate Change Centre of Excellence
Nick Robins Head, Climate Change Centre of Excellence +44 20 7991 6778 [email protected]
Zoe Knight Director, Climate Change Strategy +44 20 7991 6715 [email protected]
Wai-Shin Chan Director, Climate Change Strategy - Asia-Pacific +852 2822 4870 [email protected]
Lan Lan +852 3941 7186 [email protected]
Clean Technology
Jenny Cosgrove Regional Sector Head of Utilities - Asia-Pacific +852 2996 6619 [email protected]
Sean McLoughlin Vice President - Clean Technology +44 20 7991 3464 [email protected]
Charanjit Singh +91 80 3001 3776 [email protected]
Gloria Ho +852 2996 6941 [email protected]
Summer Y Y Huang +852 2996 6976 [email protected]
Christian Rath +49 211 910 3049 [email protected]
Murielle André-Pinard +33 1 56 52 43 16 [email protected]
Ravi Jain +1 212 525 3442 [email protected]
HSBC Climate Change Indices
Joaquim de Lima Global Head of Equity Quantitative Research +44 20 7991 6836 [email protected]
Vijay Sumon Director, Head of Indexation +44 20 7991 6839 [email protected]
Rajen Gokani +44 20 7991 6850 [email protected]
Utilities
Verity Mitchell +44 20 7991 6840 [email protected]
Specialist Sales Mark van Lonkhuyzen +44 20 7991 1329 [email protected]
Global Climate Change & Clean Technology Team