clean development mechanism simplified project design ... mw biomass co... · clean development...
TRANSCRIPT

CDM-SSC-PDD (version 02) CDM – Executive Board page 1
CLEAN DEVELOPMENT MECHANISM
SIMPLIFIED PROJECT DESIGN DOCUMENT FOR SMALL-SCALE PROJECT ACTIVITIES (SSC-CDM-PDD)
Version 02
CONTENTS
A. General description of the small-scale project activity B. Baseline methodology C. Duration of the project activity / Crediting period D. Monitoring methodology and plan E. Calculation of GHG emission reductions by sources F. Environmental impacts G. Stakeholders comments Annexes Annex 1: Information on participants in the project activity Annex 2: Information regarding public funding

CDM-SSC-PDD (version 02) CDM – Executive Board page 2
Revision history of this document
Version Number
Date Description and reason of revision
01 21 January 2003
Initial adoption
02 8 July 2005 • The Board agreed to revise the CDM SSC PDD to reflect guidance and clarifications provided by the Board since version 01 of this document.
• As a consequence, the guidelines for completing CDM SSC PDD have been revised accordingly to version 2. The latest version can be found at <http://cdm.unfccc.int/Reference/Documents>.

CDM-SSC-PDD (version 02) CDM – Executive Board page 3 SECTION A. General description of the small-scale project activity A.1. Title of the small-scale project activity: >> 15 Mw Biomass Co-Generation in Andhra Pradesh. A.2. Description of the small-scale project activity: >> The project activity consists of the expansion / modernisation of the biomass co-generation facility at Ganpati Sugar Industries Limited’s (GSIL) sugar mill at Sanga Reddy, Medak District of Andhra Pradesh, India. The biomass to be used as fuel would consist of bagasse generated by the sugar mill. Started in 2001 (project implementation), the project activity was among the first in India consisting of a high pressure boiler configuration (most sugar mills in India having co-generation units operate with low pressure boiler configuration of below 45 kg/cm2 (majority are in the range of 21 kg/cm2 to 45 kg/cm2) to cater to the in-house steam and power requirements). On the date of finalisation of the project, there were less than 4 similar projects implemented and operational in India, of which 3 were in the state of Tamil Nadu. The relatively low efficiency being a design choice historically made in the Indian sugar industry to eliminate the build-up of mountains of bagasses that represents an environmental and fire hazard. Despite being an in-efficient utilisation of resources, most sugar mills continue to operate under this Business as Usual scenario. In India, the major sugar cane growing states are as under:
State Area under cultivation
Growing season Crushing days per annum
Uttar Pradesh (03-04) 2030000 Hectares Sept – April 120 – 130 days Maharashtra (03-04) 536000 “ “ 100 – 160 days Karnataka (03-04) 237000 “ “ 100 – 200 days Andhra Pradesh (03-04) 203000 “ “ 100 – 160 days Tamil Nadu (03-04) 185000 “ “ 120 – 200 days As per the Indian Sugar Mill Association, there are 507 sugar mills in India. The total potential for bagasses co-generation being in excess of 50001 Mw, as against this, the installed capacity is a mere 750 Mw1 (at an average of ~ 1.5Mw / mill). Of the 5071 sugar mills in India, only 30 have cogeneration systems which are capable of meeting their in-house captive requirement as well as wheeling power to the grid among those only 16 are of a high pressure configuration out of which only 12 mills are successfully exporting power to the grid. This would confirm the fact that owing to historical and other operating / economic reasons, co-generation projects with high pressure configurations, for export of power to the regional Grid is not a standard practice. Under planned economy concept, the Government initially permitted small sized new units of 1250 TCD capacity only and later on increased the minimum economic size of plant to 2500 TCD and has recently increased this to 5000 TPD. Such policies of the government led to the sugar industry growing horizontally with an all India per unit average capacity of 2690 TCD.
1 Source :Indian Sugar Mill Association http://www.indiansugar.com/sugarstn.htm, ISMA publications

CDM-SSC-PDD (version 02) CDM – Executive Board page 4 The additional revenue, together with the enhanced project profile was a critical factor responsible for convincing the management of GSIL to consider investing in the proposed project. Details to establish this can be verified from documents available for inspection to the Operational Entity.
Project Description Location Status 15 Mw Co-generation unit – fuel bagasses + biomass
Sanga Reddy Mondal, Medak District, Andhra Pradesh, India
Commenced operations – January 2003. Currently in the process of securing registration under the CDM, as additional revenue from the sale of the CERs was a critical factor in the investment decision making process.
Contribution to Sustainable Development in the Host Country: The project activity has contributed to the sustainable development of the host country on account of:
1. Green House Gas emissions reduction: it is estimated that the projects would result in a cumulative GHG emissions reduction in excess of 1 million tones of CO2 equivalent over a period of 21 years.
2. Generating employment – other than direct plant related opportunities that will employ very minimally, there would be employment opportunities in material collection etc.
The Designated National Authority for CDM in India which is the Ministry of Environment & Forests, has stipulated the following indicators for sustainable development in the interim approval guidelines for Indian CDM projects. The project complies with the stipulations as under:
− Social well being: The CDM project activity quite clearly leads to the alleviation of poverty by generating additional employment, removal of social disparities and contribution to provision of basic amenities to people leading to improvement in quality of life of people. This is being achieved as the project results in additional employment opportunities for the people residing in the economic zone around the sugar mill.
− Economic well being: The CDM project activity should bring in additional investment consistent with the needs of the people. This is being achieved as the project has resulted in direct / indirect investments to the tune of INR 5300 lacs. Had the project not been implemented, this investment would not have been made in the specific region/area.
− Environmental well being: This should include a discussion of impact of the project activity on resource sustainability and resource degradation, if any, due to proposed activity; bio-diversity friendliness; impact on human health; reduction of levels of pollution in general. This is clearly being achieved as the project uses factory generated bagasses to generate power. In addition, the proposed energy plantation over dry / arid land (if successfully implemented) would result in a significant improvement of the quality of life for the people in the region.
− Technological well being: The CDM project activity should lead to transfer of environmentally safe and sound technologies with a priority to the renewables sector or energy efficiency projects that are comparable to best practices in order to assist in up gradation of technological base. This is being complied with as the technical configuration used for the project had been previously employed in less than 3 % of bagasses co-generation projects in the country. This high-pressure configuration has not been used in any public sector sugar mill till date.

CDM-SSC-PDD (version 02) CDM – Executive Board page 5 Each of the above indicators has been studied in the context of the project activity to ensure that the project activity contributes to the sustainable development. A.3. Project participants: >>Ganpati Sugar Industries Limited A.4. Technical description of the small-scale project activity: >> A.4.1. Location of the small-scale project activity: >> Sanga Reddy Mondal, Medak District, Andhra Pradesh, India A.4.1.1. Host Party(ies): >>India A.4.1.2. Region/State/Province etc.: >>Andhra Pradesh A.4.1.3. City/Town/Community etc: >>Sanga Reddy A.4.1.4. Detail of physical location, including information allowing the unique identification of this small-scale project activity(ies): >> The project site is located at Kulbagur, Fasalwadi Village,Sanga Reddy Mandal, Medak District of Andhra Pradesh (latitude 17 ° 38’17” and longitude 78 ° 7 ’17” some 75 Km from Hyderabad)
The following maps show the location of the sugar plants - Andhra Pradesh + Hyderabad in the map of India
a. Map of Andhra Pradesh – highlighting the Medak District
Figure 1 A.4.2. Type and category(ies) and technology of the small-scale project activity: >>Type I – Renewable Energy Projects

CDM-SSC-PDD (version 02) CDM – Executive Board page 6 I D – Renewable Energy Generation for a grid The predominant technology in all parts of the world today for generating megawatt (MW) levels of electricity from biomass is the steam-Rankine cycle, which consists of direct combustion of biomass in a boiler to generate steam, which is then expanded through a turbine. Most steam cycle plants are located at industrial sites, where the waste heat from the steam turbine is recovered and used for meeting industrial – process heat needs. The Steam – Rankin cycle involves heating pressurised water, with the resulting steam expansion driving a turbine generator, and then condensing back to water for partial / full recycling to the boiler. A heat exchanger is used in some cases to recover heat from the flue gases to preheat combustion air, and a derater is used to remove the dissolved oxygen from water before it enters the boiler. Steam turbines are designed as either “backpressure” or “condensing” turbines. Combined Heat and Power (CHP) applications typically employ backpressure turbines, wherein steam expands to a pressure that is still substantially above ambient pressure. The steam leaves the turbine in vapour form and is then used to satisfy industrial heating needs, where it condenses back to its liquid form. It is then partially or fully returned to the boiler. Alternatively, if process steam demands can be met using only a proportion of the available steam, a condensing-extraction steam turbine (CEST) might be used. This design includes the capability for more steam to be extracted at one of more points along the expansion path for meeting the process needs. Steam that is not extracted continues to expand to sub-atmospheric pressures, thereby increasing the amount of electricity per unit of steam compared to the back pressure turbine. The non extracted steam is converted back to liquid water in a condenser that utilises ambient air and/or a cold water source as the coolant. 2
Source : Williams & Larson, 1993 apud Kartha & Larson, 2000 p.101
The steam-Rankine cycle uses different boiler designs, depending on the scale of the facility and the characteristics of the fuel being used. The initial pressure and temperature of the steam, together with the pressure to which it is expanded, determines the amount of electricity that can be generated per kilogram
2 Williams & Larson, 1993 and Kartha & Larson, 2000 p. 101

CDM-SSC-PDD (version 02) CDM – Executive Board page 7 of steam. In general, the higher the peak pressure and temperature of the steam the more efficient, sophisticated and expensive the cycle is. The project is a grid connected sustainably grown biomass based co-generation power plant with a high-pressure steam turbine configuration.The plant is designed to operate with boiler outlet steam parameters 75 MT/Hr, of 67 kg/cm 2 and 480oC using bagasse as the primary fuel and other biomass as secondary fuel. .
PROJECT DETAILS Old Phase 1 – 15 MW
Boiler Capacity 35 TPH x 2 75 MTH/1 Temperature 380o C 480oC Pressure 32 Kg cm2 (ATA) 67 Kg cm2 Numbers 2 1 Turbine Capacity 3 Mw 15 MW Temperature 380oC 480oC Pressure 32 Kg cm2 Numbers 2 Power Generated Season 6 MW 15Mw Off Season Nil Nil Export to Grid Season Nil 10.36 MW Off – Season Nil 11.00 MW
The Indian Sugar sector being highly dependent on supply of locally grown sugar cane, which in turn is dependent on the monsoons, is a highly cyclic industry. GSIL aims to expand the surplus power generation of the mill’s co-generation system and add value to the bagasses from its sugar milling process.
GSIL invested a total of INR 1756 lacs for the acquisition of a new boiler providing 75 tons of steam per hour at 480° C and 67 bar multi drawel condensing type turbo generator of 15 MW, replacing two existing 3MW, low pressure configuration co-generation unit. The project included the setting up of a 10 Km transmission line, an energy sub station and other related infrastructure to facilitate the sale of surplus power to the regional Grid.
The initial Power Purchase Agreement entered into with the Transmission Corporation of Andhra Pradesh Limited for the sale of power to the grid at INR 2.25 per Kw Hr (base year 1994-95 with a 5% annual escalation), for a period of 4 years upto 31st March 2004.
It should be pointed out that this is currently under dispute, with the transmission company reducing the effective rate and filed a case in Supreme Court to revise the tariff. This incidence further highlights the risks (and thus a critical barriers) of setting up small power plants with a view to exporting power to the Grid.

CDM-SSC-PDD (version 02) CDM – Executive Board page 8 A.4.3. Brief explanation of how the anthropogenic emissions of anthropogenic greenhouse gas (GHGs) by sources are to be reduced by the proposed small-scale project activity, including why the emission reductions would not occur in the absence of the proposed small-scale project activity, taking into account national and/or sectoral policies and circumstances: >>
As of 31 March 2004, India had generation capacity of 112,058MW. Thermal plants, with 70% of total generation capacity, account for the bulk. The break-up of the balance was hydroelectric (26%), nuclear (2.4%) and wind (1.4%). Captive generation capacity was 19,061MW in addition to this capacity.
Power generators are either central government owned like NTPC, selling to one or more states/other bulk consumers such as railways; state government owned, selling only to the home state; private sector (IPPs), selling to one or more states; and captive power, which sells part of its surplus power to the state grid.
Central and state utilities are currently promised an ROE of 14% by the respective buyer. Earlier, IPPs were promised a 16% ROE or a fixed tariff if the contract is by way of a competitive bidding. Captive generators with surplus power are usually offered compensation only on their variable cost (no recovery of fixed costs) with or without a marginal profit element. There is, however, a proposal to provide incentives to bulk surplus generators by compensating them for part of their fixed charges, especially during peak demand requirements. This is however, yet to be finalized and as such there is a lack of clarity o the issue.
The power industry in India has been characterized by supply shortages. In FY04, demand for electricity exceeded supply by an estimated 7.1% in terms of total requirements and 11.2% in terms of peak demand requirements. Power generation capacity in India has increased substantially in recent years. However, it has not kept pace with the growth in demand. The total demand for electricity in FY04 was 559bn units vs. supply of 519bn units, resulting in shortfall of 40bn units (i.e. 7.1% of total demand).
The South Indian Regional Grid comprises of the Southern Indian states including Andhra Pradesh. By dispatching renewable energy to the South Indian Grid, the project alters the baseline scenario (however marginal the impact may be). The baseline scenario being that electricity would, in the absence of the project activity continue to be generated by the operation of grid connected power plants and by the addition of new generation sources, perhaps in a similar fuel / emission mix as the existing composition of the grid.
As the Andhra Pradesh electricity grid is connected to the South Indian Regional grid and almost all the grid connected generation units are must run projects (the grid facing a demand suppressed scenario) the Carbon Emission Factor of the south Indian Regional Grid, as computed by the Ministry of Non-conventional Energy Sources, Government of India (when applied to the electricity generated and delivered by the project) would provide an accurate estimation of the reduction of anthropogenic green house gases (GHG) that can reasonably expected on account of the said project activity. The weighted average emissions of the South Indian Regional Grid have been computed to be 937.41 t CO2eq / GWh of electricity produced. In addition to the above, the project has resulted in the reduction of GHGs as under : Reduction of Methane Emission: The project has resulted in a direct reduction of the quantity of Methane emitted on account of (1) Open air burning of bagasse

CDM-SSC-PDD (version 02) CDM – Executive Board page 9 (2) Surplus mill generated bagasses being dumped in open uncontrolled land fills, in absence of a market for the same (year 2000-01). However, as reduction in emissions of GHG in both (1) & (2) above cannot be accurately estimated, a conscious decision has been taken NOT to consider the GHG emissions reduction on account of the same for the computation of the annual volume of Carbon Credits. This has been done to ensure the highest levels of environmental integrity and to ensure that the results achieved are conservative. Bagasses are a fibrous biomass, generated as a by-product from processing sugarcane. It accounts for almost 25% of the weight of fresh cane and approximately one third of its energy content. In most Indian sugar mils, burning bagasses for generation of process heat and power production is an established practice, albeit very inefficiently and under very different equipment configuration. The plants typically installed are of very low pressure configuration, primarily to cater to the in house power requirements. Export of power to the grid is not a standard business practice. As per the resolution on National Electricity Policy and Mega Power policy drafted by the Ministry of power and the Planning commission in the year 20033 , the policies well supports Fossil fuel Based power generation than renewable energy based power generation. Hence it is clearly evident that in the absence of the project activity the emission reduction would not occur in cohesion with the policy guidelines. The fact that (according to the Indian Sugar Mill Association) of the 507 sugar mills in India, with a combined co-generation potential for generating bagasses co-generation power in excess of 5000Mw4, the total installed capacity is a mere 750 Mw1 (at a simple average of ~ 1.5Mw / mill). The is a clear and concrete indication of the fact that setting up high pressure boiler configuration and generating power for export to the grid is NOT a BAU practice in the Indian sugar industry. This further highlights the fact that :
1. There are significant barriers to implementing large (15 Mw+) high pressure configuration co-generation / biomass power plants in the country.
2. High pressure bagasses co-generation in Indian sugar mills is NOT a standard business practice.
This is further substantiated by the fact that of the 5071 sugar mills in India, only 30 have cogeneration systems of which only 16 Are of a high pressure configuration and only 12 Mills are successfully exporting power to the grid i.e. less than 3% of the mills export power to the grid.
The above would confirm the fact that owing to historical and other operating / economic reasons, co-generation projects with high pressure configurations, for export of power to the regional Grid is NOT a standard practice and thus NOT a Business As Usual scenario. Factors contributing to this is the perceived and actual risks associated with such capital intensive projects namely:
− There are NO regulatory/ other regulations requiring sugar mills to set up bagasses / biomass based power plants.
− Uncertainty with respect to the Power Purchase Agreement (PPA) & poor fiscal health of the state electricity boards, the principal customers is coupled with the uncertainty in tariff and low power purchase price offered. The power purchase agreement signed was for a period of 4 years upto 31st March 2004.
3 www.powermin.nic.in 4 Source :Indian Sugar Mill Association http://www.indiansugar.com/sugarstn.htm

CDM-SSC-PDD (version 02) CDM – Executive Board page 10 − Availability of Raw material / fuel: The availability of biomass fuel (primarily bagasses) is largely
dependent on the monsoons and is thus by nature cyclical. The recent dramatic changes in the climatic patterns + draughts has further compounded a already dire situation. This is a significant risk factor and typically, the sugar (and thus bagasses) producing season in Andhra Pradesh is limited to 160 - 180 days per annum, which in effect translates to a maximum PLF of ~ 40 - 55% on a calendar year.
− Credit worthiness of the state electricity boards, the primary customers- resulting in most financial institutions being unwilling to finance such projects.
− High Wheeling & distribution tariffs : Even though the Electricity Act 2003 has very forward looking and progressive ideas and stipulations, their compliance by the various electricity boards is dismal. This is largely on account of the fact that the electricity boards do not want to loose the large industrial customers, as they are ones subsidising all the sops offered to the ‘poor farmers’ by the political class. With a view to discourage a mass exodus to privately owned power generators, the State electricity boards, who control the grid has adopted a policy of levying high wheeling & distributing surcharge. Making direct 3rd party power sale a very complicated process.
− Poor financial condition of Sugar Mills : Typically most sugar mills in India have been going thru very poor financial condition. Skewed policy making by the central government coupled with a policy tilted in favour of the cane growers and a strict supply control regime has resulted in the market being completely distorted. This has severely eroded the ability of most players (barring a few large companies) to undertake significant capital intensive projects. Access to Carbon credits linked financing would help in achieving the risk return balance and making the projects attractive enough to attract the desired level of investments. ( data on the loss making mills)
Owing to the above, it can be concluded that bagasses based power generation projects (with a high pressure configuration) is NOT the business as usual scenario in the Indian sugar industry. Thus in the absence of the proposed project, the said emissions reduction would not have occurred.
A.4.3.1 Estimated amount of emission reductions over the chosen crediting period: >> The total emissions reduction for the first 7 years for each project is expected to be as under:
Phase 1 – 15 MW Year Electricity
exported to the Grid and
captive power generated-
GWh
Carbon Emission
Factor tCO2e /GWh
CERs generated tCO2e
2003 53.688 937.41 50,328 2004 36.253 937.41 33,983 2005 54.432 937.41 51,025 2006 54.432 937.41 51,025 2007 54.432 937.41 51,025 2008 54.432 937.41 51,025 2009 54.432 937.41 51,025
Total estimated reductions 3,39,436 Total number of crediting years 7

CDM-SSC-PDD (version 02) CDM – Executive Board page 11
Annual average over the crediting period of estimated reductions (tones of CO2 e)
48,491
A.4.4. Public funding of the small-scale project activity: >> Not Applicable as no funding from Annex 1 based institutions have been availed of. A.4.5. Confirmation that the small-scale project activity is not a debundled component of a larger project activity: >> Appendix C, paragraph 2 of the Simplified Modalities and Procedures for Small –Scale CDM project activities states: “A proposed small-scale project activity shall be deemed to be debundled component of a large project activity if there is a registered small-scale CDM project activity or a application to register another small-scale CDM project activity:
• With the same project participants • In the same project category and technology/measure; and • Registered within the previous two years; and • Whose project boundary is within 1 km of the project boundary of the proposed small-scale
activity at the closest point.” As there is currently no registered CDM project at the site either large scale or small scale, the project will meet the criteria on debundling. SECTION B. Application of a baseline methodology: B.1. Title and reference of the approved baseline methodology applied to the small-scale project activity: >> Type I – Renewable Energy Projects I D - Renewable electricity generation for a grid B.2 Project category applicable to the small-scale project activity: >> The project produces renewable energy from the combustion of bagasse. The plant is grid connected and the electricity supplied from the project activity to the grid would be expected to supplement existing and planned electricity generation from the grid, the majority of which is fossil fuel based. With regard to Appendix B of the Simplified Baseline and Monitoring Methodologies the project does not fall under point 28 and therefore there is a choice of two approaches left, 29 (a) or (b). We have chosen approach (a) as the baseline for this project: “(a) The average of the “approximate operating margin” and “build margin”,
where: (i) The “approximate operating margin” is the weighted average emissions (in kgCO2equ/kWh) of all generating sources serving the system, excluding hydro, geothermal, wind, low-cost biomass, nuclear and solar generation;

CDM-SSC-PDD (version 02) CDM – Executive Board page 12
(ii) The “build margin” is the weighted average emissions (in kgCO2equ/kWh) of recent capacity additions to the system, defined as the lower of most recent 20% of plants built or the 5 most recent plants;”
In the absence of the project activity, it is likely that only economically attractive courses of action will be implemented for grid electricity generation, which includes continued use of existing generation plants and significant expansion of existing capacity with new plants. Hence, the project participants selected approach 29(a) as most suitable for the project activity. The present project meets all of the above criteria. Therefore, the methodology is applicable to the project activity. B.3. Description of how the anthropogenic emissions of GHG by sources are reduced below those that would have occurred in the absence of the registered small-scale CDM project activity: >> Application of the tools for the demonstration and assessment of additionality of the project is used to demonstrate how the anthropogenic emissions of GHG by sources are reduced below those that would have occurred in the absence of the registered CDM project activity: Step 0: Preliminary screening based on the starting date of the project activity.
a. The starting date of this project activity is 29/04/2001. This can be easily established by checking the receipts of the equipment + proof of acquisition.
b. At the point in time when the decision to opt for the modern co-generation power facility was being taken, Ganpati Sugar was faced with many difficult choices / alternatives viz.:
The sugar industry in India was faced with indifferent conditions, prices were low and most companies were just about breaking even. The owners of GSIL had set-up the sugar mill in 1997 at a cost of almost INR 5264 lacs. Without getting returns on its investment, the decision to invest another INR 5300 in a new project based on a configuration and technology that was not an established norm in India, was a very difficult decision, more so when the fact that the power plant would lie unused for almost half the year was considered. It must be pointed out that :
There was no legal / statutory requirement for the Company to set up the project;
The State Electricity Boards, the primary customers were known to be unreliable as far as payment for power purchased was concerned.
The Power Purchase Agreement being offered was for a limited period of 4 years upto 31st March 2004. ;
Fuel Ethanol blending was being made mandatory and the Company could quite easily have opted for setting up a fuel ethanol project, with lower project off take risk and more credible customers;
It was during this time that the Kyoto Protocol was being discussed in some details in the Indian media, partly due to the efforts of the USAID and other agencies. Mr. P.M. Nair one of the Directors of GSIL was instrumental in convincing the board that the proposed project could be developed under the CDM (refer Annex:5 for board minutes dated 13/06/2000) and the fact that the additional revenue from developing the project under the CDM could significantly enhance the projects financial viability while simultaneously generating a significant amount of positive coverage and image for the

CDM-SSC-PDD (version 02) CDM – Executive Board page 13
company. The fact that it would have been one of the first sugar companies in the country to be developed under the CDM too was an additional attraction in support of the decision. Various documents and information pertained to comprehensively establish the fact, that the benefits of registering the project under the CDM was one of the key factors in pursuing the project can be made available to the Designated Operational Entity at the time of validation.
Step 1: Identification of alternatives to the project activity consistent with current laws and regulations. Sub step 1a: Define alternatives to the project activity: In the absence of any applicable rules / laws / regulations the alternatives to the proposed project activity included the following:
1. Continuing the BAU i.e. running the old low pressure configuration boiler and power system that generated adequate power to meet the internal requirements of the plant but not for exports. This in effect would lead to a continuation of the then prevailing scenario of the sugar mill with a focus on just the production of sugar;
2. Set up a distillery for manufacturing fuel ethanol: This option was seriously considered and had found favour, but was ultimately rejected as it would not have been eligible to generate CERs, as the then government was in the process of making it mandatory for fuel companies to blend 5% fuel ethanol with petrol;
3. Set up a new co-generation power project based on a high pressure boiler configuration and develop the project under the CDM.
Sub step 1b: Enforcement of applicable laws and regulations: Sub clause 2.
− The alternative to continue with the BAU situation prior to the decision to implement this project is completely consistent with the applicable laws and regulations.
Sub clause 3 – not applicable Sub clause 4:
− The project activity scenario and all the alternatives are in compliance with all applicable rules and regulations in the country.
Step 3: Barrier analysis Sub-step 3a: Identify barriers that would prevent a wide spread implementation of the proposed project activity:
(A) Investment barriers: The project being one of the first of its kind in the Indian sugar industry was faced with significant investment barriers eg.
a. Real / perceived risks include : i. Electricity Off take risk: State Electricity Board, the primary consumer & off
taker do not enjoy a very good reputation and track record as far as timely payment of dues is concerned.

CDM-SSC-PDD (version 02) CDM – Executive Board page 14
ii. Power Purchase Agreement Risk : The PPA was fixed for a period of 4 years upto 31st March 2004.. Considering the project life of 21 years, this was / is a very risky proposal. This is further borne out by the recent developments wherein the State Electricity Board has unilaterally decided to revise the PPA.
iii. Unfamiliar technology : Though the high pressure configuration was common in other parts of the world, the technology was new for the Indian sugar industry and thus perceived to be risky. Please note that GSIL was among the first few sugar mills to be exporting 10Mw + power to the grid, prior to this, only 3 out of the 507 sugar mills in India were exporting power to the Grid
b. Access to funding:
i. Bank finance: In view of the un-common configuration of the project, banks were reluctant to extend financing to the project. The problem was compounded by the fact that the primary (and only) buyer for the power to be generated was the State Electricity Board and these did/do not have a good reputation as far as timely payment of dues are concerned.
ii. Equity Funding: The Board of GSIL was divided as far as investments in the new
power project were concerned 13th June 2000. The resolution letter is being attached in Annex 5. With strong reservations being expressed about the financial viability of the project and its risks. Ultimately the argument that the project would be eligible for registration under the CDM (and its advantages) and the fact that it would be among the first Indian Sugar Mills to be registered helped convince the board about the merits of the projects.
(B) Technological barriers : The fundamental technological barrier was the fact that the project would be among the first with such a high pressure configuration. This was / is not a BAU practise in the Indian sugar Industry. The related barriers in terms of access to trained man power etc. were part and parcel of the project activity. (C) Prevailing Practice : In addition to the high pressure configuration, the fact that the project was exporting power to the Grid resulted in additional capital expenditure to the tune on INR 5300 lacs on setting up the infrastructure to evacuate the power generated. This was an uncommon practice and contrary to BAU practices in the Indian Sugar Industry. (D) Other barriers :These include, Cultural and Management expertise and focus: Operating and managing a large sized power plant (comparatively speaking) requires a separate set of skills in terms of sourcing and organizing the fuel supply, meeting the maintenance needs and dealing with the primary customers and the related legal compliance etc. The management of GSIL was / is more focussed on manufacturing and trading sugar, an activity that requires a completely different set of skills and a completely different mind set. Management related issues were thus a significant implementation barrier, as power related activities received and continue to receive lower than the desired level of priority.
Details of the barriers to project implementation can be made available to the Designated Operational Entity at the time of validation. Sub-step 3b. Show that the identified barriers would not prevent a wide spread implementation of at least one of the alternatives (except the project activity)

CDM-SSC-PDD (version 02) CDM – Executive Board page 15 The barriers to the project activity do not affect the alternatives to the identified project option as:
Continuing the BAU i.e. running the old low pressure configuration boiler and power system that generated adequate power to meet the internal requirements of the plant but not for exports would not require any additional effort from the part of the management. Nor would it need additional additional resources and would thus not be affected by the barriers outlined above.
Set up a distillery for manufacturing fuel ethanol: This option too would not be impacted by any
of the barriers outlined above as it (i) leverages the existing skills and operational expertise of the management; (ii) On account of the Government of India’s clear intention to make in mandatory to blend atleast 5% Fuel Ethanol with motor spirit, the market demand was established, with the large oil companies being the primary customers. The Oil companies are relatively good pay masters and unlike the power project, fuel ethanol can be stored and exported, should there be issues with the domestic market.
Step 4. Common Practice Analysis Sub-step 4a: Analyse other activities similar to the proposed project activity: The sugar sector, historically, has always exploited its biomass (bagasses) in an inefficient manner by making use of low-pressure boilers. Although they consume almost all the bagasse for self-energy generation purposes, it is done is such a manner that no surplus electricity is available for sale, and very few (if any) sugar company had ventured in the electricity market till very recently. The majority of projects implemented / under implementation are targeting registration under the Clean Development Mechanism in order to generate additional revenues that are so essential to make the projects viable and thus possible. Sub-step 4b: Discuss any similar options that are occurring As explained, of the approximately 507 sugar mills in India, with a total potential for bagasses co-generation in excess of 50005 Mw, , only 30 mills have co-generation facility (installed capacity a mere 750 Mw1 (at an average of ~ 1.5Mw / mill)). Of these 30 mills, only 16 are of high pressure configuration, of which only 12 are exporting power to the grid. This would confirm the fact that owing to historical and other operating / economic reasons, co-generation projects with high pressure configurations, for export of power to the regional Grid is NOT a standard practice. Most of the high pressure configuration projects have been implemented recently and most, if not all, of them are being developed under the Clean Development Mechanism. Step 5. Impact of CDM registration The registration of this CDM project activity, will contribute to overcome all the barriers described in this tool : Technological, institutional, economic, investment, cultural and management related barriers will all be significantly mitigated on account of the additional revenue generation from the sale of carbon credits. This would bring more solidity to the investment itself, thus fostering and supporting the project owner’s decision to the break through on their business model. The project activity is already engaged in negotiations to sell their expected CERs.
5 Source :Indian Sugar Mill Association http://www.indiansugar.com/sugarstn.htm

CDM-SSC-PDD (version 02) CDM – Executive Board page 16 In addition, the CDM project registration would influence other similar projects to be set up and encourage the use of CERs as an additional revenue stream that is reliable enough to be seriously considered in the project returns computation. The project developer plans to leverage the CERs generated form this project to set up another 20 Mw biomass power generation project for exclusive export of power to the Grid. The registration of this project would significantly aid in that process. B.4. Description of how the definition of the project boundary related to the baseline methodology selected is applied to the small-scale project activity: >> The project boundary shall consist of the power generation plant as well as the South Indian Regional grid, to which power is being exported. B.5. Details of the baseline and its development: >> Date of completion of the baseline study : 21/06/2005 Name of the entity conducting the baseline study : Ganpati sugar Industries Limited Name of the Person: Mr. P.M Nair, Director The project activity is generation of electricity for a grid system, which is also fed by other fossil fuel, and non-fossil fuel based generation units. Hence the applicable baseline methodology for the proposed project activity is as per Clause 29 of indicative simplified baseline and monitoring methodologies, which states that the baseline is the kWh produced by the plant multiplied by an emission coefficient (measured in KgCO2/kWh) calculated in a transparent and conservative manner. The baseline is estimated using the method specified under 29.a. i.e. the average of the “approximate operating margin” and “build margin”. The detailed baseline emissions calculations are provided separately in Annex 3. Baseline Emission Factor: 937.41 tCO2e/GWh SECTION C. Duration of the project activity / Crediting period: C.1. Duration of the small-scale project activity: >> C.1.1. Starting date of the small-scale project activity: >> 29/04/2001 C.1.2. Expected operational lifetime of the small-scale project activity: >>21 years C.2. Choice of crediting period and related information: >> The project activity will use a renewable crediting period C.2.1. Renewable crediting period: >>

CDM-SSC-PDD (version 02) CDM – Executive Board page 17 C.2.1.1. Starting date of the first crediting period: >> January 2003 C.2.1.2. Length of the first crediting period: >>7 years C.2.2. Fixed crediting period: >> Not applicable C.2.2.1. Starting date: >>Not applicable C.2.2.2. Length: >>Not applicable SECTION D. Application of a monitoring methodology and plan: >> D.1. Name and reference of approved monitoring methodology applied to the small-scale project activity: >> Type I – Renewable Energy Projects I D - Renewable electricity generation for a grid “Monitoring shall consist of metering the electricity generated by the renewable technology.” D.2. Justification of the choice of the methodology and why it is applicable to the small-scale project activity: >> The expansion of the bagasse cogeneration unit at the GSIL factory will provide electricity to the annexed sugar refinery and to the Andhra Pradesh grid. This electricity will displace existing grid generation capacity and future planned grid capacity additions. The main variable in determining the volume of emission reductions is the power exports to the sugar refinery and the grid. Exports of power are currently monitored by automated sensors (current transformers) installed at the 33kv step up plant for exports to the grid and sugar refinery. Monthly readings from the sensors at the step up plant are taken jointly by APCPDCL and the factory and form the basis for payments of power sold (in line with the current recording of these data the figures will be recorded as monthly totals, net of imports). Monthly readings of electricity supplied to the refinery are recorded by the factory staff and used for internal transfer pricing. The length of the season is a requirement in the calculation of the eligible exports. The season is currently recorded as part of the existing management information systems. This is normally recorded in days but will be converted to hours by multiplying the season length in days by twenty four. The mass of fossil fuel will be monitored through purchase receipts and may be cross checked against financial statements. Quality assurance for these two sets of data is high due to the commercial importance associated with power exports and the start and end dates of the crushing season are crucial to the most important dates in the operation of the factory.

CDM-SSC-PDD (version 02) CDM – Executive Board page 18

CDM-SSC-PDD (version 02) CDM – Executive Board page 19 D.3 Data to be monitored: >>
D.3.1 Data to be collected in order to monitor emissions from the project activity, and how this data will be archived: ID number (Please use numbers to ease cross-referencing to table D.3)
Data variable
Source of data Data unit
Measured (m), calculated (c), estimated (e),
Recording Frequency
Proportion of data to
be monitored
How will the data be archived? (electronic/
paper)
Comment
1 Electricity supplied to
the grid
Plant Records MWh M Hourly 100% Electronic Electricity supplied to the grid from the project.
2 Electricity consumed for captive
power purposes
Plant Records MWh M Hourly 100% Electronic Electricity supplied to the refinery plant from the project.
3 CEF of the grid
CEA Annual Generation Report & Local Statistics
Available
tCO2e/GWh
c Annual 100% electronic Calculated as the weighted sum of OM and BM Emission Factor
4 CEF Operating Margin of the grid
CEA Annual Generation Report & Local Statistics
Available
tCO2e/GWh
c Annual 100% electronic Calculated based on Simple OM CEF as indicated in the baseline methodology
5 CEF Build Margin of the grid
CEA Annual Generation Report & Local Statistics
Available
tCO2e/GWh
c Annual 100% electronic Calculated based on Simple BM CEF as indicated in the baseline methodology

CDM-SSC-PDD (version 02) CDM – Executive Board page 20 D.4. Qualitative explanation of how quality control (QC) and quality assurance (QA) procedures are undertaken: >> Data (Indicate table and ID number e.g. 3.-1.; 3.2.)
Uncertainty level of data (High/Medium/Low)
Explain QA/QC procedures planned for these data, or why such procedures are not necessary.
1 Low This will be cross checked with the bills raised by the company as well as the payment details by the grid operator. The actual quantity of electricity delivered to the Grid will be used for the CER computation purposes. Meters will undergo maintenance/calibration subject to appropriate industry standards. The accuracy of the meter readings will be verified by receipts issued by the purchasing power company.
2 Low The data will be archived from the internal generation data and consumption for the captive purposes. Meters will undergo maintenance/calibration subject to appropriate industry standards. The accuracy of the meter readings will be verified by receipts issued by the purchasing power company.
3 Low This involves the use of official data released by the power generating company. Quality control of this data is beyond the control of the project operators. However, the data, if considered unreasonable, may be supplanted by more accurate data according to methods verified by the DOE.
4 Low This involves the use of official data released by the power generating company. Quality control of this data is beyond the control of the project operators. However, the data, if considered unreasonable, may be supplanted by more accurate data according to methods verified by the DOE.
5 Low This involves the use of official data released by the power generating company. Quality control of this data is beyond the control of the project operators. However, the data, if considered unreasonable, may be supplanted by more accurate data according to methods verified by the DOE.
The project employs electronic based high accuracy monitoring and control equipment that will measure, record, report, monitor and control of various key parameters like generation by the project, auxiliary consumption and net energy exported to the grid. These monitoring and controls will be the part of the Distributed Control System (DCS) of the entire plant. Necessary standby meters or check meters will be installed, to operate in standby mode when the main meters are not working. All meters will be calibrated and sealed as per the industry practices at regular intervals. Hence, high quality is ensured with the above parameters. Sales records will be used and kept for checking consistency of the recorded data. Data for other parameters such as fuel consumption, generation by plant parameters etc. will be obtained from the official statistics published by the Central Electricity Authority and Ministry of Non-conventional Energy Sources, Govt. of India. Hence, quality control is not under the control of the project participants. However, the obtained data will be properly monitored, recorded and kept for verification. D.5. Please describe briefly the operational and management structure that the project participant(s) will implement in order to monitor emission reductions and any leakage effects generated by the project activity:

CDM-SSC-PDD (version 02) CDM – Executive Board page 21 >> Monitoring and recording of electricity exports will be carried out by the GSIL’s power division. Comprehensive systems are in place to accurately measure the electricity generated and exported to the grid on a continuous basis. This data will be signed off by the plant manager and then cross checked against the payment records / details provided by the Grid operator. The overall responsibility for ensuring the accuracy of the records as well as ensuring complete environmental integrity of the emissions reduction claims will rest with the Board, which has in turn appointed the General Manager of the power division to ensure that the details submitted are accurate. D.6. Name of person/entity determining the monitoring methodology: >> Ganpati sugar Industries Limited Name of the Person: Mr. P.M Nair, Director SECTION E.: Estimation of GHG emissions by sources: E.1. Formulae used: >> E.1.1 Selected formulae as provided in appendix B: >> No formula is used. Emissions by sources are zero since Baggase based cogeneration power is a zero CO2 neutral source of energy E.1.2 Description of formulae when not provided in appendix B: >> Calculation of the project GHG emissions reductions applies a weighted average emissions factor for all the thermal plants that are operational on the Southern grid of India as of Mar 2005. Appendix B of the simplified M&P for CDM small-scale project activities does not provide specific formulae for the baseline for project Category I.D paragraph 7.The detailed description is provided in section E.1.2.4 E.1.2.1 Describe the formulae used to estimate anthropogenic emissions by sources of GHGs due to the project activity within the project boundary: >> Not Applicable E.1.2.2 Describe the formulae used to estimate leakage due to the project activity, where required, for the applicable project category in appendix B of the simplified modalities and procedures for small-scale CDM project activities >> Despite the fact that the project activity has resulted in the reduction of emission of Methane (due to the surplus bagasse stored) as well as addition CO2 sequestered due the energy plantation, these have NOT been considered to enhance the environmental integrity of the proposed project Emissions reduction claim and to off-set minor leakages that may occur. E.1.2.3 The sum of E.1.2.1 and E.1.2.2 represents the small-scale project activity emissions: >>

CDM-SSC-PDD (version 02) CDM – Executive Board page 22 Project emissions are zero E.1.2.4 Describe the formulae used to estimate the anthropogenic emissions by sources of GHGs in the baseline using the baseline methodology for the applicable project category in appendix B of the simplified modalities and procedures for small-scale CDM project activities: >> Step1: Calculation of Operating Margin Emission Factor for the region based on Simple OM:
where Fi ,j, y Is the amount of fuel i (in a mass or volume unit) consumed by relevant power sources j in year(s) y. j Refers to the power sources delivering electricity to the grid, not including low-operating cost and must-run power plants, and including imports5 from the grid. COEFi,j y Is the CO2 emission coefficient of fuel i (tCO2 / mass or volume unit of the fuel), taking into account the carbon content of the fuels used by relevant power sources j and the percent oxidation of the fuel in year(s) y. GENj,y Is the electricity (GWh) delivered to the grid by source j. COEF = NCVi* EF CO2,i* OXIDi where NCVi Is the net calorific value (energy content) per mass or volume unit of a fuel i. EFCO2,i Is the CO2 emission factor per unit of energy of the fuel i. OXIDi Is the oxidation factor of the fuel (see page 1.29 in the 1996 Revised IPCC Guidelines for default values). Step2: Calculation of Build Margin Emission Factor for the region (ex-ante):
where Fi,m,y, COEFi,m Are analogous to the variables described for the simple OM method above for plants m. and GENm,y
Step 3: Calculation of Electricity Baseline Emission Factor:

CDM-SSC-PDD (version 02) CDM – Executive Board page 23
where the weights wOM and wBM, by default, are 50% (i.e., wOM = wBM = 0.5), and EFOM,y and EFBM,y are calculated as described in Steps 1 and 2 above and are expressed in tCO2/MWh. Step 4: Calculation of Baseline Emissions due to displacement of Electricity
where BEelectricity,y Are the baseline emissions due to displacement of electricity during the year y in tons of CO2.
EGy Is the net quantity of electricity generated in the bagasse-based cogeneration plant due to the project activity during the year y in GWh. EFelectricity,y Is the CO2 baseline emission factor for the electricity displaced due to the project activity in during the year y in tons CO2/GWh. E.1.2.5 Difference between E.1.2.4 and E.1.2.3 represents the emission reductions due to the project activity during a given period: >> Emission reductions from the project activity are 3,39,432 tCO2 throughout the first crediting period E.2 Table providing values obtained when applying formulae above: >>
Year 2003 2004 2005 2006 2007 2008 2009 Baseline emissions, E.1.2.4, tCO2
50328 33,983 51025 51025 51025 51025 51025
Project emissions, E.1.2.3, tCO2
0 0 0 0 0 0 0
Emissions Reductions, E.1.2.4 – E.1.2.3, tCO2
50328 33,983 51025 51025 51025 51025 51025
SECTION F.: Environmental impacts: F.1. If required by the host Party, documentation on the analysis of the environmental impacts of the project activity: >> Nothing significant

CDM-SSC-PDD (version 02) CDM – Executive Board page 24 SECTION G. Stakeholders’ comments: G.1. Brief description of how comments by local stakeholders have been invited and compiled: >> The local village regulators or Panchayats were approached for their comments and a meeting was called at the factory premises on 10th April 2000. Letters of support for the project activity was received from the local Panchayat (local village administration units) and can be verified by the Operational Entity. Copies of the letter sent and received are annexed G.2. Summary of the comments received: >> In turn panchayat on 13th April 2000 of the local village was very supportive and appreciated the fact that would generate employment opportunities as well as create a market for their surplus biomass. G.3. Report on how due account was taken of any comments received: >> The comments were taken on record and as they were all in support of the project no action was deemed necessary. Annex 1 CONTACT INFORMATION ON PARTICIPANTS IN THE PROJECT ACTIVITY The below entity is the project proponent Organization: Ganpati Sugar Industries Limited Street/P.O.Box: Road No. 4, Banjara Hills Building: 8-2-438/5 City: Hyderabad State/Region: Andhra Pradesh Postfix/ZIP: 500 034 Country: India Telephone: 91-40-23355212, 23355213, 23355214 FAX: 91-40-23350959 E-Mail: [email protected] URL: Represented by: P.M. Nair Title: Director Salutation: Mr. Last Name: Nair Middle Name: First Name: P.M Department: Operations & Research

CDM-SSC-PDD (version 02) CDM – Executive Board page 25 Mobile: Direct FAX: Direct tel: Personal E-Mail: Annex 2 INFORMATION REGARDING PUBLIC FUNDING
There is no funding from Annex- I parties

CDM-SSC-PDD (version 02) CDM – Executive Board page 26
Annex 3
BASELINE INFORMATION
Step 1: Calculation of Operating Margin Emission Factor (EF OM,y) based on Simple OM method
The “approximate operating margin” is the weighted average emissions (in t CO2equ / GWh) of all generating sources serving the system (in this case the South Indian Regional Grid)), excluding hydro, geo thermal, wind, low cost biomass, nuclear and solar generation;
Generation GWh
Emission Factor IPCC
Emissions tCO2e
Power station Owner Installed Capacity Fuel 2003
tCO2/GWh 2003
year of commissioning
Karnataka Raichur (unit 7) KPCL 210 Coal 3E 1470 1080 1586892 2002 Raichur (units 1 to 6) KPCL 1260 Coal 3E 8820 1080 9521353 1996 Tanir Bavi GMR 220 Naptha 1280 638 817142 2001 Bellary Pvt 25.2 Diesel 64 638 40857 Torangallu IMP Jindal 260 Gas 872 1080 941340 Belgaum Tata Diesel 355 638 226629 Yelahanka VVNL Diesel 715 638 456451 1993 Karnataka Hydro Hydro 4423 0 0 Kaiga NPC 440 Nuclear 3317 0 0 2000 Andhra Pradesh K_Gudam APGENCO Coal 3E 8729 1327 11587327 1998 Vijayawada APGENCO Coal 3E 10288 1044 10735883 1995 Ramagundam APGENCO 62.5 Coal 3E 390 1281 499509 1971 Nellore APGENCO Coal 3E 147 1487 218619 1965 Rayal Seema APGENCO Coal 3E 3488 1053 3671571 1995 Vijeshwaran APGPC Gas 2031 484 982059 Peddapuram CCGT REL 220 Gas 850 484 411005 2002 Jegurupadu GT GVK Gas 1583 484 765436

CDM-SSC-PDD (version 02) CDM – Executive Board page 27
Kondapalli Kondapalli Th Gas 2477 484 1197716
LVS Power LVS Power 36.8 Diesel 2 638 1277 2001 Godavari GT Spectrum Gas 1250 484 604419 R'gundam STPS NTPC 2100 Coal 16839 1053 17731618 1989 Simhadri NTPC 1000 Coal 4974 1053 5237667 2002 AP Hydro Hydro 3665 0 0 Kerala Brahamapuram DG KSEB Diesel 267 638 170451 Kozikode DG KSEB Diesel 385 638 245781 1999 Cochin CCGT REL NG 305 484 147478 1999 Kasargode RPG Diesel 148 638 94482 Kayamkulam NTPC 350 NG 2127 484 1028479 1999 Kerala Hydro Hydro 4860 0 0 TamilNadu Ennore TNEB Coal 3E 1747 1694 2958841 1970 Tutikorin TNEB Coal 9T 8187 1063 8703408 1979 Mettur TNEB Coal 9T 6739 1063 7164073 1987 North Chennai TNEB Coal 3E 4405 1053 4638574 1994 Basin Bridge TNEB NG 276 484 133456 1996 Nariman GT TNEB NG 0 484 0 Valuthur GT TNEB NG 104 484 50288 2003 Kovilakalappal TNEB NG 726 484 351046 Samayanallur Madurai P Diesel 589 638 376013 2001 Neyveli Pvt Lignite 406 1225 497544 2002 P Nallur CCGT PPNPG NG 2169 484 1048787 2001 Samalpatti DG Samalpatti Diesel 623 638 397718 2001 Basin Bridge DG Vasavi Diesel 1209 638 771816 Neyveli STI NLC Th Lignite 4421 1225 5417835 1970 Neyveli STII NLC Th Lignite 10495 1225 12861385 1993 Neyveli FST Ext NLC Th Lignite 89 1225 109067 2003 TN Hydro Hydro 2729 0 0 MAPP,kalpakam NPC 340 Nuclear 1073 0 0 1986 Wind Pvt Wind 1305 0 0 Pondichery
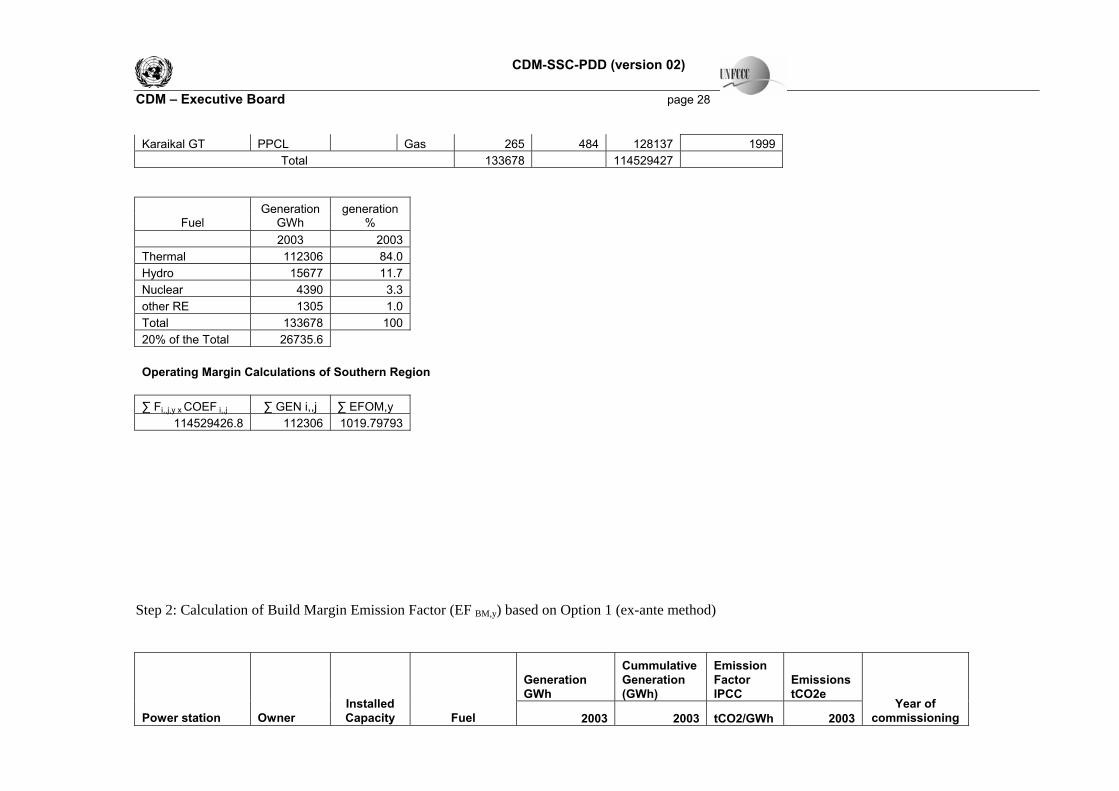
CDM-SSC-PDD (version 02) CDM – Executive Board page 28 Karaikal GT PPCL Gas 265 484 128137 1999
Total 133678 114529427
Fuel Generation
GWh generation
% 2003 2003
Thermal 112306 84.0 Hydro 15677 11.7 Nuclear 4390 3.3 other RE 1305 1.0 Total 133678 100 20% of the Total 26735.6 Operating Margin Calculations of Southern Region ∑ Fi,,j,y x COEF i,,j ∑ GEN i,,j ∑ EFOM,y
114529426.8 112306 1019.79793
Step 2: Calculation of Build Margin Emission Factor (EF BM,y) based on Option 1 (ex-ante method)
Generation GWh
Cummulative Generation (GWh)
Emission Factor IPCC
Emissions tCO2e
Power station Owner Installed Capacity Fuel 2003 2003 tCO2/GWh 2003
Year of commissioning

CDM-SSC-PDD (version 02) CDM – Executive Board page 29 Valuthur GT TNEB NG 104 104 484 50288 2003 Neyveli FST Ext NLC Th Lignite 89 193 1225 109067 2003 Raichur (unit 7) KPCL 210 Coal 3E 1470 1663 1080 1586892 2002 Peddapuram CCGT REL 220 Gas 850 2513 484 411005 2002 Simhadri NTPC 1000 Coal 4974 7487 1053 5237667 2002 Neyveli Pvt Lignite 406 7893 1225 497544 2002 Tanir Bavi GMR 220 Naptha 1280 9173 638 817142 2001 LVS Power LVS Power 36.8 Diesel 2 9175 638 1277 2001 Samayanallur Madurai P Diesel 589 9764 638 376013 2001 P Nallur CCGT PPNPG NG 2169 11933 484 1048787 2001 Samalpatti DG Samalpatti Diesel 623 12556 638 397718 2001 Kaiga NPC 440 Nuclear 3317 15873 0 0 2000 Kozikode DG KSEB Diesel 385 16258 638 245781 1999 Cochin CCGT REL NG 305 16563 484 147478 1999 Kayamkulam NTPC 350 NG 2127 18690 484 1028479 1999 Karaikal GT PPCL Gas 265 18955 484 128137 1999 K_Gudam APGENCO Coal 3E 8729 27684 1327 11587327 1998 Raichur (units 1 to 6) KPCL 1260 Coal 3E 8820 36504 1080 9521353 1996 Basin Bridge TNEB NG 276 36780 484 133456 1996 Vijayawada APGENCO Coal 3E 10288 47068 1044 10735883 1995 Rayal Seema APGENCO Coal 3E 3488 50556 1053 3671571 1995 North Chennai TNEB Coal 3E 4405 54961 1053 4638574 1994 Yelahanka VVNL Diesel 715 55676 638 456451 1993 Neyveli STII NLC Th Lignite 10495 66171 1225 12861385 1993 R'gundam STPS NTPC 2100 Coal 16839 83010 1053 17731618 1989 Mettur TNEB Coal 9T 6739 89749 1063 7164073 1987 MAPP,kalpakam NPC 340 Nuclear 1073 90822 0 0 1986 Tutikorin TNEB Coal 9T 8187 99009 1063 8703408 1979 Ramagundam APGENCO 62.5 Coal 3E 390 99399 1281 499509 1971 Ennore TNEB Coal 3E 1747 101146 1694 2958841 1970 Neyveli STI NLC Th Lignite 4421 105567 1225 5417835 1970 Nellore APGENCO Coal 3E 147 105714 1487 218619 1965 Bellary Pvt 25.2 Diesel 64 105778 638 40857
Total 105778 108424032

CDM-SSC-PDD (version 02) CDM – Executive Board page 30
Step 3: Calculation of Baseline Emission Factor Efy, as the weighted average of Operating Margin Emission Factor and Build Margin Emission Factor: Southern region emission factor A 20% of state grid 26736 B Plants meeting 20% 27684
C Last Five Plants Total 7487
∑ Fi,,j,y x COEF i,,j for C(t CO2) 23670601 ∑ EF BM,y (tCO2/GWh) 855.03 Average ∑ EF BM,y 855.03 Average ∑ EF OM,y 1019.80 ∑ EFy (Avg of OM &BM) 937.41
(tCO2/GWh)

CDM-SSC-PDD (version 02) CDM – Executive Board page 31
Annex 4
MONITORING PLAN
This monitoring protocol is designed for the 15 MW Ganapthi Co-generation Project which is being implemented in AndhraPradesh, India. This monitoring plan, which will be registered with the CDM EB as a part of the Project Design Document, describes the monitoring organisation, parameters and variables, monitoring practices, QA and QC procedures, data storage and archiving etc. Project participants implement this monitoring plan right from the start of the implementation of the project. PARAMETERS TO MONITOR As detailed in the project design document under Section – D, the unique variable that will be monitored in this project activity is the quantity of energy exported to the grid, from year 2003 up to the end of the last crediting period. Since no leakage nor any off-grid emissions change were identified in this project activity, there will be no need to monitor the variables for these cases. The monitoring will occur as follows: The quantity of energy exported to the grid will be monitored through the energy invoice submitted by Ganapathi Co-generation Project to the grid. The archiving will occur up to two years after the end of the crediting period or the last issuance of CERs for this project activity, or whatever occurs later. The amount of energy will be registered in an electronic form, which shall be the instrument for the further Verification. MONITORING PRACTICE The project developers shall install all metering and check metering facilities within the plant premises as well as in the State Electricity Board Substation where exported power is connected to the grid. This will be recorded and monitored on a continuous basis and certified the Monthly report by both State Electricity Board and the project proponents.
Power generation at plant
premises KW
Aux. Consumption at plant
premises KW
Net Energy export KW
Energy reading at APSEB Sub-
station KW
Transmission & Distribution
losses KW
QA AND QC PROCEDURES

CDM-SSC-PDD (version 02) CDM – Executive Board page 32 The project employs electronic based high accuracy monitoring and control equipment that will measure, record, report, monitor and control of various key parameters like generation by the project, auxiliary consumption and net energy exported to the grid. These monitoring and controls will be the part of the Distributed Control System (DCS) of the entire plant. Necessary standby meters or check meters will be installed, to operate in standby mode when the main meters are not working. All meters will be calibrated and sealed as per the industry practices at regular intervals. Hence, high quality is ensured with the above parameters. Sales records will be used and kept for checking consistency of the recorded data. Data for other parameters such as fuel consumption, generation by plant parameters etc. will be obtained from the official statistics published by the Central Electricity Authority and Ministry of Non-conventional Energy Sources, Govt. of India. Hence, quality control is not under the control of the project participants. However, the obtained data will be properly monitored, recorded and kept for verification. DATA STORAGE AND ARCHIVING All the above parameters monitored under the monitoring protocol will be kept for 2 years after the end of crediting period or the last issuance of CERs for this project activity whichever occurs later. The monitored data will be presented to the verification agency or DOE to whom verification of emission reductions is assigned. Necessary formats / tables / log sheets etc. will be developed by the project participants for monitoring and recording of the data and will be made part of the registered monitoring protocol.
- - - - -
Annex 5

CDM-SSC-PDD (version 02) CDM – Executive Board page 33

CDM-SSC-PDD (version 02) CDM – Executive Board page 34

CDM-SSC-PDD (version 02) CDM – Executive Board page 35
Letter sent by GSIL to the local administrative body (the Panchayat)

CDM-SSC-PDD (version 02) CDM – Executive Board page 36
Letter of support received from the local administrative body (the Panchayat)

CDM-SSC-PDD (version 02) CDM – Executive Board page 37
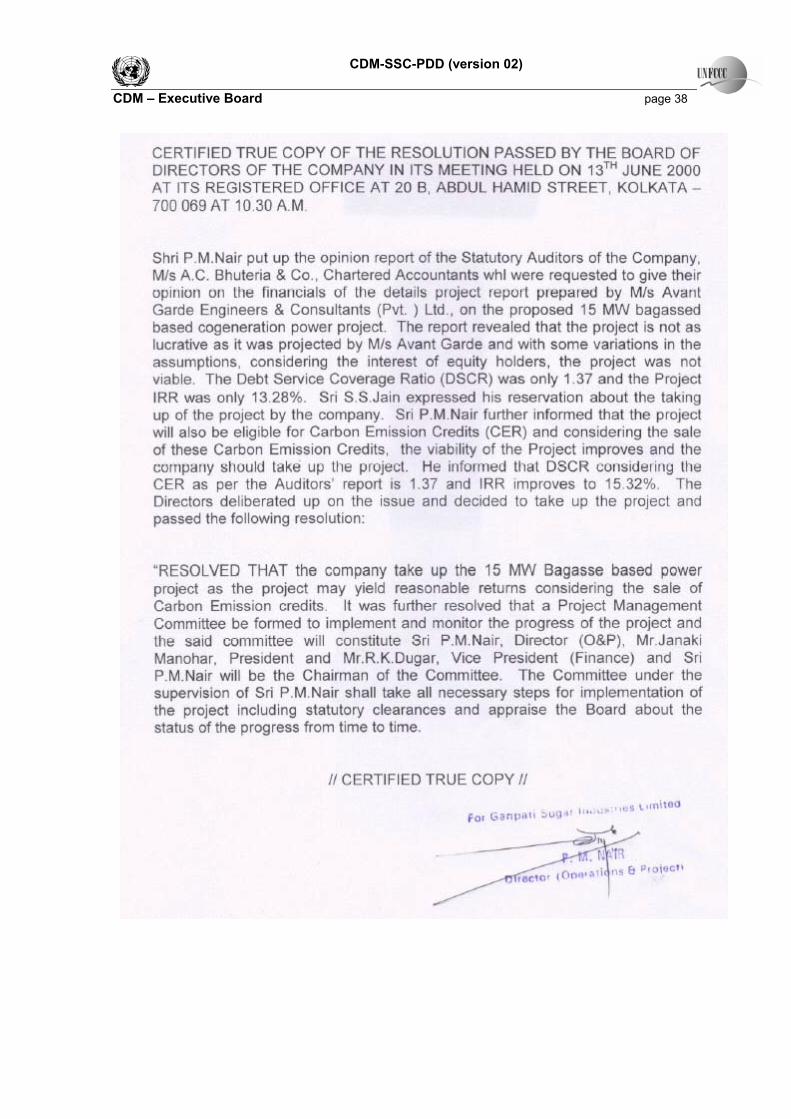
CDM-SSC-PDD (version 02) CDM – Executive Board page 38

CDM-SSC-PDD (version 02) CDM – Executive Board page 39
Letter received from Transoil Investments, expressing their interest in acquiring the CERs from the project.