claude resources inc. 2014 annual conference call and webcast
TRANSCRIPT

Full-Year 2014 Earnings Call
March 30, 2015
2
Cautionary Note Regarding Forward-Looking Information This document contains certain forward-looking statements relating but not limited to the Company’s expectations, intentions, plans and beliefs. Forward-looking information can often be identified by forward-looking words such as “anticipate”, “believe”, “expect”, “goal”, “plan”, “intent”, “estimate”, “may” and “will” or similar words suggesting future outcomes or other expectations, beliefs, plans, objectives, assumptions, intentions or statements about future events or performance. Forward-looking information may include reserve and resource estimates, estimates of future production, unit costs, costs of capital projects and timing of commencement of operations, and is based on current expectations that involve a number of business risks and uncertainties. Factors that could cause actual results to differ materially from any forward-looking statement include, but are not limited to, failure to establish estimated resources and reserves, the grade and recovery of mined ore varying from estimates, capital and operating costs varying significantly from estimates, delays in obtaining or failures to obtain required governmental, environmental or other project approvals, inflation, changes in exchange rates, fluctuations in commodity prices, delays in the development of projects and other factors. Forward-looking statements are subject to risks, uncertainties and other factors that could cause actual results to differ materially from expected results. Potential shareholders and prospective investors should be aware that these statements are subject to known and unknown risks, uncertainties and other factors that could cause actual results to differ materially from those suggested by the forward-looking statements. Shareholders are cautioned not to place undue reliance on forward-looking information. By its nature, forward-looking information involves numerous assumptions, inherent risks and uncertainties, both general and specific, that contribute to the possibility that the predictions, forecasts, projections and various future events will not occur. Claude Resources undertakes no obligation to update publicly or otherwise revise any forward-looking information whether as a result of new information, future events or other such factors which affect this information, except as required by law. Cautionary Note to U.S. Investors Concerning Resource Estimate The resource estimates in this document were prepared in accordance with National Instrument 43-101, adopted by the Canadian Securities Administrators. The requirements of National Instrument 43-101 differ significantly from the requirements of the United States Securities and Exchange Commission (the “SEC”). In this document, we use the terms “measured”, “indicated” and “inferred” resources. Although these terms are recognized and required in Canada, the SEC does not recognize them. The SEC permits U.S. mining companies, in their filings with the SEC, to disclose only those mineral deposits that constitute “reserves”. Under United States standards, mineralization may not be classified as a reserve unless the determination has been made that the mineralization could be economically and legally extracted at the time the determination is made. United States investors should not assume that all or any portion of a measured or indicated resource will ever be converted into “reserves”. Further, “inferred resources” have a great amount of uncertainty as to their existence and whether they can be mined economically or legally, and United States investors should not assume that “inferred resources” exist or can be legally or economically mined, or that they will ever be upgraded to a higher category.
Cautionary Statement

3
Key Highlights
ü Record annual gold production of 62,984 à 44% increase vs. 2013
ü Mill head grade of 7.32 g/t à 43% increase vs. 2013
ü Successfully started production at Santoy Gap ahead of schedule, producing
47,600 tonnes at 7.96 g/t
ü All-in sustaining cost per ounce of gold (1) of $1,310 à 29% decrease vs. 2013
ü Net profit of $4.6 million, or $0.02 per share
ü Debt reduction totaling $10.6 million and repaid line of credit $8.6 million
during 2014
ü A 23% increase in Mineral Reserves grade to 7.03 g/t (1) See description and reconciliation of non-IFRS financial measures in the “Non-IFRS Financial Measures and Reconciliations” section of the Company’s
2014 MD&A.
Delivered on grow ing production & lowering costs

4
Financial Results
(1) 2013 results reflect: impairment charges of $22.2 million on the Company’s Seabee Gold Operation and impairment charges of $41.6 million on the Company’s Madsen Property which was sold in the first quarter of 2014.
(2) See description and reconciliation of non-IFRS financial measures in the “Non-IFRS Financial Measures and Reconciliations” section of the Company’s 2014 MD&A.
Financial Results (all $ amounts in $CDN) Q4 2014 Q4 2013 2014 2013
Revenue (in 000’s) $22,707 $17,470 $87,372 $63,794
Production costs (in 000’s) $14,968 $12,470 $50,211 $44,051
Net profit (loss) (in 000’s) (1) ($516) ($27,100) $4,552 ($73,423)
Earnings (loss) per share (basic and diluted) (1) ($0.00) ($0.15) $0.02 ($0.42)
Cash flow from operations before net changes in non-cash working capital (in 000’s) $4,525 $4,477 $26,540 $13,785 Cash flow from operations before net changes in non-cash working capital (2) per share $0.02 $0.03 $0.14 $0.08
Average realized price per ounce $1,365 $1,323 $1,392 $1,423
Total cash costs per ounce (2) $934 $926 $836 $983
All in sustaining cost per ounce (2) $1,434 $1,609 $1,310 $1,855
A profitable gold producer
5
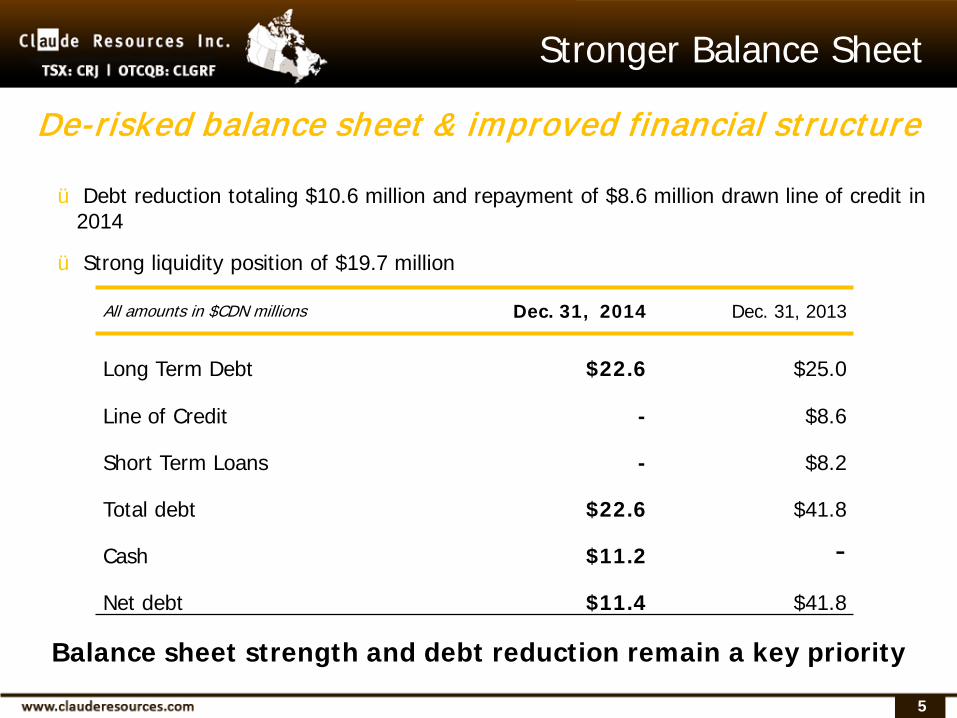
Stronger Balance Sheet
De-risked balance sheet & improved financial structure
ü Debt reduction totaling $10.6 million and repayment of $8.6 million drawn line of credit in 2014
ü Strong liquidity position of $19.7 million
Balance sheet strength and debt reduction remain a key priority
All amounts in $CDN millions Dec. 31, 2014 Dec. 31, 2013
Long Term Debt $22.6 $25.0
Line of Credit - $8.6
Short Term Loans - $8.2
Total debt $22.6 $41.8
Cash $11.2 - Net debt $11.4 $41.8
6
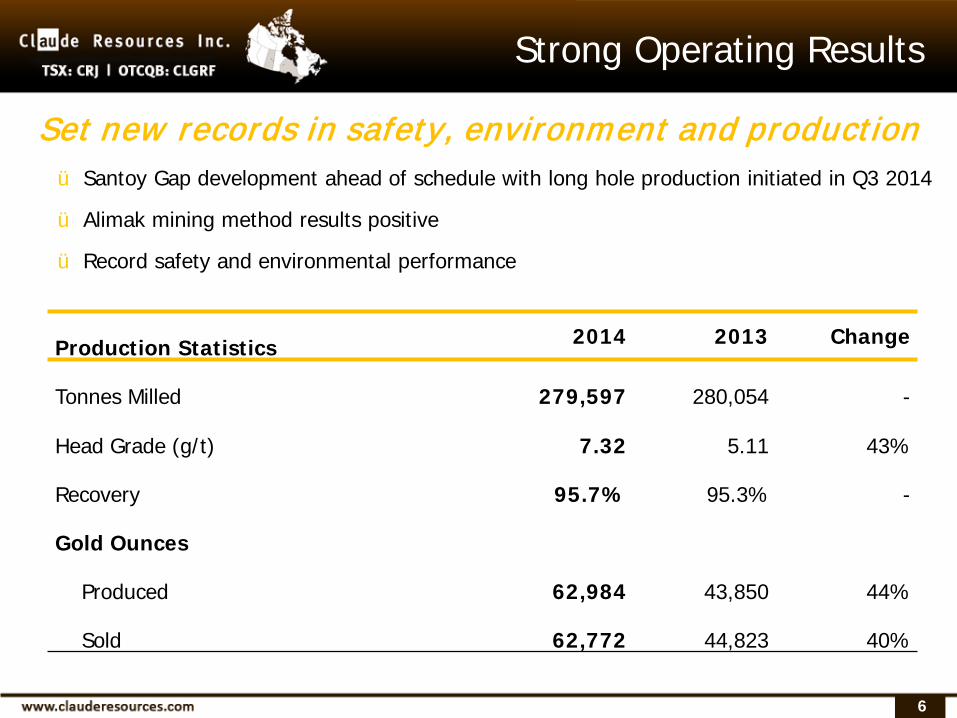
Strong Operating Results
Set new records in safety, environment and production
ü Santoy Gap development ahead of schedule with long hole production initiated in Q3 2014
ü Alimak mining method results positive
ü Record safety and environmental performance
Production Statistics 2014 2013 Change
Tonnes Milled 279,597 280,054 -
Head Grade (g/t) 7.32 5.11 43%
Recovery 95.7% 95.3% -
Gold Ounces
Produced 62,984 43,850 44%
Sold 62,772 44,823 40%

7
Q4 Operating Results
Seabee Gold Operation Production Statistics
Q4 2014 Q4 2013 Change
Tonnes Milled 60,551 74,458 (19%)
Head Grade (g/t) 6.57 5.61 17%
Recovery 96.1% 95.3% 1%
Gold Ounces
Produced 12,284 12,789 (4%)
Sold 16,639 13,209 26%
Q4 production was impacted by lower tonnes and grades from L62 and Santoy Gap due to mine sequencing

8
Key Drivers: L62 & Alimak Mining
Illustration of Alimak Mining process
• Reduced underground waste development and increased production rates :
• Ability to mine 100 metre high zone in 9 months vs 16-18 months
• Positive reconciliation on grade, ounces and tonnes versus budget
Faster, Cheaper à More Productive
L62: The source of higher grade ore
Seabee Mine – L62 Deposit
2014 Alimak Performance Tonnes Grade (g/t) Ounces Dilution (%)
L62 Zone 106,700 9.04 31,000 18

9
Key Drivers: Santoy Gap
2015 Production
2014 Production
Higher Grade + Wider Veins = More Ounces Per Vertical Metre
• Production (May to December) – over 47,000 tonnes @ approx. 7.96 g/t
• Long-hole production began end of Q3
• 60% of 2015 annual gold production tonnage
• Infrastructure upgrades on-going to ramp up to 600-700 tpd
2015 Production
Tonnes 165,000 – 175,000
Grade 6.4 – 6.6 g/t
Ounces 34,000 – 37,000

10
Focused on delivering higher margin ore to the mill • Change in mining method at Santoy Gap (Transverse vs. Long-hole) decreased tonnes and ounces but
increased grade
• Santoy Gap grade increased by 35% to 7.64 g/t from 5.68 g/t
• The 45% increase in Inferred ounces was driven by the significant expansion of the Santoy 8 ore body
• A significant 2015 underground drilling program of ~65,000 metres is expected to drive resource growth
Updated Reserves and Resources
Seabee Gold Operation Mineral Reserves and Mineral Resources* (as of November 30, 2014)
Grade (g/t) Ounces
Category 2014 2013 YOY change 2014 2013 YOY change
P&P Reserves 7.03 5.70 23% 299,000 422,900 (29%)
M&I Resources 5.98 6.91 (13%) 125,200 175,200 (29%)
Inferred Resources 7.96 7.21 10% 847,300 582,900 45%
* See 2014 Annual MD&A for footnotes to the Mineral Resource Statement.
11
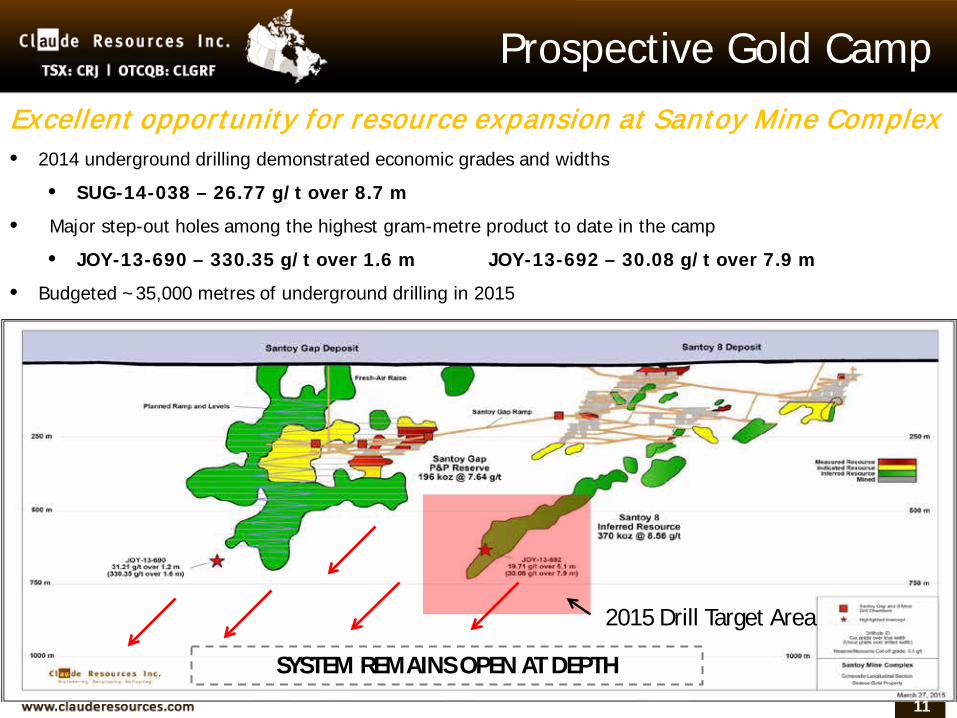
Prospective Gold Camp
SYSTEM REMAINS OPEN AT DEPTH
Excellent opportunity for resource expansion at Santoy Mine Complex • 2014 underground drilling demonstrated economic grades and widths
• SUG-14-038 – 26.77 g/t over 8.7 m
• Major step-out holes among the highest gram-metre product to date in the camp
• JOY-13-690 – 330.35 g/t over 1.6 m JOY-13-692 – 30.08 g/t over 7.9 m
• Budgeted ~35,000 metres of underground drilling in 2015
2015 Drill Target Area

12
A profitable gold miner
ü Increased production & margins by prioritizing Santoy Gap development & change
in mining method at L62
ü Set new annual gold production record of 62,984 ozs (2013: 43,850)
ü Decreased all-in sustaining costs by 29% from 2013
ü Lowered capital expenditures by 30% from 2013
ü Increased cash flow & earnings to drive further debt reduction & a stronger balance
sheet
Our strategies are delivering results

13
2015 Outlook
üGold production of 60,000 to 65,000 ounces
ü Unit cash costs – CDN $785 to $850 per ounce (includes royalty)
ü All in sustaining costs – CDN $1,175 to $1,275 per ounce
ü Expected FCF in 2015 @ CDN $1,300 Au/oz (U.S. $1,040 Au/oz*)
üOur performance & profitability is sustainable
Our focus w ill remain on cost containment, margins and production grow th
*Assuming U.S./CDN exchange rate of $0.80
14
(1) See footnotes located on page 17
Claude Resources Inc. Experience. Stability. Potential.
Creating the Capacity to
Discover. Develop. Deliver.
TSX: CRJ OTCQB: CLGRF
200 – 219 Robin Cres Saskatoon, Saskatchewan, S7L 6M8 Canada P. 306.668.7505 F. 306.668.7500 E: [email protected]

15
Appendix A: Executive Team
Brian Skanderbeg, P.Geo.
President & CEO 7 years with Claude. Prior to his current position, held several management positions including his most recent position of Sr. VP and COO. Previously employed with Goldcorp, Inco Ltd. and Helio Resources. He holds a B.Sc. from the University of Manitoba, an M.Sc. from Rhodes University, South Africa.
Rick Johnson, CPA, CA
Chief Financial Officer Vice President Finance
18 years with Claude including 10 years as CFO and VP Finance. Mr. Johnson holds a Bachelor of Commerce degree from the University of Saskatchewan and is a member of the Chartered Professional Accountants of Canada.
16
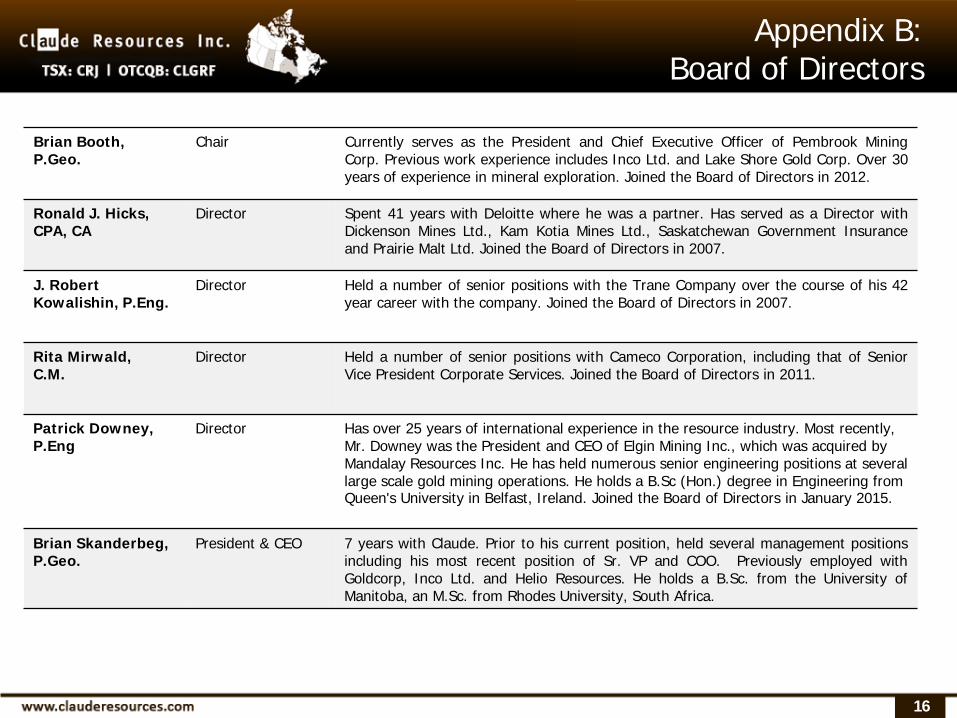
Appendix B: Board of Directors
Brian Booth, P.Geo.
Chair Currently serves as the President and Chief Executive Officer of Pembrook Mining Corp. Previous work experience includes Inco Ltd. and Lake Shore Gold Corp. Over 30 years of experience in mineral exploration. Joined the Board of Directors in 2012.
Ronald J. Hicks, CPA, CA
Director Spent 41 years with Deloitte where he was a partner. Has served as a Director with Dickenson Mines Ltd., Kam Kotia Mines Ltd., Saskatchewan Government Insurance and Prairie Malt Ltd. Joined the Board of Directors in 2007.
J. Robert Kowalishin, P.Eng.
Director Held a number of senior positions with the Trane Company over the course of his 42 year career with the company. Joined the Board of Directors in 2007.
Rita Mirwald, C.M.
Director Held a number of senior positions with Cameco Corporation, including that of Senior Vice President Corporate Services. Joined the Board of Directors in 2011.
Patrick Downey, P.Eng
Director Has over 25 years of international experience in the resource industry. Most recently, Mr. Downey was the President and CEO of Elgin Mining Inc., which was acquired by Mandalay Resources Inc. He has held numerous senior engineering positions at several large scale gold mining operations. He holds a B.Sc (Hon.) degree in Engineering from Queen's University in Belfast, Ireland. Joined the Board of Directors in January 2015.
Brian Skanderbeg, P.Geo.
President & CEO 7 years with Claude. Prior to his current position, held several management positions including his most recent position of Sr. VP and COO. Previously employed with Goldcorp, Inco Ltd. and Helio Resources. He holds a B.Sc. from the University of Manitoba, an M.Sc. from Rhodes University, South Africa.