novagold q1-2015 financial results conference call & webcast
TRANSCRIPT
novagold.com
NYSE-MKT, TSX: NG | April 2015
2015 First Quarter & Project Update

Conference Call Attendees
2
▶ Introduction
Mélanie Hennessy (Vice President Corporate Communications)
▶ Corporate Update
Greg Lang (President & Chief Executive Officer)
▶ First Quarter Financials & 2015 Budget
David Ottewell (Vice President & Chief Financial Officer)
▶ Closing Remarks
Greg Lang (President & Chief Executive Officer)
▶ Question & Answer Session
Greg Lang & David Ottewell
Cautionary Statements
REGARDING FORWARD-LOOKING STATEMENTS
This presentation includes certain “forward-looking statements” within the meaning of applicable securities laws, including the United States Private Securities Litigation Reform Act of 1995. All
statements, other than statements of historical fact, included herein including, without limitation, statements relating to Donlin Gold’s future operating or financial performance, are forward-
looking statements. Forward-looking statements are frequently, but not always, identified by words such as “plans”, “expects”, “anticipates”, “believes”, “intends”, “estimates”, “potential”,
“possible” and similar expressions, or statements that events, conditions or results “will”, “may”, “could”, or “should” occur or be achieved. These forward-looking statements are set forth in the
slides pertaining to the implementation of the Donlin Gold second updated Feasibility Study and pertaining to the implementation of the Galore Creek Pre-Feasibility Study, the factors that may
influence future gold price performance, and the potential future value of gold, and may include statements regarding perceived merit of properties; exploration results and budgets; mineral
reserves and resource estimates; work programs; capital expenditures; timelines; strategic plans; completion of transactions; market price of precious or base metals; or other statements that
are not statements of fact. Forward-looking statements involve various risks and uncertainties. There can be no assurance that such statements will prove to be accurate, and actual results and
future events could differ materially from those anticipated in such statements. Important factors that could cause actual results to differ materially from our expectations include the
uncertainties involving the need for additional financing to explore and develop properties and availability of financing in the debt and capital markets; uncertainties involved in the interpretation
of drilling results and geological tests and the estimation of reserves and resources; the need for continued cooperation between NOVAGOLD and Barrick Gold in the exploration and
development of the Donlin Gold property; the need for continued cooperation between NOVAGOLD and Teck Resources Ltd. in the exploration and development of the Galore Creek property;
the need for cooperation of government agencies and native groups in the development and operation of properties; the need to obtain permits and governmental approvals; risks of
construction and mining projects such as accidents, equipment breakdowns, bad weather, non-compliance with environmental and permit requirements, unanticipated variation in geological
structures, ore grades or recovery rates; unexpected cost increases; fluctuations in metal prices and currency exchange rates; and other risks and uncertainties disclosed in reports and
documents filed by NOVAGOLD with applicable securities regulatory authorities from time to time. The forward-looking statements made herein reflect our beliefs, opinions and projections on
the date the statements are made. Except as required by law, we assume no obligation to update the forward-looking statements of beliefs, opinions, projections, or other factors, should they
change.
REGARDING SCIENTIFIC AND TECHNICAL INFORMATION
Unless otherwise indicated, all reserve and resource estimates included in this presentation have been prepared in accordance with Canadian National Instrument 43-101 Standards of
Disclosure for Mineral Projects (“NI 43-101”) and the Canadian Institute of Mining, Metallurgy and Petroleum Definition Standards for Mineral Resources and Mineral Reserves (“CIM Definition
Standards”). Canadian standards, including NI 43-101, differ significantly from the requirements of the United States Securities and Exchange Commission (“SEC”), and reserve and resource
information in this presentation may not be comparable to similar information disclosed by U.S. companies. In particular, and without limiting the generality of the foregoing, the term “resource”
does not equate to the term “‘reserves”. Under U.S. standards, mineralization may not be classified as a “reserve” unless the determination has been made that the mineralization could be
economically and legally produced or extracted at the time the reserve determination is made. At this time, both of Donlin Gold and Galore Creek projects are without known reserves, as
defined under SEC Industry Guide 7. The SEC’s disclosure standards normally do not permit the inclusion of information concerning “measured mineral resources”, “indicated mineral
resources” or “inferred mineral resources” or other descriptions of the amount of mineralization in mineral deposits that do not constitute “reserves” by U.S. standards in documents filed with the
SEC. U.S. investors should also understand that “inferred mineral resources” have a great amount of uncertainty as to their existence and great uncertainty as to their economic and legal
feasibility. It cannot be assumed that all or any part of an “inferred mineral resource” will ever be upgraded to a higher category. Under Canadian rules, estimated “inferred mineral resources”
may not form the basis of feasibility or pre-feasibility studies except in rare cases. Investors are cautioned not to assume that all or any part of an “inferred mineral resource” exists or is
economically or legally mineable. Disclosure of “contained ounces” in a resource is permitted disclosure under Canadian regulations; however, the SEC normally only permits issuers to report
mineralization that does not constitute “reserves” by SEC standards as in-place tonnage and grade without reference to unit measures. The requirements of NI 43-101 for identification of
“reserves” are also not the same as those of the SEC, and reserves reported in compliance with NI 43-101 may not qualify as “reserves” under SEC standards. Accordingly, information
concerning mineral deposits set forth herein may not be comparable to information made public by companies that report in accordance with United States standards.
All dollar amounts quoted in this report are in U.S. currency unless otherwise noted.
3
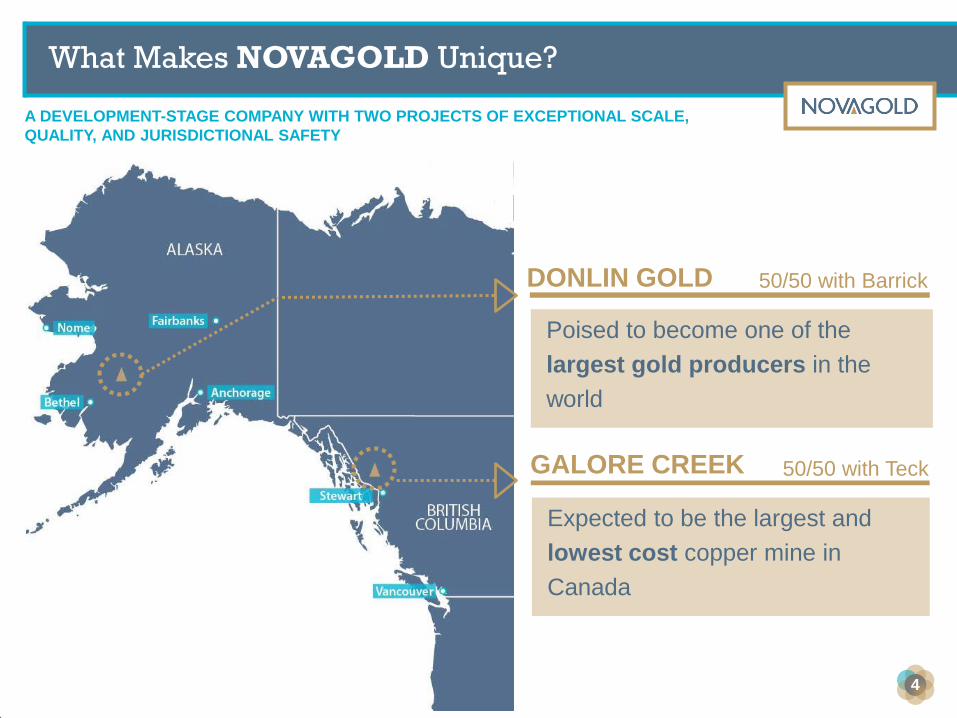
What Makes NOVAGOLD Unique?
Poised to become one of the
largest gold producers in the
world
DONLIN GOLD
GALORE CREEK
Expected to be the largest and
lowest cost copper mine in
Canada
50/50 with Barrick
50/50 with Teck
A DEVELOPMENT-STAGE COMPANY WITH TWO PROJECTS OF EXCEPTIONAL SCALE,
QUALITY, AND JURISDICTIONAL SAFETY
4

EXCELLENT PROGRESS MADE ON ALL FRONTS WHILE SAFEGUARDING OUR BALANCE SHEET
First Quarter Activities
5
ACHIEVEMENTS
▶ Excellent progress in permitting of Donlin Gold
• Submission of comments on initial draft EIS from six
cooperating agencies to the Corps, the lead agency
• Anticipate publishing the draft EIS by year-end 2015
▶ Advanced Galore Creek technical studies
• Focused on project mine planning and design to further
improve its value and marketability
▶ Released the opening segment of the Alaska Video Series –
Yup’ik Language and Culture
• Four-part video series on the way of life in Alaska
• Documenting the way of life in the remote communities of the
Y-K region, where the Donlin Gold project is located, and the
importance of subsistence living and traditional lifestyles
▶ Sponsored, volunteered and participated in local community
activities in Northern British Columbia and Alaska
• Iditarod Trail International Sled Dog Race
• Tahltan educational and healthy living initiatives
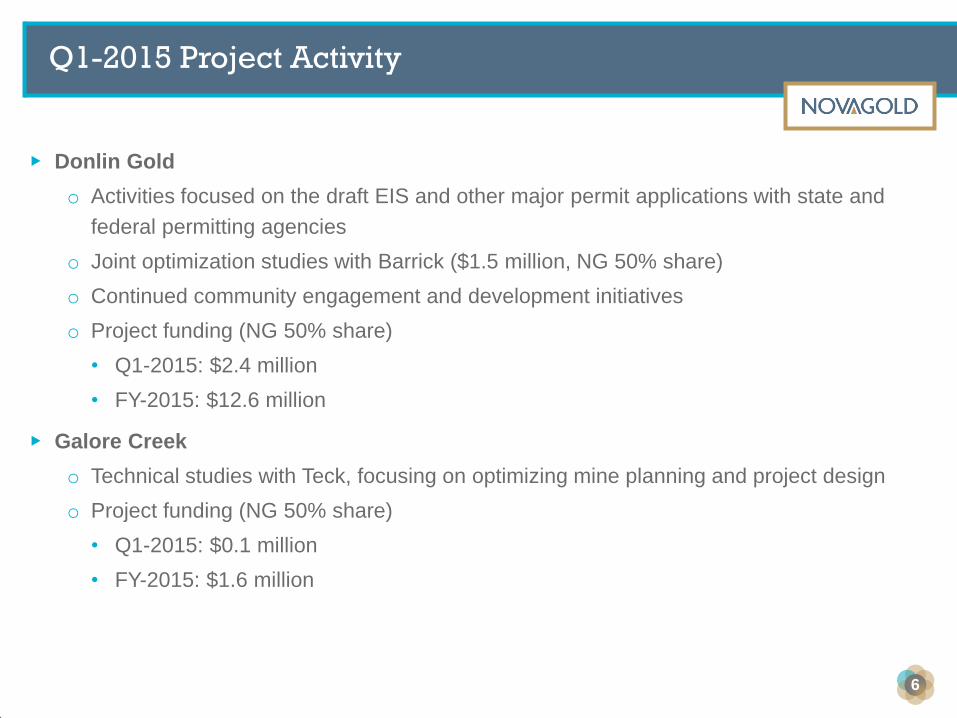
Q1-2015 Project Activity
▶ Donlin Gold
o Activities focused on the draft EIS and other major permit applications with state and
federal permitting agencies
o Joint optimization studies with Barrick ($1.5 million, NG 50% share)
o Continued community engagement and development initiatives
o Project funding (NG 50% share)
• Q1-2015: $2.4 million
• FY-2015: $12.6 million
▶ Galore Creek
o Technical studies with Teck, focusing on optimizing mine planning and project design
o Project funding (NG 50% share)
• Q1-2015: $0.1 million
• FY-2015: $1.6 million
6
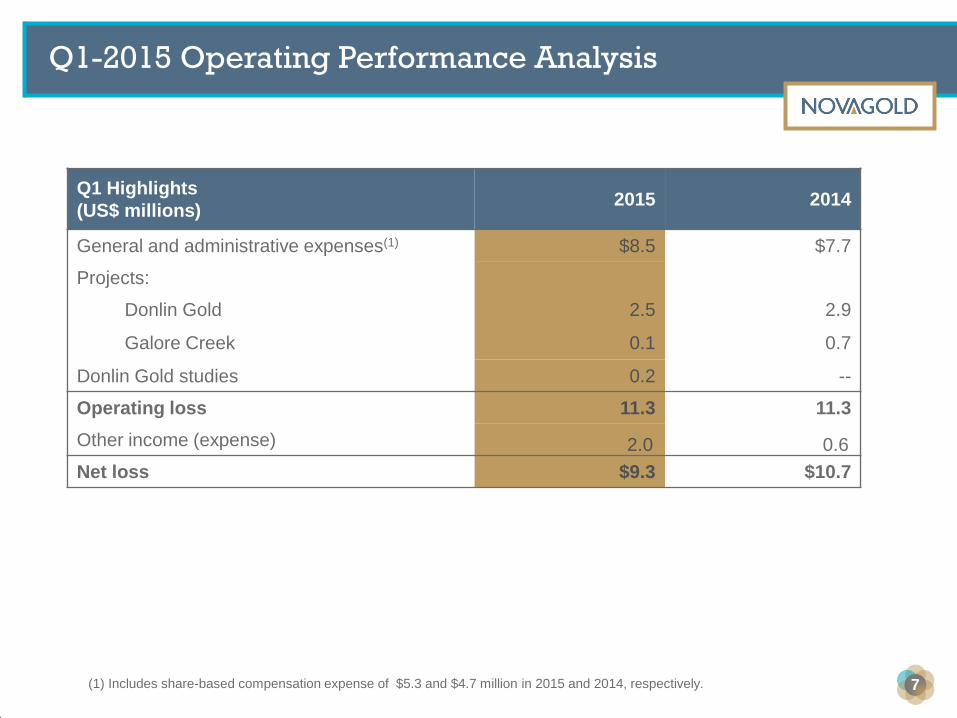
Q1-2015 Operating Performance Analysis
Q1 Highlights
(US$ millions) 2015 2014
General and administrative expenses(1) $8.5 $7.7
Projects:
Donlin Gold 2.5 2.9
Galore Creek 0.1 0.7
Donlin Gold studies 0.2 --
Operating loss 11.3 11.3
Other income (expense) 2.0 0.6
Net loss $9.3 $10.7
(1) Includes share-based compensation expense of $5.3 and $4.7 million in 2015 and 2014, respectively. 7
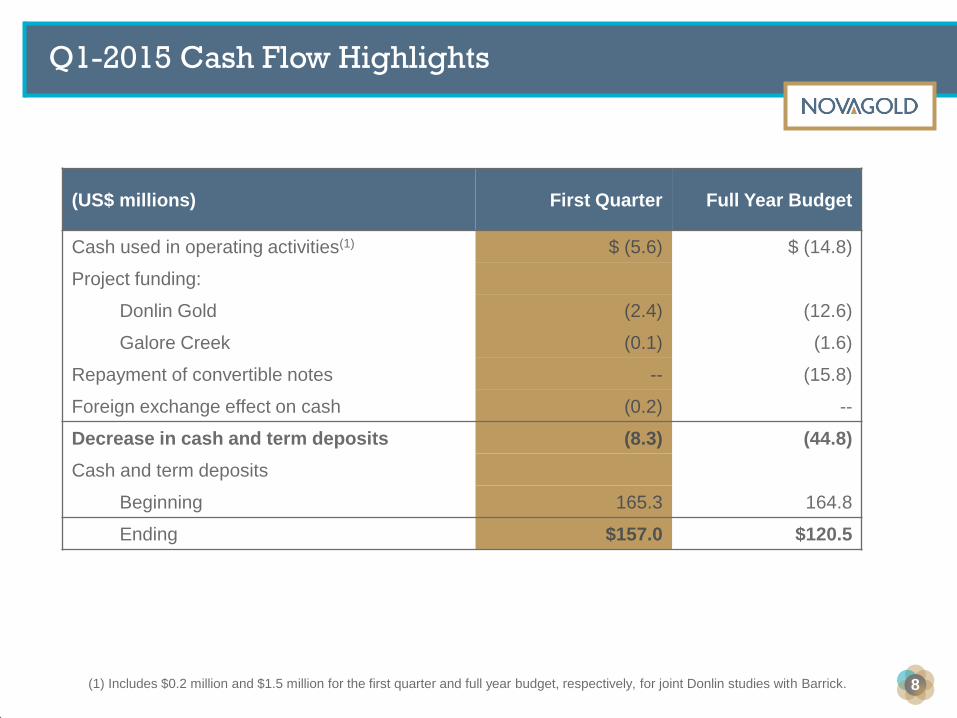
Q1-2015 Cash Flow Highlights
(US$ millions) First Quarter Full Year Budget
Cash used in operating activities(1) $ (5.6) $ (14.8)
Project funding:
Donlin Gold (2.4) (12.6)
Galore Creek (0.1) (1.6)
Repayment of convertible notes -- (15.8)
Foreign exchange effect on cash (0.2) --
Decrease in cash and term deposits (8.3) (44.8)
Cash and term deposits
Beginning 165.3 164.8
Ending $157.0 $120.5
8 (1) Includes $0.2 million and $1.5 million for the first quarter and full year budget, respectively, for joint Donlin studies with Barrick.
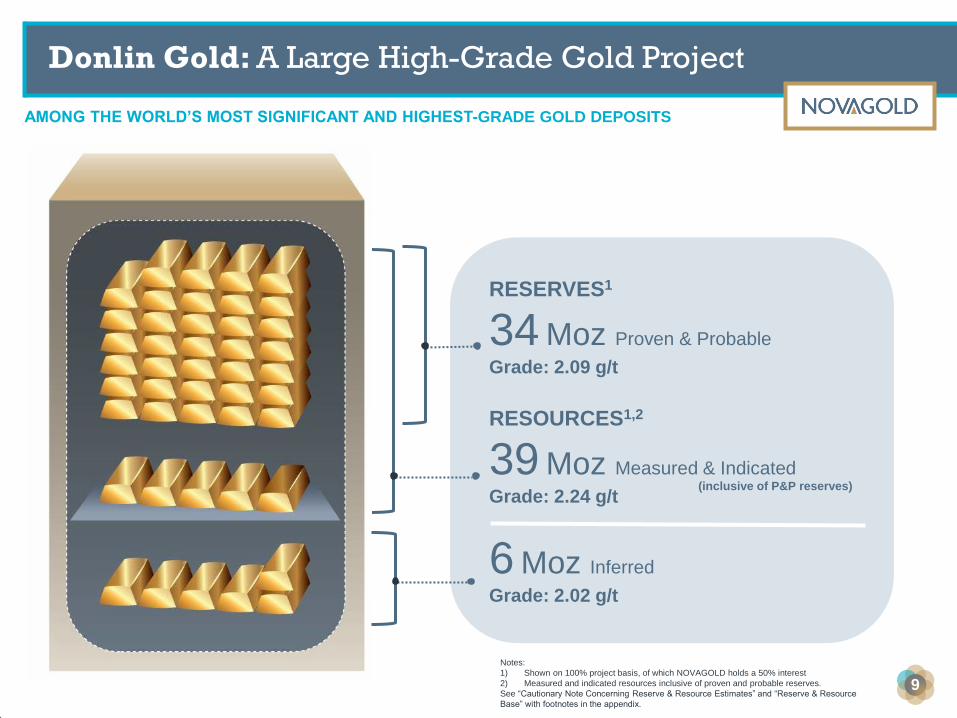
Notes:
1) Shown on 100% project basis, of which NOVAGOLD holds a 50% interest
2) Measured and indicated resources inclusive of proven and probable reserves.
See “Cautionary Note Concerning Reserve & Resource Estimates” and “Reserve & Resource
Base” with footnotes in the appendix.
RESERVES1
34 Moz Proven & Probable
Grade: 2.09 g/t
RESOURCES1,2
39 Moz Measured & Indicated
Grade: 2.24 g/t
6 Moz Inferred
Grade: 2.02 g/t
(inclusive of P&P reserves)
AMONG THE WORLD’S MOST SIGNIFICANT AND HIGHEST-GRADE GOLD DEPOSITS
9
Donlin Gold: A Large High-Grade Gold Project
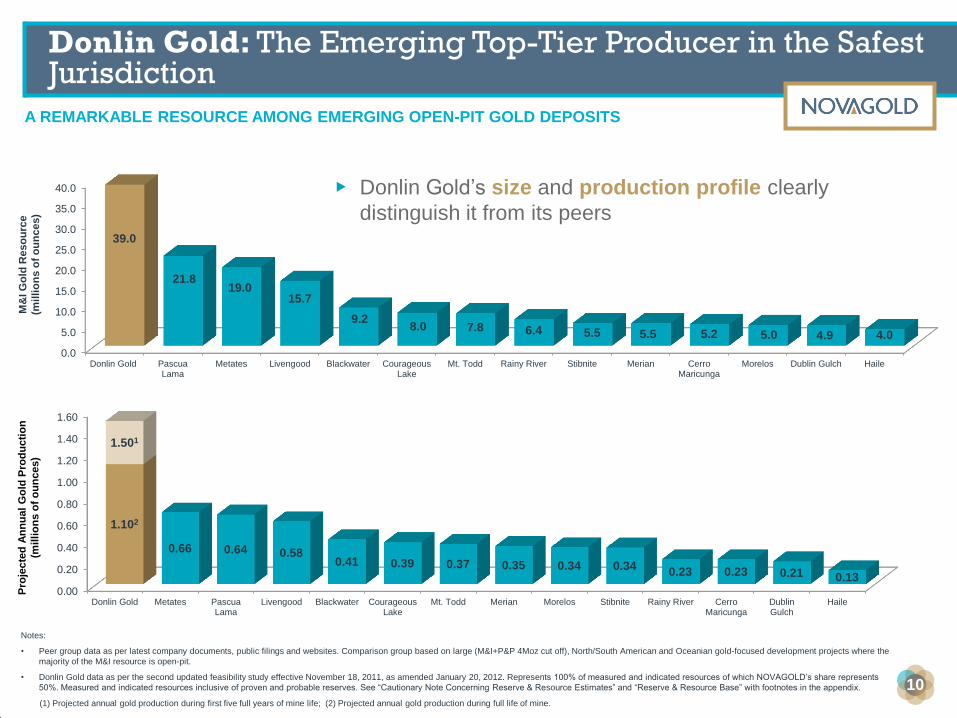
A REMARKABLE RESOURCE AMONG EMERGING OPEN-PIT GOLD DEPOSITS
Donlin Gold: The Emerging Top-Tier Producer in the Safest Jurisdiction
0.00
0.20
0.40
0.60
0.80
1.00
1.20
1.40
1.60
Donlin Gold Metates PascuaLama
Livengood Blackwater CourageousLake
Mt. Todd Merian Morelos Stibnite Rainy River CerroMaricunga
DublinGulch
Haile
1.102
0.66 0.64 0.58 0.41 0.39 0.37 0.35 0.34 0.34
0.23 0.23 0.21 0.13
1.501
Pro
jecte
d A
nn
ua
l G
old
Pro
du
cti
on
(mil
lio
ns
of
ou
nc
es)
Notes:
• Peer group data as per latest company documents, public filings and websites. Comparison group based on large (M&I+P&P 4Moz cut off), North/South American and Oceanian gold-focused development projects where the
majority of the M&I resource is open-pit.
• Donlin Gold data as per the second updated feasibility study effective November 18, 2011, as amended January 20, 2012. Represents 100% of measured and indicated resources of which NOVAGOLD’s share represents
50%. Measured and indicated resources inclusive of proven and probable reserves. See “Cautionary Note Concerning Reserve & Resource Estimates” and “Reserve & Resource Base” with footnotes in the appendix.
(1) Projected annual gold production during first five full years of mine life; (2) Projected annual gold production during full life of mine.
0.0
5.0
10.0
15.0
20.0
25.0
30.0
35.0
40.0
Donlin Gold PascuaLama
Metates Livengood Blackwater CourageousLake
Mt. Todd Rainy River Stibnite Merian CerroMaricunga
Morelos Dublin Gulch Haile
39.0
21.8 19.0
15.7
9.2 8.0 7.8 6.4 5.5 5.5 5.2 5.0 4.9 4.0
M&
I G
old
Reso
urc
e
(mil
lio
ns
of
ou
nc
es)
▶ Donlin Gold’s size and production profile clearly
distinguish it from its peers
10
0.00
0.50
1.00
1.50
2.00
2.50
3.00
Morelos CourageousLake
Donlin Gold Haile Stibnite PascuaLama
Rainy River Merian Mt. Todd Blackwater Dublin Gulch Livengood Metates CerroMaricunga
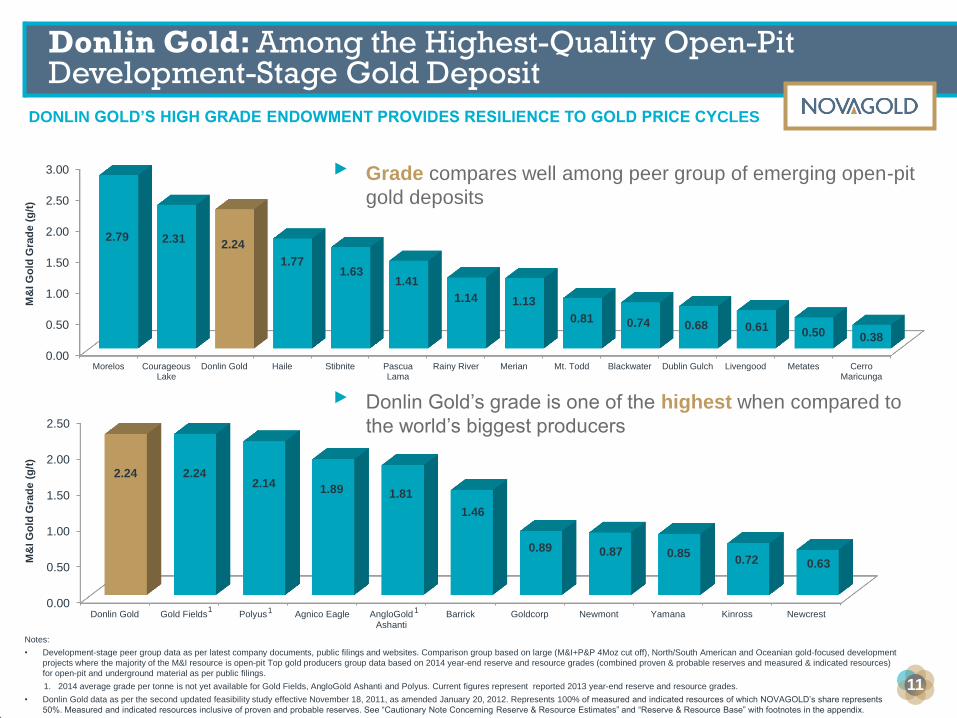
2.79 2.31 2.24
1.77 1.63
1.41
1.14 1.13
0.81 0.74 0.68 0.61 0.50 0.38
▸ Grade compares well among peer group of emerging open-pit
gold deposits
M&
I G
old
Gra
de
(g
/t)
Notes:
• Development-stage peer group data as per latest company documents, public filings and websites. Comparison group based on large (M&I+P&P 4Moz cut off), North/South American and Oceanian gold-focused development
projects where the majority of the M&I resource is open-pit Top gold producers group data based on 2014 year-end reserve and resource grades (combined proven & probable reserves and measured & indicated resources)
for open-pit and underground material as per public filings.
1. 2014 average grade per tonne is not yet available for Gold Fields, AngloGold Ashanti and Polyus. Current figures represent reported 2013 year-end reserve and resource grades.
• Donlin Gold data as per the second updated feasibility study effective November 18, 2011, as amended January 20, 2012. Represents 100% of measured and indicated resources of which NOVAGOLD’s share represents
50%. Measured and indicated resources inclusive of proven and probable reserves. See “Cautionary Note Concerning Reserve & Resource Estimates” and “Reserve & Resource Base” with footnotes in the appendix.
0.00
0.50
1.00
1.50
2.00
2.50
Donlin Gold Gold Fields Polyus Agnico Eagle AngloGoldAshanti
Barrick Goldcorp Newmont Yamana Kinross Newcrest
2.24 2.24 2.14
1.89 1.81
1.46
0.89 0.87 0.85 0.72 0.63 M
&I G
old
Gra
de
(g
/t)
DONLIN GOLD’S HIGH GRADE ENDOWMENT PROVIDES RESILIENCE TO GOLD PRICE CYCLES
Donlin Gold: Among the Highest-Quality Open-Pit Development-Stage Gold Deposit
11
1 1 1
▸ Donlin Gold’s grade is one of the highest when compared to
the world’s biggest producers
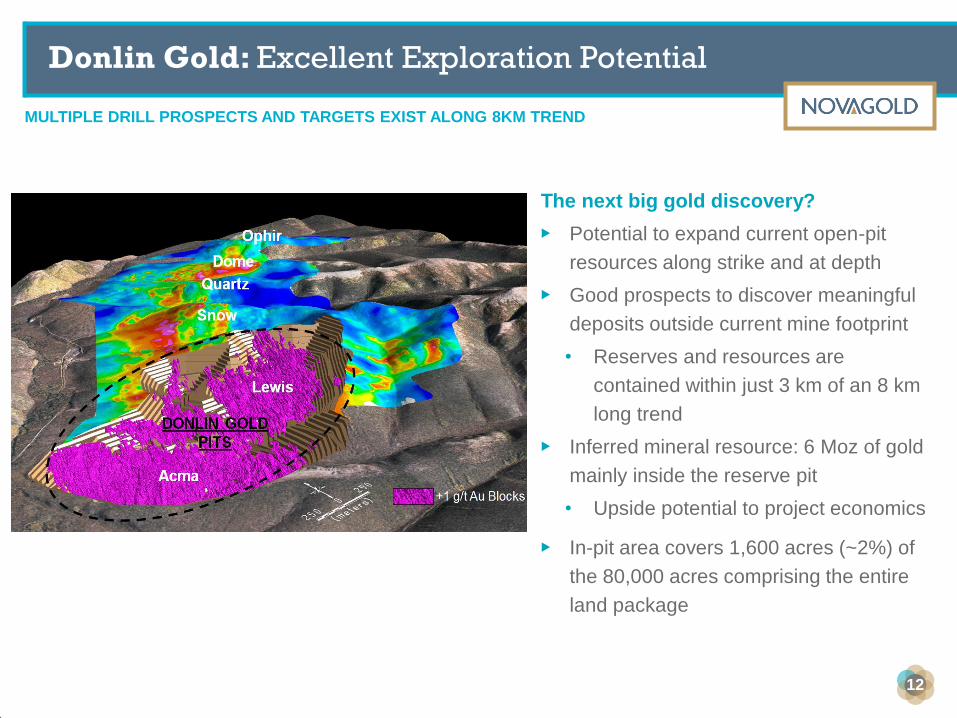
MULTIPLE DRILL PROSPECTS AND TARGETS EXIST ALONG 8KM TREND
Donlin Gold: Excellent Exploration Potential
12
The next big gold discovery?
▶ Potential to expand current open-pit
resources along strike and at depth
▶ Good prospects to discover meaningful
deposits outside current mine footprint
• Reserves and resources are
contained within just 3 km of an 8 km
long trend
▶ Inferred mineral resource: 6 Moz of gold
mainly inside the reserve pit
• Upside potential to project economics
▶ In-pit area covers 1,600 acres (~2%) of
the 80,000 acres comprising the entire
land package
0
5,000
10,000
15,000
20,000
25,000
30,000
1,200 1,300 1,500 1,700 2,000 2,500
6.2B
8.2B
11.6B
14.6B
19.2B
27.0B
NP
V (
US
$ i
n m
illi
on
s)
Gold Price (US$)
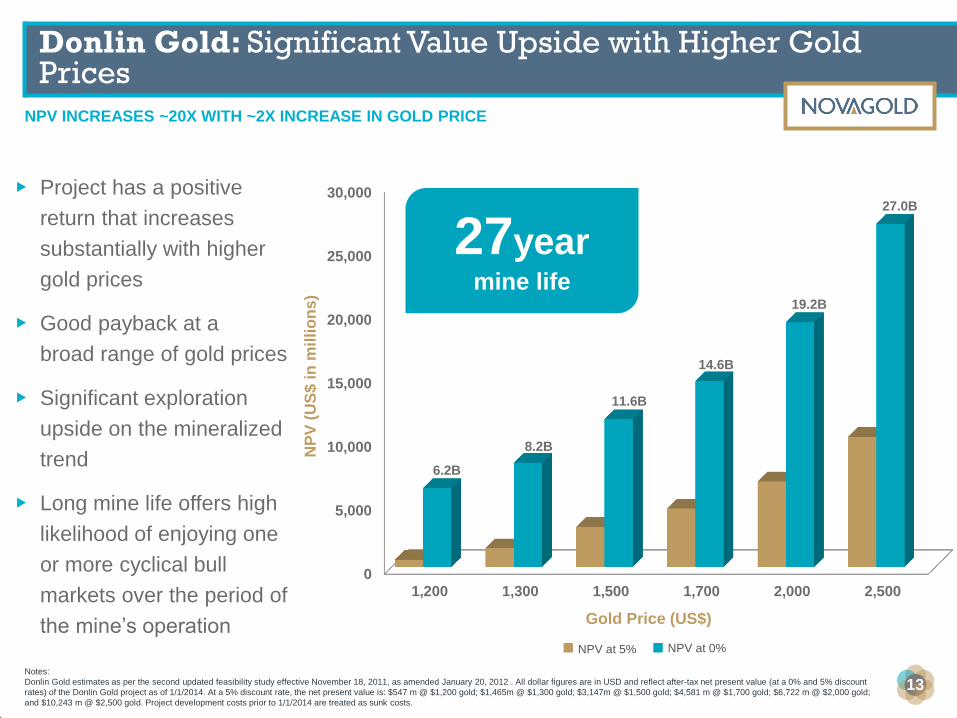
NPV INCREASES ~20X WITH ~2X INCREASE IN GOLD PRICE
Donlin Gold: Significant Value Upside with Higher Gold Prices
13 Notes:
Donlin Gold estimates as per the second updated feasibility study effective November 18, 2011, as amended January 20, 2012 . All dollar figures are in USD and reflect after-tax net present value (at a 0% and 5% discount
rates) of the Donlin Gold project as of 1/1/2014. At a 5% discount rate, the net present value is: $547 m @ $1,200 gold; $1,465m @ $1,300 gold; $3,147m @ $1,500 gold; $4,581 m @ $1,700 gold; $6,722 m @ $2,000 gold;
and $10,243 m @ $2,500 gold. Project development costs prior to 1/1/2014 are treated as sunk costs.
27year mine life
NPV at 0% NPV at 5%
▶ Project has a positive
return that increases
substantially with higher
gold prices
▶ Good payback at a
broad range of gold prices
▶ Significant exploration
upside on the mineralized
trend
▶ Long mine life offers high
likelihood of enjoying one
or more cyclical bull
markets over the period of
the mine’s operation
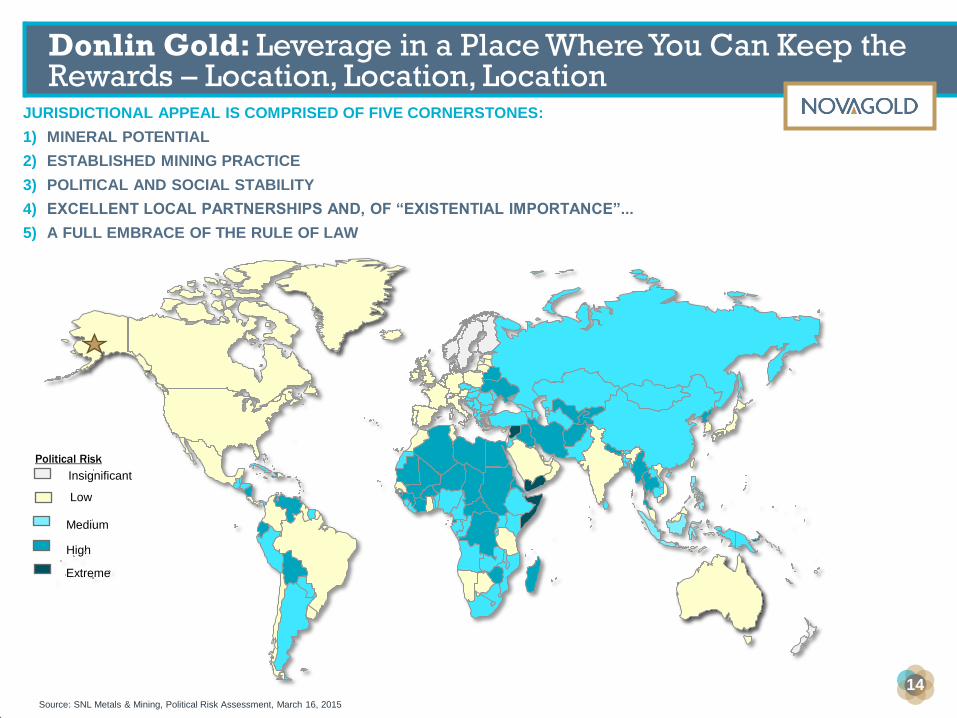
JURISDICTIONAL APPEAL IS COMPRISED OF FIVE CORNERSTONES:
1) MINERAL POTENTIAL
2) ESTABLISHED MINING PRACTICE
3) POLITICAL AND SOCIAL STABILITY
4) EXCELLENT LOCAL PARTNERSHIPS AND, OF “EXISTENTIAL IMPORTANCE”...
5) A FULL EMBRACE OF THE RULE OF LAW
Donlin Gold: Leverage in a Place Where You Can Keep the Rewards – Location, Location, Location
14
Political Risk
Insignificant
Low
Medium
High
Extreme
Source: SNL Metals & Mining, Political Risk Assessment, March 16, 2015
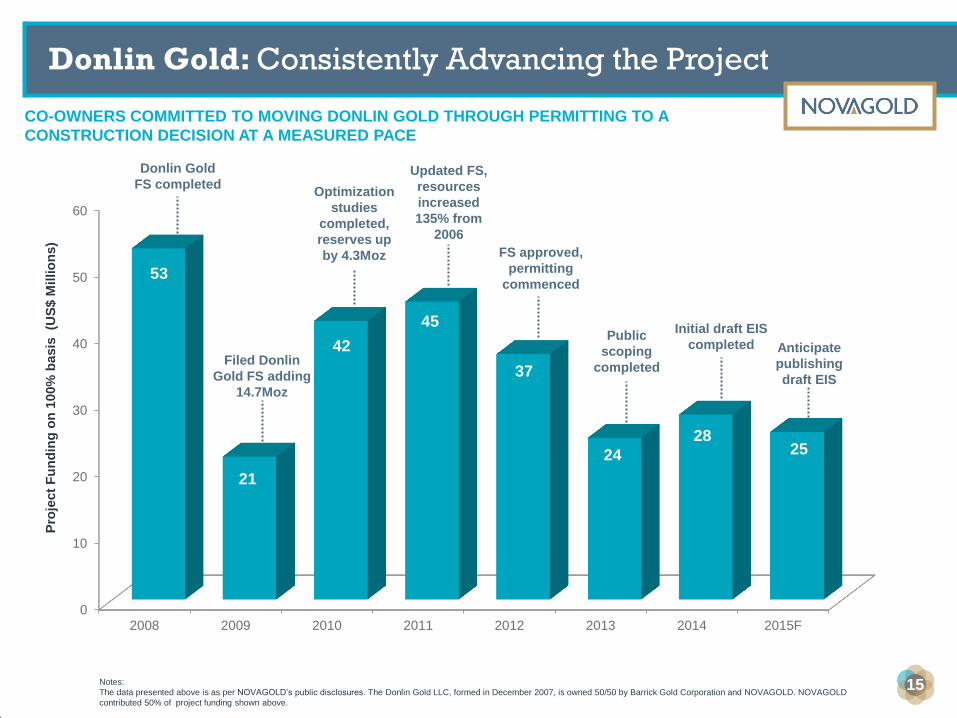
Donlin Gold: Consistently Advancing the Project
0
10
20
30
40
50
60
2008 2009 2010 2011 2012 2013 2014 2015F
53
21
42
45
37
24
28 25
CO-OWNERS COMMITTED TO MOVING DONLIN GOLD THROUGH PERMITTING TO A
CONSTRUCTION DECISION AT A MEASURED PACE
15
Pro
ject
Fu
nd
ing
on
100%
basis
(U
S$ M
illio
ns)
Notes:
The data presented above is as per NOVAGOLD’s public disclosures. The Donlin Gold LLC, formed in December 2007, is owned 50/50 by Barrick Gold Corporation and NOVAGOLD. NOVAGOLD
contributed 50% of project funding shown above.
Filed Donlin
Gold FS adding
14.7Moz
Optimization
studies
completed,
reserves up
by 4.3Moz
Updated FS,
resources
increased
135% from
2006
FS approved,
permitting
commenced
Initial draft EIS
completed Anticipate
publishing
draft EIS
Donlin Gold
FS completed
Public
scoping
completed
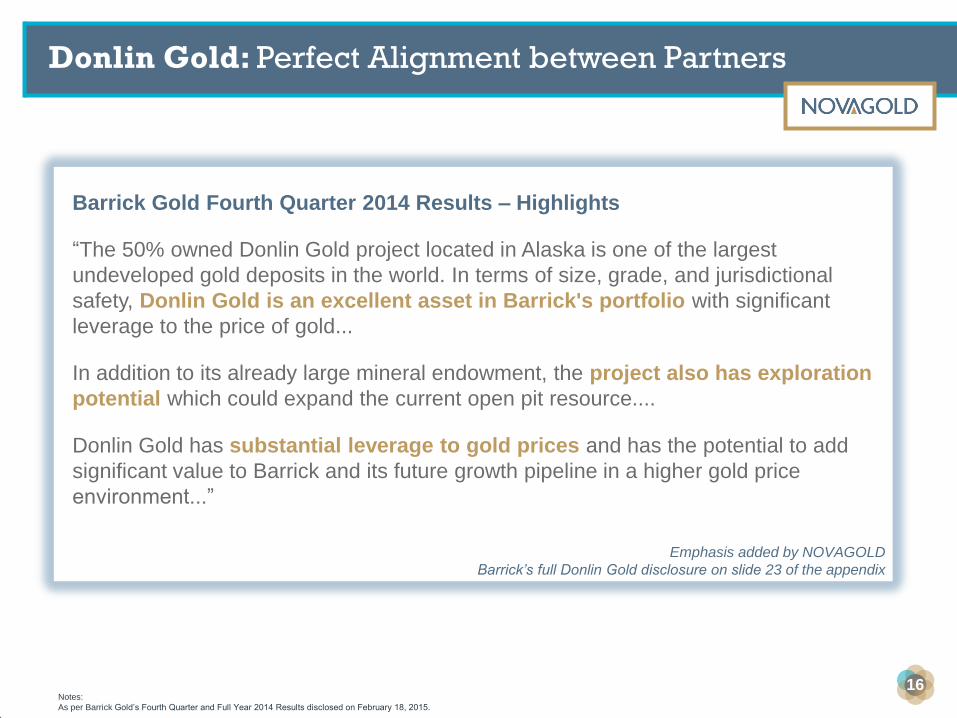
Barrick Gold Fourth Quarter 2014 Results – Highlights
“The 50% owned Donlin Gold project located in Alaska is one of the largest
undeveloped gold deposits in the world. In terms of size, grade, and jurisdictional
safety, Donlin Gold is an excellent asset in Barrick's portfolio with significant
leverage to the price of gold...
In addition to its already large mineral endowment, the project also has exploration
potential which could expand the current open pit resource....
Donlin Gold has substantial leverage to gold prices and has the potential to add
significant value to Barrick and its future growth pipeline in a higher gold price
environment...”
Donlin Gold: Perfect Alignment between Partners
16 Notes:
As per Barrick Gold’s Fourth Quarter and Full Year 2014 Results disclosed on February 18, 2015.
Emphasis added by NOVAGOLD
Barrick’s full Donlin Gold disclosure on slide 23 of the appendix
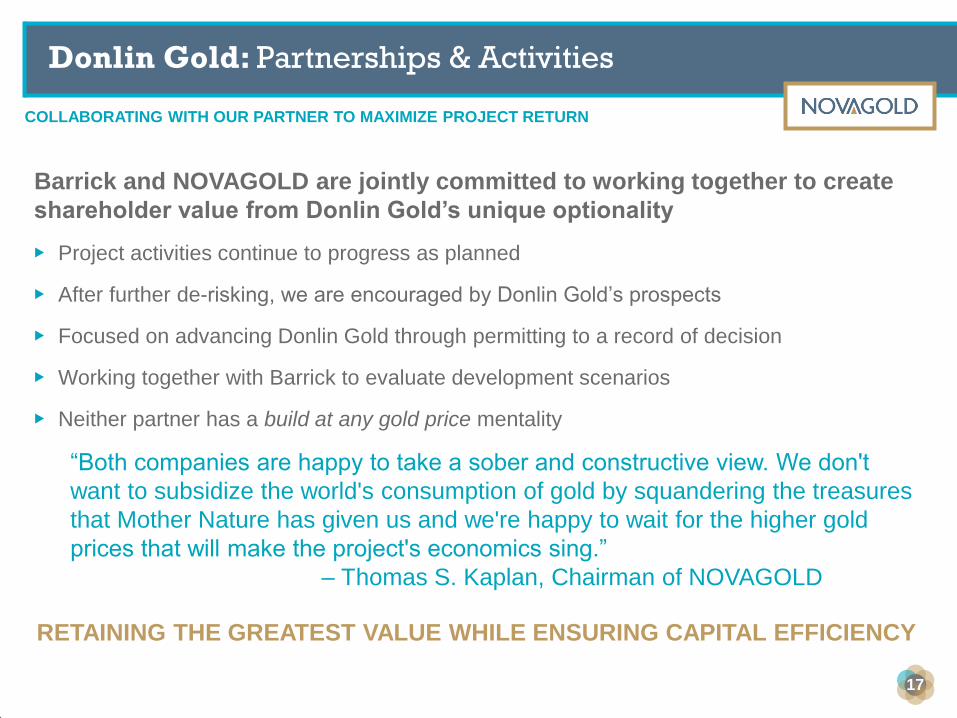
COLLABORATING WITH OUR PARTNER TO MAXIMIZE PROJECT RETURN
Donlin Gold: Partnerships & Activities
Barrick and NOVAGOLD are jointly committed to working together to create
shareholder value from Donlin Gold’s unique optionality
▶ Project activities continue to progress as planned
▶ After further de-risking, we are encouraged by Donlin Gold’s prospects
▶ Focused on advancing Donlin Gold through permitting to a record of decision
▶ Working together with Barrick to evaluate development scenarios
▶ Neither partner has a build at any gold price mentality
“Both companies are happy to take a sober and constructive view. We don't
want to subsidize the world's consumption of gold by squandering the treasures
that Mother Nature has given us and we're happy to wait for the higher gold
prices that will make the project's economics sing.”
– Thomas S. Kaplan, Chairman of NOVAGOLD
RETAINING THE GREATEST VALUE WHILE ENSURING CAPITAL EFFICIENCY
17
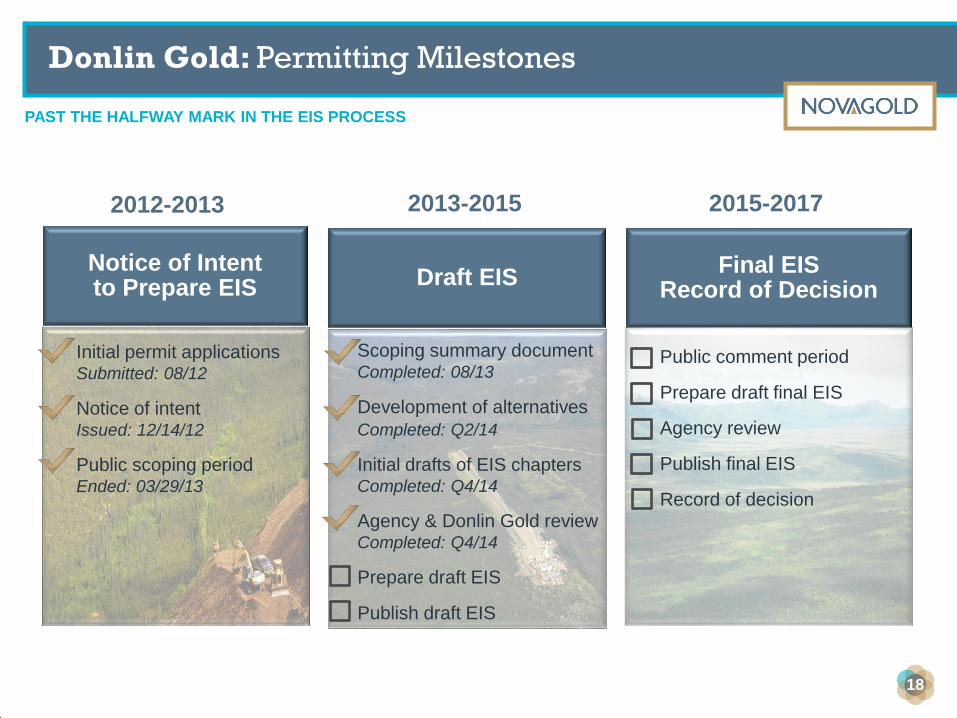
Notice of Intent to Prepare EIS
Draft EIS
Final EIS Record of Decision
Initial permit applications Submitted: 08/12
Notice of intent Issued: 12/14/12
Public scoping period Ended: 03/29/13
Scoping summary document Completed: 08/13
Development of alternatives
Completed: Q2/14
Initial drafts of EIS chapters Completed: Q4/14
Agency & Donlin Gold review Completed: Q4/14
Prepare draft EIS
Publish draft EIS
Public comment period
Prepare draft final EIS
Agency review
Publish final EIS
Record of decision
2012-2013 2013-2015 2015-2017
PAST THE HALFWAY MARK IN THE EIS PROCESS
Donlin Gold: Permitting Milestones
18
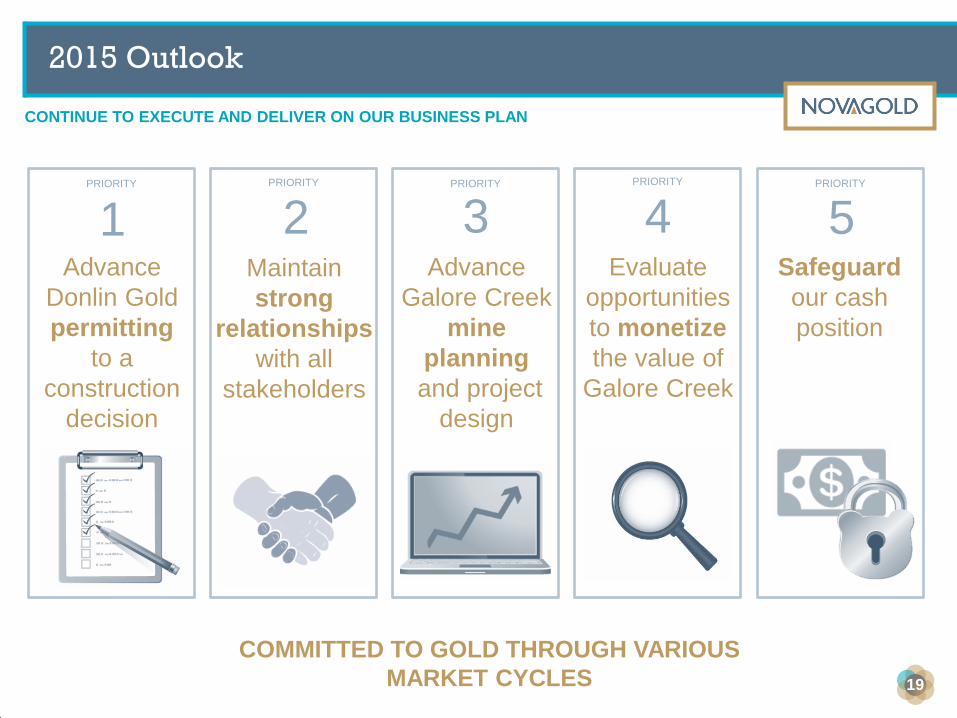
CONTINUE TO EXECUTE AND DELIVER ON OUR BUSINESS PLAN
2015 Outlook
1 2 3 4 5 PRIORITY PRIORITY PRIORITY PRIORITY PRIORITY
Advance
Donlin Gold
permitting
to a
construction
decision
Advance
Galore Creek
mine
planning
and project
design
Evaluate
opportunities
to monetize
the value of
Galore Creek
Safeguard
our cash
position
Maintain
strong
relationships
with all
stakeholders
COMMITTED TO GOLD THROUGH VARIOUS
MARKET CYCLES 19
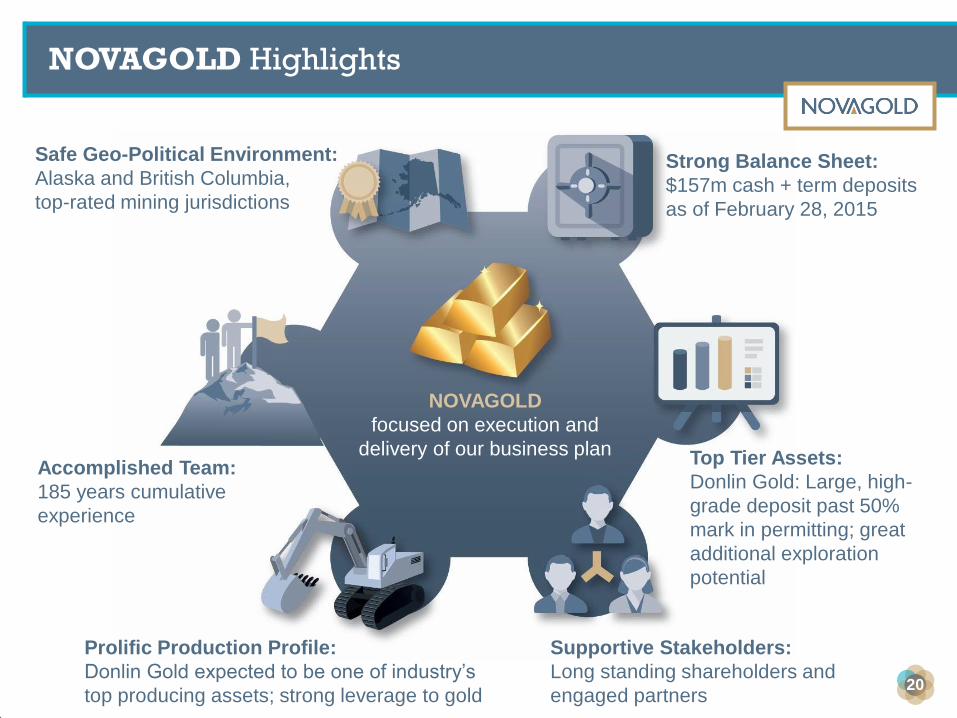
NOVAGOLD
focused on execution and
delivery of our business plan
NOVAGOLD Highlights
Safe Geo-Political Environment:
Alaska and British Columbia,
top-rated mining jurisdictions
Accomplished Team:
185 years cumulative
experience
Prolific Production Profile:
Donlin Gold expected to be one of industry’s
top producing assets; strong leverage to gold
Supportive Stakeholders:
Long standing shareholders and
engaged partners
Strong Balance Sheet:
$157m cash + term deposits
as of February 28, 2015
Top Tier Assets:
Donlin Gold: Large, high-
grade deposit past 50%
mark in permitting; great
additional exploration
potential
20
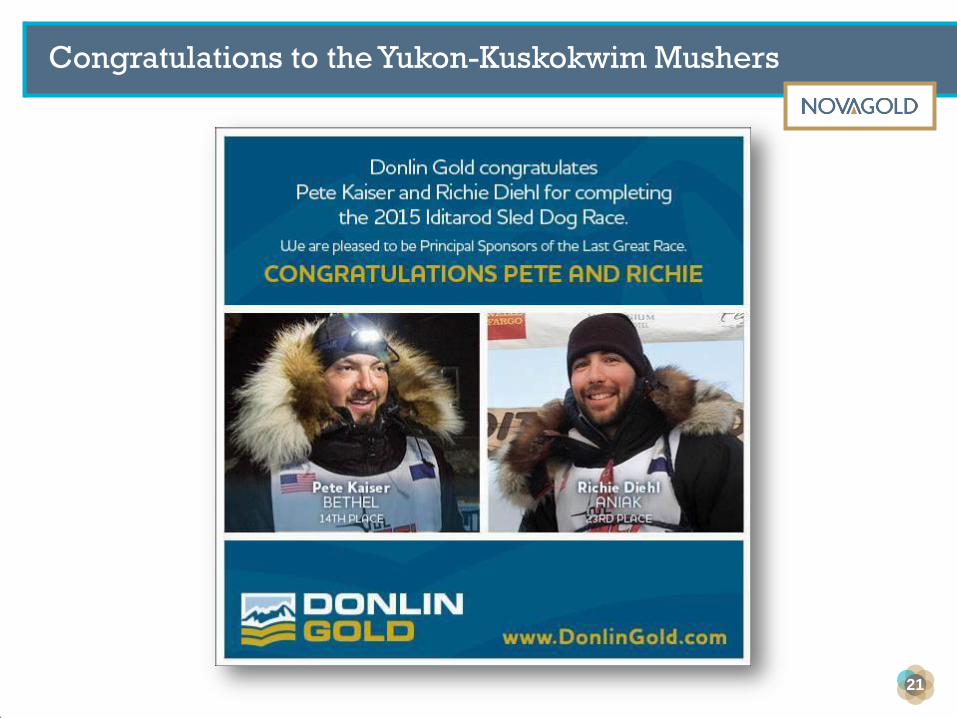
Congratulations to the Yukon-Kuskokwim Mushers
21
novagold.com
Appendix
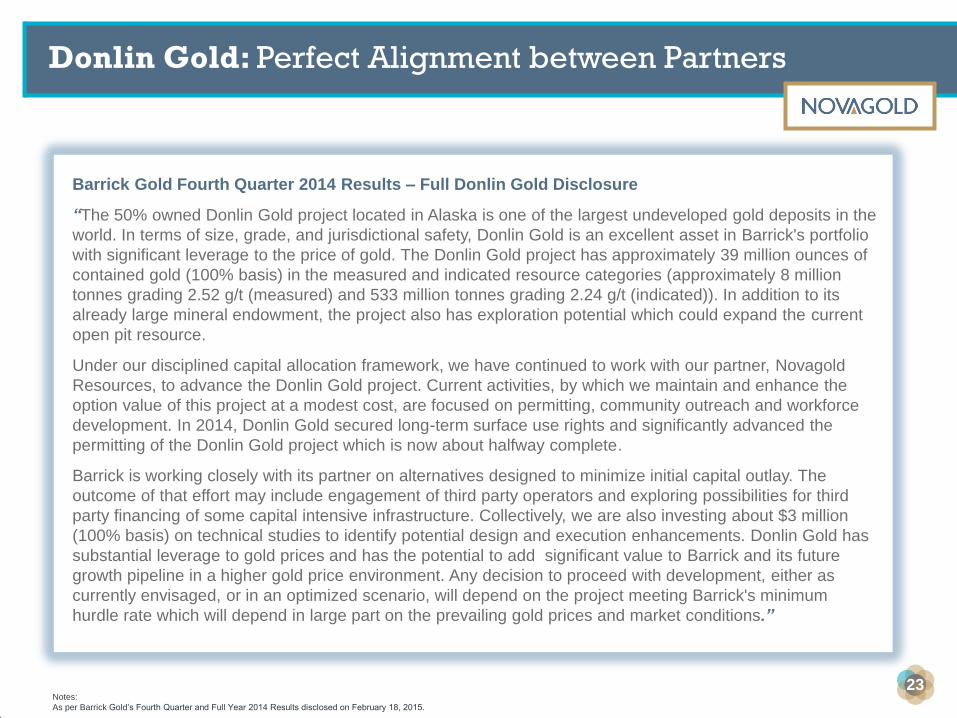
Barrick Gold Fourth Quarter 2014 Results – Full Donlin Gold Disclosure
“The 50% owned Donlin Gold project located in Alaska is one of the largest undeveloped gold deposits in the
world. In terms of size, grade, and jurisdictional safety, Donlin Gold is an excellent asset in Barrick's portfolio
with significant leverage to the price of gold. The Donlin Gold project has approximately 39 million ounces of
contained gold (100% basis) in the measured and indicated resource categories (approximately 8 million
tonnes grading 2.52 g/t (measured) and 533 million tonnes grading 2.24 g/t (indicated)). In addition to its
already large mineral endowment, the project also has exploration potential which could expand the current
open pit resource.
Under our disciplined capital allocation framework, we have continued to work with our partner, Novagold
Resources, to advance the Donlin Gold project. Current activities, by which we maintain and enhance the
option value of this project at a modest cost, are focused on permitting, community outreach and workforce
development. In 2014, Donlin Gold secured long-term surface use rights and significantly advanced the
permitting of the Donlin Gold project which is now about halfway complete.
Barrick is working closely with its partner on alternatives designed to minimize initial capital outlay. The
outcome of that effort may include engagement of third party operators and exploring possibilities for third
party financing of some capital intensive infrastructure. Collectively, we are also investing about $3 million
(100% basis) on technical studies to identify potential design and execution enhancements. Donlin Gold has
substantial leverage to gold prices and has the potential to add significant value to Barrick and its future
growth pipeline in a higher gold price environment. Any decision to proceed with development, either as
currently envisaged, or in an optimized scenario, will depend on the project meeting Barrick's minimum
hurdle rate which will depend in large part on the prevailing gold prices and market conditions.”
Donlin Gold: Perfect Alignment between Partners
23 Notes:
As per Barrick Gold’s Fourth Quarter and Full Year 2014 Results disclosed on February 18, 2015.
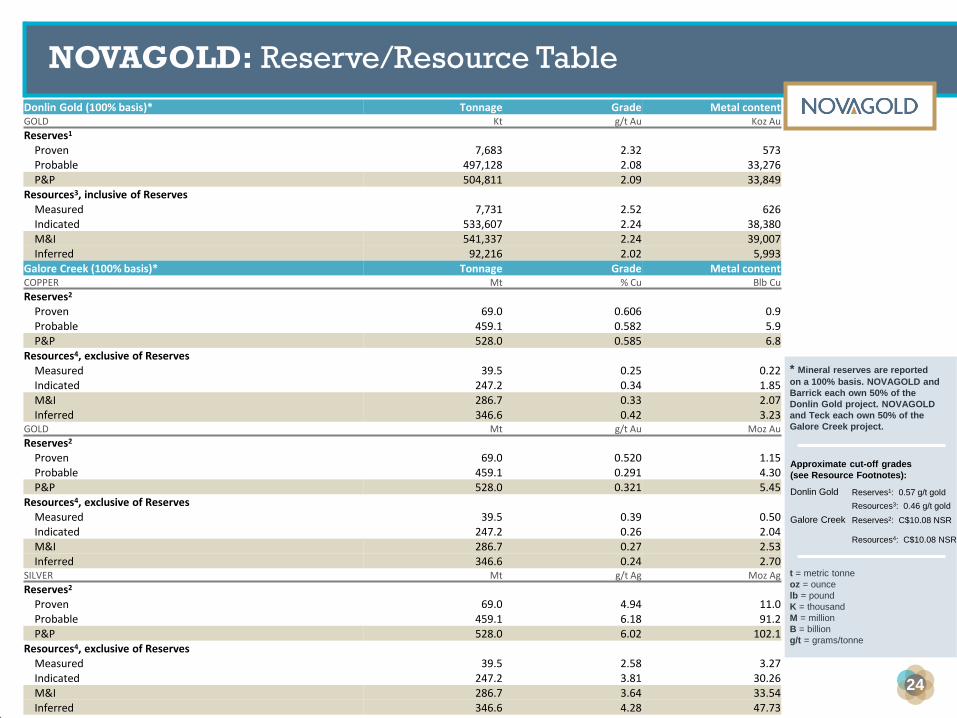
NOVAGOLD: Reserve/Resource Table
24
Donlin Gold (100% basis)* Tonnage Grade Metal content GOLD Kt g/t Au Koz Au
Reserves1 Proven 7,683 2.32 573 Probable 497,128 2.08 33,276 P&P 504,811 2.09 33,849 Resources3, inclusive of Reserves Measured 7,731 2.52 626 Indicated 533,607 2.24 38,380 M&I 541,337 2.24 39,007 Inferred 92,216 2.02 5,993 Galore Creek (100% basis)* Tonnage Grade Metal content COPPER Mt % Cu Blb Cu
Reserves2 Proven 69.0 0.606 0.9 Probable 459.1 0.582 5.9 P&P 528.0 0.585 6.8 Resources4, exclusive of Reserves Measured 39.5 0.25 0.22 Indicated 247.2 0.34 1.85 M&I 286.7 0.33 2.07 Inferred 346.6 0.42 3.23 GOLD Mt g/t Au Moz Au
Reserves2 Proven 69.0 0.520 1.15 Probable 459.1 0.291 4.30 P&P 528.0 0.321 5.45 Resources4, exclusive of Reserves Measured 39.5 0.39 0.50 Indicated 247.2 0.26 2.04 M&I 286.7 0.27 2.53 Inferred 346.6 0.24 2.70 SILVER Mt g/t Ag Moz Ag
Reserves2 Proven 69.0 4.94 11.0 Probable 459.1 6.18 91.2 P&P 528.0 6.02 102.1 Resources4, exclusive of Reserves Measured 39.5 2.58 3.27 Indicated 247.2 3.81 30.26 M&I 286.7 3.64 33.54 Inferred 346.6 4.28 47.73
* Mineral reserves are reported
on a 100% basis. NOVAGOLD and
Barrick each own 50% of the
Donlin Gold project. NOVAGOLD
and Teck each own 50% of the
Galore Creek project.
t = metric tonne
oz = ounce
lb = pound
K = thousand
M = million
B = billion
g/t = grams/tonne
Approximate cut-off grades
(see Resource Footnotes):
Donlin Gold Reserves1: 0.57 g/t gold
Resources3: 0.46 g/t gold
Galore Creek Reserves2: C$10.08 NSR
Resources4: C$10.08 NSR
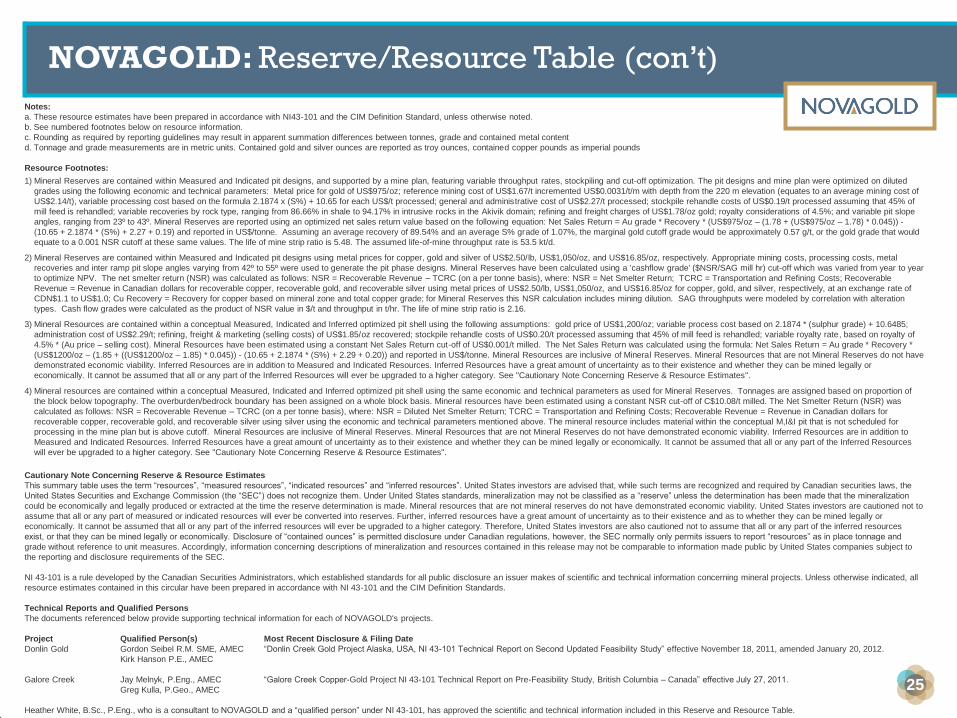
Notes:
a. These resource estimates have been prepared in accordance with NI43-101 and the CIM Definition Standard, unless otherwise noted.
b. See numbered footnotes below on resource information.
c. Rounding as required by reporting guidelines may result in apparent summation differences between tonnes, grade and contained metal content
d. Tonnage and grade measurements are in metric units. Contained gold and silver ounces are reported as troy ounces, contained copper pounds as imperial pounds
Resource Footnotes:
1) Mineral Reserves are contained within Measured and Indicated pit designs, and supported by a mine plan, featuring variable throughput rates, stockpiling and cut-off optimization. The pit designs and mine plan were optimized on diluted
grades using the following economic and technical parameters: Metal price for gold of US$975/oz; reference mining cost of US$1.67/t incremented US$0.0031/t/m with depth from the 220 m elevation (equates to an average mining cost of
US$2.14/t), variable processing cost based on the formula 2.1874 x (S%) + 10.65 for each US$/t processed; general and administrative cost of US$2.27/t processed; stockpile rehandle costs of US$0.19/t processed assuming that 45% of
mill feed is rehandled; variable recoveries by rock type, ranging from 86.66% in shale to 94.17% in intrusive rocks in the Akivik domain; refining and freight charges of US$1.78/oz gold; royalty considerations of 4.5%; and variable pit slope
angles, ranging from 23º to 43º. Mineral Reserves are reported using an optimized net sales return value based on the following equation: Net Sales Return = Au grade * Recovery * (US$975/oz – (1.78 + (US$975/oz – 1.78) * 0.045)) -
(10.65 + 2.1874 * (S%) + 2.27 + 0.19) and reported in US$/tonne. Assuming an average recovery of 89.54% and an average S% grade of 1.07%, the marginal gold cutoff grade would be approximately 0.57 g/t, or the gold grade that would
equate to a 0.001 NSR cutoff at these same values. The life of mine strip ratio is 5.48. The assumed life-of-mine throughput rate is 53.5 kt/d.
2) Mineral Reserves are contained within Measured and Indicated pit designs using metal prices for copper, gold and silver of US$2.50/lb, US$1,050/oz, and US$16.85/oz, respectively. Appropriate mining costs, processing costs, metal
recoveries and inter ramp pit slope angles varying from 42º to 55º were used to generate the pit phase designs. Mineral Reserves have been calculated using a 'cashflow grade' ($NSR/SAG mill hr) cut-off which was varied from year to year
to optimize NPV. The net smelter return (NSR) was calculated as follows: NSR = Recoverable Revenue – TCRC (on a per tonne basis), where: NSR = Net Smelter Return; TCRC = Transportation and Refining Costs; Recoverable
Revenue = Revenue in Canadian dollars for recoverable copper, recoverable gold, and recoverable silver using metal prices of US$2.50/lb, US$1,050/oz, and US$16.85/oz for copper, gold, and silver, respectively, at an exchange rate of
CDN$1.1 to US$1.0; Cu Recovery = Recovery for copper based on mineral zone and total copper grade; for Mineral Reserves this NSR calculation includes mining dilution. SAG throughputs were modeled by correlation with alteration
types. Cash flow grades were calculated as the product of NSR value in $/t and throughput in t/hr. The life of mine strip ratio is 2.16.
3) Mineral Resources are contained within a conceptual Measured, Indicated and Inferred optimized pit shell using the following assumptions: gold price of US$1,200/oz; variable process cost based on 2.1874 * (sulphur grade) + 10.6485;
administration cost of US$2.29/t; refining, freight & marketing (selling costs) of US$1.85/oz recovered; stockpile rehandle costs of US$0.20/t processed assuming that 45% of mill feed is rehandled; variable royalty rate, based on royalty of
4.5% * (Au price – selling cost). Mineral Resources have been estimated using a constant Net Sales Return cut-off of US$0.001/t milled. The Net Sales Return was calculated using the formula: Net Sales Return = Au grade * Recovery *
(US$1200/oz – (1.85 + ((US$1200/oz – 1.85) * 0.045)) - (10.65 + 2.1874 * (S%) + 2.29 + 0.20)) and reported in US$/tonne. Mineral Resources are inclusive of Mineral Reserves. Mineral Resources that are not Mineral Reserves do not have
demonstrated economic viability. Inferred Resources are in addition to Measured and Indicated Resources. Inferred Resources have a great amount of uncertainty as to their existence and whether they can be mined legally or
economically. It cannot be assumed that all or any part of the Inferred Resources will ever be upgraded to a higher category. See "Cautionary Note Concerning Reserve & Resource Estimates".
4) Mineral resources are contained within a conceptual Measured, Indicated and Inferred optimized pit shell using the same economic and technical parameters as used for Mineral Reserves. Tonnages are assigned based on proportion of
the block below topography. The overburden/bedrock boundary has been assigned on a whole block basis. Mineral resources have been estimated using a constant NSR cut-off of C$10.08/t milled. The Net Smelter Return (NSR) was
calculated as follows: NSR = Recoverable Revenue – TCRC (on a per tonne basis), where: NSR = Diluted Net Smelter Return; TCRC = Transportation and Refining Costs; Recoverable Revenue = Revenue in Canadian dollars for
recoverable copper, recoverable gold, and recoverable silver using silver using the economic and technical parameters mentioned above. The mineral resource includes material within the conceptual M,I&I pit that is not scheduled for
processing in the mine plan but is above cutoff. Mineral Resources are inclusive of Mineral Reserves. Mineral Resources that are not Mineral Reserves do not have demonstrated economic viability. Inferred Resources are in addition to
Measured and Indicated Resources. Inferred Resources have a great amount of uncertainty as to their existence and whether they can be mined legally or economically. It cannot be assumed that all or any part of the Inferred Resources
will ever be upgraded to a higher category. See "Cautionary Note Concerning Reserve & Resource Estimates".
Cautionary Note Concerning Reserve & Resource Estimates
This summary table uses the term “resources”, “measured resources”, “indicated resources” and “inferred resources”. United States investors are advised that, while such terms are recognized and required by Canadian securities laws, the
United States Securities and Exchange Commission (the “SEC”) does not recognize them. Under United States standards, mineralization may not be classified as a “reserve” unless the determination has been made that the mineralization
could be economically and legally produced or extracted at the time the reserve determination is made. Mineral resources that are not mineral reserves do not have demonstrated economic viability. United States investors are cautioned not to
assume that all or any part of measured or indicated resources will ever be converted into reserves. Further, inferred resources have a great amount of uncertainty as to their existence and as to whether they can be mined legally or
economically. It cannot be assumed that all or any part of the inferred resources will ever be upgraded to a higher category. Therefore, United States investors are also cautioned not to assume that all or any part of the inferred resources
exist, or that they can be mined legally or economically. Disclosure of “contained ounces” is permitted disclosure under Canadian regulations, however, the SEC normally only permits issuers to report “resources” as in place tonnage and
grade without reference to unit measures. Accordingly, information concerning descriptions of mineralization and resources contained in this release may not be comparable to information made public by United States companies subject to
the reporting and disclosure requirements of the SEC.
NI 43-101 is a rule developed by the Canadian Securities Administrators, which established standards for all public disclosure an issuer makes of scientific and technical information concerning mineral projects. Unless otherwise indicated, all
resource estimates contained in this circular have been prepared in accordance with NI 43-101 and the CIM Definition Standards.
Technical Reports and Qualified Persons
The documents referenced below provide supporting technical information for each of NOVAGOLD's projects.
Project Qualified Person(s) Most Recent Disclosure & Filing Date
Donlin Gold Gordon Seibel R.M. SME, AMEC “Donlin Creek Gold Project Alaska, USA, NI 43-101 Technical Report on Second Updated Feasibility Study” effective November 18, 2011, amended January 20, 2012.
Kirk Hanson P.E., AMEC
Galore Creek Jay Melnyk, P.Eng., AMEC “Galore Creek Copper-Gold Project NI 43-101 Technical Report on Pre-Feasibility Study, British Columbia – Canada” effective July 27, 2011.
Greg Kulla, P.Geo., AMEC
Heather White, B.Sc., P.Eng., who is a consultant to NOVAGOLD and a “qualified person” under NI 43-101, has approved the scientific and technical information included in this Reserve and Resource Table.
NOVAGOLD: Reserve/Resource Table (con’t)
25
NOVAGOLD RESOURCES INC.
Suite 720 – 789 West Pender Street
Vancouver, BC
Canada V6C 1H2
T 604 669 6227 TF 1 866 669 6227 F 604 669 6272
www.novagold.com
Mélanie Hennessey
VP, Corporate Communications
Erin O’Toole
Analyst, Investor Relations
Contact Us
26