classroom and laboratory utilization study and campus-wide...
TRANSCRIPT

Classroom and LaboratoryUtilization Study
andCampus-Wide Space Analysis
June 2000
THE
UNIVERSITY OF VERMONT

Document Prepared by:
PAULIEN & ASSOCIATES, INC.
Denver, Colorado
Daniel K. Paulien, President John Bengston, Senior Associate Mel Lockhart, Senior Associate
Lisa Keith, Associate II Yvonne M. Thibodeau, Associate
Anne Clark, Associate Mike Wilson, Data Analyst
K. C. Bock, Data Analyst Gloria LeFree, Production Assistant
Felicia Gallegos, Production Assistant Mary Herndon, Production Assistant
Acknowledgments to:
THE UNIVERSITY OF VERMONT PROJECT CONTACTS:
Linda Seavey, Director, Campus Planning Services
Geoffrey Gamble, Provost Tom Gustafson, Vice President, University Relations and Operations
Bill Ballard, Associate Vice President, Administrative and Facilities Services Fred Curran, Director, Institutional Studies
Harris Abbott, Assistant Director, Campus Planning Services Keith Kennedy, Assistant Director for Administrative Information Services
Joanna Carney, Facilities Information Analyst Julie Green, Staff Assistant, Campus Planning Services

Paulien & Associates, Inc.
THE UNIVERSITY OF VERMONT
Classroom and Laboratory Utilization Study and
Campus-Wide Space Analysis
Prepared by Paulien & Associates, Inc.
June 2000
1.0 PREFACE AND SUMMARY ..........................................................................1
1.1 OVERVIEW..................................................................................................................... 1 1.2 SUMMARY OF FINDINGS .............................................................................................. 2
1.2.1 CLASSROOM AND LABORATORY UTILIZATION...............................................................2 1.2.2 CAMPUS-WIDE SPACE NEEDS ANALYSIS .........................................................................3
2.0 CLASSROOM ANALYSIS .............................................................................5 2.1 CLASSROOM UTILIZATION ANALYSIS PROCESS........................................................ 5 2.2 CLASSROOM UTILIZATION ANALYSIS SUMMARY ..................................................... 5 2.3 CLASSROOM UTILIZATION BY ROOM TYPE ............................................................... 8 2.4 CLASSROOM UTILIZATION BY ROOM CAPACITY....................................................... 9 2.5 CLASSROOM UTILIZATION BY BUILDING................................................................. 12 2.6 CLASSROOM UTILIZATION BY DAY AND TIME ........................................................ 14
3.0 LABORATORY ANALYSIS .........................................................................18 3.1 LABORATORY UTILIZATION ANALYSIS PROCESS.................................................... 18 3.2 LABORATORY UTILIZATION SUMMARY ................................................................... 18 3.3 LABORATORY UTILIZATION BY DEPARTMENT......................................................... 20 3.4 LABORATORY UTILIZATION BY DAY AND TIME ...................................................... 20
4.0 CAMPUS-WIDE SPACE NEEDS FINDINGS..............................................24 4.1 SPACE NEEDS ANALYSIS PROCESS ........................................................................... 24 4.2 SPACE NEEDS ANALYSIS FINDINGS.......................................................................... 28
4.2.1 CLASSROOM & SERVICE SPACE......................................................................................29 4.2.2 TEACHING LABORATORY AND SERVICE .........................................................................29 4.2.3 OPEN LABORATORIES & SERVICE..................................................................................30 4.2.4 RESEARCH LABORATORIES & SERVICE..........................................................................30 4.2.5 OFFICES & SERVICE .........................................................................................................30 4.2.6 LIBRARY............................................................................................................................31 4.2.7 SPECIAL USE FACILITIES .................................................................................................32 4.2.8 GENERAL USE FACILITIES ...............................................................................................32 4.2.9 SUPPORT FACILITIES .......................................................................................................32 4.2.10 HEALTH CARE FACILITIES ...........................................................................................32 4.2.11 RESIDENTIAL FACILITIES.............................................................................................32

Paulien & Associates, Inc.
APPENDIX A: CLASSROOM UTILIZATION ANALYSIS.....................................................................34 APPENDIX B: CLASSROOM UTILIZATION BY DAY AND HOUR .....................................................47 APPENDIX C: LIST OF CLASSROOM ROOM USE CODE ADJUSTMENTS........................................68 APPENDIX D: TEACHING LABORATORY UTILIZATION ANALYSIS SUMMARY............................73 APPENDIX E: TEACHING LABORATORY UTILIZATION ANALYSIS SUMMARY BY DEPT .............77 APPENDIX F: SCHEDULED LAB USE BY DAY AND HOUR...............................................................84 APPENDIX G: LIST OF LABORATORY ROOM USE CODE ADJUSTMENTS .....................................89

Paulien & Associates, Inc. Page 1
THE UNIVERSITY OF VERMONT
Classroom and Laboratory Utilization Study and
Campus-Wide Space Analysis
Prepared by Paulien & Associates, Inc.
June 2000
1.0 PREFACE AND SUMMARY
1.1 OVERVIEW
The University of Vermont contracted with Paulien & Associates of Denver, Colorado to conduct a detailed classroom and laboratory utilization study, and provide perspective as to the adequacy of the amounts of space at the University of Vermont by major category through comparisons to space amounts at other research universities and space guidelines used in other states.
The University provided the consultants with a facilities inventory for the
campus and with course data from the Fall 1999 term. The University also provided the consultant with a copy of The University of Vermont Sourcebook 1999-2000. Using the data provided, the consultants reviewed the information and conducted analysis of the efficiency of classroom and laboratory use. The facilities inventory and course data were used to compute student station utilization showing hours of week per use, percentage of student station occupancy, and average space per student station for the instructional rooms.
After having reviewed the utilization data, the consultants visited the
University of Vermont campus, toured several of the campus buildings, and looked at those rooms for which the initial utilization analysis results posed questions. While on the campus the consultants met with the Director of Campus Planning Services, with her staff, with the Vice President of University Relations and Operations, and with the Associate Vice President for Administrative and Facilities Services to share the first draft of the utilization study findings. Initial findings were also shared with the Senate Physical Planning Committee. The campus visit identified additional information needed for refinement of the utilization analysis. In some instances this refinement included adjustment of room use codes to match more closely the primary use of instructional spaces.

Paulien & Associates, Inc. Page 2
The initial results of the space needs analysis portion of the study were also reviewed while the consultant was on campus. The consultant shared the preliminary findings, discussed the guidelines and peer institutions used, and recommended alternate approaches that could be used to generate more reliable results. The consultant and the Director of Institutional Studies as well as the Associate Vice President for Administrative and Facilities Services reviewed those institutions which had been utilized for comparison of space adequacy by major category. This review resulted in a decision to adjust the institutions used for the comparison. After the visit to campus the consultant and the Director of Institutional Studies identified another set of peer institutions and a revised peer analysis was produced.
1.2 SUMMARY OF FINDINGS
1.2.1 CLASSROOM AND LABORATORY UTILIZATION
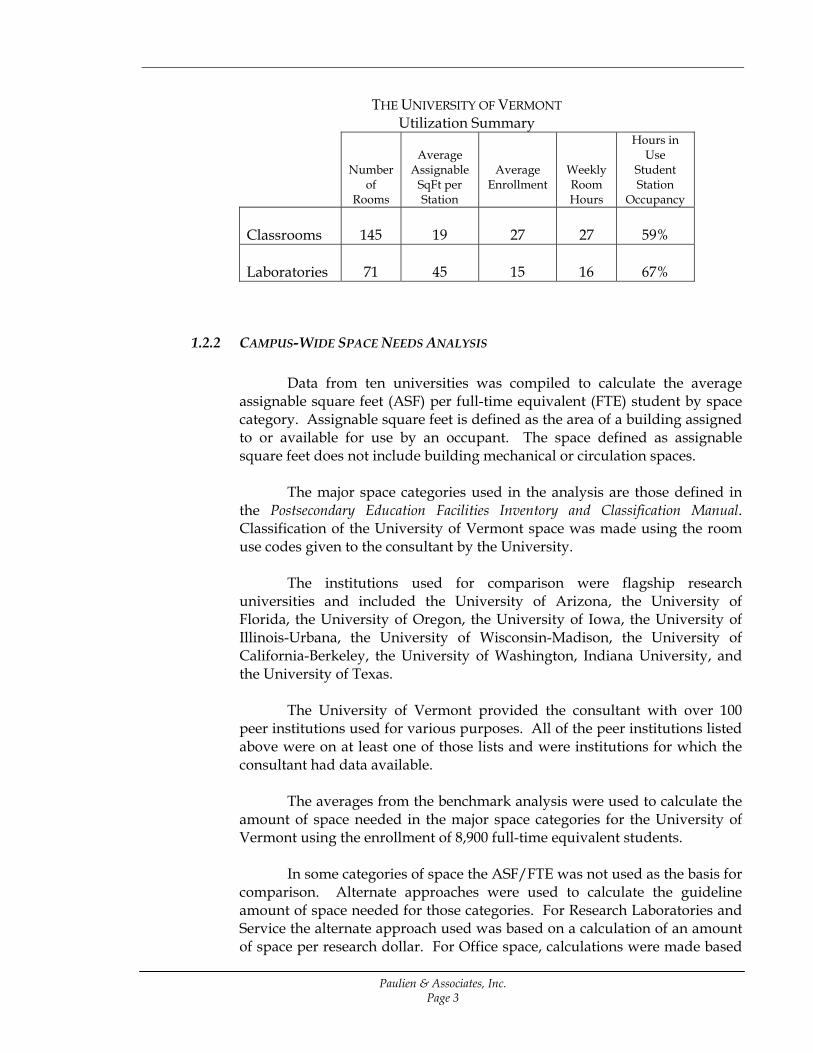
The University of Vermont campus had 145 classrooms in the Fall of 1999. The current study looked at all classroom utilization, both day and evening. The key findings showed that classrooms were scheduled an average of 27 hours per week at 59% student station occupancy. The consultants’ experience analyzing utilization at institutions similar to the University of Vermont indicates the expected range of hours of use per week to average between 30 and 35 hours of use at 60% to 65% occupancy. Findings for the University of Vermont fell a little lower than that range. The classroom use by day and time of day showed a typical pattern of use.
The University of Vermont schedules the use of classrooms manually.
This may account for the classroom utilization being slightly lower than might be expected for a major university. The University is looking into acquiring scheduling software in order to automate the scheduling process. The consultants recommend that the University acquire scheduling software and implement its use as soon as possible. In addition the consultants recommend that the University review the room use coding on a campus-wide basis for consistency.
The campus-wide use of teaching laboratories averaged 16 hours of
use per week at 67% student station occupancy. In the consultants’ experience, the expected range for teaching laboratories at similar universities is 15 to 20 hours of per week use at 70% to 75% student station occupancy. The University of Vermont findings were within the range for expected hours of scheduled use but lower than the expected range for occupancy. The laboratory use by day and time of day showed a typical pattern of use. More in-depth analysis would be necessary to draw conclusions regarding use by the individual departments.
Paulien & Associates, Inc. Page 3
THE UNIVERSITY OF VERMONT Utilization Summary
Number of
Rooms
Average
Assignable SqFt per Station
Average Enrollment
Weekly Room Hours
Hours in Use
Student Station
Occupancy Classrooms
145
19
27
27
59%
Laboratories
71
45
15
16
67%
1.2.2 CAMPUS-WIDE SPACE NEEDS ANALYSIS
Data from ten universities was compiled to calculate the average assignable square feet (ASF) per full-time equivalent (FTE) student by space category. Assignable square feet is defined as the area of a building assigned to or available for use by an occupant. The space defined as assignable square feet does not include building mechanical or circulation spaces.
The major space categories used in the analysis are those defined in
the Postsecondary Education Facilities Inventory and Classification Manual. Classification of the University of Vermont space was made using the room use codes given to the consultant by the University.
The institutions used for comparison were flagship research
universities and included the University of Arizona, the University of Florida, the University of Oregon, the University of Iowa, the University of Illinois-Urbana, the University of Wisconsin-Madison, the University of California-Berkeley, the University of Washington, Indiana University, and the University of Texas.
The University of Vermont provided the consultant with over 100
peer institutions used for various purposes. All of the peer institutions listed above were on at least one of those lists and were institutions for which the consultant had data available.
The averages from the benchmark analysis were used to calculate the
amount of space needed in the major space categories for the University of Vermont using the enrollment of 8,900 full-time equivalent students.
In some categories of space the ASF/FTE was not used as the basis for
comparison. Alternate approaches were used to calculate the guideline amount of space needed for those categories. For Research Laboratories and Service the alternate approach used was based on a calculation of an amount of space per research dollar. For Office space, calculations were made based

Paulien & Associates, Inc. Page 4
on staff numbers rather than student numbers. In the Housing category calculations were based on the number of beds on campus rather than the overall number of students. For Library space the calculations included space calculations for the number of students but also included a calculation for the number of faculty and one for the number of volumes.
Calculations of ASF/FTE and of the alternate approaches used
provided the University with a campus-wide analysis. It is recommended that the University of Vermont consider having a more detailed study done which will provide college-by-college findings utilizing both peer data at a college level and normative information. Some colleges may be significantly short of space while others may have adequate amounts. Such a study will clarify this.
Overall campus-wide findings indicated that the University of
Vermont shows a space deficit in most categories of space with a total deficit of over 175,000 ASF. It should be noted that this does not include the new spaces being planned or constructed on campus or those being leased that may be returned to the campus for use: the Health Science Research Facility, Rubenstein Laboratory, the Medical Education Center, the Student Center/Gateway, student housing, and DeGoesbriand.
It is recommended that more in-depth space needs analysis be
performed at the college or departmental level to provide the University with information that could be used for further planning. It is also recommended that the University implement a space management policy similar to the Draft Space Management Policy Version 2.c June 2000.
8,900
Existing ASF Benchmark ASFSurplus/ (Deficit)
Percent Surplus/ (Deficit)
The University of Vermont ASF/FTE
Peer Average ASF/FTE
Classroom & Service 122,724 90,780 31,944 26.0% 13.8 10.2Teaching Laboratories & Service 88,337 101,460 (13,123) (14.9%) 9.9 11.4Open Laboratories & Service 48,566 52,510 (3,944) (8.1%) 5.5 5.9
* Research Laboratories & Service 245,310 280,200 (34,890) (14.2%) 525ASF/$100,000 600ASF/$100,000* Offices & Service 494,844 589,595 (94,751) (19.1%) 155ASF/staff 185ASF/staff* Library 195,340 208,621 (13,281) (6.8%) 22.0 ACRL adjusted
Special 361,775 218,050 143,725 39.7% 40.7 24.5General 228,084 187,612 40,472 17.7% 25.6 21.1Support 152,642 233,180 (80,538) (52.8%) 17.2 26.2Health Care Facilities 5,444 48,238 (42,794) (786.1%) 0.6 5.4
* Housing 638,685 747,000 (108,315) (17.0%) 170ASF/bed 200ASF/bedCOLLEGE/UNIT TOTAL 2,581,751 2,757,246 (175,495) (6.8%)
* Alternate approaches have been used other than ASF/FTE benchmarks
THE UNIVERSITY OF VERMONT
Student FTE:
Peer Based Needs Analysis
1999 BASE YEAR

Paulien & Associates, Inc. Page 5
2.0 CLASSROOM ANALYSIS
2.1 CLASSROOM UTILIZATION ANALYSIS PROCESS The classroom utilization at the University of Vermont was analyzed using
Fall 1999 data. The data was organized in a number of different ways so that average campus-wide findings could be calculated along with findings by seating capacity of classrooms, time of day, and campus location.
The University of Vermont provided the consultant with information on the
courses taught in Fall 1999, with meeting times, locations, and enrollment for each course. A facility inventory listing all of the classrooms being studied in this report was provided by the University. The consultants visited the University of Vermont campus to gain familiarity with the classroom spaces and to verify the data received.
Paulien & Associates utilized applications it has developed with data base
management software to produce an analysis of the classroom utilization by room, by room capacity, by building, and by time of day. This study did not include analysis of quality of space, sight lines, acoustics, or equipment in rooms.
2.2 CLASSROOM UTILIZATION ANALYSIS SUMMARY
The facilities inventory originally given to the consultants included 160 rooms classified as classrooms. The initial utilization analysis results indicated that 29 of these 160 rooms had no scheduled use. For some of the classrooms that showed no utilization in the initial analysis, additional information on courses was obtained from the departments and included for subsequent analysis. After discussion with the Director of Campus Planning Services and the Facilities Information Analyst some classrooms that indicated no scheduled use were re-coded as conference rooms, classroom service, or other uses. Two classrooms, originally coded as open laboratories, were added to the classroom list.
The final analysis of classroom use included 145 classrooms. The list of
classrooms in the analysis and those that were eliminated from the analysis can be found in Appendix C. The 145 classrooms analyzed included 24 General Purpose classrooms, 51 Schedule Priority classrooms, two Special Equipment classrooms, 24 Restricted Schedule classrooms, and 44 Departmental classrooms.
The inclusive definition of classroom includes not only classrooms, but
lecture halls, recitation rooms, and seminar rooms. General Purpose classrooms are further defined by the University of Vermont as those under the control of Facilities Scheduling for the purpose of scheduling classes. Schedule Priority classrooms are those for which a particular department or program is given first priority by Facilities Scheduling when scheduling the rooms for classes. Special Equipment

Paulien & Associates, Inc. Page 6
classrooms are those scheduled by Facilities Scheduling and used by classes that require special purpose equipment for student use. Restricted Schedule classrooms are defined as those scheduled by a particular academic department or program for its own classes. After a particular department has completed scheduling its own use of the Restricted Schedule classrooms, the open periods may be released to Facilities Scheduling for further scheduling of classes. Departmental classrooms are those under the control of a particular department or program for its own academic needs.
When comparing the University of Vermont to other major universities it
should be noted that the rooms that the University of Vermont classifies as Departmental classrooms are often classified as conference rooms at other universities. This classification is often motivated by the need to maximize classroom utilization results. Since the University of Vermont has no mandated need to maximize classroom utilization, the University retains its Departmental classrooms in the classroom space category.
Of the 145 classrooms, two are scheduled for use only in the spring term.
Since the analysis was of Fall 1999 term, the analysis showed zero utilization for these two rooms, Music Room A311 and Perkins Room 211. Music Room A311 is the Electronic Music classroom. Perkins Room 211 is the Geology seminar room. Both are Departmental classrooms.
The consultants find it unusual for a campus to have classrooms that are
scheduled only one term. While only scheduling a room during one term is not unusual for an advanced laboratory space that has a particular curricular use, classrooms can generally be used for multiple disciplines and are rarely scheduled only for one term during the academic year. It is recommended that these rooms, Music Room A311 and Perkins Room 211, be evaluated for possible expanded or alternate use.
Findings for classroom utilization for the Fall 1999 term showed the overall
campus classroom utilization at the University of Vermont to be on the low side for a campus of its size and mission. The expected range for a major university would be an average of 30 to 35 hours per week of use at 60% to 65% student station occupancy. The use for classes analyzed at the University of Vermont averaged 27 hours per week, with 59% student station occupancy.
The number of hours per week of utilization can range widely. The hours of
use can be compared to a 40-hour work week or only to the 25 peak class hours in the middle of the day. It can also be compared to 70 to 75 hours of possible use in a week. The expected range of 30 to 35 hours provides a guideline. A campus that offers many evening or weekend courses might have a higher number of hours of use, while a campus that offers only daytime courses may have a lower number of hours of use per week. Utilization of individual rooms at the University of Vermont ranged from a high of 54 hours per week in Votey Room 231 to a low of zero hours per week in Music Room A311 and Perkins Room 211. As mentioned above, additional information was gathered for classrooms with zero utilization to confirm

Paulien & Associates, Inc. Page 7
whether the room is properly coded as a classroom and if there were courses scheduled in the room.
The percent student station occupancy is the indicator of the number of seats
filled in a room when it is in use. The average at the University of Vermont is 59% of seats filled when rooms are in use. As with the number of hours of use, the occupancy percent can vary widely. As a rule, rooms with less space per seat, like an auditorium, are more comfortable when some of the seats remain empty. On the other hand, a smaller room, like a seminar room, may be quite comfortable when all seats are in use.
The average student station occupancy percentage for individual rooms at
the University of Vermont ranged from 119% occupancy in 120 University Heights Room 100 and 31 South Prospect Room 100 to 2% of seats filled in Given Room E210. The classroom in 120 University Heights Room 100 is the Military Studies classroom and is used as an initial meeting place while activities often take place outside the classroom. It is classified as a Restricted Schedule classroom. The classroom in 31 South Prospect Room 100 is a Departmental classroom and is often used as a seminar room or departmental meeting room. The classroom in Given Room E210 is a lecture hall and is classified as a Departmental classroom.
In instances where the consultants found unusual occupancy percentages,
either very low percentages or percentages above 100%, additional information was requested to verify the station count of the rooms and to correct any discrepancies in the database. For several rooms further investigation confirmed the results that indicate the courses scheduled in the rooms do indeed exceed the room capacity or the course enrollment is low for the room capacity.
In a few cases the consultants found that courses were scheduled in both a
laboratory and classroom space simultaneously allowing faculty member to move the students from one to the other as needed. This was the case, for example, in Practical Nursing use of Rowell Rooms 104 and 237 and in the use of the language laboratory in Southwick 200B. Institutions with higher use of classrooms are usually unable to schedule courses in two rooms. The University of Vermont should look at future laboratories designed with appropriate spaces to conduct the explanatory parts of laboratory instruction. In this instance, the relative low incidence of this did not affect the overall campus utilization of classrooms, and while it is noted here, the consultants view this as an appropriate use of facilities and do not recommend changes in this practice.
The consultants were informed that the University of Vermont schedules the
use of classrooms manually. This may account for the classroom utilization being slightly lower than might be expected for a major university. The University is looking into acquiring scheduling software in order to automate the scheduling process. The consultants recommend that the University acquire scheduling software and implement its use as soon as possible. Until electronic scheduling has

Paulien & Associates, Inc. Page 8
been implemented and evaluated the University should postpone the planning of any major changes in the classroom pool.
2.3 CLASSROOM UTILIZATION BY ROOM TYPE
The University of Vermont has chosen to organize classrooms in five categories: General Purpose classrooms (Room Use Code 110), Schedule Priority classrooms (Room Use Code 111), Special Equipment classrooms (Room Use Code 112), Restricted Schedule classrooms (Room Use Code 113), and Departmental classrooms (Room Use Code 114). This is a unique approach to classifying classrooms and, while it is intended to provide the campus with detailed facilities management information, it does not appear to be implemented in a consistent manner by the departments across the campus. The consultant recommends that the room use codes of the classrooms be reviewed centrally to insure consistency in classroom definition and categorization.
The process used to schedule the priority classrooms works quite well since
they achieve a higher utilization than the strictly centrally scheduled ones. Adopting a scheduling program does not need to negate departmental preferences and even individual instructor preferences that can be built into the model. Such a system makes it more likely that spaces will be used than if one department staff needs to ask another department staff for permission to use the other department’s room. The scheduling of additional hours in those classrooms that are indicated as available for such use would be scheduled automatically after the priority department had turned in its schedule.
Findings for the classrooms when analyzed by the room type classification
indicate the Schedule Priority classrooms are used more hours per week on average than the other four classifications and were occupied at over 60% of capacity when in use. The General Purpose classrooms are used nearly as many hours as the Schedule Priority classrooms but fell below the overall campus average for percent of student station occupancy when in use. The Departmental classrooms are used fewest hours per week, but show the highest occupancy rate when in use. The findings for the classroom types are summarized in the table below:

Paulien & Associates, Inc. Page 9
THE UNIVERSITY OF VERMONT
Classroom Utilization
Number of Rooms
Average
Assignable SqFt per Station
Average Enrollment
Weekly Room Hours
Hours In Use Student Station
Occupancy All Classrooms
145
19
27
27
59%
General Purpose (Room Use Code 110)
24
14
50
33
51%
Schedule Priority (Room Use Code 111)
51
17
25
37
61%
Special Equipment (Room Use Code 112)
2
37
16
27
32%
Restricted Schedule (Room Use Code 113)
24
19
30
24
51%
Departmental (Room Use Code 114)
44
23
16
15
71%
The use of the Special Equipment classroom category (Room Use Code 112)
seems to be an anomaly. The definition of rooms as having special equipment would indicate that the rooms are actually teaching laboratories since the definition of a teaching laboratory is a room with specialized or discipline-specific equipment and use. There are only two rooms classified as Special Equipment classrooms (Room Use Code 112) at the University of Vermont. The University may want to review or eliminate the room use code 112 and classify special equipment classrooms as teaching laboratory spaces.
The University, in addition to the recommendation made above that the
room use codes of the classrooms be reviewed centrally to insure consistency in classroom definition, should consider reclassifying some of the Departmental classrooms into Schedule Priority classrooms to improve utilization of available space.
2.4 CLASSROOM UTILIZATION BY ROOM CAPACITY
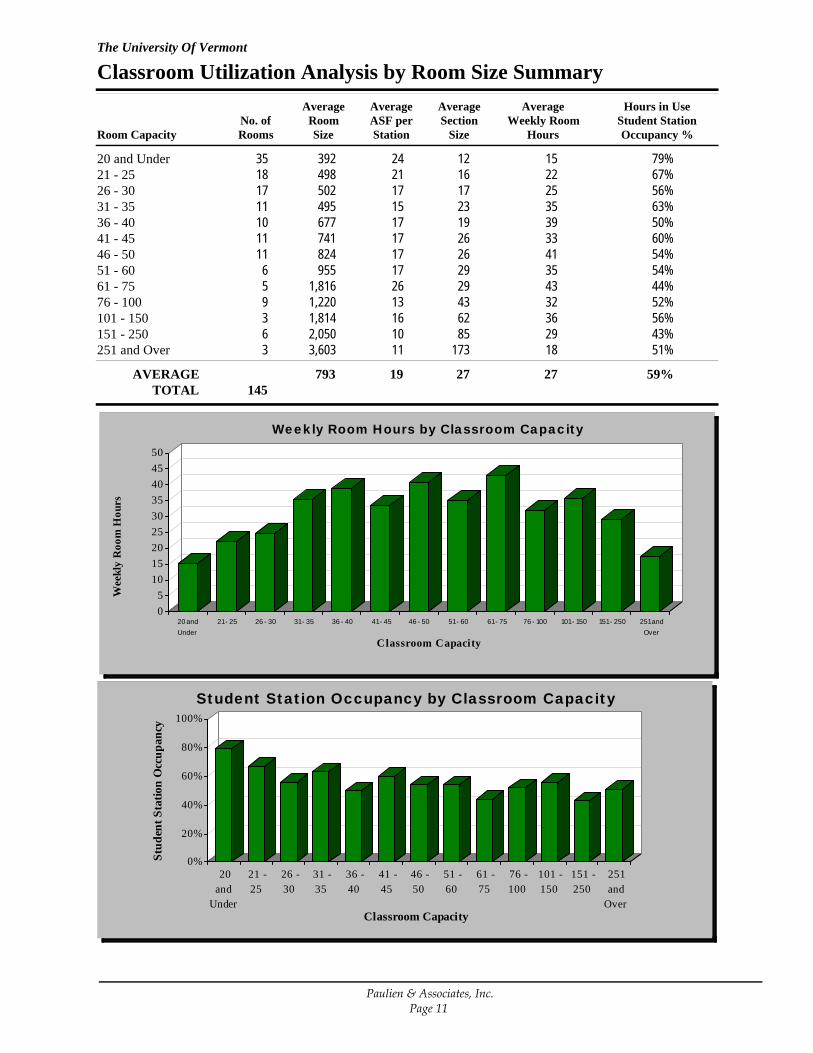
The utilization of classrooms at the University of Vermont was analyzed by room capacity. The 145 classrooms on the campus were divided into groups by room capacity and utilization results were calculated for each capacity grouping.
It has been the consultants’ experience that analysis by seating capacity
frequently shows the largest rooms to have the most hours per week of scheduled use and smallest rooms to have lower hours of use per week. This was true for the smallest rooms at the University of Vermont where utilization in classrooms with fewer than 20 seats averaged 15 hours per week of scheduled use. However, the normal finding of largest rooms having most hours per week of scheduled use was not the case for the University of Vermont. Utilization of the largest rooms was

Paulien & Associates, Inc. Page 10
nearly as low as that for smallest rooms. Classrooms having over 251 seats averaged 18 hours per week of use. Utilization was strongest in the classrooms with 61 to 75 seats which were used an average of 43 hours per week. The average number of hours per week of scheduled utilization for most sizes of classrooms was fairly consistent among all sizes of classrooms.
The percentage of student station occupancy was highest in the smallest classrooms which showed 79% occupancy when in use and lowest in classrooms having between 151 and 250 seats with 43% of student stations filled. It is typical at most institutions to find the percentage of student station occupancy to be higher in small classrooms and lower in larger classrooms. While the results for the University of Vermont do show higher occupancy in smaller classrooms, there is no significant decline in occupancy percentage for classrooms larger than 40 seats. The percent of occupancy is fairly steady for all sizes of classrooms at the University of Vermont.
It has been the consultants’ experience that a review of student station size in
relation to room capacity frequently shows the largest rooms to have the smallest average square feet per student station while the smallest rooms often have larger sized student stations. For example, an auditorium might provide only 10 or 12 square feet per seat, while a seminar room might have 25 or 30 square feet per occupant.
When making some generalizations from a utilization analysis for the sizes of
rooms needed on a campus the findings are reviewed for capacity groupings that have high number of hours per week of use. The capacity groups with the highest hours of use at the University of Vermont are those with 61 to 75 seats and those with 46 to 50 seats. However, the average student station occupancy for both of these capacity groupings is less than 60%, not a high utilization when the rooms are occupied, indicating that the rooms are not filled to capacity and could accommodate larger sections before additional classrooms are needed.
The following tables show classroom utilization and student station
occupancy by room capacity grouping.
Classroom Utilization Analysis by Room Size Summary
No. ofRooms
AverageSection
Size
AverageWeekly Room
Hours
Hours in UseStudent StationOccupancy %
The University Of Vermont
Room Capacity
AverageRoomSize
AverageASF perStation
12 15 79%3520 and Under 392 2416 22 67%1821 - 25 498 2117 25 56%1726 - 30 502 1723 35 63%1131 - 35 495 1519 39 50%1036 - 40 677 1726 33 60%1141 - 45 741 1726 41 54%1146 - 50 824 1729 35 54%651 - 60 955 1729 43 44%561 - 75 1,816 2643 32 52%976 - 100 1,220 1362 36 56%3101 - 150 1,814 1685 29 43%6151 - 250 2,050 10
173 18 51%3251 and Over 3,603 11
59%AVERAGETOTAL 145
272719
05
101520253035404550
20 andUnder
21 - 25 26 - 30 31 - 35 36 - 40 41 - 45 46 - 50 51 - 60 61 - 75 76 - 100 101 - 150 151 - 250 251 andOver
Weekly Room Hours by Classroom Capacity
Wee
kly
Roo
m H
ours
C lassroom Capacity
0%
20%
40%
60%
80%
100%
20and
Under
21 -25
26 -30
31 -35
36 -40
41 -45
46 -50
51 -60
61 -75
76 -100
101 -150
151 -250
251and
Over
Student Station Occupancy by Classroom Capacity
Stud
ent S
tatio
n O
ccup
ancy
Classroom Capacity
793
Paulien & Associates, Inc.Page 11

Paulien & Associates, Inc. Page 12
2.5 CLASSROOM UTILIZATION BY BUILDING
Classroom utilization analysis was performed by building for those buildings that include more than four classrooms. No attempt was made to tie this analysis to any departmental units or departmental use of the rooms. When classroom utilization was analyzed by building for those buildings with more than four classrooms, the classrooms in the Votey Building showed the highest hours per week of use with an average of 39 hours of use per week. The average number of hours per week of classroom use in the Votey Building and in Kalkin, Lafayette, Old Mill Annex, and Waterman exceeded the overall campus average use of 27 hours per week. The classrooms in Dewey Hall showed the lowest hours per week of use with an average of 22 hours of use per week.
The student station occupancy rate was highest in Dewey Hall and in Old
Mill Annex classrooms. The classrooms in Dewey Hall and Old Mill Annex showed an average of 74% student station occupancy when in use. Old Mill Annex was high in both the average hours per week of use and the student occupancy rate. In the Votey Building classrooms had the lowest average occupancy rate with 47% of seats filled.
Of the 145 classrooms in use in the Fall term of 1999, Lafayette Hall contains
the greatest number of classrooms with 19 out of the 145 classrooms on campus. The University of Vermont teaches small classes throughout the curriculum.
The average size for all classroom courses taught on campus was 27 students. The average class size of classes held in the buildings having more than four classrooms was 25 students. The average class sizes by building were highest in Williams Hall where class sizes averaged 40 students. Classes taught in the Old Mill Annex had the smallest average class size. The class size in Old Mill Annex averaged 19.
The following tables show classroom utilization and student station
occupancy by building.

THE UNIVERSITY OF VERMONT
Classroom Utilization Analysis by Building Summary*
No. ofRooms
AverageSection
Size
Average Weekly Room
Hours
Hours in UseStudent StationOccupancy %Building Name and Id
AverageRoomSize
AverageASF perStation
22 22 74%7DEWEY HALL 475 18DEWEY29 36 57%8KALKIN BUILDING 1,090 22KALKIN27 33 65%19LAFAYETTE HALL 789 19LAFAYETTE20 38 74%6OLD MILL ANNEX 449 18OLD MILL X23 27 49%10ROWELL N/A ALL HLTH 781 19ROWELL21 39 47%9VOTEY BLDG 814 17VOTEY21 30 61%16WATERMAN BLDG 494 14WATERMAN40 24 72%5WILLIAMS HALL 726 17WILLIAMS
61%AVERAGETOTAL 80
322518
0 5 10 15 20 25 30 35 40 45 50
Weekly Room Hours
D EW EY
W ILLIA M S
R OW ELL
W A TER M A N
LA FA Y ET TE
KA LKIN
OLD M ILL X
V OTEY
Weekly Room Hours by Building*
0% 10% 20% 30% 40% 50% 60% 70% 80%
Student S tation Occupancy %
V OT EY
R OW ELL
KA LKIN
W A T ER M A N
LA F A Y ET TE
W ILLIA M S
OLD M ILL X
D EW EY
Student Station Occupancy by Building*
705
* For Buildings with more than 4 classrooms.
Paulien & Associates, Inc.Page 13

Paulien & Associates, Inc. Page 14
2.6 CLASSROOM UTILIZATION BY DAY AND TIME
Analysis was performed on classroom utilization data to show classroom usage by day and time of day. Classroom use at the University of Vermont was strongest between 9:30 a.m. and 2:00 p.m. on Tuesday and Thursday. During those hours over 60% of the classrooms on campus were in use. On Monday and Wednesday use was also strong between 9:05 a.m. and 2:30 p.m. when over 50% of classrooms were in use. There was also significant usage until 6:00 p.m. Tuesday through Thursday. On Friday use dropped below 50% after 12:20 p.m.
At the times of day with the highest use, the percentage of rooms in use
never exceeded 70%. This would indicate that at any given time at least 30% of classrooms are not in scheduled use. While a campus need not necessarily strive to have 100% of its classrooms in use, as that would provide no flexibility for scheduling, a percentage of use in the 90% or higher range at peak periods would indicate fairly efficient use of classrooms.
In the consultants’ experience, classroom use is frequently highest between
8:00 a.m. and 2:00 p.m. with less use on Friday. The University of Vermont use was as expected on Monday through Thursday with higher use on Friday than many institutions achieve. Classroom usage on Monday and Wednesday was not appreciably different from usage on Tuesday and Thursday. Friday usage showed an expected drop in the afternoon.

Scheduled Classroom Use by Day and Hour • MWFTHE UNIVERSITY OF VERMONT
Timeof
Day
MondayRoomsin Use
% InUse
Wednesday Friday Average*Roomsin Use
% InUse
Roomsin Use
% InUse
Roomsin Use
% InUse
7:15 AM 0 0% 1 1% 0 0% 0 0%8:00 AM 39 27% 40 28% 39 27% 39 27%9:05 AM 85 59% 85 59% 90 62% 87 60%
10:10 AM 97 67% 97 67% 92 63% 95 66%11:15 AM 92 63% 95 66% 79 54% 89 61%12:20 PM 72 50% 75 52% 60 41% 69 48%
1:25 PM 81 56% 86 59% 68 47% 78 54%2:30 PM 71 49% 78 54% 44 30% 64 44%3:35 PM 63 43% 82 57% 18 12% 54 37%4:40 PM 49 34% 71 49% 6 4% 42 29%5:00 PM 51 35% 79 54% 5 3% 45 31%6:00 PM 42 29% 65 45% 0 0% 36 25%7:00 PM 23 16% 42 29% 0 0% 22 15%8:00 PM 16 11% 28 19% 0 0% 15 10%9:00 PM 8 6% 12 8% 0 0% 7 5%
10:00 PM 0 0% 1 1% 0 0% 0 0%
*Average based on Monday, Wednesday and Friday use.
145Note: Based on total classrooms of
0%
10%
20%
30%
40%
50%
60%
70%
80%
90%
100%
Cla
ssro
om U
se %
7:15
AM
8:00
AM
9:05
AM
10:1
0 A
M
11:1
5 A
M
12:2
0 PM
1:25
PM
2:30
PM
3:35
PM
4:40
PM
5:00
PM
6:00
PM
7:00
PM
8:00
PM
9:00
PM
10:0
0 PM
Time of Day
Average Classroom Use by Hour • MWF
Paulien & Associates, Inc.Page 15

Scheduled Classroom Use by Day and Hour • TThTHE UNIVERSITY OF VERMONT
Timeof
Day
Tuesday Thursday Average*Roomsin Use
% InUse
Roomsin Use
% InUse
Roomsin Use
% InUse
7:45 AM 1 1% 0 0% 1 0%8:00 AM 59 41% 51 35% 55 38%9:30 AM 96 66% 98 68% 97 67%
11:00 AM 96 66% 95 66% 96 66%12:30 PM 98 68% 102 70% 100 69%
2:00 PM 96 66% 101 70% 99 68%3:30 PM 81 56% 66 46% 74 51%5:00 PM 77 53% 63 43% 70 48%6:30 PM 51 35% 46 32% 49 33%8:00 PM 24 17% 22 15% 23 16%9:00 PM 2 1% 1 1% 2 1%
*Average based on Tuesday and Thursday use.
145Note: Based on total classrooms of
0%10%20%30%40%50%60%70%80%90%
100%
Cla
ssro
om U
se %
7:45
AM
8:00
AM
9:30
AM
11:0
0 A
M
12:3
0 PM
2:00
PM
3:30
PM
5:00
PM
6:30
PM
8:00
PM
9:00
PM
Time of Day
Average Classroom Use by Hour • TTh
Paulien & Associates, Inc.Page 16

Paulien & Associates, Inc. Page 17
Analysis of classroom utilization by time of day was also performed separating the classrooms into four of the categories of classrooms: General Purpose classrooms (Room Use Code 110), Schedule Priority classrooms (Room Use Code 111), Restricted Schedule classrooms (Room Use Code 113), and Departmental classrooms (Room Use Code 114). Because there are only two Special Equipment Classrooms (Room Use Code 112) they have not been analyzed separately.
The percent of classrooms in use was highest for the General Purpose
classrooms and lowest for the Departmental classrooms. Up to 93% of the General Purpose classrooms were used on Monday, Wednesday, and Friday compared to a high of 36% of the Departmental Classrooms. On Tuesday and Thursday the comparison is similar, with up to 96% of the General Purpose classrooms in use while up to 44% of Departmental classrooms were in use.
Tables and graphs showing the number of classrooms scheduled at each hour
of the day and the percentage of rooms in use for each time period are located in Appendix B of this study.
The University of Vermont representatives have asked the consultant to comment on whether a common calendar would help achieve better utilization of teaching facilities. The University of Vermont is not alone in having difficulty in achieving a common calendar across a large number of disciplines including multiple professional schools. In the consultant’s experience, it is not unusual for schools of medicine, other health affairs units, schools of business, schools of education, schools of architecture and engineering, all to view themselves as having needs to teach certain courses in a timeframe that differs from the primary calendar across the campus. The consultant has also seen situations where a common calendar is put into place despite challenging circumstances. The Auraria Higher Education Center, which is home to the University of Colorado at Denver, Metropolitan State College at Denver, and the Community College of Denver, has put together a common calendar framework in which the institutions agree to common start and stop times and protocols for handling longer than usual courses to assure that there is not a significant negative impact on facilities utilization resulting from the specific use. The use of a 75-minute period on a day when 50-minute periods are the norm means two schedulable hours are used by the one class.
Another suggestion that is worth considering is to adopt specific protocols for the primary hours, perhaps from 10:00 a.m. to 3:00 p.m., and allow a freer approach to the length of courses that are scheduled earlier or later than those prime hours. Those campuses which have seen extensive use of Monday and Wednesday 75-minute periods along with the traditional Tuesday and Thursday 75-minute periods have wound up with significantly lower Friday morning use. This can also allow Friday use to be a good time in those instances for longer session courses to meet such as a three-hour, once a week course.
The consultants are aware of and have read the Draft Space Management Policy
Version 2.c June 2000 and recommend that the University complete any discussions

Paulien & Associates, Inc. Page 18
or revisions to this draft and adopt a space management policy similar to this draft in order to provide the campus with consistent space protocols for use of campus space resources.
3.0 LABORATORY ANALYSIS
3.1 LABORATORY UTILIZATION ANALYSIS PROCESS
The process used to determine laboratory utilization was very similar to that performed for the classroom analysis. The University of Vermont provided the consultant a list of the laboratory courses taught in Fall 1999, showing meeting times, locations, and enrollments for each course. The data was organized in a number of different ways so that average campus-wide findings could be calculated along with findings by department and by time of day.
A facility inventory listing all of the laboratories being studied in this report was provided. The consultants toured the University of Vermont campus to gain familiarity with the laboratory spaces and to verify the data received.
Paulien & Associates utilized applications it has developed with data base
management software to produce an analysis of the laboratory utilization by room, department, and by time of day. This study did not include analysis of quality of space, sight lines, acoustics, ventilation, or equipment in rooms.
3.2 LABORATORY UTILIZATION SUMMARY
The facilities inventory originally given to the consultants included 95 rooms classified as teaching laboratories. Of these 95 laboratories the initial utilization findings indicated that 56 of these rooms had no scheduled use. Further investigation showed more laboratory classes had been scheduled, and additional information on laboratory courses was obtained from the departments and included for subsequent analysis.
Review of the other laboratories with no use revealed some of the rooms to
actually be service space to teaching laboratories or open laboratories. Teaching laboratories are defined as rooms used for regularly scheduled classes that require special purpose equipment for experimentation or participation in an academic discipline. These can include science laboratories, computer laboratories, art studios, and music rooms. Open laboratories are defined as laboratories used primarily for individual or unscheduled use. After discussion with the Director of Campus Planning Services and the Facilities Information Analyst some rooms that indicated no scheduled laboratory use were re-coded as service space or as open laboratories. The consultant reviewed scheduled utilization of rooms that were coded neither as classrooms nor as teaching laboratories. This utilization included some conference

Paulien & Associates, Inc. Page 19
rooms and open laboratories. In some instances the consultant recommended re-coding the open laboratories to teaching laboratories if scheduled use indicated teaching to be the primary use of the room.
The final analysis of teaching laboratory use included 71 laboratories. Of
these 71 laboratories, two are scheduled for use only in the spring term. Since the analysis was of Fall 1999 term, the analysis showed zero utilization for these two rooms, Hills Room 021 and Terrill Room 307. It is not unusual to find advanced laboratory space that has a particular programmatic or curricular use and is used only one term during the year. When a department or program curriculum requires a laboratory, that space must be dedicated to the program even if the course offered in that laboratory only meets for one term each year.
Findings for teaching laboratory utilization for the Fall 1999 term showed the
overall campus teaching laboratory utilization at the University of Vermont to be within the expected range of hours per week of use, but slightly below the expected occupancy rate. The expected range for a major university would be an average of 15 to 20 hours per week of use at 70% to 75% student station occupancy. The use for teaching laboratories at the University of Vermont averaged 16 hours per week, with 67% student station occupancy.
The number of hours of scheduled use of laboratory space is expected to be
lower than the number of hours of expected use for classrooms to allow unscheduled hours in the laboratory to be used for preparation of the laboratory and to provide time for individual, unscheduled study or research in the laboratory.
Utilization of individual laboratories ranged from a high of 45 hours per
week in Marsh Life Science Building Room 114 and Perkins Building Room 101 to a low of zero hours per week in the two laboratories that are scheduled in the spring. The laboratories having the next lowest weekly hours of use were the laboratories in Rowell 113 and Votey 229 which both showed two hours per week of utilization. It is not unusual to have advanced or very discipline-specific laboratories that are used for only one course each semester.
The average student station occupancy percentage for individual rooms
ranged from 156% occupancy in Dewey Hall Room 241 to 2% of stations in use in Given Room E401. In instances where the consultants found unusual occupancy percentages, either very low percentages or percentages above 100%, additional information was requested to verify the station count of the rooms and to correct any discrepancies in the database. For several rooms further investigation confirmed the results that indicate the courses scheduled in the rooms do indeed exceed the recorded room capacity or enrollment in the courses is below the room capacity.
As mentioned in the classroom utilization analysis summary above, in a few
cases the consultants found that courses were scheduled in both a laboratory and classroom space simultaneously allowing faculty member to move the students from one to the other as needed. Institutions with higher use of classrooms are usually
Paulien & Associates, Inc. Page 20
not able to schedule courses in two rooms. The University of Vermont should look at future laboratories designed with appropriate spaces to conduct the explanatory parts of laboratory instruction. In this instance, the consultants view the University of Vermont utilization as an appropriate use of facilities and do not recommend changes in this practice.
3.3 LABORATORY UTILIZATION BY DEPARTMENT
The utilization of laboratories at the University of Vermont was analyzed by department. The 71 laboratories on the campus were reviewed according to departmental assignments and utilization results were calculated for each department. The teaching laboratories on campus were assigned to 26 of the departments on campus.
It should be noted that laboratory analysis is usually done by department
since laboratory use is discipline specific, unlike classrooms which can be used by multiple disciplines and are usually assigned according to the classroom capacity and building or location on campus. The consultants did not meet with the individual departments on campus to review laboratory utilization.
When laboratory utilization was analyzed by department, the range of use
for the number of hours per week of scheduled use was from an average of 36 hours per week to an average of three hours of use per week. It is not unusual to find use of laboratories to be only three to six hours per week in departments that have advanced discipline specific laboratories.
The highest departmental student station occupancy rate showed 156%
student station occupancy when in use. This unusually high finding is likely a result of the difficulty in assigning a firm station count for the laboratory or of doubling up the number of students per student station. The lowest average departmental occupancy rate showed 3% of seats filled.
Tables showing laboratory utilization and student station occupancy by
department are located in Appendix E of this study.
3.4 LABORATORY UTILIZATION BY DAY AND TIME
Analysis was performed to illustrate laboratory utilization by day and time of day. Time of day analysis for laboratories showed use to be strongest in the afternoon. Highest use was during the afternoon between 12:30 p.m. and 3:30 p.m. Laboratory usage was highest on Tuesday afternoons and lowest on Friday. The highest use was 61% of laboratories in use at 2:00 p.m. on Tuesday. Friday use of laboratories was quite low with no more than 15% of the laboratories in use at any time. The pattern of use for laboratories at the University of Vermont is typical. In
Paulien & Associates, Inc. Page 21
the consultants’ experience, laboratory utilization is often higher in the afternoons with significantly less use on Friday.
The following tables and graphs show the number of laboratories scheduled
at each hour of the day and the percentage of rooms in use for each time period.

Scheduled Lab Use by Day and Hour • MWFTHE UNIVERSITY OF VERMONT
Timeof
Day
MondayRoomsin Use
% InUse
Wednesday Friday Average*Roomsin Use
% InUse
Roomsin Use
% InUse
Roomsin Use
% InUse
7:00 AM 0 0% 1 1% 0 0% 0 0%7:15 AM 0 0% 1 1% 0 0% 0 0%8:00 AM 4 6% 7 10% 4 6% 5 7%9:05 AM 10 14% 13 18% 10 14% 11 15%
10:10 AM 15 21% 20 28% 11 15% 15 22%11:15 AM 16 23% 16 23% 11 15% 14 20%12:20 PM 10 14% 15 21% 8 11% 11 15%
1:25 PM 35 49% 36 51% 10 14% 27 38%2:30 PM 40 56% 40 56% 11 15% 30 43%3:35 PM 34 48% 36 51% 10 14% 27 38%4:40 PM 14 20% 22 31% 7 10% 14 20%5:00 PM 15 21% 21 30% 6 8% 14 20%6:00 PM 14 20% 17 24% 2 3% 11 15%7:00 PM 12 17% 11 15% 0 0% 8 11%8:00 PM 8 11% 7 10% 0 0% 5 7%9:00 PM 3 4% 2 3% 0 0% 2 2%
*Average based on Monday, Wednesday and Friday use.
0%
10%
20%
30%
40%
50%
60%
70%
80%
90%
100%
Labo
rato
ry U
se %
7:00
AM
7:15
AM
8:00
AM
9:05
AM
10:1
0 A
M
11:1
5 A
M
12:2
0 PM
1:25
PM
2:30
PM
3:35
PM
4:40
PM
5:00
PM
6:00
PM
7:00
PM
8:00
PM
9:00
PM
Time of Day
Average Laboratory Use by Hour • MWF
71Note: Based on total laboratories of
Paulien & Associates, Inc.Page 22

Scheduled Lab Use by Day and Hour • TThTHE UNIVERSITY OF VERMONT
Timeof
Day
Tuesday Thursday Average*Roomsin Use
% InUse
Roomsin Use
% InUse
Roomsin Use
% InUse
8:00 AM 18 25% 15 21% 17 23%9:30 AM 26 37% 21 30% 24 33%
11:00 AM 17 24% 15 21% 16 23%12:30 PM 29 41% 27 38% 28 39%
2:00 PM 43 61% 41 58% 42 59%3:30 PM 40 56% 35 49% 38 53%5:00 PM 23 32% 24 34% 24 33%6:30 PM 19 27% 18 25% 19 26%8:00 PM 15 21% 15 21% 15 21%9:00 PM 4 6% 1 1% 3 4%
*Average based on Tuesday and Thursday use.
71Note: Based on total laboratories of
0%10%20%30%40%50%60%70%80%90%
100%
Lab
orat
ory
Use
%
8:00
AM
9:30
AM
11:0
0 A
M
12:3
0 PM
2:00
PM
3:30
PM
5:00
PM
6:30
PM
8:00
PM
9:00
PM
Time of Day
Average Laboratory Use by Hour • TTh
Paulien & Associates, Inc.Page 23

Paulien & Associates, Inc. Page 24
4.0 CAMPUS-WIDE SPACE NEEDS FINDINGS
4.1 SPACE NEEDS ANALYSIS PROCESS The University of Vermont contracted with the consultants to provide an
overview analysis of the adequacy of space on campus. The study did not include analysis by College or by Department, and results can not be used to identify space needed for individual campus units. This study also did not include analysis of quality of space on the campus. The results are intended to give a general indication of space adequacy for the campus as a whole so decisions can be made in context with what would typically be found on other comparable campuses.
In order for space needs comparisons to be useful for planning purposes it
would be necessary to analyze data and meet with campus representatives on a college-by-college basis rather than the university as a whole. The college-by-college analysis would provide more information since space needs vary so much from discipline to discipline and analysis would need to reflect differences in enrollment and staffing levels for each school or college. It is recommended that the University of Vermont consider a more in-depth analysis as the next phase of planning.
This analysis was performed using comparative data from ten peer
institutions for the assignable square feet per full-time equivalent student in 11 space categories, including classrooms, teaching laboratories, research laboratories, and offices.
When the University of Vermont was compared to its peers, the ASF/FTE at
the University of Vermont in the various space categories was higher than the peers average equally as often as it was lower, indicating that the University of Vermont’s facilities are in a comparable position to the peer institutions.

Paulien & Associates, Inc. Page 25
0
10
20
30
40
50
60
70
80
90
100
ASF
/FT
E
Class
room
& S
uppo
rt
Class L
abor
ator
ies
Other
Lab
orat
ories
Resea
rch
Labo
rato
ries
Office
Spa
ce
Libra
ry &
Stu
dy F
acilit
ies
Speci
al Use
Faci
lities
Gener
al U
se Fa
ciliti
es
Suppo
rt Fa
ciliti
es
Health
Car
e Fa
ciliti
es
Reside
ntia
l Fac
ilitie
s
Space Category
Comparison of The University of Vermont to Peer Average ASF/FTE
The University of Vermont
Peer Average
Data from ten institutions was compiled showing the average assignable
square feet (ASF) per full-time equivalent (FTE) student by space category. The institutions used for comparison were flagship research universities and included the University of Arizona, the University of Florida, the University of Oregon, the University of Iowa, the University of Illinois-Urbana, the University of Wisconsin-Madison, the University of California-Berkeley, the University of Washington, Indiana University, and the University of Texas.
These peer institutions were selected after extensive discussion with the
campus representatives. The Director of Institutional Studies provided the consultants with seven lists of peer institutions. These lists ranged from lists of primary competitors to lists of institutions that grant medical degrees. The lists ranged from 14 to 95 institutions per list. A group of peer institutions for the analysis was then compiled from the original seven lists using the institutions for which the consultant had applicable data. The peers that were selected are all public flagship research universities, leading campuses within their respective states.

Paulien & Associates, Inc. Page 26
Average**
SPACE TYPE
10.2 Classroom & Support
11.4 Class Laboratories
5.9 Other Laboratories
32.1 Research Laboratories
50.7 Office Space
20.1 Library & Study Facilities
24.5 Special Use Facilities
21.1 General Use Facilities
26.2 Support Facilities
5.4 Health Care Facilities
56.3 Residential Facilities
262.0 TOTAL ASF/FTE
Institution: A B C D E F G H I JThe University
of Vermont
Classroom & Support 10.2 11.6 8.6 10.9 11.9 13.5 9.2 8.6 9.0 8.6 13.8
Class Laboratories 10.0 7.7 15.5 9.8 8.8 12.0 7.5 11.9 18.5 11.9 9.9
Other Laboratories 3.5 * 1.0 17.1 4.8 7.7 * 5.0 2.1 * 5.5
Research Laboratories 27.0 35.1 42.5 14.8 33.5 30.7 51.9 13.5 26.6 45.1 27.6
Office Space 44.4 67.4 55.0 36.6 65.7 23.5 61.8 47.9 44.8 59.7 55.6
Library & Study Facilities 14.3 17.6 20.0 21.4 26.0 23.5 31.8 22.6 11.2 12.2 22.0
Special Use Facilities 12.6 15.9 13.6 27.8 15.9 35.9 14.5 20.9 32.2 56.4 40.7
General Use Facilities 14.2 20.1 11.5 15.2 27.2 21.6 18.1 43.0 14.7 25.3 25.6
Support Facilities 8.6 17.7 22.9 14.1 24.4 34.2 29.9 30.5 15.0 64.8 17.2
Health Care Facilities 0.3 11.4 1.0 0.7 1.1 15.8 1.3 0.7 2.5 19.4 0.6
Residential Facilities 31.3 31.5 44.8 70.1 35.2 49.4 43.7 79.6 114.6 62.6 71.8
TOTAL ASF/FTE: 176.3 235.9 236.3 238.3 254.4 267.6 269.7 284.3 291.0 366.0 290.1
*Data not provided; average as calculated excludes these asterisked cells**Does not include The University of Vermont
Note: Data provided by a third party source and not independently verified by the consultant
Peer Data above is sorted from highest to lowest in Total ASF/FTE. Letters have replaced institution names above to provide anonymity for the institutions' data. The data is from the following 10 institutions.
University of ArizonaUniversity of California-BerkeleyUniversity of FloridaUniversity of Illinois-UrbanaIndiana UniversityUniversity of IowaUniversity of OregonUniversity of TexasUniversity of WashingtonUniversity of Wisconsin-Madison
SPACE TYPE
THE UNIVERSITY OF VERMONTPeer Institution Comparisons ASF Per FTE By Space Category

Paulien & Associates, Inc. Page 27
Using the enrollment figure of 8,900 FTE for the University of Vermont a benchmark ASF was calculated for each category of space by multiplying the enrollment by the average amount of ASF/FTE from the ten institutions. Comparisons were then made on a campus-wide basis to the amount of existing space in each category at the University of Vermont. The data for the existing space at the University of Vermont does not include the new spaces being constructed or planned on campus or those being leased that may be returned to the campus for use: the Health Science Research Facility, Rubenstein Laboratory, the Medical Education Center, the Student Center/Gateway, student housing, and DeGoesbriand.
For the research laboratory, office space, library, and housing categories of
space, the consultant does not believe that using ASF/FTE results in reliable findings. For these categories of space the consultant used alternate approaches to calculate the campus-wide estimate of space needed. In the research laboratory category an amount of space was calculated using the amount of research dollars as a basis for needed space. For office space the number of full-time staff and a guideline amount of space per staff member was substituted for the student enrollment calculation. Library space needs were calculated using the Association of College and Research Libraries (ACRL) guidelines of space per volume and reader station. Housing was calculated using the number of beds and a guideline amount of space per bed.
The percentage of space in each category for the University of Vermont has
been charted below to give a perspective to the proportions of space in each category compared to the campus total.

Paulien & Associates, Inc. Page 28
4.2 SPACE NEEDS ANALYSIS FINDINGS
Overall campus-wide space analysis using peer comparisons and normative standards resulted in a finding indicating the University of Vermont has a space deficit of 175,495 ASF. This is nearly seven percent of the existing amount of space on the campus.
This analysis did not include the 24,000 ASF of space leased by the University
or the 62,000 ASF leased to the University, nor does it include building projects being planned or constructed on campus. The leased spaces could be returned to or taken back from the University in the future and would affect the space amounts in the chart below.
The University of Vermont Percentage of Space by Category
Classroom & Support4.8%
Class Laboratories3.4%
Other Laboratories1.9%
Research Laboratories9.5%
Office Space19.2%
Library & Study Facilities7.6%
Special Use Facilities14.0%
General Use Facilities8.8%
Support Facilities5.9%
Health Care Facilities0.2%
Residential Facilities24.7%

Paulien & Associates, Inc. Page 29
8,900
Existing ASF Benchmark ASFSurplus/ (Deficit)
Percent Surplus/ (Deficit)
The University of Vermont ASF/FTE
Peer Average ASF/FTE
Classroom & Service 122,724 90,780 31,944 26.0% 13.8 10.2Teaching Laboratories & Service 88,337 101,460 (13,123) (14.9%) 9.9 11.4Open Laboratories & Service 48,566 52,510 (3,944) (8.1%) 5.5 5.9
* Research Laboratories & Service 245,310 280,200 (34,890) (14.2%) 525ASF/$100,000 600ASF/$100,000* Offices & Service 494,844 589,595 (94,751) (19.1%) 155ASF/staff 185ASF/staff* Library 195,340 208,621 (13,281) (6.8%) 22.0 ACRL adjusted
Special 361,775 218,050 143,725 39.7% 40.7 24.5General 228,084 187,612 40,472 17.7% 25.6 21.1Support 152,642 233,180 (80,538) (52.8%) 17.2 26.2Health Care Facilities 5,444 48,238 (42,794) (786.1%) 0.6 5.4
* Housing 638,685 747,000 (108,315) (17.0%) 170ASF/bed 200ASF/bedCOLLEGE/UNIT TOTAL 2,581,751 2,757,246 (175,495) (6.8%)
* Alternate approaches have been used other than ASF/FTE benchmarks
THE UNIVERSITY OF VERMONT
Student FTE:
Peer Based Needs Analysis
1999 BASE YEAR
The space findings for the University of Vermont indicate that the campus is somewhat short of space having about seven percent less space than the average for peer institutions. This analysis was done using existing space and does not take into account new construction in the planning stages at the University of Vermont or the fact that many peers may also be building more space.
4.2.1 CLASSROOM & SERVICE SPACE
The University of Vermont has almost 14 assignable square feet per full-time equivalent student. As we look at the major universities that the University of Vermont desires to be compared to, we find them averaging just over 10 square feet per full-time equivalent student. There are several reasons for this. The University of Vermont classroom utilization averages 27 hours per week at less than 60% student station occupancy. It is not unusual for large universities to average 35 hours per week or more for classroom utilization. Universities in states that measure classroom utilization across institutions would also have more incentive to make sure that classrooms that have low utilization are reclassified.
4.2.2 TEACHING LABORATORY AND SERVICE
Teaching laboratories are defined as rooms used for regularly scheduled classes that require special purpose equipment for experimentation or participation in an academic discipline. The University of Vermont averages just under 10 assignable square feet per student of

Paulien & Associates, Inc. Page 30
teaching laboratory space. This is slightly lower than the average found at the other universities, 11.4 assignable square feet per student.
4.2.3 OPEN LABORATORIES & SERVICE
The University of Vermont averages 5.5 assignable square feet for this category which is usually now called Open Laboratories, but used to be called Special Class Laboratories and Individual Study Laboratories. Open laboratories are defined as laboratories used primarily for individual or unscheduled use. The findings for other institutions range quite widely from about one square foot per student to over 17 square feet per student. Their average is 5.9 square feet per student. The Vermont figure is fairly close to this average.
4.2.4 RESEARCH LABORATORIES & SERVICE
Research laboratories are non-class laboratories used primarily for research or experimentation. The University of Vermont averages 27.6 assignable square feet per student in this category of space. This is a significant number. Some of the universities have much more space per student than the University of Vermont in this category. It should be noted that a more appropriate way of measuring this category will be on square feet per $1,000,000 dollars of organized research expenditures. When a widely used figure of 600 assignable square feet per $100,000 is applied to the research expenditures at the University of Vermont, it shows an additional space need of approximately 35,000 assignable square feet at the current level of research.
4.2.5 OFFICES & SERVICE
The University of Vermont currently has 55.6 square feet per student in this category. There is a wide range among the institutions to which the campus is being compared. The space at the University of Vermont appears to be a fairly reasonable amount when compared to these others.
Normally other space factors would be utilized for office space
analysis looking at the faculty and staff numbers compared with a square foot per person amount. This is normally done for a more detailed planning study where staff are reviewed by major category so that those not needing office space can be excluded from the analysis.
Those systems that have adopted a very broad-based approach to
calculating office space for capital planning purposes have often utilized figures between 195 square feet per full-time equivalent faculty member and

Paulien & Associates, Inc. Page 31
175 square feet per full-time equivalent staff member. It should be noted that this space includes office service space and conference space, as well as the offices for the individuals. Using this approach for the University of Vermont, the consultant used an average of 185 ASF per faculty and staff member. This showed the University of Vermont with an additional space need of nearly 95,000 ASF. This calculation is used in place of the average of the peer findings for this category.
4.2.6 LIBRARY
The University of Vermont currently has 22 square feet per full-time equivalent student in this category. There is a wide range among the institutions to which the campus is being compared from 11 square feet per student to 32 square feet per student. The space at the University of Vermont is in the middle of the range when compared to these others.
The consultant does not believe that using a square feet per student
number produces as reliable a result as using one of the standard library guidelines which more accurately reflect collection size. Most of the guideline systems for library space utilize one set of factors for collections, another for readers, and a third for service space. The Association of College and Research Libraries (ACRL) collections guideline approach was used by the consultants. The guideline assumes that .10 NASF per volume is used for the first 150,000 volumes, at which point the factor drops to .09 NASF per volume. After 300,000 volumes are reached, the factor goes down to .08 NASF and then down again to .07 NASF for more than 600,000 volumes.
The reader space calculations have generally been based on seating
for 25% of the student body. The consultant chose to apply the 25% factor to undergraduate FTE, a 15% factor to graduate FTE, and 10% to the total full-time equivalent faculty. The mid-point of the ACRL guideline, 30 square feet, was used per reader station.
The ACRL suggests 12.5% of the total collection and reader station
space for service and staff space. Lounge space is allotted 2 NASF per study station.
Information from The University of Vermont Sourcebook 1999-2000 was
used for the library space calculations. The numbers used were 1,500,000 volumes, 8,900 full-time equivalent students, and 1,134 faculty. Applying the guidelines discussed above to the library collections information from The University of Vermont Sourcebook 1999-2000 resulted in a space need of over 13,000 ASF.

Paulien & Associates, Inc. Page 32
4.2.7 SPECIAL USE FACILITIES
The University of Vermont averages 40.7 square feet per student for this category, which includes athletics and physical education space, media production facilities, animal quarters, and greenhouses. As we look at the major universities that the University of Vermont desires to be compared to, we find them averaging 24.5 square feet per full-time equivalent student. While the University of Vermont has more square feet than the average of the ten peer institutions, it is within the overall range which was from a low of 12 square feet per student to a high of 56 square feet per student.
4.2.8 GENERAL USE FACILITIES
The University of Vermont average for this category is 25.6 square feet per student. This category includes facilities such as assembly and exhibit space, recreation, merchandising, and meeting room spaces. The average among the peer institutions was just over 21 square feet per full-time equivalent student in this category.
4.2.9 SUPPORT FACILITIES
This category includes campus shop and storage facilities. The University of Vermont average is just over 17 square feet per student in this space category. The average among the peer institutions was just over 26 square feet per full-time equivalent student.
4.2.10 HEALTH CARE FACILITIES
This space category includes clinics, hospitals, and infirmaries. The average among the peer institutions was just over five square feet per full-time equivalent student. The University of Vermont finding is 0.6 square feet per student. This finding may be the result of hospital space which is not owned by the University not being in the facilities inventory.
4.2.11 RESIDENTIAL FACILITIES
The average among the peer institutions for space in this category was 56.3 square feet per full-time equivalent student. The University of Vermont average is 71.8 square feet per student. Normally other space factors would be utilized looking at the number of students or the percentage of students living in campus housing facilities rather than an overall square foot per person amount for all the students.

Paulien & Associates, Inc. Page 33
The University of Vermont houses a higher percentage of students
than do most public flagship institutions and a lower percentage than many private universities. Many public universities house only freshmen students and many private institutions house students for all four years. The University of Vermont policy is to house freshmen and sophomores.
When a guideline application using the number of residential beds
applied to a square foot per bed amount of 200 ASF per bed is used, the University of Vermont shows an additional space need of over 108,000 ASF for housing. This analysis does not include the 90,000 ASF of space at the Redstone Student Apartment Complex which may revert to University ownership at some point in the future.

Paulien & Associates, Inc. Page 34
APPENDIX A CLASSROOM UTILIZATION ANALYSIS

AssignableSq. Ft.
No. ofStations
AverageEnroll-ment
WeeklyRoomHours
WeeklyStudent
Contact Hours
Hours in UseStudent StationOccupancy %
THE UNIVERSITY OF VERMONT
Classroom Utilization Analysis Summary
AssignableSq. Ft.
Per StationRoom ID
RoomUse
Code
120 UNIV HEIGHTS38 276 119%471 32120UHGTS 100 15113
31 S PROSPECT ST17 27450 119%269 1431 SPROS 100 19114
479 MAIN STREET14 8112 117%294 12479 MAIN 102 25114
481 MAIN ST17 21357 85%290 20481 MAIN 104 151145 1884 31%325 15481 MAIN 207 22114
70 S WILLIAMS ST25 18456 101%490 2570 S WIL 109 20114
AIKEN CENTER43 481,998 46%1,440 90AIKEN 104 1611136 311,110 75%1,124 48AIKEN 116 2311312 36363 34%546 30AIKEN 119 18113
ALLEN HOUSE21 23485 70%358 30ALLEN HS 104 12114
ANGELL LECT CTR14 31431 43%519 32ANGELL B104 16110
122 364,404 49%2,580 250ANGELL B106 1011036 27960 36%1,286 100ANGELL B112 1311015 39555 40%519 36ANGELL B203 14110
CAMP CTR THEATRE166 203,336 56%4,070 299CC THTRE I101 14110
CARR DAIRY SCI14 25327 33%593 40CARRIGAN 011 15111
COOK PHYS SCI A13 34415 42%442 29COOK A402 1511016 17257 50%491 30COOK A531 16110
DEWEY HALL29 22528 100%432 24DEWEY 126A 1811418 30528 117%516 15DEWEY 132 3411431 361,125 38%792 82DEWEY 212 10111
Paulien & Associates, Inc.Page 35

AssignableSq. Ft.
No. ofStations
AverageEnroll-ment
WeeklyRoomHours
WeeklyStudent
Contact Hours
Hours in UseStudent StationOccupancy %
THE UNIVERSITY OF VERMONT
Classroom Utilization Analysis Summary
AssignableSq. Ft.
Per StationRoom ID
RoomUse
Code
21 14175 104%278 12DEWEY 238 231146 16 38%202 16DEWEY 306 13114
38 411,573 50%897 76DEWEY 314 121118 755 65%207 12DEWEY 342 17114
FLEMING MUSEUM107 292,915 54%1,780 185FLEMING 101 10110
GIVEN C27 6254 94%620 45GIVEN C C443 14114
GIVEN E189 3567 63%2,938 300GIVEN E E131 10113
2 510 2%1,468 100GIVEN E E210 1511495 343,230 95%1,468 100GIVEN E E214 15114
HILLS AGRI SCI25 33849 53%720 49HILLS 234 15111
KALKIN BUILDING30 461,482 52%1,366 62KALKIN 001 2211138 481,862 75%1,366 52KALKIN 002 2611134 351,108 55%1,235 58KALKIN 003 2111132 501,654 49%1,375 68KALKIN 004 2011127 11292 88%834 30KALKIN 101 2811432 441,473 49%1,397 68KALKIN 110 2111115 687 60%382 24KALKIN 300 1611419 44906 51%761 40KALKIN 325 19111
L/L COMMONS47 211,055 25%2,801 200L/L CMNS 115 1411327 36975 36%1,180 75L/L CMNS 216 1611313 8112 70%253 20L/L CMNS 227 13113
LAFAYETTE HALL30 471,442 70%656 44LAFAYETTE L100 1511131 411,281 69%672 45LAFAYETTE L102 1511116 27439 71%604 23LAFAYETTE L107 2611171 342,410 66%2,069 108LAFAYETTE L108 1911032 361,143 69%697 46LAFAYETTE L111 1511123 461,031 51%647 44LAFAYETTE L200 1511116 24384 80%310 20LAFAYETTE L202 16111
Paulien & Associates, Inc.Page 36

AssignableSq. Ft.
No. ofStations
AverageEnroll-ment
WeeklyRoomHours
WeeklyStudent
Contact Hours
Hours in UseStudent StationOccupancy %
THE UNIVERSITY OF VERMONT
Classroom Utilization Analysis Summary
AssignableSq. Ft.
Per StationRoom ID
RoomUse
Code
63 402,490 58%2,064 108LAFAYETTE L207 1911133 481,569 71%687 46LAFAYETTE L210 1511137 361,323 84%655 44LAFAYETTE L300 1511127 451,200 59%664 45LAFAYETTE L302 1511010 19191 50%398 20LAFAYETTE L307 2011121 33693 75%418 28LAFAYETTE L308 1511124 19459 58%1,068 42LAFAYETTE L309 2511126 411,079 57%692 46LAFAYETTE L311 1511117 36621 72%648 24LAFAYETTE L400 2711422 36780 52%992 42LAFAYETTE L403 2411412 336 67%475 18LAFAYETTE L408 2611413 24306 61%579 21LAFAYETTE L411 28114
LIVING/LEARN A15 27409 50%603 30L/L - A A101 2011313 13163 63%389 20L/L - A A102 1911315 25401 73%603 22L/L - A A161 2711312 14175 63%396 20L/L - A A162 20113
LIVING/LEARN B17 23397 58%603 30L/L - B B101 2011314 18252 70%389 20L/L - B B102 1911326 18471 87%618 30L/L - B B132 21113
LIVING/LEARN D13 16228 71%409 20L/L - D D107 20113
MARSH LIFE SCI18 29531 33%720 55LIFE SCI 105 1311021 35789 42%659 54LIFE SCI 107 12110
163 304,881 46%3,802 350LIFE SCI 235 11110
MORRILL HALL10 770 38%398 26MORRILL 002 1511429 421,240 60%780 49MORRILL 010 16111
MRC CLSSRM&OFFIC20 14280 48%640 42MRC-CLAS 001 15114
MUSIC BLDG0 00 0%298 10MUSIC A311 30114
Paulien & Associates, Inc.Page 37

AssignableSq. Ft.
No. ofStations
AverageEnroll-ment
WeeklyRoomHours
WeeklyStudent
Contact Hours
Hours in UseStudent StationOccupancy %
THE UNIVERSITY OF VERMONT
Classroom Utilization Analysis Summary
AssignableSq. Ft.
Per StationRoom ID
RoomUse
Code
OLD MILL13 339 65%334 20OLD MILL 219 1711411 10128 64%334 20OLD MILL 221 1711412 36438 55%589 22OLD MILL 523 27114
OLD MILL ANNEX16 30483 89%515 18OLD MILL X A200 2911119 42795 54%543 35OLD MILL X A202 1611025 411,025 71%492 35OLD MILL X A206 1411126 451,188 75%479 35OLD MILL X A207 1411116 35575 82%330 20OLD MILL X A303 1711116 36567 79%333 20OLD MILL X A304 17111
PATRICK GYM20 33657 83%595 24PAT GYM 117 2511121 20425 85%657 25PAT GYM 118 26111
PERKINS BUILDING27 391,065 64%799 43PERKINS 107 1911114 37470 30%733 43PERKINS 200 171141 00 0%403 10PERKINS 211 40114
ROWELL N/A ALL HLTH10 220 100%206 10ROWELL 005 2111465 392,333 30%1,841 198ROWELL 103 91139 15138 31%581 30ROWELL 104 19112
26 41958 47%866 50ROWELL 110 1711322 30648 54%862 40ROWELL 111 2211310 29307 42%577 25ROWELL 115 2311343 351,420 68%1,162 60ROWELL 118 1911311 22253 46%582 25ROWELL 239 2311317 27503 62%569 30ROWELL 242 1911317 28460 55%565 30ROWELL 244 19113
ROYALL TYLER THEATRE11 996 89%443 12THEATRE 111 3711415 9138 61%578 25THEATRE 210 2311412 18216 75%1,712 16THEATRE 390 107114
SOUTHWICK HALL12 29377 33%710 40SOUTHWICK 202 18114
Paulien & Associates, Inc.Page 38

AssignableSq. Ft.
No. ofStations
AverageEnroll-ment
WeeklyRoomHours
WeeklyStudent
Contact Hours
Hours in UseStudent StationOccupancy %
THE UNIVERSITY OF VERMONT
Classroom Utilization Analysis Summary
AssignableSq. Ft.
Per StationRoom ID
RoomUse
Code
10 770 67%710 15SOUTHWICK 206 4711422 38863 32%3,760 70SOUTHWICK 301 5411210 18186 86%399 12SOUTHWICK 310 33114
STAFFORD ET41 241,009 44%1,012 95STAFFORD 101 11114
TERRILL-HOME EC56 341,831 56%1,174 96TERRILL 108 1211122 33777 59%740 40TERRILL 222 1911119 28568 38%585 53TERRILL 319 11111
TORREY HALL18 33573 50%468 35TORREY 201 1311119 44811 40%601 46TORREY 203 13110
VOTEY BLDG46 261,282 31%1,685 160VOTEY 105 1111011 42459 22%1,153 50VOTEY 205 2311319 37715 40%1,159 48VOTEY 207 2411123 44994 56%566 40VOTEY 220 1411115 42631 54%381 28VOTEY 223 1411120 541,046 48%574 40VOTEY 231 1411121 41870 53%677 40VOTEY 254 1711113 19245 64%362 20VOTEY 326 1811421 48993 57%767 36VOTEY 367 21111
WATERMAN BLDG24 471,159 77%465 32WATERMAN 400 1511118 46839 57%485 32WATERMAN 401 1511011 30336 45%292 25WATERMAN 402 1211118 30540 72%299 25WATERMAN 403 1211052 331,707 44%1,309 117WATERMAN 413 1111012 27288 53%262 20WATERMAN 419 131115 315 36%187 14WATERMAN 420 13114
14 30391 72%267 18WATERMAN 423 1511129 14456 93%575 35WATERMAN 426 1611147 371,673 57%1,439 80WATERMAN 427 1811016 35537 55%366 28WATERMAN 455 1311115 27417 59%340 26WATERMAN 456 1311117 44721 51%485 32WATERMAN 457 15110
Paulien & Associates, Inc.Page 39

AssignableSq. Ft.
No. ofStations
AverageEnroll-ment
WeeklyRoomHours
WeeklyStudent
Contact Hours
Hours in UseStudent StationOccupancy %
THE UNIVERSITY OF VERMONT
Classroom Utilization Analysis Summary
AssignableSq. Ft.
Per StationRoom ID
RoomUse
Code
21 42933 69%465 32WATERMAN 458 1511010 18180 67%246 15WATERMAN 514 1611423 18349 69%425 28WATERMAN 540 15110
WHEELER HOUSE12 12147 49%297 25WHEELER 101 1211415 687 58%297 25WHEELER 102 12114
WILLIAMS HALL125 243,000 68%1,614 185WILLIAMS 301 911020 26522 100%633 20WILLIAMS 402 3211432 511,628 64%582 50WILLIAMS 403A 121119 327 45%342 20WILLIAMS 418 17114
16 15243 65%459 25WILLIAMS 511 18114
27 27793 50AVERAGE 19
NO. OF ROOMSTOTAL ASF
145114,971
59%
Paulien & Associates, Inc.Page 40

AssignableSq. Ft.
No. ofStations
AverageEnroll-ment
WeeklyRoomHours
WeeklyStudent
Contact Hrs
Hours in UseStudent StationOccupancy %
The University Of VermontCLASSROOM UTILIZATION ANALYSIS BY TYPE (Fall 1999)
AssignableSq. Ft.
Per StationRoom Id
110 CLASSROOM
ANGELL LECT CTR14 31431 43%519 32ANGELL B104 16
122 364,404 49%2,580 250ANGELL B106 1036 27960 36%1,286 100ANGELL B112 1315 39555 40%519 36ANGELL B203 14
CAMP CTR THEATRE166 203,336 56%4,070 299CC THTRE I101 14
COOK PHYS SCI A13 34415 42%442 29COOK A402 1516 17257 50%491 30COOK A531 16
FLEMING MUSEUM107 292,915 54%1,780 185FLEMING 101 10
LAFAYETTE HALL71 342,410 66%2,069 108LAFAYETTE L108 1927 451,200 59%664 45LAFAYETTE L302 15
MARSH LIFE SCI18 29531 33%720 55LIFE SCI 105 1321 35789 42%659 54LIFE SCI 107 12
163 304,881 46%3,802 350LIFE SCI 235 11
OLD MILL ANNEX19 42795 54%543 35OLD MILL X A202 16
TORREY HALL19 44811 40%601 46TORREY 203 13
VOTEY BLDG46 261,282 31%1,685 160VOTEY 105 11
WATERMAN BLDG18 46839 57%485 32WATERMAN 401 1518 30540 72%299 25WATERMAN 403 1252 331,707 44%1,309 117WATERMAN 413 1147 371,673 57%1,439 80WATERMAN 427 1817 44721 51%485 32WATERMAN 457 1521 42933 69%465 32WATERMAN 458 1523 18349 69%425 28WATERMAN 540 15
WILLIAMS HALL125 243,000 68%1,614 185WILLIAMS 301 9
50 331,206 98CR Type Average 14
CR Type No. of RoomsCR Type Total ASF
2428,951
51%
Page 41Paulien & Associates , Inc.

AssignableSq. Ft.
No. ofStations
AverageEnroll-ment
WeeklyRoomHours
WeeklyStudent
Contact Hrs
Hours in UseStudent StationOccupancy %
The University Of VermontCLASSROOM UTILIZATION ANALYSIS BY TYPE (Fall 1999)
AssignableSq. Ft.
Per StationRoom Id
111 CLASSROOM - SCHEDULE PRIORITY
AIKEN CENTER43 481,998 46%1,440 90AIKEN 104 16
CARR DAIRY SCI14 25327 33%593 40CARRIGAN 011 15
DEWEY HALL31 361,125 38%792 82DEWEY 212 1038 411,573 50%897 76DEWEY 314 12
HILLS AGRI SCI25 33849 53%720 49HILLS 234 15
KALKIN BUILDING30 461,482 52%1,366 62KALKIN 001 2238 481,862 75%1,366 52KALKIN 002 2634 351,108 55%1,235 58KALKIN 003 2132 501,654 49%1,375 68KALKIN 004 2032 441,473 49%1,397 68KALKIN 110 2119 44906 51%761 40KALKIN 325 19
LAFAYETTE HALL30 471,442 70%656 44LAFAYETTE L100 1531 411,281 69%672 45LAFAYETTE L102 1516 27439 71%604 23LAFAYETTE L107 2632 361,143 69%697 46LAFAYETTE L111 1523 461,031 51%647 44LAFAYETTE L200 1516 24384 80%310 20LAFAYETTE L202 1663 402,490 58%2,064 108LAFAYETTE L207 1933 481,569 71%687 46LAFAYETTE L210 1537 361,323 84%655 44LAFAYETTE L300 1510 19191 50%398 20LAFAYETTE L307 2021 33693 75%418 28LAFAYETTE L308 1524 19459 58%1,068 42LAFAYETTE L309 2526 411,079 57%692 46LAFAYETTE L311 15
MORRILL HALL29 421,240 60%780 49MORRILL 010 16
OLD MILL ANNEX16 30483 89%515 18OLD MILL X A200 2925 411,025 71%492 35OLD MILL X A206 1426 451,188 75%479 35OLD MILL X A207 1416 35575 82%330 20OLD MILL X A303 1716 36567 79%333 20OLD MILL X A304 17
PATRICK GYM20 33657 83%595 24PAT GYM 117 2521 20425 85%657 25PAT GYM 118 26
Page 42Paulien & Associates , Inc.

AssignableSq. Ft.
No. ofStations
AverageEnroll-ment
WeeklyRoomHours
WeeklyStudent
Contact Hrs
Hours in UseStudent StationOccupancy %
The University Of VermontCLASSROOM UTILIZATION ANALYSIS BY TYPE (Fall 1999)
AssignableSq. Ft.
Per StationRoom Id
PERKINS BUILDING27 391,065 64%799 43PERKINS 107 19
TERRILL-HOME EC56 341,831 56%1,174 96TERRILL 108 1222 33777 59%740 40TERRILL 222 1919 28568 38%585 53TERRILL 319 11
TORREY HALL18 33573 50%468 35TORREY 201 13
VOTEY BLDG19 37715 40%1,159 48VOTEY 207 2423 44994 56%566 40VOTEY 220 1415 42631 54%381 28VOTEY 223 1420 541,046 48%574 40VOTEY 231 1421 41870 53%677 40VOTEY 254 1721 48993 57%767 36VOTEY 367 21
WATERMAN BLDG24 471,159 77%465 32WATERMAN 400 1511 30336 45%292 25WATERMAN 402 1212 27288 53%262 20WATERMAN 419 1314 30391 72%267 18WATERMAN 423 1529 14456 93%575 35WATERMAN 426 1616 35537 55%366 28WATERMAN 455 1315 27417 59%340 26WATERMAN 456 13
WILLIAMS HALL32 511,628 64%582 50WILLIAMS 403A 12
25 37720 43CR Type Average 17
CR Type No. of RoomsCR Type Total ASF
5136,730
61%
112 CLASSROOM - SPECIAL EQUIPMENT
ROWELL N/A ALL HLTH9 15138 31%581 30ROWELL 104 19
SOUTHWICK HALL22 38863 32%3,760 70SOUTHWICK 301 54
16 272,171 50CR Type Average 37
CR Type No. of RoomsCR Type Total ASF
24,341
32%
Page 43Paulien & Associates , Inc.

AssignableSq. Ft.
No. ofStations
AverageEnroll-ment
WeeklyRoomHours
WeeklyStudent
Contact Hrs
Hours in UseStudent StationOccupancy %
The University Of VermontCLASSROOM UTILIZATION ANALYSIS BY TYPE (Fall 1999)
AssignableSq. Ft.
Per StationRoom Id
113 CLASSROOM - RESTRICTED SCHEDULE
120 UNIV HEIGHTS38 276 119%471 32120UHGTS 100 15
AIKEN CENTER36 311,110 75%1,124 48AIKEN 116 2312 36363 34%546 30AIKEN 119 18
GIVEN E189 3567 63%2,938 300GIVEN E E131 10
L/L COMMONS47 211,055 25%2,801 200L/L CMNS 115 1427 36975 36%1,180 75L/L CMNS 216 1613 8112 70%253 20L/L CMNS 227 13
LIVING/LEARN A15 27409 50%603 30L/L - A A101 2013 13163 63%389 20L/L - A A102 1915 25401 73%603 22L/L - A A161 2712 14175 63%396 20L/L - A A162 20
LIVING/LEARN B17 23397 58%603 30L/L - B B101 2014 18252 70%389 20L/L - B B102 1926 18471 87%618 30L/L - B B132 21
LIVING/LEARN D13 16228 71%409 20L/L - D D107 20
ROWELL N/A ALL HLTH65 392,333 30%1,841 198ROWELL 103 926 41958 47%866 50ROWELL 110 1722 30648 54%862 40ROWELL 111 2210 29307 42%577 25ROWELL 115 2343 351,420 68%1,162 60ROWELL 118 1911 22253 46%582 25ROWELL 239 2317 27503 62%569 30ROWELL 242 1917 28460 55%565 30ROWELL 244 19
VOTEY BLDG11 42459 22%1,153 50VOTEY 205 23
30 24896 59CR Type Average 19
CR Type No. of RoomsCR Type Total ASF
2421,500
51%
Page 44Paulien & Associates , Inc.

AssignableSq. Ft.
No. ofStations
AverageEnroll-ment
WeeklyRoomHours
WeeklyStudent
Contact Hrs
Hours in UseStudent StationOccupancy %
The University Of VermontCLASSROOM UTILIZATION ANALYSIS BY TYPE (Fall 1999)
AssignableSq. Ft.
Per StationRoom Id
114 CLASSROOM - DEPARTMENTAL
31 S PROSPECT ST17 27450 119%269 1431 SPROS 100 19
479 MAIN STREET14 8112 117%294 12479 MAIN 102 25
481 MAIN ST17 21357 85%290 20481 MAIN 104 155 1884 31%325 15481 MAIN 207 22
70 S WILLIAMS ST25 18456 101%490 2570 S WIL 109 20
ALLEN HOUSE21 23485 70%358 30ALLEN HS 104 12
DEWEY HALL29 22528 100%432 24DEWEY 126A 1818 30528 117%516 15DEWEY 132 3421 14175 104%278 12DEWEY 238 236 16 38%202 16DEWEY 306 138 755 65%207 12DEWEY 342 17
GIVEN C27 6254 94%620 45GIVEN C C443 14
GIVEN E2 510 2%1,468 100GIVEN E E210 15
95 343,230 95%1,468 100GIVEN E E214 15
KALKIN BUILDING27 11292 88%834 30KALKIN 101 2815 687 60%382 24KALKIN 300 16
LAFAYETTE HALL17 36621 72%648 24LAFAYETTE L400 2722 36780 52%992 42LAFAYETTE L403 2412 336 67%475 18LAFAYETTE L408 2613 24306 61%579 21LAFAYETTE L411 28
MORRILL HALL10 770 38%398 26MORRILL 002 15
MRC CLSSRM&OFFIC20 14280 48%640 42MRC-CLAS 001 15
MUSIC BLDG0 00 0%298 10MUSIC A311 30
OLD MILL13 339 65%334 20OLD MILL 219 1711 10128 64%334 20OLD MILL 221 1712 36438 55%589 22OLD MILL 523 27
Page 45Paulien & Associates , Inc.

AssignableSq. Ft.
No. ofStations
AverageEnroll-ment
WeeklyRoomHours
WeeklyStudent
Contact Hrs
Hours in UseStudent StationOccupancy %
The University Of VermontCLASSROOM UTILIZATION ANALYSIS BY TYPE (Fall 1999)
AssignableSq. Ft.
Per StationRoom Id
PERKINS BUILDING14 37470 30%733 43PERKINS 200 171 00 0%403 10PERKINS 211 40
ROWELL N/A ALL HLTH10 220 100%206 10ROWELL 005 21
ROYALL TYLER THEATRE11 996 89%443 12THEATRE 111 3715 9138 61%578 25THEATRE 210 2312 18216 75%1,712 16THEATRE 390 107
SOUTHWICK HALL12 29377 33%710 40SOUTHWICK 202 1810 770 67%710 15SOUTHWICK 206 4710 18186 86%399 12SOUTHWICK 310 33
STAFFORD ET41 241,009 44%1,012 95STAFFORD 101 11
VOTEY BLDG13 19245 64%362 20VOTEY 326 18
WATERMAN BLDG5 315 36%187 14WATERMAN 420 13
10 18180 67%246 15WATERMAN 514 16
WHEELER HOUSE12 12147 49%297 25WHEELER 101 1215 687 58%297 25WHEELER 102 12
WILLIAMS HALL20 26522 100%633 20WILLIAMS 402 329 327 45%342 20WILLIAMS 418 17
16 15243 65%459 25WILLIAMS 511 18
16 15533 27CR Type Average 23
CR Type No. of RoomsCR Type Total ASF
4423,449
71%
27 27793 50AVERAGE 19
No. of RoomsTOTAL ASF
145114,971
59%
Page 46Paulien & Associates , Inc.
Paulien & Associates, Inc. Page 47
APPENDIX B CLASSROOM UTILIZATION BY DAY AND HOUR
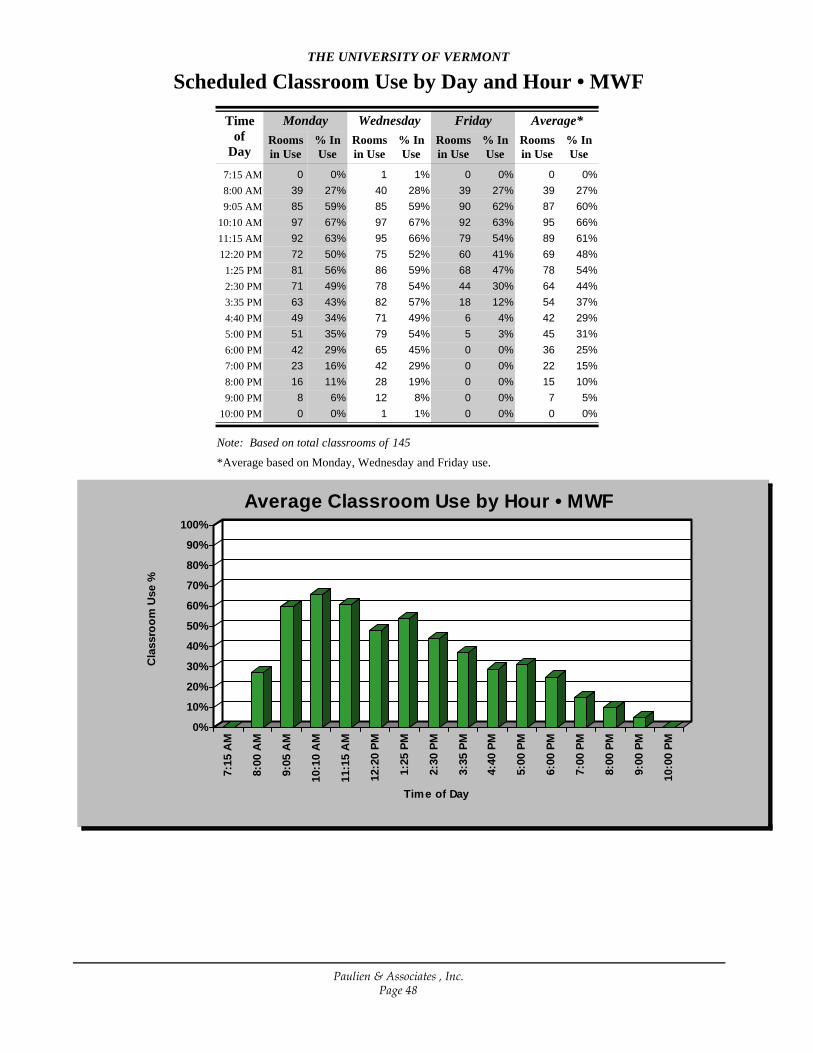
Scheduled Classroom Use by Day and Hour • MWFTHE UNIVERSITY OF VERMONT
Timeof
Day
MondayRoomsin Use
% InUse
Wednesday Friday Average*Roomsin Use
% InUse
Roomsin Use
% InUse
Roomsin Use
% InUse
7:15 AM 0 0% 1 1% 0 0% 0 0%8:00 AM 39 27% 40 28% 39 27% 39 27%9:05 AM 85 59% 85 59% 90 62% 87 60%
10:10 AM 97 67% 97 67% 92 63% 95 66%11:15 AM 92 63% 95 66% 79 54% 89 61%12:20 PM 72 50% 75 52% 60 41% 69 48%
1:25 PM 81 56% 86 59% 68 47% 78 54%2:30 PM 71 49% 78 54% 44 30% 64 44%3:35 PM 63 43% 82 57% 18 12% 54 37%4:40 PM 49 34% 71 49% 6 4% 42 29%5:00 PM 51 35% 79 54% 5 3% 45 31%6:00 PM 42 29% 65 45% 0 0% 36 25%7:00 PM 23 16% 42 29% 0 0% 22 15%8:00 PM 16 11% 28 19% 0 0% 15 10%9:00 PM 8 6% 12 8% 0 0% 7 5%
10:00 PM 0 0% 1 1% 0 0% 0 0%
*Average based on Monday, Wednesday and Friday use.
145Note: Based on total classrooms of
0%
10%
20%
30%
40%
50%
60%
70%
80%
90%
100%
Cla
ssro
om U
se %
7:15
AM
8:00
AM
9:05
AM
10:1
0 A
M
11:1
5 A
M
12:2
0 PM
1:25
PM
2:30
PM
3:35
PM
4:40
PM
5:00
PM
6:00
PM
7:00
PM
8:00
PM
9:00
PM
10:0
0 PM
Time of Day
Average Classroom Use by Hour • MWF
Paulien & Associates , Inc.Page 48

Scheduled Classroom Use by Day and Hour • MWFTHE UNIVERSITY OF VERMONT
0%10%20%30%40%50%60%70%80%90%
100%
Cla
ssro
om U
se %
7:15
AM
8:00
AM
9:05
AM
10:1
0 AM
11:1
5 AM
12:2
0 PM
1:25
PM
2:30
PM
3:35
PM
4:40
PM
5:00
PM
6:00
PM
7:00
PM
8:00
PM
9:00
PM
10:0
0 PM
Time of Day
Monday
0%10%20%30%40%50%60%70%80%90%
100%
Cla
ssro
om U
se %
7:15
AM
8:00
AM
9:05
AM
10:1
0 AM
11:1
5 AM
12:2
0 PM
1:25
PM
2:30
PM
3:35
PM
4:40
PM
5:00
PM
6:00
PM
7:00
PM
8:00
PM
9:00
PM
10:0
0 PM
Time of Day
Wednesday
0%10%20%30%40%50%60%70%80%90%
100%
Cla
ssro
om U
se %
7:15
AM
9:05
AM
11:1
5 AM
1:25
PM
3:35
PM
5:00
PM
7:00
PM
9:00
PM
Time of Day
Friday
Paulien & Associates , Inc.Page 49

Scheduled Classroom Use by Day and Hour • MWFTHE UNIVERSITY OF VERMONT
110 Time
ofDay
MondayRoomsin Use
% InUse
Wednesday Friday Average*Roomsin Use
% InUse
Roomsin Use
% InUse
Roomsin Use
% InUse
8:00 AM 10 42% 10 42% 10 42% 10 42%9:05 AM 21 88% 21 88% 20 83% 21 86%
10:10 AM 23 96% 23 96% 21 88% 22 93%11:15 AM 20 83% 21 88% 19 79% 20 83%12:20 PM 13 54% 13 54% 14 58% 13 56%
1:25 PM 15 63% 16 67% 14 58% 15 63%2:30 PM 12 50% 13 54% 7 29% 11 44%3:35 PM 11 46% 13 54% 1 4% 8 35%4:40 PM 12 50% 13 54% 0 0% 8 35%5:00 PM 12 50% 16 67% 0 0% 9 39%6:00 PM 8 33% 13 54% 0 0% 7 29%7:00 PM 3 13% 6 25% 0 0% 3 13%8:00 PM 1 4% 4 17% 0 0% 2 7%9:00 PM 0 0% 1 4% 0 0% 0 1%
Note: Based on total General Purpose classrooms of
*Average based on Monday, Wednesday and Friday use.
24
0%
10%
20%
30%
40%
50%60%
70%
80%
90%
100%
Cla
ssro
om U
se %
8:00
AM
9:05
AM
10:1
0 A
M
11:1
5 A
M
12:2
0 PM
1:25
PM
2:30
PM
3:35
PM
4:40
PM
5:00
PM
6:00
PM
7:00
PM
8:00
PM
9:00
PM
Time of Day
Average Classroom Use by Hour • MWF
Paulien & Associates , Inc.Page 50

Scheduled Classroom Use by Day and Hour • MWFTHE UNIVERSITY OF VERMONT
110
0%10%20%30%40%50%60%70%80%90%
100%
Cla
ssro
om U
se %
8:00
AM
9:05
AM
10:1
0 AM
11:1
5 AM
12:2
0 PM
1:25
PM
2:30
PM
3:35
PM
4:40
PM
5:00
PM
6:00
PM
7:00
PM
8:00
PM
9:00
PM
Time of Day
Monday
0%10%20%30%40%50%60%70%80%90%
100%
Cla
ssro
om U
se %
8:00
AM
9:05
AM
10:1
0 AM
11:1
5 AM
12:2
0 PM
1:25
PM
2:30
PM
3:35
PM
4:40
PM
5:00
PM
6:00
PM
7:00
PM
8:00
PM
9:00
PM
Time of Day
Wednesday
0%10%20%30%40%50%60%70%80%90%
100%
Cla
ssro
om U
se %
8:00
AM
9:05
AM
10:1
0 AM
11:1
5 AM
12:2
0 PM
1:25
PM
2:30
PM
3:35
PM
4:40
PM
5:00
PM
6:00
PM
7:00
PM
8:00
PM
9:00
PM
Time of Day
Friday
Paulien & Associates , Inc.Page 51
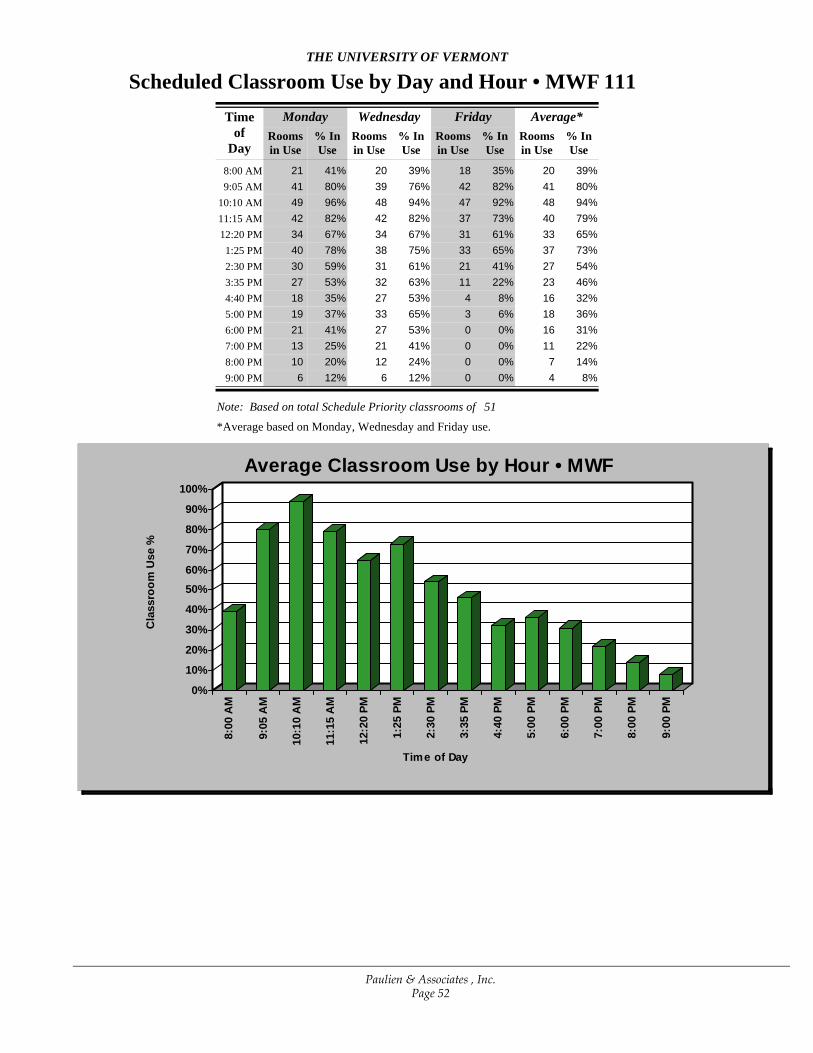
Scheduled Classroom Use by Day and Hour • MWFTHE UNIVERSITY OF VERMONT
111 Time
ofDay
MondayRoomsin Use
% InUse
Wednesday Friday Average*Roomsin Use
% InUse
Roomsin Use
% InUse
Roomsin Use
% InUse
8:00 AM 21 41% 20 39% 18 35% 20 39%9:05 AM 41 80% 39 76% 42 82% 41 80%
10:10 AM 49 96% 48 94% 47 92% 48 94%11:15 AM 42 82% 42 82% 37 73% 40 79%12:20 PM 34 67% 34 67% 31 61% 33 65%1:25 PM 40 78% 38 75% 33 65% 37 73%2:30 PM 30 59% 31 61% 21 41% 27 54%3:35 PM 27 53% 32 63% 11 22% 23 46%4:40 PM 18 35% 27 53% 4 8% 16 32%5:00 PM 19 37% 33 65% 3 6% 18 36%6:00 PM 21 41% 27 53% 0 0% 16 31%7:00 PM 13 25% 21 41% 0 0% 11 22%8:00 PM 10 20% 12 24% 0 0% 7 14%9:00 PM 6 12% 6 12% 0 0% 4 8%
*Average based on Monday, Wednesday and Friday use.
51Note: Based on total Schedule Priority classrooms of
0%
10%
20%
30%
40%
50%60%
70%
80%
90%
100%
Cla
ssro
om U
se %
8:00
AM
9:05
AM
10:1
0 A
M
11:1
5 A
M
12:2
0 PM
1:25
PM
2:30
PM
3:35
PM
4:40
PM
5:00
PM
6:00
PM
7:00
PM
8:00
PM
9:00
PM
Time of Day
Average Classroom Use by Hour • MWF
Paulien & Associates , Inc.Page 52

Scheduled Classroom Use by Day and Hour • MWFTHE UNIVERSITY OF VERMONT
111
0%10%20%30%40%50%60%70%80%90%
100%
Cla
ssro
om U
se %
8:00
AM
9:05
AM
10:1
0 AM
11:1
5 AM
12:2
0 PM
1:25
PM
2:30
PM
3:35
PM
4:40
PM
5:00
PM
6:00
PM
7:00
PM
8:00
PM
9:00
PM
Time of Day
Monday
0%10%20%30%40%50%60%70%80%90%
100%
Cla
ssro
om U
se %
8:00
AM
9:05
AM
10:1
0 AM
11:1
5 AM
12:2
0 PM
1:25
PM
2:30
PM
3:35
PM
4:40
PM
5:00
PM
6:00
PM
7:00
PM
8:00
PM
9:00
PM
Time of Day
Wednesday
0%10%20%30%40%50%60%70%80%90%
100%
Cla
ssro
om U
se %
8:00
AM
9:05
AM
10:1
0 AM
11:1
5 AM
12:2
0 PM
1:25
PM
2:30
PM
3:35
PM
4:40
PM
5:00
PM
6:00
PM
7:00
PM
8:00
PM
9:00
PM
Time of Day
Friday
Paulien & Associates , Inc.Page 53

Scheduled Classroom Use by Day and Hour • MWFTHE UNIVERSITY OF VERMONT
113 Time
ofDay
MondayRoomsin Use
% InUse
Wednesday Friday Average*Roomsin Use
% InUse
Roomsin Use
% InUse
Roomsin Use
% InUse
8:00 AM 4 17% 5 21% 6 25% 5 21%9:05 AM 10 42% 9 38% 11 46% 10 42%
10:10 AM 11 46% 11 46% 9 38% 10 43%11:15 AM 14 58% 15 63% 14 58% 14 60%12:20 PM 8 33% 10 42% 5 21% 8 32%
1:25 PM 11 46% 12 50% 7 29% 10 42%2:30 PM 12 50% 15 63% 5 21% 11 44%3:35 PM 12 50% 19 79% 1 4% 11 44%4:40 PM 9 38% 15 63% 0 0% 8 33%5:00 PM 11 46% 15 63% 0 0% 9 36%6:00 PM 8 33% 14 58% 0 0% 7 31%7:00 PM 3 13% 6 25% 0 0% 3 13%8:00 PM 3 13% 6 25% 0 0% 3 13%9:00 PM 2 8% 3 13% 0 0% 2 7%
*Average based on Monday, Wednesday and Friday use.
24Note: Based on total Restricted Schedule classrooms of
0%
10%
20%
30%
40%
50%60%
70%
80%
90%
100%
Cla
ssro
om U
se %
8:00
AM
9:05
AM
10:1
0 A
M
11:1
5 A
M
12:2
0 PM
1:25
PM
2:30
PM
3:35
PM
4:40
PM
5:00
PM
6:00
PM
7:00
PM
8:00
PM
9:00
PM
Time of Day
Average Classroom Use by Hour • MWF
Paulien & Associates , Inc.Page 54

Scheduled Classroom Use by Day and Hour • MWFTHE UNIVERSITY OF VERMONT
113
0%10%20%30%40%50%60%70%80%90%
100%
Cla
ssro
om U
se %
8:00
AM
9:05
AM
10:1
0 AM
11:1
5 AM
12:2
0 PM
1:25
PM
2:30
PM
3:35
PM
4:40
PM
5:00
PM
6:00
PM
7:00
PM
8:00
PM
9:00
PM
Time of Day
Monday
0%10%20%30%40%50%60%70%80%90%
100%
Cla
ssro
om U
se %
8:00
AM
9:05
AM
10:1
0 AM
11:1
5 AM
12:2
0 PM
1:25
PM
2:30
PM
3:35
PM
4:40
PM
5:00
PM
6:00
PM
7:00
PM
8:00
PM
9:00
PM
Time of Day
Wednesday
0%10%20%30%40%50%60%70%80%90%
100%
Cla
ssro
om U
se %
8:00
AM
9:05
AM
10:1
0 AM
11:1
5 AM
12:2
0 PM
1:25
PM
2:30
PM
3:35
PM
4:40
PM
5:00
PM
6:00
PM
7:00
PM
8:00
PM
9:00
PM
Time of Day
Friday
Paulien & Associates , Inc.Page 55

Scheduled Classroom Use by Day and Hour • MWFTHE UNIVERSITY OF VERMONT
114 Time
ofDay
MondayRoomsin Use
% InUse
Wednesday Friday Average*Roomsin Use
% InUse
Roomsin Use
% InUse
Roomsin Use
% InUse
8:00 AM 3 7% 3 7% 4 9% 3 8%9:05 AM 12 27% 15 34% 16 36% 14 33%
10:10 AM 14 32% 14 32% 14 32% 14 32%11:15 AM 15 34% 15 34% 8 18% 13 29%12:20 PM 16 36% 16 36% 9 20% 14 31%
1:25 PM 15 34% 19 43% 14 32% 16 36%2:30 PM 16 36% 18 41% 11 25% 15 34%3:35 PM 11 25% 16 36% 4 9% 10 23%4:40 PM 9 20% 15 34% 1 2% 8 19%5:00 PM 8 18% 14 32% 1 2% 8 17%6:00 PM 5 11% 11 25% 0 0% 5 12%7:00 PM 4 9% 8 18% 0 0% 4 9%8:00 PM 2 5% 5 11% 0 0% 2 5%9:00 PM 0 0% 1 2% 0 0% 0 1%
10:00 PM 0 0% 1 2% 0 0% 0 1%
*Average based on Monday, Wednesday and Friday use.
44Note: Based on total Departmental classrooms of
0%
10%
20%
30%
40%
50%
60%
70%80%
90%
100%
Cla
ssro
om U
se %
8:00
AM
9:05
AM
10:1
0 A
M
11:1
5 A
M
12:2
0 PM
1:25
PM
2:30
PM
3:35
PM
4:40
PM
5:00
PM
6:00
PM
7:00
PM
8:00
PM
9:00
PM
10:0
0 PM
Time of Day
Average Classroom Use by Hour • MWF
Paulien & Associates , Inc.Page 56

Scheduled Classroom Use by Day and Hour • MWFTHE UNIVERSITY OF VERMONT
114
0%10%20%30%40%50%60%70%80%90%
100%
Cla
ssro
om U
se %
8:00
AM
9:05
AM
10:1
0 AM
11:1
5 AM
12:2
0 PM
1:25
PM
2:30
PM
3:35
PM
4:40
PM
5:00
PM
6:00
PM
7:00
PM
8:00
PM
9:00
PM
10:0
0 PM
Time of Day
Monday
0%10%20%30%40%50%60%70%80%90%
100%
Cla
ssro
om U
se %
8:00
AM
9:05
AM
10:1
0 AM
11:1
5 AM
12:2
0 PM
1:25
PM
2:30
PM
3:35
PM
4:40
PM
5:00
PM
6:00
PM
7:00
PM
8:00
PM
9:00
PM
10:0
0 PM
Time of Day
Wednesday
0%10%20%30%40%50%60%70%80%90%
100%
Cla
ssro
om U
se %
8:00
AM
9:05
AM
10:1
0 AM
11:1
5 AM
12:2
0 PM
1:25
PM
2:30
PM
3:35
PM
4:40
PM
5:00
PM
6:00
PM
7:00
PM
8:00
PM
9:00
PM
10:0
0 PM
Time of Day
Friday
Paulien & Associates , Inc.Page 57

Scheduled Classroom Use by Day and Hour • TThTHE UNIVERSITY OF VERMONT
Timeof
Day
Tuesday Thursday Average*Roomsin Use
% InUse
Roomsin Use
% InUse
Roomsin Use
% InUse
7:45 AM 1 1% 0 0% 1 0%8:00 AM 59 41% 51 35% 55 38%9:30 AM 96 66% 98 68% 97 67%
11:00 AM 96 66% 95 66% 96 66%12:30 PM 98 68% 102 70% 100 69%
2:00 PM 96 66% 101 70% 99 68%3:30 PM 81 56% 66 46% 74 51%5:00 PM 77 53% 63 43% 70 48%6:30 PM 51 35% 46 32% 49 33%8:00 PM 24 17% 22 15% 23 16%9:00 PM 2 1% 1 1% 2 1%
*Average based on Tuesday and Thursday use.
145Note: Based on total classrooms of
0%10%20%30%40%50%60%70%80%90%
100%
Cla
ssro
om U
se %
7:45
AM
8:00
AM
9:30
AM
11:0
0 A
M
12:3
0 PM
2:00
PM
3:30
PM
5:00
PM
6:30
PM
8:00
PM
9:00
PM
Time of Day
Average Classroom Use by Hour • TTh
Paulien & Associates , Inc.Page 58

Scheduled Classroom Use by Day and Hour • TThTHE UNIVERSITY OF VERMONT
0%10%20%30%40%50%60%70%80%90%
100%C
lass
room
Use
%
7:45
AM
8:00
AM
9:30
AM
11:0
0AM
12:3
0PM
2:00
PM
3:30
PM
5:00
PM
6:30
PM
8:00
PM
9:00
PM
Time of Day
Tuesday
0%10%20%30%40%50%60%70%80%90%
100%
Cla
ssro
om U
se %
7:45
AM
8:00
AM
9:30
AM
11:0
0AM
12:3
0PM
2:00
PM
3:30
PM
5:00
PM
6:30
PM
8:00
PM
9:00
PM
Time of Day
Thursday
Paulien & Associates , Inc.Page 59

THE UNIVERSITY OF VERMONT
Scheduled Classroom Use by Day and Hour • TTh 110 Time
ofDay
Tuesday Thursday Average*Roomsin Use
% InUse
Roomsin Use
% InUse
Roomsin Use
% InUse
8:00 AM 5 21% 5 21% 5 21%9:30 AM 20 83% 22 92% 21 88%
11:00 AM 21 88% 21 88% 21 88%12:30 PM 24 100% 22 92% 23 96%
2:00 PM 20 83% 21 88% 21 85%3:30 PM 12 50% 13 54% 13 52%5:00 PM 10 42% 12 50% 11 46%6:30 PM 9 38% 10 42% 10 40%8:00 PM 6 25% 6 25% 6 25%
*Average based on Tuesday and Thursday use.
0%10%20%30%40%50%60%70%80%90%
100%
Cla
ssro
om U
se %
8:00
AM
9:30
AM
11:0
0 A
M
12:3
0 PM
2:00
PM
3:30
PM
5:00
PM
6:30
PM
8:00
PM
Time of Day
Average Classroom Use by Hour • TTh
Note: Based on total General Purpose classrooms of 24
Paulien & Associates , Inc.Page 60

THE UNIVERSITY OF VERMONT
Scheduled Classroom Use by Day and Hour • TTh 110
0%10%20%30%40%50%60%70%80%90%
100%
Cla
ssro
om U
se %
8:00
AM
9:30
AM
11:0
0AM
12:3
0PM
2:00
PM
3:30
PM
5:00
PM
6:30
PM
8:00
PM
Time of Day
Tuesday
0%10%20%30%40%50%60%70%80%90%
100%
Cla
ssro
om U
se %
8:00
AM
9:30
AM
11:0
0AM
12:3
0PM
2:00
PM
3:30
PM
5:00
PM
6:30
PM
8:00
PM
Time of Day
Thursday
Paulien & Associates , Inc.Page 61

THE UNIVERSITY OF VERMONT
Scheduled Classroom Use by Day and Hour • TTh 111 Time
ofDay
Tuesday Thursday Average*Roomsin Use
% InUse
Roomsin Use
% InUse
Roomsin Use
% InUse
8:00 AM 33 65% 28 55% 31 60%9:30 AM 46 90% 48 94% 47 92%
11:00 AM 42 82% 43 84% 43 83%12:30 PM 46 90% 46 90% 46 90%
2:00 PM 44 86% 45 88% 45 87%3:30 PM 38 75% 30 59% 34 67%5:00 PM 36 71% 28 55% 32 63%6:30 PM 24 47% 19 37% 22 42%8:00 PM 10 20% 11 22% 11 21%9:00 PM 2 4% 0 0% 1 2%
Note: Based on total Schedule Priority classrooms of
*Average based on Tuesday and Thursday use.
51
0%10%20%30%40%50%60%70%80%90%
100%
Cla
ssro
om U
se %
8:00
AM
9:30
AM
11:0
0 A
M
12:3
0 PM
2:00
PM
3:30
PM
5:00
PM
6:30
PM
8:00
PM
9:00
PM
Time of Day
Average Classroom Use by Hour • TTh
Paulien & Associates , Inc.Page 62

THE UNIVERSITY OF VERMONT
Scheduled Classroom Use by Day and Hour • TTh 111
0%10%20%30%40%50%60%70%80%90%
100%
Cla
ssro
om U
se %
8:00
AM
9:30
AM
11:0
0AM
12:3
0PM
2:00
PM
3:30
PM
5:00
PM
6:30
PM
8:00
PM
9:00
PM
Time of Day
Tuesday
0%10%20%30%40%50%60%70%80%90%
100%
Cla
ssro
om U
se %
8:00
AM
9:30
AM
11:0
0AM
12:3
0PM
2:00
PM
3:30
PM
5:00
PM
6:30
PM
8:00
PM
9:00
PM
Time of Day
Thursday
Paulien & Associates , Inc.Page 63

THE UNIVERSITY OF VERMONT
Scheduled Classroom Use by Day and Hour • TTh 113 Time
ofDay
Tuesday Thursday Average*Roomsin Use
% InUse
Roomsin Use
% InUse
Roomsin Use
% InUse
8:00 AM 7 29% 7 29% 7 29%9:30 AM 11 46% 11 46% 11 46%
11:00 AM 15 63% 14 58% 15 60%12:30 PM 12 50% 15 63% 14 56%
2:00 PM 13 54% 14 58% 14 56%3:30 PM 17 71% 12 50% 15 60%5:00 PM 16 67% 12 50% 14 58%6:30 PM 9 38% 7 29% 8 33%8:00 PM 5 21% 2 8% 4 15%
*Average based on Tuesday and Thursday use.
0%10%20%30%40%50%60%70%80%90%
100%
Cla
ssro
om U
se %
8:00
AM
9:30
AM
11:0
0 A
M
12:3
0 PM
2:00
PM
3:30
PM
5:00
PM
6:30
PM
8:00
PM
Time of Day
Average Classroom Use by Hour • TTh
24Note: Based on total Restricted Schedule classrooms of
Paulien & Associates , Inc.Page 64

THE UNIVERSITY OF VERMONT
Scheduled Classroom Use by Day and Hour • TTh 113
0%10%20%30%40%50%60%70%80%90%
100%
Cla
ssro
om U
se %
8:00
AM
9:30
AM
11:0
0AM
12:3
0PM
2:00
PM
3:30
PM
5:00
PM
6:30
PM
8:00
PM
Time of Day
Tuesday
0%10%20%30%40%50%60%70%80%90%
100%
Cla
ssro
om U
se %
8:00
AM
9:30
AM
11:0
0AM
12:3
0PM
2:00
PM
3:30
PM
5:00
PM
6:30
PM
8:00
PM
Time of Day
Thursday
Paulien & Associates , Inc.Page 65

Scheduled Classroom Use by Day and Hour • TThTHE UNIVERSITY OF VERMONT
114 Time
ofDay
Tuesday Thursday Average*Roomsin Use
% InUse
Roomsin Use
% InUse
Roomsin Use
% InUse
7:45 AM 1 2% 0 0% 1 1%8:00 AM 12 27% 10 23% 11 25%9:30 AM 18 41% 17 39% 18 40%
11:00 AM 17 39% 16 36% 17 38%12:30 PM 16 36% 18 41% 17 39%
2:00 PM 19 43% 20 45% 20 44%3:30 PM 13 30% 9 20% 11 25%5:00 PM 15 34% 10 23% 13 28%6:30 PM 8 18% 8 18% 8 18%8:00 PM 2 5% 2 5% 2 5%9:00 PM 0 0% 1 2% 1 1%
*Average based on Tuesday and Thursday use.
0%10%20%30%40%50%60%70%80%90%
100%
Cla
ssro
om U
se %
7:45
AM
8:00
AM
9:30
AM
11:0
0 A
M
12:3
0 PM
2:00
PM
3:30
PM
5:00
PM
6:30
PM
8:00
PM
9:00
PM
Time of Day
Average Classroom Use by Hour • TTh
44Note: Based on total Departmental classrooms of
Paulien & Associates , Inc.Page 66

Scheduled Classroom Use by Day and Hour • TThTHE UNIVERSITY OF VERMONT
114
0%10%20%30%40%50%60%70%80%90%
100%
Cla
ssro
om U
se %
7:45
AM
8:00
AM
9:30
AM
11:0
0AM
12:3
0PM
2:00
PM
3:30
PM
5:00
PM
6:30
PM
8:00
PM
9:00
PM
Time of Day
Tuesday
0%10%20%30%40%50%60%70%80%90%
100%
Cla
ssro
om U
se %
7:45
AM
8:00
AM
9:30
AM
11:0
0AM
12:3
0PM
2:00
PM
3:30
PM
5:00
PM
6:30
PM
8:00
PM
9:00
PM
Time of Day
Thursday
Paulien & Associates , Inc.Page 67

Paulien & Associates, Inc. Page 68
APPENDIX C LIST OF CLASSROOM ROOM USE CODE ADJUSTMENTS

University of VermontClassrooms
ROOM ID ASFORIG ROOM USE CODE
ROOM USE CODE
1 120UHGTS 100 471 1132 31 SPROS 004 269 114 3503 31 SPROS 100 269 1144 479 MAIN 102 294 1145 481 MAIN 104 290 1146 481 MAIN 207 325 1147 70 S WIL 109 490 1148 AIKEN 104 1440 1119 AIKEN 116 1124 11310 AIKEN 119 546 11311 ALLEN HS 104 358 11412 ANGELL B104 519 11013 ANGELL B106 2580 11014 ANGELL B112 1286 11015 ANGELL B203 519 11016 BRC-LAB 106 378 114 35017 CARRIGAN 011 593 11118 CC THTRE I101 4070 11019 COOK A402 442 11020 COOK A531 491 11021 DEWEY 126A 432 11422 DEWEY 132 516 11423 DEWEY 212 792 11124 DEWEY 238 278 11425 DEWEY 306 202 11426 DEWEY 314 897 11127 DEWEY 342 207 11428 FLEMING 101 1780 11029 FLEMING 104 540 114 62530 FLEMING 304A 456 114 62531 GIVEN C C443 620 11432 GIVEN E E131 2938 11333 GIVEN E E210 1468 11434 GIVEN E E214 1468 11435 HILLS 234 720 11136 HRC-BLAS 102 607 114 35037 KALKIN 001 1366 11138 KALKIN 002 1366 11139 KALKIN 003 1235 11140 KALKIN 004 1375 111
KALKIN 101 834 220 11441 KALKIN 110 1397 11142 KALKIN 300 382 11443 KALKIN 322 382 114 35044 KALKIN 325 761 111
Paulien & Associates, Inc.Page 69

University of VermontClassrooms
ROOM ID ASFORIG ROOM USE CODE
ROOM USE CODE
45 L/L - A A101 603 11346 L/L - A A102 389 11347 L/L - A A131 638 113 22048 L/L - A A161 603 11349 L/L - A A162 396 11350 L/L - B B101 603 11351 L/L - B B102 389 11352 L/L - B B132 618 11353 L/L - D D107 409 11354 L/L CMNS 115 2801 11355 L/L CMNS 216 1180 11356 L/L CMNS 227 253 11357 LAFAYETTE L100 656 11158 LAFAYETTE L102 672 11159 LAFAYETTE L107 604 11160 LAFAYETTE L108 2069 11061 LAFAYETTE L111 697 11162 LAFAYETTE L200 647 11163 LAFAYETTE L202 310 11164 LAFAYETTE L203 688 114 11565 LAFAYETTE L205 510 114 11566 LAFAYETTE L205A 281 114 11567 LAFAYETTE L207 2064 11168 LAFAYETTE L210 687 11169 LAFAYETTE L300 655 11170 LAFAYETTE L302 664 11071 LAFAYETTE L307 398 11172 LAFAYETTE L308 418 11173 LAFAYETTE L309 1068 11174 LAFAYETTE L311 692 11175 LAFAYETTE L400 648 11476 LAFAYETTE L403 992 11477 LAFAYETTE L407 1100 114 53078 LAFAYETTE L408 475 11479 LAFAYETTE L411 579 11480 LIFE SCI 105 720 11081 LIFE SCI 107 659 11082 LIFE SCI 235 3802 11083 MORRILL 002 398 11484 MORRILL 010 780 11185 MRC-CLAS 001 640 11486 MUSIC A302 237 114 22087 MUSIC A311 298 11488 OLD MILL 219 334 11489 OLD MILL 221 334 114
Paulien & Associates, Inc.Page 70

University of VermontClassrooms
ROOM ID ASFORIG ROOM USE CODE
ROOM USE CODE
90 OLD MILL 523 589 11491 OLDMLANX A200 515 11192 OLDMLANX A202 543 11093 OLDMLANX A206 492 11194 OLDMLANX A207 479 11195 OLDMLANX A303 330 11196 OLDMLANX A304 333 11197 PAT GYM 117 595 11198 PAT GYM 118 657 11199 PERKINS 107 799 111100 PERKINS 200 733 114101 PERKINS 211 403 114102 PRC-LAB 218 875 114 350103 ROWELL 005 206 114104 ROWELL 103 1841 113105 ROWELL 104 581 112106 ROWELL 110 866 113107 ROWELL 111 862 113108 ROWELL 115 577 113109 ROWELL 118 1162 113110 ROWELL 120 merged with 118111 ROWELL 239 582 113112 ROWELL 242 569 113113 ROWELL 244 565 113114 SOUTHWICK 202 710 114115 SOUTHWICK 206 710 114116 SOUTHWICK 301 3760 112
SOUTHWICK 310 399 220 114117 STAFFORD 101 1012 114118 TERRILL 108 1174 111119 TERRILL 222 740 111120 TERRILL 319 585 111121 THEATRE 111 443 114122 THEATRE 112 389 112 220123 THEATRE 210 578 114124 THEATRE 390 1712 114125 TORREY 201 468 111126 TORREY 203 601 110127 VOTEY 105 1685 110128 VOTEY 205 1153 113129 VOTEY 207 1159 111130 VOTEY 220 566 111131 VOTEY 223 381 111132 VOTEY 231 574 111133 VOTEY 254 677 111
Paulien & Associates, Inc.Page 71

University of VermontClassrooms
ROOM ID ASFORIG ROOM USE CODE
ROOM USE CODE
134 VOTEY 326 362 114135 VOTEY 367 767 111136 WATERMAN 400 465 111137 WATERMAN 401 485 110138 WATERMAN 402 292 111139 WATERMAN 403 299 110140 WATERMAN 413 1309 110141 WATERMAN 419 262 111142 WATERMAN 420 187 114143 WATERMAN 423 267 111144 WATERMAN 426 575 111145 WATERMAN 427 1439 110146 WATERMAN 455 366 111147 WATERMAN 456 340 111148 WATERMAN 457 485 110149 WATERMAN 458 465 110150 WATERMAN 514 246 114151 WATERMAN 540 425 110152 WHEELER 101 297 114153 WHEELER 102 297 114154 WILLIAMS 211 211 114 225155 WILLIAMS 301 1614 110156 WILLIAMS 402 633 114157 WILLIAMS 403A 582 111158 WILLIAMS 414 364 114 220159 WILLIAMS 418 342 114160 WILLIAMS 511 459 114
Non-classroom Room Use Codes115: Classroom Service220: Open Laboratory225: Open Laboratory Service350: Conference Room530: Media Production625: Assembly/Exhibit Service
Paulien & Associates, Inc.Page 72

Paulien & Associates, Inc. Page 73
APPENDIX D TEACHING LABORATORY UTILIZATION ANALYSIS SUMMARY

AssignedSq. Ft.
No. ofStations
AverageEnroll-ment
WeeklyRoomHours
WeeklyStudent
Contact Hrs
Hours in UseStudent StationOccupancy %
The University Of VermontTEACHING LABORATORY UTILIZATION ANALYSIS SUMMARY
AssignedSq. Ft.
Per StationRoom Id
AGRI ENGINEERING21 8120 50%2,565 30AG ENGR 114 86
AIKEN CENTER19 12224 47%611 40AIKEN 202 1511 16167 26%599 40AIKEN 222 15
CARR DAIRY SCI3 615 14%737 18CARRIGAN 012 41
COOK PHYS SCI A6 636 30%1,001 20COOK A105 50
17 12207 86%1,001 20COOK A142 5020 15306 68%1,001 30COOK A240 3320 15294 98%1,001 20COOK A241 5019 15279 93%1,001 20COOK A242 507 856 35%1,003 20COOK A305 50
12 12147 41%1,003 30COOK A313 3316 12192 80%1,003 20COOK A338 5018 12219 91%1,003 20COOK A339 5018 18315 88%1,003 20COOK A340 5019 18342 95%1,003 20COOK A341 5021 30615 102%1,001 20COOK A409 5017 12201 84%1,001 20COOK A410 5014 9114 63%1,001 20COOK A418 50
DEWEY HALL16 36561 156%453 10DEWEY 241 45
GIVEN A3 1129 3%2,454 100GIVEN A A287 25
GIVEN E2 1224 2%1,968 100GIVEN E E401 20
48 6288 80%774 60GIVEN E E401A 13
HILLS AGRI SCI16 24366 42%763 36HILLS 017 2116 16252 79%918 20HILLS 020 460 00 0%675 20HILLS 021 34
23 12276 72%1,134 32HILLS 122 3512 27321 74%858 16HILLS 128 5410 440 50%585 20HILLS 133 2917 14230 66%560 25HILLS 228 22
MARSH LIFE SCI14 29400 138%702 10LIFE SCI 112 70
Paulien & Associates , Inc.Page 74

AssignedSq. Ft.
No. ofStations
AverageEnroll-ment
WeeklyRoomHours
WeeklyStudent
Contact Hrs
Hours in UseStudent StationOccupancy %
The University Of VermontTEACHING LABORATORY UTILIZATION ANALYSIS SUMMARY
AssignedSq. Ft.
Per StationRoom Id
19 45858 95%702 20LIFE SCI 114 3516 15240 80%713 20LIFE SCI 131 3613 24306 64%733 20LIFE SCI 202 3714 21303 72%724 20LIFE SCI 304 3610 25234 47%724 20LIFE SCI 316 36
MORRILL HALL14 14198 64%749 22MORRILL 005 34
PATRICK GYM9 664 107%706 10PAT GYM 006 71
PERKINS BUILDING16 45690 51%1,076 30PERKINS 101 368 645 47%523 16PERKINS 108 332 612 17%576 12PERKINS 204 48
ROWELL N/A ALL HLTH16 25407 63%2,476 26ROWELL 003 9511 24273 63%314 18ROWELL 017 1712 24285 66%312 18ROWELL 018 1717 234 65%1,122 26ROWELL 113 4316 11166 75%1,153 20ROWELL 237 5819 24478 45%1,424 44ROWELL 313 3211 25219 34%1,157 26ROWELL 318 45
SOUTHWICK HALL13 898 41%1,124 30SOUTHWICK 200B 37
STAFFORD ET11 666 34%1,294 32STAFFORD 102 4034 8268 105%1,187 32STAFFORD 103 3724 8192 75%1,259 32STAFFORD 104 39
TERRILL-HOME EC20 14282 101%772 20TERRILL 200 390 00 0%754 14TERRILL 307 54
VOTEY BLDG8 1296 80%1,637 10VOTEY 122 164
12 14161 57%376 20VOTEY 206B 1926 252 130%555 20VOTEY 229 2822 36796 76%1,046 29VOTEY 246 364 1563 21%563 20VOTEY 308B 284 1566 37%562 12VOTEY 312 476 636 75%565 8VOTEY 328 717 428 140%200 5VOTEY 330 407 1599 17%747 40VOTEY 334 19
Paulien & Associates , Inc.Page 75

AssignedSq. Ft.
No. ofStations
AverageEnroll-ment
WeeklyRoomHours
WeeklyStudent
Contact Hrs
Hours in UseStudent StationOccupancy %
The University Of VermontTEACHING LABORATORY UTILIZATION ANALYSIS SUMMARY
AssignedSq. Ft.
Per StationRoom Id
WATERMAN BLDG34 311,029 95%1,165 35WATERMAN 539 33
WILLIAMS HALL16 18285 53%1,760 30WILLIAMS 106 5911 11119 83%998 13WILLIAMS 112 7717 15249 83%828 20WILLIAMS 207 4117 15248 83%1,760 20WILLIAMS 213 8819 33624 95%944 20WILLIAMS 305 4713 12160 89%1,760 15WILLIAMS 309 11721 43924 83%1,736 26WILLIAMS 416 6716 12192 89%769 18WILLIAMS 506 43
15 16 67%985 25AVERAGE 45
No. of RoomsTOTAL ASF
7169,927
Paulien & Associates , Inc.Page 76
Paulien & Associates, Inc. Page 77
APPENDIX E TEACHING LABORATORY UTILIZATION ANALYSIS SUMMARY
BY DEPARTMENT

AssignedSq. Ft.
No. ofStations
AverageEnroll-ment
WeeklyRoomHours
WeeklyStudent
Contact Hrs
Hours in UseStudent StationOccupancy %
The University Of VermontTEACHING LABORATORY UTILIZATION ANALYSIS SUMMARY BY DEPARTMENT
AssignedSq. Ft.
Per StationRoom IdAGRICULTURAL BIOCHEMISTRY
23 12276 72%1,134 32HILLS 122 3512 27321 74%858 16HILLS 128 5410 440 50%585 20HILLS 133 2915 14 65%859 23DEPT AVERAGE 39
No. of RoomsTOTAL DEPT ASF
32,577
212
ANATOMY&NEUROBIOLOGY2 1224 2%1,968 100GIVEN E E401 20
48 6288 80%774 60GIVEN E E401A 1311 24273 63%314 18ROWELL 017 1712 24285 66%312 18ROWELL 018 1718 17 53%842 49DEPT AVERAGE 17
No. of RoomsTOTAL DEPT ASF
43,368
218
ART16 18285 53%1,760 30WILLIAMS 106 5911 11119 83%998 13WILLIAMS 112 7717 15249 83%828 20WILLIAMS 207 4117 15248 83%1,760 20WILLIAMS 213 8819 33624 95%944 20WILLIAMS 305 4713 12160 89%1,760 15WILLIAMS 309 11721 43924 83%1,736 26WILLIAMS 416 6716 12192 89%769 18WILLIAMS 506 4316 20 82%1,319 20DEPT AVERAGE 67
No. of RoomsTOTAL DEPT ASF
810,555
350
ATHLETICS9 664 107%706 10PAT GYM 006 719 6 107%706 10DEPT AVERAGE 71
No. of RoomsTOTAL DEPT ASF
1706
64
Paulien & Associates , Inc.Page 78

AssignedSq. Ft.
No. ofStations
AverageEnroll-ment
WeeklyRoomHours
WeeklyStudent
Contact Hrs
Hours in UseStudent StationOccupancy %
The University Of VermontTEACHING LABORATORY UTILIZATION ANALYSIS SUMMARY BY DEPARTMENT
AssignedSq. Ft.
Per StationRoom IdBIOLOGY
13 24306 64%733 20LIFE SCI 202 3714 21303 72%724 20LIFE SCI 304 3610 25234 47%724 20LIFE SCI 316 3612 23 61%727 20DEPT AVERAGE 36
No. of RoomsTOTAL DEPT ASF
32,181
281
BIOMEDICAL TECHNOLOGIES17 234 65%1,122 26ROWELL 113 4311 25219 34%1,157 26ROWELL 318 4514 14 50%1,140 26DEPT AVERAGE 44
No. of RoomsTOTAL DEPT ASF
22,279
127
BOTANY14 29400 138%702 10LIFE SCI 112 7019 45858 95%702 20LIFE SCI 114 3516 15240 80%713 20LIFE SCI 131 3616 30 104%706 17DEPT AVERAGE 47
No. of RoomsTOTAL DEPT ASF
32,117
499
CHEMISTRY6 636 30%1,001 20COOK A105 50
17 12207 86%1,001 20COOK A142 5020 15306 68%1,001 30COOK A240 3320 15294 98%1,001 20COOK A241 5019 15279 93%1,001 20COOK A242 507 856 35%1,003 20COOK A305 50
12 12147 41%1,003 30COOK A313 3316 12192 80%1,003 20COOK A338 5018 12219 91%1,003 20COOK A339 5018 18315 88%1,003 20COOK A340 5019 18342 95%1,003 20COOK A341 5016 13 73%1,002 22DEPT AVERAGE 47
No. of RoomsTOTAL DEPT ASF
1111,023
218
Paulien & Associates , Inc.Page 79

AssignedSq. Ft.
No. ofStations
AverageEnroll-ment
WeeklyRoomHours
WeeklyStudent
Contact Hrs
Hours in UseStudent StationOccupancy %
The University Of VermontTEACHING LABORATORY UTILIZATION ANALYSIS SUMMARY BY DEPARTMENT
AssignedSq. Ft.
Per StationRoom IdCOMMUNITY DEV & APPLIED ECONON
21 8120 50%2,565 30AG ENGR 114 8620 14282 101%772 20TERRILL 200 3921 11 75%1,669 25DEPT AVERAGE 62
No. of RoomsTOTAL DEPT ASF
23,337
201
DEAN-AGRICULTURE0 00 0%675 20HILLS 021 34
14 14198 64%749 22MORRILL 005 347 7 32%712 21DEPT AVERAGE 34
No. of RoomsTOTAL DEPT ASF
21,424
99
DEAN-SCH OF NURSING16 11166 75%1,153 20ROWELL 237 5816 11 75%1,153 20DEPT AVERAGE 58
No. of RoomsTOTAL DEPT ASF
11,153
166
DENTAL HYGIENE16 25407 63%2,476 26ROWELL 003 9516 25 63%2,476 26DEPT AVERAGE 95
No. of RoomsTOTAL DEPT ASF
12,476
407
DIR-SCH NATURAL RES19 12224 47%611 40AIKEN 202 1511 16167 26%599 40AIKEN 222 1515 14 36%605 40DEPT AVERAGE 15
No. of RoomsTOTAL DEPT ASF
21,210
196
DIV OF EMBA/CF12 14161 57%376 20VOTEY 206B 1926 252 130%555 20VOTEY 229 2822 36796 76%1,046 29VOTEY 246 3620 17 88%659 23DEPT AVERAGE 28
No. of RoomsTOTAL DEPT ASF
31,977
336
Paulien & Associates , Inc.Page 80

AssignedSq. Ft.
No. ofStations
AverageEnroll-ment
WeeklyRoomHours
WeeklyStudent
Contact Hrs
Hours in UseStudent StationOccupancy %
The University Of VermontTEACHING LABORATORY UTILIZATION ANALYSIS SUMMARY BY DEPARTMENT
AssignedSq. Ft.
Per StationRoom IdEDUCATION
34 311,029 95%1,165 35WATERMAN 539 3334 31 95%1,165 35DEPT AVERAGE 33
No. of RoomsTOTAL DEPT ASF
11,165
1,029
ELECTRICAL & COMPUTER ENG4 1563 21%563 20VOTEY 308B 284 1566 37%562 12VOTEY 312 476 636 75%565 8VOTEY 328 717 428 140%200 5VOTEY 330 407 1599 17%747 40VOTEY 334 196 11 58%527 17DEPT AVERAGE 41
No. of RoomsTOTAL DEPT ASF
52,637
58
GEOLOGY16 45690 51%1,076 30PERKINS 101 368 645 47%523 16PERKINS 108 332 612 17%576 12PERKINS 204 488 19 38%725 19DEPT AVERAGE 39
No. of RoomsTOTAL DEPT ASF
32,175
249
MECHANICAL ENGINEERING8 1296 80%1,637 10VOTEY 122 1648 12 80%1,637 10DEPT AVERAGE 164
No. of RoomsTOTAL DEPT ASF
11,637
96
MICRO & MOLEC GENETICS11 666 34%1,294 32STAFFORD 102 4034 8268 105%1,187 32STAFFORD 103 3724 8192 75%1,259 32STAFFORD 104 3923 7 71%1,247 32DEPT AVERAGE 39
No. of RoomsTOTAL DEPT ASF
33,740
175
Paulien & Associates , Inc.Page 81

AssignedSq. Ft.
No. ofStations
AverageEnroll-ment
WeeklyRoomHours
WeeklyStudent
Contact Hrs
Hours in UseStudent StationOccupancy %
The University Of VermontTEACHING LABORATORY UTILIZATION ANALYSIS SUMMARY BY DEPARTMENT
AssignedSq. Ft.
Per StationRoom IdNUTRIT & FOOD SCIENCES
3 615 14%737 18CARRIGAN 012 410 00 0%754 14TERRILL 307 541 3 7%746 16DEPT AVERAGE 47
No. of RoomsTOTAL DEPT ASF
21,491
8
PATHOLOGY3 1129 3%2,454 100GIVEN A A287 253 11 3%2,454 100DEPT AVERAGE 25
No. of RoomsTOTAL DEPT ASF
12,454
29
PHYSICAL THERAPY19 24478 45%1,424 44ROWELL 313 3219 24 45%1,424 44DEPT AVERAGE 32
No. of RoomsTOTAL DEPT ASF
11,424
478
PHYSICS21 30615 102%1,001 20COOK A409 5017 12201 84%1,001 20COOK A410 5014 9114 63%1,001 20COOK A418 5017 17 83%1,001 20DEPT AVERAGE 50
No. of RoomsTOTAL DEPT ASF
33,003
310
PLANT & SOIL SCIENCE16 24366 42%763 36HILLS 017 2116 16252 79%918 20HILLS 020 4617 14230 66%560 25HILLS 228 2216 18 62%747 27DEPT AVERAGE 30
No. of RoomsTOTAL DEPT ASF
32,241
283
PSYCHOLOGY16 36561 156%453 10DEWEY 241 4516 36 156%453 10DEPT AVERAGE 45
No. of RoomsTOTAL DEPT ASF
1453
561
Paulien & Associates , Inc.Page 82

AssignedSq. Ft.
No. ofStations
AverageEnroll-ment
WeeklyRoomHours
WeeklyStudent
Contact Hrs
Hours in UseStudent StationOccupancy %
The University Of VermontTEACHING LABORATORY UTILIZATION ANALYSIS SUMMARY BY DEPARTMENT
AssignedSq. Ft.
Per StationRoom IdROMANCE LANGUAGES
13 898 41%1,124 30SOUTHWICK 200 3713 8 41%1,124 30DEPT AVERAGE 37
No. of RoomsTOTAL DEPT ASF
11,124
98
15 16 67%985 25TOTAL AVERAGE 45
No. of RoomsTOTAL ASF
7169,927
248
Paulien & Associates , Inc.Page 83

Paulien & Associates, Inc. Page 84
APPENDIX F SCHEDULED LAB USE BY DAY AND HOUR

Scheduled Lab Use by Day and Hour • MWFTHE UNIVERSITY OF VERMONT
Timeof
Day
MondayRoomsin Use
% InUse
Wednesday Friday Average*Roomsin Use
% InUse
Roomsin Use
% InUse
Roomsin Use
% InUse
7:00 AM 0 0% 1 1% 0 0% 0 0%7:15 AM 0 0% 1 1% 0 0% 0 0%8:00 AM 4 6% 7 10% 4 6% 5 7%9:05 AM 10 14% 13 18% 10 14% 11 15%
10:10 AM 15 21% 20 28% 11 15% 15 22%11:15 AM 16 23% 16 23% 11 15% 14 20%12:20 PM 10 14% 15 21% 8 11% 11 15%
1:25 PM 35 49% 36 51% 10 14% 27 38%2:30 PM 40 56% 40 56% 11 15% 30 43%3:35 PM 34 48% 36 51% 10 14% 27 38%4:40 PM 14 20% 22 31% 7 10% 14 20%5:00 PM 15 21% 21 30% 6 8% 14 20%6:00 PM 14 20% 17 24% 2 3% 11 15%7:00 PM 12 17% 11 15% 0 0% 8 11%8:00 PM 8 11% 7 10% 0 0% 5 7%9:00 PM 3 4% 2 3% 0 0% 2 2%
*Average based on Monday, Wednesday and Friday use.
71Note: Based on total laboratories of
0%10%20%30%40%50%60%70%80%90%
100%
Cla
ssro
om U
se %
7:00
AM
7:15
AM
8:00
AM
9:05
AM
10:1
0 A
M
11:1
5 A
M
12:2
0 PM
1:25
PM
2:30
PM
3:35
PM
4:40
PM
5:00
PM
6:00
PM
7:00
PM
8:00
PM
9:00
PM
Time of Day
Average Laboratory Use by Hour • MWF
Paulien & Associates , Inc.Page 85

Scheduled Lab Use by Day and Hour • MWFTHE UNIVERSITY OF VERMONT
0%10%20%30%40%50%60%70%80%90%
100%
Labo
rato
ry U
se %
7:00
AM
8:00
AM
10:1
0 AM
12:2
0 PM
2:30
PM
4:40
PM
6:00
PM
8:00
PM
Time of Day
Monday
0%10%20%30%40%50%60%70%80%90%
100%
Labo
rato
ry U
se %
7:00
AM
7:15
AM
8:00
AM
9:05
AM
10:1
0 AM
11:1
5 AM
12:2
0 PM
1:25
PM
2:30
PM
3:35
PM
4:40
PM
5:00
PM
6:00
PM
7:00
PM
8:00
PM
9:00
PM
Time of Day
Wednesday
0%10%20%30%40%50%60%70%80%90%
100%
Labo
rato
ry U
se %
7:00
AM
7:15
AM
8:00
AM
9:05
AM
10:1
0 AM
11:1
5 AM
12:2
0 PM
1:25
PM
2:30
PM
3:35
PM
4:40
PM
5:00
PM
6:00
PM
7:00
PM
8:00
PM
9:00
PM
Time of Day
Friday
Paulien & Associates , Inc.Page 86

Scheduled Lab Use by Day and Hour • TThTHE UNIVERSITY OF VERMONT
Timeof
Day
Tuesday Thursday Average*Roomsin Use
% InUse
Roomsin Use
% InUse
Roomsin Use
% InUse
8:00 AM 18 25% 15 21% 17 23%9:30 AM 26 37% 21 30% 24 33%
11:00 AM 17 24% 15 21% 16 23%12:30 PM 29 41% 27 38% 28 39%
2:00 PM 43 61% 41 58% 42 59%3:30 PM 40 56% 35 49% 38 53%5:00 PM 23 32% 24 34% 24 33%6:30 PM 19 27% 18 25% 19 26%8:00 PM 15 21% 15 21% 15 21%9:00 PM 4 6% 1 1% 3 4%
*Average based on Tuesday and Thursday use.
71Note: Based on total laboratories of
0%10%20%30%40%50%60%70%80%90%
100%
Lab
orat
ory
Use
%
8:00
AM
9:30
AM
11:0
0 A
M
12:3
0 PM
2:00
PM
3:30
PM
5:00
PM
6:30
PM
8:00
PM
9:00
PM
Time of Day
Average Laboratory Use by Hour • TTh
Paulien & Associates , Inc.Page 87

Scheduled Lab Use by Day and Hour • TThTHE UNIVERSITY OF VERMONT
0%10%20%30%40%50%60%70%80%90%
100%
Labo
rato
ry U
se %
8:00
AM
9:30
AM
11:0
0AM
12:3
0PM
2:00
PM
3:30
PM
5:00
PM
6:30
PM
8:00
PM
9:00
PM
Time of Day
Tuesday
0%10%20%30%40%50%60%70%80%90%
100%
Labo
rato
ry U
se %
8:00
AM
9:30
AM
11:0
0AM
12:3
0PM
2:00
PM
3:30
PM
5:00
PM
6:30
PM
8:00
PM
9:00
PM
Time of Day
Thursday
Paulien & Associates , Inc.Page 88

Paulien & Associates, Inc. Page 89
APPENDIX G LIST OF LABORATORY ROOM USE CODE ADJUSTMENTS

University of VermontTeaching Laboratories
ROOM ID ASFORIG ROOM USE CODE
ROOM USE CODE
1 AG ENGR 114 2565 2102 AIKEN 202 611 2103 AIKEN 222 599 2104 CARRIGAN 012 737 2105 CARRIGAN 100A 402 210 0116 CARRIGAN 101 243 210 2157 CARRIGAN 211 25 210 2158 COOK A105 1001 2109 COOK A108 239 210 25510 COOK A113 1001 210 25011 COOK A142 1001 21012 COOK A240 1001 21013 COOK A241 1001 21014 COOK A242 1001 21015 COOK A305 1003 21016 COOK A313 1003 21017 COOK A338 1003 21018 COOK A339 1003 21019 COOK A340 1003 21020 COOK A341 1003 21021 COOK A409 1001 21022 COOK A410 1001 21023 COOK A418 1001 210
DEWEY 241 453 220 21024 GIVEN A A255 494 210 21525 GIVEN A A287 2454 21026 GIVEN E E401 1968 21027 GIVEN E E401A 774 21028 GIVEN E E406 353 210 21529 HILLS 017 763 21030 HILLS 020 918 21031 HILLS 021 675 21032 HILLS 122 1134 21033 HILLS 128 858 21034 HILLS 133 585 21035 HILLS 134 167 210 21536 HILLS 228 560 21037 LIFE SCI 104 702 210 25038 LIFE SCI 112 702 21039 LIFE SCI 114 702 21040 LIFE SCI 131 713 21041 LIFE SCI 202 733 21042 LIFE SCI 304 724 21043 LIFE SCI 316 724 21044 MORRILL 005 749 21045 PAT GYM 006 706 210
Paulien & Associates, Inc.Page 90

University of VermontTeaching Laboratories
ROOM ID ASFORIG ROOM USE CODE
ROOM USE CODE
46 PERKINS 101 1076 21047 PERKINS 102 930 210 25048 PERKINS 108 523 21049 PERKINS 204 576 210
ROWELL 003 2476 011 21050 ROWELL 017 314 21051 ROWELL 018 312 21052 ROWELL 113 1122 21053 ROWELL 237 1153 21054 ROWELL 313 1424 21055 ROWELL 318 1157 21056 SOUTHWICK 200B 1124 21057 STAFFORD 102 1294 21058 STAFFORD 103 1187 21059 STAFFORD 104 1259 21060 STAFFORD 114A 138 210 21561 STAFFORD B011 250 210 25562 STAFFORD B012 212 210 215
TERRILL 200 772 220 21063 TERRILL 205 810 210 25064 TERRILL 301 540 210 25065 TERRILL 306 477 210 25066 TERRILL 307 754 21067 TERRILL 312 198 210 250
VOTEY 122 1637 220 210VOTEY 206B 376 220 210
68 VOTEY 227 390 210 25069 VOTEY 229 555 21070 VOTEY 246 1046 21071 VOTEY 308B 563 21072 VOTEY 312 562 21073 VOTEY 328 565 21074 VOTEY 330 200 21075 VOTEY 334 747 21076 VOTEY 371 768 210 31077 WATERMAN 124 416 210 08178 WATERMAN 539 1165 21079 WILLIAMS 106 1760 21080 WILLIAMS 111 324 210 22081 WILLIAMS 112 998 21082 WILLIAMS 202 520 210 22083 WILLIAMS 206 844 210 22084 WILLIAMS 207 828 21085 WILLIAMS 213 1760 21086 WILLIAMS 305 944 21087 WILLIAMS 309 1760 210
Paulien & Associates, Inc.Page 91

University of VermontTeaching Laboratories
ROOM ID ASFORIG ROOM USE CODE
ROOM USE CODE
88 WILLIAMS 416 1736 21089 WILLIAMS 505 303 210 21590 WILLIAMS 506 769 21091 WILLIAMS 507 110 210 21592 WILLIAMS 507A 150 210 21593 WILLIAMS 507B 8 210 21594 WILLIAMS 507C 8 210 21595 WILLIAMS 507D 15 210 215
Non-classroom Room Use Codes011: Rental Property, The University of Vermont as Lessor081: Inactive Space215: Teaching Laboratory Service220: Open Laboratory250: Research Laboratory255: Research Laboratory Service310: Offices
Paulien & Associates, Inc.Page 92