classifier performance evaluation and comparison - icmla
TRANSCRIPT
logo
Classifier performance evaluation and comparison
Classifier performance evaluation andcomparison
Jose A. Lozano, Guzmán Santafé, Iñaki Inza
Intelligent Systems GroupThe University of the Basque Country
International Conference on Machine Learning and Applications (ICMLA 2010)December 12-14, 2010
- 1 -
logo
Classifier performance evaluation and comparison
Outline of the Tutorial
1 Introduction
2 Scores
3 Estimation Methods
4 Hypothesis Testing
- 2 -
logo
Classifier performance evaluation and comparison
Introduction
Outline of the Tutorial
1 Introduction
2 Scores
3 Estimation Methods
4 Hypothesis Testing
- 3 -
logo
Classifier performance evaluation and comparison
Introduction
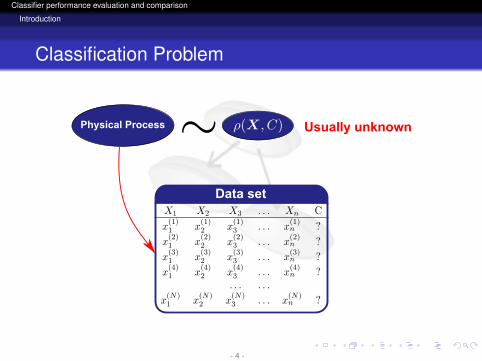
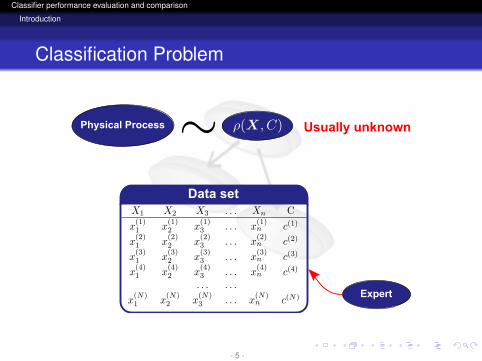
Classification Problem
Physical Process Usually unknown
Data set
- 4 -
logo
Classifier performance evaluation and comparison
Introduction
Classification Problem
Physical Process Usually unknown
Expert
Data set
- 5 -
logo
Classifier performance evaluation and comparison
Introduction
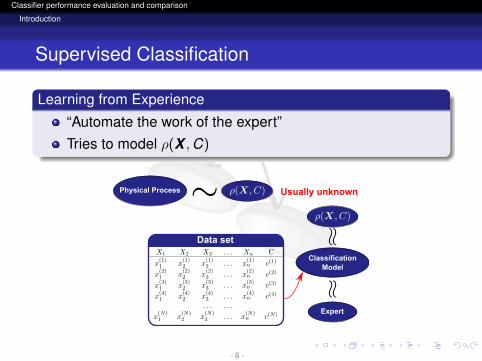
Supervised Classification
Learning from Experience
“Automate the work of the expert”Tries to model ρ(X ,C)
Physical Process Usually unknown
Expert
Data set
ClassificationModel
- 6 -
logo
Classifier performance evaluation and comparison
Introduction
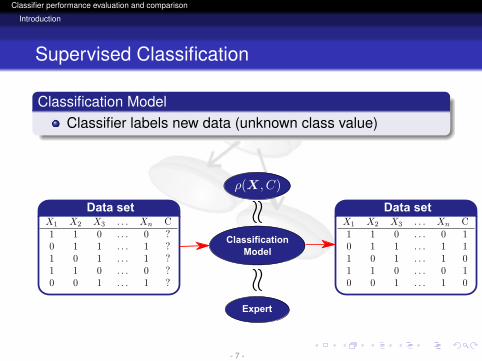
Supervised Classification
Classification ModelClassifier labels new data (unknown class value)
Expert
ClassificationModel
Data setData set
- 7 -
logo
Classifier performance evaluation and comparison
Introduction
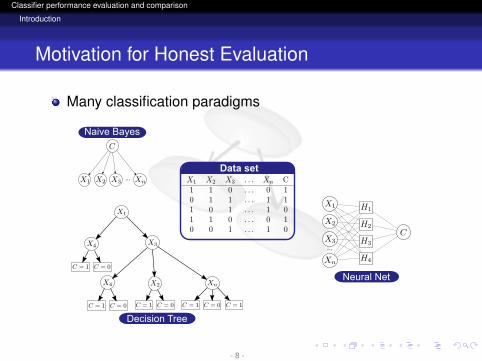
Motivation for Honest Evaluation
Many classification paradigms
Data set...
X4X4X4...
Naive Bayes
Decision Tree
Neural Net
- 8 -
logo
Classifier performance evaluation and comparison
Introduction
Motivation for Honest Evaluation
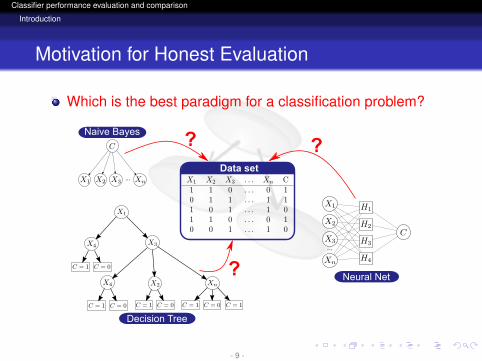
Which is the best paradigm for a classification problem?
Data set...
X4X4X4...
Naive Bayes
Decision Tree
Neural Net
? ?
?
- 9 -
logo
Classifier performance evaluation and comparison
Introduction
Motivation for Honest Evaluation
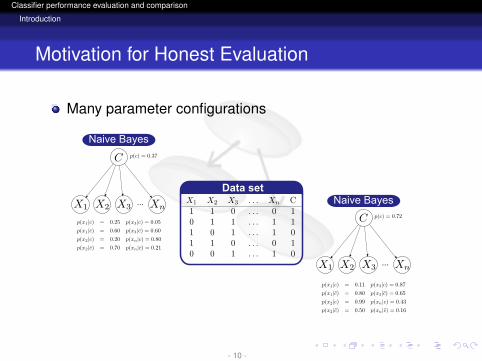
Many parameter configurations
Data set...
...
Naive Bayes
Naive Bayes
- 10 -
logo
Classifier performance evaluation and comparison
Introduction
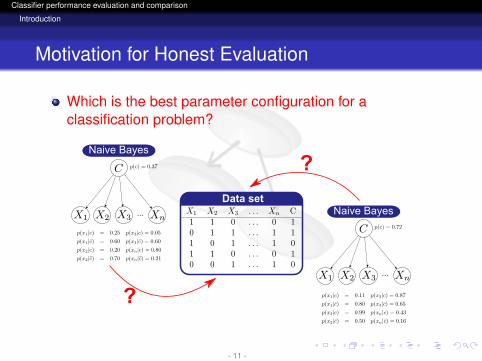
Motivation for Honest Evaluation
Which is the best parameter configuration for aclassification problem?
Data set...
...
Naive Bayes
Naive Bayes
?
?
- 11 -
logo
Classifier performance evaluation and comparison
Introduction
Motivation for Honest Evaluation
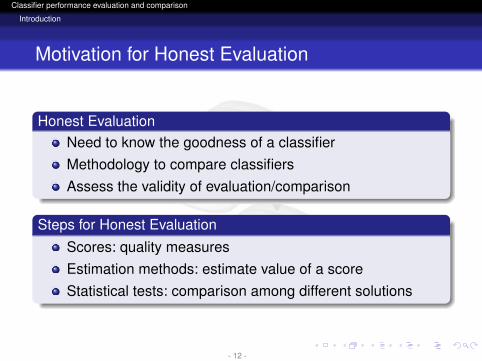
Honest EvaluationNeed to know the goodness of a classifierMethodology to compare classifiersAssess the validity of evaluation/comparison
Steps for Honest EvaluationScores: quality measuresEstimation methods: estimate value of a scoreStatistical tests: comparison among different solutions
- 12 -
logo
Classifier performance evaluation and comparison
Scores
Outline of the Tutorial
1 Introduction
2 Scores
3 Estimation Methods
4 Hypothesis Testing
- 13 -
logo
Classifier performance evaluation and comparison
Scores
Motivation
How to compare classification models?
ScoreFunction that provides a quality measure for a classifier whensolving a classification problem
- 14 -
logo
Classifier performance evaluation and comparison
Scores
Motivation
How to compare classification models?
We need some way to measure
the classification performance!!!
ScoreFunction that provides a quality measure for a classifier whensolving a classification problem
- 15 -
logo
Classifier performance evaluation and comparison
Scores
Motivation
How to compare classification models?
We need some way to measure
the classification performance!!!
ScoreFunction that provides a quality measure for a classifier whensolving a classification problem
- 16 -
logo
Classifier performance evaluation and comparison
Scores
Motivation
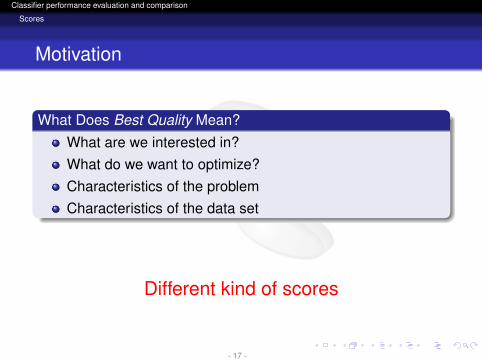
What Does Best Quality Mean?What are we interested in?What do we want to optimize?Characteristics of the problemCharacteristics of the data set
Different kind of scores
- 17 -
logo
Classifier performance evaluation and comparison
Scores
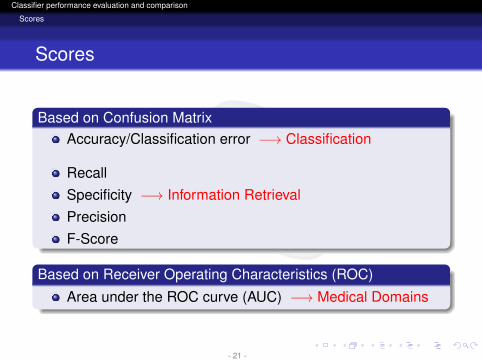
Scores
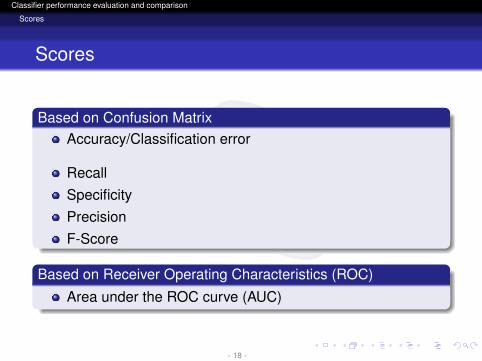
Based on Confusion MatrixAccuracy/Classification error
RecallSpecificityPrecisionF-Score
Based on Receiver Operating Characteristics (ROC)
Area under the ROC curve (AUC)
- 18 -
logo
Classifier performance evaluation and comparison
Scores
Scores
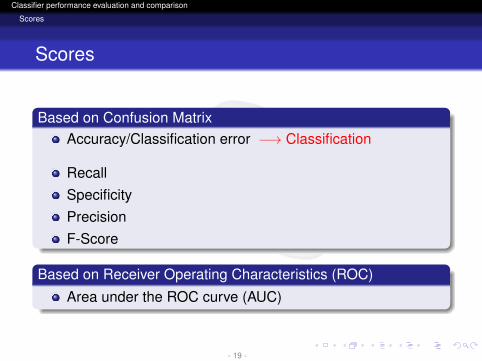
Based on Confusion MatrixAccuracy/Classification error −→ Classification
RecallSpecificityPrecisionF-Score
Based on Receiver Operating Characteristics (ROC)
Area under the ROC curve (AUC)
- 19 -
logo
Classifier performance evaluation and comparison
Scores
Scores
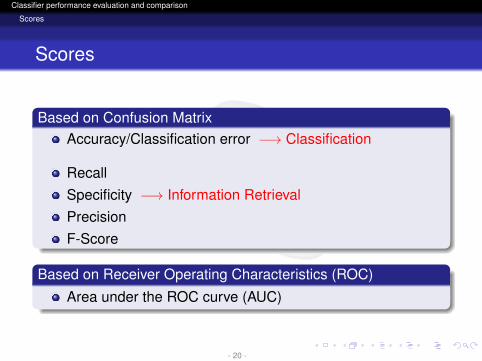
Based on Confusion MatrixAccuracy/Classification error −→ Classification
RecallSpecificity −→ Information RetrievalPrecisionF-Score
Based on Receiver Operating Characteristics (ROC)
Area under the ROC curve (AUC)
- 20 -
logo
Classifier performance evaluation and comparison
Scores
Scores
Based on Confusion MatrixAccuracy/Classification error −→ Classification
RecallSpecificity −→ Information RetrievalPrecisionF-Score
Based on Receiver Operating Characteristics (ROC)
Area under the ROC curve (AUC) −→ Medical Domains
- 21 -
logo
Classifier performance evaluation and comparison
Scores
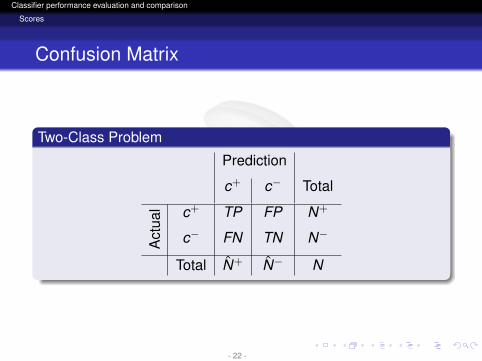
Confusion Matrix
Two-Class Problem
Prediction
c+ c− Total
Act
ual c+ TP FP N+
c− FN TN N−
Total N+ N− N
- 22 -
logo
Classifier performance evaluation and comparison
Scores
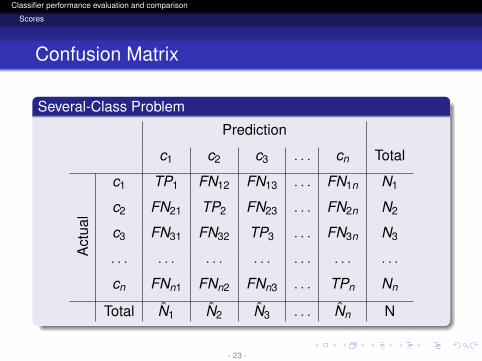
Confusion Matrix
Several-Class Problem
Prediction
c1 c2 c3 . . . cn Total
Act
ual
c1 TP1 FN12 FN13 . . . FN1n N1
c2 FN21 TP2 FN23 . . . FN2n N2
c3 FN31 FN32 TP3 . . . FN3n N3
. . . . . . . . . . . . . . . . . . . . .
cn FNn1 FNn2 FNn3 . . . TPn Nn
Total N1 N2 N3 . . . Nn N
- 23 -
logo
Classifier performance evaluation and comparison
Scores
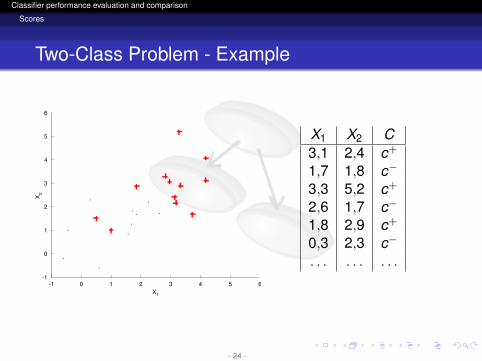
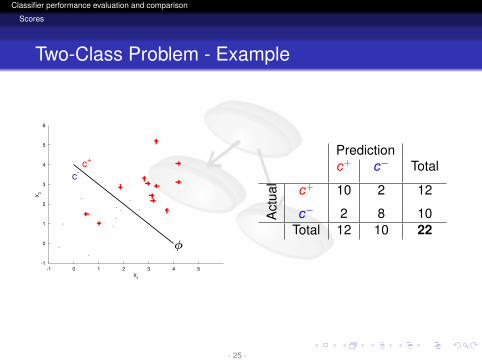
Two-Class Problem - Example
X1
X2
-1 0 1 2 3 4 5 6-1
0
1
2
3
4
5
6
X1 X2 C3,1 2,4 c+
1,7 1,8 c−
3,3 5,2 c+
2,6 1,7 c−
1,8 2,9 c+
0,3 2,3 c−
. . . . . . . . .
- 24 -
logo
Classifier performance evaluation and comparison
Scores
Two-Class Problem - Example
X1
X2
c+
c-
-1 0 1 2 3 4 5-1
0
1
2
3
4
5
6
Predictionc+ c− Total
Act
ual c+ 10 2 12
c− 2 8 10Total 12 10 22
- 25 -
logo
Classifier performance evaluation and comparison
Scores
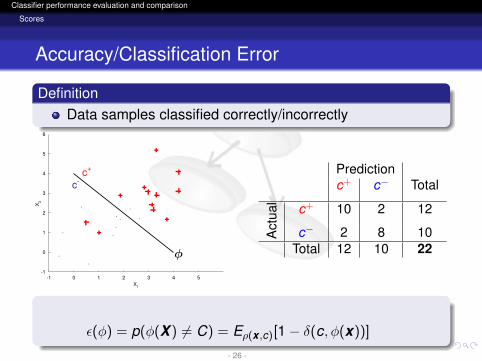
Accuracy/Classification Error
DefinitionData samples classified correctly/incorrectly
X1
X2
c+
c-
-1 0 1 2 3 4 5-1
0
1
2
3
4
5
6
Predictionc+ c− Total
Act
ual c+ 10 2 12
c− 2 8 10Total 12 10 22
ε(φ) = p(φ(X ) 6= C) = Eρ(x ,c)[1− δ(c, φ(x))]
- 26 -
logo
Classifier performance evaluation and comparison
Scores
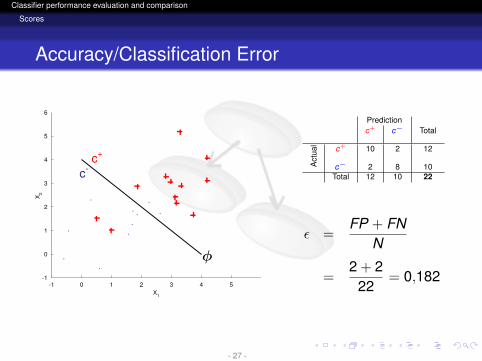
Accuracy/Classification Error
X1
X2
c+
c-
-1 0 1 2 3 4 5-1
0
1
2
3
4
5
6
Predictionc+ c− Total
Act
ual c+ 10 2 12
c− 2 8 10Total 12 10 22
ε =FP + FN
N
=2 + 2
22= 0,182
- 27 -
logo
Classifier performance evaluation and comparison
Scores
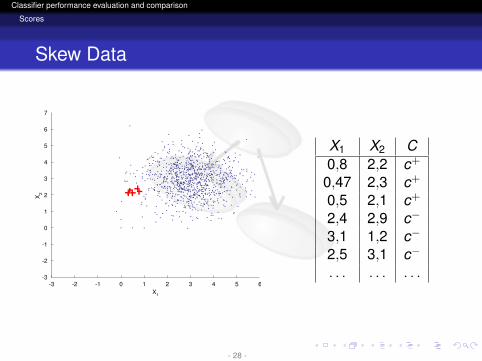
Skew Data
X1
X2
-3 -2 -1 0 1 2 3 4 5 6-3
-2
-1
0
1
2
3
4
5
6
7
X1 X2 C0,8 2,2 c+
0,47 2,3 c+
0,5 2,1 c+
2,4 2,9 c−
3,1 1,2 c−
2,5 3,1 c−
. . . . . . . . .
- 28 -
logo
Classifier performance evaluation and comparison
Scores
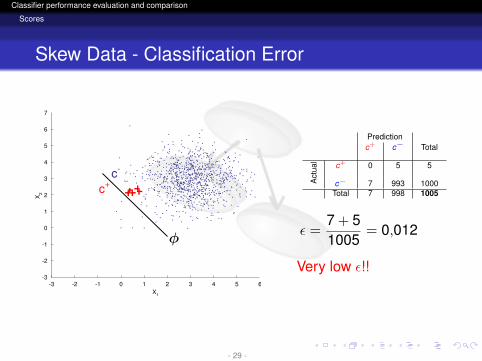
Skew Data - Classification Error
X1
X2
c-
c+
-3 -2 -1 0 1 2 3 4 5 6-3
-2
-1
0
1
2
3
4
5
6
7
Predictionc+ c− Total
Act
ual c+ 0 5 5
c− 7 993 1000Total 7 998 1005
ε =7 + 51005
= 0,012
Very low ε!!
- 29 -
logo
Classifier performance evaluation and comparison
Scores
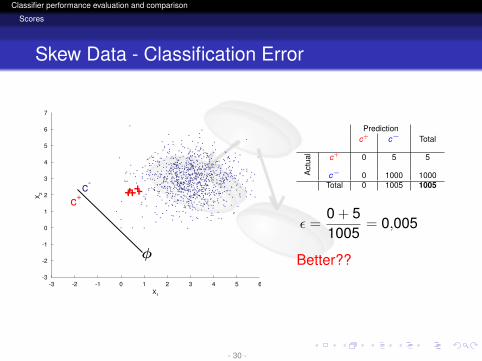
Skew Data - Classification Error
X1
X2
c-
c+
-3 -2 -1 0 1 2 3 4 5 6-3
-2
-1
0
1
2
3
4
5
6
7
Predictionc+ c− Total
Act
ual c+ 0 5 5
c− 0 1000 1000Total 0 1005 1005
ε =0 + 51005
= 0,005
Better??
- 30 -
logo
Classifier performance evaluation and comparison
Scores
Positive Unlabeled Learning
? ?
?
?
?
?
??
?
?
?
?
??
?
?
?
X1
X2
-1 0 1 2 3 4 5-1
0
1
2
3
4
5
6
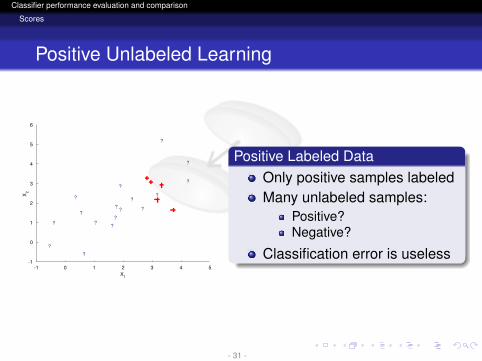
Positive Labeled DataOnly positive samples labeledMany unlabeled samples:
Positive?Negative?
Classification error is useless
- 31 -
logo
Classifier performance evaluation and comparison
Scores
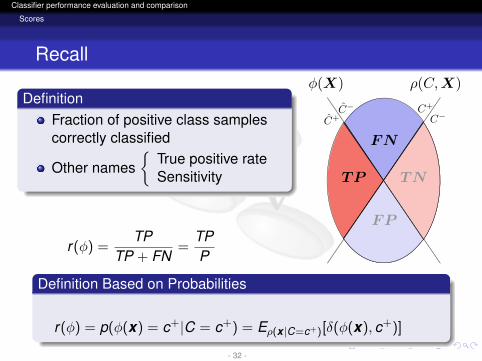
Recall
DefinitionFraction of positive class samplescorrectly classified
Other names{
True positive rateSensitivity
r(φ) =TP
TP + FN=
TPP
Definition Based on Probabilities
r(φ) = p(φ(x) = c+|C = c+) = Eρ(x |C=c+)[δ(φ(x), c+)]
- 32 -
logo
Classifier performance evaluation and comparison
Scores
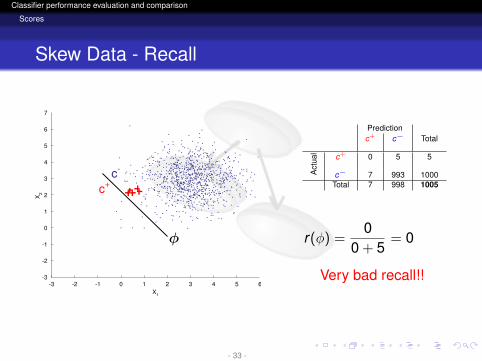
Skew Data - Recall
X1
X2
c-
c+
-3 -2 -1 0 1 2 3 4 5 6-3
-2
-1
0
1
2
3
4
5
6
7
Predictionc+ c− Total
Act
ual c+ 0 5 5
c− 7 993 1000Total 7 998 1005
r(φ) =0
0 + 5= 0
Very bad recall!!
- 33 -
logo
Classifier performance evaluation and comparison
Scores
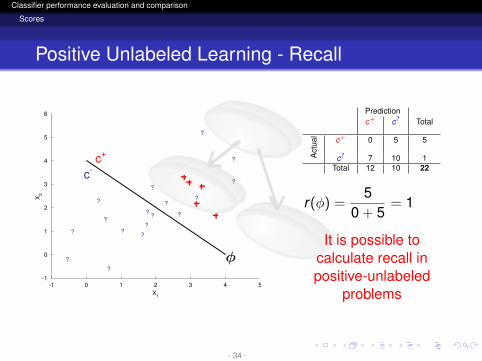
Positive Unlabeled Learning - Recall
? ?
?
?
?
?
??
?
?
?
?
??
?
?
?
X1
X2
c+
c-
-1 0 1 2 3 4 5-1
0
1
2
3
4
5
6 Predictionc+ c? Total
Act
ual c+ 0 5 5
c? 7 10 1Total 12 10 22
r(φ) =5
0 + 5= 1
It is possible tocalculate recall inpositive-unlabeled
problems
- 34 -
logo
Classifier performance evaluation and comparison
Scores
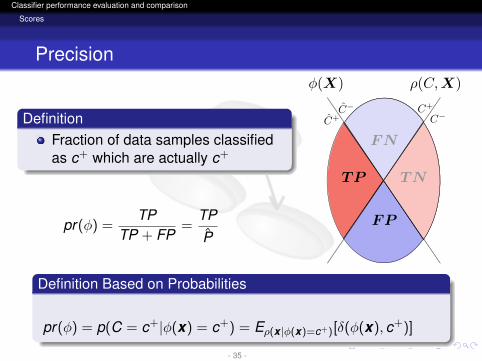
Precision
DefinitionFraction of data samples classifiedas c+ which are actually c+
pr(φ) =TP
TP + FP=
TPP
Definition Based on Probabilities
pr(φ) = p(C = c+|φ(x) = c+) = Eρ(x |φ(x)=c+)[δ(φ(x), c+)]
- 35 -
logo
Classifier performance evaluation and comparison
Scores
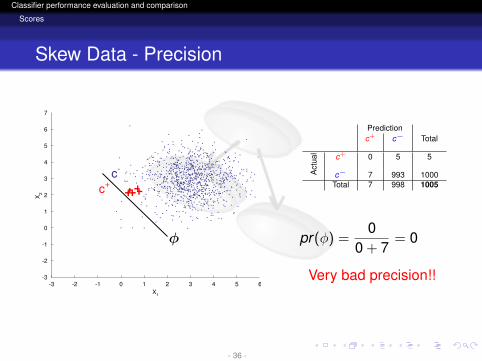
Skew Data - Precision
X1
X2
c-
c+
-3 -2 -1 0 1 2 3 4 5 6-3
-2
-1
0
1
2
3
4
5
6
7
Predictionc+ c− Total
Act
ual c+ 0 5 5
c− 7 993 1000Total 7 998 1005
pr(φ) =0
0 + 7= 0
Very bad precision!!
- 36 -
logo
Classifier performance evaluation and comparison
Scores
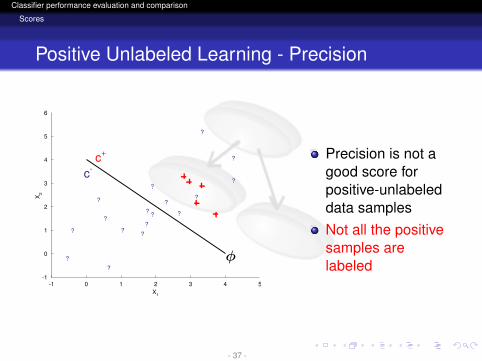
Positive Unlabeled Learning - Precision
? ?
?
?
?
?
??
?
?
?
?
??
?
?
?
X1
X2
c+
c-
-1 0 1 2 3 4 5-1
0
1
2
3
4
5
6
Precision is not agood score forpositive-unlabeleddata samplesNot all the positivesamples arelabeled
- 37 -
logo
Classifier performance evaluation and comparison
Scores
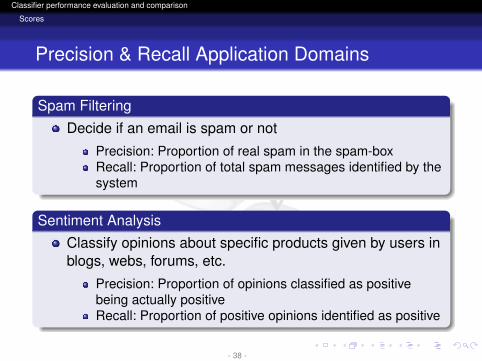
Precision & Recall Application Domains
Spam Filtering
Decide if an email is spam or not
Precision: Proportion of real spam in the spam-boxRecall: Proportion of total spam messages identified by thesystem
Sentiment AnalysisClassify opinions about specific products given by users inblogs, webs, forums, etc.
Precision: Proportion of opinions classified as positivebeing actually positiveRecall: Proportion of positive opinions identified as positive
- 38 -
logo
Classifier performance evaluation and comparison
Scores
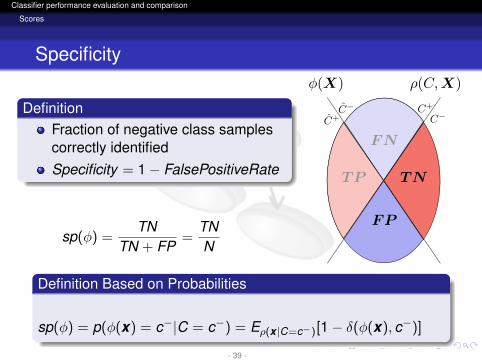
Specificity
DefinitionFraction of negative class samplescorrectly identifiedSpecificity = 1− FalsePositiveRate
sp(φ) =TN
TN + FP=
TNN
Definition Based on Probabilities
sp(φ) = p(φ(x) = c−|C = c−) = Eρ(x |C=c−)[1− δ(φ(x), c−)]
- 39 -
logo
Classifier performance evaluation and comparison
Scores
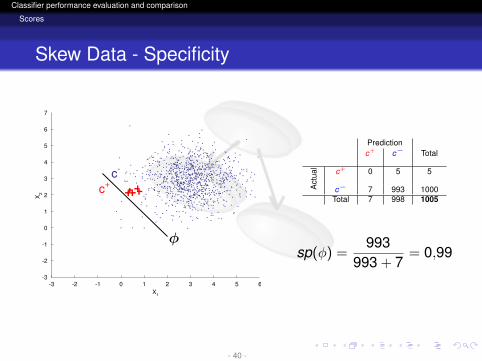
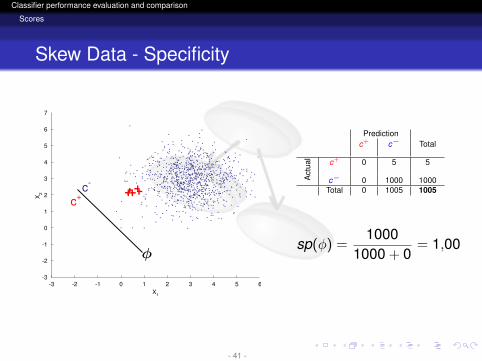
Skew Data - Specificity
X1
X2
c-
c+
-3 -2 -1 0 1 2 3 4 5 6-3
-2
-1
0
1
2
3
4
5
6
7
Predictionc+ c− Total
Act
ual c+ 0 5 5
c− 7 993 1000Total 7 998 1005
sp(φ) =993
993 + 7= 0,99
- 40 -
logo
Classifier performance evaluation and comparison
Scores
Skew Data - Specificity
X1
X2
c-
c+
-3 -2 -1 0 1 2 3 4 5 6-3
-2
-1
0
1
2
3
4
5
6
7
Predictionc+ c− Total
Act
ual c+ 0 5 5
c− 0 1000 1000Total 0 1005 1005
sp(φ) =1000
1000 + 0= 1,00
- 41 -
logo
Classifier performance evaluation and comparison
Scores
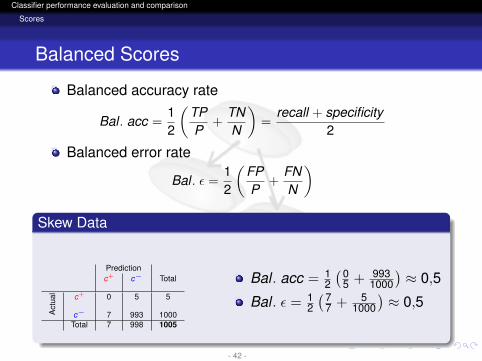
Balanced Scores
Balanced accuracy rate
Bal . acc =12
(TPP
+TNN
)=
recall + specificity2
Balanced error rate
Bal . ε =12
(FPP
+FNN
)Skew Data
Predictionc+ c− Total
Act
ual c+ 0 5 5
c− 7 993 1000Total 7 998 1005
Bal . acc = 12
(05 + 993
1000
)≈ 0,5
Bal . ε = 12
(77 + 5
1000
)≈ 0,5
- 42 -
logo
Classifier performance evaluation and comparison
Scores
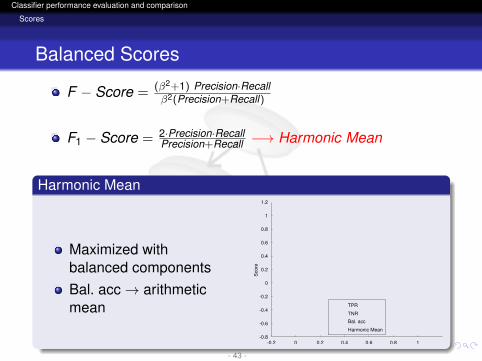
Balanced Scores
F − Score = (β2+1) Precision·Recallβ2(Precision+Recall)
F1 − Score = 2·Precision·RecallPrecision+Recall −→ Harmonic Mean
Harmonic Mean
Maximized withbalanced componentsBal. acc→ arithmeticmean
Sco
re
-0.2 0 0.2 0.4 0.6 0.8 1-0.8
-0.6
-0.4
-0.2
0
0.2
0.4
0.6
0.8
1
1.2
TPR
TNR
Bal. acc
Harmonic Mean
- 43 -
logo
Classifier performance evaluation and comparison
Scores
Classification Cost
All misclassifications cannot be equally considered
E.g. Medical Diagnosis ProblemDoes not have the same cost as diagnosing a healthy patientas ill rather than diagnosing an ill patient as healthy
Classification ModelMay be of interest to minimize the expected cost instead theclassification error
- 44 -
logo
Classifier performance evaluation and comparison
Scores
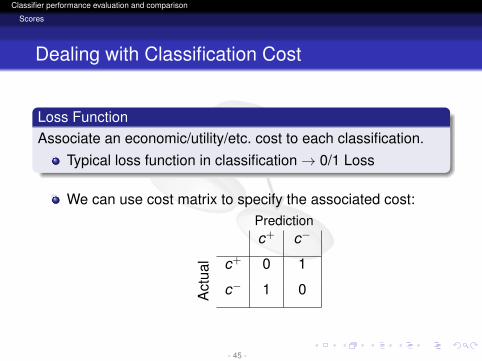
Dealing with Classification Cost
Loss FunctionAssociate an economic/utility/etc. cost to each classification.
Typical loss function in classification→ 0/1 Loss
We can use cost matrix to specify the associated cost:Predictionc+ c−
Act
ual c+ 0 1
c− 1 0
- 45 -
logo
Classifier performance evaluation and comparison
Scores
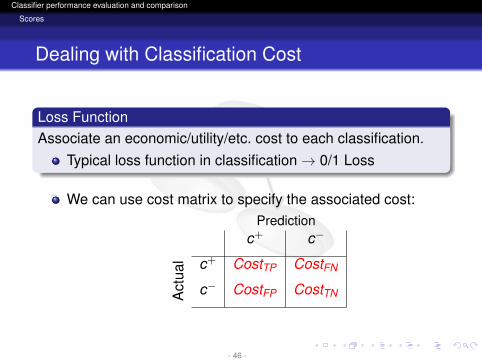
Dealing with Classification Cost
Loss FunctionAssociate an economic/utility/etc. cost to each classification.
Typical loss function in classification→ 0/1 Loss
We can use cost matrix to specify the associated cost:Prediction
c+ c−
Act
ual c+ CostTP CostFN
c− CostFP CostTN
- 46 -
logo
Classifier performance evaluation and comparison
Scores
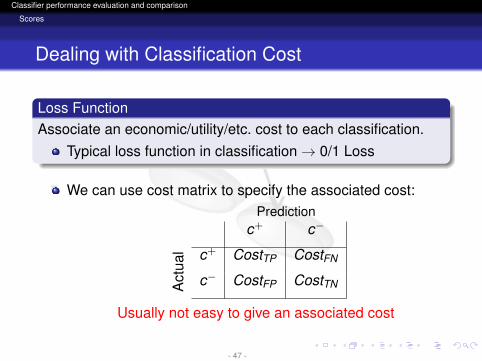
Dealing with Classification Cost
Loss FunctionAssociate an economic/utility/etc. cost to each classification.
Typical loss function in classification→ 0/1 Loss
We can use cost matrix to specify the associated cost:Prediction
c+ c−
Act
ual c+ CostTP CostFN
c− CostFP CostTN
Usually not easy to give an associated cost
- 47 -
logo
Classifier performance evaluation and comparison
Scores
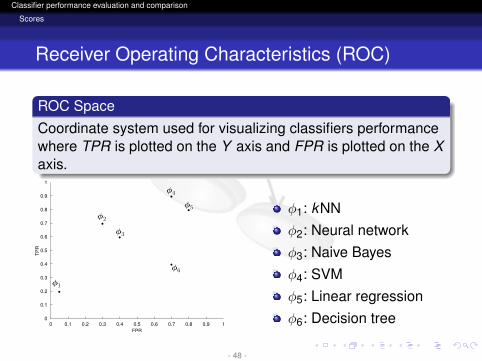
Receiver Operating Characteristics (ROC)
ROC SpaceCoordinate system used for visualizing classifiers performancewhere TPR is plotted on the Y axis and FPR is plotted on the Xaxis.
FPR
TP
R
0 0.1 0.2 0.3 0.4 0.5 0.6 0.7 0.8 0.9 10
0.1
0.2
0.3
0.4
0.5
0.6
0.7
0.8
0.9
1
φ1: kNNφ2: Neural networkφ3: Naive Bayesφ4: SVMφ5: Linear regressionφ6: Decision tree
- 48 -
logo
Classifier performance evaluation and comparison
Scores
Receiver Operating Characteristics (ROC)
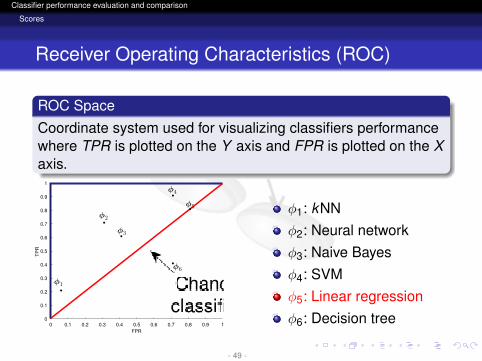
ROC SpaceCoordinate system used for visualizing classifiers performancewhere TPR is plotted on the Y axis and FPR is plotted on the Xaxis.
FPR
TP
R
0 0.1 0.2 0.3 0.4 0.5 0.6 0.7 0.8 0.9 10
0.1
0.2
0.3
0.4
0.5
0.6
0.7
0.8
0.9
1
φ1: kNNφ2: Neural networkφ3: Naive Bayesφ4: SVMφ5: Linear regressionφ6: Decision tree
- 49 -
logo
Classifier performance evaluation and comparison
Scores
Receiver Operating Characteristics (ROC)
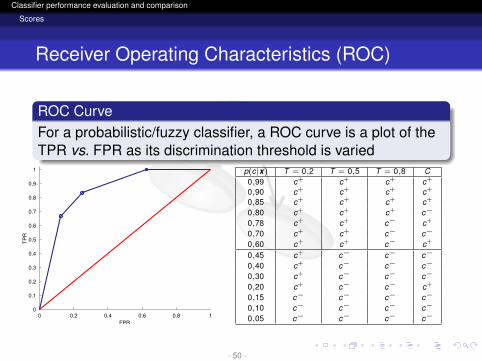
ROC CurveFor a probabilistic/fuzzy classifier, a ROC curve is a plot of theTPR vs. FPR as its discrimination threshold is varied
FPR
TP
R
0 0.2 0.4 0.6 0.8 10
0.1
0.2
0.3
0.4
0.5
0.6
0.7
0.8
0.9
1 p(c|x) T = 0,2 T = 0,5 T = 0,8 C0,99 c+ c+ c+ c+
0,90 c+ c+ c+ c+
0,85 c+ c+ c+ c+
0,80 c+ c+ c+ c−
0,78 c+ c+ c− c+
0,70 c+ c+ c− c−
0,60 c+ c+ c− c+
0,45 c+ c− c− c−
0,40 c+ c− c− c−
0,30 c+ c− c− c−
0,20 c+ c− c− c+
0,15 c− c− c− c−
0,10 c− c− c− c−
0,05 c− c− c− c−
- 50 -
logo
Classifier performance evaluation and comparison
Scores
Receiver Operating Characteristics (ROC)
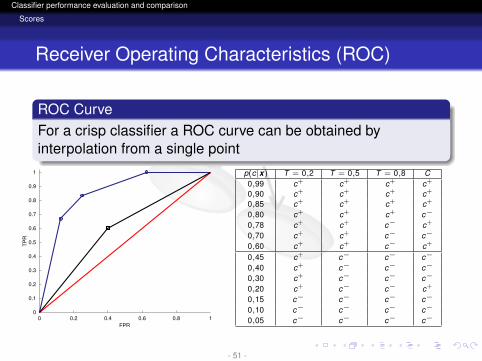
ROC CurveFor a crisp classifier a ROC curve can be obtained byinterpolation from a single point
FPR
TP
R
0 0.2 0.4 0.6 0.8 10
0.1
0.2
0.3
0.4
0.5
0.6
0.7
0.8
0.9
1 p(c|x) T = 0,2 T = 0,5 T = 0,8 C0,99 c+ c+ c+ c+
0,90 c+ c+ c+ c+
0,85 c+ c+ c+ c+
0,80 c+ c+ c+ c−
0,78 c+ c+ c− c+
0,70 c+ c+ c− c−
0,60 c+ c+ c− c+
0,45 c+ c− c− c−
0,40 c+ c− c− c−
0,30 c+ c− c− c−
0,20 c+ c− c− c+
0,15 c− c− c− c−
0,10 c− c− c− c−
0,05 c− c− c− c−
- 51 -
logo
Classifier performance evaluation and comparison
Scores
Receiver Operating Characteristics (ROC)
ROC CurveInsensitive to skew class distributionInsensitive to misclassification cost
Dominance RelationshipA ROC curve A dominates another ROC curve B if A is alwaysabove and to the left of B in the plot
- 52 -
logo
Classifier performance evaluation and comparison
Scores
Receiver Operating Characteristics (ROC)
ROC CurveInsensitive to skew class distributionInsensitive to misclassification cost
Dominance RelationshipA ROC curve A dominates another ROC curve B if A is alwaysabove and to the left of B in the plot
- 53 -
logo
Classifier performance evaluation and comparison
Scores
Receiver Operating Characteristics (ROC)
FPR
TP
R
AB
0 0.2 0.4 0.6 0.8 10
0.1
0.2
0.3
0.4
0.5
0.6
0.7
0.8
0.9
1
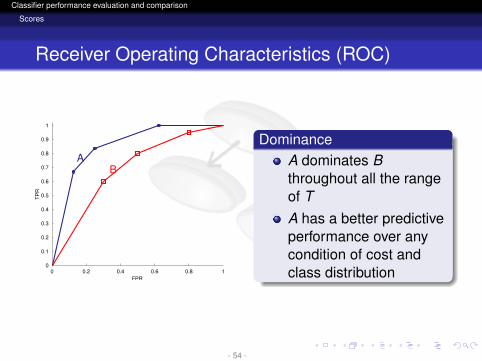
DominanceA dominates Bthroughout all the rangeof TA has a better predictiveperformance over anycondition of cost andclass distribution
- 54 -
logo
Classifier performance evaluation and comparison
Scores
Receiver Operating Characteristics (ROC)
B
A
0 0.1 0.2 0.3 0.4 0.5 0.6 0.7 0.8 0.9 10
0.1
0.2
0.3
0.4
0.5
0.6
0.7
0.8
0.9
1
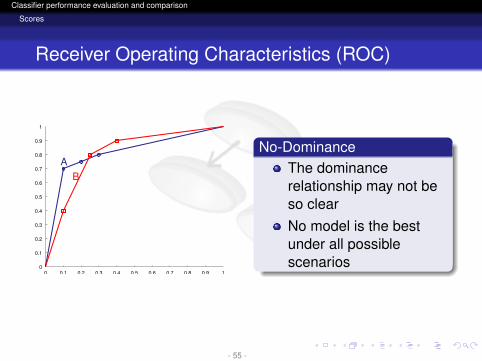
No-DominanceThe dominancerelationship may not beso clearNo model is the bestunder all possiblescenarios
- 55 -
logo
Classifier performance evaluation and comparison
Scores
Receiver Operating Characteristics (ROC)
A
B
0 0.1 0.2 0.3 0.4 0.5 0.6 0.7 0.8 0.9 10
0.1
0.2
0.3
0.4
0.5
0.6
0.7
0.8
0.9
1
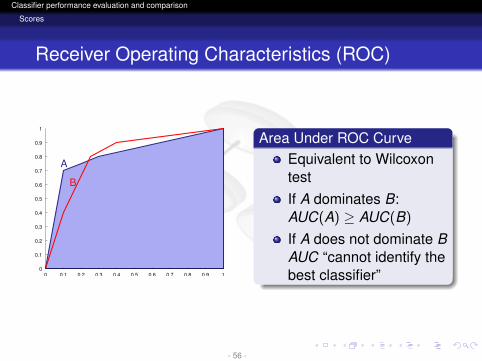
Area Under ROC CurveEquivalent to WilcoxontestIf A dominates B:AUC(A) ≥ AUC(B)
If A does not dominate BAUC “cannot identify thebest classifier”
- 56 -

logo
Classifier performance evaluation and comparison
Scores
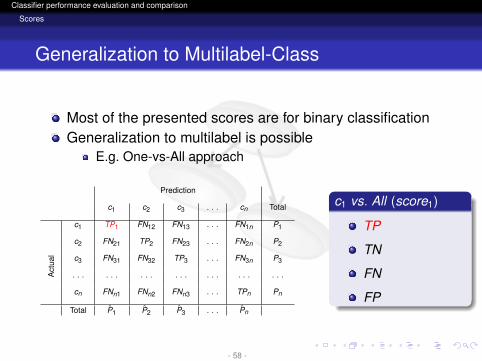
Generalization to Multilabel-Class
Most of the presented scores are for binary classificationGeneralization to multilabel is possible
E.g. One-vs-All approach
Prediction
c1 c2 c3 . . . cn Total
Act
ual
c1 TP1 FN12 FN13 . . . FN1n P1
c2 FN21 TP2 FN23 . . . FN2n P2
c3 FN31 FN32 TP3 . . . FN3n P3
. . . . . . . . . . . . . . . . . . . . .
cn FNn1 FNn2 FNn3 . . . TPn Pn
Total P1 P2 P3 . . . Pn
c1 vs. All (score1)
TP
TN
FN
FP
- 57 -
logo
Classifier performance evaluation and comparison
Scores
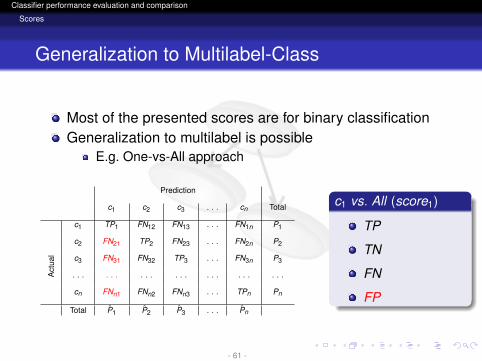
Generalization to Multilabel-Class
Most of the presented scores are for binary classificationGeneralization to multilabel is possible
E.g. One-vs-All approach
Prediction
c1 c2 c3 . . . cn Total
Act
ual
c1 TP1 FN12 FN13 . . . FN1n P1
c2 FN21 TP2 FN23 . . . FN2n P2
c3 FN31 FN32 TP3 . . . FN3n P3
. . . . . . . . . . . . . . . . . . . . .
cn FNn1 FNn2 FNn3 . . . TPn Pn
Total P1 P2 P3 . . . Pn
c1 vs. All (score1)
TP
TN
FN
FP
- 58 -

logo
Classifier performance evaluation and comparison
Scores
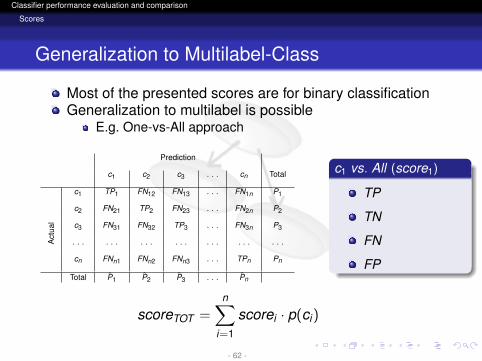
Generalization to Multilabel-Class
Most of the presented scores are for binary classificationGeneralization to multilabel is possible
E.g. One-vs-All approach
Prediction
c1 c2 c3 . . . cn Total
Act
ual
c1 TP1 FN12 FN13 . . . FN1n P1
c2 FN21 TP2 FN23 . . . FN2n P2
c3 FN31 FN32 TP3 . . . FN3n P3
. . . . . . . . . . . . . . . . . . . . .
cn FNn1 FNn2 FNn3 . . . TPn Pn
Total P1 P2 P3 . . . Pn
c1 vs. All (score1)
TP
TN
FN
FP
- 59 -

logo
Classifier performance evaluation and comparison
Scores
Generalization to Multilabel-Class
Most of the presented scores are for binary classificationGeneralization to multilabel is possible
E.g. One-vs-All approach
Prediction
c1 c2 c3 . . . cn Total
Act
ual
c1 TP1 FN12 FN13 . . . FN1n P1
c2 FN21 TP2 FN23 . . . FN2n P2
c3 FN31 FN32 TP3 . . . FN3n P3
. . . . . . . . . . . . . . . . . . . . .
cn FNn1 FNn2 FNn3 . . . TPn Pn
Total P1 P2 P3 . . . Pn
c1 vs. All (score1)
TP
TN
FN
FP
- 60 -
logo
Classifier performance evaluation and comparison
Scores
Generalization to Multilabel-Class
Most of the presented scores are for binary classificationGeneralization to multilabel is possible
E.g. One-vs-All approach
Prediction
c1 c2 c3 . . . cn Total
Act
ual
c1 TP1 FN12 FN13 . . . FN1n P1
c2 FN21 TP2 FN23 . . . FN2n P2
c3 FN31 FN32 TP3 . . . FN3n P3
. . . . . . . . . . . . . . . . . . . . .
cn FNn1 FNn2 FNn3 . . . TPn Pn
Total P1 P2 P3 . . . Pn
c1 vs. All (score1)
TP
TN
FN
FP
- 61 -
logo
Classifier performance evaluation and comparison
Scores
Generalization to Multilabel-Class
Most of the presented scores are for binary classificationGeneralization to multilabel is possible
E.g. One-vs-All approach
Prediction
c1 c2 c3 . . . cn Total
Act
ual
c1 TP1 FN12 FN13 . . . FN1n P1
c2 FN21 TP2 FN23 . . . FN2n P2
c3 FN31 FN32 TP3 . . . FN3n P3
. . . . . . . . . . . . . . . . . . . . .
cn FNn1 FNn2 FNn3 . . . TPn Pn
Total P1 P2 P3 . . . Pn
c1 vs. All (score1)
TP
TN
FN
FP
scoreTOT =n∑
i=1
scorei · p(ci)
- 62 -
logo
Classifier performance evaluation and comparison
Scores
Scores
The Use of a Specific Score Depends on:Application domainCharacteristics of the problemCharacteristics of the data setOur interest when solving the problemetc.
- 63 -
logo
Classifier performance evaluation and comparison
Estimation Methods
Outline of the Tutorial
1 Introduction
2 Scores
3 Estimation Methods
4 Hypothesis Testing
- 64 -
logo
Classifier performance evaluation and comparison
Estimation Methods
Introduction
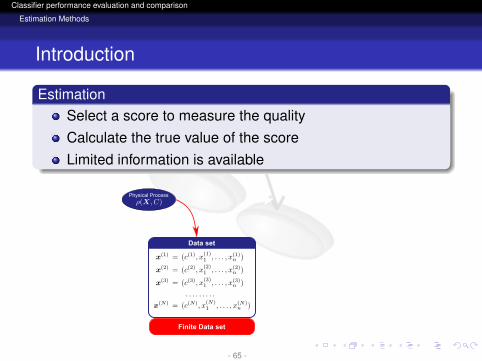
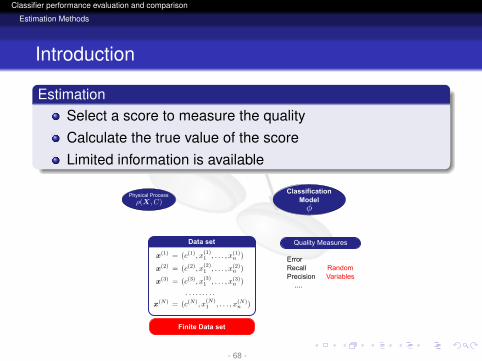
EstimationSelect a score to measure the qualityCalculate the true value of the scoreLimited information is available
Physical ProcessClassification
Model
Quality Measures
ErrorRecallPrecision ....
RandomVariables
Finite Data set
Data set
- 65 -
logo
Classifier performance evaluation and comparison
Estimation Methods
Introduction
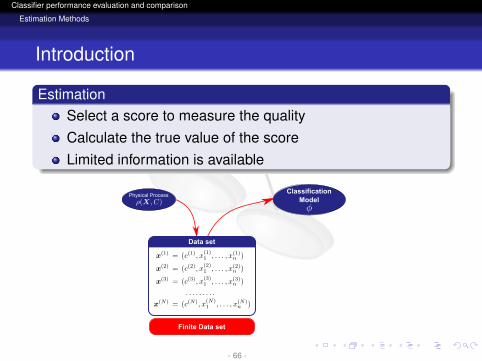
EstimationSelect a score to measure the qualityCalculate the true value of the scoreLimited information is available
Physical ProcessClassification
Model
Quality Measures
ErrorRecallPrecision ....
RandomVariables
Finite Data set
Data set
- 66 -
logo
Classifier performance evaluation and comparison
Estimation Methods
Introduction
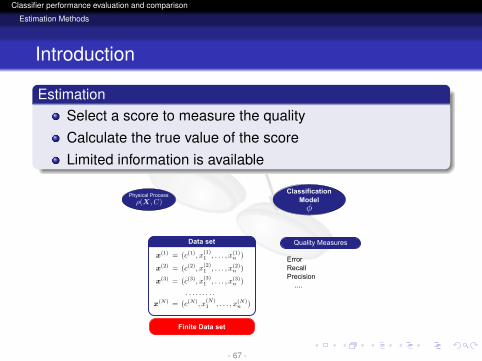
EstimationSelect a score to measure the qualityCalculate the true value of the scoreLimited information is available
Physical ProcessClassification
Model
Quality Measures
ErrorRecallPrecision ....
Finite Data set
Data set
- 67 -
logo
Classifier performance evaluation and comparison
Estimation Methods
Introduction
EstimationSelect a score to measure the qualityCalculate the true value of the scoreLimited information is available
Physical ProcessClassification
Model
Quality Measures
ErrorRecallPrecision ....
RandomVariables
Finite Data set
Data set
- 68 -
logo
Classifier performance evaluation and comparison
Estimation Methods
Introduction
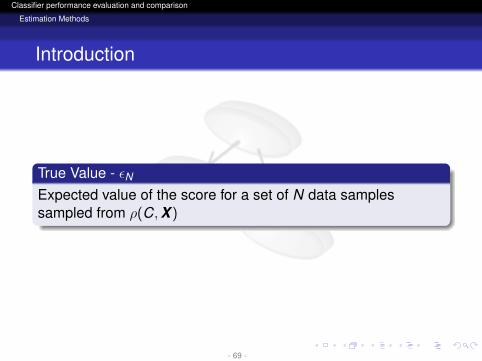
True Value - εNExpected value of the score for a set of N data samplessampled from ρ(C,X )
- 69 -
logo
Classifier performance evaluation and comparison
Estimation Methods
Introduction
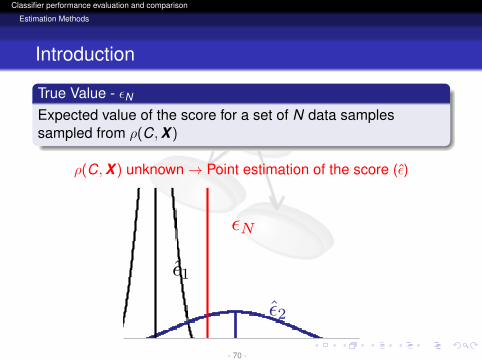
True Value - εNExpected value of the score for a set of N data samplessampled from ρ(C,X )
ρ(C,X ) unknown→ Point estimation of the score (ε)
- 70 -
logo
Classifier performance evaluation and comparison
Estimation Methods
Introduction
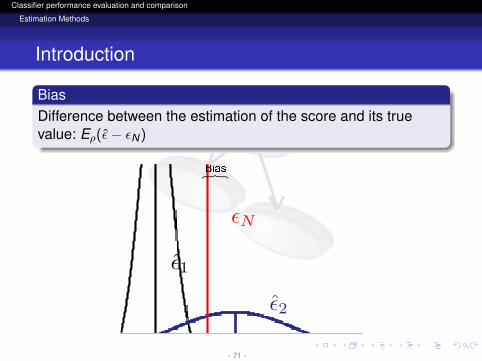
BiasDifference between the estimation of the score and its truevalue: Eρ(ε− εN)
- 71 -
logo
Classifier performance evaluation and comparison
Estimation Methods
Introduction
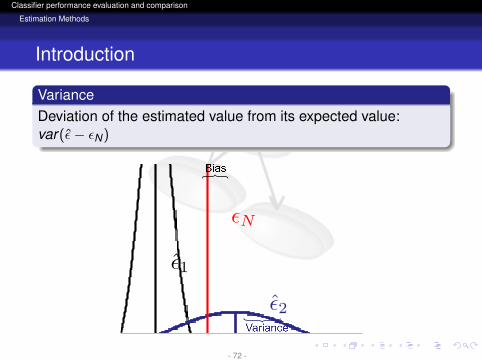
VarianceDeviation of the estimated value from its expected value:var(ε− εN)
- 72 -
logo
Classifier performance evaluation and comparison
Estimation Methods
Introduction
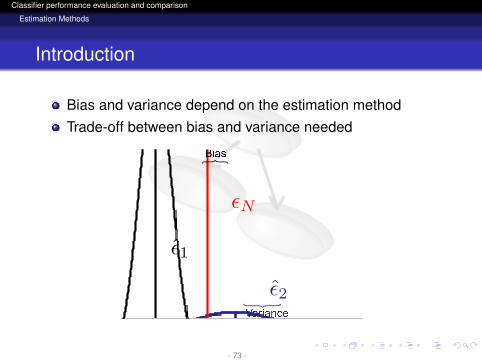
Bias and variance depend on the estimation methodTrade-off between bias and variance needed
- 73 -
logo
Classifier performance evaluation and comparison
Estimation Methods
Introduction
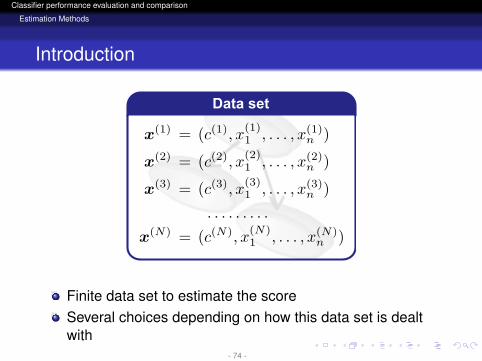
Data set
Finite data set to estimate the scoreSeveral choices depending on how this data set is dealtwith
- 74 -
logo
Classifier performance evaluation and comparison
Estimation Methods
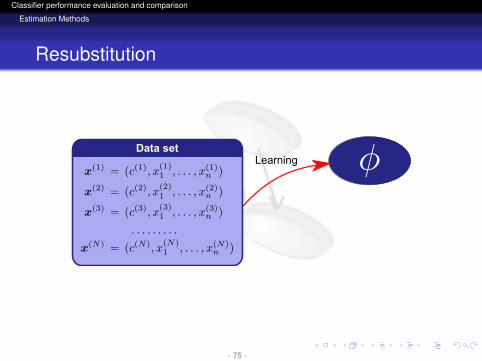
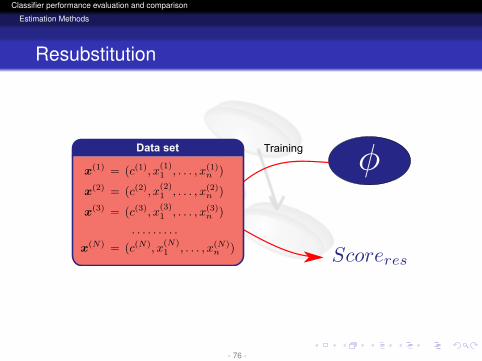
Resubstitution
LearningData set
- 75 -
logo
Classifier performance evaluation and comparison
Estimation Methods
Resubstitution
TrainingData set
- 76 -
logo
Classifier performance evaluation and comparison
Estimation Methods
Resubstitution
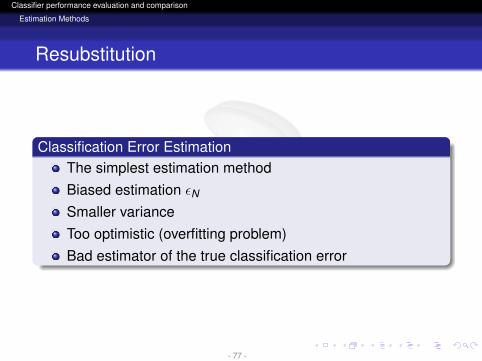
Classification Error EstimationThe simplest estimation methodBiased estimation εNSmaller varianceToo optimistic (overfitting problem)Bad estimator of the true classification error
- 77 -
logo
Classifier performance evaluation and comparison
Estimation Methods
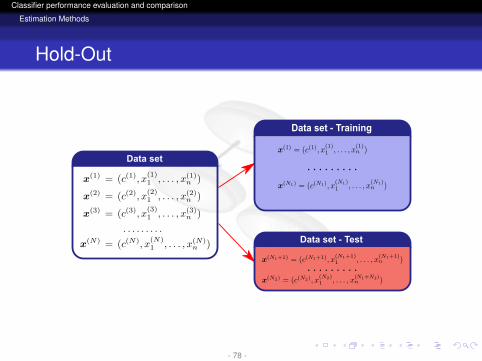
Hold-Out
Data set
Data set - Training
Data setData set - Test
- 78 -
logo
Classifier performance evaluation and comparison
Estimation Methods
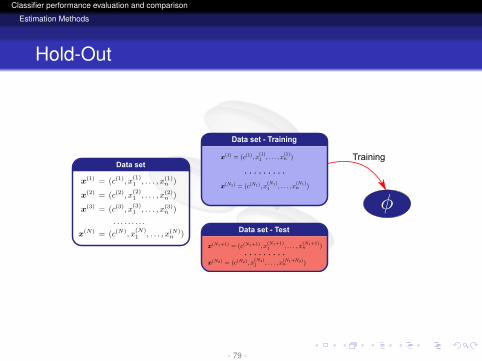
Hold-Out
TrainingData set
Data set - Training
Data setData set - Test
- 79 -
logo
Classifier performance evaluation and comparison
Estimation Methods
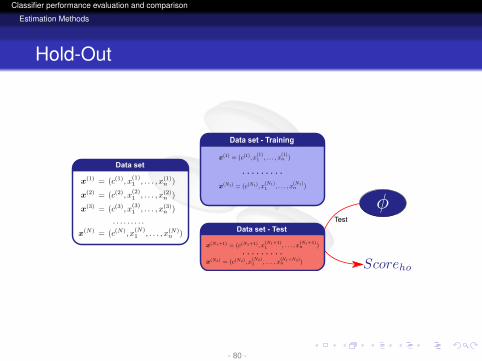
Hold-Out
Test
Data set
Data set - Training
Data setData set - Test
- 80 -
logo
Classifier performance evaluation and comparison
Estimation Methods
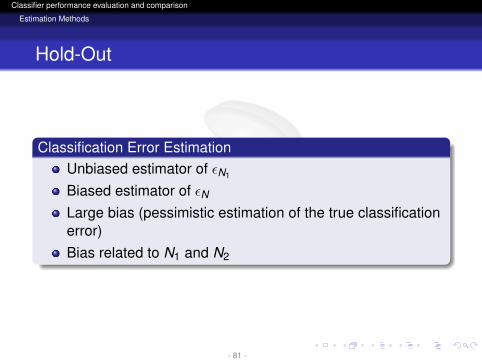
Hold-Out
Classification Error EstimationUnbiased estimator of εN1
Biased estimator of εNLarge bias (pessimistic estimation of the true classificationerror)Bias related to N1 and N2
- 81 -
logo
Classifier performance evaluation and comparison
Estimation Methods
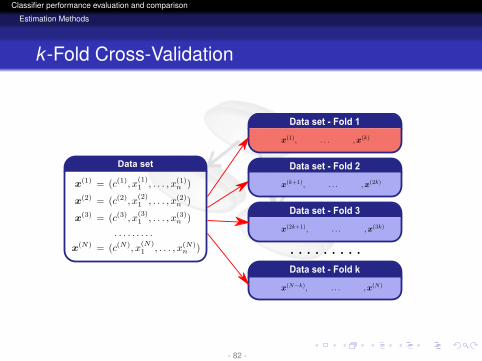
k -Fold Cross-Validation
Data set - Fold 1
Data set - Fold 2
Data set - Fold 3
Data set - Fold k
Data set
- 82 -
logo
Classifier performance evaluation and comparison
Estimation Methods
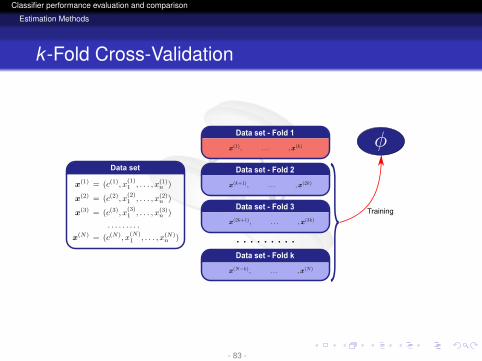
k -Fold Cross-Validation
Training
Data set - Fold 1
Data set - Fold 2
Data set - Fold 3
Data set - Fold k
Data set
- 83 -
logo
Classifier performance evaluation and comparison
Estimation Methods
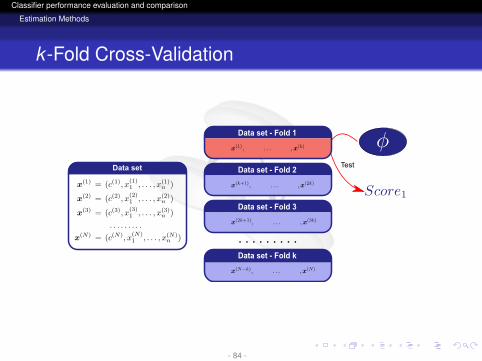
k -Fold Cross-Validation
Test
Data set - Fold 1
Data set - Fold 2
Data set - Fold 3
Data set - Fold k
Data set
- 84 -
logo
Classifier performance evaluation and comparison
Estimation Methods
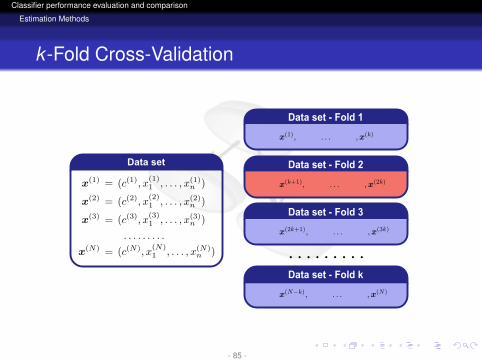
k -Fold Cross-Validation
Data set - Fold 1
Data set - Fold 2
Data set - Fold 3
Data set - Fold k
Data set
- 85 -
logo
Classifier performance evaluation and comparison
Estimation Methods
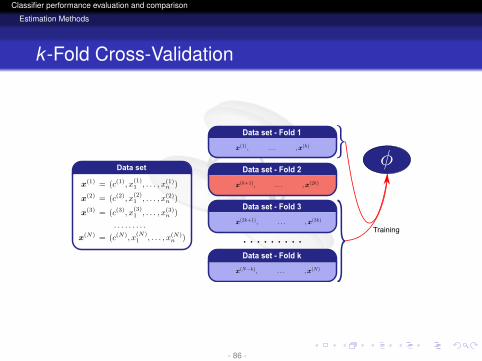
k -Fold Cross-Validation
Training
Data set - Fold 1
Data set - Fold 2
Data set - Fold 3
Data set - Fold k
Data set
- 86 -
logo
Classifier performance evaluation and comparison
Estimation Methods
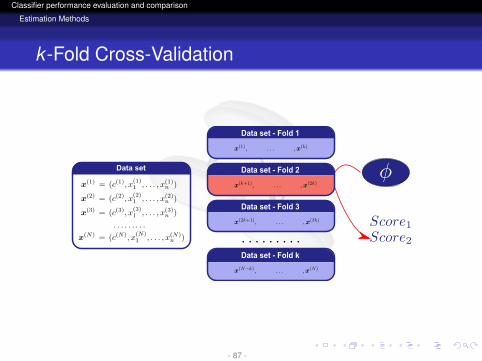
k -Fold Cross-Validation
Data set - Fold 1
Data set - Fold 2
Data set - Fold 3
Data set - Fold k
Data set
- 87 -
logo
Classifier performance evaluation and comparison
Estimation Methods
k -Fold Cross-Validation
Data set - Fold 1
Data set - Fold 2
Data set - Fold 3
Data set - Fold k
Data set
- 88 -
logo
Classifier performance evaluation and comparison
Estimation Methods
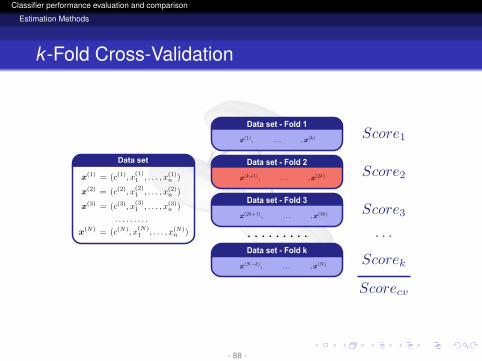
k -Fold Cross-Validation
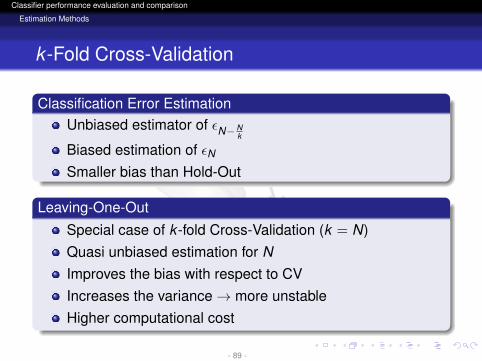
Classification Error EstimationUnbiased estimator of εN−N
k
Biased estimation of εNSmaller bias than Hold-Out
Leaving-One-Out
Special case of k -fold Cross-Validation (k = N)Quasi unbiased estimation for NImproves the bias with respect to CVIncreases the variance→ more unstableHigher computational cost
- 89 -
logo
Classifier performance evaluation and comparison
Estimation Methods
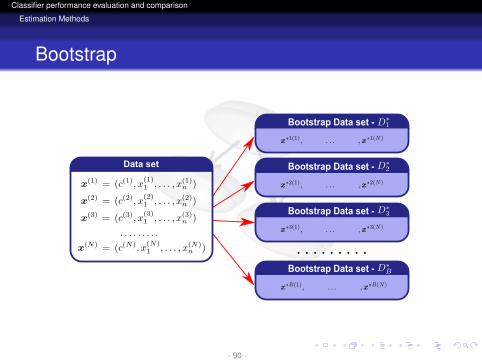
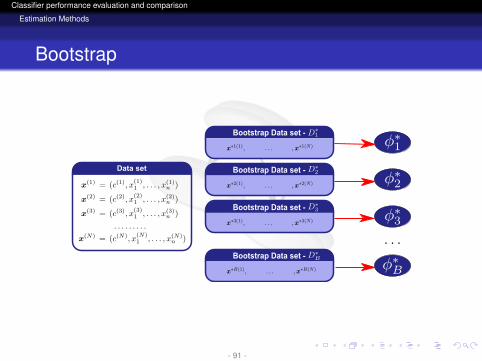
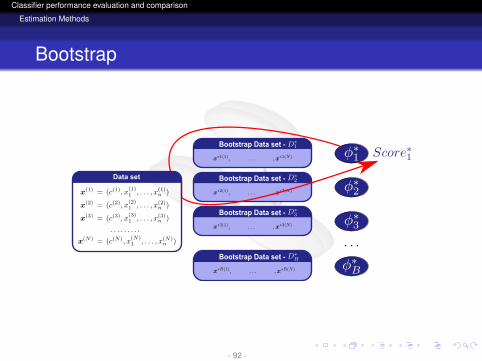
Bootstrap
Data set
Bootstrap Data set -
Bootstrap Data set -
Bootstrap Data set -
Bootstrap Data set -
- 90 -
logo
Classifier performance evaluation and comparison
Estimation Methods
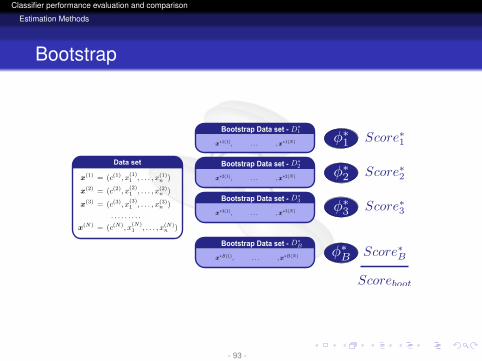
Bootstrap
Bootstrap Data set -
Bootstrap Data set -
Bootstrap Data set -
Bootstrap Data set -
Data setData setData set
- 91 -
logo
Classifier performance evaluation and comparison
Estimation Methods
Bootstrap
Bootstrap Data set -
Bootstrap Data set -
Bootstrap Data set -
Bootstrap Data set -
Data setData setData set
- 92 -
logo
Classifier performance evaluation and comparison
Estimation Methods
Bootstrap
Bootstrap Data set -
Bootstrap Data set -
Bootstrap Data set -
Bootstrap Data set -
Data setData setData set
- 93 -
logo
Classifier performance evaluation and comparison
Estimation Methods
Bootstrap
Classification Error EstimationBiased estimation of the classification errorVariance improved because of resamplingUses for testing part of the data used for learning“Similar to resubstitution”Problem of overfitting
- 94 -
logo
Classifier performance evaluation and comparison
Estimation Methods
Leaving-One-Out Bootstrap
Mimics Cross-ValidationEach φi is tested on D/D∗i
Tries to Avoid the Overfitting Problem
Expected number of distinct samples on bootstrap data set≈ 0,632NSimilar to repeated Hold-OutBiased upwards:
Tends to be a pessimistic estimation of the score
- 95 -
logo
Classifier performance evaluation and comparison
Estimation Methods
Improving the Estimation - Bias
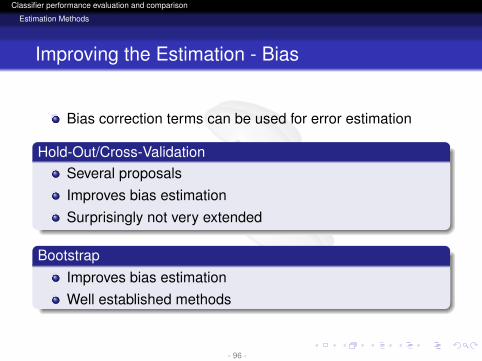
Bias correction terms can be used for error estimation
Hold-Out/Cross-ValidationSeveral proposalsImproves bias estimationSurprisingly not very extended
BootstrapImproves bias estimationWell established methods
- 96 -
logo
Classifier performance evaluation and comparison
Estimation Methods
Improving the Estimation - Bias
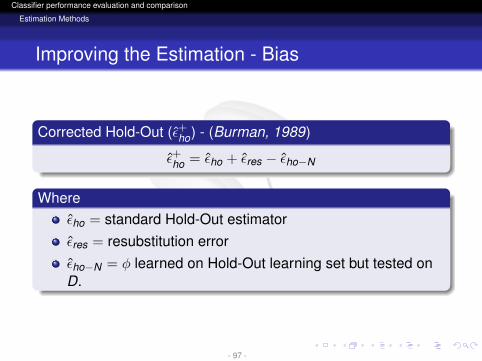
Corrected Hold-Out (ε+ho) - (Burman, 1989)
ε+ho = εho + εres − εho−N
Whereεho = standard Hold-Out estimatorεres = resubstitution errorεho−N = φ learned on Hold-Out learning set but tested onD.
- 97 -
logo
Classifier performance evaluation and comparison
Estimation Methods
Improving the Estimation - Bias
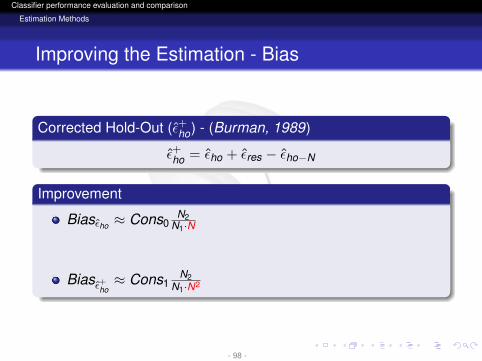
Corrected Hold-Out (ε+ho) - (Burman, 1989)
ε+ho = εho + εres − εho−N
Improvement
Biasεho ≈ Cons0N2
N1·N
Biasε+ho≈ Cons1
N2N1·N2
- 98 -
logo
Classifier performance evaluation and comparison
Estimation Methods
Improving the Estimation - Bias
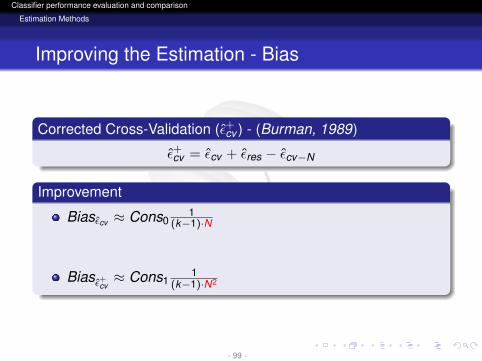
Corrected Cross-Validation (ε+cv ) - (Burman, 1989)
ε+cv = εcv + εres − εcv−N
Improvement
Biasεcv ≈ Cons01
(k−1)·N
Biasε+cv≈ Cons1
1(k−1)·N2
- 99 -
logo
Classifier performance evaluation and comparison
Estimation Methods
Improving the Estimation - Bias
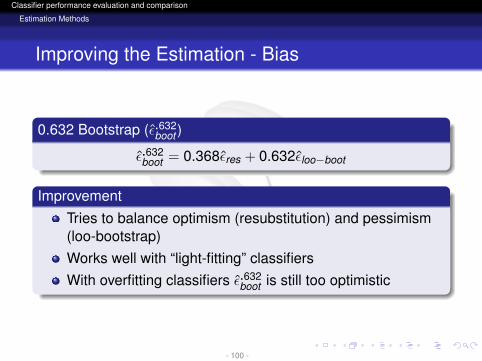
0.632 Bootstrap (ε.632boot )
ε.632boot = 0.368εres + 0.632εloo−boot
ImprovementTries to balance optimism (resubstitution) and pessimism(loo-bootstrap)Works well with “light-fitting” classifiersWith overfitting classifiers ε.632
boot is still too optimistic
- 100 -
logo
Classifier performance evaluation and comparison
Estimation Methods
Improving the Estimation - Bias
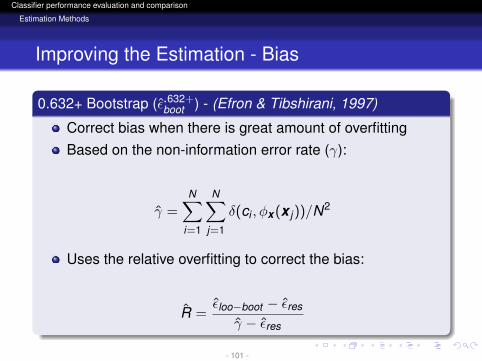
0.632+ Bootstrap (ε.632+boot ) - (Efron & Tibshirani, 1997)
Correct bias when there is great amount of overfittingBased on the non-information error rate (γ):
γ =N∑
i=1
N∑j=1
δ(ci , φx (x j))/N2
Uses the relative overfitting to correct the bias:
R =εloo−boot − εres
γ − εres
- 101 -
logo
Classifier performance evaluation and comparison
Estimation Methods
Improving the Estimation - Bias
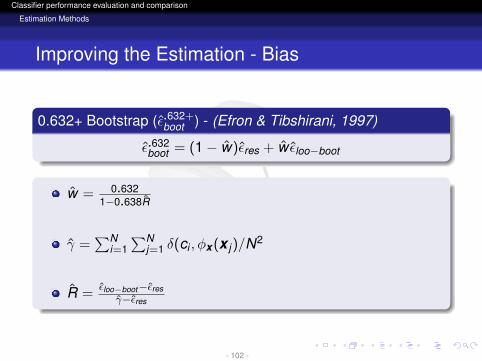
0.632+ Bootstrap (ε.632+boot ) - (Efron & Tibshirani, 1997)
ε.632boot = (1− w)εres + w εloo−boot
w = 0.6321−0.638R
γ =∑N
i=1∑N
j=1 δ(ci , φx (x j)/N2
R =εloo−boot−εres
γ−εres
- 102 -
logo
Classifier performance evaluation and comparison
Estimation Methods
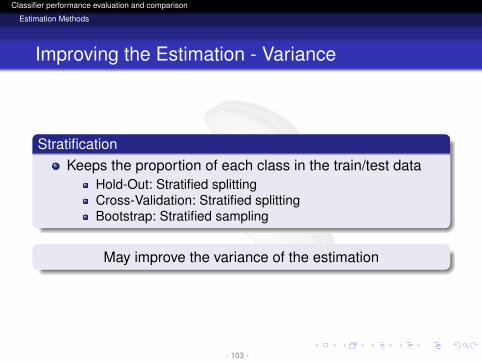
Improving the Estimation - Variance
StratificationKeeps the proportion of each class in the train/test data
Hold-Out: Stratified splittingCross-Validation: Stratified splittingBootstrap: Stratified sampling
May improve the variance of the estimation
- 103 -
logo
Classifier performance evaluation and comparison
Estimation Methods
Improving the Estimation - Variance
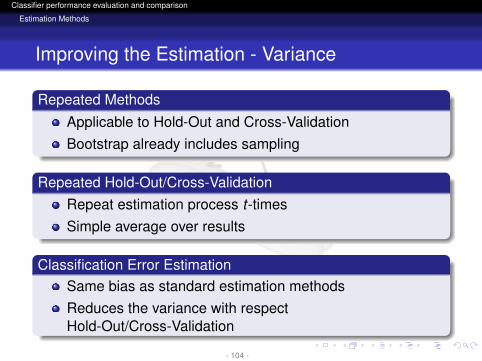
Repeated MethodsApplicable to Hold-Out and Cross-ValidationBootstrap already includes sampling
Repeated Hold-Out/Cross-ValidationRepeat estimation process t-timesSimple average over results
Classification Error EstimationSame bias as standard estimation methodsReduces the variance with respectHold-Out/Cross-Validation
- 104 -
logo
Classifier performance evaluation and comparison
Estimation Methods
Estimation Methods
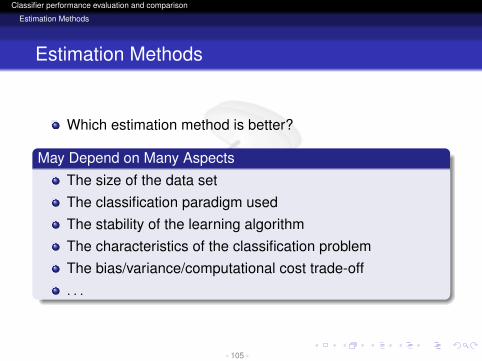
Which estimation method is better?
May Depend on Many AspectsThe size of the data setThe classification paradigm usedThe stability of the learning algorithmThe characteristics of the classification problemThe bias/variance/computational cost trade-off. . .
- 105 -
logo
Classifier performance evaluation and comparison
Estimation Methods
Estimation Methods
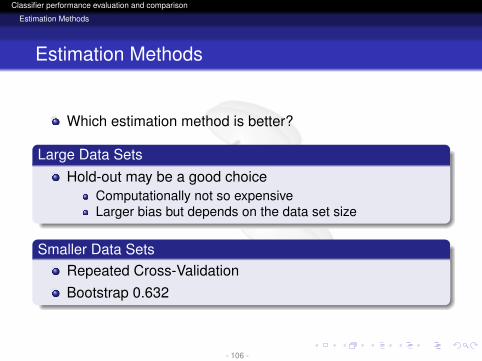
Which estimation method is better?
Large Data SetsHold-out may be a good choice
Computationally not so expensiveLarger bias but depends on the data set size
Smaller Data SetsRepeated Cross-ValidationBootstrap 0.632
- 106 -
logo
Classifier performance evaluation and comparison
Estimation Methods
Estimation Methods
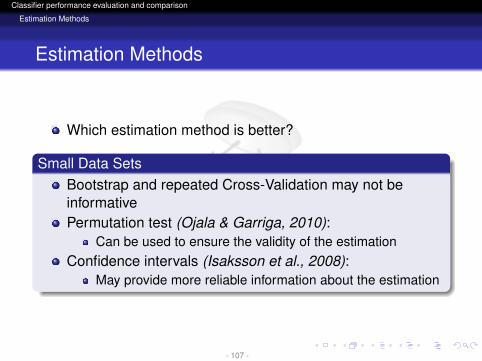
Which estimation method is better?
Small Data SetsBootstrap and repeated Cross-Validation may not beinformativePermutation test (Ojala & Garriga, 2010):
Can be used to ensure the validity of the estimationConfidence intervals (Isaksson et al., 2008):
May provide more reliable information about the estimation
- 107 -
logo
Classifier performance evaluation and comparison
Hypothesis Testing
Outline of the Tutorial
1 Introduction
2 Scores
3 Estimation Methods
4 Hypothesis Testing
- 108 -
logo
Classifier performance evaluation and comparison
Hypothesis Testing
Motivation
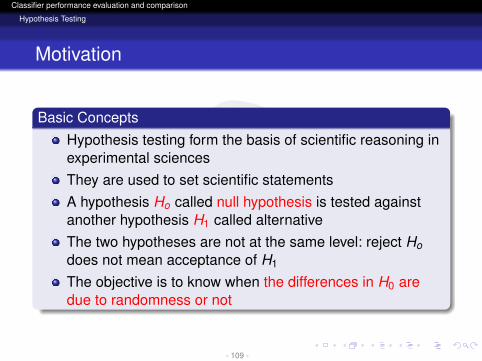
Basic ConceptsHypothesis testing form the basis of scientific reasoning inexperimental sciencesThey are used to set scientific statementsA hypothesis Ho called null hypothesis is tested againstanother hypothesis H1 called alternativeThe two hypotheses are not at the same level: reject Hodoes not mean acceptance of H1
The objective is to know when the differences in H0 aredue to randomness or not
- 109 -
logo
Classifier performance evaluation and comparison
Hypothesis Testing
Hypothesis Testing
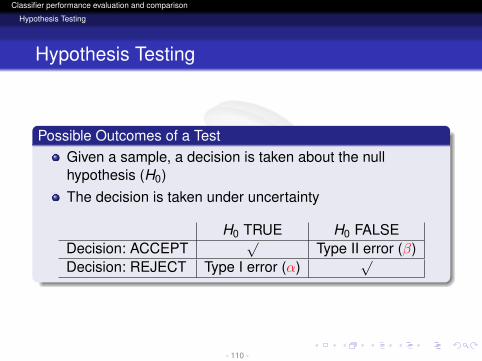
Possible Outcomes of a TestGiven a sample, a decision is taken about the nullhypothesis (H0)The decision is taken under uncertainty
H0 TRUE H0 FALSEDecision: ACCEPT
√Type II error (β)
Decision: REJECT Type I error (α)√
- 110 -
logo
Classifier performance evaluation and comparison
Hypothesis Testing
Hypothesis Testing: An Example
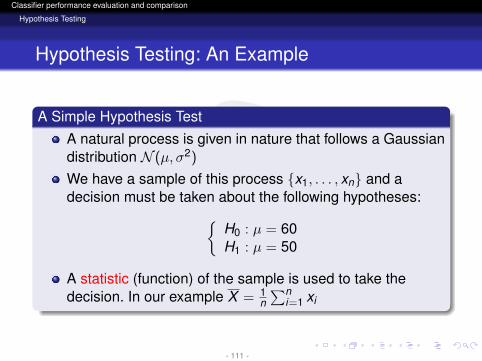
A Simple Hypothesis TestA natural process is given in nature that follows a Gaussiandistribution N (µ, σ2)
We have a sample of this process {x1, . . . , xn} and adecision must be taken about the following hypotheses:{
H0 : µ = 60H1 : µ = 50
A statistic (function) of the sample is used to take thedecision. In our example X = 1
n∑n
i=1 xi
- 111 -
logo
Classifier performance evaluation and comparison
Hypothesis Testing
Hypothesis Testing: An Example
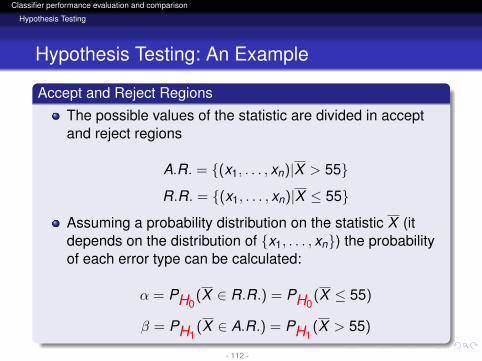
Accept and Reject Regions
The possible values of the statistic are divided in acceptand reject regions
A.R. = {(x1, . . . , xn)|X > 55}
R.R. = {(x1, . . . , xn)|X ≤ 55}
Assuming a probability distribution on the statistic X (itdepends on the distribution of {x1, . . . , xn}) the probabilityof each error type can be calculated:
α = PH0(X ∈ R.R.) = PH0
(X ≤ 55)
β = PH1(X ∈ A.R.) = PH1
(X > 55)
- 112 -
logo
Classifier performance evaluation and comparison
Hypothesis Testing
Hypothesis Testing: An Example
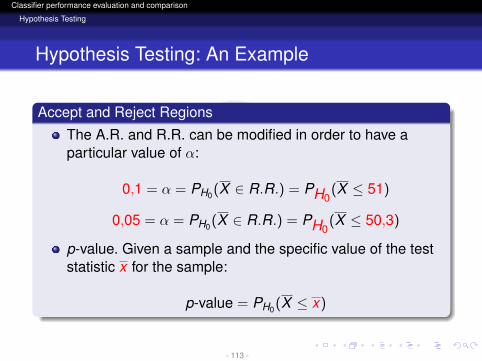
Accept and Reject Regions
The A.R. and R.R. can be modified in order to have aparticular value of α:
0,1 = α = PH0(X ∈ R.R.) = PH0(X ≤ 51)
0,05 = α = PH0(X ∈ R.R.) = PH0(X ≤ 50,3)
p-value. Given a sample and the specific value of the teststatistic x for the sample:
p-value = PH0(X ≤ x)
- 113 -
logo
Classifier performance evaluation and comparison
Hypothesis Testing
Hypothesis Testing: Remarks
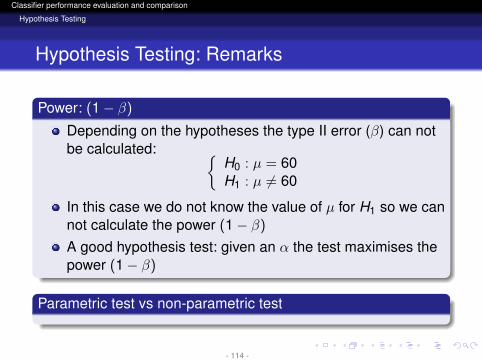
Power: (1− β)
Depending on the hypotheses the type II error (β) can notbe calculated: {
H0 : µ = 60H1 : µ 6= 60
In this case we do not know the value of µ for H1 so we cannot calculate the power (1− β)
A good hypothesis test: given an α the test maximises thepower (1− β)
Parametric test vs non-parametric test
- 114 -
logo
Classifier performance evaluation and comparison
Hypothesis Testing
Hypothesis Testing in Supervised Classification
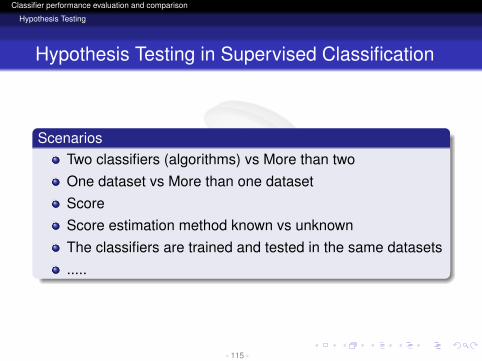
ScenariosTwo classifiers (algorithms) vs More than twoOne dataset vs More than one datasetScoreScore estimation method known vs unknownThe classifiers are trained and tested in the same datasets.....
- 115 -
logo
Classifier performance evaluation and comparison
Hypothesis Testing
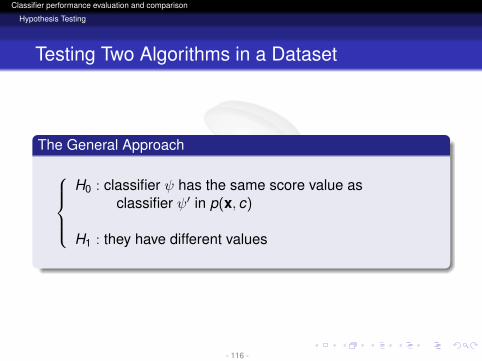
Testing Two Algorithms in a Dataset
The General Approach
H0 : classifier ψ has the same score value as
classifier ψ′ in p(x, c)
H1 : they have different values
- 116 -
logo
Classifier performance evaluation and comparison
Hypothesis Testing
Testing Two Algorithms in a Dataset
The General Approach
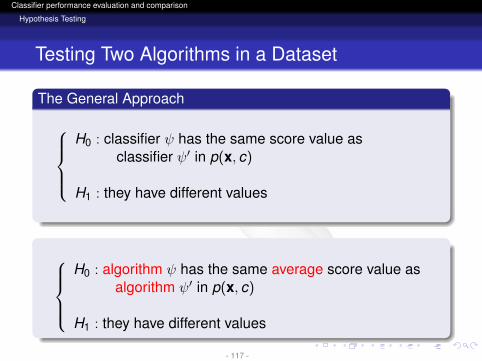
H0 : classifier ψ has the same score value as
classifier ψ′ in p(x, c)
H1 : they have different values
H0 : algorithm ψ has the same average score value as
algorithm ψ′ in p(x, c)
H1 : they have different values
- 117 -
logo
Classifier performance evaluation and comparison
Hypothesis Testing
Testing Two Algorithms in a Dataset
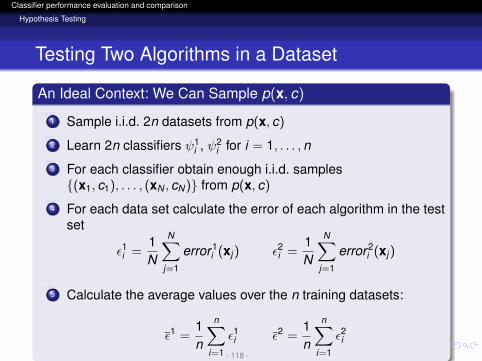
An Ideal Context: We Can Sample p(x, c)
1 Sample i.i.d. 2n datasets from p(x, c)
2 Learn 2n classifiers ψ1i , ψ2
i for i = 1, . . . ,n
3 For each classifier obtain enough i.i.d. samples{(x1, c1), . . . , (xN , cN)} from p(x, c)
4 For each data set calculate the error of each algorithm in the testset
ε1i =1N
N∑j=1
error1i (xj ) ε2i =
1N
N∑j=1
error2i (xj )
5 Calculate the average values over the n training datasets:
ε1 =1n
n∑i=1
ε1i ε2 =1n
n∑i=1
ε2i- 118 -
logo
Classifier performance evaluation and comparison
Hypothesis Testing
Testing Two Algorithms in a Dataset
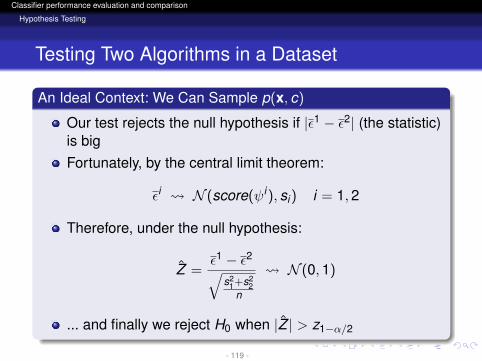
An Ideal Context: We Can Sample p(x, c)
Our test rejects the null hypothesis if |ε1 − ε2| (the statistic)is bigFortunately, by the central limit theorem:
εi N (score(ψi), si) i = 1,2
Therefore, under the null hypothesis:
Z =ε1 − ε2√
s21+s2
2n
N (0,1)
... and finally we reject H0 when |Z | > z1−α/2
- 119 -
logo
Classifier performance evaluation and comparison
Hypothesis Testing
Testing Two Algorithms in a Dataset
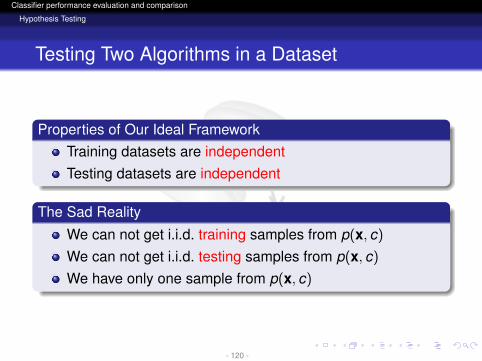
Properties of Our Ideal FrameworkTraining datasets are independentTesting datasets are independent
The Sad Reality
We can not get i.i.d. training samples from p(x, c)
We can not get i.i.d. testing samples from p(x, c)
We have only one sample from p(x, c)
- 120 -
logo
Classifier performance evaluation and comparison
Hypothesis Testing
Testing Two Algorithms in a Dataset
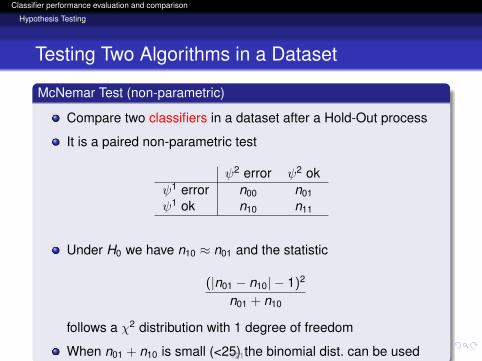
McNemar Test (non-parametric)
Compare two classifiers in a dataset after a Hold-Out process
It is a paired non-parametric test
ψ2 error ψ2 okψ1 error n00 n01ψ1 ok n10 n11
Under H0 we have n10 ≈ n01 and the statistic
(|n01 − n10| − 1)2
n01 + n10
follows a χ2 distribution with 1 degree of freedom
When n01 + n10 is small (<25) the binomial dist. can be used- 121 -
logo
Classifier performance evaluation and comparison
Hypothesis Testing
Testing Two Algorithms in a Dataset
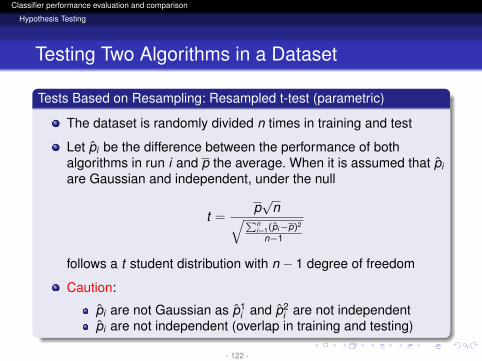
Tests Based on Resampling: Resampled t-test (parametric)
The dataset is randomly divided n times in training and test
Let pi be the difference between the performance of bothalgorithms in run i and p the average. When it is assumed that piare Gaussian and independent, under the null
t =p√
n√∑ni=1(pi−p)2
n−1
follows a t student distribution with n − 1 degree of freedom
Caution:
pi are not Gaussian as p1i and p2
i are not independentpi are not independent (overlap in training and testing)
- 122 -
logo
Classifier performance evaluation and comparison
Hypothesis Testing
Testing Two Algorithms in a Dataset
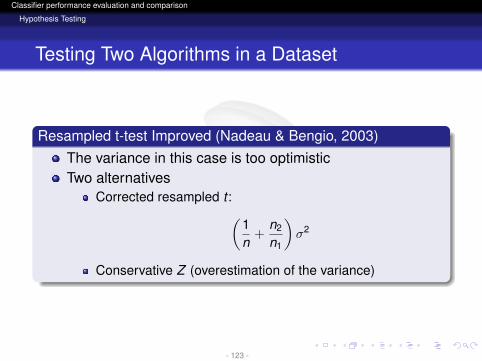
Resampled t-test Improved (Nadeau & Bengio, 2003)The variance in this case is too optimisticTwo alternatives
Corrected resampled t :(1n
+n2
n1
)σ2
Conservative Z (overestimation of the variance)
- 123 -
logo
Classifier performance evaluation and comparison
Hypothesis Testing
Testing Two Algorithms in a Dataset
t-test for k-fold Cross-validationIt is similar to t-test for resamplingIn this case the testing datasets are independentThe training datasets are still dependent
- 124 -
logo
Classifier performance evaluation and comparison
Hypothesis Testing
Testing Two Algorithms in a Dataset
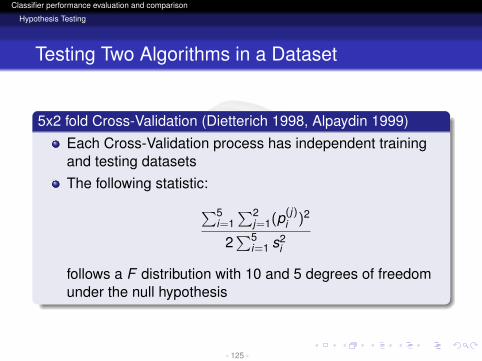
5x2 fold Cross-Validation (Dietterich 1998, Alpaydin 1999)Each Cross-Validation process has independent trainingand testing datasetsThe following statistic:∑5
i=1∑2
j=1(p(j)i )2
2∑5
i=1 s2i
follows a F distribution with 10 and 5 degrees of freedomunder the null hypothesis
- 125 -
logo
Classifier performance evaluation and comparison
Hypothesis Testing
Testing Two Algorithms in Several Datasets
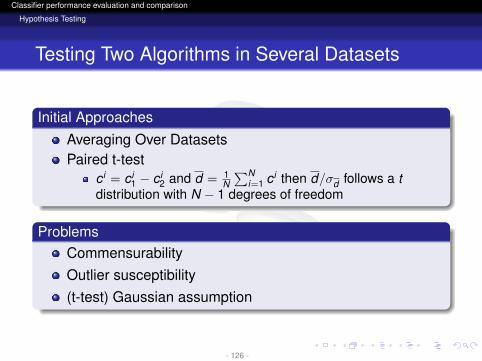
Initial ApproachesAveraging Over DatasetsPaired t-test
c i = c i1 − c i
2 and d = 1N
∑Ni=1 c i then d/σd follows a t
distribution with N − 1 degrees of freedom
ProblemsCommensurabilityOutlier susceptibility(t-test) Gaussian assumption
- 126 -
logo
Classifier performance evaluation and comparison
Hypothesis Testing
Testing Two Algorithms in Several Datasets
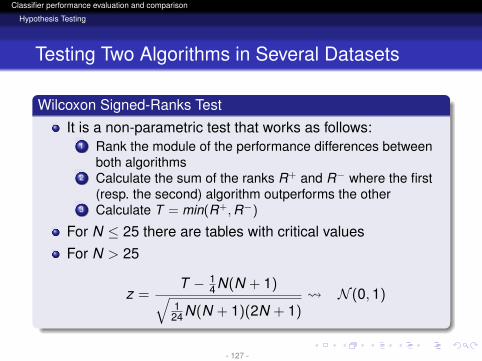
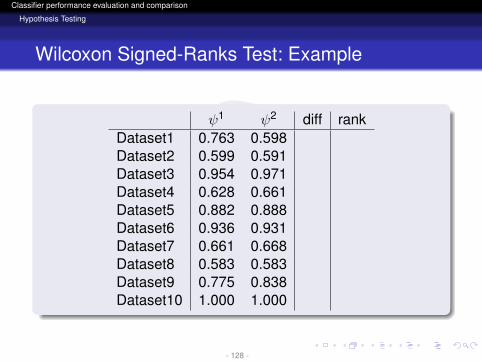
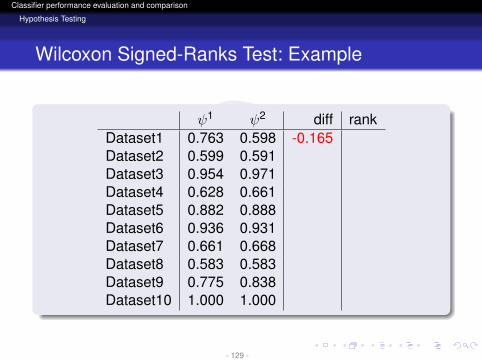
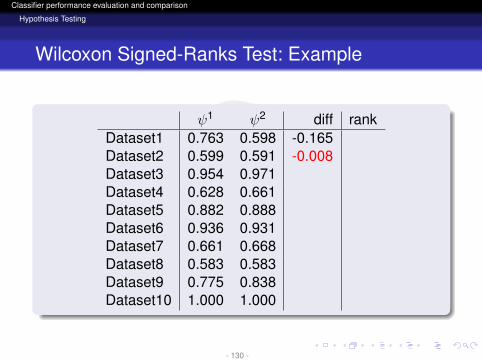
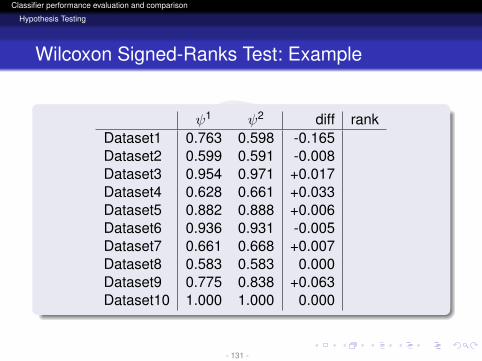
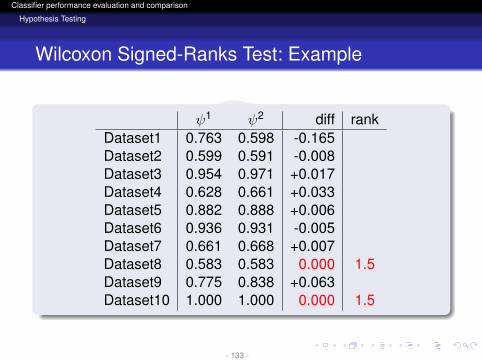
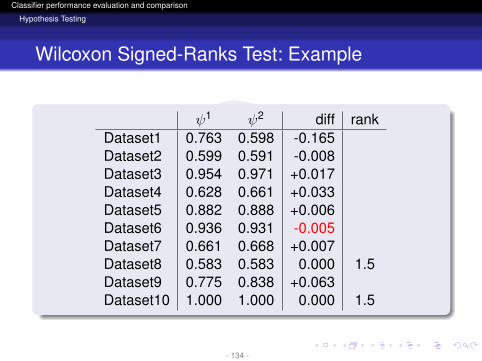
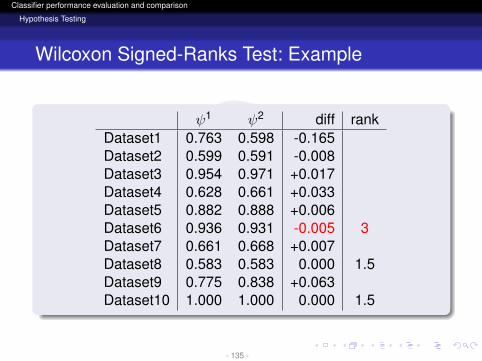
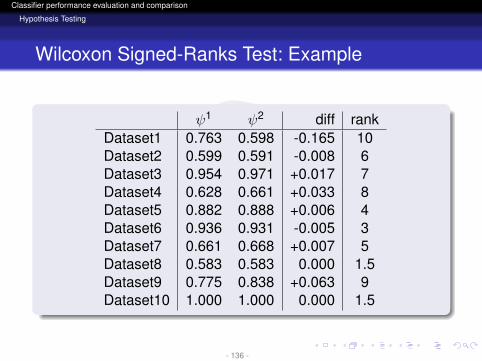
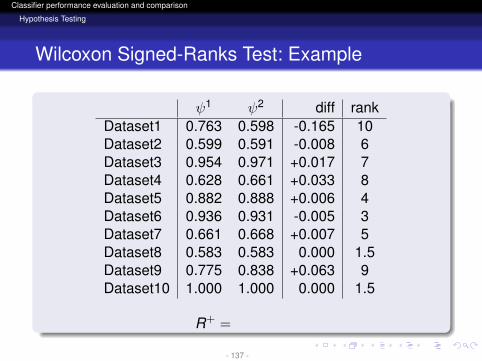
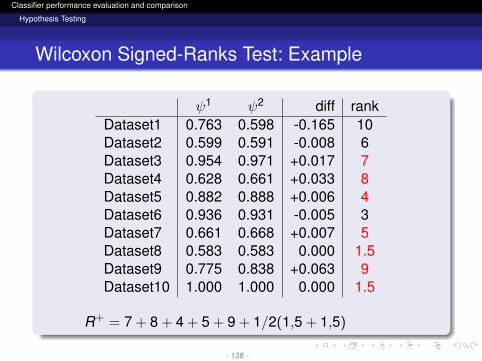
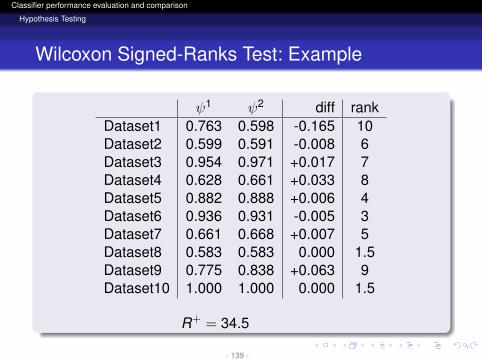
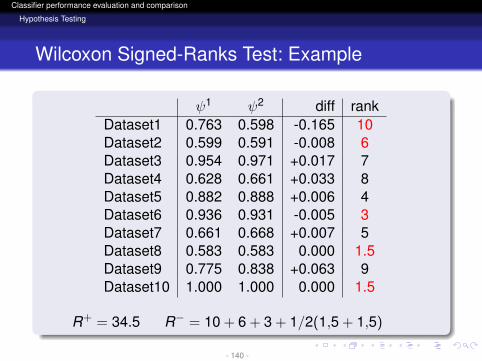
Wilcoxon Signed-Ranks Test
It is a non-parametric test that works as follows:1 Rank the module of the performance differences between
both algorithms2 Calculate the sum of the ranks R+ and R− where the first
(resp. the second) algorithm outperforms the other3 Calculate T = min(R+,R−)
For N ≤ 25 there are tables with critical valuesFor N > 25
z =T − 1
4N(N + 1)√1
24N(N + 1)(2N + 1) N (0,1)
- 127 -
logo
Classifier performance evaluation and comparison
Hypothesis Testing
Wilcoxon Signed-Ranks Test: Example
ψ1 ψ2 diff rankDataset1 0.763 0.598Dataset2 0.599 0.591Dataset3 0.954 0.971Dataset4 0.628 0.661Dataset5 0.882 0.888Dataset6 0.936 0.931Dataset7 0.661 0.668Dataset8 0.583 0.583Dataset9 0.775 0.838Dataset10 1.000 1.000
- 128 -
logo
Classifier performance evaluation and comparison
Hypothesis Testing
Wilcoxon Signed-Ranks Test: Example
ψ1 ψ2 diff rankDataset1 0.763 0.598 -0.165Dataset2 0.599 0.591Dataset3 0.954 0.971Dataset4 0.628 0.661Dataset5 0.882 0.888Dataset6 0.936 0.931Dataset7 0.661 0.668Dataset8 0.583 0.583Dataset9 0.775 0.838Dataset10 1.000 1.000
- 129 -
logo
Classifier performance evaluation and comparison
Hypothesis Testing
Wilcoxon Signed-Ranks Test: Example
ψ1 ψ2 diff rankDataset1 0.763 0.598 -0.165Dataset2 0.599 0.591 -0.008Dataset3 0.954 0.971Dataset4 0.628 0.661Dataset5 0.882 0.888Dataset6 0.936 0.931Dataset7 0.661 0.668Dataset8 0.583 0.583Dataset9 0.775 0.838Dataset10 1.000 1.000
- 130 -
logo
Classifier performance evaluation and comparison
Hypothesis Testing
Wilcoxon Signed-Ranks Test: Example
ψ1 ψ2 diff rankDataset1 0.763 0.598 -0.165Dataset2 0.599 0.591 -0.008Dataset3 0.954 0.971 +0.017Dataset4 0.628 0.661 +0.033Dataset5 0.882 0.888 +0.006Dataset6 0.936 0.931 -0.005Dataset7 0.661 0.668 +0.007Dataset8 0.583 0.583 0.000Dataset9 0.775 0.838 +0.063Dataset10 1.000 1.000 0.000
- 131 -

logo
Classifier performance evaluation and comparison
Hypothesis Testing
Wilcoxon Signed-Ranks Test: Example
ψ1 ψ2 diff rankDataset1 0.763 0.598 -0.165Dataset2 0.599 0.591 -0.008Dataset3 0.954 0.971 +0.017Dataset4 0.628 0.661 +0.033Dataset5 0.882 0.888 +0.006Dataset6 0.936 0.931 -0.005Dataset7 0.661 0.668 +0.007Dataset8 0.583 0.583 0.000Dataset9 0.775 0.838 +0.063Dataset10 1.000 1.000 0.000
- 132 -
logo
Classifier performance evaluation and comparison
Hypothesis Testing
Wilcoxon Signed-Ranks Test: Example
ψ1 ψ2 diff rankDataset1 0.763 0.598 -0.165Dataset2 0.599 0.591 -0.008Dataset3 0.954 0.971 +0.017Dataset4 0.628 0.661 +0.033Dataset5 0.882 0.888 +0.006Dataset6 0.936 0.931 -0.005Dataset7 0.661 0.668 +0.007Dataset8 0.583 0.583 0.000 1.5Dataset9 0.775 0.838 +0.063Dataset10 1.000 1.000 0.000 1.5
- 133 -
logo
Classifier performance evaluation and comparison
Hypothesis Testing
Wilcoxon Signed-Ranks Test: Example
ψ1 ψ2 diff rankDataset1 0.763 0.598 -0.165Dataset2 0.599 0.591 -0.008Dataset3 0.954 0.971 +0.017Dataset4 0.628 0.661 +0.033Dataset5 0.882 0.888 +0.006Dataset6 0.936 0.931 -0.005Dataset7 0.661 0.668 +0.007Dataset8 0.583 0.583 0.000 1.5Dataset9 0.775 0.838 +0.063Dataset10 1.000 1.000 0.000 1.5
- 134 -
logo
Classifier performance evaluation and comparison
Hypothesis Testing
Wilcoxon Signed-Ranks Test: Example
ψ1 ψ2 diff rankDataset1 0.763 0.598 -0.165Dataset2 0.599 0.591 -0.008Dataset3 0.954 0.971 +0.017Dataset4 0.628 0.661 +0.033Dataset5 0.882 0.888 +0.006Dataset6 0.936 0.931 -0.005 3Dataset7 0.661 0.668 +0.007Dataset8 0.583 0.583 0.000 1.5Dataset9 0.775 0.838 +0.063Dataset10 1.000 1.000 0.000 1.5
- 135 -
logo
Classifier performance evaluation and comparison
Hypothesis Testing
Wilcoxon Signed-Ranks Test: Example
ψ1 ψ2 diff rankDataset1 0.763 0.598 -0.165 10Dataset2 0.599 0.591 -0.008 6Dataset3 0.954 0.971 +0.017 7Dataset4 0.628 0.661 +0.033 8Dataset5 0.882 0.888 +0.006 4Dataset6 0.936 0.931 -0.005 3Dataset7 0.661 0.668 +0.007 5Dataset8 0.583 0.583 0.000 1.5Dataset9 0.775 0.838 +0.063 9Dataset10 1.000 1.000 0.000 1.5
- 136 -
logo
Classifier performance evaluation and comparison
Hypothesis Testing
Wilcoxon Signed-Ranks Test: Example
ψ1 ψ2 diff rankDataset1 0.763 0.598 -0.165 10Dataset2 0.599 0.591 -0.008 6Dataset3 0.954 0.971 +0.017 7Dataset4 0.628 0.661 +0.033 8Dataset5 0.882 0.888 +0.006 4Dataset6 0.936 0.931 -0.005 3Dataset7 0.661 0.668 +0.007 5Dataset8 0.583 0.583 0.000 1.5Dataset9 0.775 0.838 +0.063 9Dataset10 1.000 1.000 0.000 1.5
R+ =
- 137 -
logo
Classifier performance evaluation and comparison
Hypothesis Testing
Wilcoxon Signed-Ranks Test: Example
ψ1 ψ2 diff rankDataset1 0.763 0.598 -0.165 10Dataset2 0.599 0.591 -0.008 6Dataset3 0.954 0.971 +0.017 7Dataset4 0.628 0.661 +0.033 8Dataset5 0.882 0.888 +0.006 4Dataset6 0.936 0.931 -0.005 3Dataset7 0.661 0.668 +0.007 5Dataset8 0.583 0.583 0.000 1.5Dataset9 0.775 0.838 +0.063 9Dataset10 1.000 1.000 0.000 1.5
R+ = 7 + 8 + 4 + 5 + 9 + 1/2(1,5 + 1,5)
- 138 -
logo
Classifier performance evaluation and comparison
Hypothesis Testing
Wilcoxon Signed-Ranks Test: Example
ψ1 ψ2 diff rankDataset1 0.763 0.598 -0.165 10Dataset2 0.599 0.591 -0.008 6Dataset3 0.954 0.971 +0.017 7Dataset4 0.628 0.661 +0.033 8Dataset5 0.882 0.888 +0.006 4Dataset6 0.936 0.931 -0.005 3Dataset7 0.661 0.668 +0.007 5Dataset8 0.583 0.583 0.000 1.5Dataset9 0.775 0.838 +0.063 9Dataset10 1.000 1.000 0.000 1.5
R+ = 34.5
- 139 -
logo
Classifier performance evaluation and comparison
Hypothesis Testing
Wilcoxon Signed-Ranks Test: Example
ψ1 ψ2 diff rankDataset1 0.763 0.598 -0.165 10Dataset2 0.599 0.591 -0.008 6Dataset3 0.954 0.971 +0.017 7Dataset4 0.628 0.661 +0.033 8Dataset5 0.882 0.888 +0.006 4Dataset6 0.936 0.931 -0.005 3Dataset7 0.661 0.668 +0.007 5Dataset8 0.583 0.583 0.000 1.5Dataset9 0.775 0.838 +0.063 9Dataset10 1.000 1.000 0.000 1.5
R+ = 34.5 R− = 10 + 6 + 3 + 1/2(1,5 + 1,5)
- 140 -
logo
Classifier performance evaluation and comparison
Hypothesis Testing
Wilcoxon Signed-Ranks Test: Example
ψ1 ψ2 diff rankDataset1 0.763 0.598 -0.165 10Dataset2 0.599 0.591 -0.008 6Dataset3 0.954 0.971 +0.017 7Dataset4 0.628 0.661 +0.033 8Dataset5 0.882 0.888 +0.006 4Dataset6 0.936 0.931 -0.005 3Dataset7 0.661 0.668 +0.007 5Dataset8 0.583 0.583 0.000 1.5Dataset9 0.775 0.838 +0.063 9Dataset10 1.000 1.000 0.000 1.5
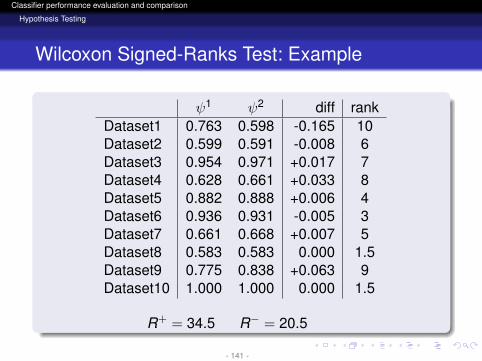
R+ = 34.5 R− = 20.5
- 141 -
logo
Classifier performance evaluation and comparison
Hypothesis Testing
Wilcoxon Signed-Ranks Test: Example
ψ1 ψ2 diff rankDataset1 0.763 0.598 -0.165 10Dataset2 0.599 0.591 -0.008 6Dataset3 0.954 0.971 +0.017 7Dataset4 0.628 0.661 +0.033 8Dataset5 0.882 0.888 +0.006 4Dataset6 0.936 0.931 -0.005 3Dataset7 0.661 0.668 +0.007 5Dataset8 0.583 0.583 0.000 1.5Dataset9 0.775 0.838 +0.063 9Dataset10 1.000 1.000 0.000 1.5
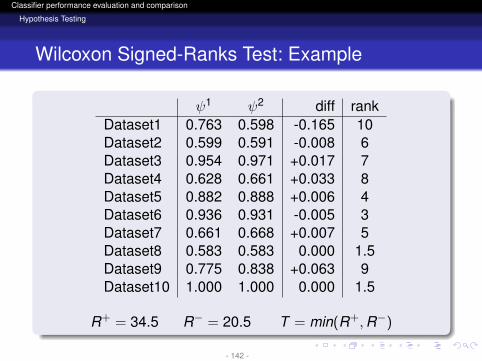
R+ = 34.5 R− = 20.5 T = min(R+,R−)
- 142 -
logo
Classifier performance evaluation and comparison
Hypothesis Testing
Wilcoxon Signed-Ranks Test: Example
ψ1 ψ2 diff rankDataset1 0.763 0.598 -0.165 10Dataset2 0.599 0.591 -0.008 6Dataset3 0.954 0.971 +0.017 7Dataset4 0.628 0.661 +0.033 8Dataset5 0.882 0.888 +0.006 4Dataset6 0.936 0.931 -0.005 3Dataset7 0.661 0.668 +0.007 5Dataset8 0.583 0.583 0.000 1.5Dataset9 0.775 0.838 +0.063 9Dataset10 1.000 1.000 0.000 1.5
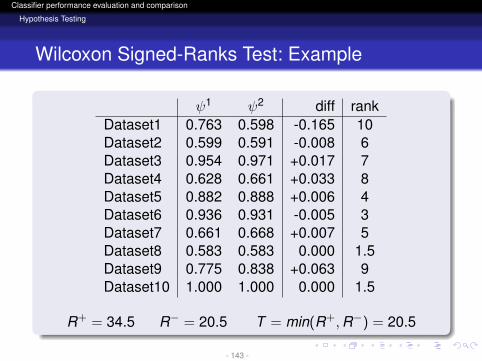
R+ = 34.5 R− = 20.5 T = min(R+,R−) = 20.5
- 143 -
logo
Classifier performance evaluation and comparison
Hypothesis Testing
Testing Two Algorithms in Several Datasets
Wilcoxon Signed-Ranks Test
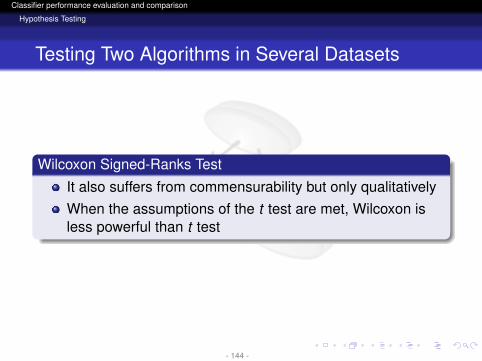
It also suffers from commensurability but only qualitativelyWhen the assumptions of the t test are met, Wilcoxon isless powerful than t test
- 144 -
logo
Classifier performance evaluation and comparison
Hypothesis Testing
Testing Two Algorithms in Several Datasets
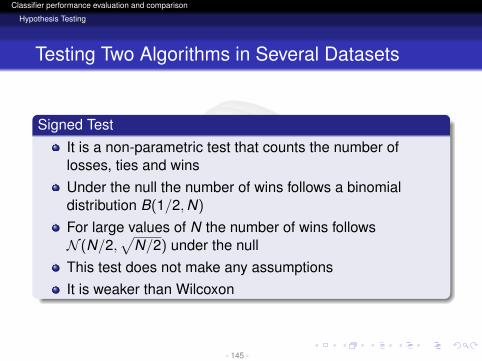
Signed Test
It is a non-parametric test that counts the number oflosses, ties and winsUnder the null the number of wins follows a binomialdistribution B(1/2,N)
For large values of N the number of wins followsN (N/2,
√N/2) under the null
This test does not make any assumptionsIt is weaker than Wilcoxon
- 145 -
logo
Classifier performance evaluation and comparison
Hypothesis Testing
Testing Several Algorithms in Several Datasets
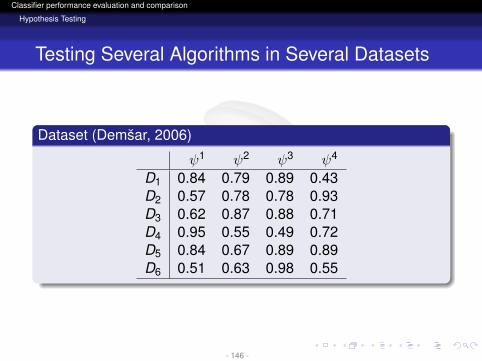
Dataset (Demsar, 2006)
ψ1 ψ2 ψ3 ψ4
D1 0.84 0.79 0.89 0.43D2 0.57 0.78 0.78 0.93D3 0.62 0.87 0.88 0.71D4 0.95 0.55 0.49 0.72D5 0.84 0.67 0.89 0.89D6 0.51 0.63 0.98 0.55
- 146 -
logo
Classifier performance evaluation and comparison
Hypothesis Testing
Testing Several Algorithms in Several Datasets
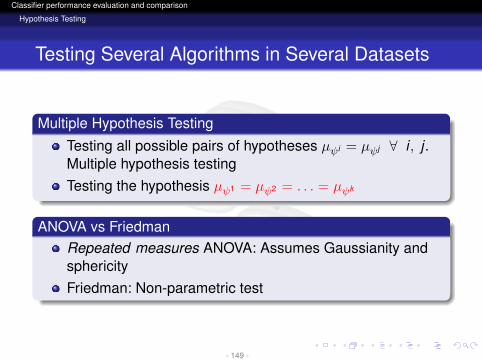
Multiple Hypothesis Testing
Testing all possible pairs of hypotheses µψi = µψj ∀ i , j .Multiple hypothesis testingTesting the hypothesis µψ1 = µψ2 = . . . = µψk
- 147 -
logo
Classifier performance evaluation and comparison
Hypothesis Testing
Testing Several Algorithms in Several Datasets
Multiple Hypothesis Testing
Testing all possible pairs of hypotheses µψi = µψj ∀ i , j .Multiple hypothesis testingTesting the hypothesis µψ1 = µψ2 = . . . = µψk
- 148 -
logo
Classifier performance evaluation and comparison
Hypothesis Testing
Testing Several Algorithms in Several Datasets
Multiple Hypothesis Testing
Testing all possible pairs of hypotheses µψi = µψj ∀ i , j .Multiple hypothesis testingTesting the hypothesis µψ1 = µψ2 = . . . = µψk
ANOVA vs FriedmanRepeated measures ANOVA: Assumes Gaussianity andsphericityFriedman: Non-parametric test
- 149 -
logo
Classifier performance evaluation and comparison
Hypothesis Testing
Testing Several Algorithms in Several Datasets
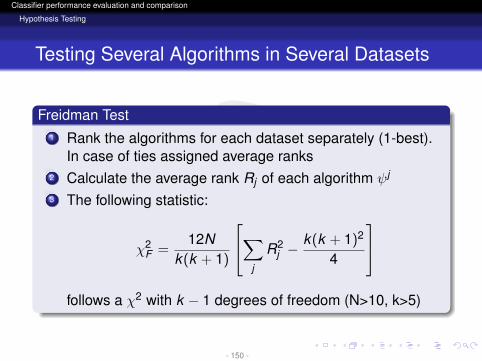
Freidman Test1 Rank the algorithms for each dataset separately (1-best).
In case of ties assigned average ranks2 Calculate the average rank Rj of each algorithm ψj
3 The following statistic:
χ2F =
12Nk(k + 1)
∑j
R2j −
k(k + 1)2
4
follows a χ2 with k − 1 degrees of freedom (N>10, k>5)
- 150 -

logo
Classifier performance evaluation and comparison
Hypothesis Testing
Testing Several Algorithms in Several Datasets
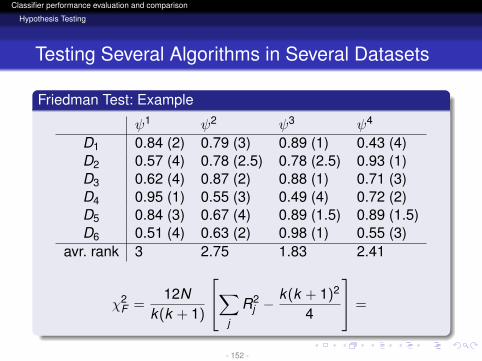
Friedman Test: Example
ψ1 ψ2 ψ3 ψ4
D1 0.84 (2) 0.79 (3) 0.89 (1) 0.43 (4)D2 0.57 (4) 0.78 (2.5) 0.78 (2.5) 0.93 (1)D3 0.62 (4) 0.87 (2) 0.88 (1) 0.71 (3)D4 0.95 (1) 0.55 (3) 0.49 (4) 0.72 (2)D5 0.84 (3) 0.67 (4) 0.89 (1.5) 0.89 (1.5)D6 0.51 (4) 0.63 (2) 0.98 (1) 0.55 (3)
avr. rank 3 2.75 1.83 2.41
- 151 -
logo
Classifier performance evaluation and comparison
Hypothesis Testing
Testing Several Algorithms in Several Datasets
Friedman Test: Example
ψ1 ψ2 ψ3 ψ4
D1 0.84 (2) 0.79 (3) 0.89 (1) 0.43 (4)D2 0.57 (4) 0.78 (2.5) 0.78 (2.5) 0.93 (1)D3 0.62 (4) 0.87 (2) 0.88 (1) 0.71 (3)D4 0.95 (1) 0.55 (3) 0.49 (4) 0.72 (2)D5 0.84 (3) 0.67 (4) 0.89 (1.5) 0.89 (1.5)D6 0.51 (4) 0.63 (2) 0.98 (1) 0.55 (3)
avr. rank 3 2.75 1.83 2.41
χ2F =
12Nk(k + 1)
∑j
R2j −
k(k + 1)2
4
=
- 152 -
logo
Classifier performance evaluation and comparison
Hypothesis Testing
Testing Several Algorithms in Several Datasets
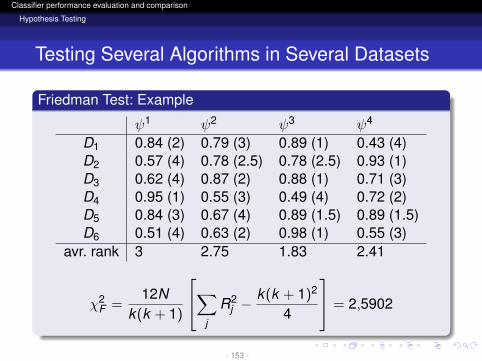
Friedman Test: Example
ψ1 ψ2 ψ3 ψ4
D1 0.84 (2) 0.79 (3) 0.89 (1) 0.43 (4)D2 0.57 (4) 0.78 (2.5) 0.78 (2.5) 0.93 (1)D3 0.62 (4) 0.87 (2) 0.88 (1) 0.71 (3)D4 0.95 (1) 0.55 (3) 0.49 (4) 0.72 (2)D5 0.84 (3) 0.67 (4) 0.89 (1.5) 0.89 (1.5)D6 0.51 (4) 0.63 (2) 0.98 (1) 0.55 (3)
avr. rank 3 2.75 1.83 2.41
χ2F =
12Nk(k + 1)
∑j
R2j −
k(k + 1)2
4
= 2,5902
- 153 -
logo
Classifier performance evaluation and comparison
Hypothesis Testing
Testing Several Algorithms in Several Datasets
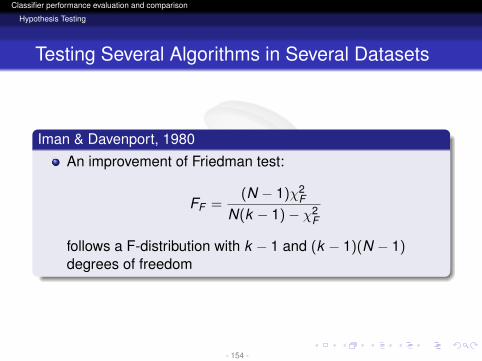
Iman & Davenport, 1980An improvement of Friedman test:
FF =(N − 1)χ2
F
N(k − 1)− χ2F
follows a F-distribution with k − 1 and (k − 1)(N − 1)degrees of freedom
- 154 -
logo
Classifier performance evaluation and comparison
Hypothesis Testing
Testing Several Algorithms in Several Datasets
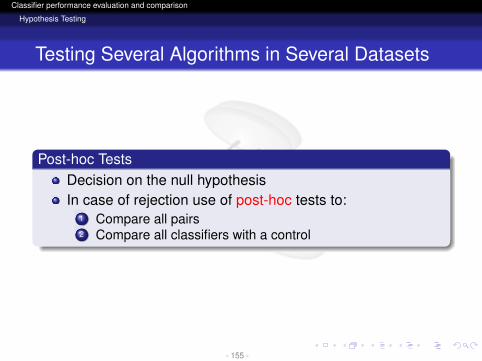
Post-hoc TestsDecision on the null hypothesisIn case of rejection use of post-hoc tests to:
1 Compare all pairs2 Compare all classifiers with a control
- 155 -
logo
Classifier performance evaluation and comparison
Hypothesis Testing
Testing Several Algorithms in Several Datasets
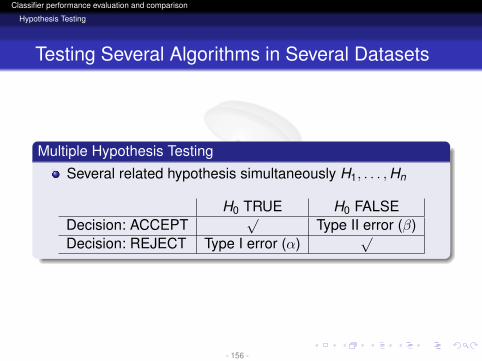
Multiple Hypothesis Testing
Several related hypothesis simultaneously H1, . . . ,Hn
H0 TRUE H0 FALSEDecision: ACCEPT
√Type II error (β)
Decision: REJECT Type I error (α)√
- 156 -
logo
Classifier performance evaluation and comparison
Hypothesis Testing
Testing Several Algorithms in Several Datasets
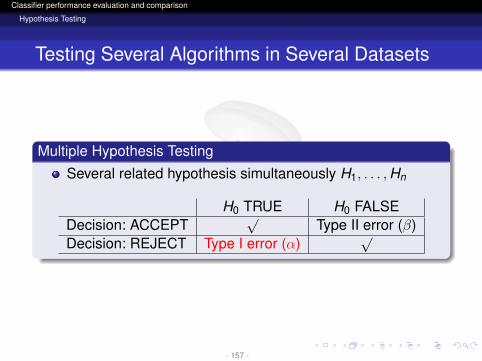
Multiple Hypothesis Testing
Several related hypothesis simultaneously H1, . . . ,Hn
H0 TRUE H0 FALSEDecision: ACCEPT
√Type II error (β)
Decision: REJECT Type I error (α)√
- 157 -
logo
Classifier performance evaluation and comparison
Hypothesis Testing
Testing Several Algorithms in Several Datasets
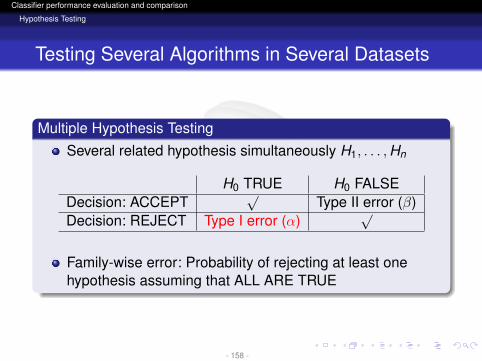
Multiple Hypothesis Testing
Several related hypothesis simultaneously H1, . . . ,Hn
H0 TRUE H0 FALSEDecision: ACCEPT
√Type II error (β)
Decision: REJECT Type I error (α)√
Family-wise error: Probability of rejecting at least onehypothesis assuming that ALL ARE TRUE
- 158 -
logo
Classifier performance evaluation and comparison
Hypothesis Testing
Testing Several Algorithms in Several Datasets
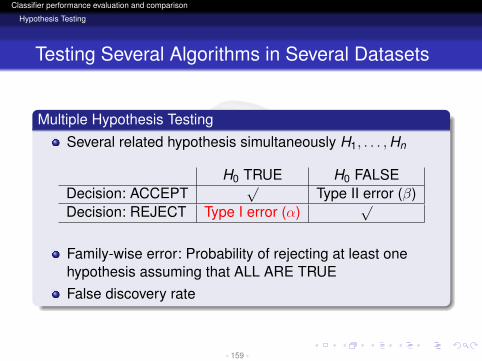
Multiple Hypothesis Testing
Several related hypothesis simultaneously H1, . . . ,Hn
H0 TRUE H0 FALSEDecision: ACCEPT
√Type II error (β)
Decision: REJECT Type I error (α)√
Family-wise error: Probability of rejecting at least onehypothesis assuming that ALL ARE TRUEFalse discovery rate
- 159 -
logo
Classifier performance evaluation and comparison
Hypothesis Testing
Testing Several Algorithms in Several Datasets
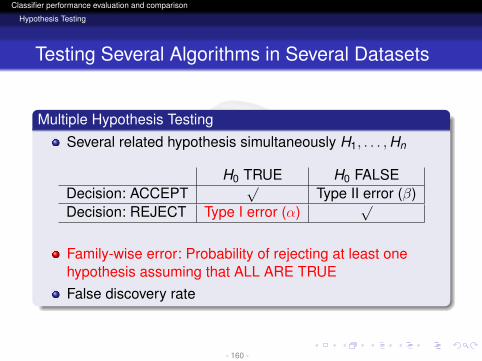
Multiple Hypothesis Testing
Several related hypothesis simultaneously H1, . . . ,Hn
H0 TRUE H0 FALSEDecision: ACCEPT
√Type II error (β)
Decision: REJECT Type I error (α)√
Family-wise error: Probability of rejecting at least onehypothesis assuming that ALL ARE TRUEFalse discovery rate
- 160 -
logo
Classifier performance evaluation and comparison
Hypothesis Testing
Testing Several Algorithms in Several Datasets
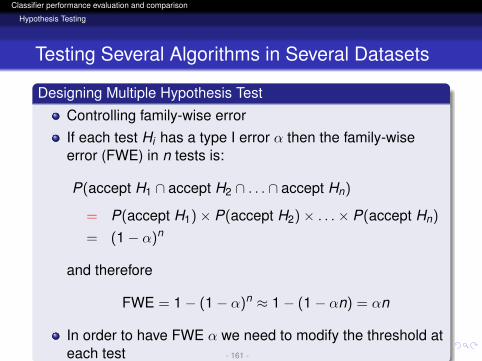
Designing Multiple Hypothesis Test
Controlling family-wise errorIf each test Hi has a type I error α then the family-wiseerror (FWE) in n tests is:
P(accept H1 ∩ accept H2 ∩ . . . ∩ accept Hn)
= P(accept H1)× P(accept H2)× . . .× P(accept Hn)
= (1− α)n
and therefore
FWE = 1− (1− α)n ≈ 1− (1− αn) = αn
In order to have FWE α we need to modify the threshold ateach test - 161 -
logo
Classifier performance evaluation and comparison
Hypothesis Testing
Testing Several Algorithms in Several Datasets
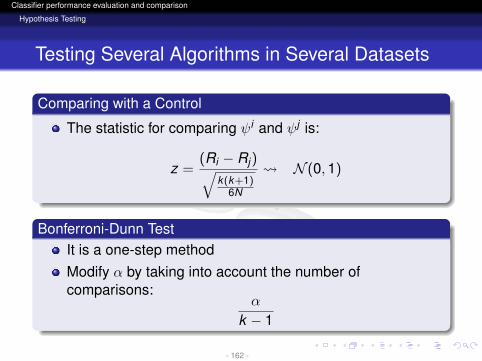
Comparing with a Control
The statistic for comparing ψi and ψj is:
z =(Ri − Rj)√
k(k+1)6N
N (0,1)
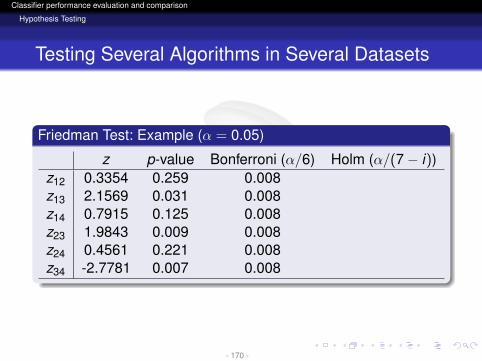
Bonferroni-Dunn TestIt is a one-step methodModify α by taking into account the number ofcomparisons:
α
k − 1
- 162 -
logo
Classifier performance evaluation and comparison
Hypothesis Testing
Testing Several Algorithms in Several Datasets
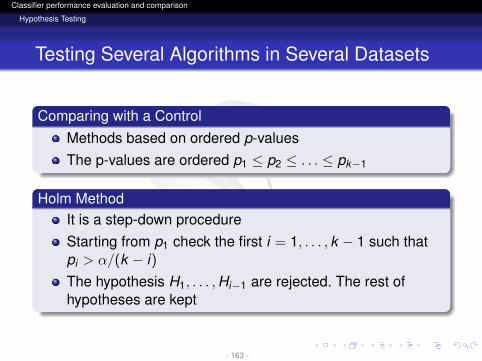
Comparing with a ControlMethods based on ordered p-valuesThe p-values are ordered p1 ≤ p2 ≤ . . . ≤ pk−1
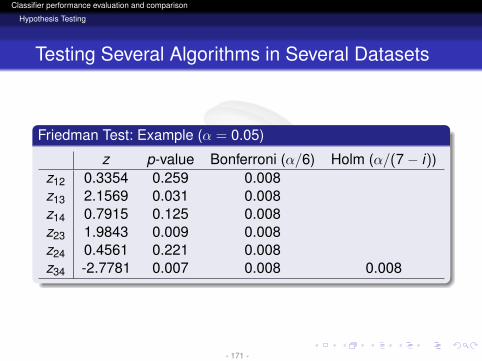
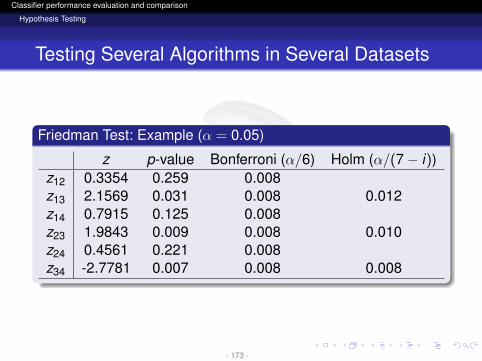
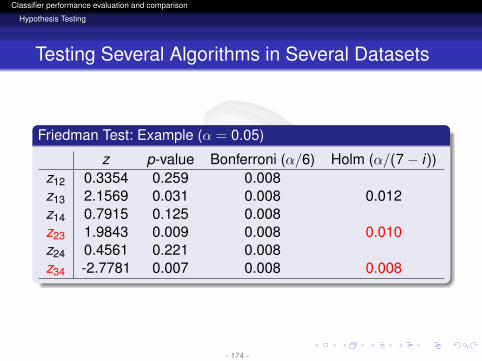
Holm MethodIt is a step-down procedureStarting from p1 check the first i = 1, . . . , k − 1 such thatpi > α/(k − i)The hypothesis H1, . . . ,Hi−1 are rejected. The rest ofhypotheses are kept
- 163 -
logo
Classifier performance evaluation and comparison
Hypothesis Testing
Testing Several Algorithms in Several Datasets
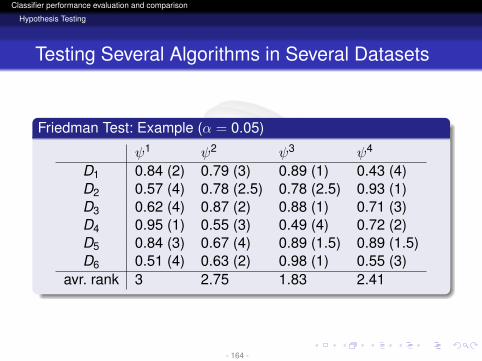
Friedman Test: Example (α = 0.05)
ψ1 ψ2 ψ3 ψ4
D1 0.84 (2) 0.79 (3) 0.89 (1) 0.43 (4)D2 0.57 (4) 0.78 (2.5) 0.78 (2.5) 0.93 (1)D3 0.62 (4) 0.87 (2) 0.88 (1) 0.71 (3)D4 0.95 (1) 0.55 (3) 0.49 (4) 0.72 (2)D5 0.84 (3) 0.67 (4) 0.89 (1.5) 0.89 (1.5)D6 0.51 (4) 0.63 (2) 0.98 (1) 0.55 (3)
avr. rank 3 2.75 1.83 2.41
- 164 -
logo
Classifier performance evaluation and comparison
Hypothesis Testing
Testing Several Algorithms in Several Datasets
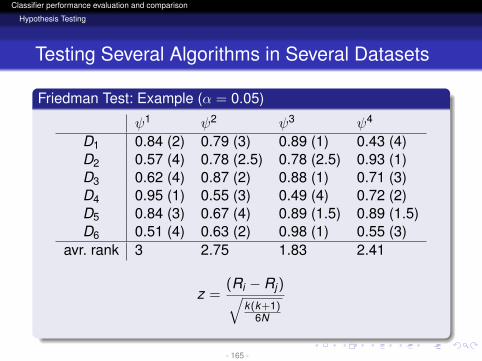
Friedman Test: Example (α = 0.05)
ψ1 ψ2 ψ3 ψ4
D1 0.84 (2) 0.79 (3) 0.89 (1) 0.43 (4)D2 0.57 (4) 0.78 (2.5) 0.78 (2.5) 0.93 (1)D3 0.62 (4) 0.87 (2) 0.88 (1) 0.71 (3)D4 0.95 (1) 0.55 (3) 0.49 (4) 0.72 (2)D5 0.84 (3) 0.67 (4) 0.89 (1.5) 0.89 (1.5)D6 0.51 (4) 0.63 (2) 0.98 (1) 0.55 (3)
avr. rank 3 2.75 1.83 2.41
z =(Ri − Rj)√
k(k+1)6N
- 165 -
logo
Classifier performance evaluation and comparison
Hypothesis Testing
Testing Several Algorithms in Several Datasets
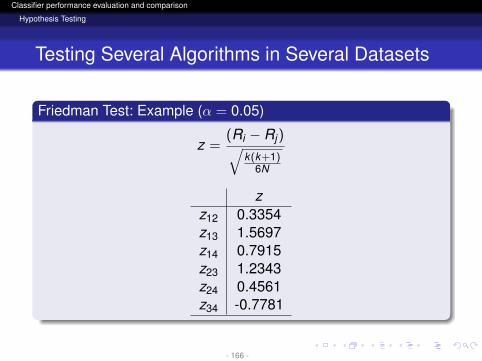
Friedman Test: Example (α = 0.05)
z =(Ri − Rj)√
k(k+1)6N
zz12 0.3354z13 1.5697z14 0.7915z23 1.2343z24 0.4561z34 -0.7781
- 166 -
logo
Classifier performance evaluation and comparison
Hypothesis Testing
Testing Several Algorithms in Several Datasets
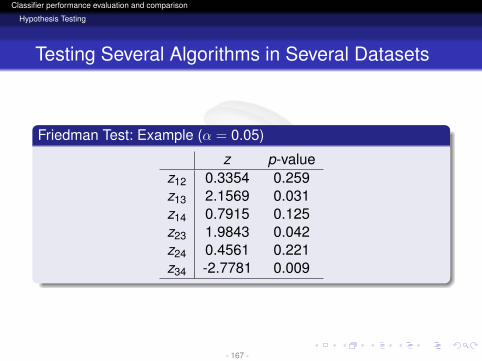
Friedman Test: Example (α = 0.05)
z p-valuez12 0.3354 0.259z13 2.1569 0.031z14 0.7915 0.125z23 1.9843 0.042z24 0.4561 0.221z34 -2.7781 0.009
- 167 -
logo
Classifier performance evaluation and comparison
Hypothesis Testing
Testing Several Algorithms in Several Datasets
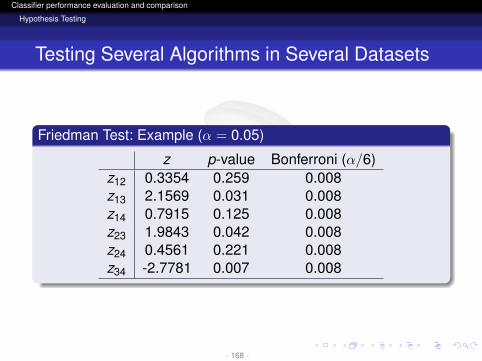
Friedman Test: Example (α = 0.05)
z p-value Bonferroni (α/6)z12 0.3354 0.259 0.008z13 2.1569 0.031 0.008z14 0.7915 0.125 0.008z23 1.9843 0.042 0.008z24 0.4561 0.221 0.008z34 -2.7781 0.007 0.008
- 168 -
logo
Classifier performance evaluation and comparison
Hypothesis Testing
Testing Several Algorithms in Several Datasets
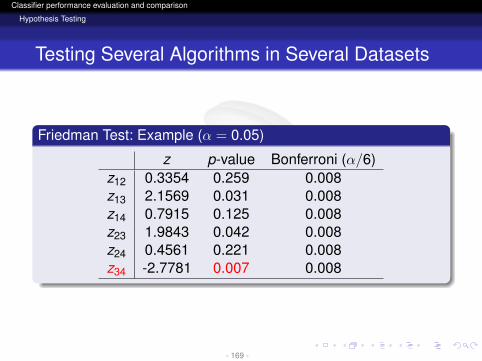
Friedman Test: Example (α = 0.05)
z p-value Bonferroni (α/6)z12 0.3354 0.259 0.008z13 2.1569 0.031 0.008z14 0.7915 0.125 0.008z23 1.9843 0.042 0.008z24 0.4561 0.221 0.008z34 -2.7781 0.007 0.008
- 169 -
logo
Classifier performance evaluation and comparison
Hypothesis Testing
Testing Several Algorithms in Several Datasets
Friedman Test: Example (α = 0.05)
z p-value Bonferroni (α/6) Holm (α/(7− i))z12 0.3354 0.259 0.008z13 2.1569 0.031 0.008z14 0.7915 0.125 0.008z23 1.9843 0.009 0.008z24 0.4561 0.221 0.008z34 -2.7781 0.007 0.008
- 170 -
logo
Classifier performance evaluation and comparison
Hypothesis Testing
Testing Several Algorithms in Several Datasets
Friedman Test: Example (α = 0.05)
z p-value Bonferroni (α/6) Holm (α/(7− i))z12 0.3354 0.259 0.008z13 2.1569 0.031 0.008z14 0.7915 0.125 0.008z23 1.9843 0.009 0.008z24 0.4561 0.221 0.008z34 -2.7781 0.007 0.008 0.008
- 171 -

logo
Classifier performance evaluation and comparison
Hypothesis Testing
Testing Several Algorithms in Several Datasets
Friedman Test: Example (α = 0.05)
z p-value Bonferroni (α/6) Holm (α/(7− i))z12 0.3354 0.259 0.008z13 2.1569 0.031 0.008z14 0.7915 0.125 0.008z23 1.9843 0.009 0.008 0.010z24 0.4561 0.221 0.008z34 -2.7781 0.007 0.008 0.008
- 172 -
logo
Classifier performance evaluation and comparison
Hypothesis Testing
Testing Several Algorithms in Several Datasets
Friedman Test: Example (α = 0.05)
z p-value Bonferroni (α/6) Holm (α/(7− i))z12 0.3354 0.259 0.008z13 2.1569 0.031 0.008 0.012z14 0.7915 0.125 0.008z23 1.9843 0.009 0.008 0.010z24 0.4561 0.221 0.008z34 -2.7781 0.007 0.008 0.008
- 173 -
logo
Classifier performance evaluation and comparison
Hypothesis Testing
Testing Several Algorithms in Several Datasets
Friedman Test: Example (α = 0.05)
z p-value Bonferroni (α/6) Holm (α/(7− i))z12 0.3354 0.259 0.008z13 2.1569 0.031 0.008 0.012z14 0.7915 0.125 0.008z23 1.9843 0.009 0.008 0.010z24 0.4561 0.221 0.008z34 -2.7781 0.007 0.008 0.008
- 174 -
logo
Classifier performance evaluation and comparison
Hypothesis Testing
Testing Several Algorithms in Several Datasets
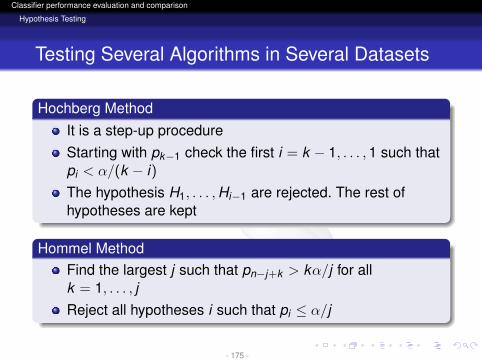
Hochberg MethodIt is a step-up procedureStarting with pk−1 check the first i = k − 1, . . . ,1 such thatpi < α/(k − i)The hypothesis H1, . . . ,Hi−1 are rejected. The rest ofhypotheses are kept
Hommel MethodFind the largest j such that pn−j+k > kα/j for allk = 1, . . . , jReject all hypotheses i such that pi ≤ α/j
- 175 -
logo
Classifier performance evaluation and comparison
Hypothesis Testing
Testing Several Algorithms in Several Datasets
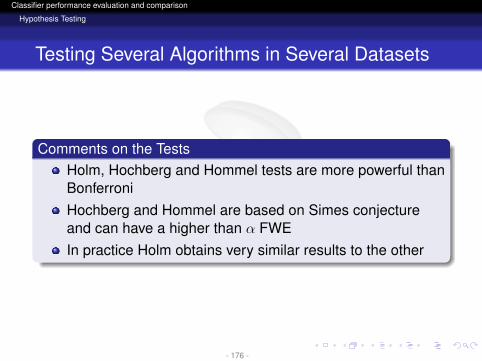
Comments on the TestsHolm, Hochberg and Hommel tests are more powerful thanBonferroniHochberg and Hommel are based on Simes conjectureand can have a higher than α FWEIn practice Holm obtains very similar results to the other
- 176 -
logo
Classifier performance evaluation and comparison
Hypothesis Testing
Testing Several Algorithms in Several Datasets
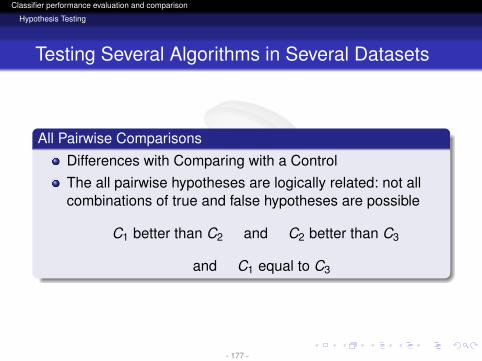
All Pairwise ComparisonsDifferences with Comparing with a ControlThe all pairwise hypotheses are logically related: not allcombinations of true and false hypotheses are possible
C1 better than C2 and C2 better than C3
and C1 equal to C3
- 177 -
logo
Classifier performance evaluation and comparison
Hypothesis Testing
Testing Several Algorithms in Several Datasets
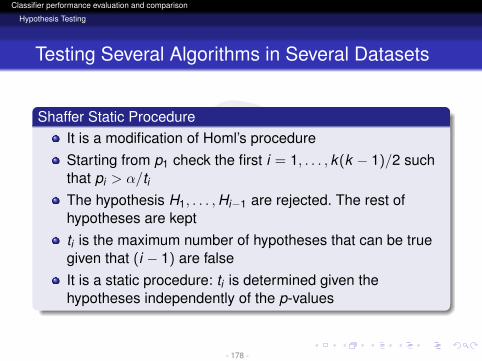
Shaffer Static ProcedureIt is a modification of Homl’s procedureStarting from p1 check the first i = 1, . . . , k(k − 1)/2 suchthat pi > α/tiThe hypothesis H1, . . . ,Hi−1 are rejected. The rest ofhypotheses are keptti is the maximum number of hypotheses that can be truegiven that (i − 1) are falseIt is a static procedure: ti is determined given thehypotheses independently of the p-values
- 178 -
logo
Classifier performance evaluation and comparison
Hypothesis Testing
Testing Several Algorithms in Several Datasets
Shaffer Dynamic ProcedureIt is similar to the previous procedure but ti is changed by t∗it∗i considers the maximum number of hypotheses that canbe true given that the previous (i − 1) hypotheses are falseIt is a dynamic procedure as t∗i depends on the hypothesesalready rejectedIt is more powerful than the Shaffer Static Procedure
- 179 -
logo
Classifier performance evaluation and comparison
Hypothesis Testing
Testing Several Algorithms in Several Datasets
Bregmann & Hommel
More powerful alternative than Shaffer Dynamic ProcedureDifficult implementation
RemarksAdjusted p-values
- 180 -
logo
Classifier performance evaluation and comparison
Hypothesis Testing
Conclusions
Two Classifiers in a DatasetThe complexity of the estimation of the scores makes itdifficult to carry out good statistical testing
Two Classifiers in Several DatasetsWilcoxon Signed-Ranks Test is a good choiceIn case of many datasets and to avoid thecommensurability problem the Signed test could be used
- 181 -
logo
Classifier performance evaluation and comparison
Hypothesis Testing
Conclusions
Several Classifiers in Several DatasetsFriedman or Iman & Davenport are requiredPost-hoc test more powerful than Bonferroni:
Comparison with a control: Holm methodAll-to-all comparison: Shaffer Static method
An Idea for Future WorkTo consider the variability of the score in each classifierand dataset
- 182 -
logo
Classifier performance evaluation and comparison
Hypothesis Testing
Classifier performance evaluation andcomparison
Jose A. Lozano, Guzmán Santafé, Iñaki Inza
Intelligent Systems GroupThe University of the Basque Country
International Conference on Machine Learning and Applications (ICMLA 2010)December 12-14, 2010
- 183 -