classification of indian stock market data using machine ... · classification of indian stock...
TRANSCRIPT

Sneha Soni et. al. / (IJCSE) International Journal on Computer Science and Engineering Vol. 02, No. 09, 2010, 2942-2946
Classification of Indian Stock Market Data Using Machine Learning Algorithms
Sneha Soni Shailendra Shrivastava
Research Scholar, Dept. of Information Technology Prof., Dept.of Information Technology Samrat Ashok Technological Institute Samrat Ashok Technological Institute
VIDISHA, M.P., India VIDISHA, M.P., India
Abstract-- Classification of Indian stock market data has always been a certain appeal for researchers. In this paper, first time combination of three supervised machine learning algorithms, classification and regression tree (CART) , linear discriminant analysis (LDA) and quadratic discriminant analysis (QDA) are proposed for classification of Indian stock market data, which gives simple interpretation of stock market data in the form of binary tree, linear surface and quadratic surface respectively. These resulted forms help market analyst to make decision on selling, purchasing or holding stock for a particular company in Indian stock market. In section IV and V, experimental results and performance comparison section show that classification and regression tree misclassification rate is only 56.11% whereas LDA and QDA show 74.26% and 76.57% respectively. Smaller misclassification reveals that CART algorithm performs better classification of Indian stock market data as compared to LDA and QDA algorithms.
Keywords - Machine learning algorithm; classification; In-
dian stock market
I. INTRODUCTION
Under the domain of supervised machine learning, classi-fication has been studied extensively. In supervised machine learning class labels or target value are already known to the user [4]. In this paper classification of Indian stock market data is done using machine learning algorithm that comes under supervised machine learning and a type of decision tree algorithm called classification and regression tree. With the help of classification and regression tree, linear discriminant analysis and quadratic discriminant analysis of Indian stock market data is classified which provide simple interpretation of Indian stock market data in the form of binary tree, linear and quadratic surfaces. It help market analyst to make deci-sion on selling, purchasing or holding stock for a particular company in Indian stock market for profit. The work proposed in this paper is unique as compared to other works in literature because we have used a combination of supervised machine learning algorithms for classification of Indian stock market data while other works consist of un-supervised machine learning algorithms i.e feed forward neural network [34], genetic algorithm [35], rough set theory [34], support vector machine and text mining[38], multilayer perceptron [38] applied for foreign stock market data which belongs to foreign countries like Taiwan stock exchange [31], New York stock exchange [34], Thailand stock exchange [35], and German and Tokyo stock exchange [35], Songhai
stock exchange, [35], Japanese stock exchange [38]. Algo-rithms in this paper are strong enough to handle all types of dataset which can be numeric and nonnumeric which is not possible in previous research works.
II. MACHINE LEARNING ALGORITHMS
In this paper three supervised machine learning algorithms CART (classification and regression tree), LDA (linear dis-criminant analysis) and QDA (quadratic discriminant analy-sis) are used for classifying Indian stock market data.
A. Classification and Regression Tree (CART)
It was introduced by Breiman in 1984. It builds both classifi-cations and regression tree.Gini index measure is used for selecting splitting attribute. Pruning is done on training data set. It can deal with both numeric and categorical attributes and can also handle missing attributes [2] The CART monograph focuses on the Gini rule, which is similar to the better known entropy or information-gain crite-rion [3]. For a binary (0/1) target the “Gini measure of im-purity” of a node t is:
1 1 (1)
1 (2) Classification and regression tree always calculates class fre-quencies in any node relative to the class frequencies in the root. For a binary (0/1) target any node is classified as class 1 if, and only if,
/ / (3) Classification and regression tree provide automatic construc-tion of new features within each node and for the binary tar-get. Single feature is given by following equation:
(4) Where, is the original attribute vector and is a scaled difference of means vector across the two classes [3].
B. Linear Discriminant Analysis (LDA) It searches for those vectors in the underlying space that
best discriminate, among classes rather than those that best describe the data. Mathematically speaking, for all the sam-ples of linear discriminant analysis classes, define two meas-ures, one is called within class scatter matrix, as given by:
ISSN : 0975-3397 2942

Sneha Soni et. al. / (IJCSE) International Journal on Computer Science and Engineering Vol. 02, No. 09, 2010, 2942-2946
5
Where is the sample of class j and is the mean of class j, c is the number of classes and the number of sam-ples in class j. Second measure is called between-class scatter matrix. It is given by:
µ µ 6
Where, µ represent mean of all classes [5] [6]. Linear discri-minant analysis has been a popular method for extracting fea-tures which preserve class separability. It has been widely used in many fields of information processing, such as ma-chine learning, data mining, information retrieval, and pattern recognition. Linear discriminant analysis is one approach to dimensionality reduction that makes use of a linear transfor-mation matrix whereas the widely used Fisher's linear discri-minant analysis is "sub-optimal" when the sample class cova-riance matrices are unequal, i.e. another linear transformation exist that produces lower loss in discrimination power [5] [6].
C. Quadratic Discriminant Analysis (QDA) A quadratic classifier is used in machine learning and sta-
tistical classification to separate measurements of two or more classes of objects or events by a quadric surface. It is a more general version of the linear classifier [22]. QDA may be thought of as a direct extension of the classical linear discri-minant analysis (LDA) method pioneered by R. A. Fisher. LDA differs from QDA by further assuming that the two dis-tributions have the same covariance. Quadratic discriminant analysis (QDA) is closely related to linear discriminant analy-sis (LDA), where it is assumed that there are only two classes of point and that the measurements are normally distributed. It derives a robust local generative classifier [22]. Quadratic discriminant analysis (QDA), which relaxes the identical co-variance assumption and allows for nonlinear discriminant boundaries to be formed, seems to be a better choice. The applicability of QDA to problems such as face recognition, where the number of training samples is much smaller than the dimensionality of the sample space is problematic as greater numbers of parameters are required to learn [5].
III. APPLICATION OF MACHINE LEARNING AL-
GORITHMS
A. Classification and Regression Tree (CART) Some of the application areas of CART are finance, med-ical [3], [7], [8], spatial data mining and prediction [11], pre-diction of financial and risk management areas [3], weed clas-sification [18] and many more. Heidi Boerstler and John M. de Figueiredo in [7] presented CART as compute-rized recursive partitioning program to identify potential high users of services among low-income psychiatric outpatients. Garzotto Mark et al in [8] presented a tree analysis using
CART algorithm for improved detection of the prostate Can-cer. Chee Jen Chanage in [3] presented CART algorithm for partitioning groups in biomedical. W. Hannover et al in [13] proposed classification and regression tree model for decision making clinical practice. Srinivas Mukkamata et al in [14] presented computational intelligent techniques that can be useful at the diagnosis stage to assist the oncologist in identi-fying the malignancy of a tumor. Brain Canada, et al in [15] presented CART for doing automatic segmentation and classi-fication of zebrafish phenotyping. Oliver Wirjadi et al in [16] presented a supervised learning method for image classifica-tion. Huajin in [17] used CART for predicting hip fracture recursive partitioning methods. Dennis White et al in [19] presented a mapping of multivariate spatial relationships from regression tree by partitions of color visual variable.
B. Linear Discriminant Analysis (LDA) Linear discriminant analysis, supervised machine learn-
ing algorithm also find its application in signal classification applications, for classification of human chromosomes, for age-group classification using facial image, heartbeat classi-fication ,hyper spectral image classification, speech/Music classification, arrhythmia classification, partial discharge classification on high voltage equipment, detection and classi-fication breast cancer in digital mammograms, multiple bi-nary classifications, face recognition, handwriting recogni-tion, speech recognition, bankruptcy prediction, and also in marketing[21]. Hargrove, L.J, et al in [21] presented applica-tion of linear discriminant analysis for pattern recognition based myoelectric control system that uses parallel binary classification and class specific thresholds. Lingyan Sheng and Pique Regi, et al in [22] performed gene array classifica-tion our algorithm is tested using 10 fold cross validation. Wei Chen and Kaiqi Huang, et al in [23] presented applica-tion of linear discriminant analysis for face recognization that uses matrix based data representation which can deal under sampled problem. Mohamed et al in [24] presented computer-aided diagnosis system based on combination of support vec-tor machine and linear discriminant analysis classifier for detection and classification breast cancer in digital mammo-grams. Tourneret J.Y and Mailhes C., et al in [25] presented classification of altimetric signals using linear discriminant analysis, where author addresses problem of classifying alti-metric waveforms backscattered from different kinds of sur-faces including oceans, ices, deserts and forests. Jain A. and Huang, J., et al in [26] presented computer vision and pattern recognition systems using linear discriminant for automated face detection, face and gesture recognition, and estimation of gender and age.
C. Quadratic Discriminant Analysis (QDA) Roula M.A. Bouridane et al in [27] presented application
of quadratic discriminant analysis for automatic classification of prostate cancer diagnosis. Agostini, G. Longari et al in [28] used quadratic discriminant for musical instrument timbres classification with spectral features. Jun Sang et al in [29] presented that quadratic discriminant analysis gives reliable
ISSN : 0975-3397 2943

Sneha Soni et. al. / (IJCSE) International Journal on Computer Science and Engineering Vol. 02, No. 09, 2010, 2942-2946
result for prediction of liver cancer as compared to other pre-diction techniques. Juwei Lu Plataniotis et al in [30] used quadratic discriminant analysis for classification of electroen cephalo graph (EEG). Jih Chang et al in [31] provided unique application of quadratic discriminant analysis for financial early warning system.
IV. EXPERIMENTAL RESULTS
As in our proposed work classification and regression tree, linear discriminant and quadratic discriminant analysis algo-rithm are used, which fall under the category of supervised machine learning used for classification of data that learn instances by organizing the attributes of the dataset into rules in certain structure i.e. classification and regression tree or-ganize rules in the form of tree, where each node in the tree performs a test on a certain attribute and the leaf nodes con-tain the target attributes. Instances are classified by sorting them down the tree starting from the root until the target attribute is found. Similarly linear discriminant and quadratic discriminant analysis organize rule in the form of linear and quadratic surface as shown in the Fig 1, fig 2, and fig 3.
Figure 1. Output window for CART supervised machine learning algorithm
Figure 2. Output window for LDA, supervised machine learning algorithm
Figure 3. Output window for QDA, supervised machine learning algorithm
In this paper, classification of Indian stock market dataset is done by three machine learning algorithm as discussed in section II. Real life data has been taken from stock market trading company situated at India. The dataset consists of 303 instances of index values of companies along with name of companies. Its nature is multivariate consists of simultaneous observation and analysis of more than one statistical variable.
V. PERFORMANCE COMPARISONS
In literature classification algorithm, classifier perfor-mance can be measured on the same data. On the basis of results obtained CART algorithm is found better than other
ISSN : 0975-3397 2944
Sneha Soni et. al. / (IJCSE) International Journal on Computer Science and Engineering Vol. 02, No. 09, 2010, 2942-2946
two algorithms. Comparisons of machine learning algorithms have been done on the basis of the misclassification and cor-rect classification rate. It is observed that classification and regression tree machine learning classifier performance is better than linear and quadratic discriminant analysis classifi-er in context of misclassification rate and correct classifica-tion rate.
TABLE I. RESULT COMPARISION OF CART,LDA AND QDA
Algorithm Misclassification
rate Correct Classification
rate CART 0.5611 0.4389 LDA 0.7426 0.2574 QDA 0.7657 0.2343
According to obtained results of classification in table 1 fol-lowing graph can be drawn.
Figure 4. Graph form misclassification error rate between CART, LDA and
QDA
Figure 5. Graph for correct classification error rate between CART, LDA
and QDA
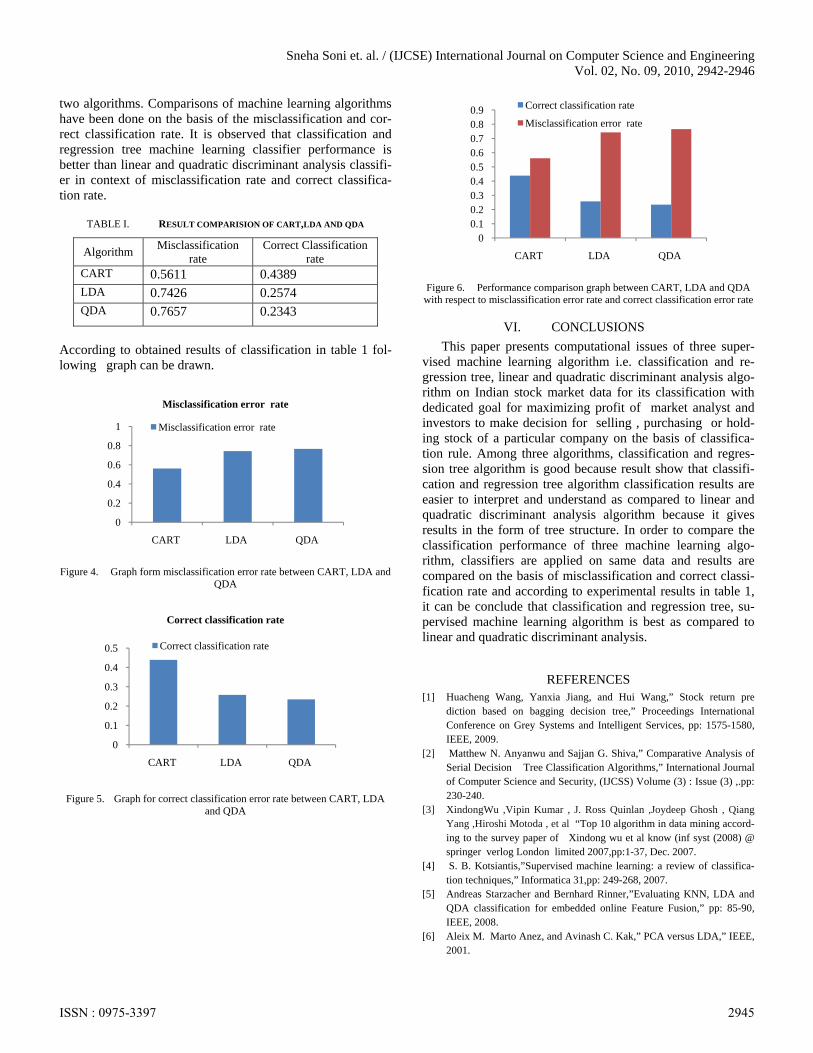
Figure 6. Performance comparison graph between CART, LDA and QDA
with respect to misclassification error rate and correct classification error rate
VI. CONCLUSIONS
This paper presents computational issues of three super-vised machine learning algorithm i.e. classification and re-gression tree, linear and quadratic discriminant analysis algo-rithm on Indian stock market data for its classification with dedicated goal for maximizing profit of market analyst and investors to make decision for selling , purchasing or hold-ing stock of a particular company on the basis of classifica-tion rule. Among three algorithms, classification and regres-sion tree algorithm is good because result show that classifi-cation and regression tree algorithm classification results are easier to interpret and understand as compared to linear and quadratic discriminant analysis algorithm because it gives results in the form of tree structure. In order to compare the classification performance of three machine learning algo-rithm, classifiers are applied on same data and results are compared on the basis of misclassification and correct classi-fication rate and according to experimental results in table 1, it can be conclude that classification and regression tree, su-pervised machine learning algorithm is best as compared to linear and quadratic discriminant analysis.
REFERENCES [1] Huacheng Wang, Yanxia Jiang, and Hui Wang,” Stock return pre
diction based on bagging decision tree,” Proceedings International Conference on Grey Systems and Intelligent Services, pp: 1575-1580, IEEE, 2009.
[2] Matthew N. Anyanwu and Sajjan G. Shiva,” Comparative Analysis of Serial Decision Tree Classification Algorithms,” International Journal of Computer Science and Security, (IJCSS) Volume (3) : Issue (3) ,.pp: 230-240.
[3] XindongWu ,Vipin Kumar , J. Ross Quinlan ,Joydeep Ghosh , Qiang Yang ,Hiroshi Motoda , et al “Top 10 algorithm in data mining accord-ing to the survey paper of Xindong wu et al know (inf syst (2008) @ springer verlog London limited 2007,pp:1-37, Dec. 2007.
[4] S. B. Kotsiantis,”Supervised machine learning: a review of classifica-tion techniques,” Informatica 31,pp: 249-268, 2007.
[5] Andreas Starzacher and Bernhard Rinner,”Evaluating KNN, LDA and QDA classification for embedded online Feature Fusion,” pp: 85-90, IEEE, 2008.
[6] Aleix M. Marto Anez, and Avinash C. Kak,” PCA versus LDA,” IEEE, 2001.
0
0.2
0.4
0.6
0.8
1
CART LDA QDA
Misclassification error rate
Misclassification error rate
0
0.1
0.2
0.3
0.4
0.5
CART LDA QDA
Correct classification rate
Correct classification rate
00.10.20.30.40.50.60.70.80.9
CART LDA QDA
Correct classification rate
Misclassification error rate
ISSN : 0975-3397 2945

Sneha Soni et. al. / (IJCSE) International Journal on Computer Science and Engineering Vol. 02, No. 09, 2010, 2942-2946
[7] Heidi Boerstler and Jhon M.de Fiqueiredo, “Prediction of use of Psychiatric Service: Application of CART Algorithm,” College of Business and Administrative and School of Nursing, university of Colo-rado, USA.
[8] Garzotto Mark ,Beer Tomasz and M.Hudson R, “Improved Detection of Prostate cancer using Classification and Regression tree Analysis,” Journal of Clinical Oncology, July 2005.
[9] Anton Andriyashin, “Financial Application of Classification and Re-gression tree,” Center of applied Statics and economics Humboldt Uni-versity, Berlin 2005.
[10] Anna Jurek and Danuta Zakrzewska, “Improving Naive Bayes Models of Insurance Risk by Unsupervised Classification,” Proceedings of the International Multiconference on Computer Science and Information Technology, pp. 137–144.
[11] L.Bel, D.Allard, J.M. Laurent, R.Cheddadi and A.Bar-Hen, “CART Algorithm for Spatial Data: Application to Environmental and Ecologogical data,” IEEE, 2008.
[12] Elia Georgiana petre, “A decision tree for weather Prediction,” pp: 77-82, IEEE, 2009.
[13] W. Hannover, M.Richard , N.B. Hansen , Z. Martinovich and H.Kordy, “A classification tree model for decision making in clinical practice : An Application based on Data of the germa Multicenter Study on eating Disorder,” Project TR_EAT Germany, Dec 2002.
[14] Srinivas Mukkamata,Qing Zhang Liu , Rajeev Verraghattam , Andrew and H. Sung ,” Computattional Intelligent Techniques for Tumor Clas-sification (Ubibs Microarray Gene Expression Data),” Dept of Comp.Sc , New MAxico Tech, Socorro NM , USA 2002.
[15] Brain Canada, Georgia Thomas, Keith Cheng and James Z.Wang,” Automated Segmentation and classification of Zebrafish Histology im-age for high Throughput Phenotyping “2008.
[16] Oliver Wirjadi , Thomas M.Beeeuel, Wolfgang Feiden and Yoo-jin Kim , “Automated feature selection for the classification of Men-ingioma Cell Nuclei,” Institute of Neuropathology ,2006.
[17] Huajin,”Classification Algorithm for hip Fracture Prediction Based on Recursive Partitioning Methods,” Dept of Radiology , University of California , San Friancisco, South Chaina ,2004.
[18] Juraiza Ishak , Asnor ,Md Tahir , Nooritawati Hussan , Aini Mustafa and Mohd Marzuki ,”Weed Classification using classification using De-cision Tree,” International Symposium on Volumn 2 issue 26-28, pp:1-5, Aug 2008.
[19] Dennis White and Jean C. Sifneos “Mapping Multivariate Spatial Rela-tionships from Regression trees by Partition of color Visual Variables.”
[20] H.S.Gupta ”Classifying linear system outputs by robust local Bayesian quadratic discriminant analysis on linear estimators,“ pp: 789 – 792,IEEE, 2009.
[21] Hargrove, L.J., Scheme, E.J., Englehart, K.B., Hudgins, B.S.” Multi-ple Binary Classifications via Linear Discriminant Analysis for Im-proved Controllability of a Powered Prosthesis,” Neural Systems and Rehabilitation Engineering, IEEE Transactions on Volume: 18, Issue: 1, Page(s): 49 – 57, 2010.
[22] Lingyan Sheng, Pique-Regi, R., Asgharzadeh, S., Ortega, A,” Microar-ray classification using block diagonal linear discriminant analysis with embedded feature selection, “Acoustics, Speech and Signal Processing, 2009.
[23] Wei Chen, Kaiqi Huang, Tieniu Tan,Dacheng Tao ,” A convergent solution to two dimensional linear discriminant analysis, “Image Proc-essing (ICIP), 2009.
[24] Alolfe, M.A., Mohamed, W.A., Youssef, A.B.M., Mohamed, A.S., Kadah, Y.M,”Computer aided diagnosis in digital mammography using combined support vector machine and linear discriminant analyasis classification, “Image Processing (ICIP), pp: 2609–2612, 2009.
[25] Tourneret, J.-Y.,Mailhes, C.,Amarouche, L., Steunou, N.,” Classifica-tion of Altimetric Signals using Linear Discriminant Analysis” Geo-science and Remote Sensing Symposium, 2008.
[26] Jain, A. and Huang, J.,”Integrating independent components and linear discriminant analysis for gender classification Automatic Face and Gesture Recognition,” Proceedings. Sixth IEEE In-ternational Conference on pp: 159 – 163, 2004.
[27] Roula, M. A. Bouridane, A. Kurugollu, F. Amira, A , ”A quadratic classifier based on multispectral texture features for prostate cancer di-agnosis,” Signal Processing and Its Applications, pp:37-40, 2003..
[28] Agostini, G. Longari, M. Pollastri and E. Dipt , “Musical instrument timbres classification with spectral fea-tures”, multimedia Signal Processing, pp:97-102,2001.
[29] Jun Sang Yihui Liu Qiang Liu Baopeng Li Jinyong Cheng,”Classification of 31P MRS for liver cancer in vivo”, On pp: 1 – 4, 2009.
[30] Juwei Lu Plataniotis, K.N. Venetsanopoulos, A.N.,” Regularized D-LDA for face recognition”, Acoustics, Speech, and Signal Processing, IEEE, 2003.
[31] Jih-Chang Hsieh Shih-Hsin Chen Pei-Chann Chang,”Application of Artificial Immune System in Constructing a Financial Early Warning System: An Example of Taiwanese Banking Industry”, Innovative Computing, Information and Control, pp: 183 – 183, IEEE 2007.
[32] Mr. Pritam R. Charkha,” Stock price prediction and trend prediction using neural networks,” First International Conference on Emerging Trends in Engineering and Technology, pp: 592-594, IEEE, 2008.
[33] Jacek Mandziuk and Marcin Jaruszewicz,” Neuro-evolutionary ap-proach to stock market prediction,” Proceedings of International Joint Conference on Neural Networks, IEEE, 2007.
[34] Hameed Al-Qaheri, Shariffah Zamoon, and Aboul Ella Hassanien, “Rough set generating prediction rules for stock price movement,” Sec-ond UKSIM European Symposium on computer modelling and simula-tion , IEEE computer society , 2008 .
[35] Sunisa Rimcharoen, Daricha Sutivong and Prabhas Chongstitvatana ,”Prediction of the stock exchange of Thailand using adaptive evolution strategies,” Proceedings of the 17th IEEE International Conference on Tools with Artificial Intelligence (ICTAI’05),IEEE, 2005.
[36] Gabriel hi Cheong Fung, Jeffrey Xu Yu and Wai Lam,”Stock Predic-tion: integrating text mining approach using real-time news,” pp: 395-402, IEEE, 2003.
[37] Karsten Schierholt and Cihan H. Dagli,”Stock market prediction using different neural network classification architectures”, IEEE, 1996.
[38] Dong Jing-rong,”Combining stock market volatility forecasts using a Bayesian technique,” pp: 1-5, IEEE, 2008.
ISSN : 0975-3397 2946