class size reduction
TRANSCRIPT

Class Size Reduction
Report of FY 2014 and FY 2015
Prepared by the
Utah State Office of Education
October 31, 2015
Brad Smith, State Superintendent of Public Instruction [email protected] Sydnee Dickson, Deputy State Superintendent [email protected] Scott Jones, Associate Superintendent of Business and Operations [email protected]

2
Table of Contents Program Description and Current Formula .................................................................................................. 3
Legislative Intent Language .......................................................................................................................... 4
Research and National Standards Regarding Class Size................................................................................ 4
Methods of Calculating Class Size and Data Used ........................................................................................ 6
Online Programs and Necessarily Existent Small Schools ............................................................................. 7
Total Cost of a Statewide Class Size Maximum ............................................................................................. 7
Funding Class Size Reduction ........................................................................................................................ 9
Fiscal Year 2014 Class Size Reduction Survey Results ................................................................................. 10
Impact of Moving Class Size Reduction Into the WPU Value ..................................................................... 11
Impact of Distributing the Class Size Reduction Appropriation on K‐3 or K‐5 ADM ................................... 11
Program Standards/Performance Measures .............................................................................................. 12
Courses of Action ........................................................................................................................................ 12
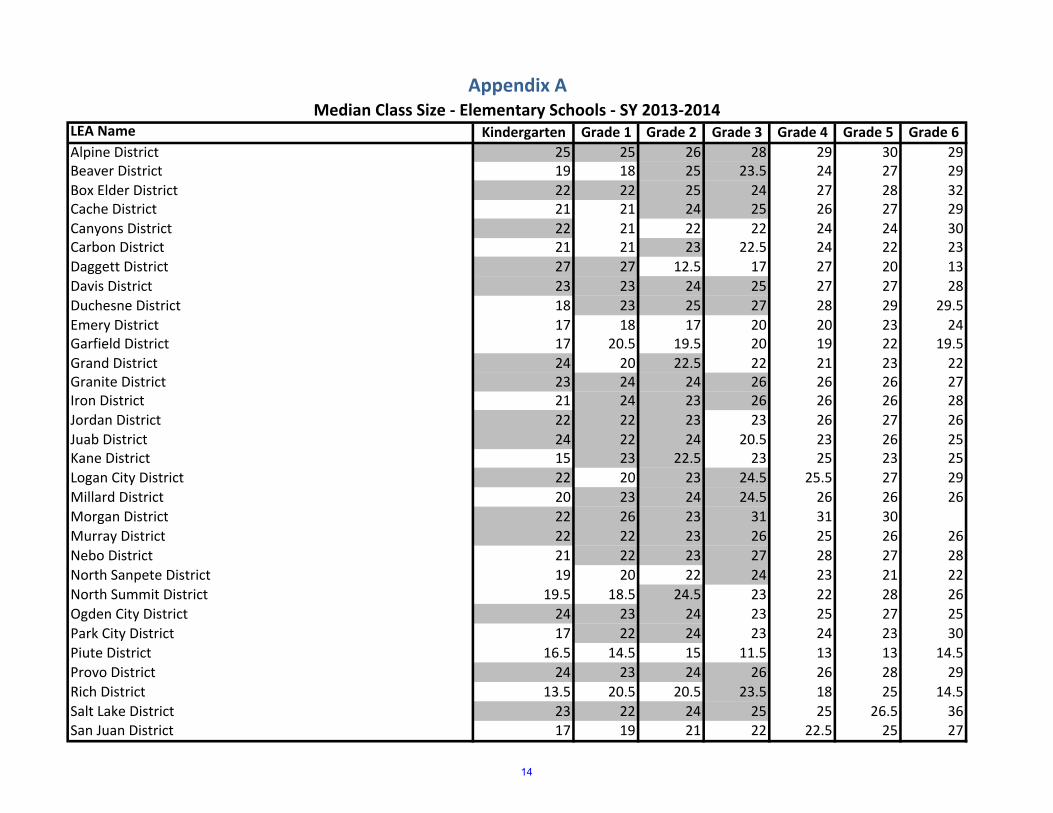
Appendix A – Median Class Size in Elementary Schools, 2013‐14 .............................................................. 14
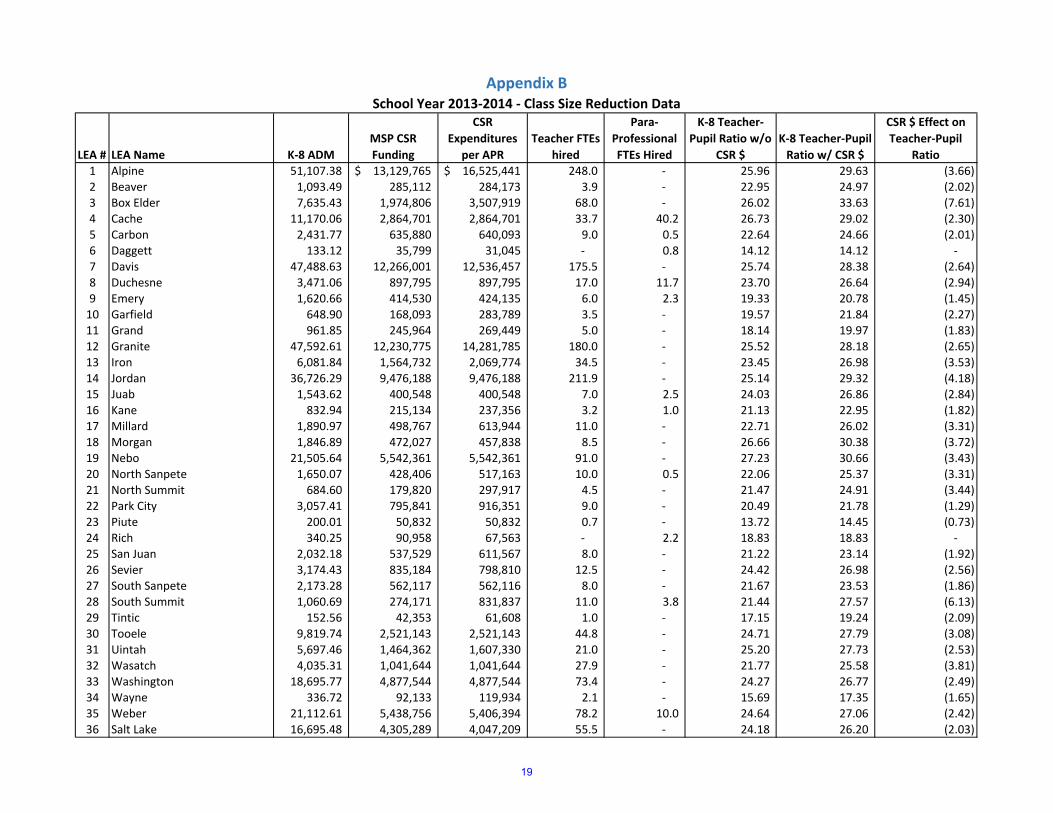
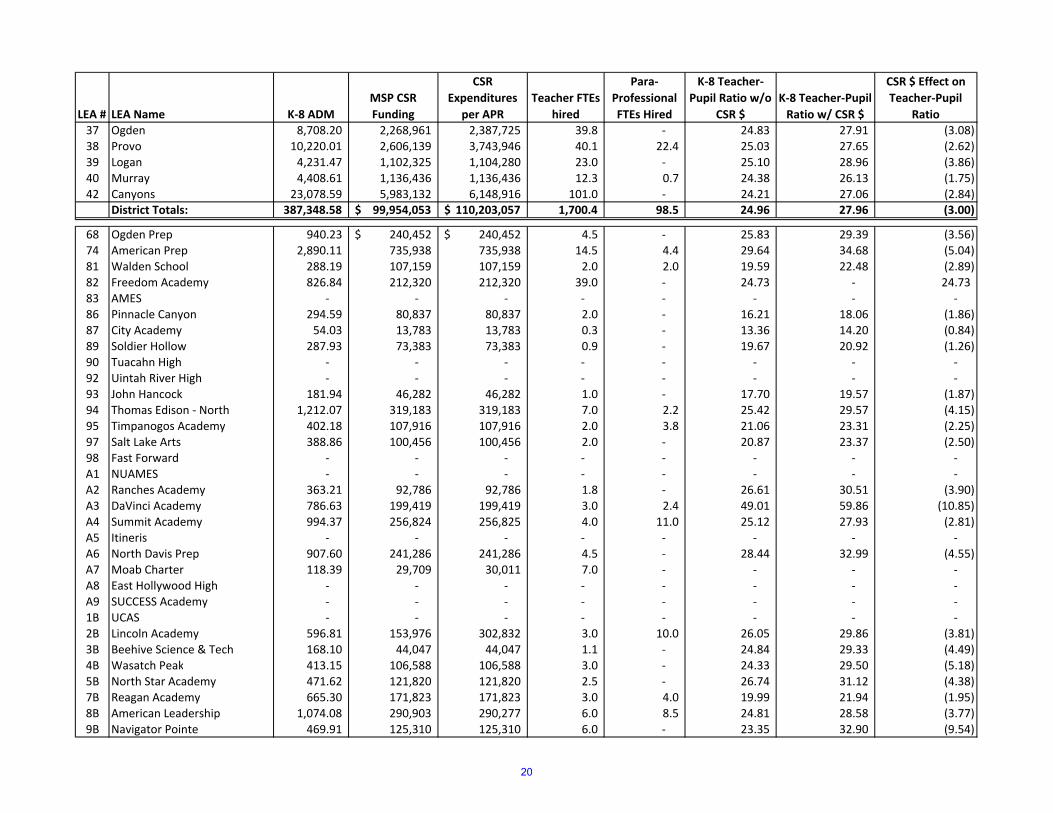
Appendix B – Class Size Reduction Data, 2013‐14 ...................................................................................... 19
Appendix C – Impact of Moving Class Size Reduction Into the WPU Value, Projected FY 2017 ................ 23
Appendix D – Class Size Reduction Funding Based on Grades K‐3 and K‐5, FY 2016 ................................. 28

3
Class Size Reduction Appropriation In Compliance with Intent Language of HB2 of the 2015 General Legislative Session
Minimum School Program Title: Class Size Reduction
USOE Section Reporting: School Finance
FY 15 Allocation: $115,783,200
Authorization: 53A‐17a‐124.5
Program Description and Current Formula The Utah State Legislature provides an appropriation to each Local Education Agency (LEA) annually to be used to reduce the average class size in kindergarten through the eighth grade in the state's public schools. This appropriation is to be allocated to LEAs in the state on the basis of prior year average daily membership (ADM) plus growth for grades K‐8. Each LEA’s total K‐8 ADM plus growth is divided by the statewide K‐8 ADM plus growth and multiplied by the total Class Size Reduction appropriation to determine each LEA’s allocation. This means that each LEA in the state receives class size money based solely on their K‐8 ADM from the prior year. The history of the Class Size Reduction appropriation is presented in Table 1. Table 2 presents total enrollment, and enrollment in K‐3 and K‐8. Table 3 presents a comparison of the increase in the Class Size Reduction appropriation to the increase in K‐8 enrollment.
Table 1. History of Program Weighted Pupil Units and
Appropriations ‐ FY 1993 to FY 2016
Fiscal Program Program Percent
Year WPUs Appropriation Change
1993 2,946 $4,389,540
1994 7,442 11,053,098 151.8%
1995 9,609 15,451,272 39.8%
1996 11,144 18,632,768 20.6%
1997 25,858 44,967,062 141.3%
1998 25,858 46,311,678 3.0%
1999 25,804 47,840,616 3.3%
2000 29,577 56,225,877 17.5%
2001 29,577 59,331,462 5.5%
2002 29,577 62,584,932 5.5%
2003 29,757 63,441,924 1.4%
2004 29,757 63,977,550 0.8%
2005 30,203 65,902,946 3.0%
2006 30,773 70,162,440 6.5%
2007 30,773 74,378,341 6.0%
2008 32,749 82,330,986 10.7%
2009 34,293 88,373,061 7.3%
2010 35,133 90,537,741 2.4%
2011 35,836 92,349,372 2.0%
2012 36,768 103,538,688 12.1%
2013 37,540 106,688,700 3.0%
2014 38,307 111,052,000 4.1%
2015 38,958 115,783,200 4.3%
2016 39,457 122,001,000 5.4%
Table 2. Enrollment History
Fiscal Year Total Enrollment K‐3 Enrollment K‐8 Enrollment
2005 495,682 157,298 339,707
2006 510,012 164,397 350,969
2007 524,003 175,025 372,321
2008 537,653 179,715 383,460
2009 551,013 184,685 395,570
2010 563,273 188,583 405,912
2011 576,335 192,095 415,628
2012 587,745 195,030 423,404
2013 600,970 198,483 432,219
2014 611,740 201,176 439,331
2015 622,153 202,350 443,954
2016 633,896 202,853 450,271

4
Table 3. Class Size Reduction Appropriation Increase Compared to Grades K‐8 Fall Enrollment Increase
Currently, state statute requires that each LEA use 50% of its class size reduction allocation to reduce class sizes in grades K through 2, with an emphasis on improving student reading skills. However, an exception is allowed in statute. If an LEA has a class size below 18 in grades K through 2, it may petition the Utah State Board of Education (the Board) for and receive a waiver to the 50% rule. This exception in statute seems to imply an optimal or desired class size of 18 in these grades in the state.
Legislative Intent Language
HB 2 Public Education Budget Amendments from the 2015 Legislative session included the following legislative intent language: “The Legislature intends that the State Board of Education develop minimum program standards, including maximum class size limits in kindergarten through grade 3, that local education agencies must meet in order to continue to receive Class Size Reduction funding. The Legislature also intends that the State Board of Education develop an estimate of the cost necessary to limit class sizes in kindergarten through grade 3, without impacting class sizes in grades 4 through 12. The Legislature also intends that the State Board of Education report the standards and estimated costs to the Education Interim Committee and the Public Education Appropriations Subcommittee by October 31, 2015.”
Research and National Standards Regarding Class Size There is a large amount of research that has been conducted on the effects of class size on student achievement. Research suggests that the effects of class size reduction are likely to be multiple, and that it is difficult in one study to capture all the complexities involved. Many credible studies done on the issue in recent years show that the effects of reducing class size are relatively small compared to the large costs incurred to do so.
0.00%
2.00%
4.00%
6.00%
8.00%
10.00%
12.00%
14.00%
2006 2007 2008 2009 2010 2011 2012 2013 2014 2015 2016
Increases in CSR Appropriation and K‐8 enrollment
CSR Appropriation % Increase K‐8 Enrollment % Increase
5
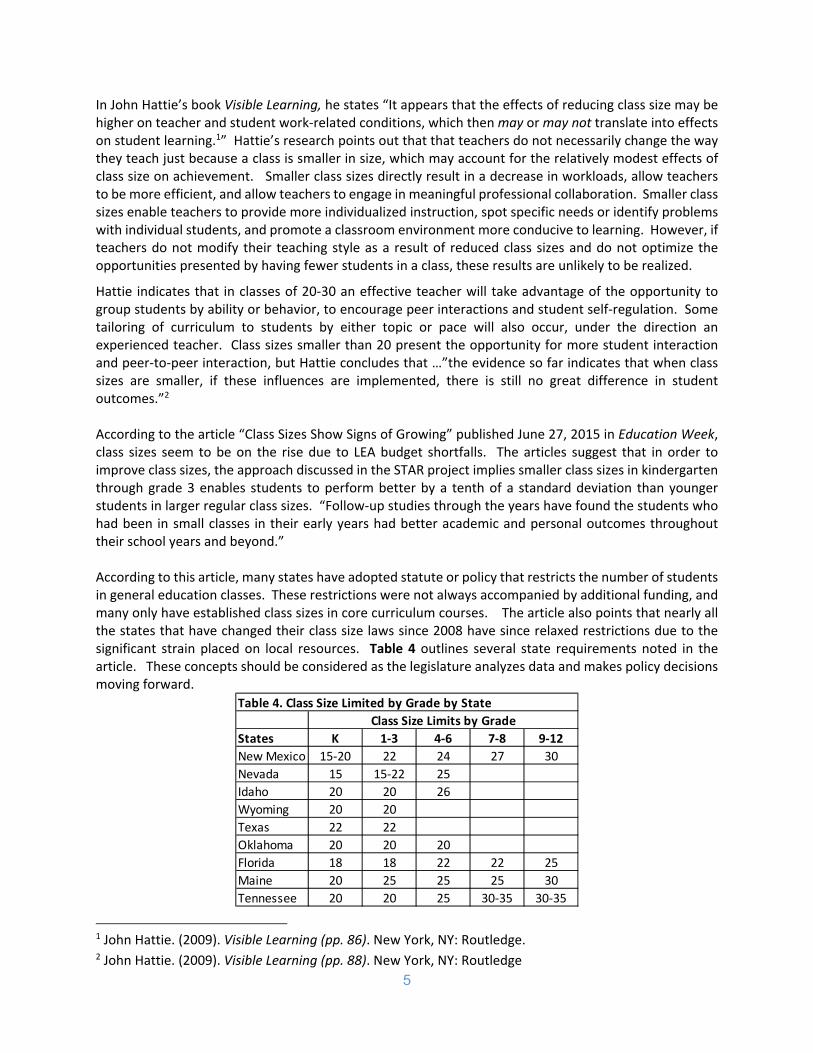
In John Hattie’s book Visible Learning, he states “It appears that the effects of reducing class size may be higher on teacher and student work‐related conditions, which then may or may not translate into effects on student learning.1” Hattie’s research points out that that teachers do not necessarily change the way they teach just because a class is smaller in size, which may account for the relatively modest effects of class size on achievement. Smaller class sizes directly result in a decrease in workloads, allow teachers to be more efficient, and allow teachers to engage in meaningful professional collaboration. Smaller class sizes enable teachers to provide more individualized instruction, spot specific needs or identify problems with individual students, and promote a classroom environment more conducive to learning. However, if teachers do not modify their teaching style as a result of reduced class sizes and do not optimize the opportunities presented by having fewer students in a class, these results are unlikely to be realized.
Hattie indicates that in classes of 20‐30 an effective teacher will take advantage of the opportunity to group students by ability or behavior, to encourage peer interactions and student self‐regulation. Some tailoring of curriculum to students by either topic or pace will also occur, under the direction an experienced teacher. Class sizes smaller than 20 present the opportunity for more student interaction and peer‐to‐peer interaction, but Hattie concludes that …”the evidence so far indicates that when class sizes are smaller, if these influences are implemented, there is still no great difference in student outcomes.”2 According to the article “Class Sizes Show Signs of Growing” published June 27, 2015 in Education Week, class sizes seem to be on the rise due to LEA budget shortfalls. The articles suggest that in order to improve class sizes, the approach discussed in the STAR project implies smaller class sizes in kindergarten through grade 3 enables students to perform better by a tenth of a standard deviation than younger students in larger regular class sizes. “Follow‐up studies through the years have found the students who had been in small classes in their early years had better academic and personal outcomes throughout their school years and beyond.” According to this article, many states have adopted statute or policy that restricts the number of students in general education classes. These restrictions were not always accompanied by additional funding, and many only have established class sizes in core curriculum courses. The article also points that nearly all the states that have changed their class size laws since 2008 have since relaxed restrictions due to the significant strain placed on local resources. Table 4 outlines several state requirements noted in the article. These concepts should be considered as the legislature analyzes data and makes policy decisions moving forward.
1 John Hattie. (2009). Visible Learning (pp. 86). New York, NY: Routledge. 2 John Hattie. (2009). Visible Learning (pp. 88). New York, NY: Routledge
States K 1‐3 4‐6 7‐8 9‐12
New Mexico 15‐20 22 24 27 30
Nevada 15 15‐22 25
Idaho 20 20 26
Wyoming 20 20
Texas 22 22
Oklahoma 20 20 20
Florida 18 18 22 22 25
Maine 20 25 25 25 30
Tennessee 20 20 25 30‐35 30‐35
Class Size Limits by Grade
Table 4. Class Size Limited by Grade by State

6
Methods of Calculating Class Size and Data Used The term “class size” can take on a number of different meanings when discussed and debated, especially for policy decisions. There are a number of methods which can be used to calculate “class size” for each LEA:
Student to Teacher Ratio – Total students enrolled in a school divided by total teachers in the school
Student to Adult Ratio – Total students enrolled in a school divided by total teachers and paraprofessionals in the school
Class Size Average – Total students enrolled in a specific grade in a school divided by the total number of classes in that grade level in the school
Class Size Median – The median (middle) value of all classes in the same grade in a school
Levels or groups at which data can be aggregated and calculations performed in order to determine compliance with an established class size maximum:
LEA level – All students, teachers, and classes at the LEA are grouped together
School level – All students, teachers, and classes at each school are grouped together
Individual class level – Each class is analyzed individually
Median class sizes reported annually in the “Annual Report of the State Superintendent of Public Instruction” are calculated using the class size median methodology and are reported at both the LEA and school levels. The number reported is a statistical calculation that can be impacted by differing class patterns. See Appendix A.
We noted there is much variation in the way that LEAs report teacher, class, and student data. For example, if a course has 50 students, a general education teacher, and a special education teacher, many LEAs report the general education teacher as the teacher of the class, and the special education teacher is not accounted for. Other LEAs may report both teachers as primary teachers for the class. Therefore, while the USOE collects data to determine the class size for each individual classroom and the teachers that are assigned to that classroom, LEA reporting differences can create potential difficulties for the USOE in tracking this information and applying performance measures without specific definitions.
For older grades (especially grades 7‐12), teachers may have classes with students from many different grades and/or teach a variety of subjects. This makes calculating a class size on a grade‐by‐grade basis more difficult. Additionally, classes such as music or art classes in these older grades tend to have higher class sizes, which is sometimes preferable or necessary. Presently, median class sizes are calculated only for English, Math, Science, and grade level courses.
Online or distance learning classes are designed to be larger than a traditional classroom. Special Education or ELL classes can be part of a regular class or their own class. Presently, all of these types of courses are excluded from the median class size calculations. How should these classes be included in a calculation of class size?
Classroom models such as Alpine School District’s “productivity model” illustrate how calculated class size maximums applied to all LEAs across the state can become problematic. Under this model, elementary school teachers are given two groups of students that each arrive at different times of the day (one class starts early in the morning and ends earlier in the day while the other starts later in the morning and ends later in the day). For the majority of the day, both classes are at the school together to attend lunch, PE, science, and similar classes. During the parts of the day when only one of the two classes is at the school, teachers focus on literacy, mathematics, or whichever subject they feel is the greatest need for the class at that time. In calculating or measuring class size using a teacher to pupil ratio or another similar

7
calculation‐based measure, the schools using the productivity model would likely show extremely large class sizes. However, these calculations are not a true representation of the instruction that is occurring at the school and do not accurately reflect that the school district has developed an innovative way to both reduce class sizes and cut costs.
Charter schools have the ability to control class size through their organizational structure and by virtue of caps placed on enrollment. Many chose to limit class sizes to 20‐25 students. Others have classes of 30 will a full time teacher and instructor which brings the adult student ratio to 1:15.
Because the median class size reported is a calculation, it is important to note that it may not reflect the actual number of students in individual classrooms at each individual school. Any calculation method for class size that does not report individual class sizes will never address the public perception of large class sizes. An LEA may have a calculated class size average below a legislative mandated maximum, but could still have classrooms within individual schools that are larger than a potential maximum. Parents, the public, and legislators may see this as a violation by the LEA of use of funds, or a failure of the LEA to comply with a potential mandated maximum, but in reality it is a matter of how the mandated class size is calculated and reported.
When evaluating a potential “maximum class size limit” to be applied statewide, we feel the Board or the Legislature must clearly specify whether the established limit applies to an LEA average in grades K‐3, a school average in grades K‐3, or whether the limit applies on a class by class basis. Changes to statute or rule should clearly define how class size is to be calculated, what classes are included, what students are included, and what teachers and para‐professionals are included.
For purposes of this analysis and due to the accessibility of data, all remaining analysis was completed using the class median data by LEA.
Online Programs and Necessarily Existent Small Schools Currently, LEAs receive funding based on their K‐8 ADM, regardless of the type of school or program in which a student is enrolled. This includes students participating in an online or distance education program and students enrolled at a school that is classified as a Necessarily Existent Small School (NESS). Online programs are designed to have larger than traditional classrooms. Larger class sizes are manageable because instruction occurs through online lessons and curriculum, with the teacher functioning as a mentor who answers questions, monitors student progress, and provides instruction as needed. Additionally, many schools receiving NESS funding have class sizes well below the state average before the receipt of class size reduction funding. In fact, these schools are classified as NESS schools primarily because of the very small population they serve in remote areas of the state. Many of these schools have already achieved low class sizes.
In both of these cases, an evaluation of policy should include a determination as to whether the reduction of class sizes through directed funding should be applied to NESS or to online or distance programs that function differently than traditional classrooms. Is the intent of the class size reduction appropriation to provide funding to LEAs for all students in grades K‐8 or is it to specifically help reduce class sizes for students in LEAs that have larger than desirable class sizes, and what role does local control and local taxing effort play?
Total Cost of a Statewide Class Size Maximum As explained above, determining class size can be complex and can produce different results depending on the methods and data used. For purposes of the analysis going forward in this section, we have

8
assumed that the maximum class size limit established will apply to a school average in grades K‐3 and that the class size mean method will be used to calculate class size.
If a statewide maximum class size limit were established, it would create additional costs for LEAs who are required to add additional teachers and/or classrooms to meet the standard. We performed an analysis to determine the number of additional teachers that would be needed statewide if various maximum class size limits were implemented for grades K‐3. Please note that for kindergarten, the USOE does not collect data on which schools have half‐day kindergarten and which schools have full‐day kindergarten. Therefore, the model made various assumptions to make these determinations. The results produced provide a good estimation of the additional teachers needed but are not exact calculations. Our analysis assumes that teachers cannot be split between schools or campuses within an LEA but could be split between grades except kindergarten.
Table 5 shows the impact of setting a statewide average class size limit between 15 and 30. As shown, a class size limit of 15 would require an additional 4,388 teachers statewide in grades K‐3, a limit of 20 would require an additional 1,670 teachers, and a limit of 25 would require an additional 319 teachers. As a note, our analysis uses fiscal year 2014 classroom and headcount data. Additionally, please note that the analysis below uses an average class size maximum with the class size median method described above.
Table 5. Statewide Class Size Maximum‐Impact
We also estimated the total cost of hiring these additional teachers. Our calculations used an average statewide teacher salary in Utah of $49,393, as reported by the National Center for Education Statistics for school year 2012‐13, and total benefits of approximately $34,000 (a total estimated compensation package of approximately $83,500). See Table 6 below. Costs of a class size limit of 15 would be over $360 million, while costs of a class size limit of 25 would be approximately $26.6 million.

9
Table 6. Estimated Statewide Cost per Teacher
In addition to the personnel costs shown above for teachers, there are additional capital and personnel costs to be considered. Each new teacher needed would require a classroom to teach in, materials and equipment to use in the classroom, a para‐professional or other staff (as needed, depending on student needs), and professional development for the hired teachers. Depending on the space each LEA has available, these costs could be extremely high. Some schools in high growth areas of the state have no available space to put additional portable classrooms outside their school and would have difficulty adding additional classrooms without expensive remodeling projects. For these types of schools, the costs to reduce class size could be extremely high. In rural areas, it may be difficult to add additional classrooms or recruit teachers.
Funding Class Size Reduction If a statewide class size maximum in grades K‐3 were established, LEAs would be forced to use local and state funding that is currently focused on other grades or programs to reduce class sizes in grades K‐3 to continue to qualify for class size reduction funding. In many cases, this could result in class sizes increasing in grades 4‐12, as LEAs would be forced to move teachers to grades K‐3. To ensure that class sizes in other grades are not harmed, the state would need to provide additional funding to assist LEAs with high class sizes to reduce the class size and come into compliance with the established limit. If the state were to commit to providing additional funding for class size reduction to help those LEAs whose class sizes are above the maximum class size, a different distribution formula or method would likely be needed. The current class size reduction formula allocates funding to all LEAs based on K‐8 ADM and if additional funding were distributed through this formula, those LEAs most needing the funding would not receive it. Additional state funding for class size reduction could be set up as a grant program where schools with a class size above the statewide maximum are able to develop a plan to reduce their class size, submit the plan to the USOE, and obtain funding to fund the proposed plan after approval (expenditures could include teachers and para‐professionals, capital costs, or professional development costs). This grant program
83,500$
Desired Class Size
Total Teachers
Needed Statewide
Total Cost
Statewide
15 4,388 366,398,000$
16 3,705 309,367,500$
17 3,112 259,852,000$
18 2,581 215,513,500$
19 2,097 175,099,500$
20 1,670 139,445,000$
21 1,306 109,051,000$
22 986 82,331,000$
23 715 59,702,500$
24 494 41,249,000$
25 319 26,636,500$
26 205 17,117,500$
27 137 11,439,500$
28 86 7,181,000$
29 70 5,845,000$
30 56 4,676,000$
Estimated Statewide Cost Per Teacher
(w/ benefits):

10
could include a requirement for LEAs receiving the funding to match the funds with local, state, or federal funding from other sources. Ultimately, if a statewide maximum class size in grades K‐3 were established, LEAs with schools over the class size limit would likely need a phase in period of 2‐5 years to provide time to establish a plan for reduction of class sizes, to develop a budget strategy, and complete necessary renovation or construction projects required to create classroom space. During this period, LEAs with class sizes over the established threshold should continue to qualify for class size reduction funding as they establish a plan and work towards their class size goals.
If class size reduction funds were eliminated, or if an LEA no longer qualified to receive class size reduction funds, the loss of state revenue would further increase the LEA’s class sizes and only exacerbate the problem. This could also result in increased local property taxes as LEAs are forced to levy additional taxes to rectify the class size problem. In place of immediately withholding class size reduction funding for those LEAs that do not qualify based on class size, it would make sense to establish a process whereby LEAs are placed on corrective action and required to create a plan to reduce class size below the maximum within a 3‐5 year period. This process would allow LEAs opportunities to make improvements prior to losing funding.
Fiscal Year 2014 Class Size Reduction Survey Results In accordance with state statute, the USOE requires each LEA in the state to submit a report regarding the expenditure of class size reduction funding each year. The USOE is currently receiving reports from LEAs regarding the expenditure of fiscal year 2015 funds. The USOE received results from fiscal year 2014 in November 2014. See the summary results of the fiscal year 2014 survey in Table 7 below.
Table 7. LEA 2014 Class Size Appropriation FTE Surveys
The Class Size Appropriation for FY2014 was $111,052,000. Some LEAs reported the expenditure of the state appropriation, as well as the expenditure of local funds to support the class size reduction effort. As shown, costs for teachers and para‐professionals in grades K‐3 make up over 70% of the current LEA expenditures of class size reduction funding. However, this means that 30%, or over $30 million, of the class size reduction appropriation is currently spent in grades 4‐8. Any legislative change which began to allocate funding only on the basis of K‐3 ADM would negatively impact those LEAs which have large student enrollment in grades 4‐8. These LEAs would likely be forced to increase class sizes in those grades as a result of the reduced funding.
Grade Total FTEs % of total FTEs Total Cost % of Total Cost
K 326.32 14.92% 17,590,539.78 14.16%
1 520.05 23.78% 29,645,968.37 23.87%
2 444.25 20.31% 25,560,771.85 20.58%
3 277.46 12.69% 16,163,236.62 13.01%
4 207.33 9.48% 11,996,492.83 9.66%
5 151.74 6.94% 8,292,247.21 6.68%
6 93.27 4.26% 5,210,480.43 4.20%
7‐8 166.54 7.62% 9,734,767.14 7.84%
Totals: 2,186.96 100.00% 124,194,504.22$ 100.00%
Para‐Professionals and Teachers

11
Based on the total FTE data reported by LEAs, we calculated an estimated class size impact in grades K‐8 of the funding received. The 2,006 teacher FTEs paid for with Class Size Reduction funding reduced the average pupils per teacher by 3.22 statewide, from 28.19 to 24.98. See Table 8 below. For further detailed results by LEA, please see Appendix B.
Table 8. Estimated Impact Fiscal Year 2014
As shown, the class size reduction funding has aided in improving class sizes statewide significantly for both school districts and charter schools in the state.
Impact of Moving Class Size Reduction Funding Into the WPU Value We performed an analysis to determine the impact of moving all funding currently appropriated to the Class Size Reduction Program into the value of the regular WPU. Using projected fiscal year 2017 WPUs for the basic school program, we determined the impact to each LEA in the state. Overall, the number of WPUs in the basic program for all LEAs would decrease by 39,990 (the projected number of WPUs allocated to the Class Size Reduction Program in fiscal year 2017). The value of the regular WPU would increase by $177 in the scenario, from $3,092 to $3,269. Overall, LEAs with higher concentrations of students in grades K‐8 would lose funding, and LEAs with higher concentrations of students in grades 9‐12 would gain funding. In total, school districts would gain $2.47 million in funding, while charter schools would lose the same amount. See Appendix C for specific LEA impacts. Because total basic program WPUs are reduced for LEAs that have grades K‐8, flexible allocation funds will be redistributed between the LEAs. The Voted and Board Guarantees will also be reduced, as total WPUs decrease. The redistribution of the class size appropriation will result in previously restricted funds being unrestricted basic funds available to local boards. Furthermore, increasing the value of the regular WPU further devalues the add‐on WPU value which is used for Special Education and Career and Technology Education. This WPU is currently $2,837, or 92% of the regular WPU value of $3,092.
Impact of Distributing the Class Size Reduction Appropriation on K‐3 or K‐5 ADM We also performed an analysis to determine the impact of changing the class size reduction formula to distribute based on enrollment and ADM in grades K‐3 and grades K‐5 (compared to the current formula, which distributes on grades K‐8). Overall, LEAs with higher concentrations of students in grades K‐3 or grades K‐5 would gain funding in this scenario, while schools with higher concentrations of students in grades 4‐8 would lose funding. See Appendix D for specific LEA impacts.
K‐8 K‐8 K‐8
K‐8 Total K‐8 K‐8 CSR W/ CSR $ W/O CSR $ CSR $ Effect
Student Teacher Teacher Pupils Pupils Pupils
Enrollment FTEs FTEs per Teacher per Teacher per Teacher
Districts: 395,868 15,859.27 1,700.43 24.96 27.96 (3.00)
Charters: 43,347 1,726.79 305.69 25.10 30.50 (5.40)
Statewide: 439,215 17,586.06 2,006.12 24.98 28.19 (3.22)

12
Program Standards/Performance Measures The Legislature intends that the Board establish minimum program standards, maximum class sizes in grades K‐3, and correlate these with reductions in class size funding. However, the Board has not had sufficient time and resources to study the many factors that should be correlated with class size data and funding levels to develop outcome measures that will have measurable impacts on student achievement. The Board has not had sufficient time to study or determine what impact local board polices and local control have on class size initiatives and how those correlate with student achievement. Current policy that governs the Class Size Appropriation has not clearly defined desired outcomes. Critical performance outcomes of student success include reading on grade level by grade 3 and achieving proficiency in math. There are many ways by which these critical performance outcomes can be achieved, one of which may be reducing class sizes. Increased professional development for teachers and collaboration with their peers enables teachers to improve their own performance. Reading programs, paraprofessionals, math labs or tutors, and small classes enable teachers that are prepared and engaged to interact with students more effectively. Current research supports the conclusion that reducing class size alone will not result in substantial gains in student achievement. Additionally, the costs that will be incurred by the state and locals to achieve a desirable class size is considerable. The Board of Education does not feel that establishing a class size maximum, as required by the intent language, will directly result in immediate gains in student achievement. Instead, the Board wishes to further study this issue and engage the Legislature to provide additional funding for the following:
1) Performance experiments 2) Study on an incentive or grant program to direct class size reduction funding 3) Incentive innovation to leverage the practices of high performing teachers
The results of these activities would provide sufficient data to inform the development of minimum program standards and performance measures that could be used to measure the performance and outcomes of the class size appropriation.
Courses of Action
The analysis of reports from LEAs indicate that the class size appropriation is being used for its intended purposes, hiring teachers and paraprofessionals in grades K‐8 to assist the LEAs to maintain or reduce class sizes. However, without minimum performance standards that correlate class sizes to student achievement, the effectiveness of these actions cannot be quantified. As such, potential courses of action of the Board are as follows:
1. Take no action on the Class Size Appropriation and engage LEAs and other stakeholders in a more in depth review of the utilization of the class size reduction funding and local resources devoted to this action by the LEAs. This additional study will inform the Board and Legislature of potential uses of these funds, minimum programs standards, and other innovative ways to utilize these funds.
2. Recommend that the class size appropriation be rolled into the value of the WPU. This action results in an increase in the value of the WPU from $3,092 to $3,269, a reduction of 39,989.86 WPUs in the Basic Program, and redistributes funds between LEAs. As with any change in a

13
formula, there will be some LEAs that gain funds, and some that lose funds. Because total Basic Program WPUs are reduced for LEAs that have grades K‐8, flexible allocation funds will be redistributed between the LEAs. The Voted and Board Guarantees will also be reduced, as total WPUs decrease. The redistribution of the Class Size Appropriation will result in previously restricted funds being unrestricted basic funds available to local boards. This action effectively indicates that local control and local board policies must establish class size standards and utilize basic program revenues and local revenues to achieve the goals of the individual LEAs. Furthermore, increasing the value of the regular WPU further devalues the add‐on WPU value which is used for Special Education and Career and Technology Education. This WPU is currently $2,837, or 92% of the regular WPU value of $3,092.
3. The Board could consider recommending a modification of the Class Size Reduction formula to redirect funds to LEAs based on K‐3 or K‐5 ADM. However, without established program standards and performance measures there is no way to quantify whether redirecting funds to K‐3, K‐5, rather than to K‐8 has a direct correlation with student achievement. The overall enrollment of an LEA would not change, and LEAs would need to make up funding reductions with local funds to mitigate any potential losses of funds. If class size funds were redirected to more targeted grades the impacts would be spread out through the LEAs in the higher grades.
4. The Board could recommend that additional funds be added to the class size appropriation to further reduce class sizes to an acceptable statewide standard.
5. The Board could consider studying whether the reduction of class sizes through the directed Class Size Reduction appropriation should be applied to NESS or to online or distance programs that function differently than traditional classrooms. The Board could consider modifying the Class Size Appropriation distribution formula to exclude educational situations where class sizes are inheritably small, or already where class sizes have already reached optimal or desirable levels.
6. The Board could consider studying whether establishing a threshold below which further Class Size Reduction funds would not be provided to LEAs for LEAs or schools that are able to reduce class sizes to optimal or desirable levels through other funding sources, such as Title I funds.
LEA Name Kindergarten Grade 1 Grade 2 Grade 3 Grade 4 Grade 5 Grade 6
Alpine District 25 25 26 28 29 30 29Beaver District 19 18 25 23.5 24 27 29
Box Elder District 22 22 25 24 27 28 32Cache District 21 21 24 25 26 27 29
Canyons District 22 21 22 22 24 24 30Carbon District 21 21 23 22.5 24 22 23
Daggett District 27 27 12.5 17 27 20 13
Davis District 23 23 24 25 27 27 28
Duchesne District 18 23 25 27 28 29 29.5
Emery District 17 18 17 20 20 23 24Garfield District 17 20.5 19.5 20 19 22 19.5
Grand District 24 20 22.5 22 21 23 22Granite District 23 24 24 26 26 26 27Iron District 21 24 23 26 26 26 28
Jordan District 22 22 23 23 26 27 26
Juab District 24 22 24 20.5 23 26 25Kane District 15 23 22.5 23 25 23 25
Logan City District 22 20 23 24.5 25.5 27 29
Millard District 20 23 24 24.5 26 26 26
Morgan District 22 26 23 31 31 30
Murray District 22 22 23 26 25 26 26
Nebo District 21 22 23 27 28 27 28
North Sanpete District 19 20 22 24 23 21 22
North Summit District 19.5 18.5 24.5 23 22 28 26
Ogden City District 24 23 24 23 25 27 25
Park City District 17 22 24 23 24 23 30
Piute District 16.5 14.5 15 11.5 13 13 14.5
Provo District 24 23 24 26 26 28 29
Rich District 13.5 20.5 20.5 23.5 18 25 14.5
Salt Lake District 23 22 24 25 25 26.5 36San Juan District 17 19 21 22 22.5 25 27
Appendix AMedian Class Size ‐ Elementary Schools ‐ SY 2013‐2014
14

LEA Name Kindergarten Grade 1 Grade 2 Grade 3 Grade 4 Grade 5 Grade 6
Sevier District 34 25 26 23 27 28 26
South Sanpete District 18 22.5 22 23 21 22 24.5
South Summit District 22 22 24 23 23 24 25
Tintic District 9 13 14 10 18 11.5 13
Tooele District 21 25 24 24 26 28 28
Uintah District 20 23 24 25 24 25.5 30
Wasatch District 23 18 22 25 27 29 29
Washington District 20 20 22.5 23 24.5 24 28
Wayne District 14 17 18 15 11 12 16.5Weber District 23 23 24 24 27 26 28
District Median 21 22 23 23.5 25 26 26.5
District Average 21 21 22 23
Districts Above District Average 19 24 29 21
12Districts Above District Average in All Grade Levels
15

LEA Name Kindergarten Grade 1 Grade 2 Grade 3 Grade 4 Grade 5 Grade 6
Alianza Academy 15.5 25 26 25
American Leadership Academy 24.5 22 26.5 28.5 27.5 25 39
American Preparatory Academy 25.5 29 28.5 30 31.5 30 32
American Preparatory Academy‐‐Accelerated School 26 31 31 30 31 31 32
American Preparatory Academy‐‐School For New Americans 25 27.5 29.5 30.5 30.5 31 30.5
Aristotle Academy 16 32 28.5 26.5 32 29 21
Bear River Charter School 20 20 21 21 18 20
Canyon Grove Academy 15 16
Canyon Rim Academy 20 25 25 25 25 25 25
Channing Hall 26 26 26 26 26 26 26
Cs Lewis Academy 18.5 22.5 22 28.5 23 24 20
Dual Immersion Academy 26 23 25.5 27.5 37 19
Early Light Academy At Daybreak 24 25 25 25 25 26 25
Edith Bowen Laboratory School 24 24 24.5 26 26 27.5
Endeavor Hall 20.5 26 26 26 26 24 23
Entheos Academy 26 26 26 26.5 27 27 27
Entheos Academy Magna 26 26 26 26 26 26 26
Excelsior Academy 21.5 26 27 25 26 26 26
Freedom Academy 20.5 26 27 26 26 26 25
Gateway Preparatory Academy 18 31.5 31.5 31.5 27 27 25
George Washington Academy 26 26 26 26 23 26 23
Good Foundations Academy 16 24 24 24 21 21 20.5
Guadalupe School 26 24 25 25 24
Hawthorn Academy 19.5 26 26 26 26 26 26
Highmark Charter School 26.5 24 24.5 25 26.5 25.5 28
Jefferson Academy 21 26.5 26 27 25 24 22
John Hancock Charter School 20 20 21 22 22 21 22
Lakeview Academy 25 25 25 25 25 25 25.5
Legacy Preparatory Academy 27 27 27 27 27 27 21.5
Liberty Academy 18 25 19 21 21 19 17Lincoln Academy 23 24 26.5 26 26 26 27
16

LEA Name Kindergarten Grade 1 Grade 2 Grade 3 Grade 4 Grade 5 Grade 6
Maria Montessori Academy 20 27 27 27 24.5 24.5 24.5
Moab Charter School 21 20 19 20 9 16
Monticello Academy 18.5 25 25 25 25 25 26
Mountainville Academy 25 26 27 28 28 26 24
Navigator Pointe Academy 27.5 27.5 28 24 26.5 27 26
Noah Webster Academy 22 29 29 29 28 28 26
North Davis Preparatory Academy 26 27 28.5 28 28 28 28
North Star Academy 25 25.5 25 26 26 26 26
Odyssey Charter School 26 26 24.5 26 25.5 23 21.5
Ogden Preparatory Academy 26 26.5 26 26 26 27.5 26
Open Classroom 19 23 23 23 23 23.5 21
Pacific Heritage Academy 21 32.5 26.5 23 32.5 20.5 27.5
Pinnacle Canyon Academy 21 16.5 15 21.5 15.5 22.5
Promontory School Of Expeditionary Learning 25 25 25 25 25 25 25
Providence Hall 25 25 25 25 25 25 49
Quest Academy 27 27 27 27 26 28 28
Ranches Academy 26 26 25.5 26 25.5 26 26
Reagan Academy 20 26 26 26 27 25 26
Renaissance Academy 20 24.5 27 28 25 24 23
Salt Lake Arts Academy 26 14
Salt Lake Center For Science Education 31
Soldier Hollow Charter School 21.5 18 20.5 21 14 19 17
Summit Academy 25 25.5 26 26 26 26 26
Syracuse Arts Academy 18 27 27 27 27 27 27
Thomas Edison 30 30.5 29.5 26 27 26.5 28
Thomas Edison ‐ South 24 28 31 27 29 30 27
Timpanogos Academy 24.5 25 25.5 25 25 25 30
Valley Academy 25 23 24.5 23 24 24.5 26
Venture Academy 25 25 25 25.5 25.5 25.5
Vista At Entrada School Of Performing Arts And Technology 24 25.5 25.5 24 22 21.5 21.5Walden School Of Liberal Arts 31 30.5 31.5 22.5 26.5 30 16.5
17

LEA Name Kindergarten Grade 1 Grade 2 Grade 3 Grade 4 Grade 5 Grade 6
Wasatch Peak Academy 25 25 25.5 25.5 25 25 24.5Weilenmann School Of Discovery 16 20 25 23 26 24 22
Charter School Median 24 25.5 26 26 26 26 26
State Median 22 24 25 25 25.5 26 26
Charter School Average 23 25 26 26
Charters Above Charter Average 34 33 22 19
8
State Average 22 24 24 25
LEAs Above State Average 47 50 54 44
9LEAs Above State Average in All Grade Levels
Charters Above Charter Average in All Grade Levels
18
LEA # LEA Name K‐8 ADM
MSP CSR
Funding
CSR
Expenditures
per APR
Teacher FTEs
hired
Para‐
Professional
FTEs Hired
K‐8 Teacher‐
Pupil Ratio w/o
CSR $
K‐8 Teacher‐Pupil
Ratio w/ CSR $
CSR $ Effect on
Teacher‐Pupil
Ratio1 Alpine 51,107.38 13,129,765$ 16,525,441$ 248.0 ‐ 25.96 29.63 (3.66) 2 Beaver 1,093.49 285,112 284,173 3.9 ‐ 22.95 24.97 (2.02) 3 Box Elder 7,635.43 1,974,806 3,507,919 68.0 ‐ 26.02 33.63 (7.61) 4 Cache 11,170.06 2,864,701 2,864,701 33.7 40.2 26.73 29.02 (2.30) 5 Carbon 2,431.77 635,880 640,093 9.0 0.5 22.64 24.66 (2.01) 6 Daggett 133.12 35,799 31,045 ‐ 0.8 14.12 14.12 ‐ 7 Davis 47,488.63 12,266,001 12,536,457 175.5 ‐ 25.74 28.38 (2.64) 8 Duchesne 3,471.06 897,795 897,795 17.0 11.7 23.70 26.64 (2.94) 9 Emery 1,620.66 414,530 424,135 6.0 2.3 19.33 20.78 (1.45) 10 Garfield 648.90 168,093 283,789 3.5 ‐ 19.57 21.84 (2.27) 11 Grand 961.85 245,964 269,449 5.0 ‐ 18.14 19.97 (1.83) 12 Granite 47,592.61 12,230,775 14,281,785 180.0 ‐ 25.52 28.18 (2.65) 13 Iron 6,081.84 1,564,732 2,069,774 34.5 ‐ 23.45 26.98 (3.53) 14 Jordan 36,726.29 9,476,188 9,476,188 211.9 ‐ 25.14 29.32 (4.18) 15 Juab 1,543.62 400,548 400,548 7.0 2.5 24.03 26.86 (2.84) 16 Kane 832.94 215,134 237,356 3.2 1.0 21.13 22.95 (1.82) 17 Millard 1,890.97 498,767 613,944 11.0 ‐ 22.71 26.02 (3.31) 18 Morgan 1,846.89 472,027 457,838 8.5 ‐ 26.66 30.38 (3.72) 19 Nebo 21,505.64 5,542,361 5,542,361 91.0 ‐ 27.23 30.66 (3.43) 20 North Sanpete 1,650.07 428,406 517,163 10.0 0.5 22.06 25.37 (3.31) 21 North Summit 684.60 179,820 297,917 4.5 ‐ 21.47 24.91 (3.44) 22 Park City 3,057.41 795,841 916,351 9.0 ‐ 20.49 21.78 (1.29) 23 Piute 200.01 50,832 50,832 0.7 ‐ 13.72 14.45 (0.73) 24 Rich 340.25 90,958 67,563 ‐ 2.2 18.83 18.83 ‐ 25 San Juan 2,032.18 537,529 611,567 8.0 ‐ 21.22 23.14 (1.92) 26 Sevier 3,174.43 835,184 798,810 12.5 ‐ 24.42 26.98 (2.56) 27 South Sanpete 2,173.28 562,117 562,116 8.0 ‐ 21.67 23.53 (1.86) 28 South Summit 1,060.69 274,171 831,837 11.0 3.8 21.44 27.57 (6.13) 29 Tintic 152.56 42,353 61,608 1.0 ‐ 17.15 19.24 (2.09) 30 Tooele 9,819.74 2,521,143 2,521,143 44.8 ‐ 24.71 27.79 (3.08) 31 Uintah 5,697.46 1,464,362 1,607,330 21.0 ‐ 25.20 27.73 (2.53) 32 Wasatch 4,035.31 1,041,644 1,041,644 27.9 ‐ 21.77 25.58 (3.81)
33 Washington 18,695.77 4,877,544 4,877,544 73.4 ‐ 24.27 26.77 (2.49) 34 Wayne 336.72 92,133 119,934 2.1 ‐ 15.69 17.35 (1.65) 35 Weber 21,112.61 5,438,756 5,406,394 78.2 10.0 24.64 27.06 (2.42) 36 Salt Lake 16,695.48 4,305,289 4,047,209 55.5 ‐ 24.18 26.20 (2.03)
School Year 2013‐2014 ‐ Class Size Reduction Data
Appendix B
19
LEA # LEA Name K‐8 ADM
MSP CSR
Funding
CSR
Expenditures
per APR
Teacher FTEs
hired
Para‐
Professional
FTEs Hired
K‐8 Teacher‐
Pupil Ratio w/o
CSR $
K‐8 Teacher‐Pupil
Ratio w/ CSR $
CSR $ Effect on
Teacher‐Pupil
Ratio37 Ogden 8,708.20 2,268,961 2,387,725 39.8 ‐ 24.83 27.91 (3.08) 38 Provo 10,220.01 2,606,139 3,743,946 40.1 22.4 25.03 27.65 (2.62) 39 Logan 4,231.47 1,102,325 1,104,280 23.0 ‐ 25.10 28.96 (3.86) 40 Murray 4,408.61 1,136,436 1,136,436 12.3 0.7 24.38 26.13 (1.75) 42 Canyons 23,078.59 5,983,132 6,148,916 101.0 ‐ 24.21 27.06 (2.84)
District Totals: 387,348.58 99,954,053$ 110,203,057$ 1,700.4 98.5 24.96 27.96 (3.00)
68 Ogden Prep 940.23 240,452$ 240,452$ 4.5 ‐ 25.83 29.39 (3.56) 74 American Prep 2,890.11 735,938 735,938 14.5 4.4 29.64 34.68 (5.04) 81 Walden School 288.19 107,159 107,159 2.0 2.0 19.59 22.48 (2.89) 82 Freedom Academy 826.84 212,320 212,320 39.0 ‐ 24.73 ‐ 24.73 83 AMES ‐ ‐ ‐ ‐ ‐ ‐ ‐ ‐ 86 Pinnacle Canyon 294.59 80,837 80,837 2.0 ‐ 16.21 18.06 (1.86) 87 City Academy 54.03 13,783 13,783 0.3 ‐ 13.36 14.20 (0.84) 89 Soldier Hollow 287.93 73,383 73,383 0.9 ‐ 19.67 20.92 (1.26) 90 Tuacahn High ‐ ‐ ‐ ‐ ‐ ‐ ‐ ‐ 92 Uintah River High ‐ ‐ ‐ ‐ ‐ ‐ ‐ ‐ 93 John Hancock 181.94 46,282 46,282 1.0 ‐ 17.70 19.57 (1.87) 94 Thomas Edison ‐ North 1,212.07 319,183 319,183 7.0 2.2 25.42 29.57 (4.15) 95 Timpanogos Academy 402.18 107,916 107,916 2.0 3.8 21.06 23.31 (2.25) 97 Salt Lake Arts 388.86 100,456 100,456 2.0 ‐ 20.87 23.37 (2.50) 98 Fast Forward ‐ ‐ ‐ ‐ ‐ ‐ ‐ ‐ A1 NUAMES ‐ ‐ ‐ ‐ ‐ ‐ ‐ ‐ A2 Ranches Academy 363.21 92,786 92,786 1.8 ‐ 26.61 30.51 (3.90) A3 DaVinci Academy 786.63 199,419 199,419 3.0 2.4 49.01 59.86 (10.85) A4 Summit Academy 994.37 256,824 256,825 4.0 11.0 25.12 27.93 (2.81) A5 Itineris ‐ ‐ ‐ ‐ ‐ ‐ ‐ ‐ A6 North Davis Prep 907.60 241,286 241,286 4.5 ‐ 28.44 32.99 (4.55) A7 Moab Charter 118.39 29,709 30,011 7.0 ‐ ‐ ‐ ‐ A8 East Hollywood High ‐ ‐ ‐ ‐ ‐ ‐ ‐ ‐ A9 SUCCESS Academy ‐ ‐ ‐ ‐ ‐ ‐ ‐ ‐ 1B UCAS ‐ ‐ ‐ ‐ ‐ ‐ ‐ ‐ 2B Lincoln Academy 596.81 153,976 302,832 3.0 10.0 26.05 29.86 (3.81) 3B Beehive Science & Tech 168.10 44,047 44,047 1.1 ‐ 24.84 29.33 (4.49) 4B Wasatch Peak 413.15 106,588 106,588 3.0 ‐ 24.33 29.50 (5.18)
5B North Star Academy 471.62 121,820 121,820 2.5 ‐ 26.74 31.12 (4.38) 7B Reagan Academy 665.30 171,823 171,823 3.0 4.0 19.99 21.94 (1.95) 8B American Leadership 1,074.08 290,903 290,277 6.0 8.5 24.81 28.58 (3.77) 9B Navigator Pointe 469.91 125,310 125,310 6.0 ‐ 23.35 32.90 (9.54)
20

LEA # LEA Name K‐8 ADM
MSP CSR
Funding
CSR
Expenditures
per APR
Teacher FTEs
hired
Para‐
Professional
FTEs Hired
K‐8 Teacher‐
Pupil Ratio w/o
CSR $
K‐8 Teacher‐Pupil
Ratio w/ CSR $
CSR $ Effect on
Teacher‐Pupil
Ratio1C Odyssey 522.26 130,757 130,757 3.3 ‐ 22.67 26.28 (3.61) 2C InTech Collegiate HS ‐ ‐ ‐ ‐ ‐ ‐ ‐ ‐ 3C Entheos Academy 941.14 240,754 240,754 6.0 ‐ 25.36 30.16 (4.80) 4C Lakeview 853.33 220,569 220,569 7.0 ‐ 25.59 32.09 (6.50) 5C Legacy Preparatory 960.22 248,785 248,785 8.0 ‐ 25.84 32.72 (6.88) 6C Liberty Academy 374.66 92,548 92,548 1.7 1.5 26.99 30.81 (3.81) 7C Monticello 670.36 172,501 172,501 3.9 4.0 24.96 29.05 (4.09) 8C Mountainville 695.07 179,996 179,996 3.2 ‐ 24.25 27.22 (2.97) 9C Paradigm High 154.26 40,432 40,432 1.0 ‐ 15.89 17.67 (1.79) 1D Renaissance 665.60 171,271 171,271 2.5 1.8 21.15 22.92 (1.77) 2D Channing Hall 646.34 169,740 169,740 3.4 1.7 21.87 24.63 (2.76) 3D Spectrum 321.40 83,358 83,358 1.3 2.0 15.58 16.46 (0.88) 4D Syracuse Arts 927.11 240,072 240,074 4.6 ‐ 24.71 28.03 (3.33) 5D George Washington 995.25 256,516 256,516 3.8 3.0 25.67 28.37 (2.70) 6D Noah Webster 526.21 147,570 147,570 4.5 ‐ 28.44 37.37 (8.92) 7D Salt Lake SPA ‐ ‐ ‐ ‐ ‐ ‐ ‐ ‐ 8D Open Classroom 373.74 94,206 106,334 1.8 ‐ 23.33 26.10 (2.77) 9D Canyon Rim 519.87 134,823 134,823 7.0 ‐ 25.76 39.11 (13.36) 1E Guadalupe Schools 132.54 32,072 33,749 ‐ 2.0 17.93 17.93 ‐ 2E Karl G. Maeser 210.91 53,786 53,786 5.0 ‐ 19.60 35.83 (16.23) 3E CS Lewis Academy 430.07 110,898 110,898 2.2 ‐ 32.07 37.92 (5.85) 4E Dual Immersion Academy 424.53 109,578 109,578 3.3 ‐ 24.39 29.90 (5.51) 5E Edith Bowen 297.37 77,321 64,851 1.5 2.8 19.35 21.32 (1.97) 7E Gateway Preparatory 600.78 168,050 168,050 9.0 ‐ 26.83 43.47 (16.64) 8E Merit College Preparatory 51.53 41,264 41,264 0.7 ‐ 13.80 16.80 (3.00) 9E Providence Hall 1,257.94 342,924 342,924 8.0 ‐ 23.93 28.18 (4.25) 1F Quest Academy 869.76 227,960 227,960 4.2 ‐ 26.81 30.49 (3.68) 2F Rockwell HS 201.79 76,947 76,947 1.7 ‐ 24.11 30.32 (6.21) 3F Venture 474.52 119,323 119,323 2.5 ‐ 21.92 24.75 (2.83) 4F Center for Science Ed. 185.95 48,347 55,785 1.0 ‐ 21.74 24.61 (2.88) 5F Utah Virtual Academy 1,266.32 363,812 257,414 10.5 ‐ 39.96 57.62 (17.66) 6F The Early Light Academy 682.06 174,419 174,419 4.0 ‐ 24.91 29.09 (4.18) 7F Excelsior Academy 656.43 170,873 170,873 5.0 ‐ 27.89 35.04 (7.15) 8F Hawthorn Academy 741.66 190,720 190,720 4.5 ‐ 26.28 31.15 (4.87) 9F Mountain Heights 76.73 21,118 21,118 1.0 ‐ 17.32 21.96 (4.64)
1G Jefferson Academy 701.31 188,265 188,265 4.0 ‐ 26.11 30.41 (4.30) 2G Vista at Entrada 805.89 208,875 208,875 4.8 ‐ 22.56 26.08 (3.52) 3G Bear River CS 173.04 45,411 45,411 1.1 ‐ 18.71 21.13 (2.42)
21

LEA # LEA Name K‐8 ADM
MSP CSR
Funding
CSR
Expenditures
per APR
Teacher FTEs
hired
Para‐
Professional
FTEs Hired
K‐8 Teacher‐
Pupil Ratio w/o
CSR $
K‐8 Teacher‐Pupil
Ratio w/ CSR $
CSR $ Effect on
Teacher‐Pupil
Ratio4G Maria Montessori 510.07 130,382 131,730 2.8 ‐ 26.58 30.71 (4.13) 5G Canyon Grove Adacemy 413.87 117,811 121,109 3.2 ‐ 28.70 36.13 (7.43) 6G Weilenmann School 560.85 145,013 145,013 5.0 ‐ 20.18 24.43 (4.25) 7G Summit Academy HS ‐ ‐ ‐ ‐ ‐ ‐ ‐ ‐ 8G Good Foundations 450.71 114,297 114,297 1.5 3.0 21.93 23.59 (1.66) 9G Alianza Academy 424.15 121,367 121,367 3.3 ‐ 38.08 52.53 (14.45) 2H Utah Connections 392.51 106,945 106,945 2.4 ‐ 39.59 51.32 (11.72) 3H Endeavor Hall 589.12 151,947 151,947 7.0 ‐ 23.46 32.03 (8.57) 4H Aristotle Academy 197.94 56,841 62,150 1.3 ‐ 21.36 24.56 (3.20) 5H HighMark CS 585.99 148,592 148,592 3.3 ‐ 24.36 28.02 (3.66) 6H Promontory School 456.09 118,001 118,001 2.4 ‐ 25.29 29.09 (3.80) 7H Pacific Heritage Acad. 317.59 95,262 95,262 6.0 ‐ 29.01 51.67 (22.65) 8H Valley Academy 407.50 107,516 107,516 2.1 ‐ 18.94 20.93 (1.99) 9H Pioneer High School ‐ ‐ ‐ ‐ ‐ ‐ ‐ ‐ 1I UT International HS 55.03 14,164 14,164 0.3 ‐ 11.70 12.62 (0.91) 3I Leadership Learning Academy 436.01 115,889 115,889 2.8 ‐ 28.20 34.19 (6.00) 4I Mana Academy 505.08 146,535 146,535 2.0 8.0 94.74 142.05 (47.31) 5I Voyage Academy 497.48 128,765 128,765 3.8 4.0 27.13 34.06 (6.93) 7I WSU Charter School 40.64 10,559 6,887 ‐ 0.5 112.02 112.02 ‐ 9I Utah Career Path ‐ ‐ ‐ ‐ ‐ ‐ ‐ ‐
Charter School Totals: 42,024.76 11,097,947$ 11,155,140$ 305.7 82.4 25.10 30.50 (5.40)
Statewide Totals: 429,373.33 111,052,000$ 121,358,197$ 2,006.1 180.8 24.98 28.19 (3.22)
22

WPU Value: 3,092$ WPU Value: 3,269$ Change: 177$
# LEA
Total Basic School
Program WPUs
Total Basic School
Program Funding
Total Basic School
Program WPUs
Total Basic School
Program FundingWPUs Funding
1 Alpine 97,531.62 298,681,819$ 92,788.39 298,463,247$ (4,743.23) (218,572)$ 2 Beaver 2,669.80 8,157,649 2,572.08 8,243,890 (97.72) 86,241$ 3 Box Elder 15,326.40 46,872,249 14,625.85 46,940,283 (700.55) 68,034$ 4 Cache 22,678.24 69,373,756 21,609.74 69,382,329 (1,068.50) 8,573$ 5 Carbon 4,946.63 15,078,736 4,737.41 15,121,551 (209.22) 42,815$ 6 Daggett 647.58 1,983,367 635.56 2,045,714 (12.02) 62,347$ 7 Davis 90,593.98 277,514,134 86,266.59 277,621,956 (4,327.39) 107,822$ 8 Duchesne 7,600.97 23,203,853 7,293.96 23,340,561 (307.01) 136,708$ 9 Emery 3,860.44 11,775,872 3,723.31 11,900,458 (137.13) 124,586$ 10 Garfield 2,289.11 7,002,369 2,233.69 7,174,572 (55.42) 172,203$ 11 Grand 2,202.47 6,729,217 2,115.96 6,780,719 (86.52) 51,502$ 12 Granite 86,488.79 264,799,832 82,283.39 264,563,835 (4,205.40) (235,997)$ 13 Iron 12,370.62 37,814,472 11,811.15 37,876,256 (559.47) 61,784$ 14 Jordan 67,342.56 206,167,931 64,198.84 206,402,820 (3,143.72) 234,889$ 15 Juab 3,320.02 10,152,313 3,164.13 10,152,703 (155.89) 390$ 16 Kane 2,590.38 7,917,919 2,515.85 8,069,962 (74.53) 152,043$ 17 Millard 4,532.61 13,831,852 4,365.13 13,960,845 (167.48) 128,993$ 18 Morgan 3,656.46 11,208,062 3,476.33 11,199,632 (180.13) (8,430)$ 19 Nebo 43,032.50 131,487,093 41,047.83 131,538,233 (1,984.67) 51,140$ 20 No. Sanpete 3,407.33 10,385,096 3,256.44 10,391,452 (150.89) 6,356$ 21 No. Summit 1,819.54 5,567,286 1,757.59 5,646,599 (61.94) 79,313$ 22 Park City 6,052.41 18,584,487 5,766.77 18,633,843 (285.64) 49,356$ 23 Piute 896.47 2,741,234 878.86 2,821,316 (17.61) 80,082$ 24 Rich 1,196.95 3,673,714 1,165.28 3,763,506 (31.66) 89,792$ 25 San Juan 5,118.41 15,669,406 4,942.30 15,892,348 (176.11) 222,942$ 26 Sevier 6,835.58 20,888,471 6,554.88 21,011,074 (280.70) 122,603$ 27 So. Sanpete 4,861.36 14,846,686 4,666.90 14,944,613 (194.46) 97,927$ 28 So. Summit 2,315.89 7,063,799 2,217.24 7,084,542 (98.65) 20,743$ 29 Tintic 833.27 2,557,301 819.19 2,645,714 (14.08) 88,413$ 30 Tooele 19,211.55 58,718,604 18,363.14 58,876,348 (848.42) 157,744$
w/ Class Size Funding (Current) Class Size Funding Rolled into WPU Differences
Appendix CImpact of Moving Class Size Reduction Funding Into the WPU Value ‐ Projected Fiscal Year 2017
23

WPU Value: 3,092$ WPU Value: 3,269$ Change: 177$
# LEA
Total Basic School
Program WPUs
Total Basic School
Program Funding
Total Basic School
Program WPUs
Total Basic School
Program FundingWPUs Funding
w/ Class Size Funding (Current) Class Size Funding Rolled into WPU Differences
31 Uintah 9,798.68 29,950,707 9,321.39 29,886,750 (477.29) (63,957)$ 32 Wasatch 8,530.87 26,107,728 8,127.49 26,114,152 (403.39) 6,424$ 33 Washington 38,081.09 116,502,198 36,347.82 116,723,136 (1,733.26) 220,938$ 34 Wayne 1,197.83 3,660,776 1,170.16 3,752,876 (27.67) 92,100$ 35 Weber 42,313.61 129,155,943 40,435.79 129,353,604 (1,877.81) 197,661$ 36 Salt Lake 30,897.36 94,458,296 29,453.17 94,467,368 (1,444.19) 9,072$ 37 Ogden 15,574.76 47,646,237 14,831.24 47,622,025 (743.52) (24,212)$ 38 Provo 21,930.75 67,091,271 20,861.50 66,984,847 (1,069.25) (106,424)$ 39 Logan 7,818.27 23,941,045 7,440.09 23,928,998 (378.19) (12,047)$ 40 Murray 8,397.95 25,712,137 8,000.98 25,726,689 (396.97) 14,552$ 42 Canyons 43,214.04 132,371,306 41,164.12 132,465,867 (2,049.92) 94,561$
District Total: 753,985.15 2,307,046,223$ 719,007.55 2,309,517,233$ (34,977.59) 2,471,010$
68 Ogden Prep 1,298.71 3,976,316$ 1,211.57 3,894,395$ (87.14) (81,921)$ 74 American Prep 5,659.96 17,268,260 5,357.12 17,120,287 (302.84) (147,973)$ 81 Walden School 541.22 1,651,152 515.90 1,648,856 (25.32) (2,296)$ 82 Freedom Academy 1,793.01 5,498,609 1,680.38 5,416,798 (112.63) (81,811)$ 83 AMES 723.16 2,221,630 723.16 2,339,873 ‐ 118,243$ 86 Pinnacle Canyon 689.61 2,087,576 665.58 2,100,192 (24.04) 12,616$ 87 City Academy 283.33 860,078 278.63 883,832 (4.70) 23,754$ 89 Soldier Hollow 329.99 1,009,222 304.92 978,066 (25.07) (31,156)$ 90 Tuacahn High 533.56 1,638,843 533.56 1,725,867 ‐ 87,024$ 92 Uintah River High 101.60 310,814 101.60 326,522 ‐ 15,708$ 93 John Hancock 217.00 665,184 200.49 645,664 (16.51) (19,520)$ 94 Thomas Edison ‐ North 1,573.42 4,809,051 1,461.15 4,682,103 (112.27) (126,948)$ 95 Timpanogos Academy 564.31 1,734,706 517.83 1,675,756 (46.48) (58,950)$ 97 Salt Lake Arts 470.51 1,446,616 435.75 1,410,705 (34.76) (35,911)$ 98 Fast Forward 338.40 1,033,273 338.40 1,084,208 ‐ 50,935$ A1 NUAMES 1,083.24 3,317,676 1,083.24 3,487,730 ‐ 170,054$ A2 Ranches Academy 417.57 1,279,453 385.18 1,239,500 (32.39) (39,953)$ A3 DaVinci Academy 1,280.49 3,922,311 1,211.44 3,897,904 (69.06) (24,407)$ A4 Summit Academy 3,057.84 9,366,605 2,819.31 9,067,650 (238.53) (298,955)$ A5 Itineris 553.97 1,707,525 553.97 1,802,037 ‐ 94,512$
24

WPU Value: 3,092$ WPU Value: 3,269$ Change: 177$
# LEA
Total Basic School
Program WPUs
Total Basic School
Program Funding
Total Basic School
Program WPUs
Total Basic School
Program FundingWPUs Funding
w/ Class Size Funding (Current) Class Size Funding Rolled into WPU Differences
A6 North Davis Prep 1,137.47 3,496,492 1,054.85 3,413,781 (82.62) (82,711)$ A7 Moab Charter 141.71 432,756 131.19 419,690 (10.53) (13,066)$ A8 East Hollywood High 458.41 1,402,596 458.41 1,473,596 ‐ 71,000$ A9 SUCCESS Academy 581.00 1,794,098 581.00 1,895,483 ‐ 101,385$ 1B UCAS 550.42 1,693,066 550.42 1,784,532 ‐ 91,466$ 2B Lincoln Academy 1,082.12 3,307,496 1,012.29 3,244,383 (69.83) (63,113)$ 3B Beehive Science & Tech 439.13 1,340,327 422.45 1,351,521 (16.68) 11,194$ 4B Wasatch Peak 450.19 1,381,587 413.62 1,334,644 (36.57) (46,943)$ 5B North Star Academy 611.16 1,877,516 569.17 1,840,135 (41.99) (37,381)$ 7B Reagan Academy 779.12 2,384,844 720.25 2,313,743 (58.86) (71,101)$ 8B American Leadership 2,318.87 7,081,928 2,214.03 7,089,191 (104.84) 7,263$ 9B Navigator Pointe 596.53 1,828,045 553.90 1,783,071 (42.62) (44,974)$ 1C Odyssey 581.41 1,783,514 534.31 1,722,775 (47.09) (60,739)$ 2C InTech Collegiate HS 331.84 1,004,887 331.84 1,049,015 ‐ 44,128$ 3C Entheos Academy 1,246.23 3,802,597 1,161.76 3,712,137 (84.47) (90,460)$ 4C Lakeview 1,141.23 3,501,669 1,059.96 3,419,585 (81.26) (82,084)$ 5C Legacy Preparatory 1,233.97 3,775,961 1,147.66 3,685,119 (86.32) (90,842)$ 6C Liberty Academy 592.62 1,813,823 549.41 1,764,751 (43.21) (49,072)$ 7C Monticello 835.85 2,568,352 771.51 2,495,045 (64.34) (73,307)$ 8C Mountainville 864.96 2,654,898 800.62 2,584,361 (64.33) (70,537)$ 9C Paradigm High 836.07 2,560,988 821.41 2,644,527 (14.66) 83,539$ 1D Renaissance 779.44 2,398,813 715.91 2,321,534 (63.53) (77,279)$ 2D Channing Hall 685.12 2,101,207 631.25 2,034,639 (53.87) (66,568)$ 3D Spectrum 3,289.78 9,615,519 3,234.38 9,630,797 (55.40) 15,278$ 4D Syracuse Arts 2,062.08 6,305,945 1,922.89 6,167,859 (139.19) (138,086)$ 5D George Washington 1,120.54 3,436,617 1,031.63 3,325,119 (88.91) (111,498)$ 6D Noah Webster 606.34 1,862,344 555.37 1,794,593 (50.96) (67,751)$ 7D Salt Lake SPA 440.70 1,352,063 440.70 1,422,860 ‐ 70,797$ 8D Open Classroom 422.37 1,295,133 390.22 1,257,393 (32.15) (37,740)$ 9D Canyon Rim 579.08 1,777,928 532.49 1,719,554 (46.59) (58,374)$ 1E Guadalupe Schools 337.13 1,034,432 310.38 1,001,212 (26.75) (33,220)$ 2E Karl G. Maeser 828.28 2,546,726 810.93 2,626,923 (17.35) 80,197$ 3E CS Lewis Academy 254.88 774,450 236.36 749,602 (18.52) (24,848)$
25

WPU Value: 3,092$ WPU Value: 3,269$ Change: 177$
# LEA
Total Basic School
Program WPUs
Total Basic School
Program Funding
Total Basic School
Program WPUs
Total Basic School
Program FundingWPUs Funding
w/ Class Size Funding (Current) Class Size Funding Rolled into WPU Differences
4E Dual Immersion Academy 521.23 1,600,484 479.35 1,548,236 (41.88) (52,248)$ 5E Edith Bowen 352.46 1,079,492 325.71 1,047,373 (26.75) (32,119)$ 7E Gateway Preparatory 747.02 2,286,746 691.80 2,222,655 (55.22) (64,091)$ 8E Merit College Preparatory 439.30 1,332,239 434.69 1,376,927 (4.61) 44,688$ 9E Providence Hall 2,728.70 8,316,044 2,590.44 8,263,686 (138.26) (52,358)$ 1F Quest Academy 1,143.10 3,487,320 1,065.11 3,402,280 (77.99) (85,040)$ 2F Rockwell HS 690.14 2,110,370 681.74 2,188,952 (8.39) 78,582$ 3F Venture 953.81 2,923,872 911.61 2,937,463 (42.20) 13,591$ 4F Center for Science Ed. 563.01 1,724,462 546.83 1,760,032 (16.18) 35,570$ 5F Utah Virtual Academy 2,877.84 8,725,463 2,784.05 8,809,005 (93.79) 83,542$ 6F The Early Light Academy 1,221.59 3,733,332 1,140.21 3,653,433 (81.38) (79,899)$ 7F Excelsior Academy 734.03 2,253,181 675.29 2,179,893 (58.74) (73,288)$ 8F Hawthorn Academy 1,792.02 5,478,105 1,663.28 5,331,328 (128.73) (146,777)$ 9F Mountain Heights 701.99 2,152,292 690.10 2,225,212 (11.89) 72,920$ 1G Jefferson Academy 594.41 1,819,805 545.91 1,754,061 (48.50) (65,744)$ 2G Vista at Entrada 1,047.43 3,205,509 969.46 3,113,278 (77.97) (92,231)$ 3G Bear River CS 214.11 653,069 198.64 634,241 (15.47) (18,828)$ 4G Maria Montessori 726.80 2,224,977 676.05 2,172,425 (50.75) (52,552)$ 5G Canyon Grove Adacemy 437.48 1,337,434 403.10 1,292,000 (34.38) (45,434)$ 6G Weilenmann School 661.80 2,031,398 609.81 1,968,435 (51.99) (62,963)$ 7G Summit Academy HS 813.35 2,490,401 813.35 2,617,623 ‐ 127,222$ 8G Good Foundations 537.97 1,647,697 495.69 1,593,910 (42.29) (53,787)$ 2H Utah Connections 1,363.53 4,173,324 1,325.60 4,261,451 (37.92) 88,127$ 3H Endeavor Hall 712.88 2,179,885 659.23 2,114,000 (53.65) (65,885)$ 4H Aristotle Academy 164.34 497,559 153.23 483,028 (11.11) (14,531)$ 5H HighMark CS 772.16 2,369,481 721.19 2,327,238 (50.97) (42,243)$ 6H Promontory School 511.93 1,572,037 471.16 1,521,969 (40.77) (50,068)$ 7H Pacific Heritage Acad. 430.80 1,320,638 396.92 1,278,339 (33.88) (42,299)$ 8H Valley Academy 423.20 1,296,208 390.34 1,255,233 (32.86) (40,975)$ 9H Pioneer High School 389.91 1,191,161 389.91 1,250,254 ‐ 59,093$ 1I UT International HS 287.26 877,857 282.91 907,391 (4.35) 29,534$ 2I Esperanza Elementary 492.74 1,513,168 451.49 1,458,482 (41.24) (54,686)$ 3I Leadership Learning 583.31 1,788,505 535.65 1,725,660 (47.65) (62,845)$
26

WPU Value: 3,092$ WPU Value: 3,269$ Change: 177$
# LEA
Total Basic School
Program WPUs
Total Basic School
Program Funding
Total Basic School
Program WPUs
Total Basic School
Program FundingWPUs Funding
w/ Class Size Funding (Current) Class Size Funding Rolled into WPU Differences
4I Mana Academy 502.57 1,544,355 466.35 1,508,385 (36.22) (35,970)$ 5I Voyage Academy 571.06 1,751,794 524.23 1,690,265 (46.83) (61,529)$ 7I WSU Charter School 32.29 98,765 28.83 92,422 (3.46) (6,343)$ 8I Winter Sports 149.70 461,339 149.70 486,822 ‐ 25,483$ 9I Utah Career Path 254.03 773,859 254.03 810,834 ‐ 36,975$ 1J Am Intl School of Utah 1,606.49 4,930,481 1,531.08 4,943,239 (75.41) 12,758$ 2J Ascent Academies of UT 2,455.37 7,517,514 2,286.81 7,350,034 (168.56) (167,480)$ 3J Dixie Montessori Academy 430.03 1,319,159 395.16 1,274,152 (34.86) (45,007)$ 4J Kairos Academy 74.23 226,169 74.23 237,012 ‐ 10,843$ 5J Mountain West Montessori Aca 525.71 1,613,314 485.12 1,565,399 (40.58) (47,915)$ 6J Scholar Academy 566.75 1,740,575 519.63 1,678,808 (47.12) (61,767)$ 7J Greenwood 470.23 1,442,718 431.93 1,393,074 (38.30) (49,644)$ 8J Terra Academy 783.23 2,403,498 743.14 2,398,663 (40.08) (4,835)$ 9J Lumen Scholar Institute 682.64 2,093,570 645.67 2,081,847 (36.97) (11,723)$ 1K Vanguard Academy 519.19 1,590,086 505.83 1,627,871 (13.36) 37,785$ 2K Utah Military Academy 765.83 2,351,769 749.05 2,421,451 (16.78) 69,682$ 3K Roots Charter HS 252.71 775,846 252.71 816,803 ‐ 40,957$ 4K Athenian eAcademy 668.30 2,051,515 625.10 2,018,449 (43.20) (33,066)$ 5K Wasatch Waldorf Academy 611.66 1,877,473 563.56 1,819,111 (48.10) (58,362)$ 6K Franklin Discovery Academy 530.46 1,627,436 485.92 1,567,031 (44.54) (60,405)$ 7K Wallace Stegner Academy 640.35 1,965,423 589.58 1,902,880 (50.77) (62,543)$ 8K American Academy of Innovation 468.36 1,438,998 452.33 1,463,251 (16.03) 24,253$ 9K St. George Academy 484.12 1,487,974 484.12 1,567,617 ‐ 79,643$ 1L Athlos Academy 928.56 2,849,902 854.45 2,757,526 (74.11) (92,376)$
Charter Totals: 91,332.42 279,120,564$ 86,320.15 276,649,554$ (5,012.27) (2,471,010)$
Statewide Totals: 845,317.56 2,586,166,787$ 805,327.70 2,586,166,787$ (39,989.86) ‐$
27

ID LEA Current (K‐8) K‐3 K‐5 K‐3 K‐51 Alpine 14,414,612$ 14,365,876$ 14,361,375$ (48,736)$ (53,237)$ 2 Beaver 300,389 292,771 292,575 (7,618) (7,814) 3 Box Elder 2,149,237 2,183,574 2,173,087 34,337 23,850 4 Cache 3,247,326 3,131,244 3,165,079 (116,081) (82,247) 5 Carbon 658,404 678,013 669,124 19,609 10,720 6 Daggett 36,657 34,327 35,798 (2,330) (859) 7 Davis 13,190,917 13,087,403 13,093,123 (103,513) (97,794) 8 Duchesne 978,879 1,041,803 1,006,565 62,924 27,686 9 Emery 436,457 431,771 429,532 (4,686) (6,925) 10 Garfield 174,669 170,224 175,933 (4,445) 1,264 11 Grand 267,646 259,870 264,553 (7,776) (3,094) 12 Granite 13,014,857 13,273,866 13,165,033 259,009 150,176 13 Iron 1,715,320 1,696,397 1,717,741 (18,923) 2,421 14 Jordan 9,756,329 9,723,063 9,717,949 (33,266) (38,380) 15 Juab 463,603 459,729 467,074 (3,874) 3,472 16 Kane 229,198 216,854 223,109 (12,344) (6,089) 17 Millard 519,409 499,368 510,523 (20,041) (8,886) 18 Morgan 550,392 553,609 551,482 3,217 1,090 19 Nebo 6,039,484 5,949,117 5,987,331 (90,367) (52,152) 20 No. Sanpete 463,767 462,279 475,049 (1,488) 11,281 21 No. Summit 191,896 188,941 189,045 (2,955) (2,851) 22 Park City 885,541 789,749 832,013 (95,792) (53,528) 23 Piute 53,126 45,470 46,945 (7,656) (6,181) 24 Rich 95,758 96,697 96,118 939 359 25 San Juan 549,149 540,855 532,159 (8,294) (16,990) 26 Sevier 880,102 856,841 866,835 (23,261) (13,267) 27 So. Sanpete 597,469 582,123 590,502 (15,347) (6,967) 28 So. Summit 304,076 288,628 292,999 (15,448) (11,076) 29 Tintic 43,815 38,622 38,887 (5,193) (4,928)
CSR Funding Based on Grades: Differences from Current
Class Size Reduction Funding Based on Grades K‐3 or K‐5 ‐ Fiscal Year 2016
Appendix D
28

ID LEA Current (K‐8) K‐3 K‐5 K‐3 K‐5CSR Funding Based on Grades: Differences from Current
30 Tooele 2,608,839 2,515,074 2,544,208 (93,765) (64,631) 31 Uintah 1,624,627 1,740,005 1,693,750 115,377 69,122 32 Wasatch 1,202,958 1,170,673 1,169,964 (32,285) (32,995) 33 Washington 5,287,263 5,154,611 5,208,925 (132,652) (78,338) 34 Wayne 89,391 85,443 87,035 (3,948) (2,356) 35 Weber 5,811,208 5,598,718 5,675,690 (212,489) (135,518) 36 Salt Lake 4,501,627 4,795,231 4,711,856 293,604 210,229 37 Ogden 2,369,666 2,536,702 2,463,907 167,036 94,241 38 Provo 3,280,927 3,411,208 3,385,134 130,281 104,207 39 Logan 1,160,980 1,238,972 1,183,330 77,992 22,350 40 Murray 1,228,021 1,233,708 1,229,335 5,687 1,314 42 Canyons 6,341,443 6,179,417 6,237,225 (162,026) (104,217)
Total Districts: 107,715,433$ 107,598,848$ 107,557,898$ (116,586)$ (157,536)$
68 Ogden Prep 266,910$ 259,158$ 260,717$ (7,752)$ (6,192)$ 74 American Prep 808,729 748,496 775,175 (60,234) (33,555) 81 Walden School 76,987 84,388 77,121 7,401 134 82 Freedom Academy 262,050 256,201 254,401 (5,848) (7,648) 83 AMES ‐ ‐ ‐ ‐ ‐ 86 Pinnacle Canyon 80,491 73,833 82,167 (6,658) 1,676 87 City Academy 18,672 ‐ ‐ (18,672) (18,672) 89 Soldier Hollow 74,512 95,733 96,029 21,221 21,517 90 Tuacahn High ‐ ‐ ‐ ‐ ‐ 92 Uintah River High ‐ ‐ ‐ ‐ ‐ 93 John Hancock 51,080 49,826 58,196 (1,254) 7,115 94 Thomas Edison ‐ North 344,151 357,763 357,261 13,613 13,111 95 Timpanogos Academy 138,870 172,479 175,260 33,609 36,390 97 Salt Lake Arts 107,533 ‐ 39,167 (107,533) (68,366) 98 Fast Forward ‐ ‐ ‐ ‐ ‐ A1 NUAMES ‐ ‐ ‐ ‐ ‐ A2 Ranches Academy 100,198 126,039 126,456 25,840 26,257 A3 DaVinci Academy 202,437 198,578 198,589 (3,859) (3,848)
29

ID LEA Current (K‐8) K‐3 K‐5 K‐3 K‐5CSR Funding Based on Grades: Differences from Current
A4 Summit Academy 493,029 500,945 499,760 7,916 6,731 A5 Itineris ‐ ‐ ‐ ‐ ‐ A6 North Davis Prep 255,857 256,132 261,301 275 5,445 A7 Moab Charter 34,425 42,488 43,748 8,063 9,323 A8 East Hollywood High ‐ ‐ ‐ ‐ ‐ A9 SUCCESS Academy ‐ ‐ ‐ ‐ ‐ 1B UCAS ‐ ‐ ‐ ‐ ‐ 2B Lincoln Academy 216,019 167,260 175,415 (48,760) (40,604) 3B Beehive Science & Tech 51,603 ‐ ‐ (51,603) (51,603) 4B Wasatch Peak 112,848 158,093 146,897 45,245 34,050 5B North Star Academy 131,534 120,487 123,356 (11,047) (8,178) 7B Reagan Academy 182,096 193,828 194,525 11,732 12,430 8B American Leadership 324,316 311,093 301,404 (13,222) (22,912) 9B Navigator Pointe 131,851 137,394 139,190 5,543 7,339 1C Odyssey 145,689 215,767 195,835 70,078 50,146 2C InTech Collegiate HS ‐ ‐ ‐ ‐ ‐ 3C Entheos Academy 259,427 253,380 255,813 (6,047) (3,614) 4C Lakeview 251,394 246,857 246,893 (4,537) (4,501) 5C Legacy Preparatory 266,216 266,369 272,873 153 6,656 6C Liberty Academy 127,043 139,236 138,093 12,192 11,050 7C Monticello 191,414 188,367 189,686 (3,048) (1,728) 8C Mountainville 196,595 186,937 209,086 (9,658) 12,491 9C Paradigm High 45,628 ‐ ‐ (45,628) (45,628) 1D Renaissance 196,527 245,929 224,668 49,403 28,142 2D Channing Hall 177,661 184,567 185,355 6,907 7,694 3D Spectrum 173,138 148,967 153,565 (24,172) (19,573) 4D Syracuse Arts 425,724 437,289 438,983 11,565 13,259 5D George Washington 275,041 328,651 323,730 53,610 48,689 6D Noah Webster 156,054 208,232 201,369 52,177 45,314 7D Salt Lake SPA ‐ ‐ ‐ ‐ ‐ 8D Open Classroom 97,618 104,748 104,271 7,130 6,653 9D Canyon Rim 144,399 182,080 182,823 37,681 38,424
30

ID LEA Current (K‐8) K‐3 K‐5 K‐3 K‐5CSR Funding Based on Grades: Differences from Current
1E Guadalupe Schools 82,756 110,080 109,066 27,325 26,310 2E Karl G. Maeser 57,717 ‐ ‐ (57,717) (57,717) 3E CS Lewis Academy 72,085 94,637 92,220 22,551 20,134 4E Dual Immersion Academy 129,553 157,175 138,683 27,622 9,130 5E Edith Bowen 82,751 120,517 122,222 37,766 39,471 7E Gateway Preparatory 170,828 172,147 176,263 1,319 5,435 8E Merit College Preparatory 18,678 ‐ ‐ (18,678) (18,678) 9E Providence Hall 423,101 302,191 343,639 (120,910) (79,462) 1F Quest Academy 246,047 287,453 274,984 41,405 28,937 2F Rockwell HS 27,601 ‐ ‐ (27,601) (27,601) 3F Venture 130,542 120,442 120,609 (10,100) (9,934) 4F Center for Science Ed. 51,122 ‐ ‐ (51,122) (51,122) 5F Utah Virtual Academy 314,399 221,375 241,464 (93,024) (72,935) 6F The Early Light Academy 251,746 247,667 250,573 (4,080) (1,173) 7F Excelsior Academy 181,701 186,167 186,745 4,467 5,045 8F Hawthorn Academy 378,182 430,422 427,741 52,239 49,559 9F Mountain Heights 30,999 ‐ ‐ (30,999) (30,999) 1G Jefferson Academy 150,030 219,960 198,381 69,930 48,351 2G Vista at Entrada 241,210 226,973 237,229 (14,237) (3,981) 3G Bear River CS 48,119 47,393 48,069 (726) (49) 4G Maria Montessori 154,959 181,151 170,760 26,192 15,801 5G Canyon Grove Adacemy 118,148 157,565 143,501 39,417 25,353 6G Weilenmann School 160,025 159,528 179,849 (497) 19,824 7G Summit Academy HS ‐ ‐ ‐ ‐ ‐ 8G Good Foundations 129,506 176,473 173,953 46,967 44,446 9G Alianza Academy 17,144 17,144 17,144 0 0 2H Utah Connections 118,555 78,909 89,427 (39,646) (29,128) 3H Endeavor Hall 165,418 179,851 177,000 14,433 11,582 4H Aristotle Academy 39,658 48,226 44,248 8,568 4,590 5H HighMark CS 158,744 125,864 137,349 (32,880) (21,395) 6H Promontory School 126,130 121,316 122,391 (4,814) (3,739) 7H Pacific Heritage Acad. 102,475 123,077 114,914 20,602 12,439
31

ID LEA Current (K‐8) K‐3 K‐5 K‐3 K‐5CSR Funding Based on Grades: Differences from Current
8H Valley Academy 112,270 120,543 118,151 8,273 5,881 9H Pioneer High School ‐ ‐ ‐ ‐ ‐ 1I UT International HS 14,851 ‐ ‐ (14,851) (14,851) 2I Esperanza Elementary 127,592 189,544 169,028 61,952 41,437 3I Leadership Learning 145,081 191,314 189,251 46,233 44,170 4I Mana Academy 101,206 114,838 105,317 13,633 4,111 5I Voyage Academy 144,871 181,720 186,983 36,849 42,112 6I Wasatch Institute of Tech. ‐ ‐ ‐ ‐ ‐ 7I WSU Charter School 11,783 25,873 17,403 14,090 5,620 8I Winter Sports ‐ ‐ ‐ ‐ ‐ 9I Utah Career Path ‐ ‐ ‐ ‐ ‐ 1J Am Intl School of Utah 190,016 114,813 124,663 (75,204) (65,353) 2J Ascent Academies of UT 502,052 510,025 511,106 7,972 9,053 3J Dixie Montessori Academy 107,849 146,109 138,570 38,260 30,721 4J Kairos Academy ‐ ‐ ‐ ‐ ‐ 5J Mountain West Montessori Aca 125,544 123,215 124,165 (2,328) (1,378) 6J Scholar Academy 139,140 187,399 185,453 48,260 46,313 7J Greenwood 111,598 165,179 150,990 53,581 39,392 8J Terra Academy 123,722 120,405 121,687 (3,317) (2,034) 9J MyOptions 123,722 114,960 120,466 (8,762) (3,255) 1K Vanguard Academy 48,497 ‐ ‐ (48,497) (48,497) 2K Utah Military Academy 46,439 ‐ ‐ (46,439) (46,439) 3K Roots Charter HS ‐ ‐ ‐ ‐ ‐ 4K Athenian eAcademy 133,641 134,926 132,269 1,285 (1,373)
Charter Totals 14,285,567$ 14,402,152$ 14,443,102$ 116,586$ 157,536$
Statewide Totals 122,001,000$ 122,001,000$ 122,001,000$ ‐$ ‐$
32