class developments during ip3 diana verseghy climate research division environment canada
TRANSCRIPT

CLASS developmentsduring IP3
Diana Verseghy
Climate Research Division
Environment Canada

The Canadian Land Surface Scheme (CLASS)
Big Leaf canopy
Monin-Obukhovsimilarity theory
Variable soil layers
Drainage (Darcy’s Law)
Heat (thermal diffusion)
Explicit snow layer
Canopy interception evaporation melt condensation sublimation unloading
(after Verseghy, 2000)
Improved snowalgorithms
Version 3.x
Mosaic
Canopy conductancevaries with species
MESHwater routing
Organic soils
2

History of CLASSVersion / Release date Major features and enhancements
1.0 April ’89 Basic thermal and hydrological model of soil and snow.
2.0 August ’91 Addition of vegetation thermal and hydrological model.
2.1 May ’93 Full vectorization of code to enable efficient running on vector computers.
2.2 April ’94 Augmentation of diagnostic calculations; incorporation of in-line comments throughout. Development of a parallel stand-alone version of the model for use in CRN land surface node.
2.3 December ’94 Revisions to diagnostic calculations; new near-surface atmospheric stability functions.
2.4 August ’95 Complete set of water budget diagnostic calculations; parameterizations of organic soils and rock soils; allowance for inhomogeneity between soil layers; incorporation of variable surface detention capacity.
2.5 January ’96 Completion of energy budget diagnostic calculations.
2.6 August ’97 Revisions to surface stability function calculations.
2.7 December ’97 Incorporation of variable soil permeable depth; calculation of soil thermal and hydraulic properties based on textural composition; modified surface temperature iteration scheme.

Effect of varying permeable depth of soil
Control (white): Standard 3-layer configuration of CLASS, with permeable depth = 1.0 m.
Experiment (red): Permeable depth decreased to 0.2 m.
Grid cell located near Peace River, Alberta.
Differences seen in daily average and cumulative QE: ~15% less with shallower soil.

CLASS versions 3.0, 3.1, 3.2(Dec. 2002, Apr. 2005, May 2006)
• Improved treatment of soil evaporation• Ability to model organic soils• New canopy conductance and leaf boundary resistance• Enhanced snow density, interception, sublimation• Improved turbulent transfer from vegetation• Optional mosaic formulation• Option for multiple soil layers at depth• Modelled liquid water content of snow pack• Revised radiation transmission in vegetation• Implemented in F90, single precision calculations allowed

Effect of including organic soils.
Control run: Grid cell located near Thompson, Manitoba, with medium-textured mineral soil.
Experiment: Replace mineral soil in the profile with organic soil.
Vegetation identical in both cases: sparse sedge.
Here differences are seen in daily average and cumulative QE; larger by ~20% in organic soil run.

Global Climate Models (GCMs) and Regional Climate Models (RCMs) have a limited resolution.
• Each grid cell contains a variety of surface types
Aggregated: one patch containingdominant or aggregated surfaceparameters
Mosaic: multiple patches, eachcontaining individual surfaceparameters
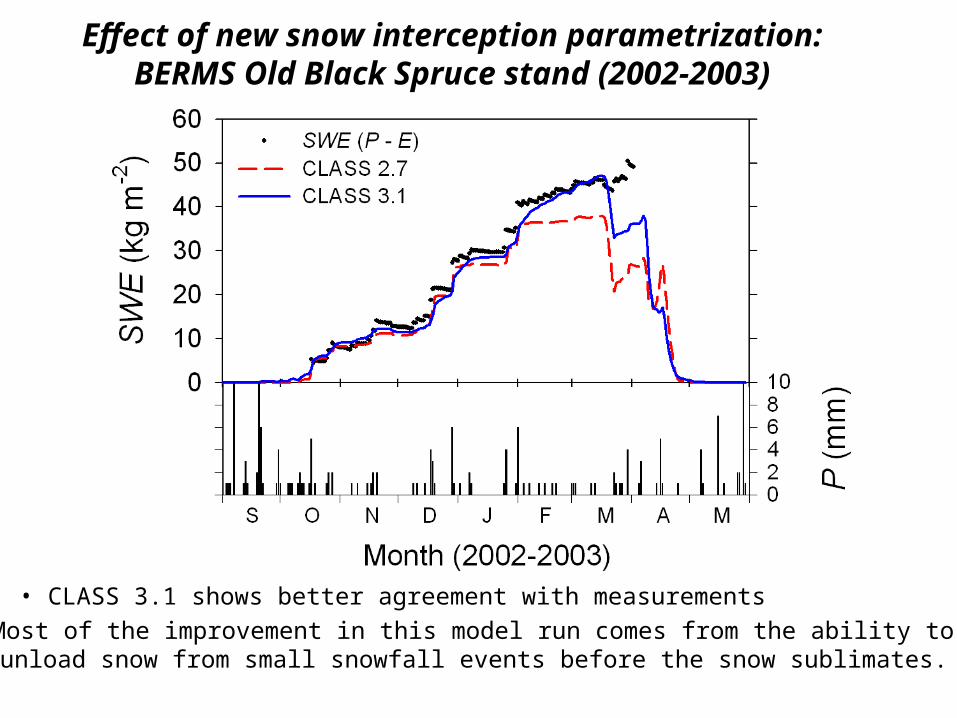
Effect of new snow interception parametrization:BERMS Old Black Spruce stand (2002-2003)
• CLASS 3.1 shows better agreement with measurements• Most of the improvement in this model run comes from the ability to unload snow from small snowfall events before the snow sublimates.

Effect of number of soil layers
Control run: Standard configuration of CLASS with 3 soil layers, Δz = 0.10, 0.25, 3.75 m.
Experiment: 9 soil layers, Δz = 0.10, 0.25, 0.25, 0.25, 0.25, 0.50, 0.50, 1.0, 1.0.
Shown: output for grid cell located in central Mackenzie River basin.
Surface temperatures and fluxes to the atmosphere show little systematic difference.

White line: T of soil layer 3 in three-layer run.
Red, green, blue and violet lines: T of soil layers 3, 6, 8 and 9 in nine-layer run.
Average temperature of layer 3 in three-layer run does not fall below zero. The depth of the zero isotherm could in principle be obtained from thequadratic temperature profile, but this neglects the heat sink of the phase change of water in the upper part of the layer.
Thus, for an accurate determination of the freezing depth or active layer depth in soil, multiple subdivisions of the third soil layer are necessary.

White line: T of soil layer 5 in 5-layer run (total depth 4 m). Red, green, blue, violet, yellow lines: T of soil layers 5, 6, 7, 8, 9 in nine-layer run (total depth 12 m).
Temperatures of fifth and lower soil layers show effect of allowing heat transfer to greater depths, with implications for modelling of deep permafrost.

Effect of including water retention in snow pack
Control: CLASS 3.2 (red)
Experiment: CLASS 3.3 (white)
Grid cell located in mainland Nunavut.
Negligible effect on snow pack evolution at this location. Probably greater effect at more temperate locations with deeper snow packs.

CLASS version 3.3(Completed December 2006)
• Separate thermal treatment of snow and soil• Extend multiple-layer option to ice sheets• Water and energy balance checks at each time step• Modifications to soil hydraulic conductivity
calculations• Small numerical fixes associated with single-
precision calculations identified during testing withCRCM

Effect of separating snowand soil temperature
calculations
Control: CLASS 3.2 (red)Experiment: CLASS 3.3 (white)
Test grid cells near Peace River, Alberta (top) and in the central Mackenzie River basin (bottom)
Differences are slight, but snow persists for slightly longer in CLASS 3.3 during the melt period.

CLASS version 3.4(Completed April 2008)
Slight streamlining to improve readability and understandability
Deletion of old work arrays and trial pieces of code Revision of soil thermal conductivity calculations Removal of option for net longwave forcing Rationalize concurrent occurrence of precipitation and
evapotranspiration

CLASS documentation
First version produced for CLASS 3.4 Over 13,000 lines of code described Explanation, dictionary of variables, equations
and references for each subroutine Instructions for assembly of input data, use of
flags Guidelines for setup of mosaic tiling and soil
layering

CLASS version 3.5(Completed December 2009)
Revised field capacity calculation for base soil layer
New calculation of baseflow Revised treatment of water on canopy and
concurrent evaporation and precipitation Alternate option for snow thermal conductivity

Further research topics• Sensitivity tests on mosaic formulation, soil and canopy
discretization• IPY snow modelling study over Quebec, using
assimilated atmospheric data and MAGS NA vegetation and soils database
• Offline runs over each IP3 research basin, focussing on CLASS-atmosphere coupling and using CRCM forcing
• CLASS version 3.5 is now in the process of being coupled to the Canadian Earth System Model
• Two major streams of application: MESH (environmental prediction) and CanESM (climate change with coupled carbon and nitrogen cycles via CTEM)

IP3 follow-up work
• Regional driver developed for IPY can be applied to IP3 research basins
• Atmospheric fields can be provided by GEM or CRCM runs
• Land cover and soil data needed from basin modellers
• Initialization problem for soil fields needs to be investigated
• Analogous tests to those being done for IPY can be run over the IP3 basins, and other basin-specific questions can be addressed

CRCM comparison runs
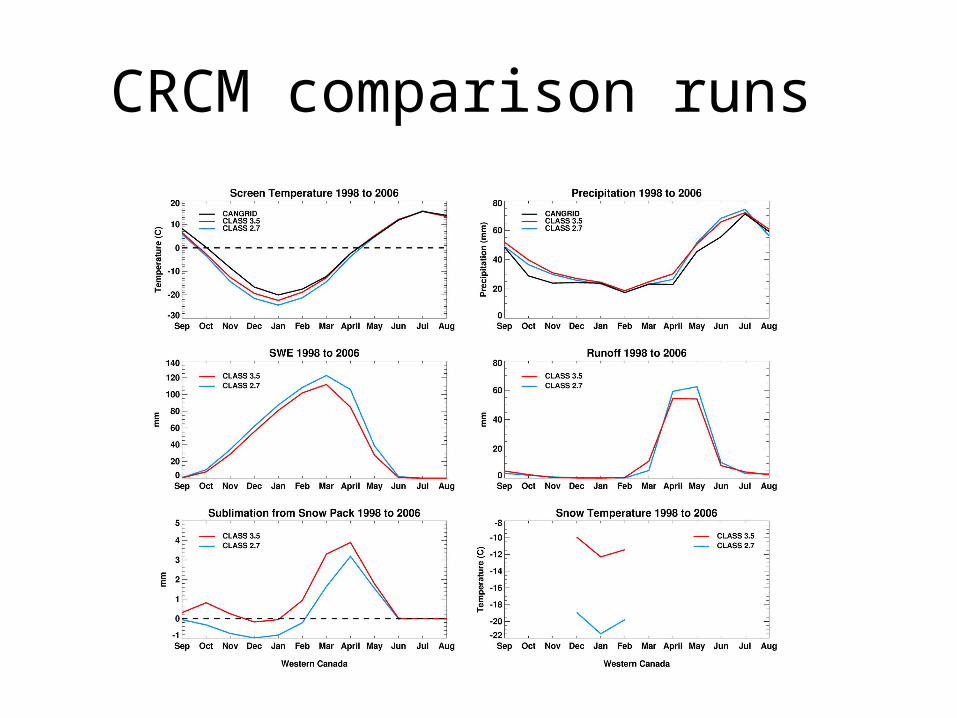
CRCM comparison runs

IP3 Research Basins
Trail Valley Creek, arctic tundra
Havikpak Creek, taiga woodland
Baker Creek, Subarctic shield lakes
Wolf Creek, subarctic tundra cordillera
Scotty Creek, permafrost wetlands
Lake O’Hara, wet alpine
Marmot Creek, Dry subalpine
Peyto Creek, glacierized alpine