claas - annual report 2003 · ebitda = ebit + depreciation of tangible assets + amortization of...
TRANSCRIPT
KEY DATA FOR THE GROUP ACCORDING TO US GAAP
��� ��� ��� ��� ��� ��� �� �� �� ��
�����
����
����
�����
����
����
�����
����
����
�����
����
����
�����
����
����
�����
����
����
���
����
����
���
����
����
���
����
����
���
����
����
�����
�����
���
NET SALES �������������
����������������������
�����������������������
���������������������������������
� ���
0
500
1000
1500
2000
ANNUAL REPORT 2003
Customers
Partners
Investors
Employees
Society
2003 2002 Change %
PROFIT AND LOSS ACCOUNT
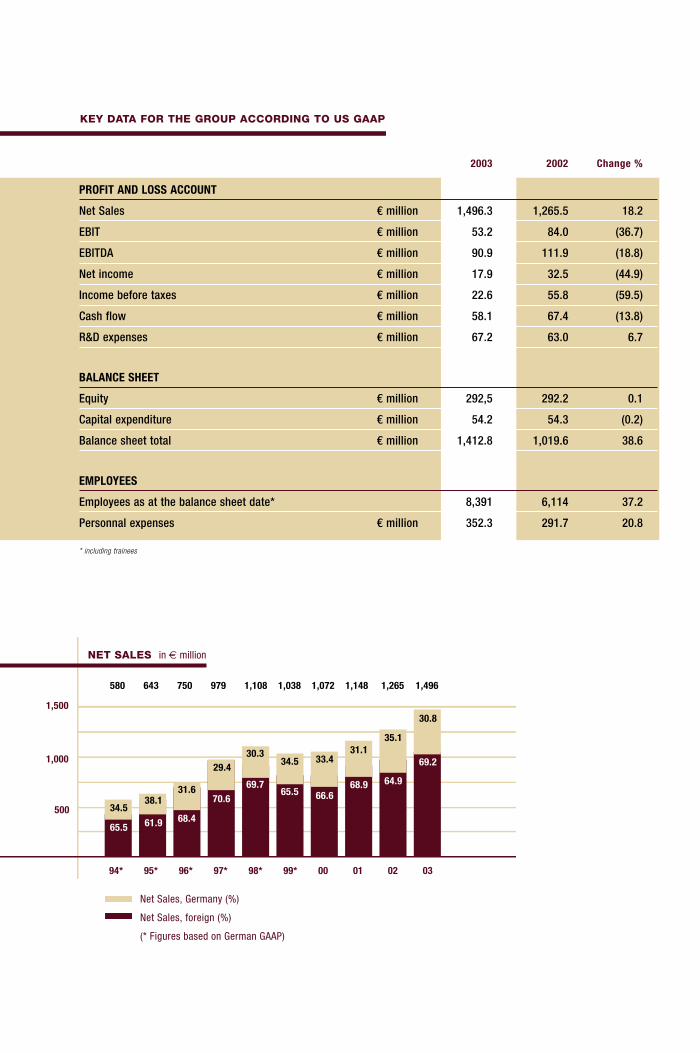
Net Sales € million 1,496.3 1,265.5 18.2
EBIT € million 53.2 84.0 (36.7)
EBITDA € million 90.9 111.9 (18.8)
Net income € million 17.9 32.5 (44.9)
Income before taxes € million 22.6 55.8 (59.5)
Cash flow € million 58.1 67.4 (13.8)
R&D expenses € million 67.2 63.0 6.7
BALANCE SHEET
Equity € million 292,5 292.2 0.1
Capital expenditure € million 54.2 54.3 (0.2)
Balance sheet total € million 1,412.8 1,019.6 38.6
EMPLOYEES
Employees as at the balance sheet date* 8,391 6,114 37.2
Personnal expenses € million 352.3 291.7 20.8
* including trainees
DEFINITIONS
Return on sales = Income before taxes
Net sales
EBIT = Net income + taxes on income + minority interest -/+ income from changes
in accounting principles + interest expense + profit transferred under a partial profit transfer
agreement (CMG) + remuneration participating certificates
EBITDA = EBIT + depreciation of tangible assets + amortization of intangible assets
Return on equity = Net income
Equity
Return on total capital employed = EBIT
Balance sheet total
Cash flow according to DVFA/SG = Net income + depreciation of tangible assets + amortization of intangible assets +/-
changes of pension provisions and other long-term provisions +/-
other expenses/ income without cash flow impact
Equity ratio = Equity
Balance sheet total
First-degree liquidity = Liquidity
Short-term liabilities
Equity to fixed assets ratio = Equity + funds similar to equity + long-term liabilities
Fixed assets
Working capital = Inventories ./. advance payments received +/- accounts receivable/ trade payables +/-
accounts receivable/payable to investments/associates +/- notes receivable/notes payable
ANNU
AL R
EPOR
T 20
03CONTACT
CLAAS KGaA mbH
P.O. Box 1163
Münsterstrasse 33
D-33426 Harsewinkel
Germany
www.claas.com
Additional copies of this report
and further information about
CLAAS are available free of
charge on request.
PUBLIC/INVESTOR RELATIONS
Tel.: (05247) 12-1743
Fax: (05247) 12-1751
E-mail: [email protected]
This annual report is available
in German and English. Both
versions may be downloaded on
the Internet AT www.claas.com
CONCEPT & DESIGN
Kirchhoff Consult AG
Hamburg, Germany
together
KEY DATA FOR THE GROUP ACCORDING TO US GAAP
��� ��� ��� ��� ��� ��� �� �� �� ��
�����
����
����
�����
����
����
�����
����
����
�����
����
����
�����
����
����
�����
����
����
���
����
����
���
����
����
���
����
����
���
����
����
�����
�����
���
NET SALES �������������
����������������������
�����������������������
���������������������������������
� ���
0
500
1000
1500
2000
ANNUAL REPORT 2003
Customers
Partners
Investors
Employees
Society
2003 2002 Change %
PROFIT AND LOSS ACCOUNT
Net Sales € million 1,496.3 1,265.5 18.2
EBIT € million 53.2 84.0 (36.7)
EBITDA € million 90.9 111.9 (18.8)
Net income € million 17.9 32.5 (44.9)
Income before taxes € million 22.6 55.8 (59.5)
Cash flow € million 58.1 67.4 (13.8)
R&D expenses € million 67.2 63.0 6.7
BALANCE SHEET
Equity € million 292,5 292.2 0.1
Capital expenditure € million 54.2 54.3 (0.2)
Balance sheet total € million 1,412.8 1,019.6 38.6
EMPLOYEES
Employees as at the balance sheet date* 8,391 6,114 37.2
Personnal expenses € million 352.3 291.7 20.8
* including trainees
DEFINITIONS
Return on sales = Income before taxes
Net sales
EBIT = Net income + taxes on income + minority interest -/+ income from changes
in accounting principles + interest expense + profit transferred under a partial profit transfer
agreement (CMG) + remuneration participating certificates
EBITDA = EBIT + depreciation of tangible assets + amortization of intangible assets
Return on equity = Net income
Equity
Return on total capital employed = EBIT
Balance sheet total
Cash flow according to DVFA/SG = Net income + depreciation of tangible assets + amortization of intangible assets +/-
changes of pension provisions and other long-term provisions +/-
other expenses/ income without cash flow impact
Equity ratio = Equity
Balance sheet total
First-degree liquidity = Liquidity
Short-term liabilities
Equity to fixed assets ratio = Equity + funds similar to equity + long-term liabilities
Fixed assets
Working capital = Inventories ./. advance payments received +/- accounts receivable/ trade payables +/-
accounts receivable/payable to investments/associates +/- notes receivable/notes payable
ANNU
AL R
EPOR
T 20
03CONTACT
CLAAS KGaA mbH
P.O. Box 1163
Münsterstrasse 33
D-33426 Harsewinkel
Germany
www.claas.com
Additional copies of this report
and further information about
CLAAS are available free of
charge on request.
PUBLIC/INVESTOR RELATIONS
Tel.: (05247) 12-1743
Fax: (05247) 12-1751
E-mail: [email protected]
This annual report is available
in German and English. Both
versions may be downloaded on
the Internet AT www.claas.com
CONCEPT & DESIGN
Kirchhoff Consult AG
Hamburg, Germany
together

FORAGE HARVESTERS TELESCOPIC LOADERS SPECIAL PRODUCTS
GREEN HARVEST MACHINERY
BALERS PRODUCTION ENGINEERING/
INDUSTRIAL ENGINEERING
PRODUCT OVERVIEW
COMBINE HARVESTERS TRACTORS
AGRICULTURAL ENGINEERING
Combine harvesters, forage harvesters,
square balers, round balers and con-
ventional high-density balers, as well as
green harvest machinery, system carrier
vehicles and agricultural information
technology
New: the range of products has been
expanded to include tractors
INDUSTRIAL ENGINEERING
System supplier for drive technology
and hydraulics
Axles and gears for agricultural and
construction machinery, as well as
commercial vehicles
PRODUCTION ENGINEERING
Development and production of com-
plete production lines for the auto-
motive and aircraft industries around
the world
Founded in 1913, today the company is the fourth largest manufacturer
of agricultural machinery in the world, covering the entire processing
chain of agricultural engineering.
In Europe we are the undisputed market leader for combine harvesters,
and worldwide we are number 1 for self-propelled forage harvesters.
In four German locations and five plants abroad, we produce local pro-
ducts globally for all countries of the world.
Currently more than 8,000 employees work for CLAAS Group worldwide.
CLAAS in brief
OCTOBER NOVEMBER DECEMBER JANUARY FEBRUARY MARCH APRIL MAY JUNE JULY AUGUST SEPTEMBER OCTOBER
CLAAS presented the
latest agricultural machi-
nery to 15.000 visitors
at a four-week-long
»World CLAAS Forum«
in the North of France.
CLAAS Fertigungstechnik,
a subsidiary company of the
CLAAS Group specialising in
complex industrial facilities,
has taken over a majority
stake in Brötje Automation.
CLAAS expands its pro-
duct range with tractors
through the acquisition
of a majority stake in
RENAULT Agriculture
As the first »MidCap«-
company, within the frame-
work of the Traditional
Private Placement, CLAAS
issued bonds in the amount
of US-$ 200 million.
In order to build a
plant, CLAAS signs an
investment agreement
with the Russian
region Krasnodar.
Opening of the modernized
and a more flexibly designed
plant in Bad Saulgau.
50 years of modern
CLAAS combine harvesters.
CLAAS introduced a
self-propelled combine
harvester »Hercules«
to the grain harvest for
the first time in 1953.
More power and more
efficiency in new design
– that´s the new
LEXION 500 series.
Introduction of
tractors under the
CLAAS name and
in CLAAS design.
Highlights 02/03

MARKET & PRODUCTS
CLAAS & CUSTOMERS
Innovation offensive at Agritechnica
EMPLOYEES
CLAAS & EMPLOYEES
Celebration: the 400,000th combine harvester comes off the production line
CORPORATE RESPONSIBILITY
CLAAS & SOCIETY
Agricultural technology in the service of society and environment
20
32
36
40
26CAPITAL MARKETS
CLAAS & INVESTORS
In dialogue: the CLAAS financial partners meeting
49 Management Report and Consolidated Financial Statements
in accordance with US GAAP accounting standards
94 The CLAAS Group/Locations
43
14 Report of the Supervisory Board
16 Preface & Management
STRATEGY
CLAAS & PARTNERS
Partnership with RENAULT Agriculture
CLAAS builds combine harvester plant in Krasnodar
DOSSIER: »FOOD – A JOINT TASK FOR THE FUTURE«
The world economy needs sophisticated agricultural machinery and qualified expertise to meet
the needs of food production and to ensure sustainable, environmentally safe and economical
use of land. As a leader in the market and technology, CLAAS is among the leaders in this
future-oriented process. We supply the needs of international agriculture with equipment, sys-
tems and accompanying service. In this regard, we consider our machines and ideas to be a
key element in the process chain for »food manufacture«. Read more about this in our dossier.

Success in agriculture is the product of commitment, competence
and perfect timing. Today more than ever, CLAAS is a reliable system
supplier, now with modern tractors in the product line alongside its
proven harvest machinery.
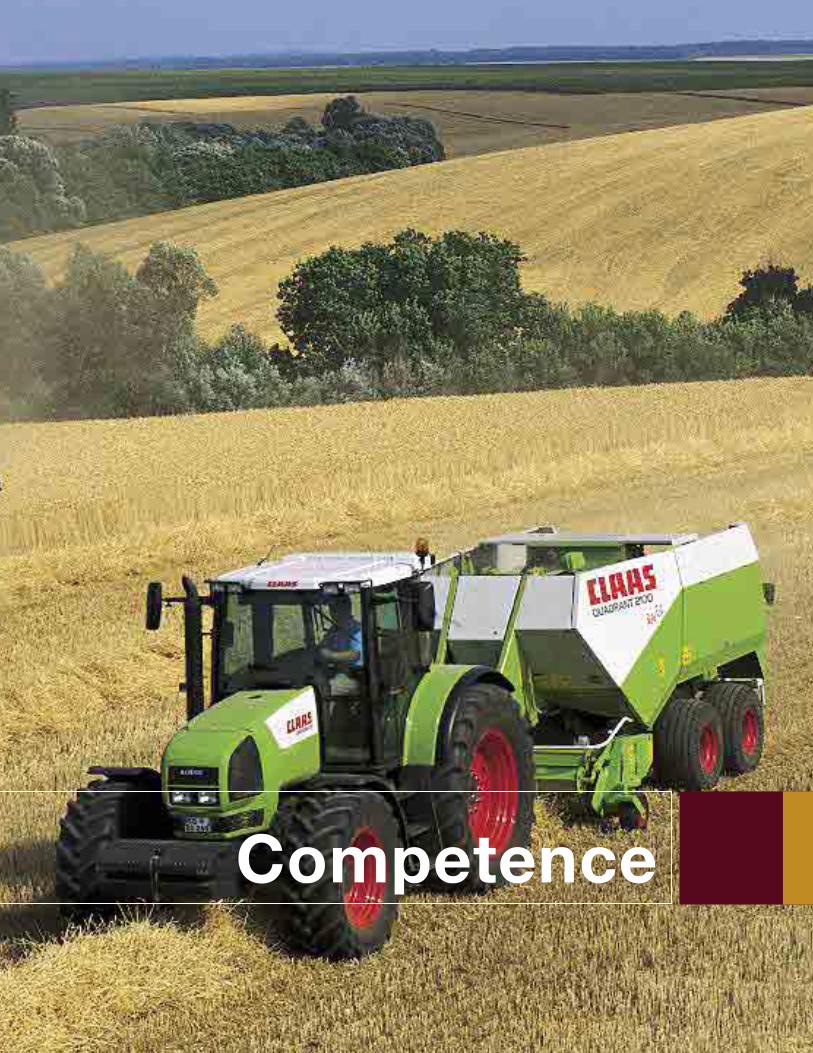
Competence

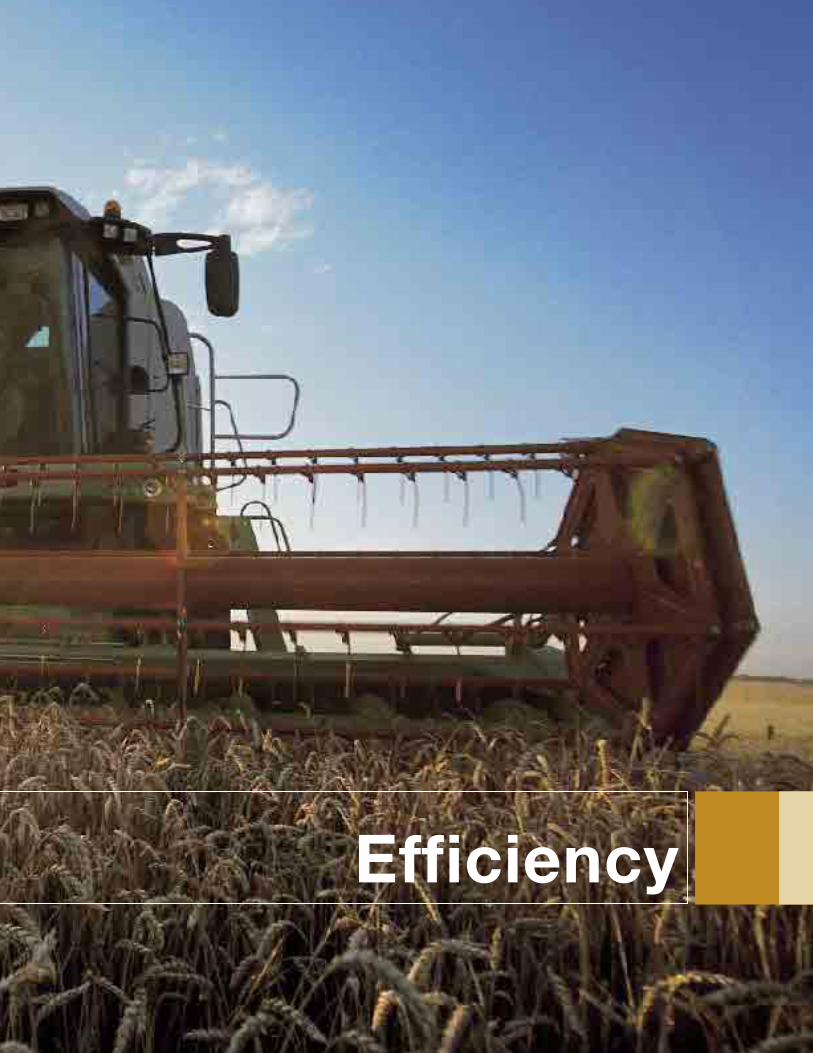
When it comes to efficiency, there’s no beating the new
LEXION combine harvesters. This year, with an average
crop throughput of 70 tonnes of wheat per hour, the
LEXION has achieved a world record performance.
Efficiency
Efficiency
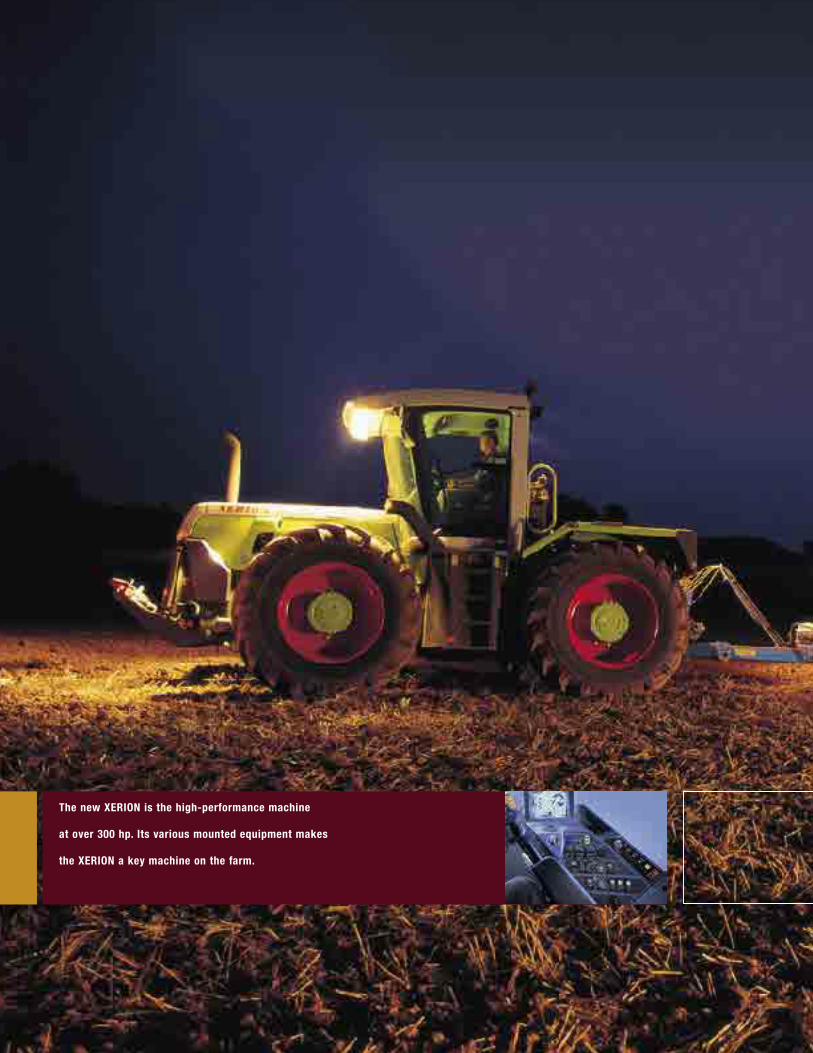
The new XERION is the high-performance machine
at over 300 hp. Its various mounted equipment makes
the XERION a key machine on the farm.
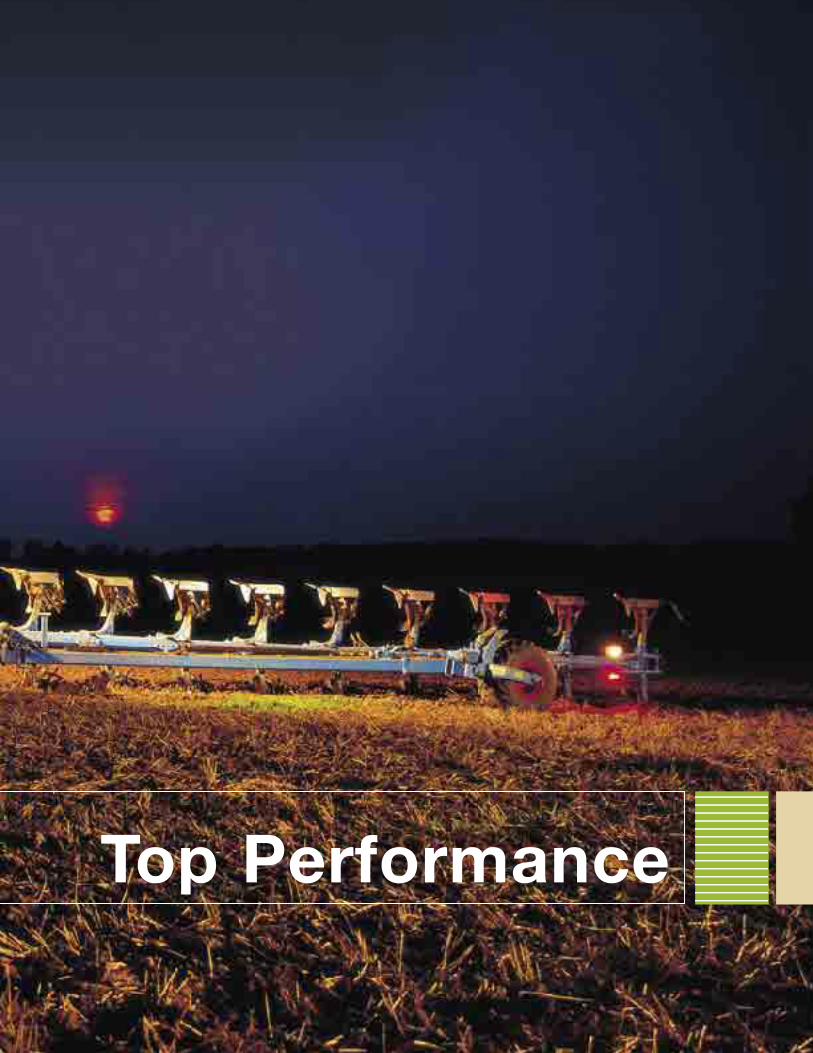
Top Performance

Over 600 hp deliver, not only the maximum power for the
harvest they can also show speed on the roads. With the
new series of JAGUAR forage harvesters a better perfor-
mance in the »green harvest machinery« is achieved.

Speed

Satellite-assisted harvesting in combination
with the very latest on-board information systems
are the platform for precision farming and hence
maximum efficiency.
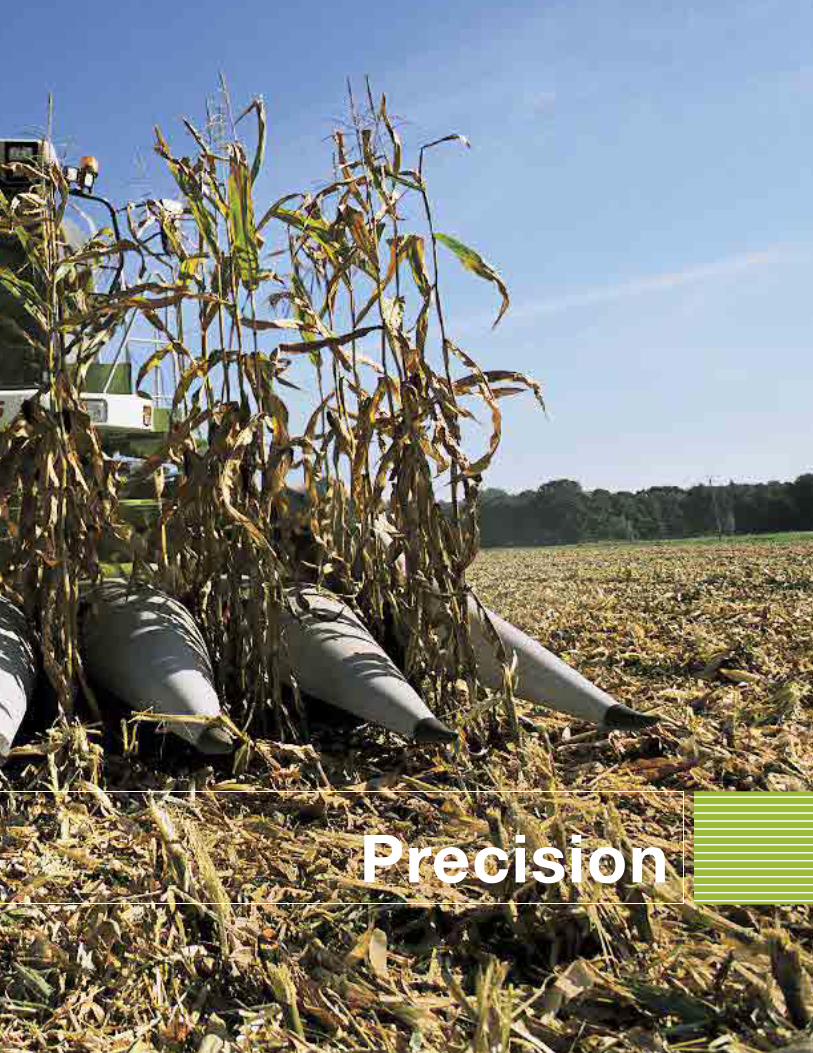
Precision
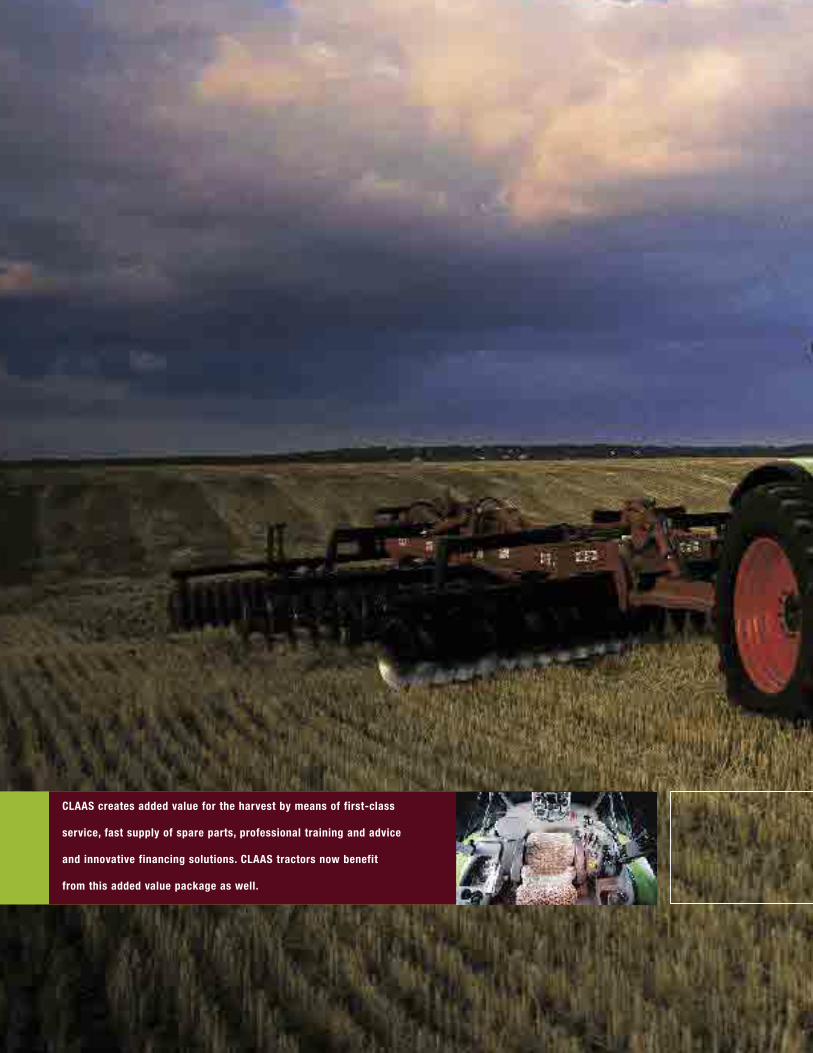
CLAAS creates added value for the harvest by means of first-class
service, fast supply of spare parts, professional training and advice
and innovative financing solutions. CLAAS tractors now benefit
from this added value package as well.
Added Value

LADIES AND GENTLEMEN,
The Supervisory Board of CLAAS KGaA mbH monitored and analyzed the Group’s busi-
ness situation and risk position at its regular meetings during fiscal year 2003. The Board’s
assessments were based on reports by the Executive Board on the Group’s strategic orienta-
tion, the asset, financial and income positions, deviations over the course of business from
the plans made and operating decisions. The reports were received at two sessions and
used as a basis for the decisions made by the Supervisory Board.
The primary focal points of the Supervisory Board’s deliberations comprised the acceptance
of the auditors’ reports and the auditing of the annual accounts of CLAAS KGaA mbH and
the CLAAS Group and plans for the year 2004, including:
Acquisition of a controlling interest in Brötje Automation GmbH
Transacting a private placement in the USA
Acquisition of a controlling interest in RENAULT Agriculture S.A.S. and integration
into the CLAAS Group
Russia production project
CLAAS Group product development
Reorganisation of the plant structure at CLAAS Selbstfahrende Erntemaschinen GmbH
including corporate colours
Tractor branding and distribution structure
Implementation of a cost reduction, synergy and efficiency programme including
optimising Sales and Service
The Supervisory Board was elected in rotation by the ordinary general meeting in January
2001 for a further statutory term of office. Its composition remains unchanged from last
year, with the exception that Mr Siegfried Vieth has now joined the Supervisory Board follow-
ing the retirement of Mr Heinrich Jakobi.
14 15REPORT OF THE SUPERVISORY BOARD
The financial statements of CLAAS KGaA mbH and the consolidated financial statements
of the CLAAS Group as at September 30, 2003 as well as the management reports for CLAAS
KGaA mbH and the Group were audited by Deloitte & Touche GmbH, Düsseldorf, the audi-
tors elected by the general meeting on January 27, 2003 and appointed by the Supervisory
Board. The statements and reports received a full audit opinion on December 8, 2003,
resp. on December 9, 2003.
The financial statements of CLAAS KGaA, the consolidated financial statements and man-
agement reports as well as the proposal for the appropriation of profit were presented to
the Supervisory Board upon completion. These documents as well as the auditors’ reports
were available to the members of the Supervisory Board and were discussed in detail at
the Supervisory Board meeting on January 12, 2004 in the presence of the auditor.
Thereupon the Supervisory Board passed the following resolution:
Following an audit of its own, the Supervisory Board agrees with the audit findings. The
final result of the audit by the auditor did not give rise to any objections. The Supervisory
Board therefore approves the consolidated financial statements. It recommends to the
shareholders that the annual financial statements of CLAAS KGaA mbH be adopted as
they stand and agrees with the proposal for appropriation of profits made by the Executive
Board of the personally liable partner.
The Supervisory Board would like to thank the Executive Board and all the employees for
their commitment during the past fiscal year. The integration of RENAULT Agriculture,
which was largely effected within a very short time, constitutes one of the most important
tasks for the new business year. The main focus of our endeavours must now be on creating
improved cost structures, using synergies and consistently increasing profits.
Harsewinkel, January 12, 2004
The Supervisory Board
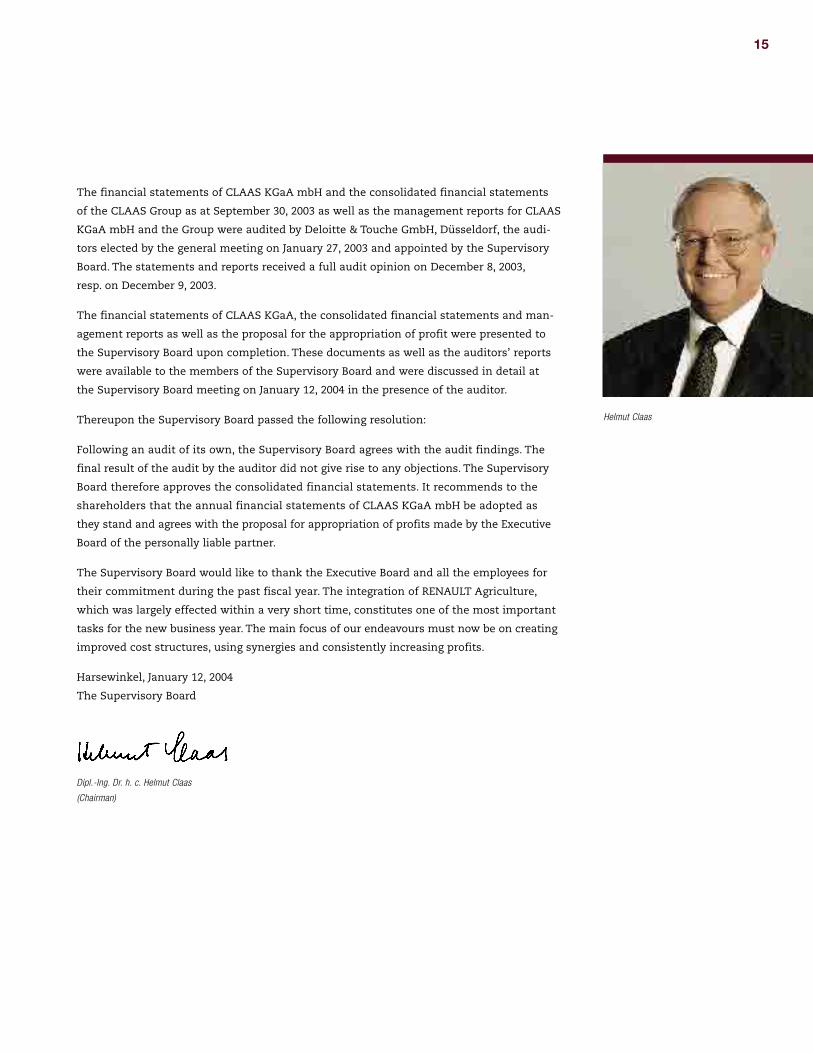
Dipl.-Ing. Dr. h. c. Helmut Claas
(Chairman)
Helmut Claas
14 15
LADIES AND GENTLEMEN,
This has been an unusually eventful year for CLAAS. We
have made some significant acquisitions, pushed ahead
with internationalisation on all fronts and continued our
innovation offensive. At the same time, we have had to
cushion the impact of turbulence in the markets. We have
remained consistent in change and in growth and have
held on to one of the strengths that characterise us as a
family business: »Togetherness«. This is our message to
customers, suppliers, investors and partners, as we work
together on the solutions for the future, and to our employ-
ees, whom we encourage to share the same aims. The
world of agricultural engineering centres on Harsewinkel,
in Westphalia. We see CLAAS as an integrating group, a
framework for people to meet and talk to one another,
where solutions are worked out with partners that allow us
to grow and prosper together. During the year under review
we ventured into a new dimension that brings its own
challenges. Facing those challenges requires strong part-
nerships in all areas and at all levels.
2003 was a year of many facets. It was packed with dyna-
mism and drama – a year of further strategic development
for us. The takeover of Brötje Automation, the world tech-
nology and market leader in connection and assembly sys-
tems for the aircraft industry, has reinforced our Engineer-
ing for Production division and given fresh impetus to the
possible transfer of technology.
Another milestone in the history of the firm was the acqui-
sition of a controlling interest in the French tractor manu-
facturer, RENAULT Agriculture. This partnership opens a
new chapter in the consolidation process within the global
agricultural engineering industry. The two companies com-
plement each other beautifully, as their product lines mesh
perfectly. The expanded product range makes us even
more attractive to our dealer network and our customers.
We have thus decisively strengthened our base in the two
key markets of Germany and France, which together repre-
sent around 40% of the European agricultural engineering
market, and created a platform for further growth. Together
with RENAULT Agriculture, CLAAS will be playing in a differ-
ent league in future. Our sales will expand by almost 50%.
Including the 2,000 or so new employees from RENAULT
Agriculture, nearly half the Claas workforce now operates
outside Germany. However, the joining up of the two firms
means more than simply the sum of their markets, people
and machines. Our foremost management task is to fuse
the strengths of both corporate cultures and take the enlarg-
ed CLAAS Group forward together into a new dimension.
Both the takeover of Brötje and the partnership with
RENAULT Agriculture blend seamlessly into our strategy
of global orientation. This has been further reinforced by
setting up our own production facilities in North America,
India and soon in Russia as well.
Along with the bright spots, 2003 also had its darker side.
Whereas operations continued on a positive trend for the
first half of the year under review, in the second half the
markets proved more than sticky. Our continuing growth
this year has been due to acquisitions alone. The integra-
tion of Brötje und RENAULT Agriculture increased our sales
by 18% to € 1.5 billion. We have not reached our ambitious
profit targets. We can not be satisfied with the pre-tax profit
at € 22.6 million.
A number of factors have brought about this trend. Firstly,
the strategic further development of CLAAS involved costs
designed to secure the long-term commercial success of
CLAAS. Secondly, during the year the market trend turned
against the agricultural engineering industry. The exception-
ally severe summer in Europe led to drastic crop failures in
some places, creating a climate of uncertainty among farm-
ers with regard to investment decisions. This uncertainty
was further fuelled in the European markets which we
dominate, in both the present EU states and the accession
16 17PREFACE

countries, by the reform of European agricultural policy.
Although we succeeded in further growing our market
share on weakening markets, sales were perceptibly down
in absolute terms. A resumption of business activity in
South America was not sufficient to balance the equation,
as our operations there are still in the early stages.
Plummeting sales of harvest machinery were only partly
offset by rapid adjustments on the production side, leading
to increased year-end inventories representing a mortgage
on the new fiscal year. The scheduled efficiency improve-
ments at the totally revamped Harsewinkel plant could
be only partially implemented, however they will be fully
effective in 2004. Although the cost-cutting measures and
adaptations introduced early on were quick to take effect,
they could not wholly make up for the slimmer margins
due to falling sales and the internal charges.
So are the days of profitable growth in agricultural engineer-
ing over? We think not. Cyclical fluctuations are typical of
our industry. We are used to dealing with them. There is no
reason to be deflected from our ambitious long-term goals.
The present weakness of the market is only an additional
spur to us. We are holding to our growth strategy based on
a steady, appropriate increase in value. Growth, profitability
and an international outlook are the pillars on which our
independence and strengths are founded.
We are well prepared to hold our own in the markets, even
in a new dimension. Our high-tech products make us the
technology and benefit leaders, while our service creates
added value for our customers. We have put value-oriented
control systems in place and we operate financial reporting
methods that meet international standards. We were one of
the first German firms to issue bonds to a value of 200 mil-
lion dollars via a traditional private placement in the USA,
the world’s toughest capital market. Along with our own
production facility and our own sales organisation in that
major combine harvester market, CLAAS thus also has a
new financial pillar. CLAAS lives on a strong, loyal, creative
workforce. In the CLAAS family we have an investor that
identifies with the firm and the people who make it work.
Simply maintaining the status quo is not enough, though.
We need to continue to grow in every area, make our activi-
ties even more international and be even more deliberate
in positioning the Group as a global player. In the medium
term we aim to become a leader within all the main
markets. The markets of Central and Eastern Europe are
increasingly coming into our area of focus. Our production
sites in Russia and India give us an entry to the growth
markets of tomorrow. In the USA, we are gearing our high-
performance combine harvesters to the local market.
We are striding confidently into the future with a quality
and innovation offensive. At Agritechnica we showcased a
number of new and enhanced products. Most importantly,
though, we have launched a new tractor line in CLAAS col-
ours into the market. This represents a significant pillar
for further growth.
Rüdiger A. Günther
16 17

DR.-ING. HERMANN GARBERS
RESEARCH AND DEVELOPMENT/
INFORMATION-TECHNOLOGY
Born 1951, held research and teaching posts at
Braunschweig Technical University (Agricultural
Machinery Institute), Development Manager for
combine harvesters, self-propelled forage harvesters
and tractors, Executive Vice President at CLAAS
since 1999.
NIKOLAUS FEIL
PRODUCTION
Born 1944, Engineering graduate, Factory Manager
at an automotive group’s central plant, developed
an automotive plant in South America, in charge of
Production at all CLAAS factories, Executive Vice
President at CLAAS since 2000.
LOTHAR KRISZUN
SALES/SERVICES
Born 1952, Business administration graduate.
He has held various positions in the CLAAS group
since 1981, including Head of the Business
Administration division, Commercial Manager of
Westfälische Werke, Managing Director of CLAAS
Fertigungstechnik, and most recently spokesman
of the management board of CSE. Executive Vice
President of the CLAAS Group since October 2002.
The past year makes it very clear that we dare not rest on
our laurels. For one thing, entering a new dimension takes
a lot of hard work and energy. Our main task will be to fur-
ther integrate RENAULT Agriculture into the CLAAS Group.
In addition, our aim is to reduce our costs further and to
make our cost structure even more flexible so that, despite
the sales fluctuations that characterise our sector, we are
still able to keep jobs secure when times are difficult and
create new ones when times are better.
The 2004 fiscal year will not be any easier than the past
year. We are not expecting any substantial growth stimuli in
our core markets, and developing our operations in foreign
growth markets takes time. The higher inventories of fin-
ished products at our factories and at our dealers’ will hold
down sales. Our aim is to continue growing. We will consist-
ently carry on with the work we have begun, in order to put
the long-term success of the Group on a secure footing. We
will continue to invest in further expanding our produc-
tion network in 2004 and in the integration of RENAULT
Agriculture. Already this fiscal year we will consistently
improve our results. Together we shall achieve that ambi-
tious aim.
»Together« involves all our stakeholders. Working together
with customers, growing together with partners, getting
together with investors, belonging together with our emplo-
yees, thinking together with society. All of them play their
part in our corporate mandate of bringing people, technolo-
gy and organisations together. Our thanks are due to every-
one involved for their contribution. We would like to thank
our employees for their commitment and loyalty, our cus-
tomers, dealers and importers, suppliers and business asso-
ciates for their confidence in us. Our thanks go also to the
shareholders and their committees, for their constructive
support to us in our endeavours.
Rüdiger A. Günther, Executive President
18 19PREFACE / MANAGEMENT

GUY POVIE
TRACTORS
Born 1949, Business Administration graduate,
Technical High School graduate. He has held
various positions in the RENAULT group since
1969 – e.g. as Project Manager for Logistics and
Quality and as CEO of a Renault-Peugeot-Citroën
joint venture. More recently he was Executive
President of RENAULT Agriculture. In May 2003
he became Executive Vice President at CLAAS.
WERNER SCHNEIDER
HUMAN RESOURCES
Born 1949, Economics graduate. He has held
various positions in human resources management
in international corporations in the metal, retail
and logistics industries. Most recently he was
the Director of Corporate Human Resources at an
international logistics company in The Netherlands,
Executive Vice President at CLAAS since June 2002.
RÜDIGER A. GÜNTHER
EXECUTIVE PRESIDENT
BOARDFINANCE AND CONTROLLING/
MERGERS & ACQUISITIONS
Born 1958, Business graduate, international
career with an US investment bank, Finance
Manager of one of the world´s leading trading
groups. Director of Finance/Controlling at CLAAS
since 1993, Executive Vice President since 1997,
Executive President board since 2002.
CLAAS Management
18 19

CLAAS regards itself as
a systems supplier covering
the whole process chain.
20 21MARKET & PRODUCTS / CLAAS & CUSTOMERS

CHANGE SHAPED BY FOUR TRENDS
Change as the only constant – this has been the challenge
facing agriculture from the beginning of time. Today’s agri-
cultural industry is characterised by globalisation, concen-
tration, increasing mechanisation and working by systems,
along with growing use of information technology. The
internationalisation trend began some time ago. Modern
agricultural engineering is a global business. It is not pos-
sible to penetrate foreign markets by exporting alone. Glo-
bal operators’ sales strategies need to include a local share
of production, component manufacturing and service.
Globalisation means thinking globally and acting locally.
The global orientation of agricultural engineering goes hand
in hand with a major wave of concentration. The consoli-
dation process is already well established in agricultural
engineering. Today’s global players are confined to a small
number of firms. International agricultural engineering is
an open book. Rounding off the range of offerings, in terms
of either products or geographical coverage, is still a key
strategic choice in a competitive environment.
HIGH-TECH ON THE FARM
As a result of the increasing demands made on agriculture,
mechanisation is forging ahead, accelerating the shift from
the traditional farmer’s single-machine approach to a sys-
tems approach. The breathtaking advances in electronics
and information technology have opened up new dimen-
sions for agricultural engineering. Integration of electronics
is making modern agricultural engineering even more effi-
cient. Precision farming is the key to the agriculture of the
future. Precision farming means recording yield and produc-
tion data in electronic form and using that information in
a closed precision farming circuit with computer-assisted
work together CLAAS & Customers
MARKET & PRODUCTS
Trends in agricultural engineering
Product line expanded
Proven ability to innovate
Working alongside the customer
20 21

equipment to fine-tune sowing, fertilizing and pesticide
application. The aim is more efficient, more sustainable
utilisation of a field’s yield potential.
These trends are driving the growth in efficient, high-quality
agricultural machinery. Demand from professional groups
of big agricultural contractors is rising. Use of machines on
more than one farm and the structural increase in individu-
al farm sizes are boosting demand for large machines. These
now account for two-thirds of the West European market.
CLAAS – AT HOME ON ALL THE WORLD’S FIELDS
Our customers are spread throughout the world, and this is
reflected in our product range and service. We develop and
build machines to process a wide variety of crops efficiently,
in all sorts of climate zones. We see ourselves as a system
supplier covering the whole process chain in harvesting
technology. Intermeshing machine systems form a balanced
chain, in which none of the links snap, but at the same time
none of the links are over-sized and thus uneconomic. We
want to supply our customers, whatever size of farm they
have, with the best machine concept for their purposes.
Our core products are combine harvesters and self-pro-
pelled forage harvesters. One combine harvester in three
sold in Europe is a CLAAS. In February of this year, combine
harvester no. 400,000 came off the production lines at Harse-
winkel. We sell one in every two self-propelled forage har-
vesters in the world market. Our range of green harvest
machinery and balers encapsulates acknowledged expertise
in the »green line« sector. Our line includes modern system,
transport and commercial vehicles for agricultural use as
well as agricultural information technology. We are a system
supplier in the drive technology and hydraulics markets, not
only to the CLAAS Group but also to external customers.The
acquisition of Brötje Automation has significantly strength-
ened our engineering for production growth segment.
The partnership with RENAULT Agriculture has opened up
a new dimension for us. By taking over the French tractor
manufacturer, we have added an important key product to
our range. We have not previously been known on the mar-
ket as a tractor manufacturer. Now we can offer a full trac-
tor line from 50 hp to 335 hp. The new product line covers
all user segments and makes us a potential supplier to con-
tractors and commercial farmers as well as grassland farm-
ers and wine growers. The first tractors in CLAAS green with
red wheels made their appearance in the fields in October
2003. This colour is a sign that CLAAS tractors are a high-
quality, reliable product and that we are behind the CLAAS
tractor.
CLAAS has launched three tractor families in various power
classes. The standard tractor is the CELTIS, designed for
mixed and grassland farming. The ARES series is the premi-
um tractor product, while the ATLES models, powered above
220 hp, are ideal for agricultural contractors and big farms.
The range of smaller narrow-track tractors for wine and
fruit growing comprises the Dionis, Fructus and Pales series.
In accordance with our principle of building on the respec-
tive companies’ strengths and brands, the smaller tractor
22 23MARKET & PRODUCTS / CLAAS & CUSTOMERS
series and special tractors that are well established in their
markets will initially enter the CLAAS product line under
the proven RENAULT Agriculture brand name. The result
for the customer is a modern, attractive tractor range with
service and parts for both CLAAS and RENAULT Agriculture
machines provided by the service network and its support
centres at Hamm-Uentrop and Le Mans.
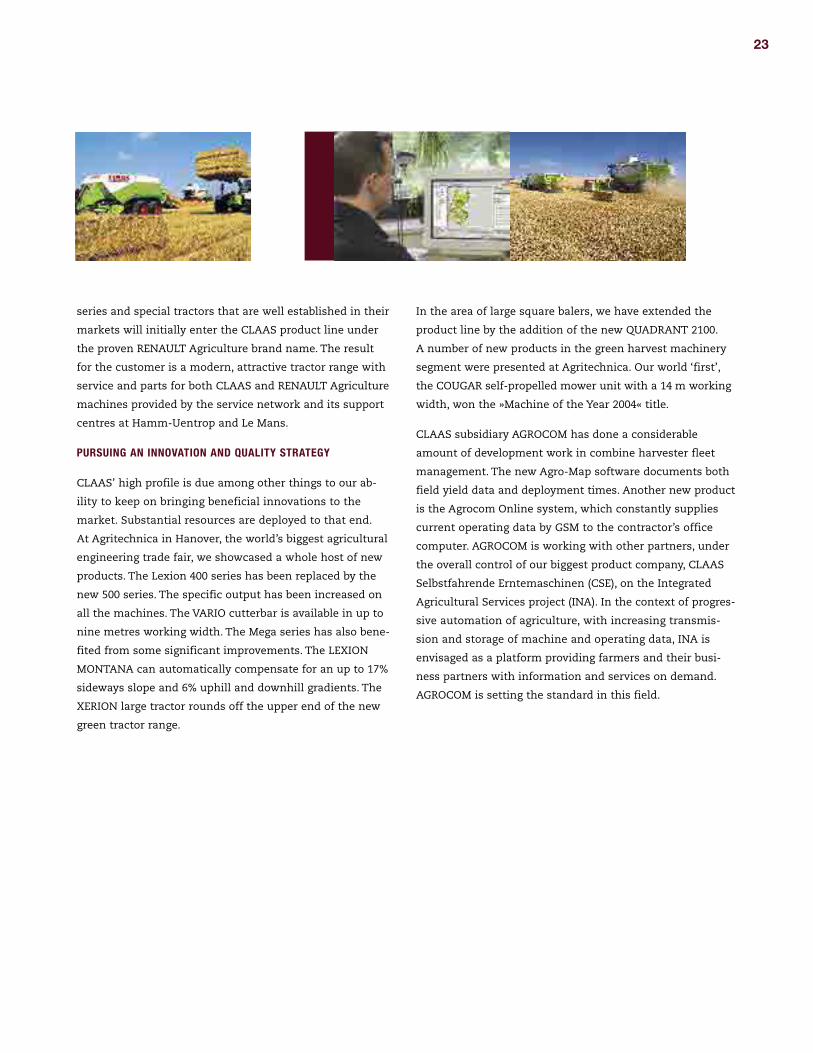
PURSUING AN INNOVATION AND QUALITY STRATEGY
CLAAS’ high profile is due among other things to our ab-
ility to keep on bringing beneficial innovations to the
market. Substantial resources are deployed to that end.
At Agritechnica in Hanover, the world’s biggest agricultural
engineering trade fair, we showcased a whole host of new
products. The Lexion 400 series has been replaced by the
new 500 series. The specific output has been increased on
all the machines. The VARIO cutterbar is available in up to
nine metres working width. The Mega series has also bene-
fited from some significant improvements. The LEXION
MONTANA can automatically compensate for an up to 17%
sideways slope and 6% uphill and downhill gradients. The
XERION large tractor rounds off the upper end of the new
green tractor range.
In the area of large square balers, we have extended the
product line by the addition of the new QUADRANT 2100.
A number of new products in the green harvest machinery
segment were presented at Agritechnica. Our world ‘first’,
the COUGAR self-propelled mower unit with a 14 m working
width, won the »Machine of the Year 2004« title.
CLAAS subsidiary AGROCOM has done a considerable
amount of development work in combine harvester fleet
management. The new Agro-Map software documents both
field yield data and deployment times. Another new product
is the Agrocom Online system, which constantly supplies
current operating data by GSM to the contractor’s office
computer. AGROCOM is working with other partners, under
the overall control of our biggest product company, CLAAS
Selbstfahrende Erntemaschinen (CSE), on the Integrated
Agricultural Services project (INA). In the context of progres-
sive automation of agriculture, with increasing transmis-
sion and storage of machine and operating data, INA is
envisaged as a platform providing farmers and their busi-
ness partners with information and services on demand.
AGROCOM is setting the standard in this field.
22 23

MOVEMENT IN THE MARKET ENVIRONMENT
Trends in the markets CLAAS supplies have varied dur-
ing the year under review. In Western Europe, CLAAS’
home market, combine harvester sales dropped by about
10%. Against this background we were able to develop our
market leadership and further improve our market share.
Following last year’s disastrous floods, the severe winter and
long summer drought, many farmers have put investments
on hold. This also applies to a great extent to Germany. The
German combine harvester market has slumped by 22%.
We have firmly consolidated our position in a sagging mar-
ket and now supply one out of every two combine harvest-
ers sold in Germany. The markets of Central and Eastern
Europe, where CLAAS is well positioned, have been thrown
Agricultural machinery of the superlatives:
at the »World CLAAS Forum« in Chantilly,
to the north of Paris, 15,000 visitors from
all over the world have experienced a
varied programme including agricultural
machines, a vaudeville show and infor-
mative film sequences.
24 25MARKET & PRODUCTS / CLAAS & CUSTOMERS
into temporary uncertainty by poor harvests, but continue
to hold great growth potential. Another ten countries are
due to join the EU next year. For farmers in the present EU,
enlargement creates uncertainty about their future income.
The same is true of the accession countries, where a wait-
and-see attitude prevails as the EU administrative systems
have not yet been introduced in recognizable form.
The dynamic, big combine harvester markets are currently
South America and Australia. In North America too, there
are signs of a low-level revival of business. Overall, develop-
ments on these markets have slightly overcompensated for
the losses in Europe, taking the world combine harvester
market up to just above 25,000 units.
The world self-propelled forage harvester market showed
a slight drop. We are the undisputed forage harvester world
market leader. In the baler segment, we have an approxima-
tely one sixth of the world market share. The world market
for large square and round balers has followed a positive
trend. Business in round balers was lively in Europe gene-
rally and in Germany. Against this background we were able
to increase our market share. The European tractor market
proved slightly recessive, with two main trends. Whereas
volume at the premium end showed a decline, the market
for small tractors grew. RENAULT Agriculture tractors main-
tained their strong market position in France in particular.
RESPONSIBILITY TO CUSTOMERS
Our strengths derive from a corporate culture which is
oriented to the customer. Our customer focus is apparent
above all in our ability to innovate plus the quality of our
service, which is acknowledged all over the world. Our cus-
tomers are engaged in a demanding business. Working the
land is a long chain of operations that mesh together like
cogs. The soil type, vegetation, wind and weather constantly
pose fresh challenges for our customers.
To overcome these hurdles, we want to be a first-class
partner to our customers, with products and services to
match. Our customer care is comprehensive, our service
and parts distribution covers all areas and at the same
time we can offer innovative financing solutions. We are
in touch with our customers everywhere and we listen to
them. In the autumn of 2002, we hosted the World CLAAS
Forum in France, which was attended by 15,000 guests from
all around the world. We exhibit at all the major trade fairs
and we also hold dealer seminars to strengthen the links
between our authorised dealers and the CLAAS organisation.
EFFICIENT AFTER-SALES ORGANISATION
The success of our growth strategy has always depended
on high-quality service and fast supply of the appropriate
spare parts. Our state-of-the-art logistics centre at Hamm-
Uentrop has demonstrated its efficiency in supplying agri-
cultural engineering around the world during three harvest
seasons. After-sales service is one of the key decision cri-
teria when purchasing agricultural machinery. We regard
it as a matter of course to support our customers in every
respect after the sale.
24 25

As an independent
family business
CLAAS values strong
partnerships and
works together with
partners on future-
oriented solutions.
26 27STATUS QUO & STRATEGY / CLAAS & PARTNERS
grow together CLAAS & Partners
STATUS QUO & STRATEGY
The global view
CLAAS Fertigungstechnik on the advance
A strong team – CLAAS and RENAULT Agriculture
Towards a worldwide production network
Treasury – our house bank
Strategies derive from visions. Our vision is to supply inter-
national agriculture with machines, systems and accom-
panying services that set standards in terms of quality
and technical performance. We are thus assuming part
of society’s responsibility for feeding the human race
adequately in future.
As opposed to our big competitors, who are without excep-
tion international public corporations, we, as a European
agricultural engineering firm, are a family business. We will
only be able to hold our ground against the competition in
our traditional and our newer markets if we continue to
grow consistently and profitably. Growth is the key compo-
nent of our strategy. There are opportunities for growth eve-
rywhere. The forces driving our industry are still the same:
an expanding world population and rising standards of liv-
ing are pushing up demand for more food and higher quali-
ty food. At the same time, land is a limited resource. High-
tech is the answer to draw higher yields from a define area.
Western Europe remains pivotal for our strategy. Most of
our sales are realized in the EU. Other regions of Europe
are increasingly coming into our focal area. Central and
Eastern Europe in our view offer excellent opportunities for
expansion. These regions are advancing along with Western
Europe to form our future home market. In the medium
term, these markets can become as significant as those of
Western Europe and North America. Demand for modern
agricultural machinery is huge and is set to grow further
as a result of EU enlargement. The CIS in particular has a
lot of ground to make up. As well as the Ukraine, Russia is a
high priority target region from a strategic point of view. The
arable land area is greater than the whole of the EU. Of the
150,000 or so combine harvesters currently in use, around
90% are machines over five years old that in many cases are
not up to the requirements of modern farming. Estimates
are that Russia has only half of the machine capacity need-
ed for sowing and harvesting.
26 27

We have spent the last few years setting up a network of
dealers and marketing outlets in the CIS. We are the lead-
ers among combine harvester manufacturers with Western
technology in Russia. Around 3,000 self-propelled forage
harvesters are now in operation there. However, in order
to further open up this market we will need to build
machines locally. Within the framework of our global pro-
duction network we will start by investing € 20 million
over the next few years in a new combine harvester plant
in Krasnodar. The region is known as the bread basket of
Russia. CLAAS will thus be the first Western agricultural
engineering manufacturer to have its own manufacturing
facility in Russia. The production project is emissioning
on main components being made at plants in the Russian
Federation for assembly at the Krasnodar production site.
We also have our sights on the big markets of South Ame-
rica and Asia. The Food and Agricultural Organisation of
the United Nations (FAO) estimates are for South America
to register the steepest growth in cereal production, after
Eastern Europe. This area is currently the world’s most
expanding market. While we have a base in Argentina,
CLAAS’ market position in South America as a whole is
still below average.
Asia offers good prospects for our green harvest machinery
and particularly for the combine harvester developed spe-
cially for rice harvesting. India is the world’s fastest-growing
and most significant agricultural market and is now among
the leaders in rice growing. Further developing our combine
harvester plant in India is therefore strategically important
to us. This will enable us to expand our business in the
emerging sales markets of Asia. Our presence in India will
allow us to cover such markets as China, Taiwan, Korea and
Malaysia considerably more effectively.
North America remains a challenge for us. The big mar-
kets of the USA and Canada are stable and profitable. The
additional subsidies of the US Farm bill which the USA
is to pay its farmers by 2007 ought to generate increased
investment in agricultural engineering. Local manufacture
of our LEXION combine harvesters in the USA is only the
beginning. The competition is strong and the only route to
growth is predatory competition.
CLAAS enters the growing
Eastern European markets and
invests in a new combine
harvester plant in Krasnodar,
Russia. The foundation
ceremony was held in 2003.
28 29STATUS QUO & STRATEGY / CLAAS & PARTNERS

NEW ACTIVITIES IN RELATED AREAS
Agricultural engineering continues to be our core business.
Internal growth is the motor of our expansion. Nevertheless,
we seize opportunities presented within the industry. The
year under review has been punctuated by acquisitions
and investments that represent an important foundation
on which to secure the success of the CLAAS Group in the
long term.
Towards the end of last year CLAAS Fertigungstechnik (CFT)
acquired a controlling interest in Brötje Automation GmbH
from the British Baxi Group Ltd. Brötje is the technology
leader in connection and assembly systems for the aircraft
industry. Together with this world market leader in assem-
bly cells for aircraft bodies and wing parts, CFT contributed
approximately 9% to Group sales in 2003. The history of CFT
is a success story in terms of using existing plant engineer-
ing and construction know-how to move into and expand
related operating areas. Originally a factory making manu-
facturing equipment for agricultural machinery, CFT has
evolved into a high-tech supplier of complex transfer and
production lines for the automotive industry and robot-
controlled assembly lines for aircraft manufacturing.
CLAAS AND RENAULT AGRICULTURE – A STRONG TEAM
In acquiring a majority stake in RENAULT Agriculture we
have exercised the strategic option of adding tractors to our
product line. The dwindling number of independent tractor
manufacturers prompted us to take an offensive approach.
This strong new alliance between CLAAS and RENAULT
Agriculture has enriched the world agricultural machinery
market. RENAULT Agriculture is an ideal partner for us. The
two product lines mesh beautifully: CLAAS, the harvest
machinery specialist with sales of around € 1.3 billion and
RENAULT Agriculture, the quality tractor manufacturer with
annual sales of over € 600 million. The figures for the year
under review include sales since May 2003. Joining forces
with RENAULT Agriculture gives the strong CLAAS brand
a new dimension.
We shall also be investing significantly in technology and
quality in this area in the next few years. The factors for
success such as innovation in agricultural engineering,
reliability and first-class service and parts availability must
also apply fully to CLAAS tractors. Market prospects are
28 29

good. RENAULT Agriculture is the market leader in France,
though underrepresented elsewhere in Europe. With the
help of the CLAAS distribution and service network, which
is well developed throughout Europe, new growth oppor-
tunities are created. Together with our distributors we are
working out country-specific solutions that will enable us to
supply customers in the different sales markets with indi-
vidual machine ranges tailored to their particular commer-
cial structures. Our distributors are poised to do this, with
a competitive line of tractors, harvest machinery and other
products that fit in well at various points of the chain.
TOWARDS A WORLDWIDE PRODUCTION NETWORK
Cutterbars from Hungary, drive systems and hydraulics
from Paderborn, software from Bielefeld and machines from
Harsewinkel – CLAAS takes all these things and builds them
into what are probably the world’s most efficient combine
harvesters. When those combine harvesters come together
with forage harvesters from Harsewinkel, balers from Metz,
green harvest machinery from Bad Saulgau and tractors
from Le Mans, the result is the product range of the world’s
fourth largest agricultural engineering manufacturer. The
small Harsewinkel site is big enough to gather the threads
from all over the world. Facilities in France, Hungary, Italy,
Spain, the United Kingdom, Russia, the USA, Argentina and
India all come together under the umbrella of the holding
company.
That international spread shows how far we have come in
the transition from being purely an exporter to becoming a
global player. Our expertise on world markets is no longer
founded solely on first-class regional distribution and serv-
ice organisations, selling machines imported from our com-
pany factories. Global expertise means creating maximum
benefit for our customers in terms of function and econom-
ic efficiency. It also stems from our willingness to create
local added value in the respective markets. We will only
reap lasting success in our markets of the future, such as
Russia and Ukraine, if we build local added value into our
strategy. We are gradually expanding our dense network of
production sites supplying not only complete machines but
also components and assemblies to be turned into finished
products at local production facilities around the world.
To implement this global growth and product strategy, an
unprecedented investment offensive has been under way
for the last few years. We have turned the main factory at
Harsewinkel into the hub of the network. This state-of-
the-art plant has production lines for combine harvesters
and forage harvesters, components and assemblies. Similar
restructuring, on a smaller scale, has taken place at our
Bad Saulgau and Metz factories. The component plant in
Hungary has been extended and a new logistics centre
opened at Hamm-Uentrop. Expansion of our production
network and optimisation of our manufacturing systems
give us greater flexibility as well as pooling our expertise,
and thus higher quality coupled with efficiency.
CLAAS feels at home in
all fields around the world.
30 31STATUS QUO & STRATEGY / CLAAS & PARTNERS

Further components of this selective investment offen-
sive include acquisitions in the USA and India. LEXION
machines tailored to the requirements of US farmers are
now built under our direct control in Nebraska, USA. CLAAS
has also taken charge of combine harvester production in
India. The rubber-tracked CROP TIGER machines have been
developed specially for local growing and harvesting con-
ditions on wet soils in rice-growing areas.
FINANCING AS A SUCCESS FACTOR
Another key component of our strategy is corporate financ-
ing. CLAAS leaves no avenues unexplored here. The Finance
Division is organized like a house bank, which plays a cen-
tral role within the Group by acting as a liquidity buffer and
investment source for the various units. Group companies
or divisions that have made a surplus or that need funds
turn to the holding company. The house bank has to be in a
position to offer competitive terms. Another central Group
function is risk management. Our control system is by no
means confined to simple cash management. By controlling
Group risks centrally, we can offset one against another if
necessary and thus limit the total exposure. In this way we
avoid situations where subsidiaries in different countries
assume individual risks that are reasonable for them but in
sum are too great for the Group. Central currency, interest
rate and credit risk management makes for a balanced risk
structure.
Our financing solutions are designed not just for our sub-
sidiaries but above all for our customers. To this end we
have formed a joint venture with BNP Paribas that allows
us to carry out banking transactions in all the countries of
the European Union. Customers can choose between hire
purchase, leasing or conventional credit financing when
purchasing our products. The joint venture with Paribas,
under the name of CLAAS Financial Services, Paris, affords
us two main advantages. Firstly, we can offer our customers
one-stop shopping and secondly, we have the benefit of the
bank’s credit rating and handling experience. Flexible, non-
conventional sales financing schemes have been devised
primarily for newly developing and transformation coun-
tries, to support our sales in growth regions like Central and
Eastern Europe while eliminating significant financing risks.
30 31
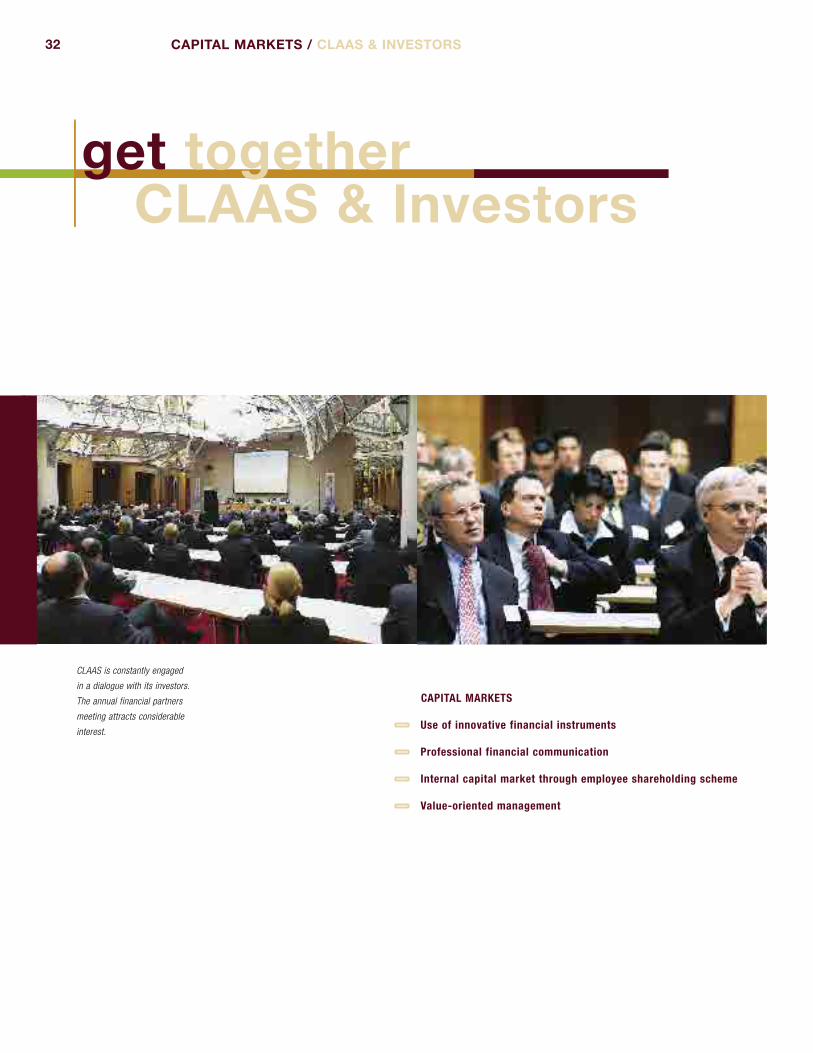
CLAAS is constantly engaged
in a dialogue with its investors.
The annual financial partners
meeting attracts considerable
interest.
get together CLAAS & Investors
CAPITAL MARKETS
Use of innovative financial instruments
Professional financial communication
Internal capital market through employee shareholding scheme
Value-oriented management
32 33CAPITAL MARKETS / CLAAS & INVESTORS

CLAAS has been setting standards in corporate financing
for years. As a mid-sized family business, we have long been
geared to the requirements of the capital markets. We were
quick to foresee the change in German bank financing and
to adapt the Group accordingly to diversified sources of
funding. The capital market environment is currently beset
by considerable uncertainties. Essential business finance
issues are presently the subject of public discussion and
answers will need to be found soon. These include ques-
tions about the future structure of both the German and the
international banking, internationally comparable methods
to gauge credit quality, the significance of the valuation
systems used by external rating agencies or, indeed, the
influence of new international accounting standards on
corporate finance decisions. On top of that, the economical
and political context remains difficult. In such a situation,
rapidly changing investor sentiments and highly volatile
interest rate and exchange rate movements are only a logi-
cal consequence. Given the present capital market environ-
ment, our objectives of differentiating and internationalis-
ing our financing profile and extending the duration of
liabilities are proving to be the correct course.
We continue to take advantage of a wide array of financ-
ing options which were given in the market. A case in point
was the US private placement in December 2002. American
insurance companies, who require an in-depth credit qual-
ity assessment, were the principal subscribers to these
securities. Notes amounting to US-$ 200 million were suc-
cessfully placed with a term of 12 years, a maturity exceed-
ing by far the normal terms available in Europe at the time
of issue. The US private placement improves our long-term
capital structure, broadens our investor base and underpins
our growth strategy at the same time.
32 33
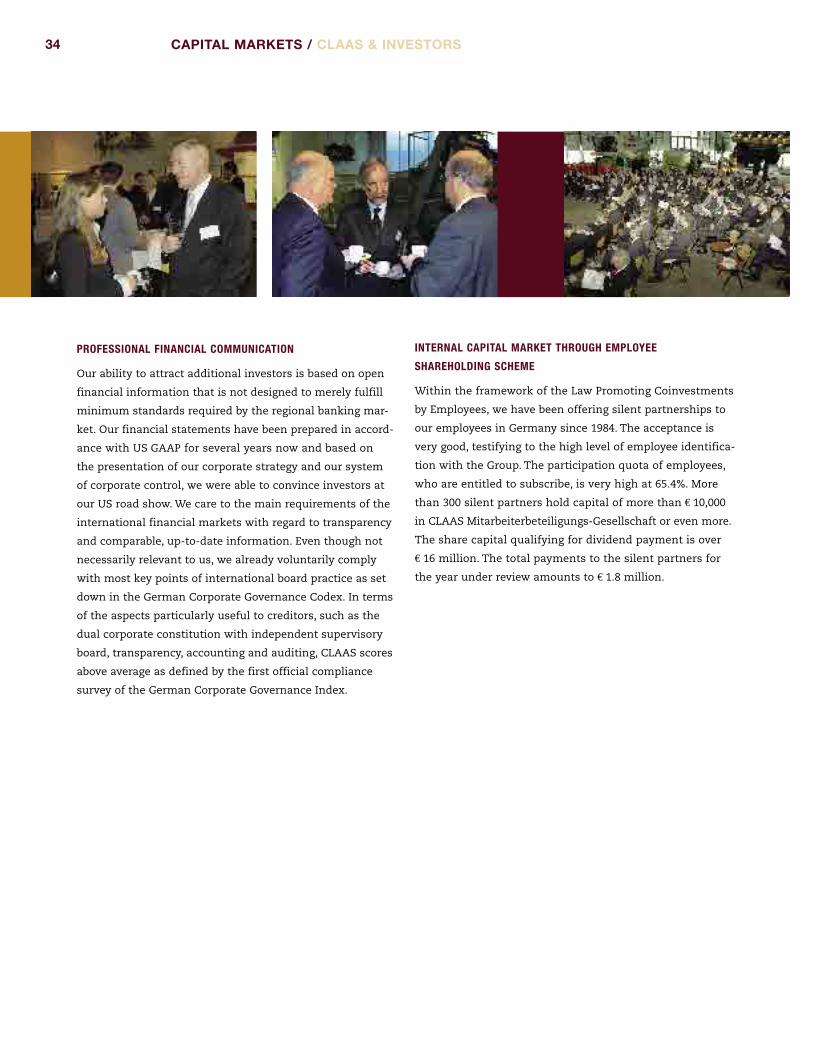
PROFESSIONAL FINANCIAL COMMUNICATION
Our ability to attract additional investors is based on open
financial information that is not designed to merely fulfill
minimum standards required by the regional banking mar-
ket. Our financial statements have been prepared in accord-
ance with US GAAP for several years now and based on
the presentation of our corporate strategy and our system
of corporate control, we were able to convince investors at
our US road show. We care to the main requirements of the
international financial markets with regard to transparency
and comparable, up-to-date information. Even though not
necessarily relevant to us, we already voluntarily comply
with most key points of international board practice as set
down in the German Corporate Governance Codex. In terms
of the aspects particularly useful to creditors, such as the
dual corporate constitution with independent supervisory
board, transparency, accounting and auditing, CLAAS scores
above average as defined by the first official compliance
survey of the German Corporate Governance Index.
INTERNAL CAPITAL MARKET THROUGH EMPLOYEE
SHAREHOLDING SCHEME
Within the framework of the Law Promoting Coinvestments
by Employees, we have been offering silent partnerships to
our employees in Germany since 1984. The acceptance is
very good, testifying to the high level of employee identifica-
tion with the Group. The participation quota of employees,
who are entitled to subscribe, is very high at 65.4%. More
than 300 silent partners hold capital of more than € 10,000
in CLAAS Mitarbeiterbeteiligungs-Gesellschaft or even more.
The share capital qualifying for dividend payment is over
€ 16 million. The total payments to the silent partners for
the year under review amounts to € 1.8 million.
34 35CAPITAL MARKETS / CLAAS & INVESTORS
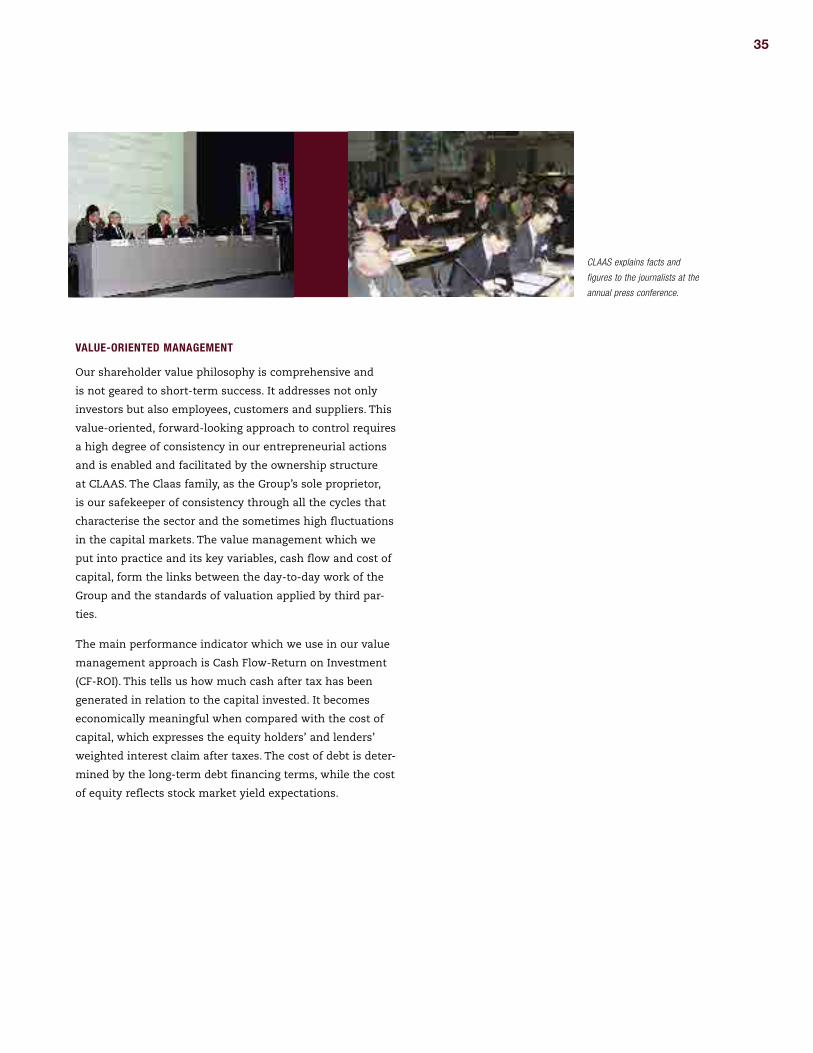
CLAAS explains facts and
figures to the journalists at the
annual press conference.
VALUE-ORIENTED MANAGEMENT
Our shareholder value philosophy is comprehensive and
is not geared to short-term success. It addresses not only
investors but also employees, customers and suppliers. This
value-oriented, forward-looking approach to control requires
a high degree of consistency in our entrepreneurial actions
and is enabled and facilitated by the ownership structure
at CLAAS. The Claas family, as the Group’s sole proprietor,
is our safekeeper of consistency through all the cycles that
characterise the sector and the sometimes high fluctuations
in the capital markets. The value management which we
put into practice and its key variables, cash flow and cost of
capital, form the links between the day-to-day work of the
Group and the standards of valuation applied by third par-
ties.
The main performance indicator which we use in our value
management approach is Cash Flow-Return on Investment
(CF-ROI). This tells us how much cash after tax has been
generated in relation to the capital invested. It becomes
economically meaningful when compared with the cost of
capital, which expresses the equity holders’ and lenders’
weighted interest claim after taxes. The cost of debt is deter-
mined by the long-term debt financing terms, while the cost
of equity reflects stock market yield expectations.
34 35

CLAAS-employees traditionally have
a strong bond with the company.
36 37EMPLOYEES / CLAAS & EMPLOYEES
belong together CLAAS & Employees
EMPLOYEES
Personnel development is top priority
Worldwide recruitment
Cooperative management structure
CLAAS ACADEMY knowledge platform
LEARNING IS A TOP-LEVEL MATTER
CLAAS, a family business, is one of the leading employ-
ers among Germany’s medium-sized companies and one
of the top firms for personnel development. This has been
confirmed by a study recently published in Top-Arbeitgeber
in Deutschland (Top Employers in Germany). CLAAS scored
maximum points in the four areas of employment condi-
tions, social skills, scope for personal development and
future prospects for the business. The panel’s conclusion
was that »CLAAS is a global player with a social face, that
puts employees on the ladder to advancement«.
Here at CLAAS, personnel development is of vital signifi-
cance. Having the best products, the best technology and
the best organisation are of no avail unless the employees
are firmly behind the company in terms of commitment,
skills and willingness to achieve. For that to happen, there
has to be job satisfaction. The Human Resources function
is part of the holding company management.
We have a huge need for qualified, effective skilled workers
and managers. We sell high-tech agricultural machinery all
over the world. To do that, we need innovative, motivated,
well-trained employees. We recruit young people wherever
we operate and train them in-house and in the field for
future employment in their own country. Together in Harse-
winkel and all over the world.
36 37

Cooperation between
colleagues is one of the
strengths of the CLAAS
corporate culture.
We are well aware that an employer who cannot offer
attractive working conditions will not get the people it
needs. Our employees spend a large part of their available
time at work. We make sure that time is not wasted. We
attach importance to personal contact and discussion
between our staff. A workforce is more than the sum of the
individuals; it is a body of colleagues that retains its cohe-
sion even beyond the factory gates. There is a saying within
the Group that everyone at Claas has »green blood in their
veins«. In other words, they identify strongly with the busi-
ness. We get together regularly to celebrate our successes,
talk through our problems and inject new staff with »green
blood«. We recognise and award our employees when they
celebrate significant anniversaries.
We operate flexible working hours models. On the com-
mercial side alone, there are ten different time models in
operation. Salaried employees are on flexitime and man-
agement-level staff work self-regulated hours on a basis of
trust. We have introduced variable pay models to motivate
our employees. In this connection we use the scope offered
over and above the established pay scales. Variable bonus
schemes are linked to the attaining of specific agreed
targets.
MANAGEMENT STRUCTURE BASED ON RESPECT
Our guiding principles are mutual respect, readiness to
accept change, reliability and involvement in decision proc-
esses. The yardstick by which the success of our personnel
policy is measured is customer satisfaction. The principles
of management and co-operation that apply worldwide
shape our corporate culture, which is based on credibility,
loyalty and trust. An honest and full exchange of informa-
tion characterises working relations between managers
and employees.
We don’t mind spending a bit of money on personnel devel-
opment. During the year under review over € 4 million were
invested under this heading, equivalent to 1.2% of total
payroll costs. The training ratio is 6.2% worldwide. At our
German plants, employing around 4,300 people, it is 7.2%
and is thus two to three percentage points higher than the
industry average. During the year under review, we had a
total of 308 young people in training. Meanwhile, 102 young
people completed their training and were all taken on by
the Group. We prepare people for over twenty different com-
mercial and technical careers.
38 39EMPLOYEES / CLAAS & EMPLOYEES

ON THE LADDER TO ADVANCEMENT
CLAAS fills 70% of its junior staff vacancies in-house.
The international trainee programme has been function-
ing as a strategic instrument for the last 16 years. We take
on graduates in a variety of disciplines who spend a year
to 18 months working in each area of the business in turn,
from administration to production to sales. Periods of time
working abroad and in-plant continuing education are an
established part of this programme, as is independence in
organising the training schedule. The posts offered to the
new recruits are not decided until completion of the trainee
programme. The contract of employment is indeterminate
from the outset. A foreman training programme which oper-
ates in parallel prepares employees who have embarked on
a foreman’s or technician’s training to fill supervisory posi-
tions within the Group and to become future foremen. Our
personnel development programme also comprises semi-
nars and courses to build technical, method and social
skills and for language learning and management training.
CLAAS pioneered twin-track studying, which combines
practical training with courses of study at the Stuttgart
Professional Training College and the Paderborn School of
Business Studies. This has proved to be an effective way
of training highly qualified employees with a commitment
to the Group.
CLAAS ACADEMY KNOWLEDGE PLATFORM
Modern agricultural engineering constantly demands new
technical concepts and practical solutions. The development
of high-tech solutions is increasingly based on intelligent
linking of innovative information technologies and sound
practical experience. That requires on-going vocational and
continuing education and training. We have institutional-
ized education and knowledge transfer by setting up the
CLAAS ACADEMY. This is a worldwide training organisation,
open not only to our staff but also to distribution partners.
Through training courses and practical work in the field,
we equip staff from the engineering side with essential
production and service knowledge and support our market-
ing and sales specialists with benefit arguments for our
machine and system product lines. During the year under
review, 3,200 staff from the technical and marketing func-
tions took the opportunity to follow the courses offered
at our training centres in Harsewinkel, Bad Saulgau, Metz,
Kiev and Belgorod in Russia. The CLAAS ACADEMY is now
under a new roof at Harsewinkel, opposite the CLAAS plant.
The premises comprise nine seminar rooms with the latest
media and presentation technology and two workshop com-
plexes for hands-on training on the machines.
38 39

Future challenges
can only be tackled
together. CLAAS faces
up to this task.
40 41CORPORATE RESPONSIBILITY / CLAAS & SOCIETY

CORPORATE RESPONSIBILITY
Soil conservation is vital
CLAAS plays its part
CLAAS Foundation serving society
Constant dialogue with the public
think together CLAAS & Society
COMBINING ECOLOGY AND ECONOMICS
IN AGRICULTURAL ENGINEERING
Feeding the human population with sufficient food that
not only fills people up but is also healthy and of good qual-
ity poses enormous challenges for agriculture. The main
source of the problem is that as the population increases,
the land available for faming is shrinking. CLAAS plays a
key part in responding to this challenge. Our products and
services help create the foundation for the society of tomor-
row. That mission obliges us to make an active commit-
ment to the environment and to be socially responsible. The
contribution expected of us to feeding people adequately in
the future is an essential component of our basic attitude.
We create lasting values by becoming actively involved in
economic and social life. We encourage our employees and
our customers to combine their actions with social and
environmental awareness and we make great efforts to be
a dependable partner to all the groups with whom we come
into contact. Our way of thinking and acting is directed at
the whole process with respect to corporate responsibility.
Agriculture is not possible without fertile, healthy soil. For a
long time, this was not a problem for the world. Increasing
the available land area was not an issue. However, the illu-
sion of the almost limitless capability of the soil to meet our
needs was shattered long ago. The world population explo-
sion, rising standards of living and globalisation of markets
have led to a huge rise in the demand for food. Land has
become a bottleneck. The soil is worked intensively and
has little time to recover.
40 41

Agriculture and the engineering industry supplying it with
technology are expected to do the impossible. On the one
hand, they have to produce the food essential for life, while
on the other hand, they must ensure that the basis of their
work remains intact. Our big agricultural machines and
tractors are an indispensable component of economically
efficient farming. We have spent years developing machines
to meet both economic and environmental demands in
the closed system of soil cultivation. We influence tyre
technology and devise tyres and track systems to distribute
the heavy load over a wide area. Many of our big agricultur-
al machines are fitted with rubber track roller units, which
are very efficient yet at the same time gentle on the ground.
Special machines for tropical and subtropical regions enable
rice and maize to be harvested in a more environmentally
sound way. The growing use of electronics is making agri-
cultural engineering more cost-effective and also more
environmentally sophisticated. Computer-assisted equip-
ment applies data on growing conditions in order to opti-
mise sowing, fertilizing and plant protection. Fertilizer is
only applied where yields are poor, plant protection only
where pests are found to occur.
CLAAS FOUNDATION SERVING SOCIETY
Businesses have a responsibility to society. CLAAS is well
aware of this. We regard actively helping to shape the social
environment as a corporate duty. The CLAAS Foundation,
set up in 1999, plays an important part in this, by contribut-
ing to agricultural education and knowledge and encourag-
ing the rising generation to face the challenges of the future
with new ideas.
The Foundation’s aim is to promote science, research and
education, principally in agricultural engineering and also
in the related fields of engineering and economics. Out-
standing project work or dissertations are recognized with
the Helmut Claas Scholarship, awarded annually and these
are supported as part of project promotion. The Foundation
also gives research contracts. The projects that receive such
honour all reflect the significance of agriculture and agricul-
tural engineering for the future.
DIALOGUE WITH THE PUBLIC
CLAAS does a lot for society. We train young people,
create jobs, invest in plants and pay large amounts in tax.
The Group is subject to constant changes, many of which
are due to the social environment. In order to adjust to
new developments, we try to maintain constant contact
with representatives of society. We tell them about our
work and discuss all the relevant issues with them.
42 CORPORATE RESPONSIBILITY / CLAAS & SOCIETY

Food A joint task for the future
42

Oh, the delight of freshly baked bread, a steaming
bowl of rice or perhaps a steak with chips and a side
salad – however diverse their eating habits, every
child, every woman and every man should be able
to eat their fill.
It is possible. The paddy fields of Asia, Europe’s acres
of wheat, the American maize plantations and even
the millet fields of Africa have the ability to satisfy
human hunger. But without modern technology, it
won’t happen. High-tech in the fields: that’s the key
to the future.
45
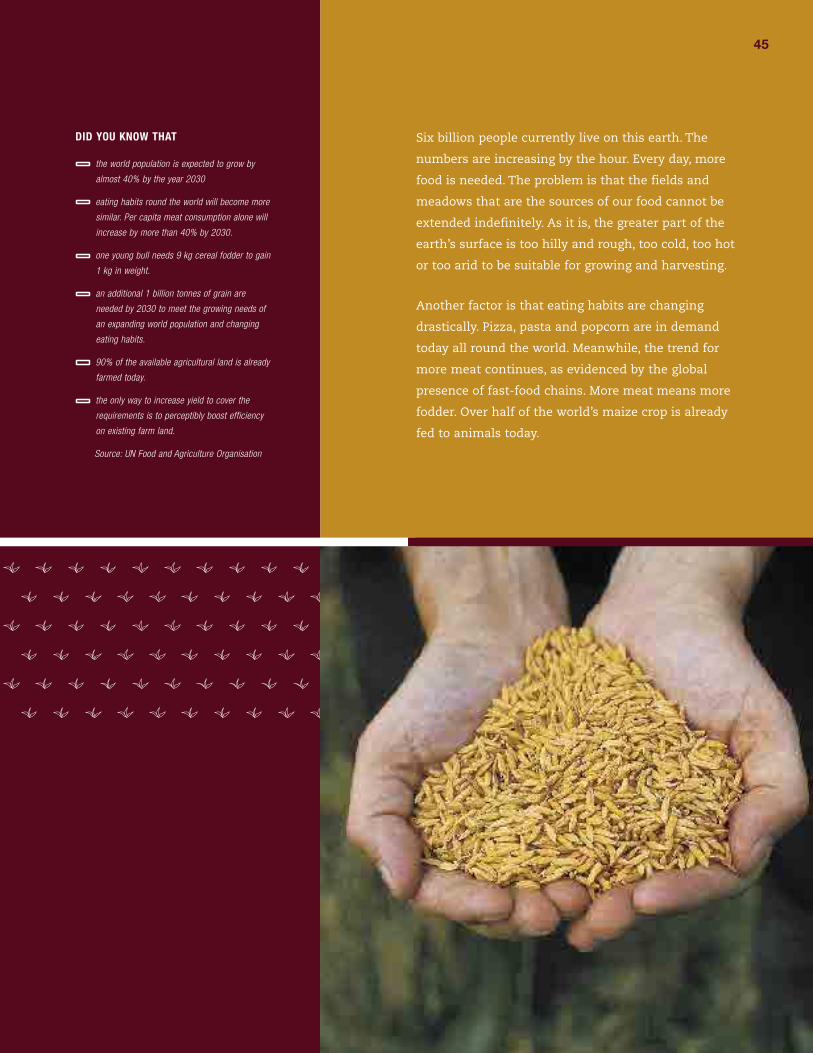
Six billion people currently live on this earth. The
numbers are increasing by the hour. Every day, more
food is needed. The problem is that the fields and
meadows that are the sources of our food cannot be
extended indefinitely. As it is, the greater part of the
earth’s surface is too hilly and rough, too cold, too hot
or too arid to be suitable for growing and harvesting.
Another factor is that eating habits are changing
drastically. Pizza, pasta and popcorn are in demand
today all round the world. Meanwhile, the trend for
more meat continues, as evidenced by the global
presence of fast-food chains. More meat means more
fodder. Over half of the world’s maize crop is already
fed to animals today.
DID YOU KNOW THAT
the world population is expected to grow by
almost 40% by the year 2030
eating habits round the world will become more
similar. Per capita meat consumption alone will
increase by more than 40% by 2030.
one young bull needs 9 kg cereal fodder to gain
1 kg in weight.
an additional 1 billion tonnes of grain are
needed by 2030 to meet the growing needs of
an expanding world population and changing
eating habits.
90% of the available agricultural land is already
farmed today.
the only way to increase yield to cover the
requirements is to perceptibly boost efficiency
on existing farm land.
Source: UN Food and Agriculture Organisation
45
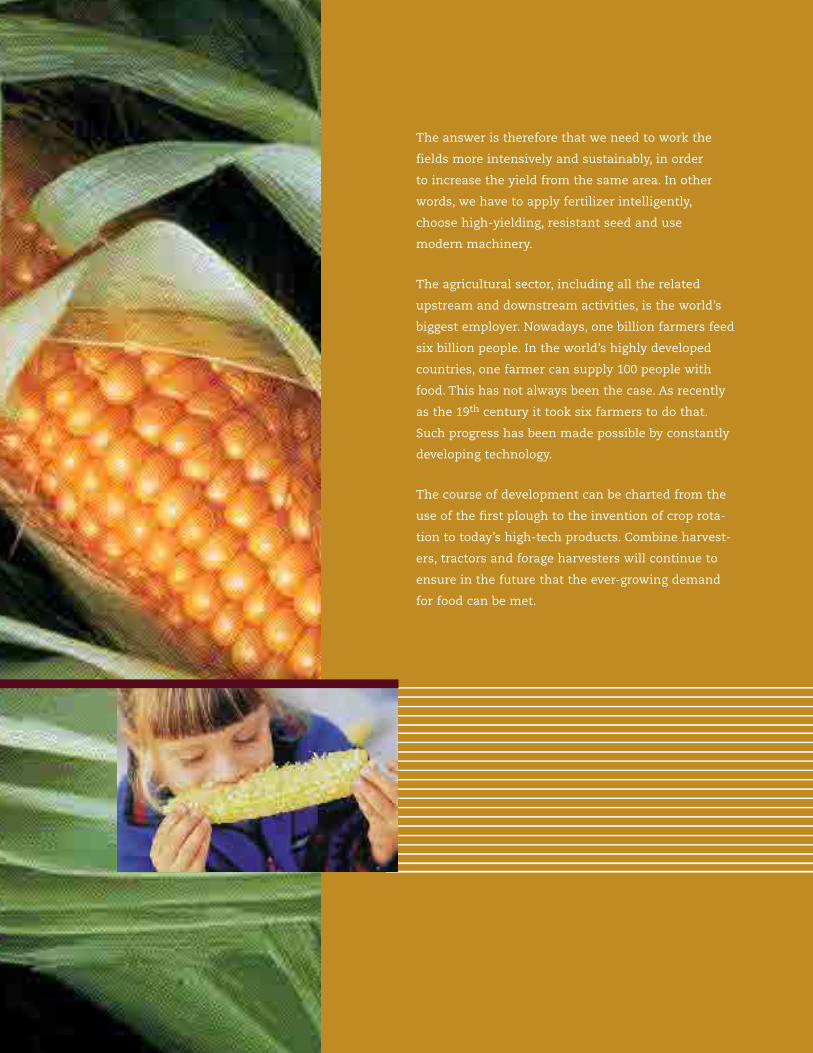
The answer is therefore that we need to work the
fields more intensively and sustainably, in order
to increase the yield from the same area. In other
words, we have to apply fertilizer intelligently,
choose high-yielding, resistant seed and use
modern machinery.
The agricultural sector, including all the related
upstream and downstream activities, is the world’s
biggest employer. Nowadays, one billion farmers feed
six billion people. In the world’s highly developed
countries, one farmer can supply 100 people with
food. This has not always been the case. As recently
as the 19th century it took six farmers to do that.
Such progress has been made possible by constantly
developing technology.
The course of development can be charted from the
use of the first plough to the invention of crop rota-
tion to today’s high-tech products. Combine harvest-
ers, tractors and forage harvesters will continue to
ensure in the future that the ever-growing demand
for food can be met.
47

Agricultural machinery improves living conditions.
To put it very simply: if you eat well, you are more
likely to keep healthy. If you are healthy, you will do
better at school. And with a good education, you are
likely to get a job. The one thing leads to the next to
create the basis for social, political and economic
stability – in short: satisfaction.
Food is the basis of life. Where would we be without
farming? Thanks to the new technologies, there is
every prospect that people everywhere will be able
to feed themselves by their own efforts. The task
for the future »food« is to be solved jointly. It can
be done. Together.
47

You can find further information on this issue at
»Food and Agriculture Organization of the United Nations«
www.fao.org
49

Management ReportConsolidated Financial Statements
CONSOLIDATED FINANCIAL STATEMENTS
IN ACCORDANCE WITH US GAAP
(detailed Index on page 60)
61 Independent Auditors´ Report
62 Consolidated Profit and Loss Account
63 Consolidated Balance Sheet
64 Cash flow Statement
65 Movements in Consolidated Equity
66 Movements in Consolidated
Fixed Assets
68 Related Companies and significant
Shares in Related Companies
70 Notes to Consolidated Financial
Statements
MANAGEMENT REPORT
50 Industry Development
50 Net Sales
52 Result
53 Capital Expenditure
54 Cash flow
55 Liquidity and Financing
55 Assets
57 Research and Development
57 Outlook
58 Risk Management
59 Management Statement
49

50 51MANAGEMENT REPORT
INDUSTRY DEVELOPMENT
»EUROPEAN CLIMATE« IMPACTS INVESTMENT CLIMATE
The investment climate in the agricultural engineering markets which,
contrary to the general development of business activity, had generally
been positive in the previous year, clearly deteriorated in the year under
report. The effects were especially noticeable in Europe, but also in
North America.
The main reason for the reluctance to invest, in addition to declining
incomes in previous years and the uncertain framework conditions
surrounding agricultural policy, was the European weather. Extreme
drought conditions, at levels previously unknown, were experienced
almost all over the Continent. Forest fires throughout Southern Europe,
and dried up grain in regions of normally fertile soil, reflected the
severity of the conditions. There have never been so many days of
temperatures exceeding 30 degrees, since records began.
Grain production in the European Union decreased by almost 10%
in 2003, with declines being most extreme in the major agricultural
engineering markets of France, Germany, and Italy.
The major markets for agricultural machines in Central and Eastern
Europe also suffered considerable declines in both income and profit.
Here too, unfavorable weather conditions were the main cause, with the
drought conditions following the serious frost damage during the winter
period. Total worldwide grain production in 2003 was about 15 million
tons below the already depleted production levels of the previous year.
Resolutions reforming EU agricultural policy, the accelerating structural
change, and the forthcoming enlargement of the EU in 2004, all inten-
sified the uncertainty among farmers and crop producers. Whilst current
EU members fear growing competition and pricing pressure, acceding
countries have serious doubts as to whether they will be able to estab-
lish competitive business structures on a timely basis.
After a clear recovery in the previous year, there were signs of an over-
all moderate decline in the agricultural engineering market in Western
Europe for 2003. The German agricultural engineering industry also re-
corded a decline in total sales. In the first half of the year the German
market recorded a decrease of 11.3%, which could only be partly com-
pensated through increasing exports. The high exchange rate of the euro
strongly affected agricultural engineering exports to non-European
markets.
France, the largest agricultural engineering market in Europe, also ex-
perienced a slight downward trend for tractors and combine harvesters
in 2003. The baler market alone was able to record modest growth.
Great Britain recovered further from the deep crisis suffered since the
mid-90s, although demand declined noticeably in the tractor market.
The agricultural engineering markets of Western Europe are expected,
as a whole, to continue to remain conservative.
Central and Eastern Europe continue to be important target regions of
West European agricultural engineering exports due to the high demand
for modern, efficient machines. The forthcoming fundamental structural
changes in Central Europe will, however, lead to a time delay in invest-
ment activity.
The economic development and framework conditions of agricultural
policy in the major CIS markets will continue to improve. Government sub-
sidies for the agricultural industry contribute to a recovery of the agricul-
tural engineering market, particularly in Russia. The pressure on capital
investment and the trend towards free market orientation will continue.
The North American agricultural engineering market showed a slight
downward trend during the year under report. South America was the
dominant growth market in 2003 and at the end of the year, Brazil had
experienced significant growth in both the combine harvester and tractor
markets. Argentina’s agricultural exports will reach high levels after
overcoming the economic crisis in 2003. In line with this development,
the agricultural engineering market has already grown considerably
this year. The outlook for Argentina as a major worldwide agricultural
exporter is positive.
In India, the agricultural engineering market remained difficult through-
out 2003. The necessary automation of the agricultural industry however,
clearly demonstrates that this country continues to offer huge growth
potential.
NET SALES
IMPROVED MARKET SHARES – SALES GROWTH THROUGH ACQUISITIONS
The CLAAS Group achieved an increase in sales of 18.2% to € 1,496.3
million in 2003, as a result of acquisitions. Sales were virtually at the
��
�����
��
�����
���
�����
��
�����
��
�����
�����
�����
�����
���
���
���
SALES ������������
������������
������������
������������
������������
� ���
����
����
����
����
����
����
����
����
����
����
�������������������������������
Management Report of the CLAAS Group

50 51
same high levels at the previous year (€ 1,265.5 million) after excluding
the acquisition of majority shares in Brötje Automation GmbH and in
RENAULT Agriculture S.A.S.
Sales development within the various segments and regions varied.
In the Agricultural Engineering segment, sales improved by 15.8% to
€ 1,340.4 million as a result of the tractor sales included in the CLAAS
Group since May 2003. The Production Engineering segment continued
to grow independently from the acquisition of Brötje Automation, and
sales achieved by the Industrial Engineering segment were stable at
similar levels to the previous year.
CLAAS successfully asserted its position in the European market. De-
spite the difficult conditions arising from reductions in income levels
of the past few years, the extreme drought inexperienced for centuries,
and the reforms of EU agricultural policy, CLAAS clearly gained market
share. This improvement was, however, insufficient to compensate the
market decline in terms of units sold.
In Western Europe, which continues to be the most important agricul-
tural engineering market for CLAAS, total sales improved by 23.7% to
€ 1,021.2 million. Sales for the original core business of harvest machin-
ery, excluding RENAULT Agriculture, were slightly below the level of the
previous year. The moderate decline is primarily attributable to reduced
levels of income suffered by the farmers as a result of unfavorable
weather conditions. The decrease in sales, at 2.1%, was more pronounc-
ed in the EU member states. Grain production in the European Union as
a whole fell by 10%.
Following above-average development in the previous year, the sales
of harvest machinery decreased by 6.5% in Germany and 2.6% in Italy.
The recovery in Great Britain, however, continued and enabled CLAAS
to record growth similar to the level of the previous year, at 6.4%. In
France, CLAAS recorded a 3.5% increase against a slightly declining
market. The development of the harvest machinery business in the re-
maining EU countries was varied, with declines in Scandinavia, Ireland
and Austria being matched by almost equal increases in the Benelux
countries and in Spain.
The main agricultural machine markets of Central Europe also suffered
from losses in revenue and decreased income on account of the ad-
verse weather conditions of the past season.
In total, the Central European countries recorded a 6.6% drop in CLAAS
harvest machinery sales in the financial year 2003. The strength of the
euro, coupled with forthcoming fundamental structural changes in the
EU acceding countries along with the uncertainty associated with the
future shaping of the new agricultural policy, all led to comparatively
lower capital expenditures on harvest machinery.
The overall sales development in Eastern Europe was slightly different.
CLAAS successfully expanded its business activities in the Russian
Federation, recording an 18.6% increase. The start-up of a local com-
bine harvester production facility in the South Russian city of Krasnodar,
results in the fact that the barriers to Western machine imports will no
longer be an issue in the future. In addition, subsidies and public
assistance for investment in agricultural engineering will be available
for locally manufactured CLAAS products. In contrast, last summers
drought, continuing restrictions with respect to the financing of machine
imports, and the creation of new customs barriers all adversely influ-
enced the business development in the remaining regions of Eastern
Europe. Harvest machinery sales in the Ukraine decreased. The intro-
duction of customs duties on agricultural machine imports led to a major
sales decline in Belorussia. The strong demand for modern agricultural
engineering in Eastern Europe, along with the continuing trend towards
free market orientation, leads CLAAS to anticipate considerably im-
proved growth in the future.
CLAAS Agricultural Engineering sales (without tractors) in non-European
markets decreased by 1.4% over the previous year to € 146.9 million.
In the USA, the largest market outside Europe for CLAAS, the demand
for agricultural machines has not recovered from the 2002 drought,
despite a good harvest in 2003. Nevertheless, the two American com-
panies CLAAS of America LLC. and CLAAS Omaha LLC. increased sales
by approximately 10%, mainly due to an improved spare parts business.
The marked change in the exchange rates parity of the euro/dollar from
the previous year resulted in a reduction of € 12.5 million, or 16%, of
the US sales realized by the CLAAS Group. CLAAS Argentina improved
sales, albeit from a modest base. Additional non-European countries
enjoying substantial sales growth are located in Central Asia.
The proportion of export sales as a percentage of total sales of the
original core business of harvest machinery increased, as a result of
the positive trends in export markets and the decline of sales in Ger-
many, from 68.5% in the previous year, to 69.8% in 2003. In total,
exports accounted for 69.2% of sales in 2003, compared to the
previous year of 64.9%.
COMBINE HARVESTERS AND FORAGERS WEAKER –
GREEN HARVEST MACHINERY AND BALERS EXTENDED
The modest decline in sales of the Agricultural Engineering segment –
after adjusting for acquisitions – is attributable to combine harvesters
and foragers. This development results primarily from the adverse
weather conditions in both Western and Central Europe, as previously
mentioned, but also from the loss of the Challenger track-type tractor
��������������� ������������
A
B
C
D
461.4
685.9
188.0
161.0
(+4.0%)
(+48.9%)
(-7.4%)
(+1.9%)
C
D
B
A�������
�������������������
������������������������
�����������������������
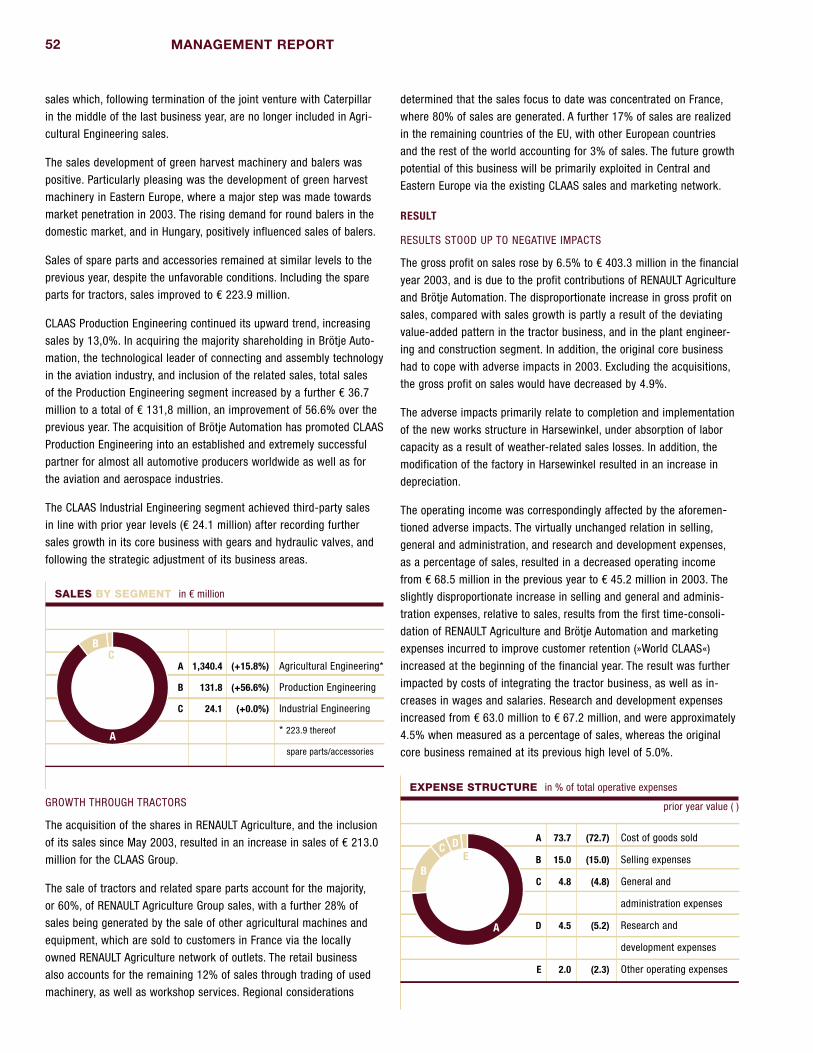
MANAGEMENT REPORT 52 53
sales which, following termination of the joint venture with Caterpillar
in the middle of the last business year, are no longer included in Agri-
cultural Engineering sales.
The sales development of green harvest machinery and balers was
positive. Particularly pleasing was the development of green harvest
machinery in Eastern Europe, where a major step was made towards
market penetration in 2003. The rising demand for round balers in the
domestic market, and in Hungary, positively influenced sales of balers.
Sales of spare parts and accessories remained at similar levels to the
previous year, despite the unfavorable conditions. Including the spare
parts for tractors, sales improved to € 223.9 million.
CLAAS Production Engineering continued its upward trend, increasing
sales by 13,0%. In acquiring the majority shareholding in Brötje Auto-
mation, the technological leader of connecting and assembly technology
in the aviation industry, and inclusion of the related sales, total sales
of the Production Engineering segment increased by a further € 36.7
million to a total of € 131,8 million, an improvement of 56.6% over the
previous year. The acquisition of Brötje Automation has promoted CLAAS
Production Engineering into an established and extremely successful
partner for almost all automotive producers worldwide as well as for
the aviation and aerospace industries.
The CLAAS Industrial Engineering segment achieved third-party sales
in line with prior year levels (€ 24.1 million) after recording further
sales growth in its core business with gears and hydraulic valves, and
following the strategic adjustment of its business areas.
GROWTH THROUGH TRACTORS
The acquisition of the shares in RENAULT Agriculture, and the inclusion
of its sales since May 2003, resulted in an increase in sales of € 213.0
million for the CLAAS Group.
The sale of tractors and related spare parts account for the majority,
or 60%, of RENAULT Agriculture Group sales, with a further 28% of
sales being generated by the sale of other agricultural machines and
equipment, which are sold to customers in France via the locally
owned RENAULT Agriculture network of outlets. The retail business
also accounts for the remaining 12% of sales through trading of used
machinery, as well as workshop services. Regional considerations
determined that the sales focus to date was concentrated on France,
where 80% of sales are generated. A further 17% of sales are realized
in the remaining countries of the EU, with other European countries
and the rest of the world accounting for 3% of sales. The future growth
potential of this business will be primarily exploited in Central and
Eastern Europe via the existing CLAAS sales and marketing network.
RESULT
RESULTS STOOD UP TO NEGATIVE IMPACTS
The gross profit on sales rose by 6.5% to € 403.3 million in the financial
year 2003, and is due to the profit contributions of RENAULT Agriculture
and Brötje Automation. The disproportionate increase in gross profit on
sales, compared with sales growth is partly a result of the deviating
value-added pattern in the tractor business, and in the plant engineer-
ing and construction segment. In addition, the original core business
had to cope with adverse impacts in 2003. Excluding the acquisitions,
the gross profit on sales would have decreased by 4.9%.
The adverse impacts primarily relate to completion and implementation
of the new works structure in Harsewinkel, under absorption of labor
capacity as a result of weather-related sales losses. In addition, the
modification of the factory in Harsewinkel resulted in an increase in
depreciation.
The operating income was correspondingly affected by the aforemen-tioned adverse impacts. The virtually unchanged relation in selling,
general and administration, and research and development expenses,
as a percentage of sales, resulted in a decreased operating income
from € 68.5 million in the previous year to € 45.2 million in 2003. The
slightly disproportionate increase in selling and general and adminis-
tration expenses, relative to sales, results from the first time-consoli-
dation of RENAULT Agriculture and Brötje Automation and marketing
expenses incurred to improve customer retention (»World CLAAS«)
increased at the beginning of the financial year. The result was further
impacted by costs of integrating the tractor business, as well as in-
creases in wages and salaries. Research and development expenses
increased from € 63.0 million to € 67.2 million, and were approximately
4.5% when measured as a percentage of sales, whereas the original
core business remained at its previous high level of 5.0%.
���������������� ������������
��
��
��
��������
�����
����
��������
��������
�������
�
�
�������������������������
����������������������
����������������������
����������������
��������������������������
�
EXPENSE STRUCTURE ���������������������������������
��
��
��
�
�
����
����
���
���
���
������
������
�����
�����
�����
�
� �
�
������������������
����������������
������������
�����������������������
�������������
��������������������
������������������������
�
��������������������

MANAGEMENT REPORT 52 53
The income from investments includes all profit and loss contributions
of participations not fully consolidated, and are largely attributable to
the sales financing companies CLAAS Financial Services S.A.S. and
CLAAS Valtra Finance Ltd. as well as CLAAS GUSS GmbH.
Income from interest and securities decreased by € 4.5 million from
the previous year, primarily reflecting the financing costs of the acquisi-
tions undertaken in the financial year 2003. As a result of a € 100 mil-
lion euro bond issued in 1999, and the US$ 200 million placement in
the USA towards the end of 2002, CLAAS was able to benefit from the
historically favorable interest level.
The other financial expense of € 12.0 million includes expenses incurred
for participation certificates and for the CLAAS employee profit partici-
pation scheme, losses on foreign currency transactions, commission
paid to financial service providers (guarantee and security commissions,
etc.) and other financing expenses. The significant appreciation in value
of the euro compared to other major currencies was largely compensat-
ed by CLAAS through timely and effective hedging. Nevertheless, includ-
ing hedging costs, the net currency expense amounted to € 3.9 million.
Profit from ordinary activities which, as a result of the lack of extra-
ordinary items, corresponds to income before taxes, decreased from
€ 55.8 million to € 22.6 million as explained by the effects referred
to above.
The Group‘s net income declined from € 32.5 million to € 17.9 million.
The disproportionately low income tax burden of approximately 15%,
compared to 41% in the previous year, arises from the utilization of
tax losses carried forward in foreign Group companies.
CAPITAL EXPENDITURE
CAPITAL EXPENDITURES INCREASED TO € 142 MILLION
The financial year 2003 was largely characterized at CLAAS Group
level by considerable investments in production facilities and, through
acquisitions, in the expansion of the product portfolio. Capital invest-
ments totaled € 142.3 million. Capital expenditure on tangible and
intangible assets, excluding Goodwill, remained at prior year levels
of € 54.2 million.
The most significant individual capital investment was the acquisition
of shares in RENAULT Agriculture, which accounted for € 74.7 million,
whereas the acquisition of the 51% share in Brötje Automation account-
ed for € 12.6 million. Both acquisitions are important strategic steps
towards expanding the market position within the various segments.
The addition of tractors to the CLAAS product portfolio provides im-
proved benefit to our customers on account of a broader, integrated
range of products on offer from a single source. Similarly, the acquisi-
tion of Brötje Automation as an established market leader of connecting
and assembly technology in the aviation industry, enables the Produc-
tion Engineering segment to gain a more rapid foothold in the aircraft
construction machinery industry. Synergies arise from the transfer of
technologies between the different fields of activity of the Production
Engineering segment, as well as from winning new joint customers.
Investments in property, plant, and equipment in 2003 primarily relate
to the modernization and restructuring of the production facilities, with
focus on the facilities at Harsewinkel and in Saulgau. The SYNPRO10
Project in Harsewinkel has been largely completed, and the goal is to
continue to further improve production efficiency, quality and flexibility.
In addition, CLAAS invested significant funds on the expansion of the
product range and on model maintenance. Further progress was also
made in the implementation of the SAP R/3 Software System at various
locations.
���
����
����
��
��������
��
����
����
��
����
����
��
����
����
��
��
��
��
��
��
CAPITAL EXPENDITURE AND DEPRECIATION ������������
�����������������������
������������������������������
������������� ���
�������������������������������
��� �� �� �� ��
������������ ����������
��
��
��
��
��
PROFIT FROM ORDINARY ACTIVITIES ������������
�������������������������������

MANAGEMENT REPORT 54 55
CASH FLOW
CASH FLOW ACCORDING TO DVFA/SG AT A GOOD LEVEL
The cash flow, computed in accordance with DVFA/SG principles,
amounts to € 58.1 million, and is € 9.3 million, or 13.8%, below the
level of the previous year. This indicates that the special negative in-
fluences to the profit did not impact the cash flow, as evidenced by the
increase in depreciation as a result of the restructuring of the factory in
Harsewinkel, which had no impact on cash outflow.
The cash inflow from operating activities is, compared with the previous
year, slightly negative at € 3.8 million, which primarily relates to
changes in working capital both in the original core business and also
at RENAULT Agriculture since its inclusion in the CLAAS Group.
The acquisitions undertaken in the year under report resulted in a
marked increase in cash outflow from investing activities, compared
to the previous year. The cash outflow amounting to € 84.8 million is
more than compensated by a cash inflow from financing activities in
the amount of € 155.0 million, primarily due to the placement of a bond
in the USA. The residual surplus, together with the cash outflow from
operating activities, results in an increase in cash and cash equivalents
of € 65.0 million to € 233.2 million.
2003 2003 2002 2002
CASH FLOW STATEMENT € million % € million %
Cash flow according to DVFA/SG 58.1 25 67.4 40
Cash flow from operating activities (3.8) (2) 36.6 22
Cash flow used for investing activities (84.8) (36) (35.0) (21)
Cash flow used for financing activities 155.0 66 (4.9) (3)
Change in cash and cash equivalents with cash flow impact 66.4 28 (3.3) (2)
Influence of foreign exchange (1.4) 0 (0.9) 0
Opening balance of cash and cash equivalents 168.2 72 172.4 102
Closing balance of cash and cash equivalents 233.2 100 168.2 100
The cash flow to sales ratio computed on the basis of the cash flow
according to DVFA/SG, which amounts to € 58.1 million, is 3.9% (prior
year 5.3%).
��� �� �� �� ��
������������ ��������
���
���
������
���
CASH FLOW ACCORDING TO DVFA/SG ������������
����������
������������������������
�������������������������������
���
���
���
��
����
����
����
���
CASH FLOW STATEMENT ������������
����
����������
����
�������������
�������������������
����
������������
�����
�������������
����
�������������
����
��������������������������������������
�������������������
�����
������������������������������������
�����
���������������������
�����
�����������������������������
����������������������
�����
�������������
�����
������������������������������������

MANAGEMENT REPORT 54 55
LIQUIDITY AND FINANCING
LIQUIDITY AND FINANCING FLUCTUATE DURING THE YEAR
As at the balance sheet date, CLAAS had available liquidity (cash
and cash equivalents plus securities classified as current assets) of
€ 344.8 million, which is a marked increase from the previous year
(€ 300.7 million). The cyclical business development within a year,
which is typical for the agricultural machine industry, leads to con-
siderable liquidity fluctuations during the year. Whereas the relatively
low commitment of funds to working capital normally leads to a high
liquidity level at the financial year end, the financing requirement rises
significantly during the business year, in line with the cyclic business
development. The operative measures taken for reducing these liquidity
fluctuations in the course of the year (for instance, flexibility in pro-
duction) are accompanied by an asset-backed securities program (ABS
program). Within the scope of this ABS program, trade receivables are
sold to a special-purpose entity.
The increase in cash and cash equivalents was largely due to the in-
flow of proceeds from issuing a US$ 200 million bond at the beginning
of the financial year, which was partly off-set by a cash outflow for
financing acquisitions.
After consolidating the acquisitions, first-degree liquidity (liquidity
to short-term liabilities ratio) is at 67.4% (prior year: 83.7%).
Second-degree liquidity (monetary current assets to short-term
liabilities ratio) amounts to 123.3% (prior year: 141.1%).
In addition to the ABS program, the CLAAS Group has received financ-
ing commitments in excess of € 720 million, which serve to secure
the financing requirements of the CLAAS Group’s future growth. The
financing commitments are detailed in the notes to the financial
statements. In addition to a listed euro bond of € 100 million, which
CLAAS issued with a 4.5% coupon and a maturity of 7 years in the
international capital market at the beginning of March 1999, they
include a US$ 200 million bond. This bond was placed with American
institutional investors in the form of a private placement in December
2002. With a 5.76% coupon, and a maturity of 12 years, it was once
again possible to secure a very low level of interest.
Furthermore, through the issuance of participating certificates of
€ 41 million, and the conclusion of a syndicated credit facility exceed-
ing € 100 million, precautionary measures were taken in the last few
years to secure the financing of the CLAAS Group’s future growth.
2003 2003 2002 2002
BALANCE SHEET STRUCTURE € million % € million %
Fixed assets 373.9 26.5 262.3 25.7
Current assets 1,038.9 73.5 757.3 74.3
Assets 1,412.8 100 1,019.6 100
Equity 292.5 20.7 292.2 28.7
Funds similar to equity 106.3 7.5 58.3 5.7
Long-term liabilities 502.5 35.6 309.7 30.4
Short-term liabilities* 511.5 36.2 359.4 35.2
Equity and liabilities 1,412.8 100 1,019.6 100
* including Derivative Financial Instruments
ASSETS
ACTIVE ASSET MANAGEMENT, HIGH LIQUIDITY
The changes to the balance sheet structure were primarily result
from the first-time consolidations of RENAULT Agriculture and Brötje
Automation. The balance sheet total increased by € 393.2 million to
€ 1,412.8 million.
Fixed assets increased from € 262.3 million to € 373.9 million. The add-
itions and the effects from first-time consolidations totaling € 166.2 mil-
lion (prior year: € 90.6 million) are partly off-set by disposals at residual
carrying amount of € 10.2 million (prior year: € 11.0 million) and depre-
ciation of € 37.8 million (prior year: € 27.9 million). The changes in
scope of consolidation disclosed in intangible assets include Goodwill
in the amount of € 36.0 million resulting from the first-time consoli-
dation of the acquisitions Brötje Automation and RENAULT Agriculture
for the first time. The additions to tangible assets in the amount of
€ 52.1 million relate primarily to the modernization and restructuring of
CLAAS Group’s production facilities. In addition, the first-time consolida-
tions of RENAULT Agriculture and Brötje Automation resulted in a further
increase in tangible assets of € 55.0 million, with additions to land, land
rights, and to technical equipment, constituting the principal amount of
€ 46.9 million.
Financial assets increased over the previous year (€ 49.4 million) by
€ 16.4 million to € 65.8 million, with RENAULT Agriculture accounting
for € 15.2 million of this increase.
Inventories increased by € 130.5 million to € 337.6 million, when com-
pared to prior year, primarily as a result of the inclusion of RENAULT
Agriculture. Through flexibility in production, and the timely adjustment
to output levels, CLAAS was able to limit the increase in harvest ma-
chinery inventories resulting from the weather-related reduced demand
in the spring and summer of 2003, to € 17.7 million.

MANAGEMENT REPORT 56 57
Trade receivables increased from € 139.5 million to € 179.9 million, of
which € 68.5 million relate to RENAULT Agriculture. This consolidation-
related increase was partly off-set by decreases in trade receivables
at other CLAAS companies. After adjustment for acquisitions, the trade
receivables to sales ratio improved considerably from the prior year
level of 11.0%, to below 9.0%. This positive development is partly attri-
butable to the sale of receivables within the ABS program, and partly
due to strict receivables control in an effort to minimize credit risks.
Liquidity, including securities classified as current assets, improved
from € 300.7 million to € 344.8 million, and accounts for approximately
one quarter of the balance sheet total.
SOLID COVER RATIOS MAINTAINED
The amount of equity, at € 292.5 million, was basically unchanged from
the previous year. The net income for the year 2003 directly compen-
sated distribution to shareholders and exchange rate effects. The equity
ratio decreased from 28.7% to 20.7% on account of the increased
balance sheet total resulting from the acquisitions.
Including funds similar to equity, which increased to € 106.3 million
as a result of the minority share in RENAULT Agriculture, the expanded
equity ratio, at 28.2%, remains solid. In addition to minority interests,
funds similar to equity also include participation certificates outstand-
ing in the amount of € 40.9 million, and the dormant participation of
CLAAS- Mitarbeiterbeteiligungs-Gesellschaft (CMG) in the amount of
€ 17.2 million (prior year: € 16.1 million). In accordance with US GAAP,
these items are not classified as equity in the narrow sense of the
meaning.
Long-term liabilities amount to € 502.5 million (prior year: € 309.7 mil-
lion) and is comprised of pension provisions, other non-current provi-
sions and liabilities with a remaining term of more than one year. The
increase in the long-term liabilities relates primarily to the inflow from
the US private placement and the absorption of the pension provisions
from RENAULT Agriculture.
Long-term capital, comprised of equity, funds similar to equity and
long-term liabilities, covers fixed assets at a ratio of 241.1% (prior year:
251.7%). The extended equity-to-fixed-assets ratio (long-term capital
in relation to the aggregate of fixed assets and 50% of inventories),
at 166.1% (prior year: 180.5%), remains at an excellent level.
PURCHASING
Market-driven price increases had a distinct effect upon purchasing in
2003. Producer capacity issues created a short supply of steel, which
led to a significant increase in world steel prices followed by an increase
in steel, and steel-related, products. At the same time, the Iraq crisis
resulted in increases to the price of oil, oil-related products, and energy.
The impact of these increases to CLAAS was mitigated by reducing the
number of suppliers, and by bundling volumes. In the year under report,
the number of suppliers was reduced by more than 10%, leading to
economies of scale.
CLAAS has entered into an intensified value added partnership with
the remaining suppliers. The cost of materials will be further optimized
through joint product development based upon market-orientated costs,
agreements to continuously rationalize production and supply-chain
processes, and the establishment of clearly defined quality targets. In
order to realize these goals, suppliers are being increasingly integrated
into the CLAAS business operations. Today, CLAAS is already networked
with its most important suppliers through electronic media.
BALANCE SHEET STRUCTURE ����
�� ��
�����
��
��
��
������������
�����������
��������������������
���������
�����
��
��
��
��
�����
�
��
��
��
�����
�� �� �� ��
�
��
��
������
��������������������������������
�����������������������
����������������������
���������������������
������ ����������������������

MANAGEMENT REPORT 56 57
SIX SIGMA – INNOVATIVE METHODS FOR PROCESS CHAIN OPTIMIZATION
Six Sigma is a project management program utilized by CLAAS for the
analysis and sustained elimination of quality issues by means of com-
monly used modern quality management tools. Six Sigma also serves
to design nearly error-free products and services, as well as the under-
lying CLAAS processes, in accordance with customer requirements.
Six Sigma targets are generally consistent with the elementary internal
objectives of the CLAAS Group.
RESEARCH AND DEVELOPMENT
INVESTING IN THE FUTURE: RESEARCH AND DEVELOPMENT
Research and Development expenses for the CLAAS Group increased,
with the acquisition of RENAULT Agriculture, to € 67.2 million and
account for approximately 4.5% of Group sales.
Numerous innovative products were developed, including:
The new LEXION combine harvester series – more power and
larger grain tank, »Straw Chopper Special Cut II« with new chaff
distributor, new VISTA CAB cabin, electrically adjustable rotor-cut
panes and quick-stop header;
The new JAGUAR forager models – automatic steering upon swath
reception by means of laser pilot, automatic AUTO CONTOUR
ground adjustment with row-less RU 600 corn cutter (longitudinal
and transverse direction), data capture and storage for output-
related invoicing;
The XERION system vehicle, with a maximum speed of 50 km/h
in the power class exceeding 300 HP, equipped with CVT gearbox
and electro hydraulic steering assembly, self-steering parallel and
contour drive system;
The COUGAR – a self-propelled mower with a working width of
14 m (The world’s first!);
The QUADRANT 2100 – a new category 2 baler with optimized ma-
terial-flow through a combination of transversally and longitudinally
conveyance-tools on a shaft, 49-knife FINE CUT cutter;
The CORTO F-Profile – a three-dimensional kinematics-adjustor for
front-end cutters to prevent cutting into the ground;
The new VOLTO Family – a new maintenance-free Perma Link
power flux system which enables full intervention, tilting movement
up to 180°;
The DIRECT DISC – a direct cutting tool for foragers which allows
total plant silage harvesting;
The CROP-Meter – recording of crop conditions by way of a mecha-
nically controlled pendulum for specific spreading of fertilizer or
plant protection agents;
The CELTIS – an all-round tractor with up to 100 HP, with hydraulic
reverse gear unit and INFOTRAC on-board information system.
The CLAAS Group was awarded six medals for innovation during the
Agritechnica 2003 Trade Fair. The medals were presented to CLAAS
by the Deutsche Landwirtschafts-Gesellschaft (DLG), the German Agri-
cultural Society. With these awards CLAAS has been honoured as one
of the most innovative Groups in the agricultural engineering industry.
OUTLOOK
Following a general recovery in the previous year, the agricultural
engineering markets slumped again to lower levels in 2003, and we
anticipate only moderate growth in 2004. Poor harvests, the weak
economic situation internationally and protracted discussions surround-
ing EU agricultural policy are crucial factors that could influence the
willingness of our customers to invest.
We do not anticipate any considerable growth stimulus in Western and
Central Europe; the agricultural engineering market is likely to stabilize
at the 2003 level. As a result of poor harvests leading to a reduction in
incomes for the farmers in 2003, together with the fact that the forth-
coming EU expansion eastwards is hampering the demand for capital
goods, the current reluctance to buy is expected to continue in 2004.
Whereas current EU members are preparing themselves for stronger
competition and pricing pressure, there remains a considerable backlog
in administrative implementation of the new agricultural system within
the acceding countries. We anticipate, however, that this situation will
be resolved in the course of 2004. The new partnership with RENAULT
Agriculture presents new opportunities for CLAAS that will enable us,
despite this difficult market environment, to expand our market position
for growth.
There is considerable demand in Eastern Europe for modern, efficient
agricultural machinery and this region will continue to be an important
market for West European agricultural engineering exports. There re-
mains, however, uncertainty with respect to the exchange rate develop-
ment and a strong euro could impact the export business. In addition,
we anticipate that conditions surrounding agricultural policies in the
most important CIS countries will further improve, especially in Russia,
where subsidies for the agricultural industry are likely to lead to a re-
covery of the agricultural engineering market. The extensive requirement
��� �� �� �� ��
������������ ��������
��
��
��
��
��
��
��
RESEARCH AND DEVELOPMENT EXPENSES ������������
�������������������������������
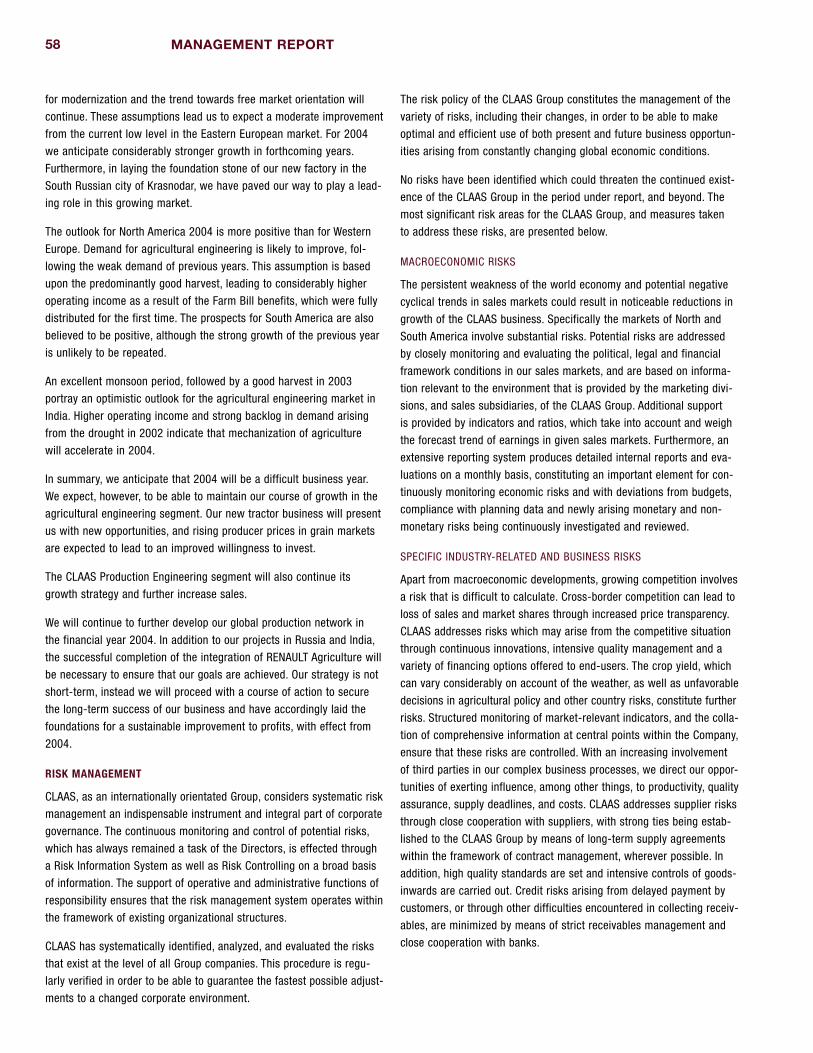
58 59
for modernization and the trend towards free market orientation will
continue. These assumptions lead us to expect a moderate improvement
from the current low level in the Eastern European market. For 2004
we anticipate considerably stronger growth in forthcoming years.
Furthermore, in laying the foundation stone of our new factory in the
South Russian city of Krasnodar, we have paved our way to play a lead-
ing role in this growing market.
The outlook for North America 2004 is more positive than for Western
Europe. Demand for agricultural engineering is likely to improve, fol-
lowing the weak demand of previous years. This assumption is based
upon the predominantly good harvest, leading to considerably higher
operating income as a result of the Farm Bill benefits, which were fully
distributed for the first time. The prospects for South America are also
believed to be positive, although the strong growth of the previous year
is unlikely to be repeated.
An excellent monsoon period, followed by a good harvest in 2003
portray an optimistic outlook for the agricultural engineering market in
India. Higher operating income and strong backlog in demand arising
from the drought in 2002 indicate that mechanization of agriculture
will accelerate in 2004.
In summary, we anticipate that 2004 will be a difficult business year.
We expect, however, to be able to maintain our course of growth in the
agricultural engineering segment. Our new tractor business will present
us with new opportunities, and rising producer prices in grain markets
are expected to lead to an improved willingness to invest.
The CLAAS Production Engineering segment will also continue its
growth strategy and further increase sales.
We will continue to further develop our global production network in
the financial year 2004. In addition to our projects in Russia and India,
the successful completion of the integration of RENAULT Agriculture will
be necessary to ensure that our goals are achieved. Our strategy is not
short-term, instead we will proceed with a course of action to secure
the long-term success of our business and have accordingly laid the
foundations for a sustainable improvement to profits, with effect from
2004.
RISK MANAGEMENT
CLAAS, as an internationally orientated Group, considers systematic risk
management an indispensable instrument and integral part of corporate
governance. The continuous monitoring and control of potential risks,
which has always remained a task of the Directors, is effected through
a Risk Information System as well as Risk Controlling on a broad basis
of information. The support of operative and administrative functions of
responsibility ensures that the risk management system operates within
the framework of existing organizational structures.
CLAAS has systematically identified, analyzed, and evaluated the risks
that exist at the level of all Group companies. This procedure is regu-
larly verified in order to be able to guarantee the fastest possible adjust-
ments to a changed corporate environment.
The risk policy of the CLAAS Group constitutes the management of the
variety of risks, including their changes, in order to be able to make
optimal and efficient use of both present and future business opportun-
ities arising from constantly changing global economic conditions.
No risks have been identified which could threaten the continued exist-
ence of the CLAAS Group in the period under report, and beyond. The
most significant risk areas for the CLAAS Group, and measures taken
to address these risks, are presented below.
MACROECONOMIC RISKS
The persistent weakness of the world economy and potential negative
cyclical trends in sales markets could result in noticeable reductions in
growth of the CLAAS business. Specifically the markets of North and
South America involve substantial risks. Potential risks are addressed
by closely monitoring and evaluating the political, legal and financial
framework conditions in our sales markets, and are based on informa-
tion relevant to the environment that is provided by the marketing divi-
sions, and sales subsidiaries, of the CLAAS Group. Additional support
is provided by indicators and ratios, which take into account and weigh
the forecast trend of earnings in given sales markets. Furthermore, an
extensive reporting system produces detailed internal reports and eva-
luations on a monthly basis, constituting an important element for con-
tinuously monitoring economic risks and with deviations from budgets,
compliance with planning data and newly arising monetary and non-
monetary risks being continuously investigated and reviewed.
SPECIFIC INDUSTRY-RELATED AND BUSINESS RISKS
Apart from macroeconomic developments, growing competition involves
a risk that is difficult to calculate. Cross-border competition can lead to
loss of sales and market shares through increased price transparency.
CLAAS addresses risks which may arise from the competitive situation
through continuous innovations, intensive quality management and a
variety of financing options offered to end-users. The crop yield, which
can vary considerably on account of the weather, as well as unfavorable
decisions in agricultural policy and other country risks, constitute further
risks. Structured monitoring of market-relevant indicators, and the colla-
tion of comprehensive information at central points within the Company,
ensure that these risks are controlled. With an increasing involvement
of third parties in our complex business processes, we direct our oppor-
tunities of exerting influence, among other things, to productivity, quality
assurance, supply deadlines, and costs. CLAAS addresses supplier risks
through close cooperation with suppliers, with strong ties being estab-
lished to the CLAAS Group by means of long-term supply agreements
within the framework of contract management, wherever possible. In
addition, high quality standards are set and intensive controls of goods-
inwards are carried out. Credit risks arising from delayed payment by
customers, or through other difficulties encountered in collecting receiv-
ables, are minimized by means of strict receivables management and
close cooperation with banks.
MANAGEMENT REPORT
58 59
OPERATIVE RISKS
Since CLAAS‘s subsidiaries are located around the globe, it is possible
to spread risks. However, international orientation can also involve
risks, which may lead to quality defects, or possibly also disrupt the
flow of production. Large distances and a broad product portfolio can
result in logistical shortages. The corporate freight management, which
develops and implements logistics concepts for all CLAAS locations,
effectively contributes to the smooth running of the value-added chain.
In order to avoid an impairment of the quality of CLAAS products,
production techniques and administrative operations are continuously
being reviewed, improved and enhanced. In addition, manuals and
procedural instructions, as well as monitoring of their compliance,
ensure successful quality management.
FINANCIAL MARKET RISKS
CLAAS addresses financial and currency risks by hedging currency and
interest positions through derivative financial instruments as well as
through regular strict monitoring of a number of early-warning indica-
tors. To mitigate currency risks and interest rate risks, CLAAS Group
implemented a systematic currency and interest rate management,
which is controlled centrally by CLAAS KGaA mbH and is organized
according to the principles of due segregation of functions. The use of
derivatives is based on relevant risk assessments and detailed guide-
lines and specifications, with derivatives being in principle used for
hedging underlying transactions, i.e. no transactions for trading or spe-
culative purposes are entered into.
HUMAN RESOURCE RISKS
There is strong competition for highly qualified experts and executives.
This refers particularly to staff with technical and industry-specific know-
ledge and experience for developing new products and technologies.
For this reason, CLAAS seeks to win, and to successfully integrate, quali-
fied staff and to establish long-term ties between staff and the Group.
In order to win and retain new employees, CLAAS has established close
contacts with universities, technical colleges and professional schools
and attends recruiting fairs. To ensure the essential expertise of its
employees, CLAAS employees at all levels are offered comprehensive
training and advanced training courses as well as individual career
opportunities.
MANAGEMENT STATEMENT CONCERNING THE PREPARATION OF
THE CONSOLIDATED FINANCIAL STATEMENTS
The accompanying consolidated financial statements and the Group man-
agement report were prepared by the management of CLAAS KGaA mbH.
The accuracy and completeness of the information contained in the
financial statements are the responsibility of the Company’s manage-
ment. The consolidated financial statements as of September 30, 2003
were prepared according to United States Generally Accepted Account-
ing Principles (US GAAP). They comply with Directive 83/349/EEC. The
prior year figures have been established according to the same prin-
ciples. According to § 292a of the German Commercial Code (HGB),
the consolidated financial statements under US GAAP have the effect
of exempting the Company being required to prepare consolidated
financial statements in accordance with the German Commercial Code.
Rüdiger A. Günther Nikolaus Feil Guy Povie
Dr.-Ing. Hermann Garbers Lothar Kriszun Werner Schneider
The systems of internal accounting controls, uniform Group accounting
rules and continuous employee training ensure that the consolidated
financial statements and the Group management report are prepared in
compliance with generally accepted accounting principles and comply
with statutory requirements. Compliance with the guidelines laid down
in the risk management manual, which is valid for the Group as a whole,
as well as the reliability and effectiveness of the control systems, are
continuously being examined by the internal audit function. Our careful
examination of the current risk position disclosed no specific risks that
could threaten the continued existence of the CLAAS Group.
Deloitte & Touche GmbH, Wirtschaftsprüfungsgesellschaft, has audited
the consolidated financial statements and the Group management report
and has provided the unqualified auditors’ opinion presented below.
Harsewinkel, December 9, 2003
60 61
61 Independent Auditors’ Report 62 Consolidated Profit and Loss Account63 Consolidated Balance Sheet64 Cash Flow Statement65 Movements in Consolidated Equity66 Movements in Consolidated Fixed Assets68 Related Companies and Significant Shares
in Related Companies
NOTES TO CONSOLIDATED FINANCIAL STATEMENTS
70 General Information
70 Scope of Consolidation
71 Accounting and Valuation Methods
73 Consolidation Principles
74 Currency Translation
74 Litigation and Damage Claims
74 Use of Estimates
74 New Accounting Standards
NOTES TO CONSOLIDATED PROFIT AND LOSS ACCOUNT
75 Net Sales
75 Selling Expenses
75 General and Administration Expenses
75 Other Operating Income
76 Other Operating Expenses
76 Income from Investments
76 Financial Income
77 Profit from Ordinary Activities/Income before Taxes
77 Taxes on Income
79 Earnings per Share
NOTES TO CONSOLIDATED BALANCE SHEET (ASSETS)
80 Fixed Assets
80 Inventories
80 Accounts Receivable and Other Assets
81 Asset-Backed Securities
82 Securities with a maturity of more than 90 days
82 Cash and Cash Equivalents
NOTES TO CONSOLIDATED BALANCE SHEET (LIABILITIES)
83 Comprehensive Income
83 Equity/Movements in Equity
83 Participation Certificates/Silent Partnership
84 Provisions
84 Pension Provisions and similar Obligations
86 Liabilities
OTHER INFORMATION
87 Contingent Liabilities and Other Financial Commitments
88 Warranty Provisions
88 Financing Commitments
89 Cash Flow Statement
89 Employees
89 Derivative Financial Instruments and Hedge Accounting
90 Segment Reporting
92 Material Differences between German GAAP (HGB) and US GAAP
94 CLAAS Group/Locations
96 Summary of Financial Statistics
INDEX TO CONSOLIDATED FINANCIAL STATEMENTS
60 61
Consolidated Financial Statements in accordance with US GAAP
INDEPENDENT AUDITORS’ REPORT
We have audited the consolidated financial statements prepared by
CLAAS Kommanditgesellschaft auf Aktien mbH, Harsewinkel, compris-
ing the profit and loss account, balance sheet, statement of changes
in shareholders’ equity, cash flow statement and notes to the financial
statements for the financial year from October 1, 2002 to September 30,
2003. The preparation and content of the consolidated financial state-
ments according to the United States Generally Accepted Accounting
Principles (US GAAP) are the responsibility of the Company’s manage-
ment. Our responsibility is to express an opinion as to whether the con-
solidated financial statements comply with US GAAP based on our audit.
We conducted our audit of the consolidated annual financial statements
in accordance with the German auditing provisions and the generally
accepted German standards for the audit of financial statements pro-
mulgated by the Institut der Wirtschaftsprüfer. Those standards require
that we plan and perform the audit such that the opinion that the con-
solidated financial statements are free from material misstatements can
be given with reasonable assurance. Knowledge of the business activi-
ties and the economic and legal environment of the Group and evalua-
tions of possible misstatements are taken into account in the determin-
ation of audit procedures. The evidence supporting the values and
disclosures in the consolidated financial statements is examined on a
test basis within the framework of the audit. The audit includes assess-
ing the accounting principles used and significant estimates made by
management, as well as evaluating the overall presentation of the con-
solidated financial statements. We believe that our audit provides a
reasonable basis for our opinion.
In our opinion, the consolidated financial statements give a true and fair
view of the net assets, financial position and results of operations of the
Group as well as of the cash flows of the financial year in accordance
with US GAAP.
Our audit, which also extends to the group management report prepared
by management for the financial year from October 1, 2002 to Septem-
ber 30, 2003, has not led to any reservations. In our opinion, the group
management report on the whole provides a suitable understanding of
the Group’s position and suitably presents the risks of future develop-
ment. In addition, we confirm that the consolidated financial statements
and the group management report for the financial year from October 1,
2002 to September 30, 2003 satisfy the conditions required for the Com-
pany’s exemption from its obligation to prepare consolidated financial
statements and the group management report in accordance with Ger-
man law.
Düsseldorf, December 9, 2003
Deloitte & Touche GmbH
Wirtschaftsprüfungsgesellschaft
Schlereth Kalvelage
Wirtschaftsprüfer Wirtschaftsprüfer
[German Public Auditor] [German Public Auditor]
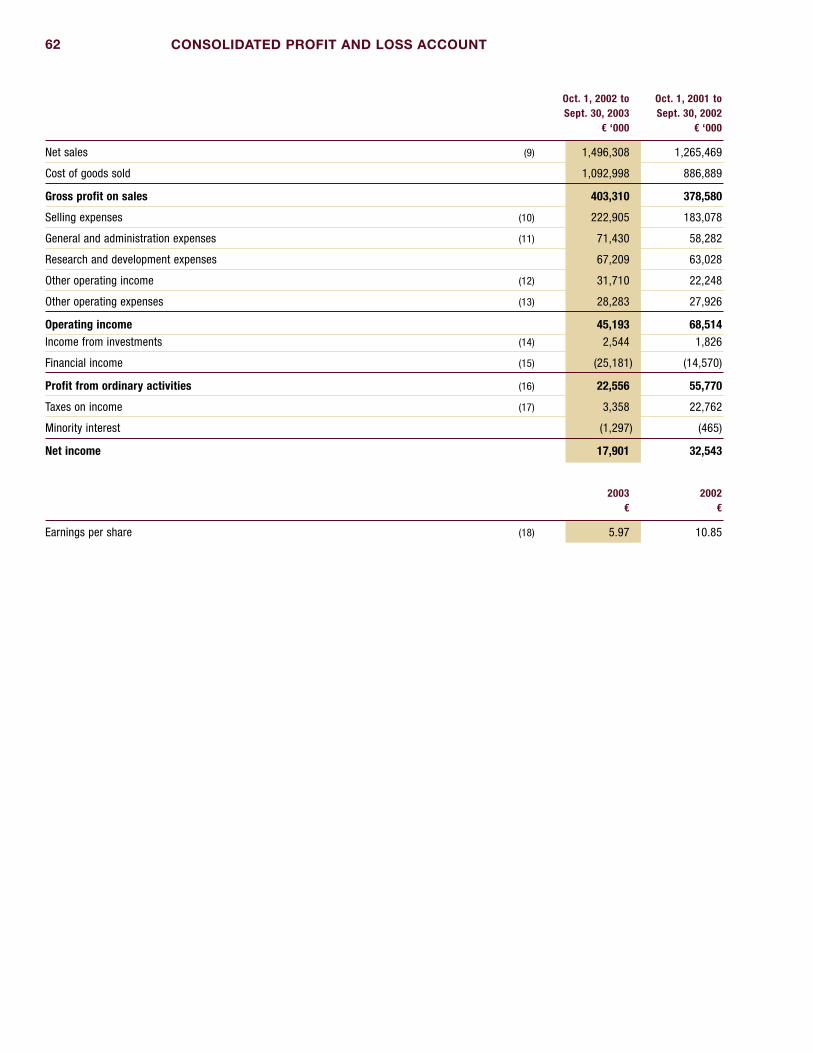
62 63CONSOLIDATED PROFIT AND LOSS ACCOUNT
Oct. 1, 2002 to Oct. 1, 2001 to Sept. 30, 2003 Sept. 30, 2002 € ‘000 € ‘000
Net sales (9) 1,496,308 1,265,469
Cost of goods sold 1,092,998 886,889
Gross profit on sales 403,310 378,580
Selling expenses (10) 222,905 183,078
General and administration expenses (11) 71,430 58,282
Research and development expenses 67,209 63,028
Other operating income (12) 31,710 22,248
Other operating expenses (13) 28,283 27,926
Operating income 45,193 68,514Income from investments (14) 2,544 1,826
Financial income (15) (25,181) (14,570)
Profit from ordinary activities (16) 22,556 55,770
Taxes on income (17) 3,358 22,762
Minority interest (1,297) (465)
Net income 17,901 32,543
2003 2002 € €
Earnings per share (18) 5.97 10.85

62 63CONSOLIDATED BALANCE SHEET AS AT SEPTEMBER 30, 2003
Sept. 30, 2003 Sept. 30, 2002ASSETS € ‘000 € ‘000
Intangible assets 55,810 20,045
Tangible assets 252,282 192,784
Financial assets 65,760 49,429
Total fixed assets (19) 373,852 262,258
Inventories (20) 337,553 207,058
Accounts receivable and other assets (21/22) 286,010 206,415
Derivatives (36) 16,395 10,564
Securities with a maturity of more than 90 days (23) 111,569 132,494
Cash and cash equivalents (24) 233,190 168,236
Total currents assets 984,717 724,767
Deferred taxes (17) 50,560 28,238
Prepaid expenses 3,631 4,335
Balance sheet total 1,412,760 1,019,598
Sept. 30, 2003 Sept. 30, 2002EQUITY AND LIABILITIES € ‘000 € ‘000
Subscribed capital 78,000 78,000
Capital reserves 38,347 38,347
Revenue reserves 164,980 140,237
Other comprehensive income (25) -6,752 3,102
Net income 17,901 32,543
Total equity (26) 292,476 292,229
Participation certificates (27) 40,903 40,903
Silent partnership (27) 17,202 16,064
Minority interest 48,159 1,343
Total funds similar to equity 106,264 58,310
Provisions (28/29) 384,884 323,246
Liabilities (30) 574,048 331,678
Derivatives (36) 48,136 7,348
Deferred taxes (17) 6,952 6,787
Total external capital 1,014,020 669,059
Balance sheet total 1,412,760 1,019,598
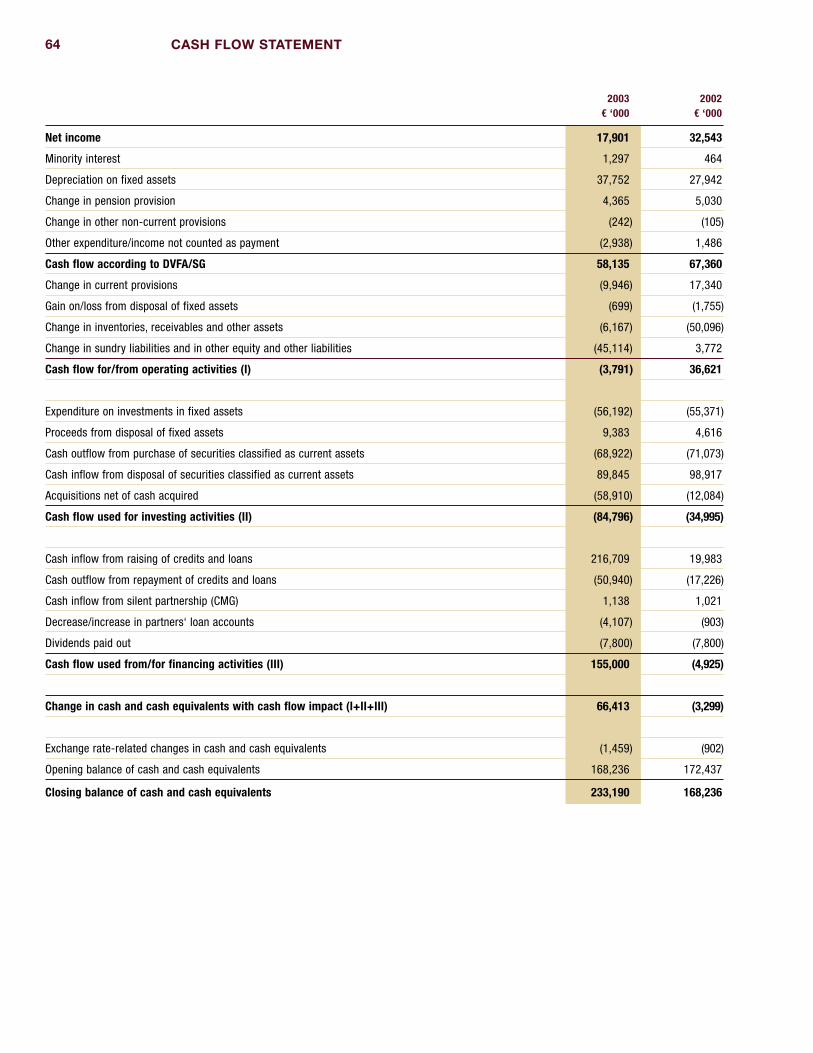
64 65
2003 2002 € ‘000 € ‘000
Net income 17,901 32,543
Minority interest 1,297 464
Depreciation on fixed assets 37,752 27,942
Change in pension provision 4,365 5,030
Change in other non-current provisions (242) (105)
Other expenditure/income not counted as payment (2,938) 1,486
Cash flow according to DVFA/SG 58,135 67,360
Change in current provisions (9,946) 17,340
Gain on/loss from disposal of fixed assets (699) (1,755)
Change in inventories, receivables and other assets (6,167) (50,096)
Change in sundry liabilities and in other equity and other liabilities (45,114) 3,772
Cash flow for/from operating activities (I) (3,791) 36,621
Expenditure on investments in fixed assets (56,192) (55,371)
Proceeds from disposal of fixed assets 9,383 4,616
Cash outflow from purchase of securities classified as current assets (68,922) (71,073)
Cash inflow from disposal of securities classified as current assets 89,845 98,917
Acquisitions net of cash acquired (58,910) (12,084)
Cash flow used for investing activities (II) (84,796) (34,995)
Cash inflow from raising of credits and loans 216,709 19,983
Cash outflow from repayment of credits and loans (50,940) (17,226)
Cash inflow from silent partnership (CMG) 1,138 1,021
Decrease/increase in partners‘ loan accounts (4,107) (903)
Dividends paid out (7,800) (7,800)
Cash flow used from/for financing activities (III) 155,000 (4,925)
Change in cash and cash equivalents with cash flow impact (I+II+III) 66,413 (3,299)
Exchange rate-related changes in cash and cash equivalents (1,459) (902)
Opening balance of cash and cash equivalents 168,236 172,437
Closing balance of cash and cash equivalents 233,190 168,236
CASH FLOW STATEMENT

64 65MOVEMENTS IN CONSOLIDATED EQUITY
Other Comprehensive Income
Additional Unrealized Derivative Subscribed Capital Revenue Currency minimum gains from financial capital reserves reserves translation liability securities instruments Total € ‘000 € ‘000 € ‘000 € ‘000 € ‘000 € ‘000 € ‘000 € ‘000
As at Oct. 1, 2001 78,000 38,347 147,813 5,240 (613) 0 0 268,787
Change in scope of consolidation 224 224
Dividend payments (7,800) (7,800)
Net income 32,543 32,543
Other comprehensive income (OCI) (951) (829) 255 0 (1,525)
As at Sept. 30, 2002/Oct. 1, 2002 78,000 38,347 172,780 4,289 (1,442) 255 0 292,229
Dividend payments (7,800) (7,800)
Net income 17,901 17,901
Other comprehensive income (OCI) (5,659) (1,087) 547 (3,655) (9,854)
As at Sept. 30, 2003 78,000 38,347 182,881 (1,370) (2,529) 802 (3,655) 292,476

66 67MOVEMENTS IN CONSOLIDATED FIXED ASSETS
Historical purchase or manufacturing cost Depreciation Net values
Changes in Depreciation Thereof Thereof As at Currency As at scope of Reclassifi- for financial Accumulated currency changes in scope As at As at Sept. 30, 2002 adjustment Oct. 1, 2002 consolidation* Additions Disposals cations year depreciation adjustments of consolidation Sept. 30, 2003 Prior year € ‘000 € ‘000 € ‘000 € ‘000 € ‘000 € ‘000 € ‘000 € ‘000 € ‘000 € ‘000 € ‘000 € ‘000 € ‘000
I. Intangible assets
1. Concessions, industrial and similar rights and
assets and licenses in such rights 16,548 (16) 16,532 2,862 2,068 1,795 43 2,517 11,331 (11) 2,645 8,379 8,572
2. Goodwill 19,936 (4) 19,932 35,958 0 0 0 0 8,459 (5) 0 47,431 11,473
3. Payments in advance 0 0 0 0 0 0 0 0 0 0 0 0 0
36,484 (20) 36,464 38,820 2,068 1,795 43 2,517 19,790 (16) 2,645 55,810 20,045
II. Tangible assets
1. Land, land rights and buildings including
buildings on third-party land 134,480 (4,022) 130,458 54,458 3,008 1,838 1,480 4,691 59,920 (611) 21,375 127,646 99,725
2. Plant and machinery 193,309 (1,423) 191,886 34,786 24,211 3,088 17,113 15,049 190,642 (638) 20,982 74,266 34,496
3. Other equipment, factory and office equipment 123,178 (1,056) 122,122 21,599 14,889 5,282 3,584 12,084 118,818 (649) 17,049 38,094 27,988
4. Payments in advance for construction work in progress 22,801 (132) 22,669 3,595 9,908 4,707 (22,220) 0 0 0 0 9,245 22,780
5. Capital lease 13,877 0 13,877 0 77 2,261 0 3,411 8,662 0 0 3,031 7,795
487,645 (6,633) 481,012 114,438 52,093 17,176 (43) 35,235 378,042 (1,898) 59,406 252,282 192,784
III. Financial assets
1. Shares in associated companies 12,100 (513) 11,587 13,481 3,544 1,407 0 0 449 0 0 26,756 11,651
2. Other investments 1,256 (26) 1,230 1,410 6 0 0 0 654 0 649 1,992 1,251
3. Long-term investments 36,528 (1,318) 35,210 0 2,010 1,175 0 0 0 0 0 36,045 36,527
4. Other loans 0 0 0 953 29 15 0 0 0 0 0 967 0
49,884 (1,857) 48,027 15,844 5,589 2,597 0 0 1,103 0 649 65,760 49,429
Total 574,013 (8,510) 565,503 169,102 59,750 21,568 0 37,752 398,935 (1,914) 62,700 373,852 262,258
* The values added are matched by depreciation and amortization of the period and accumulated depreciation.
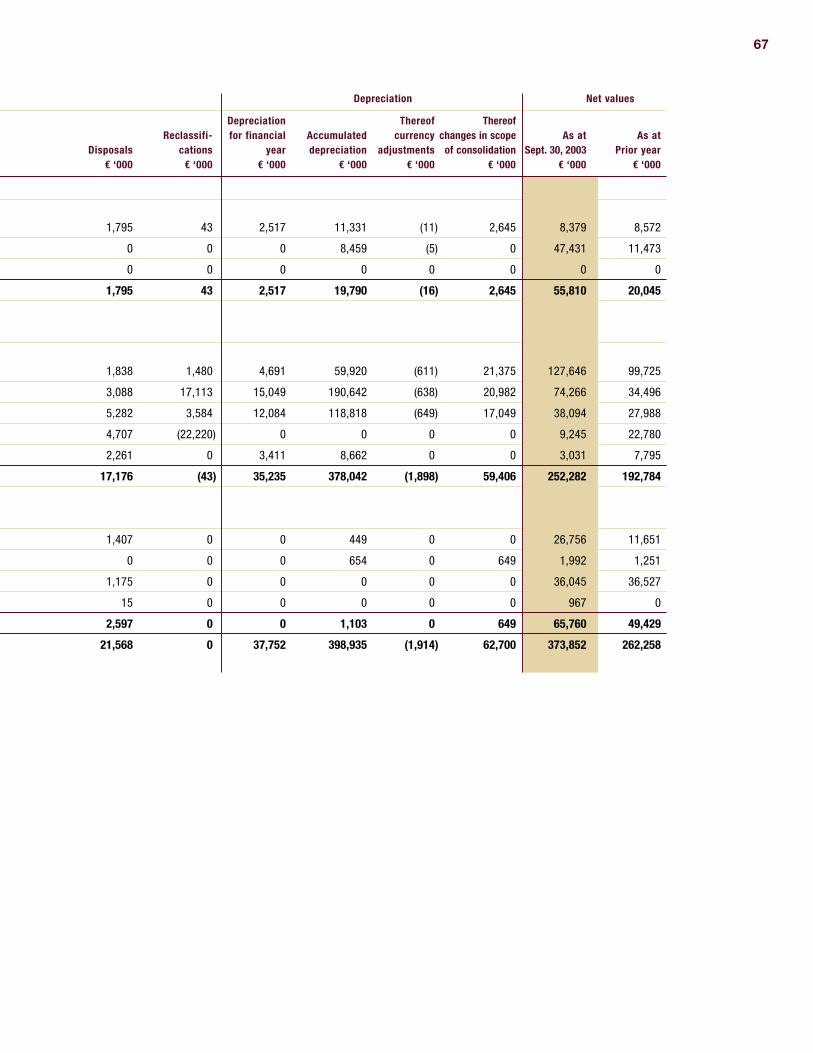
66 67
Historical purchase or manufacturing cost Depreciation Net values
Changes in Depreciation Thereof Thereof As at Currency As at scope of Reclassifi- for financial Accumulated currency changes in scope As at As at Sept. 30, 2002 adjustment Oct. 1, 2002 consolidation* Additions Disposals cations year depreciation adjustments of consolidation Sept. 30, 2003 Prior year € ‘000 € ‘000 € ‘000 € ‘000 € ‘000 € ‘000 € ‘000 € ‘000 € ‘000 € ‘000 € ‘000 € ‘000 € ‘000
I. Intangible assets
1. Concessions, industrial and similar rights and
assets and licenses in such rights 16,548 (16) 16,532 2,862 2,068 1,795 43 2,517 11,331 (11) 2,645 8,379 8,572
2. Goodwill 19,936 (4) 19,932 35,958 0 0 0 0 8,459 (5) 0 47,431 11,473
3. Payments in advance 0 0 0 0 0 0 0 0 0 0 0 0 0
36,484 (20) 36,464 38,820 2,068 1,795 43 2,517 19,790 (16) 2,645 55,810 20,045
II. Tangible assets
1. Land, land rights and buildings including
buildings on third-party land 134,480 (4,022) 130,458 54,458 3,008 1,838 1,480 4,691 59,920 (611) 21,375 127,646 99,725
2. Plant and machinery 193,309 (1,423) 191,886 34,786 24,211 3,088 17,113 15,049 190,642 (638) 20,982 74,266 34,496
3. Other equipment, factory and office equipment 123,178 (1,056) 122,122 21,599 14,889 5,282 3,584 12,084 118,818 (649) 17,049 38,094 27,988
4. Payments in advance for construction work in progress 22,801 (132) 22,669 3,595 9,908 4,707 (22,220) 0 0 0 0 9,245 22,780
5. Capital lease 13,877 0 13,877 0 77 2,261 0 3,411 8,662 0 0 3,031 7,795
487,645 (6,633) 481,012 114,438 52,093 17,176 (43) 35,235 378,042 (1,898) 59,406 252,282 192,784
III. Financial assets
1. Shares in associated companies 12,100 (513) 11,587 13,481 3,544 1,407 0 0 449 0 0 26,756 11,651
2. Other investments 1,256 (26) 1,230 1,410 6 0 0 0 654 0 649 1,992 1,251
3. Long-term investments 36,528 (1,318) 35,210 0 2,010 1,175 0 0 0 0 0 36,045 36,527
4. Other loans 0 0 0 953 29 15 0 0 0 0 0 967 0
49,884 (1,857) 48,027 15,844 5,589 2,597 0 0 1,103 0 649 65,760 49,429
Total 574,013 (8,510) 565,503 169,102 59,750 21,568 0 37,752 398,935 (1,914) 62,700 373,852 262,258

68 69RELATED COMPANIES AND SIGNIFICANT SHARES IN RELATED COMPANIESAs at September 30, 2003
Ser. Holdingno. Company Capital in % with
1 CLAAS Kommanditgesellschaft auf Aktien mbH, Harsewinkel € 78,000,000
2 CLAAS Selbstfahrende Erntemaschinen GmbH, Harsewinkel € 25,600,000 100 1
3 CLAAS Beteiligungsgesellschaft mbH, Harsewinkel € 52,000 100 48
4 CLAAS Saulgau GmbH, Bad Saulgau € 7,700,000 100 1
5 CLAAS Fertigungstechnik GmbH, Beelen € 5,300,000 100 1
6 CLAAS Automation GmbH, Nördlingen € 260,000 100 5
7 Brötje Automation GmbH, Wiefelstede € 1,030,000 51 5
8 CLAAS Industrietechnik GmbH, Paderborn € 7,700,000 100 1
9 CLAAS Vertriebsgesellschaft mbH, Harsewinkel € 3,100,000 100 1
10 Brandenburger Landtechnik GmbH, Liebenthal € 1,000,000 50.6 9
11 Landtechnik Steigra GmbH, Steigra € 615,000 90 9
12 Mühlengeez Landtechnik GmbH & Co. Handels KG, Mühlengeez € 52,000 100 9
13 Mühlengeez Landtechnik GmbH, Mühlengeez € 26,000 100 9
14 Semmenstedt Landtechnik GmbH, Semmenstedt € 500,000 100 9
15 CLAAS Württemberg GmbH, Langenau € 800,000 90 9
16 AGROCOM GmbH & Co. Agrarsystem KG, Bielefeld € 117,600 87.5 1
17 AGROCOM Verwaltungs GmbH, Bielefeld € 32,150 87.5 1
18 agrocom.Systempartner GmbH, Rostock € 26,000 60 16
19 CLAAS Osteuropa Investitions GmbH, Harsewinkel € 100,000 100 1
20 RENAULT Agriculture GmbH, Rosbach € 511,000 100 25
21 Pius Degenhart GmbH & Co. KG, Memmingen € 409,000 100 20
I. RELATED COMPANIES INCLUDED IN CONSOLIDATED FINANCIAL STATEMENTS
DOMESTIC
Ser. Holdingno. Company Capital in % with
22 CLAAS France Holding S.A.S., Paris/France € 21,009,001 100 1
23 Usines CLAAS France S.A.S., Metz-Woippy/France € 2,000,000 100 22
24 CLAAS France S.A.S., Paris/France € 8,842,043 100 22
25 RENAULT Agriculture S.A.S., Vélizy/France € 70,800,000 51 22
26 RENAULT Agriculture Ltd., Shipston on Stour/Great Britain £ 15,000 100 25
27 RENAULT Agriculture B.V., Lelystad/Netherlands € 204,210 100 25
28 RENAULT Agriculture & Sonlika International Plc., Port Louis/Mauritius US-$ 900,000 60 25
29 RENAULT Agriculture Holdings Co., Port Louis/Mauritius US-$ 5,402 100 25
30 CLAAS Holdings Ltd., Saxham/Great Britain £ 10,800,000 100 1
31 CLAAS U.K. Ltd., Saxham/Great Britain £ 101,100 100 30
32 J. Mann & Son Ltd., Saxham/Great Britain £ 3,627,448 100 31
33 Southern Harvesters Ltd., Saxham/Great Britain £ 150,000 100 31
34 Seward Agricultural Machinery Ltd., Doncaster/Great Britain £ 500,000 100 31
35 Kirby Agricultural Ltd., Market Harborough/Great Britain £ 100 100 32
FOREIGN

68 69
Ser. Holdingno. Company Capital in % with
36 Western Harvesters Ltd., Cheltenham/Great Britain £ 16,000 75 31
37 RW Marsh Ltd., Lincolnshire/Great Britain £ 440,000 75 31
38 S.I.S. Ltd., Coventry/Great Britain £ 45,000 100 5
39 Teleporters Ltd., Saxham/Great Britain £ 8,401,645 100 30
40 CLAAS Italia S.p.A., Vercelli/Italy € 2,600,000 100 1
41 CLAAS Ibérica S.A., Madrid/Spain € 3,307,500 100 1
42 CLAAS Hungaria Kft., Törökszentmiklos/Hungary HUF 552,740,000 100 1
43 CLAAS Finance B.V., Amsterdam/Netherlands € 18,151 100 1
44 OOO CLAAS Vostok, Moscow/Russia RUB 170,000 100 1
45 CLAAS Ukraina DP, Kiev/Ukraine UAH 30,000 100 1
46 Port Mellen S.A., Montevideo/Uruguay UYU 360,000 100 1
47 CLAAS Argentina S.A., Sunchales/Argentina ARS 12,000 100 1
48 CLAAS North America Holdings Inc., Omaha/Nebraska/US US-$ 700 100 1
49 CLAAS of America LLC., Columbus/Indiana/US US-$ 9,800,000 100 48
50 CLAAS Omaha LLC., Omaha/Nebraska/US US-$ 48,000,000 100 48/3
51 CLAAS North America Finance LLC., Omaha/Nebraska/US US-$ 0 100 48
52 CLAAS India Ltd., Faridabad/India INR 70,000,000 100 1
53 OOO CLAAS, Krasnodar/Russia RUB 350,000 99 19
II. SIGNIFICANT SHARES IN RELATED COMPANIES
Ser. Holdingno. Company Capital in % with
54 CLAAS GUSS GmbH, Bielefeld € 4,680,000 44.45 1/4
55 CS Parts Logistics GmbH, Bremen € 1,550,000 50 1
56 Mecklenburger Landtechnik GmbH, Mühlengeez € 1,000,000 50 9
57 Landtechnik-Zentrum Chemnitz GmbH, Hartmannsdorf € 750,000 40 9
58 Worch und Schütze Landtechnik GmbH, Schora € 55,000 39 9
59 CLAAS Valtra Finance Ltd., Basingstoke/Great Britain £ 3,000,000 49 30
60 CLAAS Financial Services S.A.S., Paris/France € 14,000,000 10 1
61 HMC Investments Ltd., Drogheda/Ireland € 152,369 49.57 1
62 Harvest Machinery (Sales) Ltd., Drogheda/Ireland € 126,974 11.83 1
63 International Tractors Ltd., New Delhi/India INR 55,113,640 20 25
64 G.I.M.A. S.A., Beauvais/France € 8,448,500 50 25
65 Agritalia S.p.A., Rovigo/Italy € 5,631,600 11 25
66 SCIMA, Schmitten/Switzerland CHF 425,000 16.7 25

70 71NOTES TO THE CONSOLIDATED FINANCIAL STATEMENTS
The consolidated financial statements of CLAAS KGaA mbH for the fi-
nancial year 2003 (October 1, 2002 to September 30, 2003) were pre-
pared in accordance with United States Generally Accepted Accounting
Principles (US GAAP). The financial statements have been supplemented
with a Group management report and further notes as required under
§ 292a of the German Commercial Code (HGB). The financial statements
therefore satisfy the requirements of exemption from the duty to pre-
pare consolidated financial statements in accordance with German
GAAP (HGB).
The cost of goods sold method of accounting has been applied to the
consolidated profit and loss account. In the interest of clear and con-
tinuous disclosure, the structures of the consolidated balance sheet and
of the consolidated profit and loss account are based upon the prin-
ciples of German commercial law. Amounts relating to prior years are
reported accordingly.
In order to improve the clarity of presentation, individual items within
the consolidated balance sheet and the consolidated profit and loss
account have been grouped. These items have been analyzed and ex-
plained in the notes to the financial statements.
Figures relating to prior years have been adjusted to the current
presentation format.
In accordance with § 264 (3) of the German Commercial Code, we are
not required to publish the annual financial statements in the Official
Gazette and neither are we required to prepare notes to the financial
statements and management reports, for our subsidiaries CLAAS Ferti-
gungstechnik GmbH, Beelen; CLAAS Industrietechnik GmbH, Paderborn;
CLAAS Selbstfahrende Erntemaschinen GmbH, Harsewinkel; CLAAS
Vertriebsgesellschaft mbH, Harsewinkel; CLAAS Saulgau GmbH, Bad
Saulgau and CLAAS Automation GmbH, Nördlingen.
1 | GENERAL INFORMATION
FULLY CONSOLIDATED ENTITIES
CLAAS KGaA mbH and all subsidiaries have been included in the con-
solidated financial statements. The consolidation represents a total of
53 companies (prior year: 42) including CLAAS KGaA mbH, 21 of which
are domestic, and 32 of which are foreign companies. Subsidiary com-
panies consolidated in accordance with the full consolidation method
are companies directly, or indirectly, controlled by the CLAAS KGaA mbH.
The list of shareholdings has been attached to this report.
ACQUISITIONS IN THE FINANCIAL YEAR
CLAAS acquired 51% of the shares in Brötje Automation GmbH from the
British based Baxi Group Ltd. with effect from December 1, 2002. Brötje
Automation is the technological leader of connecting and assembly tech-
nology in the aviation industry whose customers include Airbus, Boeing,
Bombardier-Shorts, and other renowned manufacturers. As a result of
close cooperation with Brötje Automation, CLAAS anticipates synergy
effects in the areas of distribution and technology transfer, as well as in
the compensation of seasonal fluctuations. The world market leader for
assembly cells for fuselages and wing components, based near Olden-
burg in northern Germany, realized sales of approximately € 40 million
in fiscal 2003, with approximately 220 employees. Brötje Automation
was included as a related company within the consolidated financial
statements of the financial year 2003 with effect from December 1,
2002. The purchase price amounted to € 12.6 million and, at the time of
the acquisition, Brötje Automation had net assets totaling € 26.9 million,
equity of € 3.5 million, and external capital of € 23.4 million. The good-
will on this acquisition amounts to approximately € 10.8 million. The
remaining shares will be acquired at the beginning of 2004, with the
purchase price being calculated on the same basis as the original ac-
quisition of shares.
With effect from April 30, 2003 CLAAS also acquired 51% shareholding
in Group RENAULT Agriculture S.A.S., based in Vélizy, France. RENAULT
Agriculture is the largest manufacturer of tractors in France, realizing
sales in excess of € 600 million in financial year 2002 with approx-
imately 2,000 employees. The integration of RENAULT Agriculture will
be of considerable benefit to the CLAAS Group as a result of comple-
mentary marketing networks, and the expanded product portfolio.
RENAULT Agriculture was consolidated into the CLAAS Group effective
May 1, 2003. The purchase price amounted to € 74.7 million and
the following chart illustrates the assets and liabilities of RENAULT
Agriculture at the time of acquisition:
€ million
Current assets 231.9
Tangible assets 53.6
Goodwill 24.9
Intangible assets 0.4
Financial assets 15.5
Prepaid expenses/deferred taxes 17.2
Total assets 343.5
Liabilities 161.0
Other provisions and deferred taxes/income 63.9
Minority interest 43.9
Purchase price 74.7
2 | SCOPE OF CONSOLIDATION
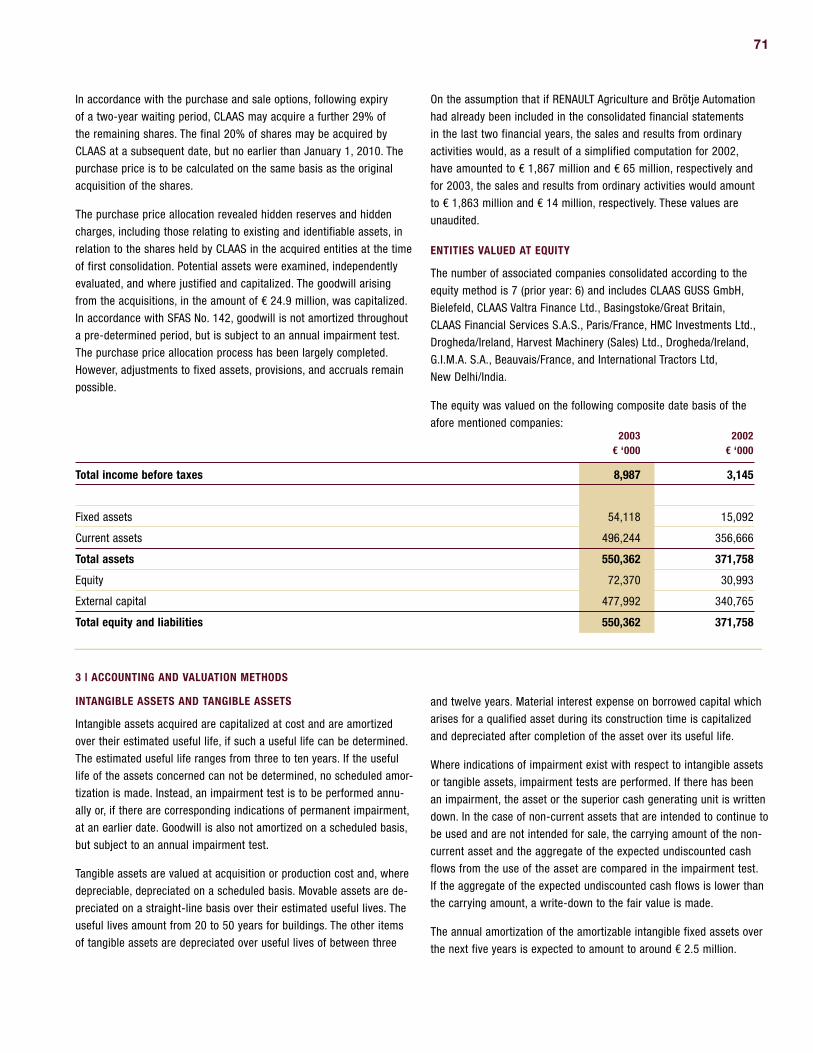
70 71
In accordance with the purchase and sale options, following expiry
of a two-year waiting period, CLAAS may acquire a further 29% of
the remaining shares. The final 20% of shares may be acquired by
CLAAS at a subsequent date, but no earlier than January 1, 2010. The
purchase price is to be calculated on the same basis as the original
acquisition of the shares.
The purchase price allocation revealed hidden reserves and hidden
charges, including those relating to existing and identifiable assets, in
relation to the shares held by CLAAS in the acquired entities at the time
of first consolidation. Potential assets were examined, independently
evaluated, and where justified and capitalized. The goodwill arising
from the acquisitions, in the amount of € 24.9 million, was capitalized.
In accordance with SFAS No. 142, goodwill is not amortized throughout
a pre-determined period, but is subject to an annual impairment test.
The purchase price allocation process has been largely completed.
However, adjustments to fixed assets, provisions, and accruals remain
possible.
On the assumption that if RENAULT Agriculture and Brötje Automation
had already been included in the consolidated financial statements
in the last two financial years, the sales and results from ordinary
activities would, as a result of a simplified computation for 2002,
have amounted to € 1,867 million and € 65 million, respectively and
for 2003, the sales and results from ordinary activities would amount
to € 1,863 million and € 14 million, respectively. These values are
unaudited.
ENTITIES VALUED AT EQUITY
The number of associated companies consolidated according to the
equity method is 7 (prior year: 6) and includes CLAAS GUSS GmbH,
Bielefeld, CLAAS Valtra Finance Ltd., Basingstoke/Great Britain,
CLAAS Financial Services S.A.S., Paris/France, HMC Investments Ltd.,
Drogheda/Ireland, Harvest Machinery (Sales) Ltd., Drogheda/Ireland,
G.I.M.A. S.A., Beauvais/France, and International Tractors Ltd,
New Delhi/India.
The equity was valued on the following composite date basis of the
afore mentioned companies: 2003 2002 € ‘000 € ‘000
Total income before taxes 8,987 3,145
Fixed assets 54,118 15,092
Current assets 496,244 356,666
Total assets 550,362 371,758
Equity 72,370 30,993
External capital 477,992 340,765
Total equity and liabilities 550,362 371,758
INTANGIBLE ASSETS AND TANGIBLE ASSETS
Intangible assets acquired are capitalized at cost and are amortized
over their estimated useful life, if such a useful life can be determined.
The estimated useful life ranges from three to ten years. If the useful
life of the assets concerned can not be determined, no scheduled amor-
tization is made. Instead, an impairment test is to be performed annu-
ally or, if there are corresponding indications of permanent impairment,
at an earlier date. Goodwill is also not amortized on a scheduled basis,
but subject to an annual impairment test.
Tangible assets are valued at acquisition or production cost and, where
depreciable, depreciated on a scheduled basis. Movable assets are de-
preciated on a straight-line basis over their estimated useful lives. The
useful lives amount from 20 to 50 years for buildings. The other items
of tangible assets are depreciated over useful lives of between three
and twelve years. Material interest expense on borrowed capital which
arises for a qualified asset during its construction time is capitalized
and depreciated after completion of the asset over its useful life.
Where indications of impairment exist with respect to intangible assets
or tangible assets, impairment tests are performed. If there has been
an impairment, the asset or the superior cash generating unit is written
down. In the case of non-current assets that are intended to continue to
be used and are not intended for sale, the carrying amount of the non-
current asset and the aggregate of the expected undiscounted cash
flows from the use of the asset are compared in the impairment test.
If the aggregate of the expected undiscounted cash flows is lower than
the carrying amount, a write-down to the fair value is made.
The annual amortization of the amortizable intangible fixed assets over
the next five years is expected to amount to around € 2.5 million.
3 | ACCOUNTING AND VALUATION METHODS
NOTES TO THE CONSOLIDATED FINANCIAL STATEMENTS72 73
INVESTMENTS
If it is possible to exercise significant influence, investments in asso-
ciated companies and in joint ventures are accounted for at the relevant
proportion of equity capital (application of the equity method). The other
investments are classified as securities that are neither part of the trad-
ing portfolio nor held to maturity (»available for sale«) if the shares held
by CLAAS are listed on a stock exchange or fair values are publicly avail-
able. If there is no publicly available fair value of other investments,
they are accounted for at cost (possibly less write-downs).
SECURITIES
According to SFAS No. 115, securities are classified into three catego-
ries: »held to maturity», »available for sale» and »trading». The securi-
ties held by CLAAS are either securities held to maturity or available for
sale within the last three months before final maturity (»held to matur-
ity«) or securities that are neither part of the trading portfolio nor held
to maturity (»available for sale«). Securities classified as »held to matur-
ity« are carried at amortized cost. Securities classified as »available for
sale« are valued at fair values (if available). In a separate equity item,
other comprehensive income, unrealized income from, and expenses
on, »available for sale« securities are disclosed without profit and loss
impact, taking into account deferred taxes.
DERIVATIVE FINANCIAL INSTRUMENTS AND HEDGE ACCOUNTING
CLAAS Group uses derivative financial instruments such as swaps, ex-
change futures, interest rate swap options, forward interest rate dealings,
caps and floors for hedging purposes. Under SFAS No. 133 »Accounting
for Derivative Instruments and Hedging Activities», all derivative financial
instruments are required to be reported in the balance sheet either as
an asset or as a liability at their respective fair values. If there is a clear
hedging connection, hedge accounting (setting up valuation units) is
possible. With hedge accounting, the fair value changes of the deriva-
tives depend on the type of the hedge. In the case of a cash flow hedge,
fair value changes of the effective part of the derivative are initially
booked in equity (other comprehensive income) and not released with
profit and loss impact until the underlying transaction is recognized in
income. The ineffective part of a hedge is recognized as incurred. Fair
value changes of the derivative in the case of a fair value hedge are
recognized with profit and loss impact together with the fair value
changes of the underlying transaction.
FAIR VALUES OF FINANCIAL INSTRUMENTS
Under US GAAP, financial instruments include derivative financial instru-
ments (e.g. swaps, options) and original financial instruments (at the
level of CLAAS, e.g. participation certificates, silent partnership, bonds,
receivables, payables, cash and cash equivalents). Under US GAAP, the
fair value of a financial instrument indicates the value at which a finan-
cial instrument can be traded among unrelated parties dealing at arm‘s
length if there are parties willing to buy and sell and the transaction con-
cerned is not a compulsory or winding-up sale. Where the fair values of
financial instruments are not stated explicitly, they do not or only insig-
nificantly deviate from the carrying amounts.
INVENTORIES
Inventories are stated at the lower of cost or market. Raw materials,
consumables and supplies as well as merchandise are capitalized at
average cost, work in process and finished goods at production-related
full cost, i.e. apart from direct material and prime cost, the directly
allocable parts of necessary indirect material and production overhead
and production-related administration expenses are also capitalized.
Inventory risks that result from reduced likelihood of full utilization, as
well as disposal risks based on the estimate of realizable sale prices
are taken into account through depreciation.
RECEIVABLES
Receivables and other assets are recognized in the balance sheet at
face value. Adequate allowances are made for anticipated non-payment
risks. Non-interest-bearing receivables that are not expected to be
collected within the normal payment cycle (usually 1 year) are dis-
counted.
The percentage of completion method (PoC method) is applied to long-
term construction contracts. The amount required to be capitalized is
disclosed under receivables at the same time, sales revenues are rea-
lized. The stage of completion is determined according to the expenses
incurred. At each balance sheet date, existing contracts are reviewed in
respect of potential risks. In the case of anticipated losses, correspond-
ing allowances or provisions are made.
CASH AND CASH EQUIVALENTS
Under US GAAP, cash and cash equivalents include also securities with
a remaining term at the time of acquisition of up to 90 days. The cash
and cash equivalents disclosed in the cash flow statement correspond
to the cash and cash equivalents in the balance sheet.
PROVISIONS/LIABILITIES
Pension obligations are measured through actuarial methods according
to the projected unit credit method. With this method, not only the
pensions and accrued vested rights known at the balance sheet date
are taken into account but also future anticipated pay rises and pension
increases. Actuarial gains and losses which are outside a range of 10%
of the scope of commitments are distributed over the average residual
period of service.

NOTES TO THE CONSOLIDATED FINANCIAL STATEMENTS72 73
Other provisions are provided for all commitments identifiable as at the
balance sheet date that are based on past business transactions or past
events and the amount and/or due date of which are uncertain. They
are valued at the amount repayable and are not netted with positive
profit contributions. If the amount repayable is uncertain, the repayment
amount with the highest probability of occurrence is taken as a basis.
Provisions are only made if there is an underlying legal or de facto
obligation towards third parties.
Liabilities are generally carried at the amount at which they will be
repaid; liabilities denominated in a foreign currency are translated at
the rate in effect at the balance sheet date.
CURRENT AND DEFERRED TAXES ON INCOME
Deferred taxes are determined according to SFAS No. 109 »Accounting
for Income Taxes». They reflect future reductions or increases in the tax
burden that arise from temporary differences between consolidated
balance sheet and tax balance sheet. The deferred tax assets also com-
prise tax reduction claims arising from the expected realization of exist-
ing loss carryforwards in subsequent years and the realization of which
is sufficiently probable. Deferred taxes are computed using the tax rate
that will be authoritative according to the present legal situation at the
probable compensation time of the temporary differences. Abroad, tax
rates specific to the country are used. An allowance is made on deferred
tax assets if there is a sufficiently high likelihood that not all deferred
tax assets can be realized in future through fiscal profits or if the reali-
zation is limited in time.
SALES RECOGNITION
Sales are recognized after passage of risk to the customer and perform-
ed delivery or service.
In the case of long-term production orders, sales are recorded accord-
ing to the percentage of completion method (PoC method) in line with
reaching contractually agreed milestones or performance progress.
The sets of financial statements of the individual companies are pre-
pared on a uniform basis for inclusion in the consolidated financial state-
ments according to the accounting and valuation guidelines existing for
the CLAAS Group. All sets of financial statements are in principle pre-
pared as at September 30.
For the purposes of capital consolidation, the book values of the invest-
ments are offset against the proportionate revalued shareholders’ equity
of the subsidiaries at the date of acquisition. Any residual debit differ-
ences are capitalized as goodwill and subject to an annual impairment
test. Any arising credit difference is written down taking into account
deferred taxes and offset against non-current non-monetary assets. To
the extent that the credit difference exceeds the acquired company’s
assets that can be written down, extraordinary income is reported.
Investments in associated companies are valued according to the equity
method. In respect of the elimination of intercompany relationships, the
principles applied are consistent with those applied for the purposes of
full consolidation.
Receivables and payables, net sales as well as income and expenses
between consolidated entities are eliminated. Stocks from intercompany
deliveries included in inventories are adjusted for unrealized profits and
losses on intra-group transactions.
Consolidation measures with profit and loss impact take into account
deferred taxes to the extent that the deviating tax charge is likely to be
balanced in later financial years. Deferred tax assets and liabilities are
eliminated where applicable.
4 | CONSOLIDATION PRINCIPLES

NOTES TO THE CONSOLIDATED FINANCIAL STATEMENTS74 75
The currency translation according to SFAS No. 52 is based on the con-
cept of functional currency. The functional currency is the currency pre-
dominating in the environment in which an entity operates. As a rule,
this is the currency in which cash and cash equivalents are generated
and used.
In the consolidated financial statements, all balance sheet items of for-
eign entities are translated at rate of exchange as at the balance sheet
date, and expenses and income are translated at the average rate of
the financial year. The translation adjustments resulting from currency
translations in the balance sheets are disclosed without profit and loss
impact in equity.
The following exchange rates were used for countries that are Non-
European Monetary Union members:
5 | CURRENCY TRANSLATION
Average Balance Sheet Date
2003 2002 2003 2002 in € in € in € in €
1 US dollar 0.92 1.09 0.86 1.02
1 Pound Sterling 1.47 1.60 1.43 1.59
1 Ukrainian griwna 0.17 0.20 0.16 0.19
100 Hungarian forints 0.40 0.41 0.39 0.41
100 Indian rupees 1.95 2.24 1.87 2.10
100 Russian roubles 2.95 3.51 2.79 3.20
CLAAS Group companies are involved in various legal and official pro-
ceedings within the framework of general operations or such proceed-
ings could be initiated or asserted in future (e.g. concerning patents,
product liability and competition). Even if the outcome of individual pro-
ceedings cannot be predicted with certainty with a view to the unfore-
seeable events associated with legal disputes, according to current
estimate, there will be no significantly adverse impact on the Group‘s
results of operations beyond the risks taken into account as liabilities,
provisions or accruals in the financial statements.
6 | LITIGATION AND DAMAGE CLAIMS
Estimates and assumptions that influence the recognized assets and
liabilities, the recognition of contingent liabilities as at the balance sheet
date and the disclosure of income and expenses during the reporting
period must be made to a certain degree in the consolidated financial
statements. The amounts actually arising can deviate from the esti-
mates.
7 | USE OF ESTIMATES
In June 2002, the FASB issued Standard SFAS No. 146 »Accounting for
Costs Associated with Exit or Disposal Activities«. This standard replaces
EITF Issue No. 94-3 »Liability Recognition for Certain Employee Termina-
tion Benefits and Other Costs to Exit an Activity (Including Certain Costs
Incurred in a Restructuring)«. SFAS No. 146 governs, among other things,
the accounting for costs of disposal of businesses or closure costs. It
applies to disposals of businesses and closure activities that are com-
menced after December 31, 2002. SFAS No. 146 was adopted for the
first time in the past financial year.
In November 2002, the FASB issued Financial Interpretation No. 45
»Guarantor’s Accounting and Disclosure Requirements for Guarantees«
(FIN No. 45), which governs the accounting for commitments under
guarantees. Its accounting and valuation requirements are applicable
to guarantees granted or modified after December 31, 2002. FIN No. 45
was adopted for the first time in the past financial year.
In January 2003, the FASB issued Financial Interpretation No. 46 »Con-
solidation of Variable Interest Entities«. It complements the regulation
of ARB No. 51 »Consolidated Financial Statements«. This Standard lays
down new requirements for the duty to consolidate variable interest
entities (VIEs) depending on the assumption of major opportunities and
risks from the company. Qualifying special-purpose entities (QSPEs) in
terms of SFAS No. 140 are explicitly excluded from the scope of appli-
cation of FIN No. 46. CLAAS, in its capacity as a nonpublic enterprise,
has to adopt FIN No. 46 from the financial year 2004 onwards.
8 | NEW ACCOUNTING STANDARDS
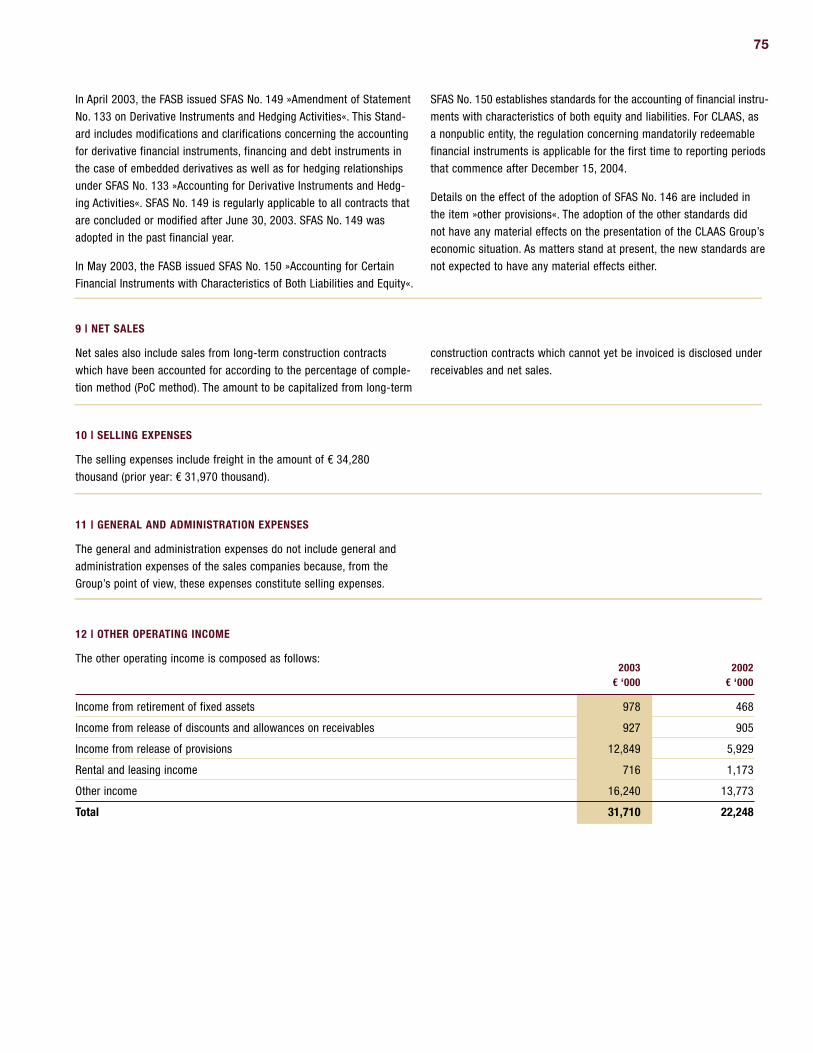
NOTES TO THE CONSOLIDATED FINANCIAL STATEMENTS74 75
In April 2003, the FASB issued SFAS No. 149 »Amendment of Statement
No. 133 on Derivative Instruments and Hedging Activities«. This Stand-
ard includes modifications and clarifications concerning the accounting
for derivative financial instruments, financing and debt instruments in
the case of embedded derivatives as well as for hedging relationships
under SFAS No. 133 »Accounting for Derivative Instruments and Hedg-
ing Activities«. SFAS No. 149 is regularly applicable to all contracts that
are concluded or modified after June 30, 2003. SFAS No. 149 was
adopted in the past financial year.
In May 2003, the FASB issued SFAS No. 150 »Accounting for Certain
Financial Instruments with Characteristics of Both Liabilities and Equity«.
SFAS No. 150 establishes standards for the accounting of financial instru-
ments with characteristics of both equity and liabilities. For CLAAS, as
a nonpublic entity, the regulation concerning mandatorily redeemable
financial instruments is applicable for the first time to reporting periods
that commence after December 15, 2004.
Details on the effect of the adoption of SFAS No. 146 are included in
the item »other provisions«. The adoption of the other standards did
not have any material effects on the presentation of the CLAAS Group’s
economic situation. As matters stand at present, the new standards are
not expected to have any material effects either.
Net sales also include sales from long-term construction contracts
which have been accounted for according to the percentage of comple-
tion method (PoC method). The amount to be capitalized from long-term
construction contracts which cannot yet be invoiced is disclosed under
receivables and net sales.
9 | NET SALES
The selling expenses include freight in the amount of € 34,280
thousand (prior year: € 31,970 thousand).
10 | SELLING EXPENSES
The general and administration expenses do not include general and
administration expenses of the sales companies because, from the
Group’s point of view, these expenses constitute selling expenses.
11 | GENERAL AND ADMINISTRATION EXPENSES
The other operating income is composed as follows:
12 | OTHER OPERATING INCOME
2003 2002 € ‘000 € ‘000
Income from retirement of fixed assets 978 468
Income from release of discounts and allowances on receivables 927 905
Income from release of provisions 12,849 5,929
Rental and leasing income 716 1,173
Other income 16,240 13,773
Total 31,710 22,248

NOTES TO THE CONSOLIDATED FINANCIAL STATEMENTS76 77
13 | OTHER OPERATING EXPENSES
2003 2002 € ‘000 € ‘000
Loss from disposal of fixed assets 281 86
Allowances on receivables 779 1,508
Other expenses 27,223 26,332
Total 28,283 27,926
The other expenses comprise a number of minor items, e.g. expenses
for litigation, fees and charges and personnel expenses not related to
specific functions.
14 | INCOME FROM INVESTMENTS
2003 2002 € ‘000 € ‘000
Income from other investments 199 133
Net income from investments in associated companies 2,345 1,693
Gain on/loss from disposal of investments 0 0
Write-downs on investments 0 0
Total 2,544 1,826
The net income from investments includes all income and expenses
realized and incurred in connection with the holding or the disposal of
not fully consolidated investments.
2003 2002INCOME FROM INTEREST AND SECURITIES € ‘000 € ‘000
Interest expenses (25,964) (22,081)
Interest income 11,936 10,889
Proceeds from other securities and non-current financial investments 808 1,094
Loss from disposal of securities 0 (14)
Gain on disposal of securities 2 1,387
Write-ups of financial assets (excluding investments) and other investments classified as current assets 0 9
Total (13,218) (8,716)
The income from interest and securities includes all income and
expenses realized and incurred in connection with the holding or the
disposal of securities or financial assets other than investments.
15 | FINANCIAL INCOME
The financial income is comprised of the two components »income from
interest and securities« and »other financial income«.
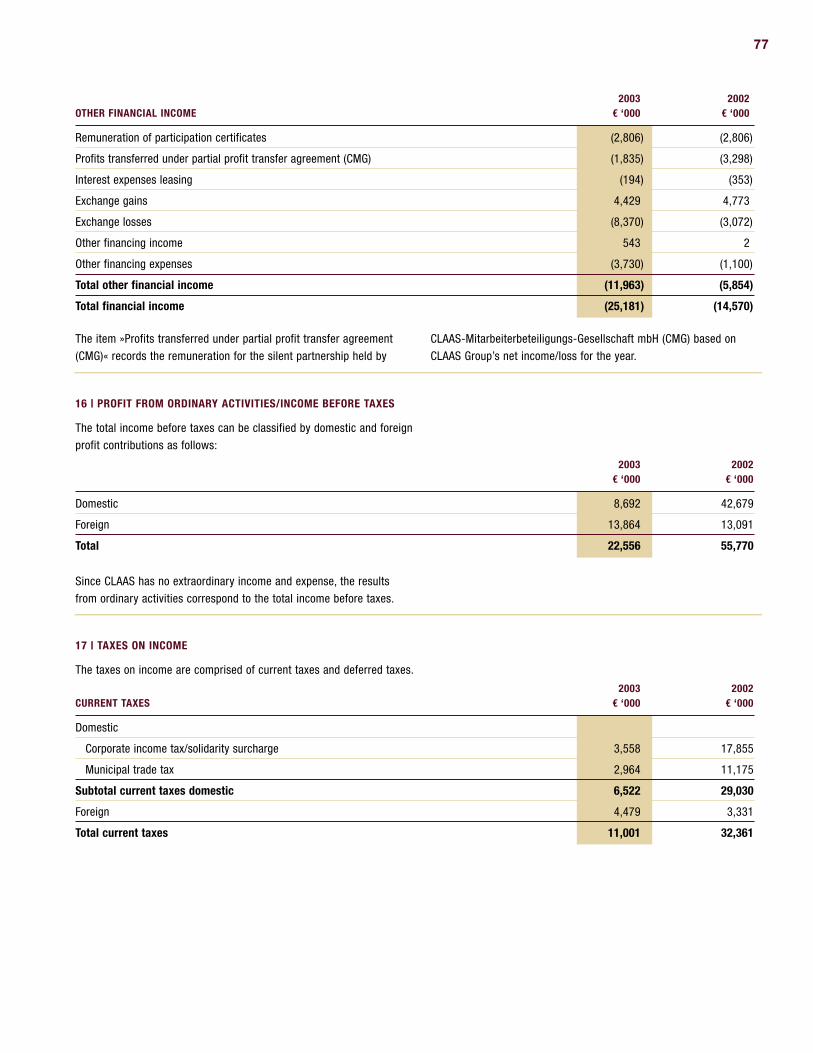
NOTES TO THE CONSOLIDATED FINANCIAL STATEMENTS76 77
The total income before taxes can be classified by domestic and foreign
profit contributions as follows:
16 | PROFIT FROM ORDINARY ACTIVITIES/INCOME BEFORE TAXES
2003 2002OTHER FINANCIAL INCOME € ‘000 € ‘000
Remuneration of participation certificates (2,806) (2,806)
Profits transferred under partial profit transfer agreement (CMG) (1,835) (3,298)
Interest expenses leasing (194) (353)
Exchange gains 4,429 4,773
Exchange losses (8,370) (3,072)
Other financing income 543 2
Other financing expenses (3,730) (1,100)
Total other financial income (11,963) (5,854)
Total financial income (25,181) (14,570)
The item »Profits transferred under partial profit transfer agreement
(CMG)« records the remuneration for the silent partnership held by
CLAAS-Mitarbeiterbeteiligungs-Gesellschaft mbH (CMG) based on
CLAAS Group’s net income/loss for the year.
2003 2002 € ‘000 € ‘000
Domestic 8,692 42,679
Foreign 13,864 13,091
Total 22,556 55,770
Since CLAAS has no extraordinary income and expense, the results
from ordinary activities correspond to the total income before taxes.
The taxes on income are comprised of current taxes and deferred taxes.
17 | TAXES ON INCOME
2003 2002CURRENT TAXES € ‘000 € ‘000
Domestic
Corporate income tax/solidarity surcharge 3,558 17,855
Municipal trade tax 2,964 11,175
Subtotal current taxes domestic 6,522 29,030
Foreign 4,479 3,331
Total current taxes 11,001 32,361
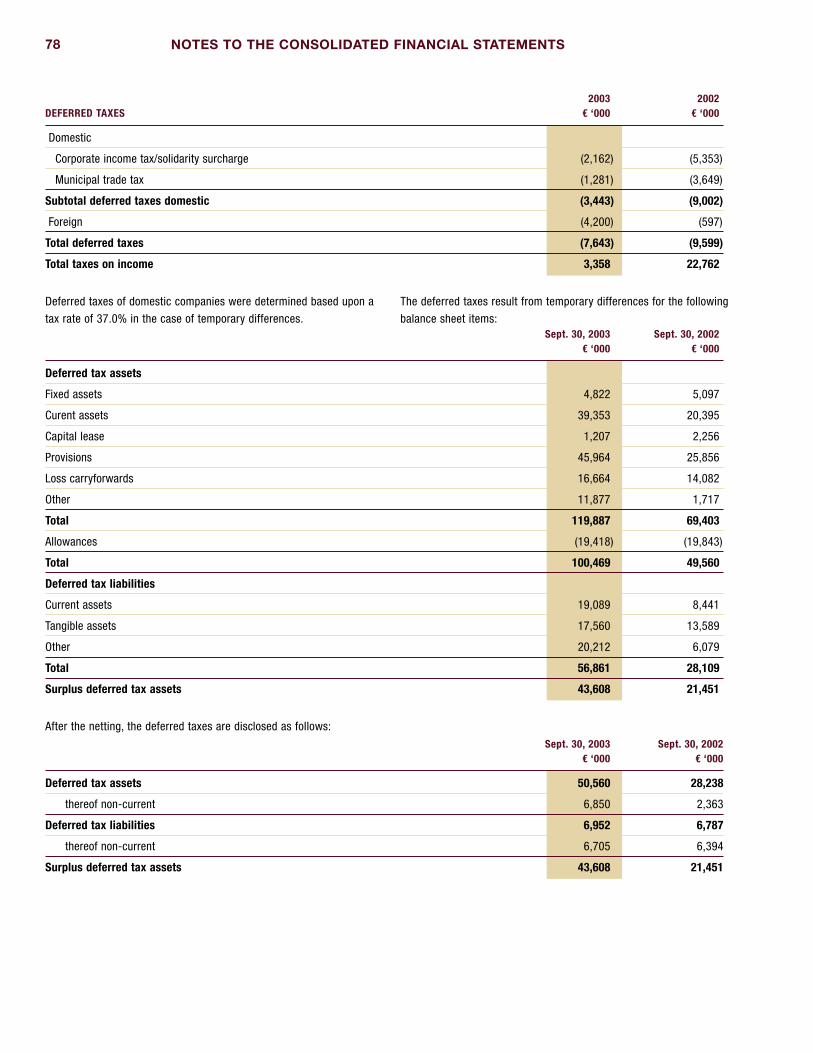
2003 2002DEFERRED TAXES € ‘000 € ‘000
Domestic
Corporate income tax/solidarity surcharge (2,162) (5,353)
Municipal trade tax (1,281) (3,649)
Subtotal deferred taxes domestic (3,443) (9,002)
Foreign (4,200) (597)
Total deferred taxes (7,643) (9,599)
Total taxes on income 3,358 22,762
Deferred taxes of domestic companies were determined based upon a
tax rate of 37.0% in the case of temporary differences.
The deferred taxes result from temporary differences for the following
balance sheet items: Sept. 30, 2003 Sept. 30, 2002 € ‘000 € ‘000
Deferred tax assets
Fixed assets 4,822 5,097
Curent assets 39,353 20,395
Capital lease 1,207 2,256
Provisions 45,964 25,856
Loss carryforwards 16,664 14,082
Other 11,877 1,717
Total 119,887 69,403
Allowances (19,418) (19,843)
Total 100,469 49,560
Deferred tax liabilities
Current assets 19,089 8,441
Tangible assets 17,560 13,589
Other 20,212 6,079
Total 56,861 28,109
Surplus deferred tax assets 43,608 21,451
After the netting, the deferred taxes are disclosed as follows:
Sept. 30, 2003 Sept. 30, 2002 € ‘000 € ‘000
Deferred tax assets 50,560 28,238
thereof non-current 6,850 2,363
Deferred tax liabilities 6,952 6,787
thereof non-current 6,705 6,394
Surplus deferred tax assets 43,608 21,451
NOTES TO THE CONSOLIDATED FINANCIAL STATEMENTS78
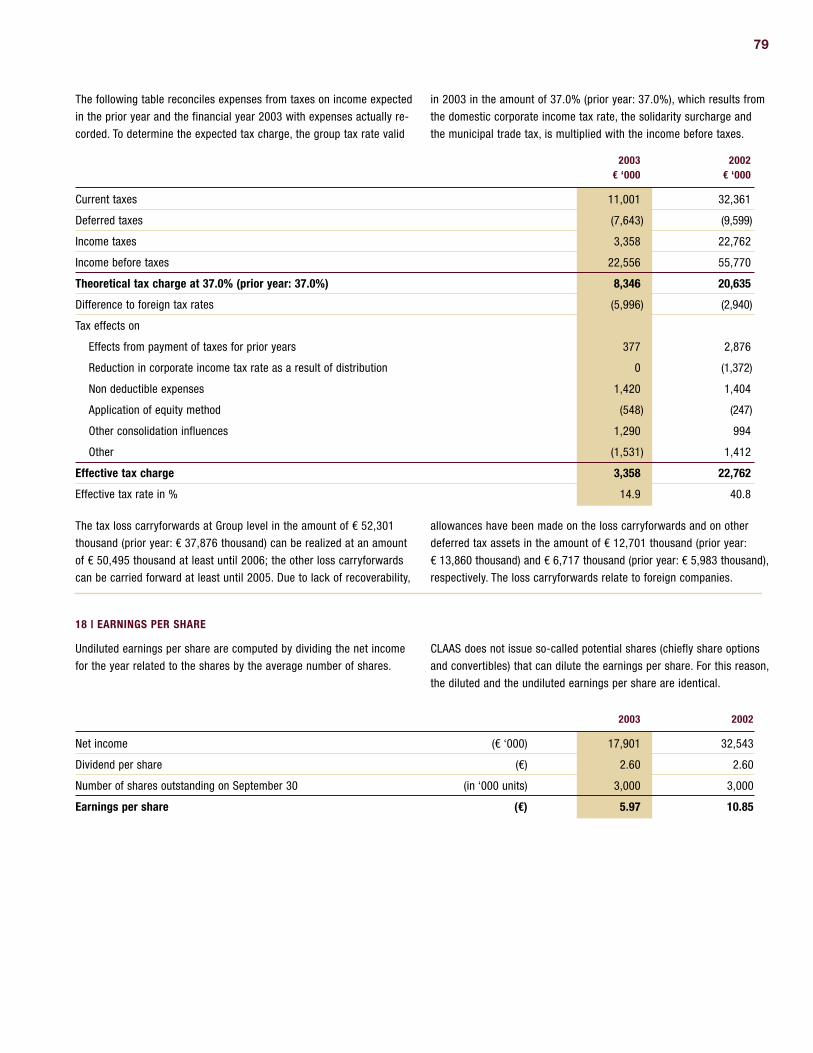
The following table reconciles expenses from taxes on income expected
in the prior year and the financial year 2003 with expenses actually re-
corded. To determine the expected tax charge, the group tax rate valid
in 2003 in the amount of 37.0% (prior year: 37.0%), which results from
the domestic corporate income tax rate, the solidarity surcharge and
the municipal trade tax, is multiplied with the income before taxes.
2003 2002 € ‘000 € ‘000
Current taxes 11,001 32,361
Deferred taxes (7,643) (9,599)
Income taxes 3,358 22,762
Income before taxes 22,556 55,770
Theoretical tax charge at 37.0% (prior year: 37.0%) 8,346 20,635
Difference to foreign tax rates (5,996) (2,940)
Tax effects on
Effects from payment of taxes for prior years 377 2,876
Reduction in corporate income tax rate as a result of distribution 0 (1,372)
Non deductible expenses 1,420 1,404
Application of equity method (548) (247)
Other consolidation influences 1,290 994
Other (1,531) 1,412
Effective tax charge 3,358 22,762
Effective tax rate in % 14.9 40.8
The tax loss carryforwards at Group level in the amount of € 52,301
thousand (prior year: € 37,876 thousand) can be realized at an amount
of € 50,495 thousand at least until 2006; the other loss carryforwards
can be carried forward at least until 2005. Due to lack of recoverability,
allowances have been made on the loss carryforwards and on other
deferred tax assets in the amount of € 12,701 thousand (prior year:
€ 13,860 thousand) and € 6,717 thousand (prior year: € 5,983 thousand),
respectively. The loss carryforwards relate to foreign companies.
Undiluted earnings per share are computed by dividing the net income
for the year related to the shares by the average number of shares.
CLAAS does not issue so-called potential shares (chiefly share options
and convertibles) that can dilute the earnings per share. For this reason,
the diluted and the undiluted earnings per share are identical.
18 | EARNINGS PER SHARE
2003 2002
Net income (€ ‘000) 17,901 32,543
Dividend per share (€) 2.60 2.60
Number of shares outstanding on September 30 (in ‘000 units) 3,000 3,000
Earnings per share (€) 5.97 10.85
79

The movements in fixed assets of CLAAS Group in the financial year
2003 are presented on pages 66 and 67.
The additions to intangible assets relate primarily to the goodwill
arising upon the first-time consolidation of RENAULT Agriculture and
Brötje Automation.
The additions to shares in associated companies include also the pro-
portionate net income for the year of the companies accounted for at
equity. Accordingly, the distributions made by the associated companies
that were realized in the sets of individual financial statements and that
are to this extent required to be consolidated are disclosed as disposals
under this item.
The additions to long-term investments include also reinvested interest
income.
Total depreciation on tangible assets and amortization of intangible
assets amounts to € 35,235 thousand (prior year: € 25,976 thousand)
and € 2,517 thousand (prior year: € 1,966 thousand), respectively.
19 | FIXED ASSETS
Sept. 30, 2003 Sept. 30, 2002 € ‘000 € ‘000
Held to maturity securities 0 1,124
Available for sale securities 36,045 35,403
Total long-term investments 36,045 36,527
The fair values of the held to maturity securities differ only insignifi-
cantly from their carrying amounts.
As of September 30, 2003, payments received in the amount of
€ 39,450 thousand (prior year: € 39,688 thousand) were offset in
finished goods and merchandise.
20 | INVENTORIES
Sept. 30, 2003 Sept. 30, 2002 € ‘000 € ‘000
Raw materials, consumables and supplies 44,011 36,283
Work in process 58,483 35,271
Finished goods and merchandise 220,589 126,153
Payments made on account 14,470 9,351
Total 337,553 207,058
Accounts receivable and other assets are composed as follows:
21 | ACCOUNTS RECEIVABLE AND OTHER ASSETS
Sept. 30, 2003 Sept. 30, 2002 € ‘000 € ‘000
Trade receivables 179,905 139,487
Receivables from companies in which investments are held 7,969 1,067
PoC receivables 23,292 15,151
Other assets 74,844 50,710
Total 286,010 206,415
€ 2,264 thousand (prior year: € 2,674 thousand) of the trade receiv-
ables have a remaining term of more than one year. The other assets
include assets of € 13,683 thousand (€ 16,313 thousand) with a remain-
ing term of more than one year.
NOTES TO THE CONSOLIDATED FINANCIAL STATEMENTS80

CLAAS sells trade receivables through a continuous ABS program to
a special-purpose entity that is refinanced by issuing securities in
the international capital market. On account of the revolving sale of
receivables, the cash flows are netted between CLAAS and the special-
purpose entity at the effective settlement dates.
The receivables are sold by CLAAS to the special-purpose entity without
repurchase or guarantee agreements. Under SFAS No. 140, the sale of
the accounts receivable is a so-called »true sale«.
Within the scope of the ABS transaction, CLAAS performs bookkeeping,
receivables collection, and dunning services and receives a corres-
ponding remuneration (service fee) from the special-purpose entity.
The upper limit for the program usage is € 114,000 thousand. Due
to seasonal fluctuations, the volume of receivables sold varies in the
course of the year; at the financial year end, the volume of the receiv-
ables sold amounted to € 30,861 thousand (prior year: € 40,740 thou-
sand). The volume as a percentage of the total receivables portfolio
before the sale at the financial year end was 14.6% (prior year: 22.6%).
Maturity as at the year end of financial assets sold:
22 | ASSET-BACKED SECURITIES
MATURITY IN MONTHS 1 2 3 4 More than 5 Total pool
€ ‘000 16,528 2,458 527 9,030 2,318 30,861
The special-purpose entity is a so-called qualifying special-purpose
entity (QSPE) according to SFAS No. 140, which is not included in the
group of entities consolidated at CLAAS Group.
2003 2002FURTHER KEY ELEMENTS OF THE ABS TRANSACTION € ‘000 € ‘000
Receivables portfolio as at September 30 30,861 40,740
Subordinated loan furnished as a collateral 532 532
Service fee received (accumulated) 1,432 1,312
Cash inflow from receivables sold as at September 30 19,246 26,125
Fair value of retained interests 1,817 1,676
Fair value adjustment 309 407
Trust liability as at September 30 6,030 17,975
According to SFAS No. 140 retained interests resulting from the
ABS transaction are required to be capitalized. The first valuation is
generally made by apportioning the previous carrying amount of the
portfolio sold into the portion sold and the retained interests in relation
to their fair value. The valuation of retained interests is made at fair
value, which has to be established on the basis of anticipated cash
inflows. For reasons of simplification, these are derived from the anti-
cipated future receipts of payment on the basis of discounted future
cash inflows.
The amount of retained interests can be affected by different underlying
assumptions and risks (e.g. anticipated loss of receivables outstanding).
The very low historical default rate is a measure of orientation that can
be applied in valuing these receipts of payment. A strong negative devia-
tion from this value is anticipated for the future only in the case of sig-
nificant macroeconomic changes. To estimate the influence of such
changes, a hypothetical analysis of an increase by 10% and 20% in
the loss of outstanding receivables was made. The fair value of the
anticipated default rate, by means of which the value of the anticipated
receipts of payment on account of retained interests is then computed
for the different scenarios, was established on this basis.
81
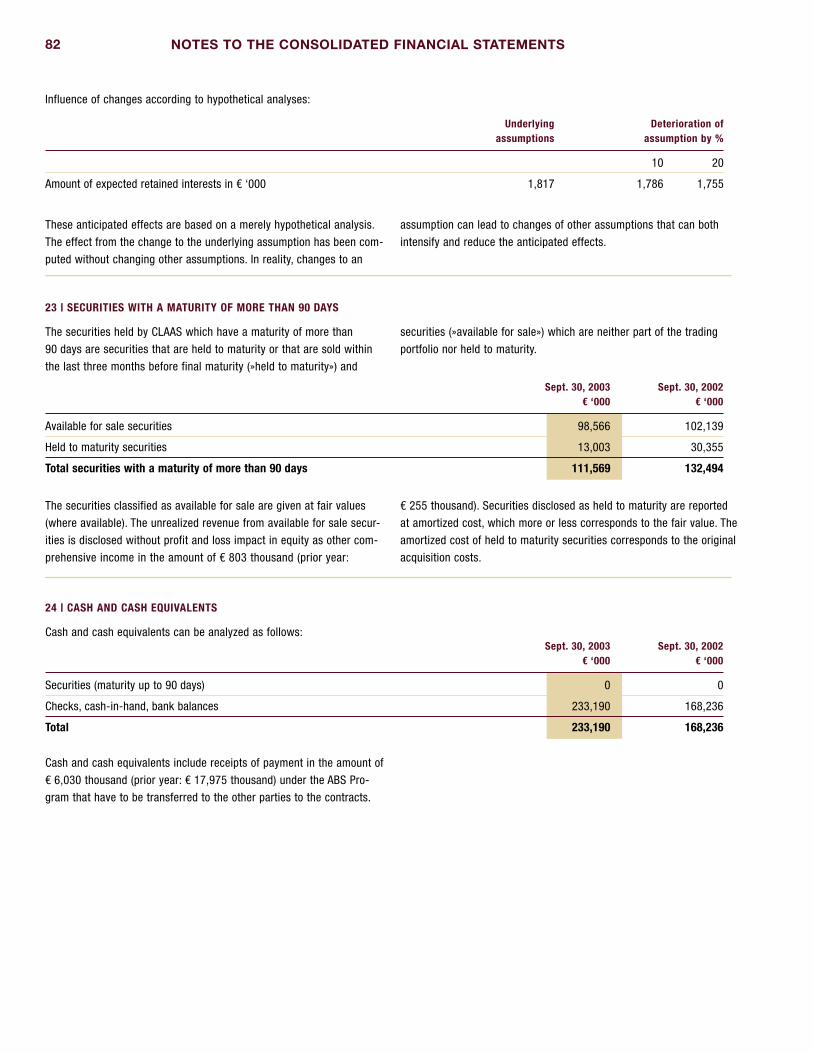
NOTES TO THE CONSOLIDATED FINANCIAL STATEMENTS82 83
Underlying Deterioration of assumptions assumption by %
10 20
Amount of expected retained interests in € ‘000 1,817 1,786 1,755
These anticipated effects are based on a merely hypothetical analysis.
The effect from the change to the underlying assumption has been com-
puted without changing other assumptions. In reality, changes to an
assumption can lead to changes of other assumptions that can both
intensify and reduce the anticipated effects.
The securities held by CLAAS which have a maturity of more than
90 days are securities that are held to maturity or that are sold within
the last three months before final maturity (»held to maturity») and
securities (»available for sale») which are neither part of the trading
portfolio nor held to maturity.
23 | SECURITIES WITH A MATURITY OF MORE THAN 90 DAYS
Sept. 30, 2003 Sept. 30, 2002 € ‘000 € ‘000
Available for sale securities 98,566 102,139
Held to maturity securities 13,003 30,355
Total securities with a maturity of more than 90 days 111,569 132,494
The securities classified as available for sale are given at fair values
(where available). The unrealized revenue from available for sale secur-
ities is disclosed without profit and loss impact in equity as other com-
prehensive income in the amount of € 803 thousand (prior year:
€ 255 thousand). Securities disclosed as held to maturity are reported
at amortized cost, which more or less corresponds to the fair value. The
amortized cost of held to maturity securities corresponds to the original
acquisition costs.
Cash and cash equivalents can be analyzed as follows:
24 | CASH AND CASH EQUIVALENTS
Sept. 30, 2003 Sept. 30, 2002 € ‘000 € ‘000
Securities (maturity up to 90 days) 0 0
Checks, cash-in-hand, bank balances 233,190 168,236
Total 233,190 168,236
Cash and cash equivalents include receipts of payment in the amount of
€ 6,030 thousand (prior year: € 17,975 thousand) under the ABS Pro-
gram that have to be transferred to the other parties to the contracts.
Influence of changes according to hypothetical analyses:

NOTES TO THE CONSOLIDATED FINANCIAL STATEMENTS82 83
25 | COMPREHENSIVE INCOME 2003 Deducted 2002 Deducted
taxes on income taxes on income
€ ‘000 € ‘000
Net income 17,901 32,543
Translation adjustments (5,659) (3,323) (951) (558)
Unrealized income from securities 547 321 255 150
Changes in additional minimum liability (1,087) (638) (829) (487)
Derivative financial instruments (3,655) (2,147) 0 0
Changes in other comprehensive income (9,854) (5,787) (1,525) (895)
Comprehensive income 8,047 31,018
The comprehensive income is comprised of the net income for the year
and the other comprehensive income. It covers, hence, all changes in
equity that are not due to transactions with shareholders (e.g. through
capital increases or dividends paid out). The components of the other
comprehensive income are determined after deducting a portion of
taxes on income, the amount of which is disclosed in a separate column.
The amounts disclosed as subscribed capital and capital reserves in the
consolidated financial statements correspond to the amounts in the indi-
vidual accounts of CLAAS KGaA mbH. The subscribed capital of CLAAS
KGaA mbH is composed of 3 million individual share certificates.
General partner without capital contribution is Helmut Claas GmbH;
the shareholders of the commercial partnership limited by shares,
CLAAS KGaA mbH, are directly or indirectly exclusively family members.
The movements in equity are separately presented on the face of the
financial statements on page 65.
26 | EQUITY/MOVEMENTS IN EQUITY
The respective repayable participation certificates and the silent partner-
ship of CLAAS- Mitarbeiterbeteiligungs-Gesellschaft mbH (CMG) are re-
munerated through a profit and loss-related compensation and are to
be treated as subordinate in the event of liability. Under US GAAP, repay-
able transferred capital is to be disclosed outside the stockholders’
equity.
The participation certificates disclosed include eighty registered partici-
pation certificates made out to bearer at a total par value of € 40,903
thousand, which were issued in September 1997. The receivables from
the participation certificates are subordinate and possibly participate in
potential losses up to the full amount. The participation certificates are
repayable on March 1, 2005; premature termination through the holders
of the participation certificates is excluded.
CMG is paid for its subordinated contribution a compensation that
is based on the net income for the year of CLAAS Group; there is
also a corresponding loss participation. € 6,593 thousand of the silent
partnership can be terminated as of September 30, 2004, there are
rights of termination between 2005 and 2008 with respect to another
€ 5,454 thousand.
27 | PARTICIPATION CERTIFICATES/SILENT PARTNERSHIP

NOTES TO THE CONSOLIDATED FINANCIAL STATEMENTS84 85
An analysis of provisions is as follows:
28 | PROVISIONS
Sept. 30, 2003 Sept. 30, 2002 € ‘000 € ‘000
Provisions for pensions and similar obligations 137,811 109,630
Provisions for income and other taxes 11,203 16,590
Other provisions 235,870 197,026
Total 384,884 323,246
The provisions for taxes are comprised exclusively of provisions for
effective taxes; deferred tax liabilities are separately disclosed.
The long-term provisions amount to € 164,775 thousand (prior year:
€ 134,466 thousand).
The other provisions include short-term provisions for restructuring
commitments according to SFAS No. 146: »Accounting for Costs
Associated with Exit or Disposal Activities« and EITF 95-3: »Recognition
of Liabilities in Connection with a Purchase Business Combination« in
the amount of € 10.2 million. On account of the declining market
development and due to a reorganization in distribution, restructuring
measures were required.
The measures taken on account of the declining market developments
relate to wage earners and salaried employees in the Production Divi-sion in Germany. The adjustment program was resolved by manage-
ment – besides other measures – in August and/or September 2003.
The works council was informed in September 2003. The total expenses
expected for severance payments and similar benefits, which are
recognized in other operating expenses as incurred, amount to
€ 1.5 million. The measures are likely to be implemented until the
end of the year 2004.
Starting out from the acquisition of shares in RENAULT Agriculture,
negotiations are held to integrate distribution activities for tractors in
European foreign countries. Provisions in the amount of € 8.5 million
were recorded for compensation to take over distribution activities
and for expenses to restructure existing selling companies. Of these,
€ 4.9 million have already been included in the opening balance sheet
of RENAULT Agriculture. Another € 3.6 million have been added to
provisions with profit and loss impact (other operating expense) in the
financial year 2003. The measures include compensation for the ter-
mination of existing contracts with importers, dealers and suppliers as
well as severance pay. The restructuring measures are likely to be
implemented until the end of the year 2004.
The provisions relate to the Agricultural Engineering segment.
CLAAS maintains several defined benefit pension plans in Germany and
one fund-financed plan in Great Britain and in Germany each.
Under the defined benefit pension plans implemented by CLAAS, the
Company undertakes to comply with its pension obligations towards
active and former employees. The pension provision that covers commit-
ments under defined benefit schemes includes also pension fund obliga-
tions and is reduced by the amount of the fund assets. Fund surpluses,
if any, are capitalized as other assets and fund deficits are carried as a
liability as pension provisions. Pension provisions are recorded for obli-
gations from vested rights and current benefits paid to eligible active
and former employees and surviving dependants. The obligations relate
primarily to old age pensions, which are paid partially as basic partially
as supplementary benefits. Pension obligations are normally based on
company seniority and the employees‘ remuneration.
The pension obligations are measured through actuarial methods accord-
ing to the projected unit credit method. This projected unit credit method
does not only take into account pensions and accrued vested rights
known at the balance sheet date but also pay and pension increases
anticipated in future. Actuarial gains and losses which are outside a
range of 10% of the scope of commitments are distributed over the
average residual period of service.
The computation was based on an interest factor of 5.5% (prior year:
6%), pay rises of 3% (prior year: 3%) and pension increases of 1.5%
(prior year: 1.5%). These assumptions refer to the employees working
in Germany to whom the predominant part of the pension obligation
relates. For the employees assigned abroad, deviating assumptions that
take into account the specific circumstances in the country concerned
have to be used. The anticipated return on funds amounts to 6.86%
(prior year: 7%).
29 | PENSION PROVISIONS AND SIMILAR OBLIGATIONS

NOTES TO THE CONSOLIDATED FINANCIAL STATEMENTS84 85
The pension obligations financed by funds developed as follows:
Sept. 30, 2003 Sept. 30, 2002 € ‘000 € ‘000
Projected benefit obligation of funded plans 28,473 25,977
Less plan assets at fair value (27,613) (25,415)
Subtotal (= funded status) 860 562
Less unrecognized net gains/(losses) (11,683) (14,507)
Net amount recognized for funded obligations (= balance sheet amount) (10,823) (13,945)
In 2003, the netted balance sheet amount of € 10,823 thousand (prior
year: € 13,945 thousand) is composed of an excess of pension obliga-
tions financed by funds in the amount of € 11,964 thousand and a
deficit in the amount of € 1,141 thousand. The excess is capitalized as
other asset, the deficit is included in the accrued pension cost.
The plan assets developed as follows:
2003 2002 € ‘000 € ‘000
Fair value of plan assets as at Oct. 1, 2002 25,415 30,550
Actual return on plan assets 4,403 (4,814)
Employer‘s contributions 563 463
Employees‘ contributions 647 260
Actual pension payments (796) (805)
Foreign currency exchange rate changes (2,619) (239)
Other 0 0
Fair value of plan assets as at Sept. 30, 2003 27,613 25,415
The pension obligations not financed by funds can be analyzed as
follows: Sept. 30, 2003 Sept. 30, 2002 € ‘000 € ‘000
Projected benefit obligation of unfunded plans 146,841 114,769
Additional minimum liability 4,844 2,543
Unrecognized prior service costs (2,028) (1,697)
Unrecognized actuarial gains/losses (12,987) (5,985)
Pension provision for unfunded obligations 136,670 109,630
The pension provisions are derived as follows from the unfunded pen-
sion obligations and from a deficit of the funded pension obligations: Sept. 30, 2003 Sept. 30, 2002 € ‘000 € ‘000
Pension provision for unfunded obligations 136,670 109,630
Pension provision for funded obligations 1,141 0
Net amount recognized (pension provisions) 137,811 109,630

NOTES TO THE CONSOLIDATED FINANCIAL STATEMENTS86 87
The pension costs for funded and unfunded plans are classified as
follows: 2003 2002 € ‘000 € ‘000
Service cost 4,388 4,322
Interest cost 8,545 8,216
Recognized prior service costs 114 114
Recognized actuarial losses/(gains) 503 410
Expected return on plan assets (1,656) (2,136)
Other 0 58
Net periodic pension costs 11,894 10,984
The service cost accrued in the financial year 2003 as well as the
interest cost relate to pension obligations for both funded and un-
funded plans.
The funded and unfunded projected pension obligations developed as
follows:
2003 2002 € ‘000 € ‘000
Pension obligations as at Oct. 1, 2002 140,746 138,465
Change in scope of consolidation 21,433 0
Service cost 4,388 4,322
Interest cost 8,545 8,216
Actuarial losses/(gains) 8,809 -3,673
Actual pension payments -7,346 -6,580
Exchange rate effects -2,667 -263
Other 1,406 259
Pension obligations as at Sept. 30, 2003 175,314 140,746
30 | LIABILITIES Sept. 30, 2003 Sept. 30, 2002
Remaining term Total Remaining term Total
up to more than Sept. 30, up to more than Sept. 30, 1 year 1 year 2003 1 year 1 year 2002 € ‘000 € ‘000 € ‘000 € ‘000 € ‘000 € ‘000
Bonds 0 271,101 271,101 0 100,000 100,000
Liabilities to insurance companies 3,801 13,857 17,658 3,801 17,658 21,459
Liabilities to banks 4,342 25,449 29,791 12,384 19,227 31,611
Payments received on account 8,685 0 8,685 0 0 0
Trade payables 94,947 0 94,947 57,016 0 57,016
Liabilities on bills accepted and drawn 26,951 0 26,951 1,835 0 1,835
Accounts payable to investments/associates 912 0 912 423 0 423
Leasing payables 1,810 1,576 3,386 4,607 2,243 6,850
Other liabilities 94,852 25,765 120,617 76,402 36,082 112,484
Total 236,300 337,748 574,048 156,468 175,210 331,678

NOTES TO THE CONSOLIDATED FINANCIAL STATEMENTS86 87
The liabilities to insurance companies and the liabilities to banks in-
clude liabilities in the amount of € 17,658 thousand (prior year: € 21,459
thousand) and € 16,170 thousand (prior year: € 10,672 thousand), re-
spectively, which are collateralized through encumbrances on real prop-
erty and transfers by way of security.
The fair values and nominal values of the bonds as well as of the loans
granted by banks and insurance companies are as follows:
Sept. 30, 2003 Sept. 30, 2002
Nominal value Fair value Nominal value Fair value € million € million € million € million
Bonds 271.1 279.6 100.0 98.5
Loans granted by banks and insurance companies (with fair value difference) 24.4 26.4 34.0 36.1
Loans granted by banks and insurance companies (without fair value difference) 23.0 23.0 19.1 19.1
Total 318.5 329.0 153.1 153.7
The bonds (maturity until 2006 and maturities from 2010 to 2014)
accrue interest at a rate of 4.5% p.a. and 5.76% p.a.; interest rates
ranging from 1.0% to 8.3% p.a. apply to the loans granted by banks
and insurance companies (maturity from 2003 to 2011).
The other liabilities include payables to the shareholders, above all to
the shareholders of the commercial partnership limited by shares, in
the amount of € 46,846 thousand (prior year: € 44,931 thousand), of
which € 22,908 thousand are long-term (prior year: € 27,010 thousand).
The maturities of commitments from leasing and tenancy relationships
are as follows:
31 | CONTINGENT LIABILITIES AND OTHER FINANCIAL COMMITMENTS
Capital Lease Operating Lease Nominal value Nominal valueMINIMUM LEASE PAYMENTS € ‘000 € ‘000
1 year to maturity 2,181 15,892
2 years to maturity 507 7,056
3 years to maturity 470 2,869
4 years to maturity 256 1,281
More than 4 years to maturity 145 3,384
Total 3,559 30,482
Interest 173
Present value of commitments 3,386
In the year under audit, rent and rental expenses amounted to
€ 10,101 thousand. The rentals received under non-terminable sublease
agreements as at the balance sheet date amount to € 14,686 thousand.
The capital lease and operating lease commitments arise predominantly
under leasing programs under which CLAAS agricultural machines have
been leased from CLAAS Leasing GmbH and subleased to final custom-
ers. The aggregate of contingent liabilities in the current financial year
amounts to € 51,735 thousand (prior year: € 51,156 thousand). These
are comprised of notes payable, liabilities under guarantees as well as
other financial commitments. The notes payable of CLAAS Group as at
the financial year end amount to € 33,959 thousand (prior year:
€ 30,960 thousand). They include commitments in the amount of
€ 17,741 thousand that arose after January 1, 2003 and that are
matched by equivalent reimbursement claims and realization proceeds.
As of September 30, 2003, the Group’s liabilities under guarantees
amounted to € 14,013 thousand (prior year: € 17,072 thousand).
The liabilities under guarantees included therein in the amount of
€ 6,548 thousand that arose after January 1, 2003 are compensated
through reimbursement claims and realization proceeds in the amount
of € 6,332 thousand. The residual amount of € 215 thousand is valued
at its fair value of € 2 thousand.
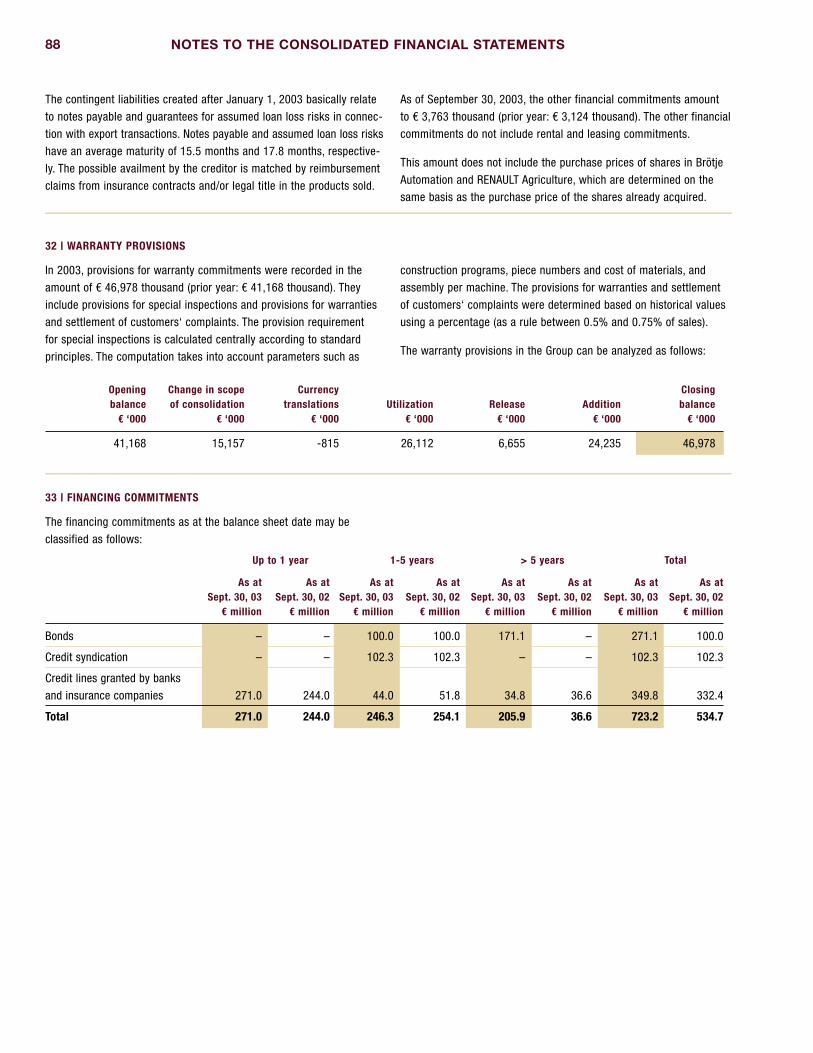
NOTES TO THE CONSOLIDATED FINANCIAL STATEMENTS88 89
Up to 1 year 1-5 years > 5 years Total
As at As at As at As at As at As at As at As at Sept. 30, 03 Sept. 30, 02 Sept. 30, 03 Sept. 30, 02 Sept. 30, 03 Sept. 30, 02 Sept. 30, 03 Sept. 30, 02 € million € million € million € million € million € million € million € million
Bonds – – 100.0 100.0 171.1 – 271.1 100.0
Credit syndication – – 102.3 102.3 – – 102.3 102.3
Credit lines granted by banks
and insurance companies 271.0 244.0 44.0 51.8 34.8 36.6 349.8 332.4
Total 271.0 244.0 246.3 254.1 205.9 36.6 723.2 534.7
The financing commitments as at the balance sheet date may be
classified as follows:
33 | FINANCING COMMITMENTS
The contingent liabilities created after January 1, 2003 basically relate
to notes payable and guarantees for assumed loan loss risks in connec-
tion with export transactions. Notes payable and assumed loan loss risks
have an average maturity of 15.5 months and 17.8 months, respective-
ly. The possible availment by the creditor is matched by reimbursement
claims from insurance contracts and/or legal title in the products sold.
As of September 30, 2003, the other financial commitments amount
to € 3,763 thousand (prior year: € 3,124 thousand). The other financial
commitments do not include rental and leasing commitments.
This amount does not include the purchase prices of shares in Brötje
Automation and RENAULT Agriculture, which are determined on the
same basis as the purchase price of the shares already acquired.
In 2003, provisions for warranty commitments were recorded in the
amount of € 46,978 thousand (prior year: € 41,168 thousand). They
include provisions for special inspections and provisions for warranties
and settlement of customers‘ complaints. The provision requirement
for special inspections is calculated centrally according to standard
principles. The computation takes into account parameters such as
construction programs, piece numbers and cost of materials, and
assembly per machine. The provisions for warranties and settlement
of customers‘ complaints were determined based on historical values
using a percentage (as a rule between 0.5% and 0.75% of sales).
The warranty provisions in the Group can be analyzed as follows:
32 | WARRANTY PROVISIONS
Opening Change in scope Currency Closing balance of consolidation translations Utilization Release Addition balance € ‘000 € ‘000 € ‘000 € ‘000 € ‘000 € ‘000 € ‘000
41,168 15,157 -815 26,112 6,655 24,235 46,978

NOTES TO THE CONSOLIDATED FINANCIAL STATEMENTS88 89
The statement of cash flows is classified by cash flows from current
operating activities, from investing activities, and from financing activi-
ties. Effects of changes in the entities included in consolidation have
been eliminated; their impact on cash and cash equivalents – like the
influence of exchange rate fluctuations on cash and cash equivalents –
is separately shown.
The cash flow from operating activities includes dividends received in
the amount of € 829 thousand (prior year: € 1,575 thousand); the profit
contributions without cash flow impact from the application of the equity
method were eliminated. Additions to fixed assets without cash flow
impact relate exclusively to additions of leased assets in the amount of
€ 77 thousand (prior year: € 1,838 thousand), which are to be classified
as capital lease. Interest paid amounts to € 32,174 thousand (prior year:
€ 25,956 thousand); the taxes on income paid amount to € 33,022 thou-
sand (prior year: € 34,477 thousand).
34 | CASH FLOW STATEMENT
35 | EMPLOYEES
ANNUAL AVERAGE NUMBER OF EMPLOYEES 2003 2002
Hourly paid 3,749 3,111
Salaried 3,127 2,249
Trainees 416 347
Total 7,292 5,707
On account of its business activities, CLAAS Group is exposed to ex-
change and interest risks. Exchange risks as well as interest risks are
controlled through systematic foreign currency and interest manage-
ment, using all common financial instruments including derivative instru-
ments. The currency risks relate basically to the US dollar, the Hungarian
forint and the British pound. Exchange futures and currency options are
entered into for mitigating or eliminating the exchange risk from receiv-
ables and payables denominated in foreign currencies including the
netting. Interest swaps and interest options serve to hedge the interest
risk of asset and liability positions.
All transactions are concluded exclusively on the basis of existing under-
lying transactions or transactions that are supported by concrete plann-
ing data.
The nominal volume of the hedging transactions constitutes the aggre-
gate of all buying and selling amounts underlying the dealings. The
amount of the nominal volume permits to draw conclusions as to the
scope of derivatives used, but does not reflect the Group‘s exposure from
the use of derivatives. It is to be emphasized that the nominal volumes
in the table below do not include the interest and currency positions that
were entered into through counter transactions. A gross presentation of
these amounts would not provide meaningful information in economic
terms. The nominal volumes as of the balance sheet date of the interest
and currency positions entered into through counter transactions amount
to € 210.2 million (prior year: € 210.2 million).
There is a strict segregation of functions in physical and organizational
terms between conclusion, control, and booking of transactions. The
competences in terms of amount and contents are defined in internal
guidelines. In the finance area, risk positions are continuously measured
by means of tested software.
Business partners are exclusively German and international banks of un-
questionable financial standing. Since management and the supervisory
bodies of CLAAS attach great importance to systematic risk management,
a comprehensive monitoring system, which meets the requirements
under the German Act on Control and Transparency in the Corporate
Sector (KonTraG), has been installed. In this context, the efficiency of
the hedging instruments used and the reliability of the internal control
systems are regularly controlled through internal and external examina-
tions.
In the financial year 2003, derivatives were accounted for in the frame-
work of hedge accounting for the first time. Cash flow hedge accounting
hedges both variable future cash flows from long-term liabilities and
future foreign currency sales.
A hedge effectiveness of 100% could be substantiated for the cash flow
hedge on variable future cash flows from long-term liabilities. The fair
value changes of these derivatives have been recorded in other compre-
hensive income disclosed under equity. A reclassification in the profit
and loss account has been made in the amount in which the underlying
transaction was recognized in income in the period under audit. This
reclassification was made in the same item of the profit and loss
account under which the underlying transaction was recorded.
The cash flow hedges of future foreign currency sales disclosed ineffect-
ive parts in the amount of net € 72 thousand as at 30 September 2003,
which have been included with a positive amount in the exchange result.
36 | DERIVATIVE FINANCIAL INSTRUMENTS AND HEDGE ACCOUNTING
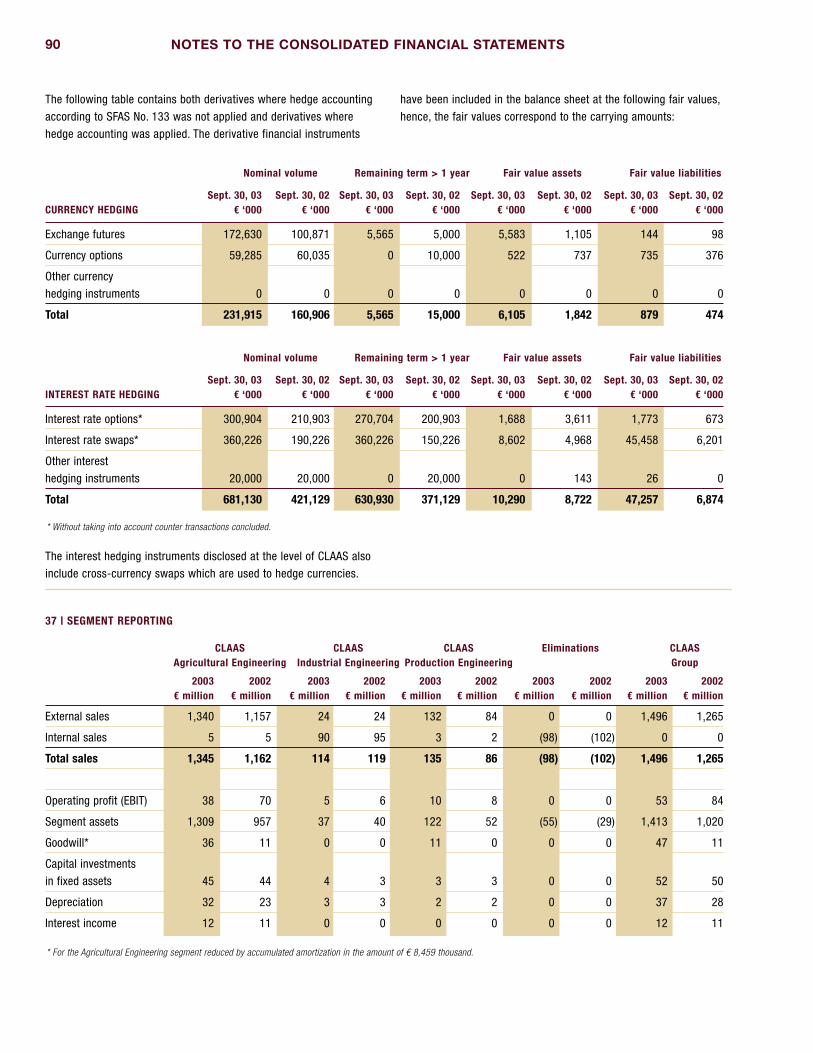
NOTES TO THE CONSOLIDATED FINANCIAL STATEMENTS90 91
Nominal volume Remaining term > 1 year Fair value assets Fair value liabilities
Sept. 30, 03 Sept. 30, 02 Sept. 30, 03 Sept. 30, 02 Sept. 30, 03 Sept. 30, 02 Sept. 30, 03 Sept. 30, 02CURRENCY HEDGING € ‘000 € ‘000 € ‘000 € ‘000 € ‘000 € ‘000 € ‘000 € ‘000
Exchange futures 172,630 100,871 5,565 5,000 5,583 1,105 144 98
Currency options 59,285 60,035 0 10,000 522 737 735 376
Other currency
hedging instruments 0 0 0 0 0 0 0 0
Total 231,915 160,906 5,565 15,000 6,105 1,842 879 474
The following table contains both derivatives where hedge accounting
according to SFAS No. 133 was not applied and derivatives where
hedge accounting was applied. The derivative financial instruments
have been included in the balance sheet at the following fair values,
hence, the fair values correspond to the carrying amounts:
Nominal volume Remaining term > 1 year Fair value assets Fair value liabilities
Sept. 30, 03 Sept. 30, 02 Sept. 30, 03 Sept. 30, 02 Sept. 30, 03 Sept. 30, 02 Sept. 30, 03 Sept. 30, 02INTEREST RATE HEDGING € ‘000 € ‘000 € ‘000 € ‘000 € ‘000 € ‘000 € ‘000 € ‘000
Interest rate options* 300,904 210,903 270,704 200,903 1,688 3,611 1,773 673
Interest rate swaps* 360,226 190,226 360,226 150,226 8,602 4,968 45,458 6,201
Other interest
hedging instruments 20,000 20,000 0 20,000 0 143 26 0
Total 681,130 421,129 630,930 371,129 10,290 8,722 47,257 6,874
The interest hedging instruments disclosed at the level of CLAAS also
include cross-currency swaps which are used to hedge currencies.
37 | SEGMENT REPORTING
CLAAS CLAAS CLAAS Eliminations CLAAS Agricultural Engineering Industrial Engineering Production Engineering Group
2003 2002 2003 2002 2003 2002 2003 2002 2003 2002 € million € million € million € million € million € million € million € million € million € million
External sales 1,340 1,157 24 24 132 84 0 0 1,496 1,265
Internal sales 5 5 90 95 3 2 (98) (102) 0 0
Total sales 1,345 1,162 114 119 135 86 (98) (102) 1,496 1,265
Operating profit (EBIT) 38 70 5 6 10 8 0 0 53 84
Segment assets 1,309 957 37 40 122 52 (55) (29) 1,413 1,020
Goodwill* 36 11 0 0 11 0 0 0 47 11
Capital investments
in fixed assets 45 44 4 3 3 3 0 0 52 50
Depreciation 32 23 3 3 2 2 0 0 37 28
Interest income 12 11 0 0 0 0 0 0 12 11
* Without taking into account counter transactions concluded.
* For the Agricultural Engineering segment reduced by accumulated amortization in the amount of € 8,459 thousand.
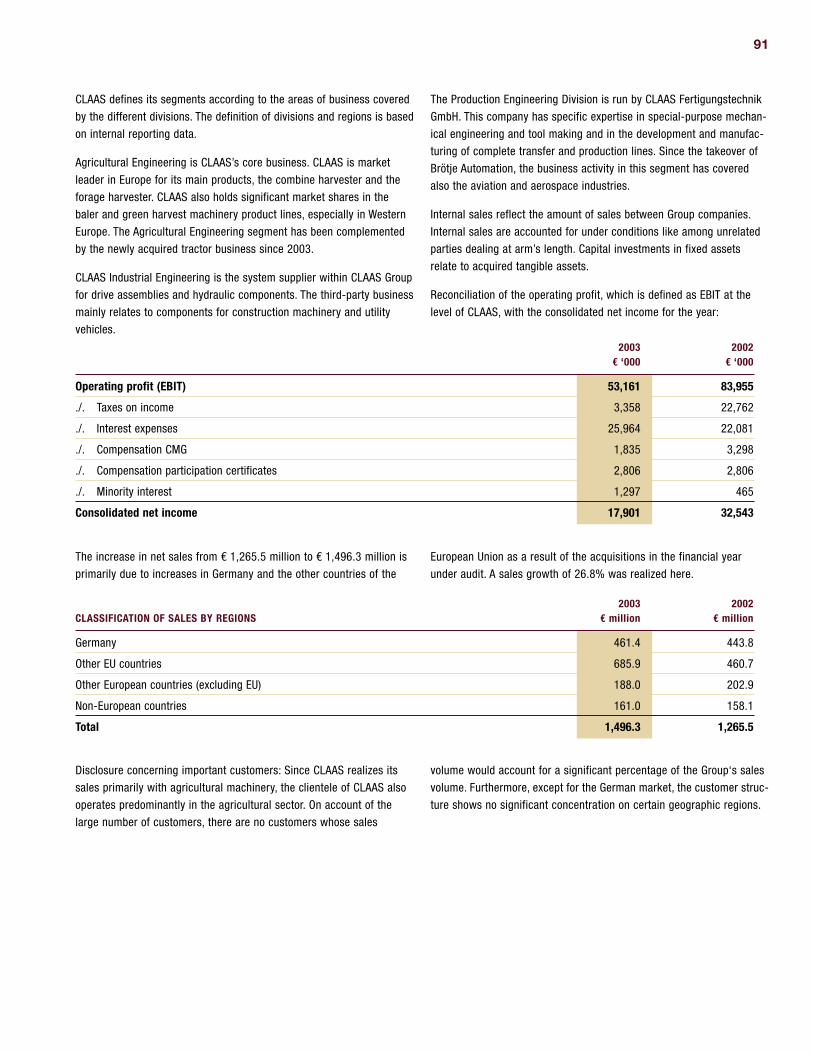
NOTES TO THE CONSOLIDATED FINANCIAL STATEMENTS90 91
CLAAS defines its segments according to the areas of business covered
by the different divisions. The definition of divisions and regions is based
on internal reporting data.
Agricultural Engineering is CLAAS’s core business. CLAAS is market
leader in Europe for its main products, the combine harvester and the
forage harvester. CLAAS also holds significant market shares in the
baler and green harvest machinery product lines, especially in Western
Europe. The Agricultural Engineering segment has been complemented
by the newly acquired tractor business since 2003.
CLAAS Industrial Engineering is the system supplier within CLAAS Group
for drive assemblies and hydraulic components. The third-party business
mainly relates to components for construction machinery and utility
vehicles.
The Production Engineering Division is run by CLAAS Fertigungstechnik
GmbH. This company has specific expertise in special-purpose mechan-
ical engineering and tool making and in the development and manufac-
turing of complete transfer and production lines. Since the takeover of
Brötje Automation, the business activity in this segment has covered
also the aviation and aerospace industries.
Internal sales reflect the amount of sales between Group companies.
Internal sales are accounted for under conditions like among unrelated
parties dealing at arm’s length. Capital investments in fixed assets
relate to acquired tangible assets.
Reconciliation of the operating profit, which is defined as EBIT at the
level of CLAAS, with the consolidated net income for the year:
2003 2002 € ‘000 € ‘000
Operating profit (EBIT) 53,161 83,955
./. Taxes on income 3,358 22,762
./. Interest expenses 25,964 22,081
./. Compensation CMG 1,835 3,298
./. Compensation participation certificates 2,806 2,806
./. Minority interest 1,297 465
Consolidated net income 17,901 32,543
The increase in net sales from € 1,265.5 million to € 1,496.3 million is
primarily due to increases in Germany and the other countries of the
European Union as a result of the acquisitions in the financial year
under audit. A sales growth of 26.8% was realized here.
2003 2002CLASSIFICATION OF SALES BY REGIONS € million € million
Germany 461.4 443.8
Other EU countries 685.9 460.7
Other European countries (excluding EU) 188.0 202.9
Non-European countries 161.0 158.1
Total 1,496.3 1,265.5
Disclosure concerning important customers: Since CLAAS realizes its
sales primarily with agricultural machinery, the clientele of CLAAS also
operates predominantly in the agricultural sector. On account of the
large number of customers, there are no customers whose sales
volume would account for a significant percentage of the Group‘s sales
volume. Furthermore, except for the German market, the customer struc-
ture shows no significant concentration on certain geographic regions.
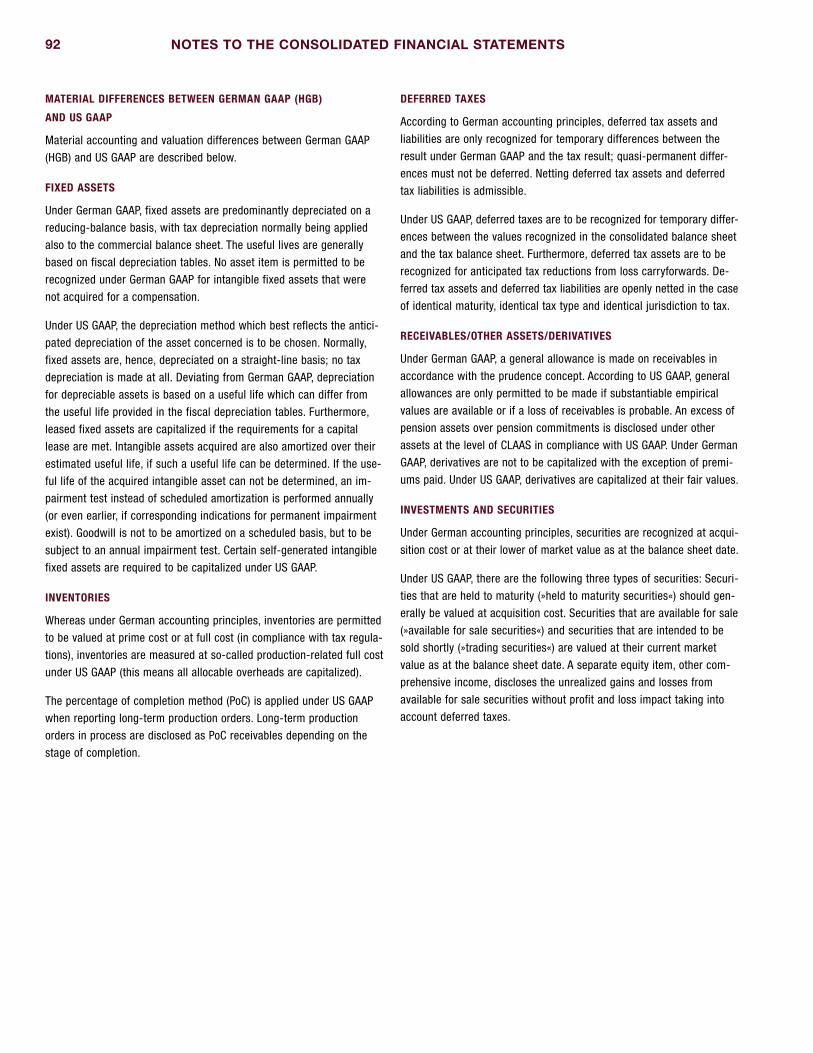
NOTES TO THE CONSOLIDATED FINANCIAL STATEMENTS92 93
MATERIAL DIFFERENCES BETWEEN GERMAN GAAP (HGB)
AND US GAAP
Material accounting and valuation differences between German GAAP
(HGB) and US GAAP are described below.
FIXED ASSETS
Under German GAAP, fixed assets are predominantly depreciated on a
reducing-balance basis, with tax depreciation normally being applied
also to the commercial balance sheet. The useful lives are generally
based on fiscal depreciation tables. No asset item is permitted to be
recognized under German GAAP for intangible fixed assets that were
not acquired for a compensation.
Under US GAAP, the depreciation method which best reflects the antici-
pated depreciation of the asset concerned is to be chosen. Normally,
fixed assets are, hence, depreciated on a straight-line basis; no tax
depreciation is made at all. Deviating from German GAAP, depreciation
for depreciable assets is based on a useful life which can differ from
the useful life provided in the fiscal depreciation tables. Furthermore,
leased fixed assets are capitalized if the requirements for a capital
lease are met. Intangible assets acquired are also amortized over their
estimated useful life, if such a useful life can be determined. If the use-
ful life of the acquired intangible asset can not be determined, an im-
pairment test instead of scheduled amortization is performed annually
(or even earlier, if corresponding indications for permanent impairment
exist). Goodwill is not to be amortized on a scheduled basis, but to be
subject to an annual impairment test. Certain self-generated intangible
fixed assets are required to be capitalized under US GAAP.
INVENTORIES
Whereas under German accounting principles, inventories are permitted
to be valued at prime cost or at full cost (in compliance with tax regula-
tions), inventories are measured at so-called production-related full cost
under US GAAP (this means all allocable overheads are capitalized).
The percentage of completion method (PoC) is applied under US GAAP
when reporting long-term production orders. Long-term production
orders in process are disclosed as PoC receivables depending on the
stage of completion.
DEFERRED TAXES
According to German accounting principles, deferred tax assets and
liabilities are only recognized for temporary differences between the
result under German GAAP and the tax result; quasi-permanent differ-
ences must not be deferred. Netting deferred tax assets and deferred
tax liabilities is admissible.
Under US GAAP, deferred taxes are to be recognized for temporary differ-
ences between the values recognized in the consolidated balance sheet
and the tax balance sheet. Furthermore, deferred tax assets are to be
recognized for anticipated tax reductions from loss carryforwards. De-
ferred tax assets and deferred tax liabilities are openly netted in the case
of identical maturity, identical tax type and identical jurisdiction to tax.
RECEIVABLES/OTHER ASSETS/DERIVATIVES
Under German GAAP, a general allowance is made on receivables in
accordance with the prudence concept. According to US GAAP, general
allowances are only permitted to be made if substantiable empirical
values are available or if a loss of receivables is probable. An excess of
pension assets over pension commitments is disclosed under other
assets at the level of CLAAS in compliance with US GAAP. Under German
GAAP, derivatives are not to be capitalized with the exception of premi-
ums paid. Under US GAAP, derivatives are capitalized at their fair values.
INVESTMENTS AND SECURITIES
Under German accounting principles, securities are recognized at acqui-
sition cost or at their lower of market value as at the balance sheet date.
Under US GAAP, there are the following three types of securities: Securi-
ties that are held to maturity (»held to maturity securities«) should gen-
erally be valued at acquisition cost. Securities that are available for sale
(»available for sale securities«) and securities that are intended to be
sold shortly (»trading securities«) are valued at their current market
value as at the balance sheet date. A separate equity item, other com-
prehensive income, discloses the unrealized gains and losses from
available for sale securities without profit and loss impact taking into
account deferred taxes.

NOTES TO THE CONSOLIDATED FINANCIAL STATEMENTS92 93
PENSION PROVISIONS
Under German GAAP, pension provisions are normally measured accord-
ing to the entry age normal method under tax law. Probable fluctuations
are taken into account on a lump-sum basis. Pay and pension rises
must not be taken into account. The discounting factor can be based on
tax regulations.
Under US GAAP, pension provisions are measured according to the pro-
jected unit credit method. Official fluctuation probabilities as well as
pay and pension rises are taken into account. The discounting factor
corresponds to the interest rate in the capital market.
If, on account of the change in the bases of computation, the present
value of vested pension rights exceeds the pension provision that has
been set up with profit and loss impact, the pension provision is in-
creased without profit and loss impact by an additional provision amount
(»additional minimum liability») according to SFAS No. 87. This amount
must be lower than the additional expenses from plan adjustments that
remain to be allocated. Otherwise, it is offset against equity. The differ-
ence arising on the pension valuation has no profit and loss impact under
US GAAP. Under German GAAP, the funding and release of this minimum
pension commitment is, however, immediately charged against profit
and loss in the profit and loss account.
OTHER PROVISIONS
Under German GAAP, there are certain options with respect to provisions
and accruals and provisions for charges that are based on an internal
commitment are permitted to be carried as a liability.
According to US GAAP, there are more restrictive requirements for re-
cording provisions and setting up accruals. There are no options to
show or not to show corresponding items as a liability on the balance
sheet and recognition is made contingent upon a high probability that
a liability will actually arise. Provisions for charges are inadmissible.
CASH AND CASH EQUIVALENTS
Deviating from German GAAP, liquid funds under US GAAP include also
securities with a remaining term at the date of acquisition of up to
90 days.
PARTICIPATION CERTIFICATES/SILENT PARTNERSHIP
The allocation to equity or external capital according to German GAAP
depends decisively on profit and loss-related compensation, the loss
participation and the treatment as subordinate in the case of bankrupt-
cy. According to these criteria, the silent partnership and the participa-
tion certificates of CLAAS are to be classified as equity in accordance
with German GAAP. Under US GAAP, however, the repayability of the
capital transfer decides on the disclosure within or outside equity.
MINORITY INTEREST
Under German GAAP, minority interest is taken into account within
equity. Under US GAAP, minority interest is disclosed as a separate item
outside equity on the balance sheet.
COMPREHENSIVE INCOME/OTHER COMPREHENSIVE INCOME
Deviating from German accounting rules, US GAAP provides for a separ-
ate equity component, the other comprehensive income, which together
with the net income for the year forms a kind of total operating perform-
ance, the so-called comprehensive income. The following elements of
the other comprehensive income are to be separately disclosed: Foreign
currency translation differences, supplementary pension provisions (see
pension provision), unrealized gains and losses in connection with the
market valuation of securities as well as the effective portion of the fair
value variance of derivative instruments that meet cash flow hedge
requirements.
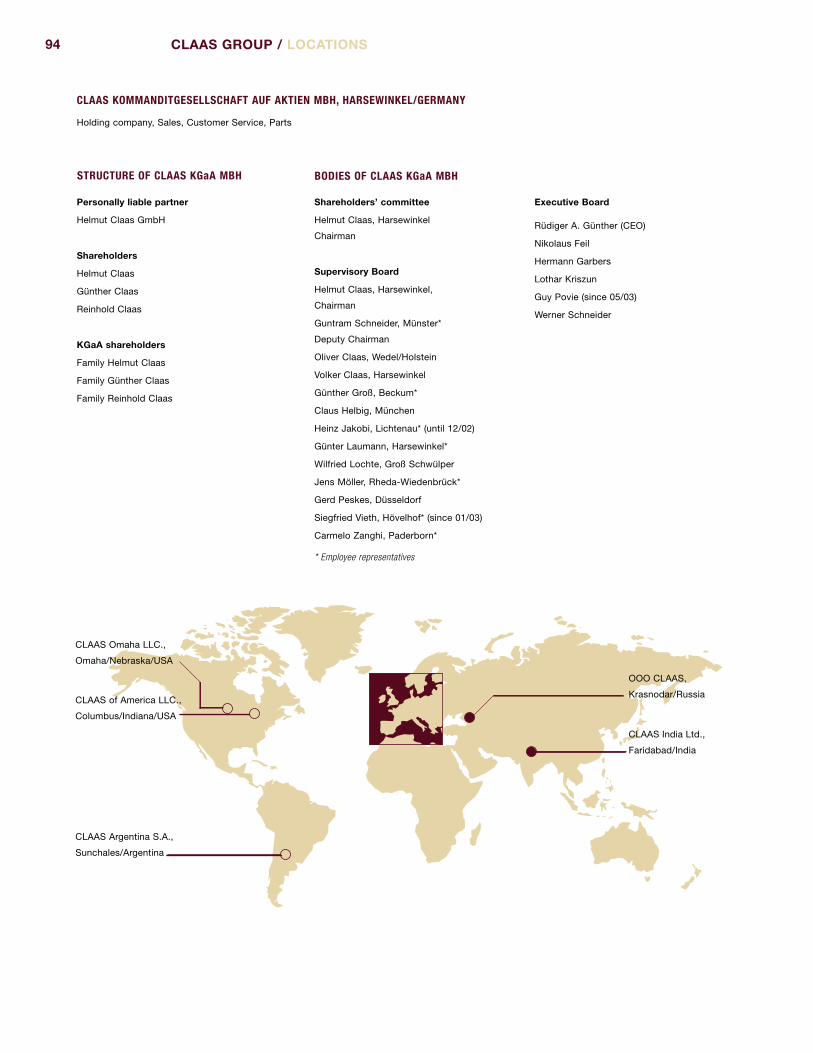
94 95CLAAS GROUP / LOCATIONS
CLAAS KOMMANDITGESELLSCHAFT AUF AKTIEN MBH, HARSEWINKEL/GERMANY
Holding company, Sales, Customer Service, Parts
STRUCTURE OF CLAAS KGaA MBH BODIES OF CLAAS KGaA MBH
Personally liable partner
Helmut Claas GmbH
Shareholders
Helmut Claas
Günther Claas
Reinhold Claas
KGaA shareholders
Family Helmut Claas
Family Günther Claas
Family Reinhold Claas
Shareholders’ committee
Helmut Claas, Harsewinkel
Chairman
Supervisory Board
Helmut Claas, Harsewinkel,
Chairman
Guntram Schneider, Münster*
Deputy Chairman
Oliver Claas, Wedel/Holstein
Volker Claas, Harsewinkel
Günther Groß, Beckum*
Claus Helbig, München
Heinz Jakobi, Lichtenau* (until 12/02)
Günter Laumann, Harsewinkel*
Wilfried Lochte, Groß Schwülper
Jens Möller, Rheda-Wiedenbrück*
Gerd Peskes, Düsseldorf
Siegfried Vieth, Hövelhof* (since 01/03)
Carmelo Zanghi, Paderborn*
* Employee representatives
FERTIGUNGSTECHNIK
Executive Board
Rüdiger A. Günther (CEO)
Nikolaus Feil
Hermann Garbers
Lothar Kriszun
Guy Povie (since 05/03)
Werner Schneider
CLAAS India Ltd.,
Faridabad/India
CLAAS Argentina S.A.,
Sunchales/Argentina
CLAAS Omaha LLC.,
Omaha/Nebraska/USA
CLAAS of America LLC.,
Columbus/Indiana/USA
OOO CLAAS,
Krasnodar/Russia

94 95
FERTIGUNGSTECHNIK
AGRICULTURAL ENGINEERING
Product companies
Sales companies
Finance companies
FERTIGUNGSTECHNIK
FERTIGUNGSTECHNIK
RENAULT Agriculture S.A.S.,
Vélizy/France
AGROCOM GmbH & Co.
Agrarsystem KG,
Bielefeld/Germany
CLAAS Hungaria Kft.,
Törökszentmiklos/Hungary
Usines CLAAS France S.A.S.,
Metz-Woippy/France
CLAAS Saulgau GmbH,
Bad Saulgau/Germany
CLAAS Selbstfahrende
Erntemaschinen GmbH,
Harsewinkel/Germany
RENAULT Agriculture Ltd.,
Shipston on Stour/Great Britain
CLAAS Ibérica S.A.,
Madrid/SpainCLAAS Italia S.p.A.,
Vercelli/Italy
CLAAS U.K. Ltd.,
Saxham/Great Britain
CLAAS France S.A.S.,
Paris/France
CLAAS Vertriebsgesellschaft mbH,
Harsewinkel/GermanyCLAAS Valtra Finance Ltd.,
Basingstoke/Great Britain
CLAAS Financial Services S.A.S.,
Paris/France
CLAAS Industrietechnik GmbH,
Paderborn/Germany
CLAAS Fertigungstechnik GmbH,
Beelen/Germany
FERTIGUNGSTECHNIK
PRODUCTION ENGINEERING
FERTIGUNGSTECHNIK
INDUSTRIAL ENGINEERING * As of 31/12/2003

96
SUMMARY OF FINANCIAL STATISTICS 2003 2002 2001 2000 1999* 1998* 1997*
PROFIT AND LOSS ACCOUNT
Net sales € million 1,496.3 1,265.5 1,147.9 1,072.5 1,038.5 1,108.5 978.7
Exports as a share of sales % 69.2 64.9 68.9 66.6 65.5 69.7 70.6
Income before taxes € million 22.6 55.8 36.1 26.2 22.4 59.9 68.9
Net income € million 17.9 32.5 14.3 11.7 5.8 27.2 27.0
BALANCE SHEET
Fixed assets € million 373.9 262.3 211.2 187.1 148.1 132.0 119.3
Intangible assets € million 55.8 20.0 6.8 3.5 6.0 8.4 8.0
Tangible assets € million 252.3 192.8 155.5 138.7 99.3 83.3 77.1
Financial assets € million 65.8 49.5 48.9 44.8 42.8 40.3 34.2
Current assets € million 984.7 724.8 698.2 656.4 582.5 542.8 519.5
Inventories € million 337.6 207.1 168.5 181.2 212.6 224.6 141.0
Accounts receivable/derivatives/other assets € million 302.3 217.0 195.6 190.4 133.1 137.2 149.9
Liquidity € million 344.8 300.7 334.1 284.8 236.8 181.0 228.6
Prepaid expenses/deferred taxes € million 54.2 32.5 22.0 16.1 25.5 16.9 5.1
Equity € million 292.5 292.2 268.8 263.5 261.6 261.0 241.2
Funds similar to equity** € million 106.3 58.3 56.3 55.5
External capital € million 1,014.0 669.1 606.3 540.6 494.5 430.7 402.7
Provisions/deferred taxes € million 391.8 330.1 288.2 257.0 246.7 263.1 234.1
Liabilities/derivatives € million 622.2 339.0 318.1 283.6 247.8 167.6 168.6
Balance sheet total € million 1,412.8 1,019.6 931.4 859.6 756.1 691.7 643.9
RATIOS
Return on sales % 1.5 4.4 3.2 2.4 2.2 5.4 7.0
EBIT € million 53.2 84.0 66.7 54.0 48.7 89.6 90.1
EBITDA € million 90.9 111.9 111.5 82.5 79.9 113.8 118.0
Return on equity % 6.1 11.1 5.3 4.4 2.2 10.4 11.2
Return on total equity employed % 3.8 8.2 7.2 6.3 6.4 13.0 14.0
Cash flow according to DVFA/SG*** € million 58.1 67.4 67.7 39.6 53.1 70.9 63.3
Equity ratio % 20.7 28.7 28.9 30.7 34.6 37.7 37.4
First-degree liquidity % 67.4 83.7 109.7 118.3 111.9 74.3 103.6
Equity-to-fixed-assets ratio % 241.1 251.7 297.0 330.9 367.7 339.5 354.7
Working capital € million 417.2 303.5 251.8 274.0 286.6 298.1 209.8
EMPLOYEES
Employees as at the balance sheet date
(including trainees) 8,391 6,114 5,488 5,558 5,853 6,030 5,571
Personnel expenses € million 352.3 291.7 277.3 269.7 269.1 262.0 222.8
* The figures up to and including 1999 are based on German GAAP.
** Under US GAAP, participation certificates, the silent partnership and minority interest are not part of equity in a narrow sense in contrast to German GAAP.
*** Deutsche Vereinigung für Finanzanalyse und Anlageberatung e.V./Schmalenbach-Gesellschaft (DVFA commission für methodology of financial analysis/Schmalenbach-Gesellschaft).

FORAGE HARVESTERS TELESCOPIC LOADERS SPECIAL PRODUCTS
GREEN HARVEST MACHINERY
BALERS PRODUCTION ENGINEERING/
INDUSTRIAL ENGINEERING
PRODUCT OVERVIEW
COMBINE HARVESTERS TRACTORS
AGRICULTURAL ENGINEERING
Combine harvesters, forage harvesters,
square balers, round balers and con-
ventional high-density balers, as well as
green harvest machinery, system carrier
vehicles and agricultural information
technology
New: the range of products has been
expanded to include tractors
INDUSTRIAL ENGINEERING
System supplier for drive technology
and hydraulics
Axles and gears for agricultural and
construction machinery, as well as
commercial vehicles
PRODUCTION ENGINEERING
Development and production of com-
plete production lines for the auto-
motive and aircraft industries around
the world
Founded in 1913, today the company is the fourth largest manufacturer
of agricultural machinery in the world, covering the entire processing
chain of agricultural engineering.
In Europe we are the undisputed market leader for combine harvesters,
and worldwide we are number 1 for self-propelled forage harvesters.
In four German locations and five plants abroad, we produce local pro-
ducts globally for all countries of the world.
Currently more than 8,000 employees work for CLAAS Group worldwide.
CLAAS in brief
OCTOBER NOVEMBER DECEMBER JANUARY FEBRUARY MARCH APRIL MAY JUNE JULY AUGUST SEPTEMBER OCTOBER
CLAAS presented the
latest agricultural machi-
nery to 15.000 visitors
at a four-week-long
»World CLAAS Forum«
in the North of France.
CLAAS Fertigungstechnik,
a subsidiary company of the
CLAAS Group specialising in
complex industrial facilities,
has taken over a majority
stake in Brötje Automation.
CLAAS expands its pro-
duct range with tractors
through the acquisition
of a majority stake in
RENAULT Agriculture
As the first »MidCap«-
company, within the frame-
work of the Traditional
Private Placement, CLAAS
issued bonds in the amount
of US-$ 200 million.
In order to build a
plant, CLAAS signs an
investment agreement
with the Russian
region Krasnodar.
Opening of the modernized
and a more flexibly designed
plant in Bad Saulgau.
50 years of modern
CLAAS combine harvesters.
CLAAS introduced a
self-propelled combine
harvester »Hercules«
to the grain harvest for
the first time in 1953.
More power and more
efficiency in new design
– that´s the new
LEXION 500 series.
Introduction of
tractors under the
CLAAS name and
in CLAAS design.
Highlights 02/03
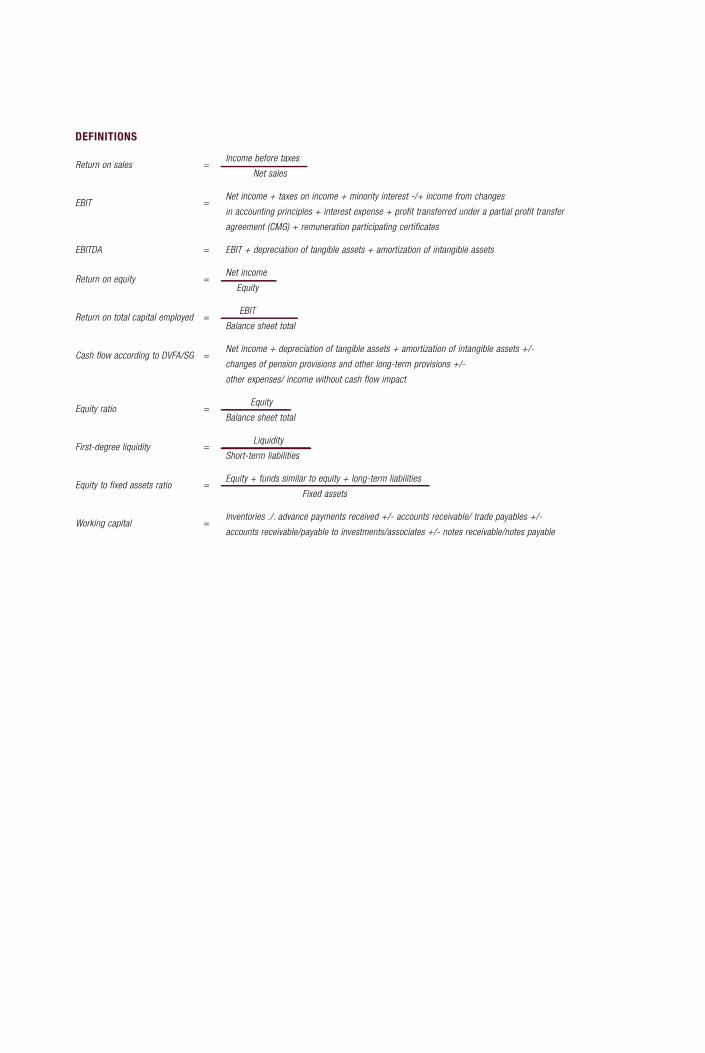
KEY DATA FOR THE GROUP ACCORDING TO US GAAP
��� ��� ��� ��� ��� ��� �� �� �� ��
�����
����
����
�����
����
����
�����
����
����
�����
����
����
�����
����
����
�����
����
����
���
����
����
���
����
����
���
����
����
���
����
����
�����
�����
���
NET SALES �������������
����������������������
�����������������������
���������������������������������
� ���
0
500
1000
1500
2000
ANNUAL REPORT 2003
Customers
Partners
Investors
Employees
Society
2003 2002 Change %
PROFIT AND LOSS ACCOUNT
Net Sales € million 1,496.3 1,265.5 18.2
EBIT € million 53.2 84.0 (36.7)
EBITDA € million 90.9 111.9 (18.8)
Net income € million 17.9 32.5 (44.9)
Income before taxes € million 22.6 55.8 (59.5)
Cash flow € million 58.1 67.4 (13.8)
R&D expenses € million 67.2 63.0 6.7
BALANCE SHEET
Equity € million 292,5 292.2 0.1
Capital expenditure € million 54.2 54.3 (0.2)
Balance sheet total € million 1,412.8 1,019.6 38.6
EMPLOYEES
Employees as at the balance sheet date* 8,391 6,114 37.2
Personnal expenses € million 352.3 291.7 20.8
* including trainees
DEFINITIONS
Return on sales = Income before taxes
Net sales
EBIT = Net income + taxes on income + minority interest -/+ income from changes
in accounting principles + interest expense + profit transferred under a partial profit transfer
agreement (CMG) + remuneration participating certificates
EBITDA = EBIT + depreciation of tangible assets + amortization of intangible assets
Return on equity = Net income
Equity
Return on total capital employed = EBIT
Balance sheet total
Cash flow according to DVFA/SG = Net income + depreciation of tangible assets + amortization of intangible assets +/-
changes of pension provisions and other long-term provisions +/-
other expenses/ income without cash flow impact
Equity ratio = Equity
Balance sheet total
First-degree liquidity = Liquidity
Short-term liabilities
Equity to fixed assets ratio = Equity + funds similar to equity + long-term liabilities
Fixed assets
Working capital = Inventories ./. advance payments received +/- accounts receivable/ trade payables +/-
accounts receivable/payable to investments/associates +/- notes receivable/notes payable
ANNU
AL R
EPOR
T 20
03CONTACT
CLAAS KGaA mbH
P.O. Box 1163
Münsterstrasse 33
D-33426 Harsewinkel
Germany
www.claas.com
Additional copies of this report
and further information about
CLAAS are available free of
charge on request.
PUBLIC/INVESTOR RELATIONS
Tel.: (05247) 12-1743
Fax: (05247) 12-1751
E-mail: [email protected]
This annual report is available
in German and English. Both
versions may be downloaded on
the Internet AT www.claas.com
CONCEPT & DESIGN
Kirchhoff Consult AG
Hamburg, Germany
together