city of vineland, new jersey draft master plan …€¦ · master plan circulation element ......
TRANSCRIPT

City of Vineland, New Jersey Master Plan Circulation Element May 27, 2009

Master Plan Circulation Element City of Vineland Cumberland County, New Jersey May 2009
Credits and Acknowledgments: Robert Romano, Mayor and Planning Board Member Peter F. Coccaro, III, Council President Douglas A. Albrecht, Councilman and Planning Board Member Mayra Arroyo, Councilwoman Edward W. Conrow, Councilman Louis F. Cresci, Jr., Councilman David Catalana, Planning Board Chairman Robert J. Ferrari, Jr., Planning Board Vice Chairman Gina L. Biagi, Planning Board Member Michael I. Cyter, Planning Board Member Maria Perez, Planning Board Member David G. Pickett, Planning Board Member Victor B. Terenik, Jr., Planning Board Member Stephen Plevins, Alternate Planning Board Member David Manders, Alternate Planning Board Member Prepared by: Orth-Rodgers & Associates, Inc. Nelson\Nygaard Consulting Associates A-Tech Engineering, Inc. ______________________________________ Daniel A. Kueper, PP, AICP, PTP NJ Professional Planner License No. 5332

Contents Introduction and Goals .................................................................................................................... 1
Goals: .......................................................................................................................................... 1 Vehicular ......................................................................................................................................... 2
Functional Classification ............................................................................................................ 2 Traffic Volumes .......................................................................................................................... 4 Levels of Service......................................................................................................................... 6 Safety .......................................................................................................................................... 8
High Crash Locations ............................................................................................................. 8 Mid-Block Locations ............................................................................................................ 15 Access Management ............................................................................................................. 15 Other Safety Issues ............................................................................................................... 16
Roadway Design ....................................................................................................................... 17 Posted Speed ......................................................................................................................... 20 Residential Traffic Management Program ............................................................................ 21
Trucking Routes ........................................................................................................................ 22 Pedestrian and Bicycle .................................................................................................................. 24
Pedestrian and Bicycle Safety ................................................................................................... 24 Vineland Ordinance .................................................................................................................. 25 Bicycle Facilities ....................................................................................................................... 25 Pedestrian Facilities .................................................................................................................. 30
Transit ........................................................................................................................................... 35 Fixed-Route Service.................................................................................................................. 35
Utilization ............................................................................................................................. 37 Proposed Changes ................................................................................................................. 37
Modified Fixed-Route Transit .................................................................................................. 38 Proposed Changes ................................................................................................................. 38 Demand-Response Transit .................................................................................................... 38
Analysis of Transit Service Alignment ..................................................................................... 38 Transit Opportunity ................................................................................................................... 42
New Connection Opportunities............................................................................................. 42 Coordinating Service with Shift Changes ............................................................................. 42 Improved Facilities ............................................................................................................... 43 Marketing and Communications ........................................................................................... 43
Passenger Rail ........................................................................................................................... 44 Rail Expansion ...................................................................................................................... 46
Carpooling..................................................................................................................................... 46 Freight Rail ................................................................................................................................... 49 Air-Based Transportation.............................................................................................................. 50

Figures FIGURE 1: FUNCTIONAL CLASSIFICATION ........................................................................................ 3 FIGURE 2: DAILY TRAFFIC VOLUMES .............................................................................................. 5 FIGURE 3: EVENING PEAK HOUR LEVEL OF SERVICE ....................................................................... 7 FIGURE 4: CRASH CLUSTERS 2005-2007........................................................................................ 11 FIGURE 5: TRUCK GENERATORS AND POTENTIAL ROUTES ............................................................ 23 FIGURE 6: BICYCLE COMPATIBILITY ANALYSIS ............................................................................. 28 FIGURE 7: SCHOOL WALKING BOUNDARIES .................................................................................. 33 FIGURE 8: FIXED-ROUTE BUS, ACTIVE FREIGHT, AND PROPOSED PASSENGER RAIL ROUTES ........ 36 FIGURE 9: TRANSIT COMMUTE PATTERNS (2000) .......................................................................... 37 FIGURE 10: TRANSIT ALIGNMENT WITH POPULATION AND EMPLOYMENT DENSITIES ................... 39 FIGURE 11: TRANSIT ALIGNMENT WITH TRANSIT PROPENSITY LEVELS ......................................... 41 FIGURE 12: POTENTIAL LOT-SHARE OPPORTUNITIES NEAR NJ47 AND NJ55 ................................ 48 FIGURE 13: POTENTIAL LOT-SHARE OPPORTUNITY AT MEDICAL CENTER .................................... 48

City of Vineland Master Plan 1 Circulation Element
INTRODUCTION AND GOALS A circulation element is one of the recommended elements of a municipal master plan; as described in the New Jersey Municipal Land Use Law (NJSA 40:55D-28), a circulation element shows the “location and types of all modes of transportation required for the efficient movement of people and goods into, about and through the municipality.” This Circulation Element provides a far-ranging, comprehensive review of all modes of transportation within the City of Vineland: Vehicular (automobile and trucking) Pedestrian Bicycle Transit (including bus and passenger rail) Minor modes such as air and freight rail are covered in lesser detail. This Plan is as interested in the safety of all transportation modes, as their efficiency.
Goals: • Identify and address significant delays in the roadway system. • Improve the safety of the roadway system, particularly at identified problem areas. • Design roadways to fit into surrounding land uses while accommodating through travel
needs. • Maintain roadways adequate to support trucking to City farming, industrial and trucking
operations. • Design roadways to encourage travel speeds appropriate for all travel modes. • Develop bicycle facilities for both local and regional travel. • Extend the sidewalk system throughout the City, especially in high-priority areas. • Support increased use of transit services. • Protect existing rail infrastructure for freight and potential passenger service.
City of Vineland Master Plan 2 Circulation Element
VEHICULAR
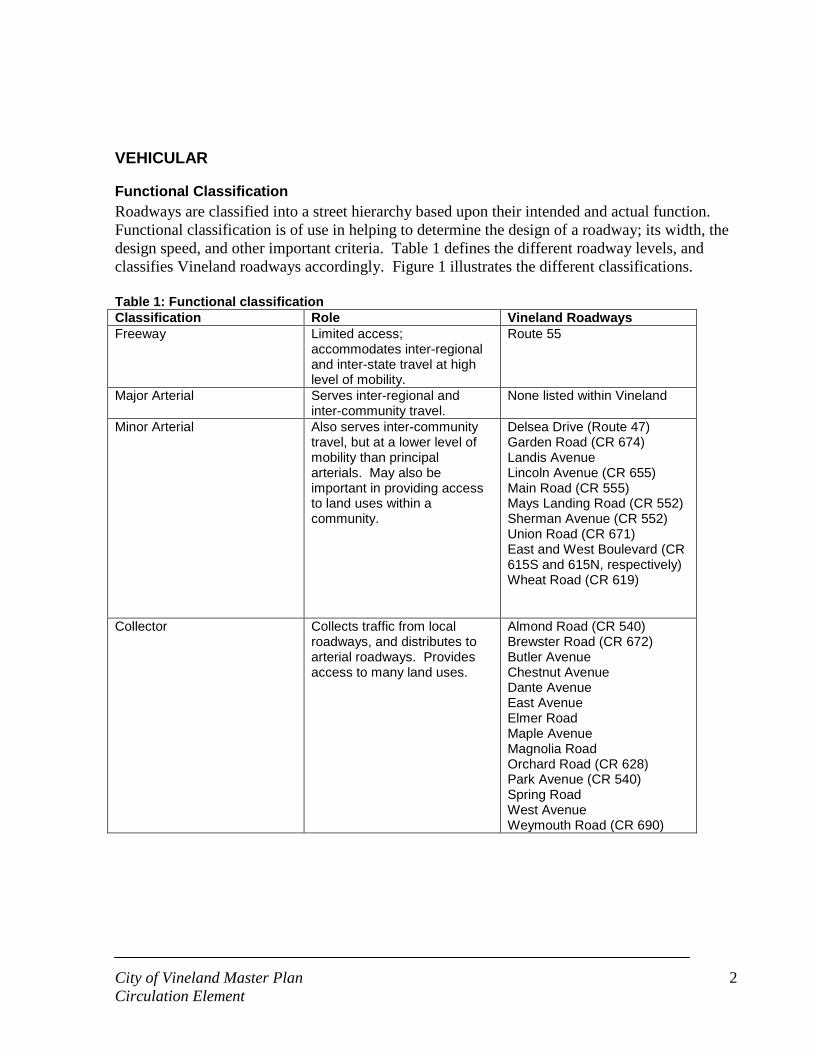
Functional Classification Roadways are classified into a street hierarchy based upon their intended and actual function. Functional classification is of use in helping to determine the design of a roadway; its width, the design speed, and other important criteria. Table 1 defines the different roadway levels, and classifies Vineland roadways accordingly. Figure 1 illustrates the different classifications. Table 1: Functional classification Classification Role Vineland Roadways Freeway Limited access;
accommodates inter-regional and inter-state travel at high level of mobility.
Route 55
Major Arterial Serves inter-regional and inter-community travel.
None listed within Vineland
Minor Arterial Also serves inter-community travel, but at a lower level of mobility than principal arterials. May also be important in providing access to land uses within a community.
Delsea Drive (Route 47) Garden Road (CR 674) Landis Avenue Lincoln Avenue (CR 655) Main Road (CR 555) Mays Landing Road (CR 552) Sherman Avenue (CR 552) Union Road (CR 671) East and West Boulevard (CR 615S and 615N, respectively) Wheat Road (CR 619)
Collector Collects traffic from local roadways, and distributes to arterial roadways. Provides access to many land uses.
Almond Road (CR 540) Brewster Road (CR 672) Butler Avenue Chestnut Avenue Dante Avenue East Avenue Elmer Road Maple Avenue Magnolia Road Orchard Road (CR 628) Park Avenue (CR 540) Spring Road West Avenue Weymouth Road (CR 690)

City of Vineland Master Plan 4 Circulation Element
NJ Route 55 is the sole freeway within the City; connecting Vineland to Central New Jersey and the Philadelphia region, it is important to the economic development of the city. There are no principal arterials within Vineland, although Route 47 does facilitate regional travel. There is an extensive network of both minor arterials and collectors across the City, with many of these being County roadways. Because minor arterials are not seen as having the essential mobility function that principal arterials do, there is some leeway in how these roadways can be designed to address community needs, as well as regional through movements. As is customary in Census years, the classification of all roadways in the region will be re-evaluated in 2010 by NJDOT, in concert with Cumberland County and SJTPO. The classification must ultimately be approved by the FHWA. As part of this process, it is recommended that the classification of the following roadways be evaluated, consistent with the need to accommodate traffic volumes in a growing community:
• Mays Landing Road east of Union Road – consider changing from collector to minor arterial. This roadway is the most direct route to the important Atlantic City labor market.
• Butler Avenue between Main Road and Lincoln Avenue – consider changing from local road to collector.
• Garden Road between Delsea Drive and the Boulevards – consider changing from local road to minor arterial or collector.
• Valley Avenue between Park Avenue and Wheat Road – consider changing from local road to collector.
• Spring Road between Magnolia Road and Lincoln Avenue – consider changing from local road to collector.
• Delsea Drive – consider changing from minor arterial to principal arterial.
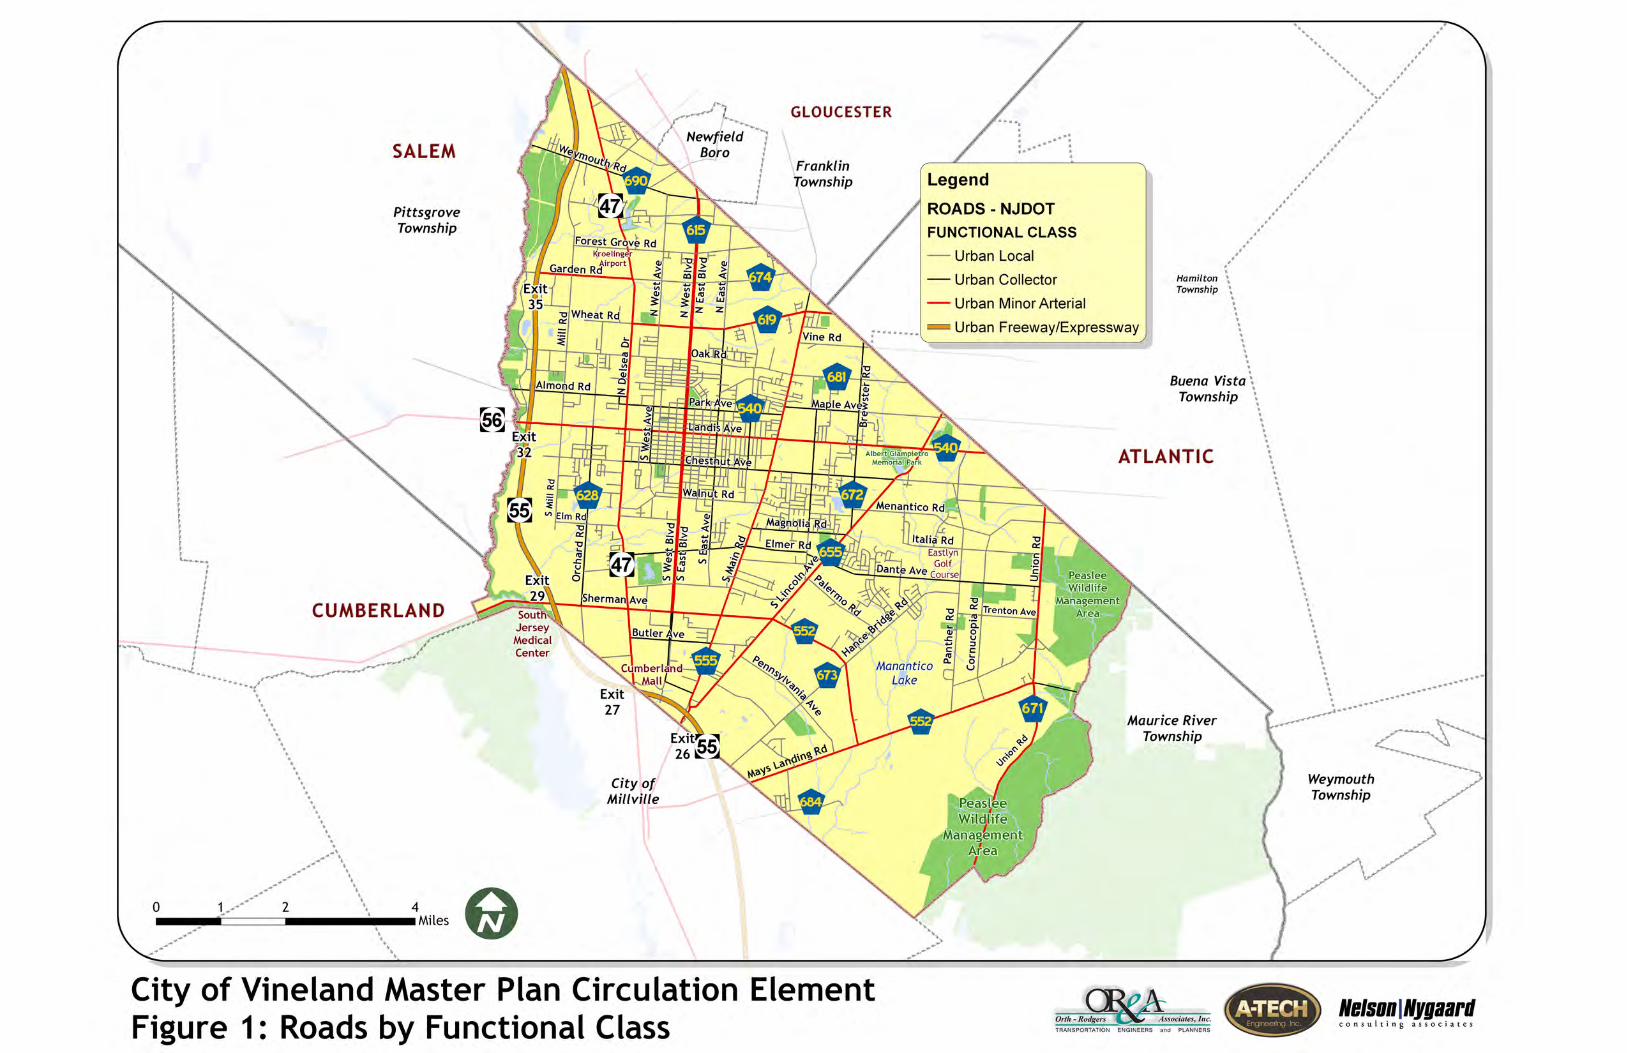
Traffic Volumes Average daily traffic volumes on Vineland roadways largely correspond to roadway classification, with heavier volumes typically found on the arterial roadways (Figure 2). Route 55 has the highest daily volume at 29,700. All of the roadways with daily volumes above 10,000 are arterials. Delsea Drive is roughly 23,000 from the middle of the city to the south. Landis Avenue has a daily traffic volume of 18,800 west of Delsea Drive, but the volume drops to 15,600 between Delsea Drive and West Avenue, and continues to fall as the roadway moves to the east. Main Road has the heaviest volume on the east side of the city, peaking at 18,100 in the vicinity of Landis Avenue. After Landis Avenue, Chestnut Avenue has the second highest volumes of municipal roadways, at 15,700. Some multi-lane roadways in the City have more capacity than needed to accommodate the traffic volumes. Two examples are Park Avenue, a five-lane cross-section with a volume of 11,500 or less, and West Boulevard, which is no higher than 4,000 north of Walnut Road.
City of Vineland Master Plan 6 Circulation Element
Directional flows are apparent on some major roadways. On Landis Avenue east of Route 55, eastbound traffic flow is more prominent in the morning peak hour, with westbound flow more prominent in the evening peak hour. Interestingly, this eastbound movement in the morning is less prominent on Landis Avenue east of Delsea Drive, as traffic seems to filter through the City to some extent. This could indicate a propensity toward the Atlantic City labor market. On Main Road in the southern half of the city, traffic flow northbound is more prominent in the morning peak hour.
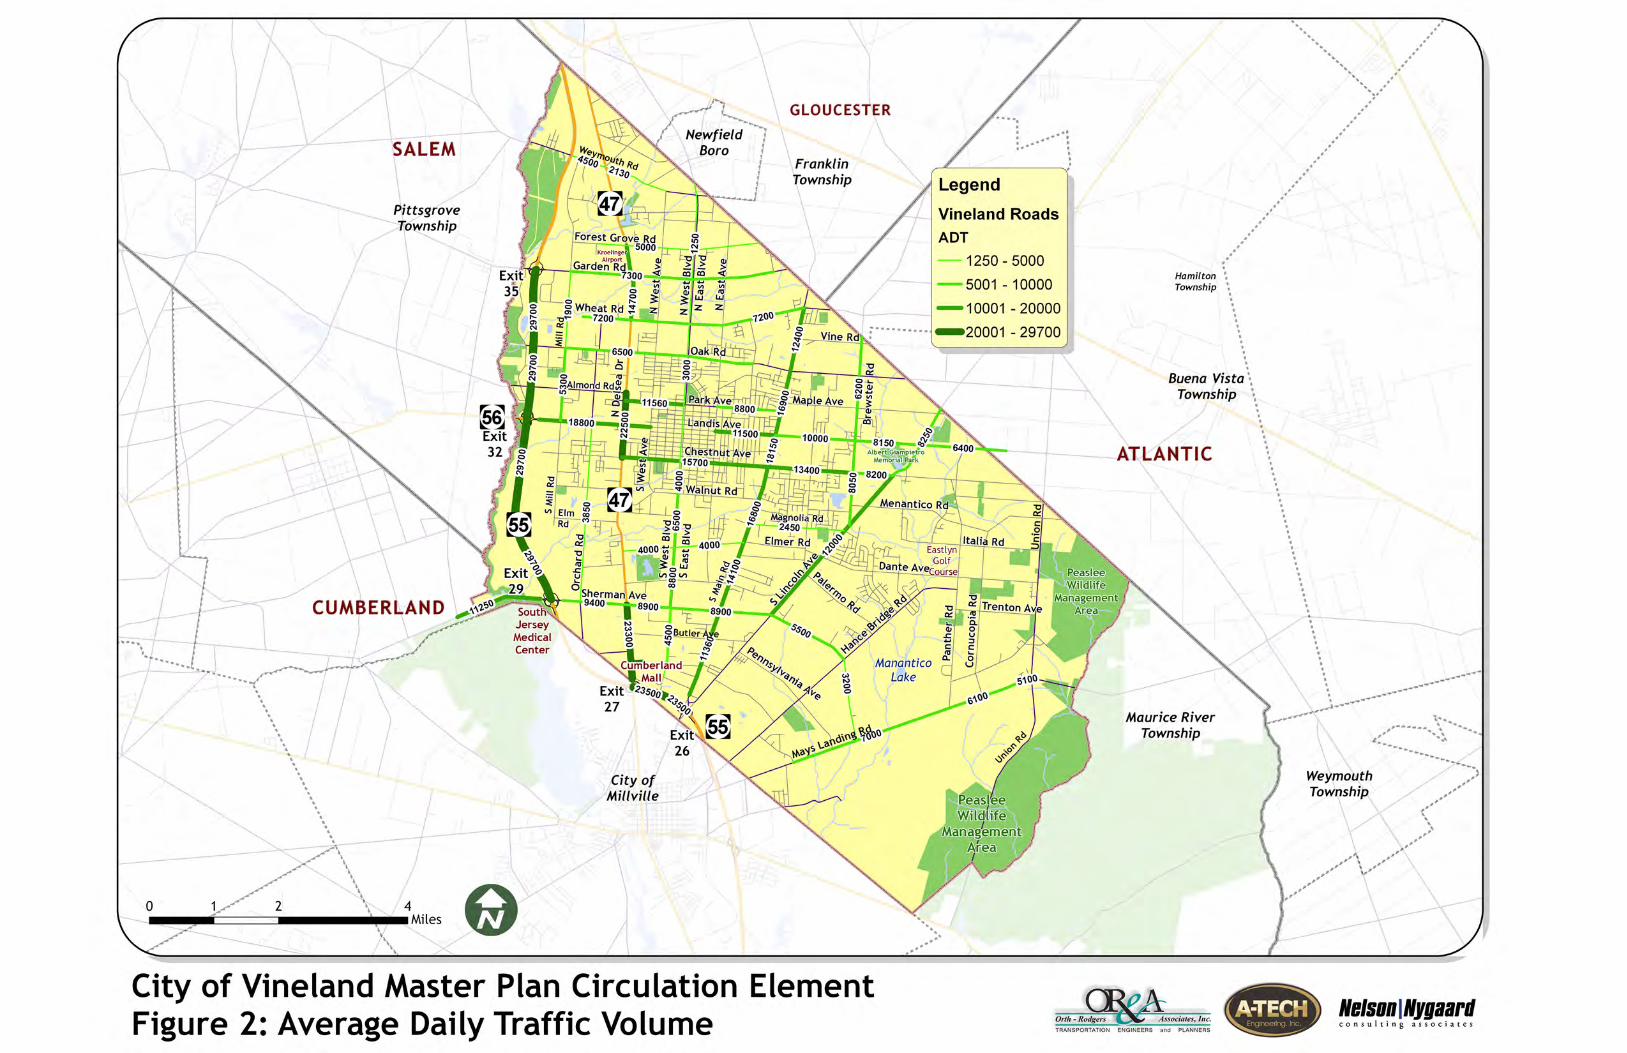
Levels of Service Traffic “levels of service” for key intersections were determined through a review of traffic impact studies filed with the City within the last five years. Level of service is used by traffic engineers to “grade” intersections by expected traffic delay. At signalized intersections, levels of service range from Level of Service ‘A’ (indicating average delays of 10 seconds or less) to Level of Service ‘F’ (indicating average delays of greater than 80 seconds). Level of Service ‘D’ is generally considered as the acceptable limit of delay for most drivers, and Levels of Service ‘E’ and ‘F’ are considered undesirable. The levels of service for signalized intersections are summarized in Table 2. Table 2: Level of Service for Signalized Intersections
Level of Service Average Total Delay per Vehicle (seconds)
A 0 to 10.0 B 10.1 to 20.0 C 20.1 to 35.0 D 35.1 to 55.0 E 55.1 to 80.0 F over 80.0
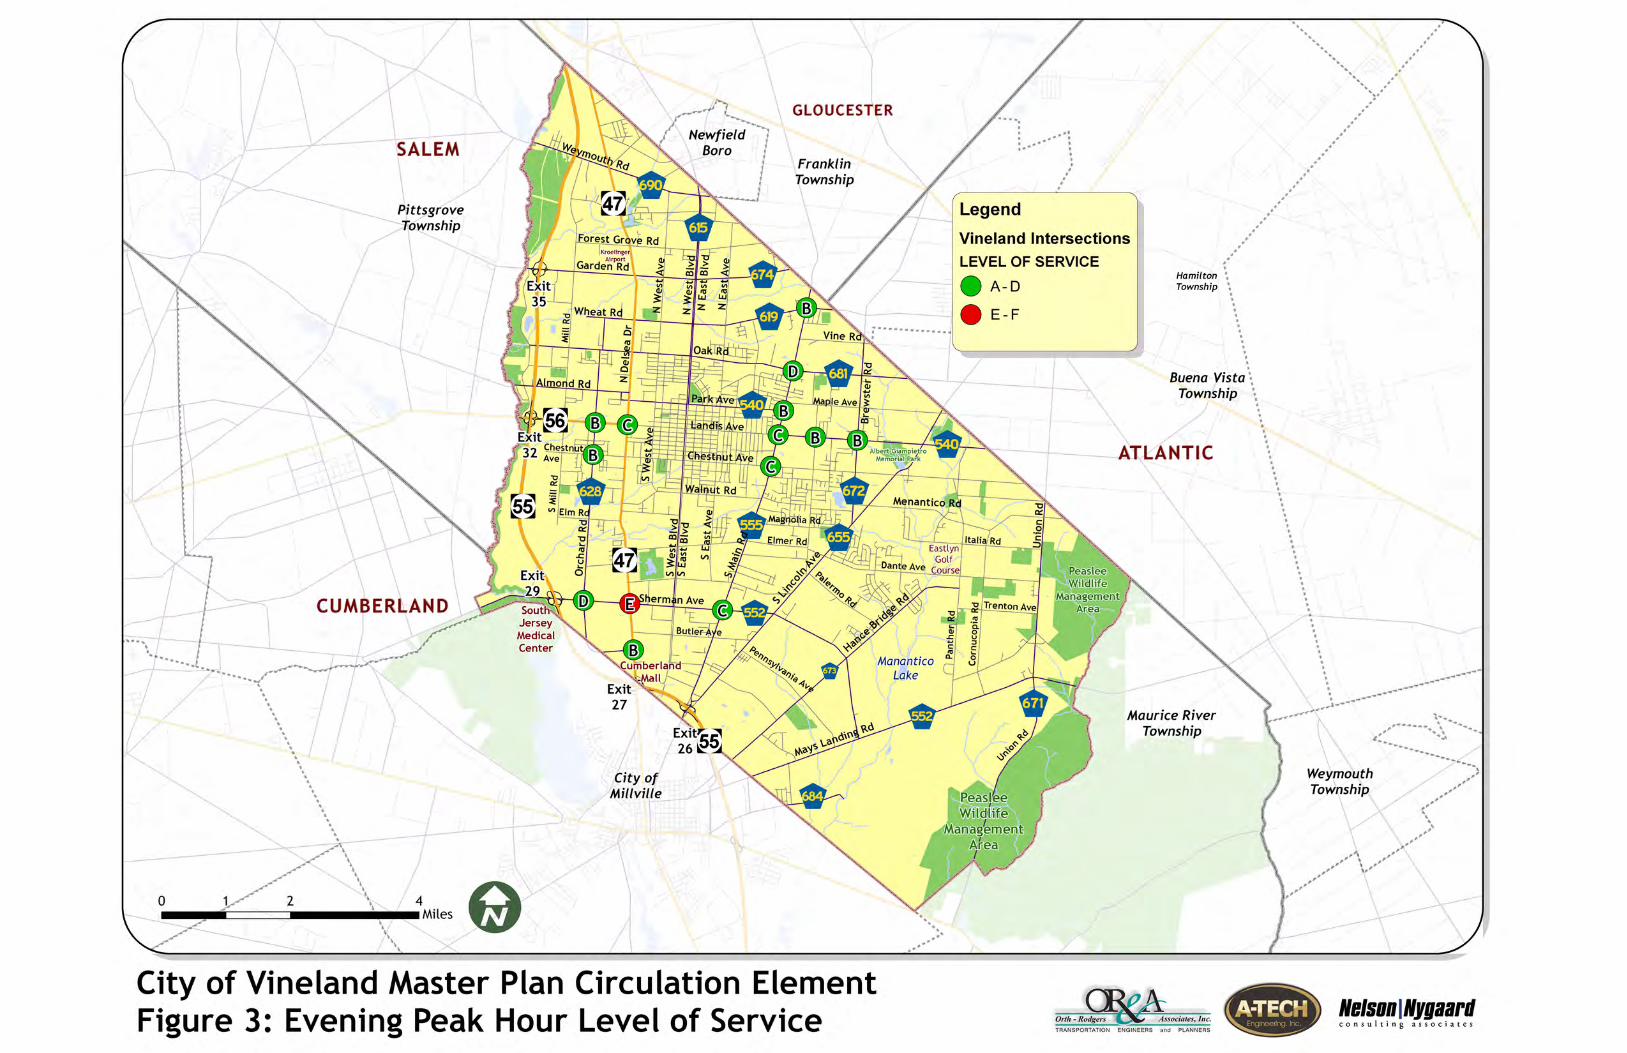
At signalized intersections, factors that affect the various approach capacities include width of approach, number of lanes, signal ‘green’ time, turning percentages, truck volumes, etc. Delays cannot be related to capacity in a simple one-to-one fashion. It is possible to have delays in the level of service ‘F’ range without exceeding roadway capacity. Figure 3 indicates the overall level of service (average delay for all vehicles) for intersections in the evening peak hour. As shown here, traffic delay is currently not a significant problem at most of the major intersections in the City. The only Level of Service ‘E’ is found at the intersection of Sherman Avenue and Delsea Drive; however, this LOS was documented in a traffic impact study from several years ago, and this intersection has subsequently benefitted from improvements that have reduced delays. Otherwise, all major intersections operate at a LOS ‘D’ or better. Along Landis Avenue, intersections operate at a LOS ‘C’ or better. Along Main Road, with the exception of the intersection of Oak Road and Main Road, five intersections evaluated operate at LOS ‘B’ or ‘C’.

City of Vineland Master Plan 8 Circulation Element
The overall level of service is not indicated for unsignalized intersections since average delay at such intersections is not an especially reliable gauge of intersection conditions. It is not unusual for stop-controlled movements at unsignalized intersections within the City to operate at a failing level of service. As only one example, Vineland residents have expressed concerns about delays when turning onto Delsea Drive from unsignalized streets. When delays at unsignalized intersections become substantial, the intersection can become a candidate for signalization in order to reduce the delay. At other unsignalized intersections, high delays can sometimes manifest themselves in a spike in angle crashes, as motorists begin to accept smaller gaps for turning onto the main road. Unsignalized intersections along growing traffic corridors in Vineland should continue to be monitored to determine if signalization will eventually be warranted. Based on field views conducted for the Circulation Plan, traffic queues were most prominent at unsignalized intersections at Sherman Avenue and the Boulevards; the County has already begun the process to plan signalization at this location. Traffic studies were conducted in 2003 for two county roadways which have seen growing traffic volumes: Sherman Avenue and Main Road. Both studies called for widening both roadways to a five-lane cross-section. Based on traffic volumes, Main Road is closer to justifying a five-lane cross-section, although two through lanes are still adequate in many sections. Traffic growth has been noted on Sherman Avenue in recent years, but at a daily volume of less than 10,000, the roadway will not need significant widening for years. Vineland is well poised to meet the needs of future traffic volume increases, since it is built upon a well-connected network of roadways. Right-of-way is sufficient along a number of these roadways to meet increased demands, and the network provides flexibility to a motorist to choose a variety of different routes. Recommendation: Both the County and City should continue to be vigilant about acquiring necessary right-of-way along arterials and major collectors to accommodate future physical improvements where justified; but there are no prominent missing roadway segments in the overall network that should be identified on the City’s official map.
Safety
High Crash Locations Improving the safety of travel on Vineland roadways is an important goal of this circulation plan. To obtain an understanding of the existing safety situation, the following crash data was reviewed for the period of January 1, 2005 through December 31, 2007:
• All crash reports for Landis Avenue. These reports were provided by the Vineland Police Department.
• Crash summaries for the large majority of County roadways within the City. The only county roadways for which the crash history was not reviewed were the lesser county roadways in the sparsely populated sections of the City: Hance Bridge Road (CR 673) and Union Road (CR 671). Based upon past experience, no intersection along these

City of Vineland Master Plan 9 Circulation Element
roadways would have made the threshold for analysis. The crash summaries were prepared by the New Jersey Department of Transportation (NJDOT) and the South Jersey Transportation Planning Organization (SJTPO).
• Crash summary for Delsea Drive (NJ Route 47). This summary was prepared by the NJDOT.
Table 3 summarizes the crash history for every intersection with at least 15 crashes, or an average of five crashes per year for the study period. To put these numbers into perspective, there are typically 3,000 crashes per year within the City. The crashes in this list total 740, or about 8 percent of the 9,253 crashes within the past three years. The number of crashes at each location is also visually illustrated in Figure 4. The incidence of crashes is highest on the major roadways – Delsea Drive, Landis Avenue, and Sherman Avenue. The crash incidence for many of the intersections corresponds to the level of traffic volumes that pass through the intersection, and is not a source of particular concern. This is particularly true for signalized intersections in which crash types are well dispersed with no significant pattern, or in which rear end crashes account for a high percentage of crashes. However, when there is a large number of left turn crashes and angle crashes, a signalized intersection may need further study. When the number of crashes begins to mount at unsignalized intersections, evaluation of various countermeasures – including signalization – should be considered.

City of Vineland Master Plan 10 Circulation Element
Table 3: Highest Crash Intersections 2005-2007 Rank Primary roadway Cross Street Type* Crashes Predominant Crash Types
1 Landis Ave Mill Road S 60 11 left turns (7 EB, 4 WB lefts); 13 rear-ends (7 EB); 26 angle (12 NB and EB conflicts)
2 Landis Ave Delsea Drive (Rt 47) S 55 33 rear-end (14 EB, 8 NB)
3 Delsea Dr (Route 47) Sherman Ave (CR 552) S 36 18 rear end (6 NB, 5 EB), 6 left turn (3 NB lefts, 2 SB lefts)
4 Sherman Ave (CR 552) South East Blvd U 35 27 angle (18 SB and EB conflicts)
5 Landis Ave Orchard Road (CR 628) S 33 12 left turn (6 EB, 6 WB lefts); 8 rear-ends (4 WB)
6 Landis Ave Main Road (CR 555) S 32 18 rear-end (7 WB, 6 SB), 6 left turns (3 SB lefts)
7 North West Blvd (CR 615S) Weymouth Rd (CR 690) U 31 29 angle (even distribution)
8 Oak Rd (CR 681) West Avenue U 29 16 angle (7 NB and EB conflicts); 6 left turns (all EB or WB)
9 Delsea Dr (Rt 47) Park Ave (CR 540) S 29 12 rear-end (4 SB, 4 WB) 10 Delsea Dr (Rt 47) Chestnut Avenue S 27 10 rear-end; 7 left turn
11 Park Ave (CR 540) West Avenue S 24 11 angle (5 NB and EB; 5 NB and WB conflicts); 7 left turns (3 NB, 2 EB)
12 Delsea Dr (Rt 47) Route 55 U 24 13 rear-end (7 NB, 6 SB); 4 head-on (NB and SB)
13 Landis Ave West Avenue S 24 9 rear end (7 NB)
14 Sherman Ave (CR 552) Orchard Road (CR 628) S 23 10 rear-end (4 EB, 5 WB), 5 angle (4 involving WB vehicles)
15 Sherman Ave (CR 552) Main Road (CR 555) S 23 12 rear end (5 EB, 6 SB) 16 Landis Ave East Avenue S 23 8 rear-end 17 Delsea Dr (Route 47) College Dr (CR 628) S 22 6 left turn (all NB lefts) 18 Sherman Ave (CR 552) Lincoln Ave (CR 655) S 21 8 rear-ends (4 WB, 3 SB)
19 Brewster Rd (CR 672) Lincoln Ave (CR 655) U 20 16 rear-end (all SB)
20 South West Blvd (CR 615S) Elmer Street U 19 14 angle (all SB and EB conflicts)
21 Wheat Rd (CR 619) East Avenue U 18 14 angle (11 NB and EB conflicts) 22 Delsea Dr (Route 47) Almond Road U 18 13 angle (6 NB and EB conflicts) 23 Landis Ave Valley Avenue S 18 9 rear-ends
24 Sherman Ave (CR 552) South West Blvd (CR 615S) U 17 13 angle
25 Main Rd (CR 555) Chestnut Avenue S 17 6 left turn (4 EB lefts) 26 Landis Ave 4th Street S 17 9 rear-ends (5 WB) 27 Oak Rd (CR 681) Mill Road U 15 11 angle (5 SB and WB conflicts) 28 Main Rd (CR 555) Magnolia Road S 15 7 rear-end (3 SB, 4 NB) 29 Delsea Dr (Rt 47) Oak Road (CR 681) S 15 6 angle (SB and EB conflicts)
*S – Signalized; U – Signalized


City of Vineland Master Plan 12 Circulation Element
Following is a discussion of those intersections that should receive the highest level of scrutiny, since they have conspicuous patterns of crashes, or because the number of crashes appears disproportionate to the traffic volumes at that intersection: Landis Ave (Route 56) and Mill Road – This signalized intersection had a higher number of crashes than any other intersection in the City, with 60 in the 3-year study period. This high number is troubling, in part, because traffic volumes on Mill Road are relatively small, and conflicts should theoretically be fewer here than at some other intersections in the City. The intersection had a higher number of left turn crashes (11) than any other intersection except for Landis Avenue and Orchard Road. All left turn crashes involved eastbound or westbound vehicles. This pattern may be traced in part to the intersection design: there are two unmarked lanes on both Landis Avenue approaches, so the inner lane functions as a left turn/through lane, and the outer lane functions as a through/right-turn lane. There is no dedicated phase for left turn movements. A higher number of left turn crashes is often associated with this type of intersection. A vehicle waiting to turn left may block sight lines, leading a motorist on the opposite approach to turn left into the path of a through motorist. Re-designing the intersection to create directly opposing left turn lanes, and perhaps a dedicated phase for left turn movements, should thus be investigated. Effectively addressing this situation would likely require geometric changes. For example, if changes are restricted to the existing cartway, the intersection approach on Landis Avenue could be converted to one left-turn lane and one through lane in each direction. This will increase traffic delays, and so should be evaluated before implementation. Alternatively, opposing left turn lanes could be added as part of roadway widening, providing a left turn lane and two though lanes on the Landis Avenue approaches. Of even greater concern, the number of angle crashes, at 26, far exceeded any other signalized intersection in the City. A high number of angle crashes should be closely scrutinized at any signalized intersection, because signalization is intended to address precisely the poor judgment calls by motorists that contribute to this type of crash. Of the 26 crashes, crash reports indicated that an eastbound motorist was at fault in 13, or half the crashes. Crash reports were analyzed to determine if a high number of the eastbound crashes took place in the morning, since sun glare, combined with heavy eastbound flows on Landis Avenue in the morning peak hour, would presumably contribute to this pattern. Interestingly, three crashes occurred between 7 to 7:30 AM, all on different spring mornings – but this does not explain the other 10 eastbound crashes. Possible measures to address this problem with angle crashes could include:
• Brighter LED signal lens to replace the current incandescent lens • Backplate behind signals, to heighten contrast with the signal lens • Advanced signal change warning flashers
Red-light running is likely involved in many of these angle crashes. Cameras have been developed to detect red light running, but these are not authorized for general use by New Jersey municipalities at the current time. The State is in the process of a trial program to evaluate the effectiveness of these cameras.
City of Vineland Master Plan 13 Circulation Element
Another factor behind the high number of eastbound crashes could be that this is the first signalized intersection that motorists encounter on their way into the city from western Cumberland County, or off the Route 55 expressway. The roadway is posted at 45 mph, with many motorists undoubtedly traveling at a higher speed; they may thus not be prepared to stop. In any event, this intersection should be a high priority for further studies as part of an effort to reduce crash rates. Sherman Avenue (CR 552) at South East Boulevard, and Sherman Avenue at South West Boulevard (CR 615S) – The unsignalized intersection of Sherman Avenue and South East Boulevard ranked fourth in the number of crashes at 35, and the unsignalized intersection of Sherman Avenue and South West Boulevard ranked 24th with 17. Both are all-way stop controlled, and both intersections feature a high number of angle crashes. The two intersections are in very close proximity, separated only by the railroad line. Particularly given the growing traffic queues at each intersection, both are candidates for signalization. The County Engineer’s office is advancing an improvement here; the project has been designed and is scheduled to be constructed in fiscal years 2010 and 2011 with federal funding. Landis Avenue at Orchard Road – This signalized intersection ranked 5th in crashes, with 33. It is the next intersection to the east from Landis Avenue and Mill Road, discussed above. It has a similar layout to that intersection – two unmarked lanes on both the eastbound and westbound approaches – and, like that intersection, it has a high number of left turn crashes, at 12. Also like Landis Avenue and Mill Road, the number of left turn crashes could likely be reduced with a redesign of the intersection. The incidence of red light running does not appear to be as pervasive here as at Landis Avenue and Mill Road, since the incidence of angle crashes was not unusually high. North West Boulevard (CR 615S) and Weymouth Road (CR 690) – This is an unsignalized intersection, with Weymouth Road being the stop-controlled approach. Ranking 7th in crashes with 31, this intersection is far too high on the list given the relatively low traffic volumes found on both of these roadways. Virtually all of the crashes are angle (29), although there is no pronounced orientation to these crashes. This intersection should be advanced for study. Oak Road (CR 681) and West Avenue – This intersection ranked 8th in crashes; of the 29 crashes, 16 were angle. It is unsignalized, with West Avenue being stop-controlled, with supplemental red flashers. The speed limit along Oak Road is 45 mph. An April 2009 safety study for the SJTPO recommended signalization of this intersection. Park Avenue (CR 540) and West Avenue – This signalized intersection ranked 11th with 24 crashes. It had a relatively high number of angle crashes, at 11, as well as seven left turn crashes. A field investigation revealed the lack of an “all-red” clearance phase between the Park Avenue and West Avenue signal phases, which likely helps explain some of the angle crashes. An all-red signal phase is particularly recommended, given the width of Park Avenue (60 feet). It is the only signalized intersection identified on field views in the City not to have an all-red phase. The City has begun to address this condition.
City of Vineland Master Plan 14 Circulation Element
Brewster Road (CR 672) and Lincoln Avenue (CR 655) – This unsignalized intersection ranked 19th in crashes; of the 20 crashes, 16 were rear-end southbound. Brewster Road is stop-controlled and “tees” into Lincoln Avenue. An April 2009 safety study for the SJTPO recommended signalization of this intersection. South West Boulevard and Elmer Street – This unsignalized intersection ranked 20th with 19 crashes. South West Boulevard is stop-controlled, and Elmer Street uncontrolled. There are 14 angle crashes, all of which involve southbound and eastbound vehicles (an unsurprising pattern, since both streets are one-way). The number of crashes is somewhat high given the moderate traffic volumes on both roadways. The presence of a hedge and tree along Elmer Street, and on-street parking on Elmer Street proximate to the corner, may contribute to sight distance issues for motorists approaching on South West Boulevard. It is noted that sight distance is more restricted here than at any other intersection along the Boulevards. It is recommended that this intersection receive further study. Wheat Road (CR 619) and East Avenue – This unsignalized intersection had 18 crashes, of which 14 were angle; 11 of these involved eastbound and northbound vehicles. The East Avenue approaches are stop-controlled. No condition about this intersection stands out, but the speed limit on Wheat Road is 50 mph, so motorists travel through here at a high speed. An April 2009 safety study conducted for the SJTPO recommended signalizing this intersection. Delsea Drive (NJ 47) and Almond Road – This intersection is unsignalized, with Almond Road being the stop-controlled approach. This intersection has apparently seen a decrease in crashes in recent months, following a change in traffic control to restrict motorists at both of the Almond Road approaches to right turns only. Vineland has expressed interest in signalizing this intersection in the past, but NJDOT has declined due to proximity to the existing signalized intersection of Park Avenue and Delsea Drive. The Wawa located in the southeast corner of this intersection generates heavy traffic volumes; many motorists departing the Wawa choose to turn right onto Almond Road, drive through the Forman Mills parking lot, and re-enter the roadway network at Park Avenue. Oak Road (CR 681) and Mill Road – This unsignalized intersection had 15 crashes. Of these, 11 were angle crashes, and 5 of these involved southbound and westbound vehicles. Until recently, this was a two-way stop, with Oak Road being the uncontrolled approach. The traffic controls have just been changed to a four-way stop. The crash history should be monitored going forward. Other Intersections Other intersections throughout the City may not have met the crash threshold to be listed in Table 3, but still present safety concerns. For example, the intersection of Forest Grove and Delsea Drive was recently identified as possessing poor sight lines in a safety audit conducted for NJDOT. The intersection of Spring Road and Lincoln Avenue is skewed, and is an example of an intersection that is likely to present safety concerns as traffic volumes increase in the future.

City of Vineland Master Plan 15 Circulation Element
Recommendation: Vineland should coordinate with the State, Cumberland County and/or SJTPO as needed to investigate above intersections called out for further study due to crash history.
Mid-Block Locations In addition to the intersections discussed above, there were a number of crash clusters at mid-block locations. Examples include: Delsea Drive (multiple locations) – Because of the heavy traffic volumes on Delsea Drive, and the high intensity of driveways, there are many places along Delsea Drive with regular crashes. As only two examples, a 500 feet segment around Hennis Road (just north of Route 55) had 29 crashes, and a 100-foot segment south of Park Avenue (CR 540) had 18 crashes. Landis Avenue east of Coney Avenue – There were 12 crashes in a 200-foot span east of Coney Avenue, with many of these due to vehicles turning in or out of the Sears shopping center. Park Avenue, 500-foot section east of Delsea Drive – There were 57 crashes in this segment, with many taking place in the vicinity of the driveway at the Forman Mills shopping center. This driveway accommodates much more traffic than that generated directly by stores at Forman Mills; many motorists departing the Wawa at the intersection of Almond Road and Route 47 also use this driveway to re-enter the public roadway network. Sherman Avenue, 50 to 100 feet west of Delsea Drive – This section had 33 crashes, of which 20 were angle; NJDOT reported that virtually all of these were conflicts between northbound vehicles (presumably vehicles pulling out of the two Wawa driveways) and eastbound vehicles on Sherman Avenue. It will be noted that all four of these areas are in retail commercial areas, which is where mid-block crashes tend to be most problematic in any town. Access management policies should thus be evaluated to see if they would be of assistance in addressing these areas.
Access Management Access management is the process of providing access to land development while simultaneously preserving the flow and safety of traffic on the adjacent road. It involves controlling the frequency, location and width of driveways. Studies are definitive that effectively controlling access can reduce the number of crashes on roadways. A high number of driveways, in close proximity to other driveways, is highly related to the number of crashes. Hence, access management is most efficiently targeted at arterial and collector roadways through commercial districts. Because NJDOT controls access to all state highways, Vineland is somewhat limited in its ability to restrict access points along Delsea Drive, the most problematic corridor. Municipalities can, however, ask developers to address circulation conditions off Delsea Drive, particularly by requiring them to seek establishing vehicular links to adjoining properties. Cross-access drives are particularly valuable when they enable visitors to a property not at a signalized intersection to

City of Vineland Master Plan 16 Circulation Element
eventually access a highway at a signalized intersection, or when they give motorists the option to access the public roadway network at a location with fewer vehicular conflicts. The City has recently approved the option of cross-access drives in its new Zoning Ordinance of June 30, 2008 (Article VII, Section F); the strategy should be used as part of development approvals along Delsea Drive and other growing commercial corridors whenever possible. Another access management issue concerns the manner in which left turns are provided to properties along busy commercial corridors. History indicates that the installation of a two-way left turn lane has been successful in reducing crash incidence where installed along Delsea Drive. NJDOT should thus consider extending the two-way left turn lane treatment on Delsea Drive below Chestnut Avenue. Field views of the roadway below Chestnut Avenue indicate that many motorists currently swerve into the shoulder to avoid motorists in front who have stopped to turn left into commercial uses. These sudden maneuvers can contribute to crashes. It should also be noted that there are locations for which controlling the number and location of driveways would make little additional difference. Volumes are high at the Forman Mills access to Park Avenue, in part, because it is accommodating motorists from the Wawa on Almond Road who wish to eventually head eastbound, as well as those who turn west in order to go south on Delsea Drive. The driveway from Sherman Avenue to the Wawa west of Delsea Drive is also noted as another crash cluster; further studies will need to take place here to determine if the situation can be remediated.
Other Safety Issues Commercial electronic variable messaging signs (CEVMS) used in outdoor advertising have assumed greater popularity around the state, and questions have arisen regarding their potential use in Vineland. Use of these signs has aroused concerns that they could increase distractions for motorists, and therefore increase the risk of crashes. One of the most comprehensive summaries of studies on the safety effects of CEVMS appears on the FHWA website (The Effects of Commercial Electronic Variable Message Signs (CEVMS) on Driver Attention and Distraction: An Update, February 2009). This report defines CEVMS as a “self-luminous advertising sign which depicts any kind of light, color, or message change which ranges from static images to image sequences to full motion video.” The FHWA report reviews other studies that have been conducted on the subject, and finds that “some studies show statistically significant driver safety concerns or distraction effects, but not all levels of distraction have negative safety impacts.” The report further cautions that it is difficult to quantify the percentage of crashes contributed to by such signs, since the “distraction from external factors is likely to be underreported and underrepresented in crash databases.” Recommendation: Since a number of studies have documented the potential of these signs to distract motorists, the City should carefully scrutinize any request for installation of such signs, especially in proximity to intersections and other areas where the full attention of the motorist

City of Vineland Master Plan 17 Circulation Element
should be focused on the roadway environment. Amendment of the Land Use Ordinance may eventually be required.
Roadway Design There is a greater awareness in recent years of how the design of roadways can impact the behavior not just of motorists, but of pedestrians and bicyclists. There is also a better understanding of how important the design of a roadway can be to the character of a place. For example, the presence of a wide roadway will encourage motorists to drive faster, all other things being equal, and discourage pedestrian crossings of that roadway. In an area with high vehicular speeds, parents will feel less comfortable about letting their children play in a park adjacent to such a roadway. A well connected sidewalk system, with sidewalks set back from the street by a grass buffer or parked cars, will make pedestrians feel more secure, and encourage more walking. Finally, the very appearance of a roadway and adjacent land uses contributes to the perception that people have of a certain place. Realtors refer to this perception as “curb appeal.” The idea that the design of a roadway should be compatible with the surrounding community is perhaps best known as “context-sensitive design.” This is also the animating idea behind “Smart Transportation,” popularized in a Guidebook of the same name issued by NJDOT and PennDOT in March 2008. A core idea behind Smart Transportation is that road design is not a matter of “one size fits all,” and that the design of a roadway should flex to fit its environment. Rather than approaching all arterial and collector roadways as if they should have the same typical section – with a travel lane width of 12 feet, and shoulder of at least 8 feet – and as if the over-riding goal of every such roadway should be to expedite vehicular movement, Smart Transportation emphasizes that roadways should be sized to fit into the surrounding land uses, even while they fulfill their intended function. For example, for arterial and collector roadways through neighborhoods and in traditional business areas, consideration should be given to travel lanes less than 12 feet in width, particularly if it means that there is available room to install bike lanes, or if it means being able to provide adequate room for pedestrian facilities. A narrower roadway can also be desirable for streets where an important goal is to temper speeding. On the other hand, the wider travel lanes and shoulders should be provided for the higher-speed roadways on which efficient regional travel is desirable. Wider lanes are also desirable for roadways with high traffic volumes and regular truck volumes. Vineland has many active industrial uses, and the roadways traveled upon by the vehicles that serve these facilities should be sized accordingly. Currently, the Land Use Ordinance states that a minor collector shall be at least 40 feet, and major collectors and arterials should be 40 to 60 feet. To provide a more nuanced perspective on roadway design, Table 4 indicates dimensions which should be considered for design elements on arterial and collector roadways in Vineland, within the three major land classifications of urban, suburban, and rural. Much of the “Old Borough” section of the City would be considered

City of Vineland Master Plan 18 Circulation Element
urban. Suburban areas surround the Old Borough, and are found along higher order roadways elsewhere. Extensive sections of the City on the perimeter would be considered rural. Table 4: Design Element Recommendations for Arterial and Collector Roadways Urban Suburban Rural Travel Lanes Typical 11 or 12 ft;
consider 10 ft. lanes for streets on which lower speeds are acceptable or desired, or to fit in bike lanes. Consider 14 ft lanes for bike-compatible lanes.
Typical 11 to 12 ft (12 ft typical for truck routes); consider 14 ft for bike-compatible lanes.
11 to 12 ft.
Shoulders Consider bike lanes instead of shoulders; on most roadways in urban areas, on-street parking provided instead of shoulders.
6 to 10 ft. 4 to 8 ft.
Bike Lane 5 to 6 ft. 5 to 6 ft., if shoulder not present
5 to 6 ft., if shoulder not present
Curb Radius 10 to 40 ft 25 to 50 ft; strive for above 35 ft in areas with regular large truck activity
25 to 50 ft; strive for above 35 ft in areas with regular large truck activity
On-Street Parking Typical 7 to 8 ft. parallel parking; angled parking downtown.
Provide on-street parking as needed in suburban neighborhoods.
NA
Grass buffer 4 to 6 ft. along neighborhood streets; not needed downtown.
4 to 8 ft. NA
Sidewalk 6 to 14 ft downtown. Min. 5 ft for suburban commercial centers; min 4 ft acceptable for suburban neighborhoods.
NA
The width of a travel lane should depend on a variety of factors: desired vehicle operating speed, surrounding land uses, truck and bus volumes, total volumes, and bicycle facility. The width of a shoulder depends on similar factors. For both, higher speeds and volumes, and presence on a regular truck or transit route, would usually point to wider facilities. Today a bike lane is only present along Delsea Drive; bike lanes can be useful in encouraging greater bike activity, and safer bicyclist actions. On-street parking is most prevalent in the Old Borough. Parallel parking is used along most roadways, although angled parking is found along Landis Avenue and the Boulevards. The latter is a useful means of increasing parking supply and taking up room on overly wide streets.

City of Vineland Master Plan 19 Circulation Element
The curb radius is an important design element in a municipality like Vineland with active industries and trucking companies, since it affects how large vehicles navigate turns at intersections. The Vineland Land Use Ordinance calls for a curb radius of at least 35 feet when connecting to arterials and collectors. This radius is appropriate for the intersections of most of the higher order roadways with one another, or when local roadways from industrial areas connect with higher order roadways. For intersections on higher-order roadways with regular turning tractor-trailer traffic, a radius of 40 feet or more may be recommended. It should be noted that a local trucking firm has requested a re-design of the intersection of Orchard Road and Sherman Avenue to permit trucks to more easily turn west onto Sherman Avenue. The Landis Sewerage Authority has also requested larger curb radii at this intersection, as well as at Landis Avenue and Mill Road. However, a large curb radius is not needed for the intersection of many local roadways with arterials and collectors, particularly when the largest design vehicles to regularly turn at such intersections are school buses or delivery vehicles. A larger curb radius results in a longer pedestrian crossing. At such intersections, a radius of 25 feet is sufficient, and even smaller radii can be considered depending upon the design vehicle. The recommendations for a sidewalk and grass buffer are based on what is needed to comfortably accommodate pedestrian travel. A minimum 4-foot sidewalk – with intervals of 5 feet sidewalk – is required by ADA. Recommendation: It is recommended that the Land Use Ordinance be revised to reflect the range of design elements available on roadways. Motorist, pedestrian and bicycle behavior alike is also affected by the design of the overall roadway network. It is noted that the Land Use Ordinance indicates that the utilization of cul-de-sacs and loop streets is encouraged. While cul-de-sacs obviously have the potential to reduce vehicular traffic on those streets, they also increase the length of trips for pedestrians and bicyclists, and restrict the options of local motorists. Measures other than cul-de-sacs can be used to discourage an excessive number of non-local trips, if that is the primary concern; traffic calming measures serve to reduce both speeds and “cut-through” behavior by motorists from outside the neighborhood. In general, interest has been greatly heightened in the benefits of well-connected roadway networks in recent years. When motorists have more options to travel from one point to another, greater flexibility is permitted in designing individual streets. Conversely, when a roadway network is so poorly connected that residents must drive on a higher order roadway to engage in simple errands – such as buying a gallon of milk – or to access parks or schools, greater pressure will be placed on widening that roadway at some point. This will make that roadway less amenable to pedestrians or bicyclists, especially children. Compounding the problem, in the absence of a well-connected network, these user groups have fewer options from traveling from one neighborhood to another.

City of Vineland Master Plan 20 Circulation Element
Further, an increasing number of municipalities have realized that well-connected street networks improve the quality of utility connections and enable more efficient trash collection. They provide better emergency vehicle access, and permit a fire station to provide service to a greater number of commercial and residential units. In all these respects, a well-connected network can reduce the cost of municipal services. Some municipalities increasingly encourage connectivity, such as by setting a maximum block length in new developments of 600 feet, but permitting a greater block length along arterials. Vineland’s Master of Plan of Streets is an effective tool that can be used to encourage well-planned and efficient street networks; it should continue to be developed to meet the needs of the growing community, and to reflect revisions of the Zoning Ordinance. Recommendation: The Land Use Ordinance should eliminate language encouraging the use of cul-de-sacs. There should also be a re-evaluation of the maximum block length of 1,320 feet in the Land Use Ordinance, with consideration given to a dimension of 600 feet. The City’s Master Plan of Streets should encourage efficient, well-connected networks.
Posted Speed As discussed above, the ambient speed of traffic along a roadway plays an important part in determining if that roadway is comfortable for non-motorized travel. As part of a “Smart Transportation” approach to roadway design, the posted speed of all arterial and collector roadways within Vineland should be evaluated to determine if they are consistent with the intended function of that roadway. Arterial and collector roadways within populated areas of Vineland are distinguished by a large number of roadways posted from 40 to 50 mph, and some at 35 mph and 30 mph. For wide roadways on which mobility is critical, and pedestrian activity and bicycle activity are minimal, then posted speeds of 40 mph and above may be appropriate. But if roadways pass through medium density or greater neighborhoods, in which pedestrian and bicycle activity is to be encouraged, higher speeds are less desirable. A review of posted speeds in Vineland indicates that sometimes these speeds increase as a roadway passes from the historic “Old Borough” section of the City into what had been the Township, even if there are no other conditions present that would suggest a higher speed is appropriate. One of the better examples is found along Park Avenue. The speed limit is 35 mph west of East Avenue, and 40 mph east of East Avenue, even though the section to the west is predominantly a five-lane cross-section, with large sections of commercial uses; the section to the east is a two-lane roadway of 32 feet in width, passing through a residential neighborhood, including a garden apartment complex. West Avenue is posted 40 mph where it passes through a medium density residential neighborhood just north of Park Avenue, although the total roadway width here is a modest 30 ft. In both cases, a speed limit of no more than 35 mph would be more appropriate. On Valley Avenue above Park Avenue – a section with no sidewalks, travel lanes of 11 feet, and only 2-foot shoulders – the speed limit is 35 mph. On this section, a speed limit of 30 might be more appropriate.

City of Vineland Master Plan 21 Circulation Element
If the primary goal on all of these roadways is vehicular mobility, then placing speeds in the higher range of what is typical for similar roadways in residential neighborhoods is appropriate. However, given the wide choice of higher order roadways motorists can use to cross Vineland, lower speeds should be considered in certain cases. Recommendation: The posted speed should be evaluated on roadways of 35 to 45 mph that are adjacent to medium density neighborhoods or above, important community facilities such as parks, or traditional commercial areas, especially for narrower roadways with sub-standard pedestrian facilities. Lower speeds would also be desirable on roadways selected as part of bicycle network. Reductions of posted speed by 5 mph to a range of 30 to 35 mph in some sections may be justified.
Residential Traffic Management Program Interest has been expressed in a traffic calming program, also known as a “residential traffic management program.” Traffic calming is defined as “the combination of mainly physical measures that reduce the negative effects of motor vehicle use, alter driver behavior and improve conditions for non-motorized street users.” Its focus is to encourage motorists to drive at a speed which residents of the area consider compatible with the surrounding land uses. The classic traffic calming situation is when high traffic speeds have been identified as an issue on residential roadways. If the City wishes to institute a formal program, it should establish guidelines indicating that it will consider installation of a traffic calming measure only for those roadways where the 85th percentile speed of motorists exceeds the speed limit by 8 mph, or if cut-through volumes exceed 100 trips per hour and comprise more than 40% of the street’s traffic volumes. Before installing any measure, Vineland should gather traffic data; evaluate a range of measures before selecting the most appropriate; and finally conduct a survey of residents on the affected street to determine if they would support installation of the measure. A threshold of support of 65 to 70% of ballots received from residents is usually sought. Examples of traffic calming measures include: On-street parking - One study found that the presence of on-street parking slowed motorist speeds 7.5 mph compared to similar roadways. Speed hump - This is the single most popular traffic calming measure in use across the country. Speed humps are inexpensive, and very effective at what they are intended to do. The most common profile of a speed hump is 3 inches in height, and 12 to 14 ft. in length. They typically slow vehicles to 15 mph. Flat-top speed humps can be used for a higher design speed of 20 to 25 mph. Traffic circle - Smaller in diameter than a roundabout, traffic circles are used at intersections only on minor collector and local roadways. The diameter of circles varies from 13 to 33 ft. Circles are used on streets as little as 24 ft. in width. These are very popular across the country. Studies show that vehicles slow by 4 to 6 mph in the proximity of traffic circles.

City of Vineland Master Plan 22 Circulation Element
Recommendation: The City should evaluate whether to institute a traffic calming program intended for residential streets.
Trucking Routes The City has an active and growing industrial base, and large trucks are thus regularly seen on certain City streets. On regular truck routes, the needs of large vehicles should be taken into consideration. Figure 5 indicates the location of major trucking generators in the City; these include produce brokers, produce freezers, cement manufacturing, landscaping, and trucking companies themselves, such as National Freight Incorporated. Figure 5 indicates the roadways that trucks generated by these establishments would logically follow to access Route 55. In general, trucks should use arterial and collector roadways whenever possible, and seek routes that are removed from residential neighborhoods and community facilities such as schools. Figure 5 also includes roadways, in general, that should be used by trucks that pass through the community. The City currently does not have a truck route system. In general, there are three means for setting up a truck route system:
1. Designate certain roadways as truck routes in the City ordinance; 2. Place weight restrictions on certain roadways in the City ordinance, thereby encouraging
trucks to use other, preferred roadways by default; and, 3. Rather than amend the City ordinance, meet with representatives from the companies
generating truck traffic and informally agree on the routes that they should travel. Option 3 is less onerous, and should thus be explored before resorting to options 1 and 2. It should also be noted that roadways can be designed to attract trucks, such as through the use of larger curb radii and other design features. Recommendation: The City should establish preferred truck routes to be followed by local companies, using the routes recommended in Figure 5 as a template.

City of Vineland Master Plan 24 Circulation Element
PEDESTRIAN AND BICYCLE
Pedestrian and Bicycle Safety Pedestrian and bicycle crash summaries in the City of Vineland for the study period were provided by the Transportation Safety Resource Center at Rutgers University. There were 192 pedestrian and bicycle crashes in Vineland from 2005 to 2007, with a virtually even split between the two modes: 97 pedestrian crashes, and 95 bicycle crashes. Given that pedestrian activity in the City greatly exceeds bicycle activity, these statistics indicate that riding a bicycle is much more hazardous than walking. Crash clusters for pedestrians and bicyclists are not as prominent as vehicular clusters, but there were roadways on which these crashes were more frequent, as summarized below:
• Delsea Drive – 29 – 4 crashes by Cumberland Mall – 3 crashes by Shop-Rite – 3 crashes just south of Chestnut Avenue
• Chestnut Avenue – 21 – 3 crashes by Chestnut Square Apartments
• Landis Avenue – 17 • East Avenue – 9 • Almond Road, Park Avenue – 8 • Main Road – 8
Delsea Drive is a locus for pedestrian and bicycle crashes for the same reason that it sees many vehicular crashes – there is a high amount of vehicular activity and many turning movements, and pedestrians and bicyclists are regularly present, if never in high numbers. The Cumberland Mall and Shop-Rite are both popular commercial destinations. There were three pedestrian crashes in the 100-foot segment on Delsea Drive just south of Chestnut Avenue. In addition to these crashes, there was a cluster of three crashes on Chestnut Avenue itself, proximate to the high pedestrian generator of the Chestnut Square Apartments. Also on Chestnut Avenue there were two pedestrian crashes at Vineland High School South, and two bicycle crashes at the intersection with Valley Avenue. There were two pedestrian crashes on Landis Avenue near 8th Street, and two bicycle crashes at West Avenue. Circumstances in pedestrian and bicycle crashes can be harder to diagnose than vehicular crashes – particularly when there are relatively low numbers at crash clusters – but any future studies intended to improve pedestrian and bicycle safety should start with the corridors listed above.

City of Vineland Master Plan 25 Circulation Element
An analysis of all 12 bicycle crashes along Landis Avenue during the study period indicates the degree to which bicyclist actions can contribute to crashes. Of the 12 crashes:
• Bicyclists crossed during a red signal in three crashes • Bicyclists rode on the wrong side of the street in two crashes • In two crashes, bicyclists rode on the wrong side of the street and against the signal • In three crashes, motorists appeared to be at fault; two turned left into a bicyclist, and one
pulled out from a driveway • Two crashes were ambiguous regarding who was at fault
In summary, bicyclist actions appeared to contribute to seven crashes, motorists to three, with two unknown. Recommendation: Pedestrian and bicycle safety studies should be concentrated on the corridors identified above. A bicyclist education program should be considered to help promote safer bicycle activity.
Vineland Ordinance The overall approach to accommodating pedestrians and bicyclists in Vineland should be re-calibrated. As stated in the Land Use Ordinance, Section 300-75.C.2, “Separate pedestrian and bicycle path systems are encouraged to ensure safe segregation from vehicular traffic.” It is certainly the case that sidewalks should be installed along all roadways in Vineland with regular pedestrian activity, and that pedestrians are better off not walking in a roadway immediately adjacent to vehicular traffic. But in many cases, sidewalks will need to be installed directly adjacent to the roadway. Further, it is highly infeasible to expect to accommodate all needed bicycle travel to take place on separate paths, and there are no such paths in Vineland today. Increasingly, jurisdictions across the country are emphasizing the idea of “Complete Streets”, which can be safely used by all transportation modes. As stated on the Complete Streets website (www.completestreets.org), “Pedestrians, bicyclists, motorists and transit riders of all ages and abilities must be able to safely move along and across a complete street.” Recommendation: When new roadways are built in the future, or existing roadways reconstructed or resurfaced, the project should always be evaluated to determine if it will accommodate pedestrians and bicyclists in a safe manner. The Vineland Land Use Ordinance should be revised to reflect this approach.
Bicycle Facilities There are four primary types of bicycle facilities, three on-road, and one off-road:
• Bicycle lane – striped lane and markings on the roadway, designating an area for preferential or exclusive use by bicyclists; typically 5 to 6 feet in width.
• Shoulder – typically minimum of 4 feet. Studies show that the practical effect of shoulders differs little from bike lanes, on roadways without on-street parking.
City of Vineland Master Plan 26 Circulation Element
• Wide curb lane – Outside travel lane of at least 14 feet in width on most roadways. A travel lane of 12 feet is adequate on low-speed, lower volume roadways without parking. A width of 15 feet is recommended on roadways with steep grades, and above 40 mph.
• Shared use path – Path lying outside the roadway; minimum of 8 ft., with 10 feet preferred, and 12 feet desirable on shared use paths with regular use.
The only designated bicycle facility in the City is a bike lane on Delsea Drive in the proximity of Cumberland Mall. There are no bike routes, bike lanes, or shared use paths. The Cross County TMA has documented other existing and planned bicycle facilities throughout the County in a December 2007 report. This report indicates that a bike lane has been proposed for Route 49 to the south, through Maurice River Township and the City of Millville. A bike lane has also been proposed for installation along Route 40 to the north, through Salem, Gloucester and Atlantic Counties. It would be desirable if bicycle facilities were designated through Vineland to connect to these facilities, to accommodate and encourage bicycling through the region. To determine the adequacy of City roadways for bicycle travel, a bicycle compatibility analysis was conducted. The criteria used to analyze bicycle compatibility of City roadways are taken from NJDOT’s Bicycle Compatible Roadways and Bikeways Planning and Design Guidelines (April 1996). It is the policy of NJDOT to promote bicycling as a “legitimate choice of personal transportation for short trips.” To accomplish this, NJDOT has issued design guidelines for accommodating and encouraging shared use of roadways by motor vehicles, bicycles, and pedestrians. The NJDOT guidelines specify the minimum recommended pavement width and facility type (shared lane or shoulder) for shared use by bicycle and motor vehicle traffic. The criteria used to determine compatibility are lane width, shoulder width, traffic volume, speed limit, the character of the area (urban or rural), the presence (or absence) of on-street parking, and heavy truck use. Table 5 shows how this data is used to determine whether a roadway is bicycle compatible and which type of facility is best suited given roadway characteristics.

City of Vineland Master Plan 27 Circulation Element
Table 5: NJDOT Bicycle Compatibility Guidelines Condition I: AADT 1200*-2000 Speed Limit Urban w/ Parking Urban w/o Parking Rural < 30 mph Shared lane (12 ft.) Shared lane (11 ft.) Shared lane (10 ft.) 31-40 mph Shared lane (14 ft.) Shared lane (14 ft.) Shared lane (12 ft.) 41-50 mph Shared lane (15 ft.) Shared lane (15 ft.) Shoulder (3 ft.) >50 mph Not Applicable (NA) Shoulder (4 ft.) Shoulder (4 ft.) *For volumes less than 1200, a shared lane is acceptable. Condition II: AADT 2000-10,000 Speed Limit Urban w/ Parking Urban w/o Parking Rural < 30 mph Shared lane (14 ft.) Shared lane (12 ft.) Shared lane (12 ft.) 31-40 mph Shared lane (14 ft.) Shared lane (14 ft.) Shoulder (3 ft.) 41-50 mph Shared lane (15 ft.) Shared lane (15 ft.) Shoulder (4 ft.) >50 mph Not Applicable (NA) Shoulder (6 ft.) Shoulder (6 ft.) Condition III: AADT over 10,000 or Trucks over 5% Speed Limit Urban w/ Parking Urban w/o Parking Rural < 30 mph Shared lane (14 ft.) Shared lane (14 ft.) Shared lane (14 ft.) 31-40 mph Shared lane (14 ft.) Shoulder (4 ft.) Shoulder (4 ft.) 41-50 mph Shared lane (15 ft.) Shoulder (6 ft.) Shoulder (6 ft.) >50 mph Not Applicable (NA) Shoulder (6 ft.) Shoulder (6 ft.)
*Note: Whenever possible, minimum 8-foot shoulder should be provided on roadways with an AADT greater than 10,000 vehicles.
The analysis was conducted on all major roadways in the City. These were selected because they comprise an effective network, with access to the more important land uses in the City. Bicyclists, like motorists, generally aspire to reach their destination in the shortest time possible. The results of the compatibility analysis are shown in Figure 6. On the positive side, the analysis indicates that a good majority of roadways in the City are bicycle-compatible; this is chiefly due to the presence of shoulders of at least 4 feet (and typically greater) found along many of the county roadways, as well as higher-order municipal roadways. On roadways without parking, studies indicate that bicyclists tend to operate in shoulders in a very similar manner to bike lanes, even though there is a technical difference between the two facilities: a bike lane is reserved for preferential use by bicyclists, which is not the case with shoulders. It should be acknowledged that bike lanes do have some advantages over shoulders on such roadways – they do a better job of “advertising” that bicyclists are welcome on these roads, and they provide more specific guidance on which roadways a bicyclist might consider taking through the community. Examples of roadways that are considered bicycle-compatible due to the presence of shoulders include Delsea Drive, Almond Road, Sherman Avenue, parts of South West and North West Boulevards, and Lincoln Avenue.


City of Vineland Master Plan 29 Circulation Element
Other roadways are considered bicycle-compatible because the traveled lane width is considered adequate as a “shared lane” by motorists and bicyclists. This is true of several streets in the more urban center of Vineland, such as West Avenue and East Avenue, where the travel lanes are 15 or 16 feet, and where the posted speeds do not exceed 40 mph. These roadways would not be bicycle-compatible with the presence of parked cars, but either because of the presence of “no parking” signs in some cases, or because very few motorists choose on-street parking in places where parking is permitted, these and other roadways without shoulders would be considered bicycle-compatible. On the negative side, some of the key roadways in the core of Vineland – in or proximate to the “Old Borough” – are not bicycle-compatible. Some examples include Park Avenue and Chestnut Avenue, which lack shoulders or bike lanes, and do not have wide outside travel lanes. There are also examples of county roadways in more suburban parts of the City that would not be considered bicycle-compatible, due to minimal shoulder width. Examples include much of Oak Road, a section of Wheat Road west of West Avenue, and Mill Road south of Landis Avenue. The sections of Landis Avenue and the Boulevards in the middle of the City are interesting cases. Both have front-in angle parking, which is considered undesirable along bike facilities, since the concern is that motorists backing into the street from these spaces may not have ideal visibility of approaching bicyclists. However, a review of the crash history of Landis Avenue indicates a scarcity of incidents between vehicles backing up from these spaces and bicycles. The volume of bicyclists is unknown, so it may also be a question of how many bicyclists ride on the street versus the sidewalk. There is 21 feet between the angled parking spaces and the Landis Avenue centerline, which bicycle professionals in other jurisdictions have found adequate for accommodating bicyclists in the presence of angled parking. On each of the Boulevards, angle parking is found on the left side of the roadway (from the perspective of the approaching motorist), with a shoulder on the right side. This shoulder is of a bicycle compatible width. Vehicles are permitted to park in the shoulder; however, because relatively few vehicles are, the roadways may be essentially considered bike-compatible. For the reasons above, Landis Avenue and West Boulevard are shown on Figure 6 as “bicycle compatible with conditions.” A more extensive review should take place to determine the extent to which bicyclists on Landis Avenue ride on the street versus the sidewalk, and whether safer roadway designs are feasible. It should be stressed that all roadways are open to use by bicyclists whether or not the roadway meets the bicycle compatibility criteria. “Bicycle compatibility” simply refers to specific conditions that, taken together, create an environment that is acceptable to a fairly wide range of cyclists. If a roadway fails to meet the specific compatibility criteria, bicyclists are still free to use it, and there may never be any safety problems. Recommendation: On the whole, Vineland has very good potential for developing a bicycle network, and this option should be pursued. The roadways shown as bicycle-compatible in

City of Vineland Master Plan 30 Circulation Element
Figure 6 should serve as the “backbone” of bicycle travel in the City, and bike route designation should be considered. On north-south routes, the following roadways provide the most extensive coverage: Orchard Road, Delsea Drive, West Avenue, the Boulevards, Main Road, and Lincoln Avenue. Any of these could be posted as bike routes. Delsea Drive is the one roadway currently designated as a bicycle lane, as discussed above. Based solely on traffic volumes, bicyclists would find the Boulevards to be among the more desirable north-south routes. East-west routes are more problematic. On the north side, the absence of shoulders prevents Oak Road and Garden Road from being as suitable for bicyclists. On future improvement projects along these roadways, the County should seek to widen the shoulders by a few feet where possible. In the center of the city, Almond Road west of Delsea Drive, and Park Avenue east of East Avenue are currently bike-compatible. In the five-lane section of Park Avenue, the roadway could be made more bike-compatible by restriping the roadway from the current cross-section of five 12-foot lanes (including the two-way left turn lane), to 10-foot inner travel lanes, and making the outer lanes wider. Five lanes are not needed to accommodate the traffic volumes on Park Avenue, so a more significant re-design can eventually be considered here, involving reduction of the travel lanes. Sections of Landis Avenue, including all of Landis east of East Avenue, are bike-compatible; more significant study on accommodating bicyclists on the section of Landis Avenue should be undertaken. Alternatively, bike lanes could be striped on Elmer Street and Wood Street, such as through a cross-section of two 7-foot parking lanes, with a 6-foot bike lane and 12-foot travel lane, fitting within the 32-foot cartway. On the south side, potential east-west routes include Elmer Road, Sherman Avenue, and Mays Landing Road. All are fully bike-compatible. In designating bicycle lanes, two choices are available. On roadways with bike-compatible shoulders, Vineland or the County could essentially use the existing shoulder and install approved bike lane stencils. On roadways with bike compatible travel lanes, such as Landis Avenue east of the downtown, Vineland could stripe bike lanes and narrow the existing travel lanes. For example, on Landis Avenue, the 17-foot lanes could be re-striped as a 12-foot lane and 5-foot bike lane. Establishing a bike route system need not cost the City very much money. The City will be able to work, for the most part, within the existing infrastructure. On roadways that will be designated with bike lanes, coordination should take place with City or County public works on resurfacing schedules.
Pedestrian Facilities The most important pedestrian facility is the sidewalk. Sidewalk coverage is quite extensive within the “Old Borough” section of the City, but sidewalks are missing from many roadways outside the Old Borough, including a good percentage of County roadways.

City of Vineland Master Plan 31 Circulation Element
The Vineland Land Use Ordinance has likely contributed to the situation by its approach to sidewalk installation on new developments. The Land Use Ordinance states that sidewalks are not required unless:
• Sidewalks exist along frontage of abutting property • Board finds sidewalks required to protect public safety
It is important to note that the default position is not requiring sidewalks. This ordinance runs counter to the trend in communities where pedestrian activity is encouraged; in these municipalities, developers are required to install sidewalks, unless both existing and future pedestrian activity in the area is likely to be minimal, and/or the development is in a rural-type zoning district. Recommendation: Vineland should change its Land Use Ordinance to indicate that sidewalks are preferred on most developments. The absence of an extensive sidewalk system is particularly conspicuous on the roadways adjacent to many schools in the City - including, in a number of places, directly on the school property itself. Sidewalks were not considered critical in these areas when the schools were first being constructed and busing was widespread, and waivers for sidewalks were widely granted; as the cost of busing has increased, the financial impact has become more problematic. On a universal note, the decrease in the number of children walking to school has made itself felt in other ways, such as through a well-documented increase in childhood obesity. According to the Institute of Medicine of the National Academies, over the past three decades, the childhood obesity rate has more than doubled for preschool children aged 2-5 years and adolescents aged 12-19 years, and it has more than tripled for children aged 6-11 years. The Institute attributes this, among other factors, to “urban and suburban designs that discourage walking and other physical activities” (Institute of Medicine, Childhood Obesity in the United States: Facts and Figures, September 2004). In general, sidewalks should be provided as part of any developments where even a minimal level of pedestrian is anticipated. This is particularly true for developments along arterial and collector roadways; the greater speeds and volumes typically found on these roads present greater hazards for pedestrians walking in the street. Sidewalks along both sides of roadways in all developing areas are recommended. Because sidewalk improvement needs are present in so many parts of the City, it will be useful for the City to prioritize roadways where sidewalks should be installed. One means of prioritizing would be to install sidewalks in all parts of the City within walking distance of schools. The Vineland Board of Education is encouraging greater numbers of children to walk to schools. In recent years, the number of students walking to school has increased from about 500 to about 2,000. Middle school students comprise the majority of the walkers, at about 1,500; the VBOE considers accommodation of these students as the highest priority. Figure 7 indicates the “walking boundaries” around schools in Vineland as determined by the Board of Education. In Vineland, it is anticipated that Pre-K to Grade 5 students can walk .five
City of Vineland Master Plan 32 Circulation Element
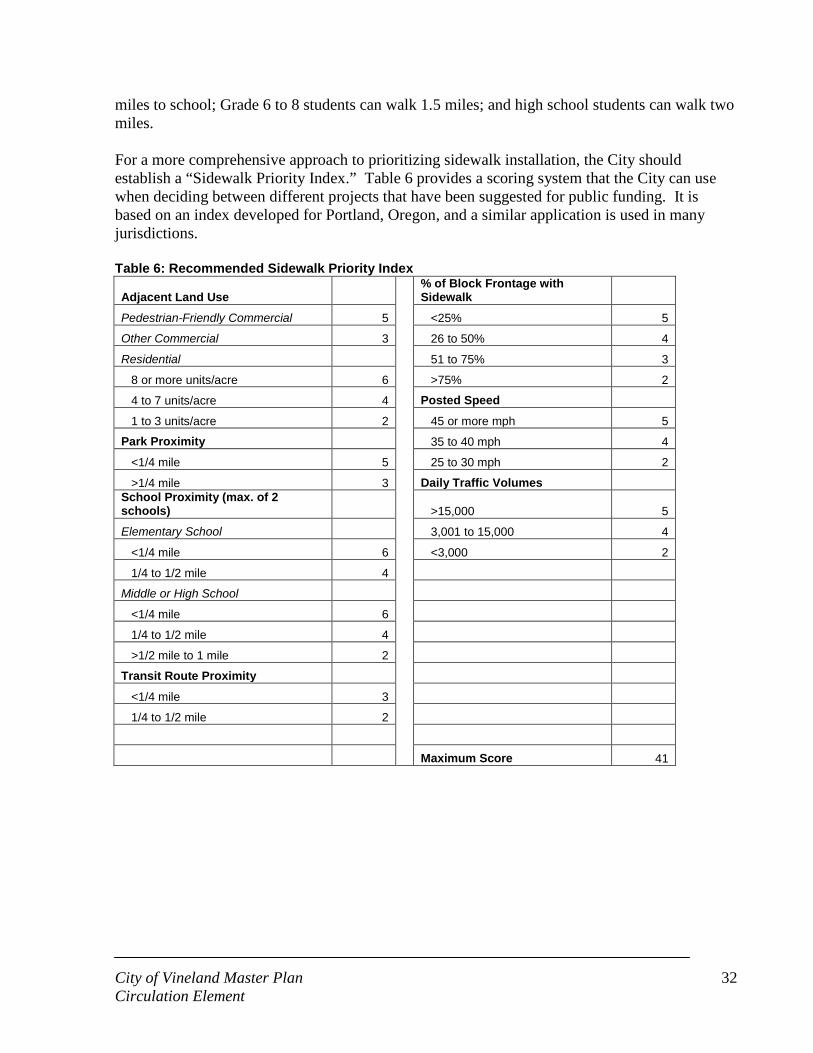
miles to school; Grade 6 to 8 students can walk 1.5 miles; and high school students can walk two miles. For a more comprehensive approach to prioritizing sidewalk installation, the City should establish a “Sidewalk Priority Index.” Table 6 provides a scoring system that the City can use when deciding between different projects that have been suggested for public funding. It is based on an index developed for Portland, Oregon, and a similar application is used in many jurisdictions. Table 6: Recommended Sidewalk Priority Index
Adjacent Land Use % of Block Frontage with Sidewalk
Pedestrian-Friendly Commercial 5 <25% 5
Other Commercial 3 26 to 50% 4
Residential 51 to 75% 3
8 or more units/acre 6 >75% 2
4 to 7 units/acre 4 Posted Speed
1 to 3 units/acre 2 45 or more mph 5
Park Proximity 35 to 40 mph 4
<1/4 mile 5 25 to 30 mph 2
>1/4 mile 3 Daily Traffic Volumes School Proximity (max. of 2 schools) >15,000 5
Elementary School 3,001 to 15,000 4
<1/4 mile 6 <3,000 2
1/4 to 1/2 mile 4 Middle or High School <1/4 mile 6 1/4 to 1/2 mile 4 >1/2 mile to 1 mile 2 Transit Route Proximity <1/4 mile 3 1/4 to 1/2 mile 2 Maximum Score 41

City of Vineland Master Plan 34 Circulation Element
Recommendation: The City should establish a sidewalk priority index. Sidewalk projects should receive priority when located in proximity to schools, medium to high density residential areas, pedestrian-friendly retail uses, parks, and transit routes. The roadway itself has a bearing on priority; projects along roadways with higher speeds and volumes, and those with few sidewalks currently, should receive preference, since pedestrian activity is less safe here. Recommendation: The City should make a concerted effort to seek public funding for sidewalk projects in the future, to facilitate the development of the sidewalk network. A wide variety of funding sources is available, from New Jersey funded programs like Local Aid, to federally funded programs administered by the State, such as Transportation Enhancements and Safe Routes to School. As a New Jersey “center”, and a UEZ community, the City would likely be very competitive in its efforts to secure funding. Regular coordination with Cumberland County will also be needed to improve the sidewalk network. On development applications, the City can ask the developer to install pedestrian facilities on adjacent roadways as needed. However, on stand-alone sidewalk improvement projects (or as part of roadway improvement projects), the County must acquiesce to sidewalk installation on County roadways. Recommendation: The City and County should establish a process for coordination and identification of priority sidewalk projects along County roadways. Finally, it is noted that other pedestrian facilities in the City are lacking or obsolete. Pedestrian indications on downtown signals are generally missing or very dated. High-visibility crosswalk markings are not used. The downtown should be the first priority for new pedestrian facilities. In general, the design of Landis Avenue should be re-evaluated to consider options that will encourage pedestrian activity, as the existing cartway (72 feet) is wider than typically considered desirable for a community “main street.” Recommendation: New pedestrian facilities should be installed throughout the downtown, and the design of Landis Avenue re-evaluated.

City of Vineland Master Plan 35 Circulation Element
TRANSIT
Fixed-Route Service Fixed-route transit service in Vineland consists of three New Jersey Transit bus routes, providing connections to Philadelphia, Atlantic City, Cape May, Upper Deerfield, Millville, and points in between. There are two major bus station-stops within the city:
Vineland Regional Transportation Center – 110 West Landis Avenue, Vineland Bus Routes: NJT – 313, 408, and 553 Parking: 47 free spaces for New Jersey Transit Riders
South Jersey Healthcare Regional Medical Center – 1505 W Sherman Avenue, Vineland
Bus Routes: NJT – 313 and 553 Table 7 and Figure 8 present service and route details for these transit operations. Table 7: Fixed-Route Bus Service in Vineland NJ Transit 553 NJ Transit 408 NJ Transit 313
Terminal Stops Upper Deerfield – Atlantic
City Bus Terminal
Millville - Philadelphia Cape May – Philadelphia
Vineland Stops VTC, Medical Center VTC VTC, Medical Center
Connecting Rail Service None Riverline, PATCO Riverline, PATCO
Service Span* 24/7 16/7 12/7
Daily Ridership 3,031 1,327 165
Daily Vineland Boardings**
683 185 23
Headways***
Peak 30 min 30 min To Cape May: 7:52 AM;
11:57 AM; 3:07 PM; 10:06
PM
Off-Peak 30 min 60 min
Saturday 30 min 90 min To Philadelphia: 11:41 AM;
3:51 PM; 11:48 PM Sunday 30 m in 120 min
* Hours of Weekday Service/ Service Days per Week (for Vineland service) ** Average daily boardings recorded 1/20 through 1/22 (Tuesday through Thursday), as provided by NJ Transit Office of Bus Service Planning *** Average time span between trips from Vineland Transportation Center (rounded to 30-minute increments)
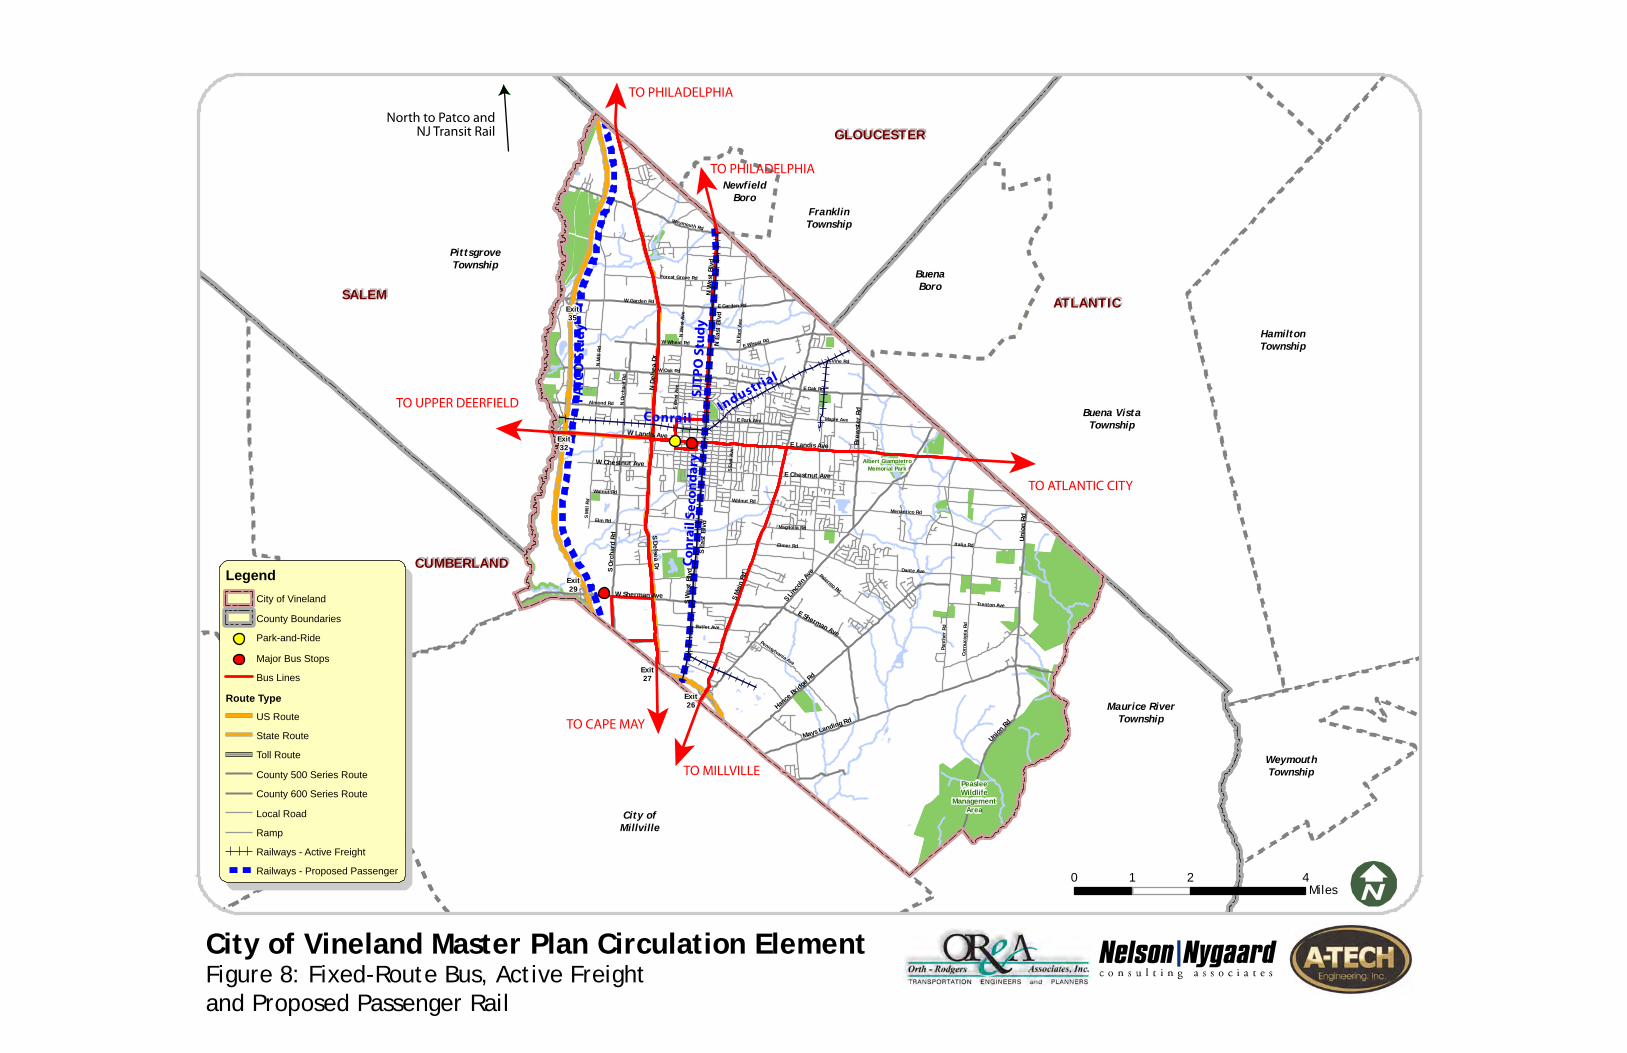
City of Vineland Master Plan Circulation ElementFigure 8: Fixed-Route Bus, Active Freightand Proposed Passenger Rail
0 2 41Miles
GLOUCESTERGLOUCESTER
SALEMSALEM
CUMBERLANDCUMBERLAND
ATLANTICATLANTIC
Albert GiampietroMemorial Park
NewfieldBoro
FranklinTownship
BuenaBoro
Buena VistaTownship
HamiltonTownship
WeymouthTownship
Maurice RiverTownship
City ofMillville
LawrenceTownship
Exit32
Exit32
Exit35
Exit29
Exit27
Exit26
Exit27
Exit26
W Sherman Ave
E Sherman Ave
S Delsea D
r
Mays Landing Rd
Hance
Bridg
e Rd
S Lin
coln
Ave
S M
ain
Rd
Union
Rd
Uni
on R
d
S Ea
st B
lvd
S W
est
Blvd
Pant
her
Rd
Dante Ave
dR aipocunroC
Trenton Ave
Italia Rd
Butler Ave
PeasleeWildlife
ManagementArea
S O
rcha
rd R
d
E Chestnut Ave
W Chestnut Ave
W Landis AveE Landis Ave
Elm Rd
Walnut Rd
Magnolia Rd
Walnut Rd
Elmer Rd
Menantico Rd
Palermo Rd
Pennsylvania Ave
Almond Rd
E Park Ave Maple Ave
W Oak Rd
E Oak Rd
N E
ast
Blvd
N W
est
Blvd
W Wheat RdE Wheat Rd
W Garden RdE Garden Rd
Forest Grove Rd
N E
ast
Ave
N W
est
Ave
N D
else
a D
r
Weymouth Rd
N M
ill R
d
N O
rcha
rd R
d
Vine Rd
Brew
ster
Rd
PittsgroveTownship
S M
ill R
d
S Ea
st A
ve
S W
est
Ave
North to Patco andNJ Transit Rail
FairfieldTownship
LegendCity of Vineland
County Boundaries
Major Bus Stops
Bus Lines
Route Type
US Route
State Route
Toll Route
County 500 Series Route
County 600 Series Route
Local Road
Ramp
Railways - Active Freight
Railways - Proposed Passenger
Park-and-Ride
TO PHILADELPHIA
TO PHILADELPHIA
TO CAPE MAY
TO MILLVILLE
TO UPPER DEERFIELD
TO ATLANTIC CITY
Conrail In
dustrial
Conr
ail S
econ
dary
S
JTPO
Stu
dy
PATC
O S
tudy

City of Vineland Master Plan 37 Circulation Element
Utilization According to the US Census’s 2005-07 American Community Survey data, approximately 2.5% of working Vineland residents commute to work via transit — 2.39% travel by bus while just under 0.2% travel by train. For the 2000 Census data, just over 5.5% of all workers commuting from or to Vineland stated that they commuted by transit. Figure 9 depicts travel patterns among commuters travelling by bus or trains into or from Vineland, based on Year 2000 US Census Journey to Work data.
Figure 9: Transit Commute Patterns (2000)
Proposed Changes According to NJ Transit, the only recent service changes to the three Vineland routes were reductions in over-night service along the #553 route. There are no plans for any additional service changes to these Vineland-serving routes at the time of this report.
City of Vineland Master Plan 38 Circulation Element
Modified Fixed-Route Transit As shown in Figure 9, a number of origins and destinations are located in places not served by fixed-route transit, indicating that a number of area commuters rely upon private and non-profit transit services, including those provided by social-service agencies to help low-income workers maintain access to work. These typically operate on either a “modified fixed-route” or a “demand-response” model.
The Cumberland County Office of Employment and Training (OET) provides two modified fixed-route transit routes that serve Vineland. These services run along a fixed-route, but offer the option of deviating from those routes, up to one quarter-mile, for specific pickups/drop-offs. This transit service is offered solely for travelling directly to and from jobs or training. One route, the Landis Avenue Express, runs between Vineland and Bridgeton via Landis Avenue, NJ Route 56 and Route 77. A second route runs between the VTC and Vineland Industrial Park. All routes are peak-only and run only on weekdays.
Proposed Changes The OET has applied for funding to add a third line from the VTC to Burns Avenue and the back of the Cumberland Mall along South East and West Boulevards.
Demand-Response Transit In outlying areas, the Cumberland Area Senior Transportation System provides Demand-Response transit — where transit vehicles are specifically scheduled to provide door-to-door trip service for aging and disabled residents.
Analysis of Transit Service Alignment An analysis of existing, fixed-route bus service and demographic indicators of transit propensity indicate that existing routes are well-aligned with key transit markets. As indicated in Figure 10, the three primary transit routes serving Vineland run through or astride the sections (census tracts) of the city that contain its highest concentrations of residents and jobs.

City of Vineland Master Plan Circulation ElementFigure 10: Transit Alignment with Population and Employment Densities
0 2 41Miles
GLOUCESTERGLOUCESTER
SALEMSALEM
CUMBERLANDCUMBERLAND
ATLANTICATLANTIC
Albert GiampietroMemorial Park
NewfieldBoro
FranklinTownship
BuenaBoro
Buena VistaTownship
HamiltonTownship
WeymouthTownship
Maurice RiverTownshipCity of
Millville
LawrenceTownship
Exit32
Exit35
Exit29
Exit27
Exit26
W Sherman Ave
E Sherman Ave
S Delsea D
r
Mays Landing Rd
Hance
Bridg
e Rd
S Lin
coln
Ave
S M
ain
Rd
Union
Rd
Uni
on R
d
S Ea
st B
lvd
S W
est
Blvd
Pant
her
Rd
Dante Ave
Corn
ucop
ia R
d
Trenton Ave
Italia Rd
Butler Ave
PeasleeWildlife
ManagementArea
S O
rcha
rd R
d
E Chestnut Ave
W Chestnut Ave
W Landis AveE Landis Ave
Elm Rd
Walnut Rd
Magnolia Rd
Walnut Rd
Elmer Rd
Menantico Rd
Palermo Rd
Pennsylvania Ave
Almond Rd
W Park AveE Park Ave Maple Ave
W Oak Rd
E Oak Rd
N E
ast
Blvd
N W
est
Blvd
W Wheat RdE Wheat Rd
W Garden RdE Garden Rd
Forest Grove Rd
N E
ast
Ave
N W
est
Ave
N D
else
a D
r
Weymouth Rd
N M
ill R
d
N O
rcha
rd R
d
Vine Rd
Brew
ster
Rd
PittsgroveTownship
S M
ill R
d
S Ea
st A
ve
S W
est
Ave
North to Patco andNJ Transit Rail
FairfieldTownship
LegendCity of Vineland
County Boundaries
Bus Terminal
Bus Lines
Route Type
US Route
State Route
Toll Route
County 500 Series Route
County 600 Series Route
Local Road
Ramp
Railways - Active & Inactive
Low population and employment
Moderate population and employment
Moderate population and high employment
High population and moderate employment
High population and employment
Relative Population and EmploymentDensity by Census Tract

City of Vineland Master Plan 40 Circulation Element
To further analyze the existing and potential transit market in Vineland, an analysis was conducted of key “transit-propensity” demographic measures – indicators of a population’s inclination to use transit – within each of the 11 Vineland Census tracts. These include lack of available vehicle, residents aged 65 and over, households with income below $20,000, and other measures. Census data indicate that Vineland’s population is well-inclined toward transit utilization. All but four of the 11 Census Tracts indicate a propensity level higher than the average for Cumberland County and the State of New Jersey, as well as the national average. Figure 11 combines the mapped results of the transit propensity measures within the City of Vineland with existing fixed-route transit alignments. As indicated, the three primary transit routes serving Vineland run through or astride the sections (census tracts) of the city that contain the highest concentrations of populations most likely to ride transit. The maps in figures 9 and 10 reinforce the finding that current fixed-route service alignments are well positioned to access the City’s key transit markets, and that realigning existing bus routes are unlikely to offer much opportunity for expanded bus ridership.

City of Vineland Master Plan Circulation ElementFigure 11: Transit Alignment with Transit Propensity Levels
0 2 41Miles
GLOUCESTERGLOUCESTER
SALEMSALEM
CUMBERLANDCUMBERLAND
ATLANTICATLANTIC
Albert GiampietroMemorial Park
NewfieldBoro
FranklinTownship
BuenaBoro
Buena VistaTownship
HamiltonTownship
WeymouthTownship
Maurice RiverTownship
City ofMillville
LawrenceTownship
Exit32
Exit35
Exit29
Exit27
Exit26
W Sherman Ave
E Sherman Ave
S Delsea D
r
Mays Landing Rd
Hance
Bridg
e Rd
S Lin
coln
Ave
S M
ain
Rd
Union
Rd
Uni
on R
d
S Ea
st B
lvd
S W
est
Blvd
Pant
her
Rd
Dante Ave
Corn
ucop
ia R
d
Trenton Ave
Italia Rd
Butler Ave
PeasleeWildlife
ManagementArea
S O
rcha
rd R
d
E Chestnut Ave
W Chestnut Ave
W Landis AveE Landis Ave
Elm Rd
Walnut Rd
Magnolia Rd
Walnut Rd
Elmer Rd
Menantico Rd
Palermo Rd
Pennsylvania Ave
Almond Rd
W Park AveE Park Ave Maple Ave
W Oak Rd
E Oak Rd
N E
ast
Blvd
N W
est
Blvd
W Wheat RdE Wheat Rd
W Garden RdE Garden Rd
Forest Grove Rd
N E
ast
Ave
N W
est
Ave
N D
else
a D
r
Weymouth Rd
N M
ill R
d
N O
rcha
rd R
d
Vine Rd
Brew
ster
Rd
PittsgroveTownship
S M
ill R
d
S Ea
st A
ve
S W
est
Ave
North to Patco andNJ Transit Rail
FairfieldTownship
Legend
City of Vineland
County Boundaries
Bus Terminal
High Transit Propensity (by Tract)
Medium Transit Propensity (by Tract)
Low Transit Propensity (by Tract)
Bus Lines
Route Type
US Route
State Route
Toll Route
County 500 Series Route
County 600 Series Route
Local Road
Ramp
Railways - Active & Inactive

City of Vineland Master Plan 42 Circulation Element
Transit Opportunity Despite the well-positioned transit lines, the commute-mode share for transit among Vineland residents was just over 2.5 percent (2006 American Community Survey). This relatively low commute-share level, viewed in conjunction with the relatively high level of transit propensity measures within Vineland, indicate a significant opportunity to expand transit use among the city’s residents and workers. An expanded bus ridership would serve many important goals for the City of Vineland. It can help build a case for extending passenger rail service to the city, as will be discussed below. High transit ridership can also reduce traffic congestion, improve air quality, reduce exposure to volatile fuel prices, and expand transportation options for transit-dependent populations.
Following is a review of options available to the City to support an expansion of bus ridership. These options are organized along the following opportunity categories:
• Explore new connection opportunities • Ensure that transit service is coordinated with shift changes • Improve transit facilities • Develop marketing and communications strategy
These options are discussed below.
New Connection Opportunities To help bridge the gap between the current, reservation-based options and conversion to standard fixed-route transit service, the City should explore funding opportunities to expand current OET services and routes. Recommended opportunities include coupling OET and City funds with support from area business organizations whose staffing interests would benefit from expanded options and reliability within the local transportation network.
Coordinating Service with Shift Changes Vineland enjoys a fairly high level of service in terms of short headways (wait-time between buses) and long service spans (the number of operating hours each day and operating days each week) given the relatively low rate of transit commuting by residents. Expanding service spans and reducing headways even further are expensive propositions for transit operators. Targeting choice riders – those that choose to ride despite having the option to drive – through such investments in Vineland would likely require headways of 15 minutes or less; an expensive option lacking justification based on current ridership levels. A more prudent investment would be ensuring that off-peak schedules and headways on shift-work-oriented routes (such as the NJ 408) are coordinated with common shift-change schedules, and that service is increased during key shift-transition periods. Expanding the service windows, and minimizing headways and increasing runs within them, can make reliance upon transit less of a risk for non-standard-shift workers. The City can coordinate with NJ Transit to help ensure

City of Vineland Master Plan 43 Circulation Element
that schedulers of these services receive updates on any significant changes in local shift-employment patterns.
Improved Facilities Transit operations should be complemented by measures ensuring rider comfort; while operations are the heart of a transit system, bus stops that are easy to find and use are critical to passengers using the system. Studies have documented that enhanced amenities at transit stops and stations can increase transit ridership. All stops should have the following elements:
A level concrete pad, consisting of a 20-foot by 6-foot clear zone at each stop, unobstructed by street furniture, landscaping, or signage;
Clear sidewalks providing direct access to the loading area; Adequate lighting. Some transit agencies have begun utilizing photovoltaic panels to
illuminate shelters. Although startup costs appear high, in the long run solar power can be anticipated to save money through reduced energy cost;
A bench; A trash receptacle (optional, but recommended); Route, schedule, and system information; and NJ Transit and County OET signage where appropriate on one pole.
Stops with more than 50 boardings a day (including transfers) should also have a bus shelter designed to provide shade without creating blind spots. Stops with more than 300 boardings a day should have real time travel information notifying travelers when the next bus is expected. Bicycle racks should be provided at key transit stops in the City and on buses. Safety and security must also be addressed. All stops should be well-lit and provide clear sight lines with no “blind spots.” Placement of stops in view of active uses is recommended. Wherever possible, stations and stops should be located proximate to controlled roadway crossings, preferably signalized crossings.
Marketing and Communications For a community’s transit system to be successful, it must be embraced by the community. While the transit serving Vineland is operated by others, the City can play an important part in helping to tailor marketing and outreach to the local population. Following are elements of a recommended marketing outreach:
Maintain outreach to Hispanic constituents, by preparing all written materials in both English and Spanish, using both English and Spanish on the transit website, and sending representatives to present information in Spanish at church meetings;
Send representatives to present information at elder-care facilities and senior citizen centers;
Offer riders the opportunity to improve the system through an on-going customer service program, with regular surveys covering such topics as reliability, security, and courtesy of personnel;

City of Vineland Master Plan 44 Circulation Element
Create a webpage hosted on the City’s website with all transit information (instead of automatically forwarding web browsers to NJ Transit’s website). An email address and telephone number should be provided on the webpage;
Any materials distributed by Vineland and Cumberland County regarding available transit services should incorporate NJ Transit graphics on all services – this will reinforce “service branding”;
The City Planning Board should provide regular input to NJ Transit and OET on the planning, marketing, and delivery of transit services in Vineland.
Recommendation: The City should pursue a multi-pronged strategy for increasing transit ridership on the existing system, as described above.
Passenger Rail Vineland benefitted from Philadelphia-based passenger rail service as recently as 1971. Today, however, the closest rail stop to Vineland is the Hammonton Station along NJ Transit’s Atlantic City Line — a 40-minute drive from Vineland and offering one-hour service to Philadelphia. Several recent studies have examined the feasibility of re-introducing passenger rail service for Vineland, as summarized below. South Jersey Regional Rail Study (2002, SJTPO) In 2002, the SJTPO and NJ Transit evaluated the potential for restoring passenger service to abandoned rail lines and active freight rail corridors within the SJTPO region — many of which once supported passenger service. Four corridors were included in the study:
Corridor 1 - Atlantic City to Mays Landing Corridor 2 - Winslow Junction to Cape May Court House Corridor 3 - Winslow Junction to Vineland – Bridgeton Corridor 4 - Glassboro to Vineland – Millville
Corridor 4 was determined to be the most feasible. This service would extend from Glassboro to Vineland and onto Millville along the Conrail “Secondary” line; this line currently has active freight service along its full length. Vineland would have a station stop. The largely positive assessment of the feasibility of Corridor 4 is based on a number of factors, including low environmental impact. The track is also in better condition than that found along the other three corridors, although the report did express concern about the high utilization of the line by freight service (currently two to three trains per day).
The study concludes that advancement of this corridor for service expansion “hinges almost entirely on whether or not NJ Transit or PATCO builds a new transit line from Camden to Glassboro, serving the congested and rapidly growing NJ 55 corridor in Gloucester County.” If this line is developed, “the Glassboro-to-Millville line (which would include a stop in Vineland) “makes a great deal of sense and compares very favorably to the other three corridors in this study.”

City of Vineland Master Plan 45 Circulation Element
Southern New Jersey to Philadelphia Transit Study (2005, DRPA) In 2005, the Southern New Jersey to Philadelphia Transit Study was sponsored by the DRPA and PATCO to assess the need for passenger rail improvements in four areas: Southern New Jersey, the Camden Waterfront, the Market West section of Center City in Philadelphia, and the Philadelphia Waterfront. For Southern New Jersey, three different mode options were considered: two options would be heavy rail similar to the existing PATCO Speedline, and the third would be diesel light rail, similar to the technology used on the Riverline between Camden and Trenton.
In addition, the study identified three alternatives to be advanced for service expansion consideration. Two of these alternatives included Vineland service within a second development phase that would connect Glassboro to Millville. (The first phase would link Philadelphia to Glassboro). In Alternative NJ-2, Phase II would provide rail service in the median of Route 55; in Alternative NJ-3, Phase II would provide rail service on the existing Conrail right-of-way. Both alternatives would run every 30 minutes in the peak hour, and 60 minutes in the off-peak.
After a series of public hearings that provided input on the proposed service, a new alternative was added and labeled NJ-4, with similar potential for Phase II service to Vineland along the Conrail line. Analysis of South Jersey Rail Expansion Alternatives (2009, OSG) In February, 2009, the New Jersey Office of Smart Growth released a report entitled “Analysis of South Jersey Rail Expansion Alternatives.” The Office analyzed the rail expansion options identified in the DRPA study, concluding that the alternatives running along the existing freight rail lines (NJ-3 and NJ-4, both offering Phase II connections to Vineland) stood out as “most closely aligning with State Plan Principles.” In support of this conclusion, the report states that, compared to the alternatives that would create a string of exclusively park-and-ride stations along NJ55:
“A line that serves small communities while also providing park-and-ride services at select stations would provide greater benefits to the citizens of the region and to the service provider.”
Governor’s Endorsement In May, 2009, the governor of New Jersey announced support for the DRPA proposal to expand diesel light rail service from Camden to Glassboro, as well as DRPA proposals to study Bus Rapid Transit along Routes 42 and 55, and improvements to the New Jersey Transit Atlantic City rail line. In response, the DRPA announced it would “begin to immediately conduct another round of public meetings in June to discuss these investments and the plans to move forward.” Recommendation: To provide an important, sustainable commute-mode alternative to both residents of and travelers to Vineland, the City should continue to its efforts to bring rail passenger service back to the city. Recommendation: To maximize the economic development benefits of rail passenger service, and support the smart growth strategy of encouraging development in existing centers, the City

City of Vineland Master Plan 46 Circulation Element
should support and lobby for alignment proposals that incorporate the existing freight lines, rather than those proposing an NJ 55 alignment. A Vineland station stop should be located in Downtown to encourage infill and redevelopment, and support Vineland’s vision of being a walkable community. Rail Expansion There are a number of means by which the City can encourage and expand the current interest in re-instituting passenger rail service to Vineland. The two most important are to demonstrate growth in demand for transit service and to protect its viable rail infrastructure.
• Maintain rail infrastructure – The presence of viable rail infrastructure is key to maintaining the city’s competitive edge for proposals that focus on existing lines. Maintaining the current healthy state of the City’s freight rail infrastructure will therefore remain a critical component of Vineland’s rail expansion objectives.
Recommendation: The City should enact a policy to support preservation of the existing rail infrastructure, regardless of short-term operations, in order to have the right-of-way available for long-term rail use.
• Demonstrate demand – Two important measures of latent demand for rail transit in any community are ridership levels for existing transit services and rates of carpooling among non-transit commuters. Options for supporting expanded transit ridership are outlined in the Bus section above. Strategies for increasing carpooling are discussed below.
CARPOOLING The current carpooling rate among Vineland residents indicates a slightly higher than average propensity to carpool. As a share of the overall commute mode market, Vineland residents currently carpool slightly more than the New Jersey statewide average, though slightly less than the Cumberland County average. Table 8 provides a summary comparison of carpooling rates for Vineland and comparable New Jersey cities, as well as the county and state.
Table 8: Comparison of Carpooling Rates City Population Total Commuters Drive Alone Rate Carpool Rate
Vineland 61,593 27,526 82.0% 10.4%
Cape May 97,555 44,640 79.0% 8.4%
Glassboro 19,068 8,955 77.9% 9.0%
Millville 27,272 10,917 82.9% 11.1%
Cumberland County 154,086 62,448 81.2% 11.8%
State of New Jersey 8,669,815 4,081,395 72.1% 9.3%
Source: 2000 US Census data

City of Vineland Master Plan 47 Circulation Element
To maintain and improve the city’s rail transit competitiveness, the City of Vineland should set an objective to at least match the Cumberland County carpool rate of 11.8%; a rate that would indicate a market ready for additional non-driving commute options (and also take hundreds of cars off local and regional roads and highways during the commute peak). Providing park-and-ride sites for carpoolers can help meet this objective by making carpooling both more visible and more convenient and efficient for participants. Potential advantages inherent in the development of formal Park and Ride locations for carpoolers include:
Decreasing commute times by creating a single, en-route point of connection for drivers and riders;
Increasing the visibility and profile of carpooling – particularly when accompanied by appropriate wayfinding and signage investments;
Placing local drivers on-site at local shops and service providers each day; Establishing a land-bank for Park and Ride spaces for future transit services; and Providing an opportunity for the City to shape future transit routes based on their local
understanding of opportunities and constraints. The City should seek to develop Park and Ride lots and lot-sharing opportunities at strategic locations to support the expansion of carpooling among Vineland residents. Not only will such investments expand the commute-options for Vineland residents (providing important economic relief from volatile fuel costs and reducing the stress of commuting on increasingly congested freeways), expanding carpooling is an important means for demonstrating demand for non- single-occupant-vehicle commute options such as transit. The City should explore opportunities near entrances to NJ 55 and other primary commute thoroughfares where drivers can meet riders en route to work as opposed to circulating through Vineland to individual homes. An important, low-cost opportunity worth exploring is space-share or space-lease arrangements with lot owners near points of access to key commute routes. Shopping centers are often an effective resource for this, as Park and Ride activity can fill parking spaces that otherwise remain empty during work hours and place potential new customers inside the shopping center complex in the evenings. The figures below identify examples of the types of locations where such Park and-Ride opportunities are likely to be found. Initial site visits to these locations indicated sufficient unused parking inventory to accommodate Park and Ride operations without constraining parking for on-site uses. For each opportunity site, the City of Vineland should reach out to property owners, and volunteer to begin the process by completing formal midday occupancy surveys of the peripheral spaces most amenable to Park and Ride use, and least appealing to site visitors. The new Wal-Mart development on Landis Avenue is another example of a prime candidate for a shared use parking facility.

City of Vineland Master Plan 48 Circulation Element
Figure 12: Potential Lot-Share Opportunities near NJ47 and NJ55
Figure 13: Potential Lot-Share Opportunity at Medical Center
Recommendation: The City should support efforts to encourage carpooling, such as through coordinating with merchants to establish formal park and ride lots.

City of Vineland Master Plan 49 Circulation Element
FREIGHT RAIL One key to the potential to expand passenger rail service to Vineland is the continued presence of viable rail lines that, while currently limited to freight transport, could be converted to support passenger service. Active freight rail lines running through Vineland consist of:
• The Conrail Vineland Secondary (Secondary) – the main track between Millville and Woodbury; and
• The Conrail Vineland Industrial (Industrial) – part of the Southern Division of the Central Railroad of New Jersey.
The two lines intersect near the center of Vineland’s business district and there is connecting track linking the two lines at this point. Each line is in use for freight transport five days per week.
In addition, there is a currently idle line running northeast and southwest through the city to Winslow Junction. The line’s owner, the New Jersey Department of Transportation, has an interest in maintaining the line for its potential to haul sand through Winslow Junction to Pleasantville. Although the line’s infrastructure is in good repair, a lack of business demand has left it idle for many years, and the re-introduction of service would consequently require substantial clearing of brush and other vegetative over-growth.
Table 8 provides route and operations details for these lines.
Table 8: Status and Description of Key Freight Rail Lines Track Name Conrail Vineland
Secondary Conrail Vineland
Industrial Vineland-Winslow
Junction Ownership Conrail Conrail NJ DOT FRA Class 2 1 Acceptable Track
Route through Vineland
North-South between East and West
Boulevards
East-West Northeast/ Southwest
Key Destinations
Millville and Woodbury Secondary Line - East Vineland
Winslow Junction
Current Operators
Conrail, Winchester and Western
Conrail, Winchester and Western
Idle
Weekly Operations
5 Days 5 Days None
Daily Operations 1 or 2 trains 1 or 2 trains None Planned or Proposed Changes
Remains under consideration for
passenger rail conversion by various
parties
Winchester & Western Railroad Company has expressed interest in
purchasing this line from Conrail
The DOT is interested in maintaining the line for the potential hauling of
sand down to Pleasantville
Source: Source: F.A. Winkler, General Agent, Winchester and Western Railroad Company
Existing utilization of Vineland’s freight rail lines appears healthy, particularly in an era in which long-haul freight is dominated by truck fleets. Given the superior energy efficiency of moving freight using rail service, and continuing volatility in the energy markets, it is wise for the city to maintain the existing freight infrastructure, and support the development of spur lines

City of Vineland Master Plan 50 Circulation Element
when appropriate. In addition, as indicated by recent passenger rail expansion studies, the presence of rail infrastructure is invaluable in supporting the case that passenger service can be extended through Vineland.
AIR-BASED TRANSPORTATION There is one airport located within Vineland. The Kroelinger Airport is a public-use airport on Forest Grove Road, approximately three miles north of the CBD. The single-runway airport is privately owned and operated. Six resident-planes are all single-engine and average about 27 flights per month. There are no plans for service expansion, and it is anticipated that use of this airport will remain limited. The primary airport for Vineland residents is the Philadelphia International Airport, the largest airport in the Delaware Valley. After Philadelphia, the second choice of most Vineland residents for air service is Atlantic City.