city of union city
TRANSCRIPT
COMPREHENSIVEANNUAL FINANCIAL
REPORT
2019For year ended August 31, 2019
www.unioncityga.org

CITY OF UNION CITY, GEORGIA
COMPREHENSIVE ANNUAL FINANCIAL REPORT
FOR THE FISCAL YEAR ENDED AUGUST 31, 2019
Prepared by: Union City Finance Department
CITY OF UNION CITY, GEORGIA
COMPREHENSIVE ANNUAL FINANCIAL REPORT FOR THE FISCAL YEAR ENDED AUGUST 31, 2019
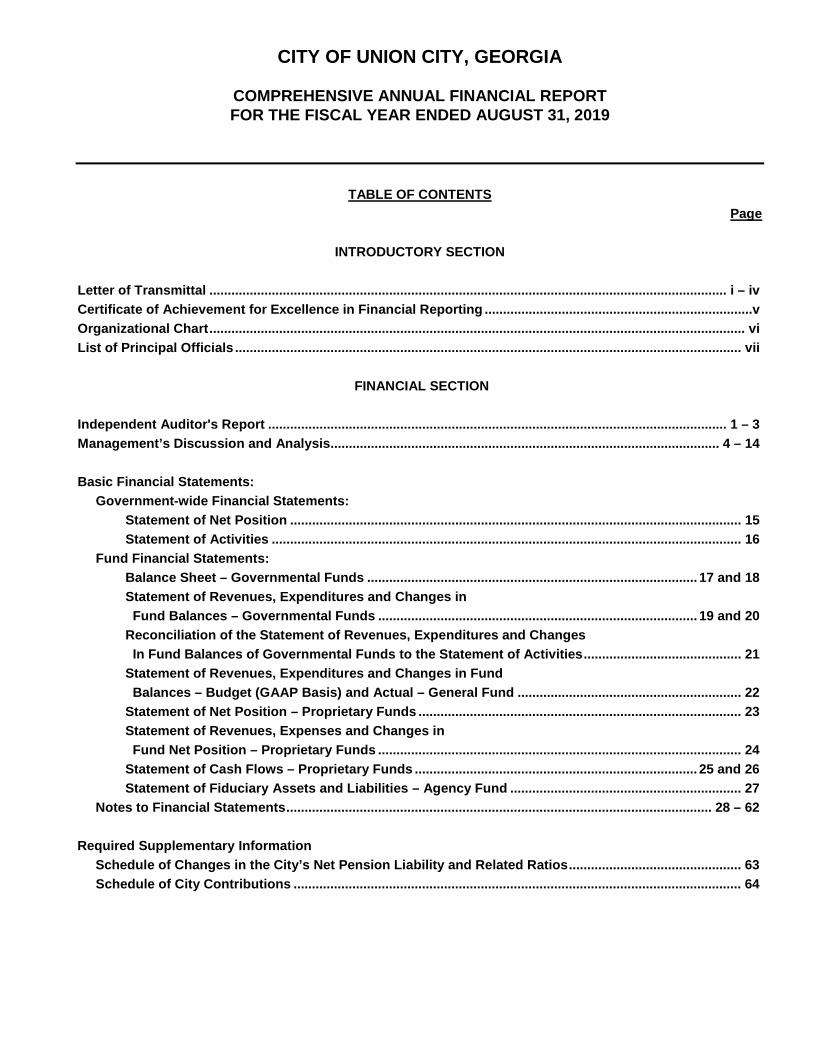
TABLE OF CONTENTS
Page
INTRODUCTORY SECTION Letter of Transmittal ............................................................................................................................................. i – iv Certificate of Achievement for Excellence in Financial Reporting .........................................................................v Organizational Chart .................................................................................................................................................. vi List of Principal Officials .......................................................................................................................................... vii
FINANCIAL SECTION
Independent Auditor's Report ............................................................................................................................. 1 – 3 Management’s Discussion and Analysis.......................................................................................................... 4 – 14 Basic Financial Statements: Government-wide Financial Statements: Statement of Net Position ........................................................................................................................... 15 Statement of Activities ................................................................................................................................ 16 Fund Financial Statements: Balance Sheet – Governmental Funds .......................................................................................... 17 and 18 Statement of Revenues, Expenditures and Changes in Fund Balances – Governmental Funds ....................................................................................... 19 and 20 Reconciliation of the Statement of Revenues, Expenditures and Changes In Fund Balances of Governmental Funds to the Statement of Activities ........................................... 21 Statement of Revenues, Expenditures and Changes in Fund Balances – Budget (GAAP Basis) and Actual – General Fund ............................................................. 22 Statement of Net Position – Proprietary Funds ........................................................................................ 23 Statement of Revenues, Expenses and Changes in Fund Net Position – Proprietary Funds ................................................................................................... 24 Statement of Cash Flows – Proprietary Funds ............................................................................. 25 and 26 Statement of Fiduciary Assets and Liabilities – Agency Fund ............................................................... 27 Notes to Financial Statements .................................................................................................................... 28 – 62 Required Supplementary Information Schedule of Changes in the City’s Net Pension Liability and Related Ratios ............................................... 63 Schedule of City Contributions .......................................................................................................................... 64

CITY OF UNION CITY, GEORGIA
COMPREHENSIVE ANNUAL FINANCIAL REPORT FOR THE FISCAL YEAR ENDED AUGUST 31, 2019
TABLE OF CONTENTS (CONTINUED)
Page
FINANCIAL SECTION (CONTINUED)
Combining Statements and Schedules: Combining Balance Sheet – Nonmajor Governmental Funds ............................................................. 65 and 66 Combining Statement of Revenues, Expenditures and Changes in Fund Balances – Nonmajor Governmental Funds ............................................................................. 67 and 68 Schedule of Revenues, Expenditures and Changes in Fund Balance – Budget and Actual General Obligation Bonds Fund .................................................................................................................. 69 TSPLOST Fund .............................................................................................................................................. 70 Capital Grants Fund ...................................................................................................................................... 71 Special Revenue Funds: Federal Seized Funds Fund ....................................................................................................................... 72 Vehicle Rental Excise Tax Fund................................................................................................................ 73 Hotel/Motel Tax Fund ................................................................................................................................. 74 Emergency 911 Fund ................................................................................................................................. 75 Tax Allocation District Fund ...................................................................................................................... 76 Multiple Operating Grant Fund.................................................................................................................. 77 Capital Projects Funds: Capital Projects Funds ............................................................................................................................... 78 CDBG Fund ................................................................................................................................................. 79 Debt Service Funds: 2014 General Obligation Bond Debt Service Fund ................................................................................. 80 2010 Certificate of Participation Debt Service Fund ............................................................................... 81 2017 General Obligation Bond Debt Service Fund ................................................................................. 82 Combining Statement of Net Position – Nonmajor Enterprise Funds ............................................................ 83 Combining Statement of Revenues, Expenditures and Changes in Fund Net Position – Nonmajor Enterprise Funds ........................................................................................... 84 Combining Statement of Cash Flows – Nonmajor Enterprise Funds ................................................. 85 and 86 Statement of Changes in Fiduciary Assets and Liabilities – Agency Fund ................................................... 87 Statement of Cash Flows – Component Unit .................................................................................................... 88

CITY OF UNION CITY, GEORGIA
COMPREHENSIVE ANNUAL FINANCIAL REPORT FOR THE FISCAL YEAR ENDED AUGUST 31, 2019
TABLE OF CONTENTS (CONTINUED)
Page
STATISTICAL SECTION
Fund information: Net Position by Activity ....................................................................................................................................... 89 Changes in Net Position.............................................................................................................................. 90 – 92 Fund Balances, Governmental Funds ............................................................................................................... 93 Changes in Fund Balances, Governmental Funds ............................................................................... 94 and 95 Assessed Value and Estimated Actual Value of Taxable Property ................................................................ 96 Direct and Overlapping Property Tax Rates .................................................................................................... 97 Property Tax Levies and Collections ................................................................................................................. 98 Principal Property Taxpayers ............................................................................................................................. 99 Ratio of Outstanding Debt by Type .................................................................................................................. 100 Ratio of General Bonded Debt Outstanding ................................................................................................... 101 Legal Debt Margin Information ......................................................................................................................... 102 Direct and Overlapping Governmental Activities Debt .................................................................................. 103 Pledged-Revenue Coverage ............................................................................................................................. 104 Demographic and Economic Statistics ........................................................................................................... 105 Principal Employers .......................................................................................................................................... 106 Full-Time Equivalent City Employees by Function/Program ........................................................................ 107 Operating Indicators by Function .................................................................................................................... 108 Capital Assets Statistics by Function .............................................................................................................. 109
COMPLIANCE SECTION
Independent Auditor's Report on Internal Control Over Financial Reporting and on Compliance and Other Matters Based on an Audit of Financial Statements Performed in Accordance with Government Auditing Standards .............................................. 110 and 111 Independent Auditor's Report on Compliance For Each Major Program; Report on Internal Control Over Compliance; and Report on the Schedule of Expenditures of Federal Awards Required by The Uniform Guidance ...................................112 – 114 Schedule of Expenditures of Federal Awards ................................................................................................. 115 Notes to Schedule of Expenditures of Federal Awards .................................................................................. 116 Schedule of Findings and Responses ............................................................................................... 117 and 118 Schedule of Prior Year Findings ....................................................................................................................... 119

INTRODUCTORY SECTION

i
March 26, 2020
To the Honorable Mayor, Members of the City Council, and Citizens of the City of Union City, Georgia: State law requires that all general-purpose local governments publish for the close of each fiscal year a complete set of financial statements presented in conformity with generally accepted accounting principles (GAAP) and audited in accordance with auditing standards generally accepted in the United States of America and standards applicable to financial audits contained in Government Auditing Standards issued by the Comptroller General of the United States, by a firm of licensed certified public accountants. Pursuant to that requirement, we hereby issue the comprehensive annual financial report of the City of Union City, Georgia for the fiscal year ended August 31, 2019. This report consists of management's representations concerning the finances of the City of Union City, Georgia. Consequently, management assumes full responsibility for the completeness and reliability of all of the information presented in this report. To provide a reasonable basis for making these representations, management of the City of Union City, Georgia has established a comprehensive internal control framework that is designed both to protect the government's assets from loss, theft, or misuse and to compile sufficient reliable information for the preparation of the City of Union City, Georgia's financial statements in conformity with GAAP. Because the cost of internal controls should not outweigh their benefits, the City of Union City, Georgia's comprehensive framework of internal controls has been designed to provide reasonable rather than absolute assurance that the financial statements will be free from material misstatement. As management, we assert that, to the best of our knowledge and belief, this financial report is complete and reliable in all material respects. The City of Union City, Georgia's financial statements have been audited by Mauldin & Jenkins, LLC, a licensed certified public accounting firm. The goal of the independent audit was to provide reasonable assurance that the financial statements of the City of Union City, Georgia for the fiscal year ended August 31, 2019, are free of material misstatement. The independent audit involved examining, on a test basis, evidence supporting the amounts and disclosures in the financial statements; assessing the accounting principles used and significant estimates made by management; and evaluating the overall financial statement presentation. The independent auditor concluded, based upon the audit, that there was a reasonable basis for rendering an unmodified opinion that the City of Union City, Georgia's financial statements for the fiscal year ended August 31, 2019, are fairly presented in conformity with GAAP. The independent auditor's report is presented as the first component of the financial section of this report.

ii
GAAP requires that management provide a narrative introduction, overview, and analysis to accompany the basic financial statements in the form of Management's Discussion and Analysis (MD&A). This letter of transmittal is designed to complement (MD&A) and should be read in conjunction with it. The City of Union City, Georgia's MD&A can be found immediately following the report of the independent auditors. Profile of the Government Union City was incorporated August 17, 1908, and was named for the Farmer's Union whose national headquarters was located in the area. Since that time, the City's population has grown to its current population of approximately 20,500. The City is located in North Central Georgia on Interstate 85 in South Fulton County, the largest county in the State of Georgia. Approximately 15 miles south of downtown Atlanta, Union City is only 5 miles from Hartsfield-Jackson International Airport and is part of the metropolitan statistical area as designated by the Bureau of Census; a small town America within the sphere of downtown Atlanta, home of the 1996 Olympic Games. The City of Union City, Georgia, operates under a Mayor and Council-Chief Administrative Officer form of government. The Chief Administrative Officer is appointed by and serves at the pleasure of the City Council. The City Council annually adopts a balanced budget and establishes a tax rate for the support of City programs. The Chief Administrative Officer has the responsibility of administering these programs in accordance with policies and the annual budget adopted by the City Council. Services provided by the City under general governmental functions include finance, human resources, information technology, police and fire protection, community development, public services, recreation services and administrative services to the citizens. In addition, water and sewer services, solid waste collection and disposal services, and criminal justice management are provided under an Enterprise Fund concept, with user charges set by the City Council to ensure adequate coverage of operating expenses and payments on outstanding debt. City Management reviewed all potential component units to determine if any should be included in these financial statements and has concluded that the South Fulton Municipal Regional Jail Authority is a component unit that should be included in the financial statements. The annual budget is the financial plan for the operation of the City for the ensuing annual period. The budget process provides for a professional management approach to the establishment of priorities and the implementation of work programs while providing an orderly means for control and evaluation of the financial posture of the Government. The City adopts an annual budget no later than the beginning of each fiscal year. The Chief Administrative Officer and the Finance Director are required to prepare and submit a budget to the Council for review and adoption. The budget is accompanied by a message from the Chief Administrative Officer containing a statement of general fiscal policies of the City, the important features of the budgets, explanations of the major changes recommended for the next fiscal year, a general summary of the budgets, and such other comments and information as may be deemed pertinent. The Council may approve, reject, or modify the proposed budget and shall adopt the final budget by ordinance no later than August 31. Upon recommendation of the Chief Administrative Officer and approval of the Mayor and Council, the City may make interfund or interdepartmental transfers in the current operating or capital improvements budgets at any regular or special meeting called for such purpose, provided funds are available. The budget is prepared and adopted on a basis consistent with generally accepted accounting principles.

iii
Annual budgets are adopted for the General Fund, Debt Service Funds, and Special Revenue Funds. Capital Projects Funds have legal budgets adopted on a total project basis rather than an annual basis. Annual operating budgets are prepared for each Enterprise Fund for planning, control, cost allocation, and evaluation purposes. The legal level of budgetary control is the fund level. Increases in the total appropriations of a fund, whether accomplished through an increase in estimated revenues or through a transfer of appropriations among funds, require the recommendation of the Chief Administrative Officer and approval of the Mayor and Council. Appropriations lapse at year-end except those for capital projects which are accounted for in future periods as "fund balance reserved for construction" until the appropriation is expended or the project completed.
Final budget amounts included on all budget comparisons in this report are as amended as of August 31, 2019, by the Mayor and Council.
Financial Position and Future Prospects Union City is strategically located near Hartsfield Jackson Atlanta International Airport (HJAIA) and has great accessibility to three major interstate highways: I-20, I-75, and I-85, all of which provide superior logistical connectivity to cities in the southeastern region of the U.S., including Union City the older highway, US Hwy 29, locally known as Roosevelt Highway, links Union City to College Park, the airport, and Atlanta to the northeast as well as Fairburn and Palmetto to the southwest. SR-138, locally known as Jonesboro Road, connects Union City to Riverdale and Jonesboro to the southeast, and the Chattahoochee River and Douglasville to the northwest.
In 2015, Georgia Domestic Trade totaled $430 billion of which $179 billion comes from interstate Trade. Georgia Domestic Trade is projected to grow 46% over the next 25 years to $625 billion indicating that close proximity to Georgia’s major interstate highways will continue supplying substantial growth along these corridors.
Likewise, as Union City is located 15 minutes southwest of Atlanta’s airport, it is perfectly sited next to the busiest transit hub in the world. This ideal location means that Union City is destined for exponential growth over the next 20 years. The City can leverage its location to access a portion of the over 100 million passengers that HJAIA services annually.
The three major components of Georgia’s economy are interstate highways, the deep-water port of Savannah, and HJAIA, all of which converge at the southwest I-285/I-85 interchange making the greater Atlanta area the largest transportation hub in the Southeast. Therefore, this is a critical time and an amazing opportunity in the development of Union City to plan for effective growth in a dynamic future.
Union City has gained the attention of top businesses from around the country. Over the past few years, the growing economic base has manifested in the acquisition of several high profile companies including Grady Health System, Jaguar, ASOS, Proctor and Gamble, Coca Cola, the Walmart Distribution Ecommerce facility, and Amazon. Due to the booming entertainment industry in the State, Union Station, an obsolete mall, was demolished and in its place now is one of our state’s largest film studios, Atlanta Metro Studios of Union City. The economic impact of the movie industry in Georgia is $6 billion. This development continues to provide the City with ability to create a niche market for film induced tourism, which is one of the fastest growing markets in the industry. Having one of the largest movie studios in the state located in Union City provides a seat at the table in becoming a destination of choice for both film and entertainment.
The City works diligently to enhance job growth and to promote business stability. Incentives such as the Tax Allocation District (TAD) proposed a 600-acre mixed-use development that helps focus on

iv
redevelopment and local infrastructure improvements. With the district’s parallel position and access to I-85, it is a strong candidate for major businesses and industrial investments. Union City maintains a federal designation as a Georgia Foreign Trade Zone (GFTZ) which helps businesses remain competitive, reducing processing fees, custom fees and enhancing the movement of goods in a global marketplace. With these incentives, Union City continues to maintain a solid yet distinctive blend of business clusters that are strategically designed to succeed. Land availability and location advantages, such as the interstate and close proximity to Hartsfield-Jackson International Airport, present Union City with an opportunity distinct to South Fulton County. These resources have enabled the City to capture development, both commercial and residential.
Federal and State Grants The City has made a significant investment in applying for federal and state awards which use Federal and State dollars to benefit its citizens. In fiscal year 2020, Union City received grants for public safety, sidewalks, street paving and resurfacing. Awards & Acknowledgements The Government Finance Officers Association (GFOA) awarded a Certificate of Achievement for Excellence in Financial Reporting to the City of Union City for its Comprehensive Annual Financial Report (CAFR) for the fiscal period ended August 31, 2019. In order to be awarded a Certificate of Achievement, the City had to publish an easily readable and efficiently organized CAFR that satisfied both generally accepted accounting principles and applicable legal requirements. A Certificate of Achievement is valid for a period of one year only. We are pleased to present the City’s seventeenth Comprehensive Annual Financial Report (CAFR), and submit the same to the Government Finance Officers Association (GFOA) for consideration in the Certificate of Achievement for Excellence in Financial Reporting program. We believe that our current CAFR continues to meet the program’s requirements. The preparation of this report would not have been possible without the efficient and dedicated services of the entire staff of the finance department. We would like to express our appreciation to all members of the department who assisted and contributed to the preparation of this report. Credit also must be given to the mayor and the governing council for their unfailing support for maintaining the highest standards of professionalism in the management of the City's finances. Respectfully submitted, LaSonja Fillingame Sonja Fillingame City Manager

v

City of Union City Organization Chart August 31, 2019 Mayor and City
Council
City Manager
City Clerk Public Services
Operations
Code Enforcement
Human ResourcesPolice
Department
Finance Department
Community Development
Fire Department
Economic Development
Planning and Zoning
Permits
Operations
Patrol
Special Operations
Traffic
C.O.P.S.
Records
Communications
Municipal Court
Streets
Water/Sewer
Sanitation
Building and Grounds
Information Technology
Marketing & Communications
Grants
Special Events
Leisure Services
Personnel
Benefits
Wellness and Safety
Liability
Payroll
Utility
Accounts Receivable
Accounts Payable
Purchasing
Contracts
Inspections
Fire Suppression
E.M.S. Services
Parks and Recreation
Accounting
Administrative Assistant
Occupational Tax Certificates, and Taxes
Budgeting
Citizens of Union City
Assistant City Manger
Administrative Assistant
VI

vii
CITY OF UNION CITY, GEORGIA
LIST OF PRINCIPAL OFFICIALS AUGUST 31, 2019
Elected Officials
Vince Williams, Mayor
City Council Christina Hobbs Brian K. Jones
Angelette Mealing Shayla J. Nealy
Appointed Officials
City Manager Sonja Fillingame
City Clerk
Shandrella Jewett
Chief of Police Cassandra Jones
Chief of Fire Administration
Joe Maddox
Director of Public Services Lonnie Ferguson
Directors
Assistant City Manager Tarsha Calloway
Director of Community Development
Ellis Still
Director of Human Resources Linda Goodman
Comptroller
Crystal Lazarus

FINANCIAL SECTION

300 MULBERRY STREET, SUITE 300 • POST OFFICE BOX 1877 • MACON, GEORGIA 31202-1877 • 478-464-8000 • FAX 478-464-8051 • www.mjcpa.com MEMBERS OF THE AMERICAN INSTITUTE OF CERTIFIED PUBLIC ACCOUNTANTS
INDEPENDENT AUDITOR’S REPORT
To the Honorable Mayor and Members of the City Council Union City, Georgia Report on Financial Statements We have audited the accompanying financial statements of the governmental activities, the business-type activities, the discretely presented component unit, each major fund, and the aggregate remaining fund information of the City of Union City, Georgia (the “City”), as of and for the year ended August 31, 2019, and the related notes to the financial statements, which collectively comprise the City’s basic financial statements as listed in the table of contents. Management’s Responsibility for the Financial Statements Management is responsible for the preparation and fair presentation of these financial statements in accordance with accounting principles generally accepted in the United States of America; this includes the design, implementation, and maintenance of internal control relevant to the preparation and fair presentation of financial statements that are free from material misstatement, whether due to fraud or error. Auditor’s Responsibility Our responsibility is to express opinions on these financial statements based on our audit. We conducted our audit in accordance with auditing standards generally accepted in the United States of America and the standards applicable to financial audits contained in Government Auditing Standards, issued by the Comptroller General of the United States. Those standards require that we plan and perform the audit to obtain reasonable assurance about whether the financial statements are free from material misstatement. An audit involves performing procedures to obtain audit evidence about the amounts and disclosures in the financial statements. The procedures selected depend on the auditor’s judgment, including the assessment of the risks of material misstatement of the financial statements, whether due to fraud or error. In making those risk assessments, the auditor considers internal control relevant to the entity’s preparation and fair presentation of the financial statements in order to design audit procedures that are appropriate in the circumstances, but not for the purpose of expressing an opinion on the effectiveness of the entity’s internal control. Accordingly, we express no such opinion. An audit also includes evaluating the appropriateness of accounting policies used and the reasonableness of significant accounting estimates made by management, as well as evaluating the overall presentation of the financial statements. We believe that the audit evidence we have obtained is sufficient and appropriate to provide a basis for our audit opinions.

2
Opinions In our opinion, the financial statements referred to above present fairly, in all material respects, the respective financial position of the governmental activities, the business-type activities, the discretely presented component unit, each major fund, and the aggregate remaining fund information of the City of Union City, Georgia, as of August 31, 2019, and the respective changes in financial position and, where applicable, cash flows thereof and the respective budgetary comparison for the General Fund for the year then ended in accordance with accounting principles generally accepted in the United States of America. Other Matters Required Supplementary Information Accounting principles generally accepted in the United States of America require that the Management’s Discussion and Analysis (“MD&A”) (on pages 4 through 14), and the Schedule of Changes in the City’s Net Pension Liability and Related Ratios and the Schedule of City Contributions on pages 63 and 64 be presented to supplement the basic financial statements. Such information, although not a part of the basic financial statements, is required by the Governmental Accounting Standards Board (“GASB”), who considers it to be an essential part of financial reporting for placing the basic financial statements in an appropriate operational, economic, or historical context. We have applied certain limited procedures to the required supplementary information in accordance with auditing standards generally accepted in the United States of America, which consisted of inquiries of management about the methods of preparing the information and comparing the information for consistency with management’s responses to our inquiries, the basic financial statements, and other knowledge we obtained during our audit of the basic financial statements. We do not express an opinion or provide any assurance on the information because the limited procedures do not provide us with sufficient evidence to express an opinion or provide any assurance. Other Information Our audit was conducted for the purpose of forming opinions on the financial statements that collectively comprise the City’s basic financial statements. The introductory section, the combining and individual nonmajor fund financial statements and schedules, and the statistical section are presented for the purpose of additional analysis and are not a required part of the basic financial statements. The schedule of expenditures of federal awards is presented for purposes of additional analysis as required by Title 2 U.S. Code of Federal Regulations Part 200, Uniform Administrative Requirements, Cost Principles, and Audit Requirements for Federal Awards, and is also not a required part of the basic financial statements.

3
The combining and individual nonmajor fund financial statements and schedules and schedule of expenditures of federal awards are the responsibility of management and were derived from and relate directly to the underlying accounting and other records used to prepare the basic financial statements. Such information has been subjected to the auditing procedures applied in the audit of the basic financial statements and certain additional procedures, including comparing and reconciling such information directly to the underlying accounting and other records used to prepare the basic financial statements or to the basic financial statements themselves, and other additional procedures in accordance with auditing standards generally accepted in the United States of America. In our opinion, the combining and individual nonmajor fund financial statements and schedules and the schedule of expenditures of federal awards are fairly stated, in all material respects, in relation to the basic financial statements as a whole. The introductory and statistical sections have not been subjected to the auditing procedures applied in the audit of the basic financial statements and, accordingly, we do not express an opinion or provide any assurance on them. Other Reporting Required by Government Auditing Standards In accordance with Government Auditing Standards, we have also issued our report dated March 26, 2020, on our consideration of the City’s internal control over financial reporting and on our tests of its compliance with certain provisions of laws, regulations, contracts and grant agreements and other matters. The purpose of that report is solely to describe the scope of our testing of internal control over financial reporting and compliance and the results of that testing, and not to provide an opinion on the effectiveness of the City of Union City, Georgia’s internal control over financial reporting or on compliance. That report is an integral part of an audit performed in accordance with Government Auditing Standards in considering the City of Union City, Georgia’s internal control over financial reporting and compliance.
Macon, Georgia March 26, 2020

CITY OF UNION CITY, GEORGIA
MANAGEMENT'S DISCUSSION AND ANALYSIS FOR THE FISCAL YEAR ENDED AUGUST 31, 2019
4
As management of the City of Union City, (the “City”), we offer readers of the City’s financial statements this narrative overview and analysis of the financial activities of the City for the fiscal year ended August 31, 2019. We encourage readers to consider the information presented here in conjunction with additional information that we have furnished in the financial statements and the notes to the financial statements. FINANCIAL HIGHLIGHTS Key financial highlights for fiscal year 2019 are as follows: • The assets and deferred outflows of resources of the City exceeded its liabilities and deferred inflows of resources
at the close of the fiscal year by $53,162,677 (net position).
• The City’s total net position increased by $10,830,737 or 25.59%.
• As of the close of the current fiscal year, the City’s governmental activities reported ending net position of $40,007,246, an increase of $10,947,062 from the prior year.
• The City’s General Fund reported a positive fund balance of $20,120,781 which represents 109% of the current year expenditures.
• The South Fulton Municipal Regional Jail Authority, a component unit of the City, sold the jail facility to Fulton County, Georgia, thereby relieving the City of any obligation on outstanding bonds issued by the Authority.
• General Fund results were $7,426,170 better than budgeted. OVERVIEW OF THE FINANCIAL STATEMENTS This Management’s Discussion and Analysis (“MD&A”) is intended to serve as an introduction to the City's basic financial statements. The City’s basic financial statements are comprised of three components: 1) government-wide financial statements, 2) fund financial statements, and 3) notes to those financial statements. This report also contains other supplementary information in addition to the basic financial statements themselves. Government-wide Financial Statements The government-wide financial statements are designed to provide readers with a broad overview of the City's finances, in a manner similar to a private-sector business. All governmental and business-type activities are consolidated to arrive at a total for the Primary Government. There are two government-wide statements, the statement of net position and the statement of activities, which are described below. The statement of net position presents information on all of the City’s assets, deferred outflows of resources, liabilities, and deferred inflows of resources, with the difference between the two reported as net position. Over time, increases or decreases in net position may serve as a useful indicator of whether the financial position of the City is improving or deteriorating. It is important to note that this statement consolidates the governmental fund’s current financial resources (short-term) with capital assets and long-term liabilities.
MANAGEMENT'S DISCUSSION AND ANALYSIS
5
The statement of activities presents information showing how the government's net position changed during the most recent fiscal year. All changes in net position are reported as soon as the underlying event giving rise to the change occurs, regardless of the timing of related cash flows. Thus, revenues and expenses are reported in this statement for some items that will only result in cash flows in future fiscal periods (e.g., uncollected taxes and earned but unused vacation leave). The governmental activities of the City include general government, judicial, public safety, public works, community services, recreation, and economic development. The business-type activities of the City include water and sewer, sanitation, and criminal justice management. The government-wide financial statements include not only the City itself (known as the primary government), but also the South Fulton Municipal Regional Jail Authority. This is a legally separate entity that is a component unit of the City due to the significance of its operational or financial relationship with the City. Financial information for this component unit is reported separately from the financial information presented for the primary government itself. The City's government-wide financial statements are presented on pages 15 and 16. Reporting the City’s Most Significant Funds Unlike government-wide financial statements, the focus of fund financial statements is directed to specific activities of the City rather than the City as a whole. Except for the General Fund, a specific fund is established to satisfy managerial control over resources or to satisfy finance-related legal requirements established by external parties or governmental statutes or regulations. The City's fund financial statements are divided into three broad categories, namely, 1) governmental funds, 2) proprietary funds, and 3) debt service funds. Governmental Funds Governmental fund financial statements consist of a balance sheet and statement of revenues, expenditures, and change in fund balances and are prepared on an accounting basis that is significantly different from that used to prepare the government-wide financial statements. In general, these financial statements have a short-term emphasis and, for the most part, measure and account for cash and other assets that can easily be converted to cash. For example, amounts reported on the balance sheet include items such as cash and receivables collectible within a very short period of time, but do not include capital assets such as land and buildings. Fund liabilities include amounts that are to be paid within a very short period after the end of the fiscal year. The difference between a fund's total assets and total liabilities is labeled as the fund balance, and generally indicates the amount that can be used to finance the next fiscal year's activities. Likewise, the operating statement for governmental funds reports only those revenues and expenditures that were collected in cash or paid with cash, respectively, during the current period or very shortly after the end of the year.

MANAGEMENT'S DISCUSSION AND ANALYSIS
6
For the most part, the balances and activities accounted for in governmental funds are also reported in the governmental activities columns of the government-wide financial statements; however, because different accounting bases are used to prepare fund financial statements, there are often significant differences between the totals presented in these financial statements. For this reason, there is an analysis at the bottom of the balance sheet that reconciles the total fund balances to the amount of net position presented in the governmental activities column on the statement of net position. Also, there is an analysis at the bottom of the statement of revenues, expenditures, and changes in fund balances that reconciles the total change in fund balances for all governmental funds to the change in net position as reported in the governmental activities column in the statement of activities. The City presents in separate columns funds that are most significant to the City (major funds) and all other governmental funds are aggregated and reported in a single column (non-major funds). The City's governmental fund financial statements are presented on pages 17 – 22. Proprietary Funds Proprietary fund financial statements consist of a statement of net position, statement of revenues, expenses, and changes in fund net position and statement of cash flows, and are prepared on an accounting basis that is similar to the basis used to prepare the government-wide financial statements. For financial reporting purposes, proprietary funds are grouped into Enterprise Funds and Internal Service Funds. The City uses Enterprise Funds to account for business-type activities that charge fees to customers for the use of specific goods or services. For the most part, the balances and activities accounted for in the City's Enterprise Funds are also reported in the business-type activities columns of the government-wide financial statements. The City presents in separate columns Enterprise Funds that are most significant to the City and all other Enterprise Funds are aggregated and reported in a single column. A statement of cash flows is presented at the fund financial statement level for proprietary funds, but no equivalent statement is presented in the government-wide financial statements for either governmental activities or business-type activities. The City's proprietary fund financial statements are presented on pages 23 – 26.

MANAGEMENT'S DISCUSSION AND ANALYSIS
7
Overview of the City’s Financial Position and Operations The City's overall financial position and operations for the past two years are summarized as follows based on the information included in the government-wide financial statements (see pages 15 and 16):
2019 2018 2019 2018 2019 2018
Current and other assets $ 40,224,392 $ 35,118,754 $ 10,206,661 $ 10,445,635 $ 50,431,053 $ 45,564,389 Capital assets, net 24,165,550 18,647,596 13,615,601 14,341,848 37,781,151 32,989,444 Total assets 64,389,942 53,766,350 23,822,262 24,787,483 88,212,204 78,553,833
Deferred outflows of resources 2,705,044 1,946,987 159,895 108,632 2,864,939 2,055,619
Other liabilities 12,134,705 11,248,000 2,751,032 3,061,259 14,885,737 14,309,259 Long-term liabilities outstanding 13,701,072 14,133,224 7,992,041 8,476,276 21,693,113 22,609,500 Total liabilities 25,835,777 25,381,224 10,743,073 11,537,535 36,578,850 36,918,759
Deferred inflows of resources 1,251,963 1,271,929 83,653 86,824 1,335,616 1,358,753
Net position:Net investment in capital assets 12,268,365 9,461,603 5,797,207 6,296,865 18,065,572 15,758,468 Restricted 13,516,860 6,624,974 1,374,641 1,449,250 14,891,501 8,074,224 Unrestricted 14,222,021 12,973,607 5,983,583 5,525,641 20,205,604 18,499,248 Total net position $ 40,007,246 $ 29,060,184 $ 13,155,431 $ 13,271,756 $ 53,162,677 $ 42,331,940
City of Union City's Net PositionAugust 31, 2019 and 2018
Governmental Activities Business-type Activities Total
Financial Position The total net position of the City increased 10,830,737, or 25.6%, from $42,331,940 to $53,162,677 as noted in the table above. The increase is primarily the result of better than budgeted balances in the General Fund and management’s emphasis on generating reserves for future projects and any potential downturns in the economy.

MANAGEMENT'S DISCUSSION AND ANALYSIS
8
2019 2018 2019 2018 2019 2018Revenues Program revenues: Charges for services $ 4,403,689 $ 3,893,580 $ 10,878,717 $ 10,998,827 $ 15,282,406 $ 14,892,407 Operating grants and contributions - 55,636 - - - 55,636 Capital grants and contributions 1,673,477 918,282 - - 1,673,477 918,282
General revenues: Property taxes 12,773,085 11,459,372 - - 12,773,085 11,459,372 Sales taxes 9,411,819 8,943,451 - - 9,411,819 8,943,451 Franchise taxes 1,506,941 1,398,275 - - 1,506,941 1,398,275 Other taxes 2,062,315 1,810,050 - - 2,062,315 1,810,050 Unrestricted investment earnings 658,402 94,706 30,804 18,268 689,206 112,974 Total revenues 32,489,728 28,573,352 10,909,521 11,017,095 43,399,249 39,590,447
Expenses General government 5,300,953 3,781,555 - - 5,300,953 3,781,555 Judicial 490,390 426,489 - - 490,390 426,489 Public safety 11,417,818 10,396,662 - - 11,417,818 10,396,662 Public works 3,212,888 2,207,629 - - 3,212,888 2,207,629 Parks and recreation 938,851 554,589 - - 938,851 554,589 Economic development 934,250 852,933 - - 934,250 852,933 Interest on long-term debt 437,610 436,104 - - 437,610 436,104 Water and Sewer - - 7,797,294 7,261,987 7,797,294 7,261,987 Sanitation - - 1,538,470 1,611,225 1,538,470 1,611,225 Stormwater - - 499,988 231,166 499,988 231,166 Total expenses 22,732,760 18,655,961 9,835,752 9,104,378 32,568,512 27,760,339
Increase in net position before transfers 9,756,968 9,917,391 1,073,769 1,912,717 10,830,737 11,830,108
Transfers 1,190,094 261,290 (1,190,094) (261,290) - -
Change in net position 10,947,062 10,178,681 (116,325) 1,651,427 10,830,737 11,830,108
Net position, beginning of year 29,060,184 18,881,503 13,271,756 11,620,329 42,331,940 30,501,832 Net position, end of year $ 40,007,246 $ 29,060,184 $ 13,155,431 $ 13,271,756 $ 53,162,677 $ 42,331,940
City of Union City's Changes in Net Position
Governmental Activities Business-type Activities Total

MANAGEMENT'S DISCUSSION AND ANALYSIS
9
Governmental Activities As noted in the table on the preceding page, governmental revenues increased $3,916,376, or 13.71%. The more significant increases were sales taxes which include Local Option Sales Taxes (“LOST”) and Transportation Special Purpose Local Option Sales Taxes (“TSPLOST”) which increased $468,356, or 5.24% as a result of improvements in the local retail economy. Property taxes increased $1,313,713, or 11.46%, due to increased assessed property values and commercial growth. Charges for services increased $510,109, or 13.1% primarily because of a $374,792 increase in plan review fees combined with a $139,172 increase in fines and forfeitures. Capital grants and contributions increased $755,195, or 82.24% because of additional activity related to Georgia Department of Transportation grants. In total, governmental expenses increased $4,076,799 or 21.85% over the prior year. General Government expenses increased $1,519,398 or 40.18% for a number of reasons including $254,000 spent for professional services for master planning; approximately $130,000 for additional building repair expense; approximately $780,000 increase in non-capitalizable assets reclassed as general government expenses; and approximately $238,000 increase in accrued liability claims. Public safety expenses increased $1,021,156 or 9.82% because of additional positions supported by federal grants along with increases in benefits and operating supplies. Parks and recreation expense increased $384,262 or 69.29% because of increases in staff and related benefits and increased depreciation related to new facilities. Changes in other categories of expense were not significant. Business-Type Activities Net position for business-type activities decreased $116,325 or less than 1%. The Water and Sewer Fund reported an increase in net position of $41,146; the Criminal Justice Management Fund had a decrease in net position of $504,496 as this fund was closed as of year-end and any residual balances were transferred to the General Fund; the Stormwater Fund had an increase in net position of $213,150; and the Sanitation Fund had an increase in net position of $133,875. The Water and Sewer Fund had net operating income of $1,833,777; $2,742,125; and $1,670,315; for 2019, 2018 and 2017, respectively. Operating income decreased $908,348 in 2019 compared to 2018. Contributing to this decrease were decreases in other charges revenue of $144,619 or 19.4% as there was a slowdown in new sewer connections; Contracted service expenses increased $462,733 or 21.2% and included $117,000 expenses for outside meter technician as well as $165,000 increases in sewer charges from Fulton County; water sales decreased slightly by $107,462 or 1.5% and water purchases increased $186,024 or 8%. The Water and Sewer Fund continues to bear non-operating expenses for obligations under an intergovernmental agreement with the South Fulton Regional Water Authority to fund the repayment of construction bonds for alternative water and sewer resources. These obligations were $1,516,551; $1,607,071; and $1,459,221; for 2019, 2018 and 2017, respectively. (See Note 14, pages 60 and 61). The Criminal Justice Management Fund had net operating income of $416,183; $200,986; and $95,730; for 2019, 2018 and 2017, respectively. Because of continuing losses prior to 2013, the City ceased operating the facility. Beginning August 2013, the City leased the jail facility to the Fulton County Sheriff department under an annual lease agreement. The facility was sold to Fulton County in October 2018 and all residual fund balances were transferred to the General Fund.

MANAGEMENT'S DISCUSSION AND ANALYSIS
10
The Stormwater Fund had net operating income of $349,410; $566,493; and $443,463; for 2019, 2018 and 2017 respectively. Operating income decreased from 2018 to 2019 primarily because outsourced professional services increased by $281,000 related to city wide stormwater planning. Sanitation Fund. The City manages the billing and collection of revenues for its Sanitation customers, and outsources the collection and disposal of garbage to a private vendor for both residential and commercial customers. The City’s goal in the process is to, at a minimum, break even and attempt to maintain a level retained earnings balance in order to refrain from having to transfer funds into the sanitation activities from other sources. This is a service that the City provides to its residents which aides residents further by controlling and maintaining the lowest cost for these services, as opposed to allowing a private vendor to take over the entire process and expose residents to garbage fees that could be inflated for profit reasons. The Sanitation Fund had net income before transfers of $267,030; $311,730; and $231,240; for 2019, 2018 and 2017, respectively. Financial Analysis of the City’s Funds As noted earlier, the City uses fund accounting to ensure and demonstrate compliance with finance related legal requirements. Governmental Fund Balance and Proprietary Net Position – Major Funds The City's combined fund balances as of the end of the current year for governmental funds, presented on pages 19 and 20, are $33,470,075. This balance represents an increase of $4,133,467 or 14.1% from last year's ending balance. The tables below reflect changes in governmental fund balances. The General Fund’s fund balance has increased $949,209 or 4.95% as the City continues to build reserves for funding future capital projects and as a hedge against future economic disruptions. The General Obligation Bond Fund’s fund balance decreased $3,393,320 or 100% as the City spends the related bond proceeds. The T-SPLOST Fund’s fund balance has increased $2,666,499 or 58.1% as the City collects T-SPLOST proceeds for transportation projects projected to start in future fiscal years.
2019 2018 $ Change % Change
Governmental Major Funds' Fund BalancesGeneral Fund $ 20,120,781 $ 19,171,482 $ 949,299 General Obligation Bonds Fund (23,211) 3,370,109 (3,393,320)
T-SPLOST Fund 7,255,618 4,589,119 2,666,499 Capital Grants Fund (299,301) - (299,301)
Total Governmental Major Funds' Fund Balances $ 27,053,887 $ 27,130,710 $ (76,823) (0.28) %
Proprietary Major Funds' Net PositionWater and Sewer Fund $ 9,787,069 $ 9,745,923 $ 41,146 Stormwater Fund 2,469,207 2,256,057 213,150 Total Proprietary Major
Funds' Net Position $ 12,256,276 $ 12,001,980 $ 254,296 2.12 %
City of Union City Major Funds' Fund Balances and/or Net PositionAugust 31, 2019

MANAGEMENT'S DISCUSSION AND ANALYSIS
11
As noted in the table on the following page, excess (deficiency) of revenues over (under) expenditures prior to other financing sources in the Governmental Funds was $2,120,972 as compared to $5,397,592 in the prior year. Governmental revenues increased $2,977,236 or 10.43%. Property taxes increased $1,276,063 or 11.16% due to increases in property values and additional commercial development within the City. Sales taxes increased $468,368 or 5.24% as the local retail economy continues to improve. Charges for services increased $308,974, or 55.36%, and is primarily related to increases in site plan review fees. Intergovernmental revenue decreased $201,931, or 20.73%, as collection of revenues on certain federal grants was delayed. Interest revenues increased $563,695, or 595%, as interest rates have increased and better terms were negotiated with the City’s primary banker. Overall governmental expenditures increased $6,253,856 or 27.01%. General government expenditures increased $689,888 or 21.31% because of general increases in city administration costs combined with $254,000 of additional professional services related to city wide master planning. Public safety expenditures increased $808,448, or 8%, due to significant increases in group health costs as well as significant increases in operating supplies. Public works expenditures increases $967,569, or 54.25%, due to increases in outsourced professional services and site improvements. Parks and recreation expenditures increased $289,543, or 60.65%, due to increases in personnel and related benefits. Capital outlay increased $3,928,826, or 101.52%, and included a community center building as well as various infrastructure projects. Debt service principal and interest decreased $552,579, or 28.10%, and $15,318, or 2.95%, respectively, as certain bond payments were completed in the prior year.

MANAGEMENT'S DISCUSSION AND ANALYSIS
12
City of Union City's Changes in Governmental Fund BalanceAugust 31, 2019
2019 2018 $ Change % ChangeRevenues Property taxes $ 12,714,288 $ 11,438,225 $ 1,276,063 11.16 % Sales taxes 9,411,819 8,943,451 468,368 5.24 Other taxes 2,062,315 1,810,049 252,266 13.94 Charges for services 867,050 558,076 308,974 55.36 Licenses and permits 2,649,636 2,630,270 19,366 0.74 Intergovernmental 771,987 973,918 (201,931) (20.73) Franchise fees 1,506,941 1,398,275 108,666 7.77 Fines and forfeitures 729,045 589,873 139,172 23.59 Interest revenue 658,402 94,707 563,695 595.20 Rental income 22,436 30,822 (8,386) (27.21) Other revenue 135,522 84,539 50,983 60.31 Total revenues 31,529,441 28,552,205 2,977,236 10.43
Expenditures Current: General government 3,926,810 3,236,922 689,888 21.31 Judicial 397,435 340,609 56,826 16.68 Public safety 10,915,831 10,107,383 808,448 8.00 Public works 2,750,999 1,783,430 967,569 54.25 Parks and recreation 766,940 477,397 289,543 60.65 Planning and economic development 934,250 852,933 81,317 9.53 Capital outlay 7,799,011 3,870,185 3,928,826 101.52 Debt service: Principal (net of refunding) 1,413,753 1,966,332 (552,579) (28.10) Interest 503,440 518,758 (15,318) (2.95) Bond issuance costs - 664 (664) (100.00) Total expenditures 29,408,469 23,154,613 6,253,856 27.01 Excess (deficiency) of revenues over (under) expenditures 2,120,972 5,397,592 (3,276,620) (60.71)
Other financing sources Capital leases 822,401 426,365 396,036 Net transfers 1,190,094 261,290 928,804 Total other financing sources 2,012,495 687,655 1,324,840
Net change in fund balance $ 4,133,467 $ 6,085,247 $ (1,951,780) 32.07 %
The City’s proprietary funds provide the same type of information found in the government-wide statements but in more detail. Other factors concerning the finances of these funds have already been addressed in the discussion of the City’s business-type activities.

MANAGEMENT'S DISCUSSION AND ANALYSIS
13
General Fund Budgetary Highlights The final budgets passed by the City Council anticipated $22,191,707 of revenues to cover expenditures of $21,817,550 and net transfers out of $6,851,028. Actual results were $7,426,170 better than projected. A comparison of the final budgetary figures and the actual budgetary figures for revenues are located on page 22. For the General Fund, the actual revenues were $4,059,222 better than the final budget. Revenues were
budgeted at $22,191,707 and actual revenues were $26,250,929. Property taxes were $1,907,303 better than budgeted due to increases in property values and additional development. Sales taxes and other taxes were $617,529 and $191,243, respectively, better than budgeted due to improvements in the local economy. Charges for services were $399,664 better than budgeted because site plan review fees were almost $400,000 better than projected. Licenses and permits were $283,636 better than budgeted due to significant increases in business licenses and building permits. Fines and forfeitures were $133,105 less than budgeted due penalties being assessed using community service as opposed to cash penalties. Interest revenues were $543,453 better than budgeted due to increases in interest rates and better terms negotiated with the City’s primary banker.
Actual expenditures of $18,424,108 were $3,393,442 less than the budgeted amount of $21,817,550 as management continues to be very conservative in their budgeting. General government expenditures were $1,045,990 better than budgeted primarily because a contingency budget of $357,948 was not utilized and the general operations department was $374,610 under budget because certain contractual services were not required. Public safety expenditures were $1,334,202 better than budgeted because of vacancies in the police and fire departments. Public works expenditures were $598,277 better than budgeted because certain outsourced professional services were not required.
Capital Asset and Debt Administration
Capital Assets The City has invested $37,781,151 in capital assets (net of depreciation). Capital assets held by the City at the end of the current and previous year are summarized below:
2019 2018 2019 2018 2019 2018
Land $ 691,851 $ 691,851 $ 493,194 $ 493,194 $ 1,185,045 $ 1,185,045 Construction in progress 3,130,961 3,593,425 108,686 - 3,239,647 3,593,425 Buildings, grounds and improvements 11,617,243 5,621,451 8,333,801 8,718,157 19,951,044 14,339,608 Machinery and equipment 248,611 211,448 179,159 173,221 427,770 384,669 Infrastructure 6,881,016 7,014,700 652,930 692,409 7,533,946 7,707,109 Intangibles - - 3,810,119 4,214,325 3,810,119 4,214,325 Vehicles 1,595,868 1,514,721 37,712 50,542 1,633,580 1,565,263 Total $ 24,165,550 $ 18,647,596 $ 13,615,601 $ 14,341,848 $ 37,781,151 $ 32,989,444
Governmental Activities Business -type Activities Total
City of Union City's Capital Assets, net of Accumulated DepreciationAugust 31, 2019
The detailed schedule capital assets are reported in Note 5 of the financial statements.

MANAGEMENT'S DISCUSSION AND ANALYSIS
14
Total capital asset additions for 2019 were $6,706,131 compared to $3,569,258 in 2018. Long-Term Debt At the end of the current year, the City had long-term debt related to governmental activities of $11,928,941 and $8,045,000 for business type activities. All debt is 100% backed by the full faith and credit of the government. Governmental debt is secured by property tax revenue sources and Water and Sewer bonds are secured by related revenues. In 2012, the City issued Water and Sewer revenue bonds of $11,275,000 for operations and renewal and extension activities. Moody’s Investors Service has assigned a rating of “A2” on the 2012 Water and Sewer bonds. The Citizens of the City approved the 2006 Bond Referendum in March of 2006 for $12,575,000 which required an increase in the property tax millage by 2 mills. The additional property tax revenue collected from the increase in the millage rate will be used to repay the 2006 Series Bonds. In September 2014, the City issued series 2014 general obligation bonds to partially refund series 2006 bonds. The debt position of the City is summarized below and is more fully analyzed in Note 6 of the financial statements.
2019 2018 2019 2018 2019 2018
General obligation bonds backed by property taxes $ 11,270,000 $ 12,095,000 $ - $ - $ 11,270,000 $ 12,095,000 Revenue bonds - - 8,045,000 8,540,000 8,045,000 8,540,000 Capital lease 658,941 425,293 - - 658,941 425,293
$ 11,928,941 $ 12,520,293 $ 8,045,000 $ 8,540,000 $ 19,973,941 $ 21,060,293
City of Union City's Outstanding Long-Term LiabilitiesAugust 31, 2019
Governmental Activities Business -type Activities Total
Economic Factors and Next Year’s Budgets and Rates Union City, like most cities, has been hit hard by the recession. Due to the economy, the City was placed in a difficult financial position and was forced to make tough decisions. However, over the past few years, the City’s strategic location and improving economic conditions has led to the acquisition of several high profile companies including Proctor and Gamble, the Walmart Distribution E-commerce facility, Amazon, and Atlanta Metro Studios of Union City. Millage rates for property taxes were set at 14.326 mills for the fiscal year 2019. Contacting the City’s Financial Management This financial report is designed to provide a general overview of the City's finances for all those with an interest in the government's finances. Questions concerning any of the information provided in this report or requests for additional financial information should be addressed to the City’s Finance Department, City Hall, 5047 Union Street, Union City, Georgia 30291 or by calling (770) 964-2288.

15
ASSETS Cash and cash equivalents $ 36,238,312 $ 6,499,988 $ 42,738,300 $ 32,344 Investments 107,329 322,535 429,864 - Taxes receivable 294,458 - 294,458 - Accounts receivable, net of allowances - 2,147,460 2,147,460 - Internal balances 32,165 (32,165) - - Due from component unit - 32,344 32,344 - Due from other governments 2,067,713 - 2,067,713 - Intergovernmental receivable from Fulton County - - - 12,825,000 Due from others 343,396 - 343,396 - Inventory 6,850 35,463 42,313 - Prepaid expenses 521,601 - 521,601 - Restricted assets: Cash and cash equivalents 612,568 1,085,178 1,697,746 - Investments - 115,858 115,858 - Capital assets: Nondepreciable 3,822,812 601,880 4,424,692 - Depreciable, net of accumulated depreciation 20,342,738 13,013,721 33,356,459 - Total assets 64,389,942 23,822,262 88,212,204 12,857,344
DEFERRED OUTFLOWS OF RESOURCES Pension 2,392,996 159,895 2,552,891 - Deferred charges on refunding 312,048 - 312,048 928,472 Total deferred outflows of resources 2,705,044 159,895 2,864,939 928,472
LIABILITIES Accounts payable 4,778,169 1,055,730 5,833,899 - Accrued liabilities 921,274 53,615 974,889 - Unearned revenues 31,411 - 31,411 - Due to other governments 150,540 - 150,540 - Customer deposits payable - 1,223,855 1,223,855 - Due to primary government - - - 32,344 Capital leases due within one year 530,954 - 530,954 - Capital leases due in more than one year 127,987 - 127,987 - Bonds payable due within one year 855,000 505,000 1,360,000 420,000 Bonds payable due in more than one year 11,307,860 7,462,324 18,770,184 12,405,000 Claims payable due within one year 427,939 - 427,939 - Compensated absences due within one year 451,332 24,717 476,049 - Net pension liability due in more than one year 6,253,311 417,832 6,671,143 - Total liabilities 25,835,777 10,743,073 36,578,850 12,857,344
DEFERRED INFLOWS OF RESOURCES Pension 1,251,963 83,653 1,335,616 - Total deferred inflows of resources 1,251,963 83,653 1,335,616 -
NET POSITION Net investment in capital assets 12,268,365 5,797,207 18,065,572 - Restricted Law enforcement 1,037,386 - 1,037,386 - Economic development 611,596 - 611,596 - Debt service 9,292 1,293,146 1,302,438 - Capital outlay 11,858,586 - 11,858,586 - Customer deposits - 81,495 81,495 - Unrestricted 14,222,021 5,983,583 20,205,604 928,472 Total net position $ 40,007,246 $ 13,155,431 $ 53,162,677 $ 928,472
The accompanying notes are an integral part of these financial statements.
ActivitiesGovernmental
Activities
CITY OF UNION CITY, GEORGIA
STATEMENT OF NET POSITIONAUGUST 31, 2019
Primary Government Component UnitSouth Fulton
MunicipalRegional
Jail Authority
TotalPrimary
GovernmentBusiness-type

16
Functions/ProgramsPrimary government: Governmental activities:
General government $ 5,300,953 $ 2,855,996 $ - $ - $ (2,444,957) $ - $ (2,444,957) $ - Judicial 490,390 59,523 - - (430,867) - (430,867) - Public safety 11,417,818 819,721 - - (10,598,097) - (10,598,097) - Public works 3,212,888 15,721 - 1,673,477 (1,523,690) - (1,523,690) - Parks and recreation 938,851 58,396 - - (880,455) - (880,455) - Planning and economic development 934,250 594,332 - - (339,918) - (339,918) - Interest on long-term debt 437,610 - - - (437,610) - (437,610) -
Total governmental activities 22,732,760 4,403,689 - 1,673,477 (16,655,594) - (16,655,594) - Business-type activities: Water and Sewerage 7,797,294 7,807,636 - - - 10,342 10,342 - Sanitation 1,538,470 2,221,683 - - - 683,213 683,213 - Stormwater 499,988 849,398 - - - 349,410 349,410 - Total business-type activities 9,835,752 10,878,717 - - - 1,042,965 1,042,965 - Total primary government $ 32,568,512 $ 15,282,406 $ - $ 1,673,477 (16,655,594) 1,042,965 (15,612,629) - Component unit: South Fulton Municipal Regional Jail Authority $ 390,560 $ 140,074 $ - $ - - - - (250,486) Total component unit $ 390,560 $ 140,074 $ - $ - - - - (250,486)
General revenues:Property taxes 12,773,085 - 12,773,085 - Sales taxes 9,411,819 - 9,411,819 - Insurance premium tax 1,394,090 - 1,394,090 - Alcoholic beverage taxes 18,153 - 18,153 - Other taxes 650,072 - 650,072 - Franchise taxes 1,506,941 - 1,506,941 - Unrestricted investment earnings 658,402 30,804 689,206 137 Gain on sale of capital assets - - - 5,632,451
Transfers 1,190,094 (1,190,094) - - Total general revenues and transfers 27,602,656 (1,159,290) 26,443,366 5,632,588
Change in net position 10,947,062 (116,325) 10,830,737 5,382,102 Net position, beginning of year 29,060,184 13,271,756 42,331,940 (4,453,630) Net position, end of year $ 40,007,246 $ 13,155,431 $ 53,162,677 $ 928,472
The accompanying notes are an integral part of these financial statements.
CITY OF UNION CITY, GEORGIA
Program Revenues Net (Expenses) Revenues and Changes in Net Position
STATEMENT OF ACTIVITIES FOR THE FISCAL YEAR ENDED AUGUST 31, 2019
ExpensesCharges for
Services
OperatingGrants and
Contributions
CapitalGrants and
ContributionsGovernmental
ActivitiesBusiness-type
Activities Total
Component UnitSouth Fulton
MunicipalRegional
Jail Authority
Primary Government

17
ASSETS Cash and cash equivalents $ 22,622,749 $ 10,630 Restricted cash - - Investments 107,329 - Taxes receivable, net 240,478 - Due from other governments 476,930 - Due from others 343,396 - Inventory 6,850 - Due from other funds 863,473 - Prepaid expenditures 271,601 - Total assets $ 24,932,806 $ 10,630
LIABILITIES Accounts payable $ 4,338,772 $ - Accrued liabilities 273,211 - Unearned revenue 31,411 - Due to others - - Due to other funds - 33,841 Total liabilities 4,643,394 33,841
DEFERRED INFLOWS OF RESOURCES Unavailable revenue - property taxes 168,631 - Unavailable revenue - intergovernmental revenues - -
Total deferred inflows of resources 168,631 -
FUND BALANCES (DEFICITS) Nonspendable: Inventory 6,850 - Prepaid expenditures 271,601 - Restricted for: Law enforcement - - Economic development - - Other capital projects - - Debt service - - Unassigned 19,842,330 (23,211) Total fund balances 20,120,781 (23,211) Total liabilities, deferred inflows of resources and fund balances (deficits) $ 24,932,806 $ 10,630
Amounts reported for governmental activities in the statement of net position are different because:
Capital assets used in governmental activities are not financial resources and, therefore, are not reported in the funds. Other long-term assets are not available to pay for current-period expenditures and, therefore, are reported as unavailable revenue in the funds. Deferred refunding charges are not financial resources and, therefore, are not reported in the funds. The net pension liability and related deferred outflows and inflows of resources are not financial resources and, therefore, are not reported in the governmental funds. Certain liabilities are not due and payable in the current period and, therefore, are not reported in the funds.
Net position of governmental activities
The accompanying notes are an integral part of these financial statements.
Bonds FundObligation
General
CITY OF UNION CITY, GEORGIA
BALANCE SHEETGOVERNMENTAL FUNDS
AUGUST 31, 2019
General Fund

18
$ 7,463,569 $ - $ 6,141,364 $ 36,238,312 - - 612,568 612,568 - - - 107,329 - - 53,980 294,458
307,460 842,342 440,981 2,067,713 - - - 343,396 - - - 6,850 - - - 863,473 - - 250,000 521,601
$ 7,771,029 $ 842,342 $ 7,498,893 $ 41,055,700
$ 64,546 $ 53,032 $ 321,819 $ 4,778,169 450,865 - - 724,076
- - - 31,411 - - 150,540 150,540 - 368,545 428,922 831,308
515,411 421,577 901,281 6,515,504
- - - 168,631 - 720,066 181,424 901,490 - 720,066 181,424 1,070,121
- - - 6,850 - - 250,000 521,601
- - 1,037,386 1,037,386 - - 611,596 611,596
7,255,618 - 4,602,968 11,858,586 - - 9,292 9,292 - (299,301) (95,054) 19,424,764
7,255,618 (299,301) 6,416,188 33,470,075
$ 7,771,029 $ 842,342 $ 7,498,893
24,165,550
1,070,121 312,048
(5,112,278) (13,898,270)
$ 40,007,246
NonmajorGovernmental
Funds
TotalGovernmental
FundsFundGrantsCapital
FundTSPLOST
19
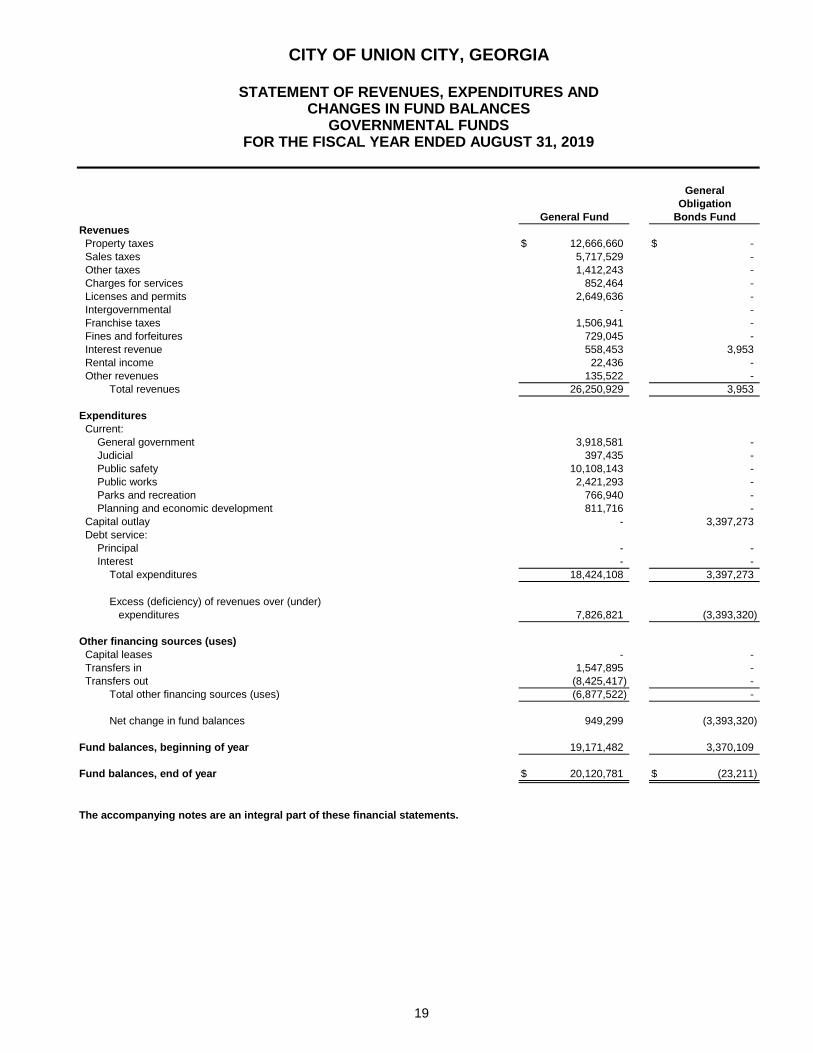
Revenues Property taxes $ 12,666,660 $ - Sales taxes 5,717,529 - Other taxes 1,412,243 - Charges for services 852,464 - Licenses and permits 2,649,636 - Intergovernmental - - Franchise taxes 1,506,941 - Fines and forfeitures 729,045 - Interest revenue 558,453 3,953 Rental income 22,436 - Other revenues 135,522 - Total revenues 26,250,929 3,953
Expenditures Current: General government 3,918,581 - Judicial 397,435 - Public safety 10,108,143 - Public works 2,421,293 - Parks and recreation 766,940 - Planning and economic development 811,716 - Capital outlay - 3,397,273 Debt service: Principal - - Interest - - Total expenditures 18,424,108 3,397,273
Excess (deficiency) of revenues over (under) expenditures 7,826,821 (3,393,320)
Other financing sources (uses) Capital leases - - Transfers in 1,547,895 - Transfers out (8,425,417) - Total other financing sources (uses) (6,877,522) -
Net change in fund balances 949,299 (3,393,320)
Fund balances, beginning of year 19,171,482 3,370,109
Fund balances, end of year $ 20,120,781 $ (23,211)
The accompanying notes are an integral part of these financial statements.
GeneralObligation
Bonds Fund
CITY OF UNION CITY, GEORGIA
STATEMENT OF REVENUES, EXPENDITURES ANDCHANGES IN FUND BALANCES
GOVERNMENTAL FUNDSFOR THE FISCAL YEAR ENDED AUGUST 31, 2019
General Fund

20
$ - $ - $ 47,628 $ 12,714,288 3,694,290 - - 9,411,819
- - 650,072 2,062,315 - - 14,586 867,050 - - - 2,649,636 - 398,131 373,856 771,987 - - - 1,506,941 - - - 729,045
79,351 - 16,645 658,402 - - - 22,436 - - - 135,522
3,773,641 398,131 1,102,787 31,529,441
- - 8,229 3,926,810 - - - 397,435 - - 807,688 10,915,831 - - 329,706 2,750,999 - - - 766,940 - - 122,534 934,250
1,107,142 1,591,490 1,703,106 7,799,011
- - 1,413,753 1,413,753 - - 503,440 503,440
1,107,142 1,591,490 4,888,456 29,408,469
2,666,499 (1,193,359) (3,785,669) 2,120,972
- - 822,401 822,401 - 666,480 7,758,937 9,973,312 - - (357,801) (8,783,218) - 666,480 8,223,537 2,012,495
2,666,499 (526,879) 4,437,868 4,133,467
4,589,119 227,578 1,978,320 29,336,608
$ 7,255,618 $ (299,301) $ 6,416,188 $ 33,470,075
TotalGovernmental
FundsFundGrantsCapital
TSPLOSTFund
NonmajorGovernmental
Funds

21
Amounts reported for governmental activities in the statement of activities are different because:
Net change in fund balances - total governmental funds $ 4,133,467
Governmental funds report capital outlays as expenditures. However, in the statement of activities the cost ofthose assets is allocated over their estimated useful lives and reported as depreciation expense. This is theamount by which capital outlay exceeded depreciation in the current period. 5,522,612
The net effect of various miscellaneous transactions involving capital assets (disposals) is to decrease netposition. (4,658)
Revenues in the statement of activities that do not provide current financial resources are not reported asrevenues in the funds. 960,287
The issuance of long-term debt provides current financial resources to governmental funds, while therepayment of the principal of long-term debt consumes the current financial resources of governmental funds.Neither transaction, however, has any effect on net position. This amount is the net effect of thesedifferences in the treatment of long-term debt and related items. 591,352
Some expenses reported in the statement of activities do not require the use of current financial resourcesand, therefore, are not reported as expenditures in governmental funds. (255,998)
Change in net position of governmental activities $ 10,947,062
The accompanying notes are an integral part of these financial statements.
CITY OF UNION CITY, GEORGIA
RECONCILIATION OF THE STATEMENT OF REVENUES, EXPENDITURESAND CHANGES IN FUND BALANCES OF GOVERNMENTAL FUNDS
TO THE STATEMENT OF ACTIVITIESFOR THE FISCAL YEAR ENDED AUGUST 31, 2019

22
Revenues Property taxes $ 10,759,357 $ 10,759,357 $ 12,666,660 $ 1,907,303 Sales taxes 5,100,000 5,100,000 5,717,529 617,529 Other taxes 1,221,000 1,221,000 1,412,243 191,243 Charges for services 452,800 452,800 852,464 399,664 Licenses and permits 2,366,000 2,366,000 2,649,636 283,636 Franchise taxes 1,357,400 1,357,400 1,506,941 149,541 Fines and forfeitures 862,150 862,150 729,045 (133,105) Interest revenue 15,000 15,000 558,453 543,453 Rental income 18,000 18,000 22,436 4,436 Other revenues 40,000 40,000 135,522 95,522 Total revenues 22,191,707 22,191,707 26,250,929 4,059,222
Expenditures Current General government: City clerk 348,606 389,997 389,997 - Finance 652,919 652,919 575,649 77,270 City administrator 652,625 652,625 567,899 84,726 Mayor and council 700,608 700,608 563,763 136,845 Human resources 536,929 536,929 522,339 14,590 Operations 2,031,493 2,031,493 1,298,934 732,559 Total general government 4,923,180 4,964,571 3,918,581 1,045,990
Judicial: Municipal court 414,885 414,885 397,435 17,450
Public safety: Police 6,598,668 6,598,668 5,859,111 739,557 Fire 4,843,677 4,843,677 4,249,032 594,645 Total public safety 11,442,345 11,442,345 10,108,143 1,334,202
Public works: Buildings and grounds 3,019,570 3,019,570 2,421,293 598,277
Planning and economic development 909,889 909,889 811,716 98,173
Parks and recreation 964,501 964,501 766,940 197,561
Debt service 101,789 101,789 - 101,789
Total expenditures 21,776,159 21,817,550 18,424,108 3,393,442
Excess of revenues over expenditures 415,548 374,157 7,826,821 7,452,664
Other financing sources (uses) Transfers in 629,414 629,414 1,547,895 918,481 Transfers out (7,480,442) (7,480,442) (8,425,417) (944,975) Total other financing uses, net (6,851,028) (6,851,028) (6,877,522) (26,494)
Net change in fund balances $ (6,435,480) $ (6,476,871) 949,299 $ 7,426,170
Fund balance, beginning of year 19,171,482
Fund balance, end of year $ 20,120,781
The accompanying notes are an integral part of these financial statements.
CITY OF UNION CITY, GEORGIA
STATEMENT OF REVENUES, EXPENDITURES AND CHANGES IN FUND BALANCESBUDGET (GAAP BASIS) AND ACTUAL
GENERAL FUNDFOR THE FISCAL YEAR ENDED AUGUST 31, 2019
Budgeted AmountsOriginal Final Actual
Variancewith Final
Budget
23
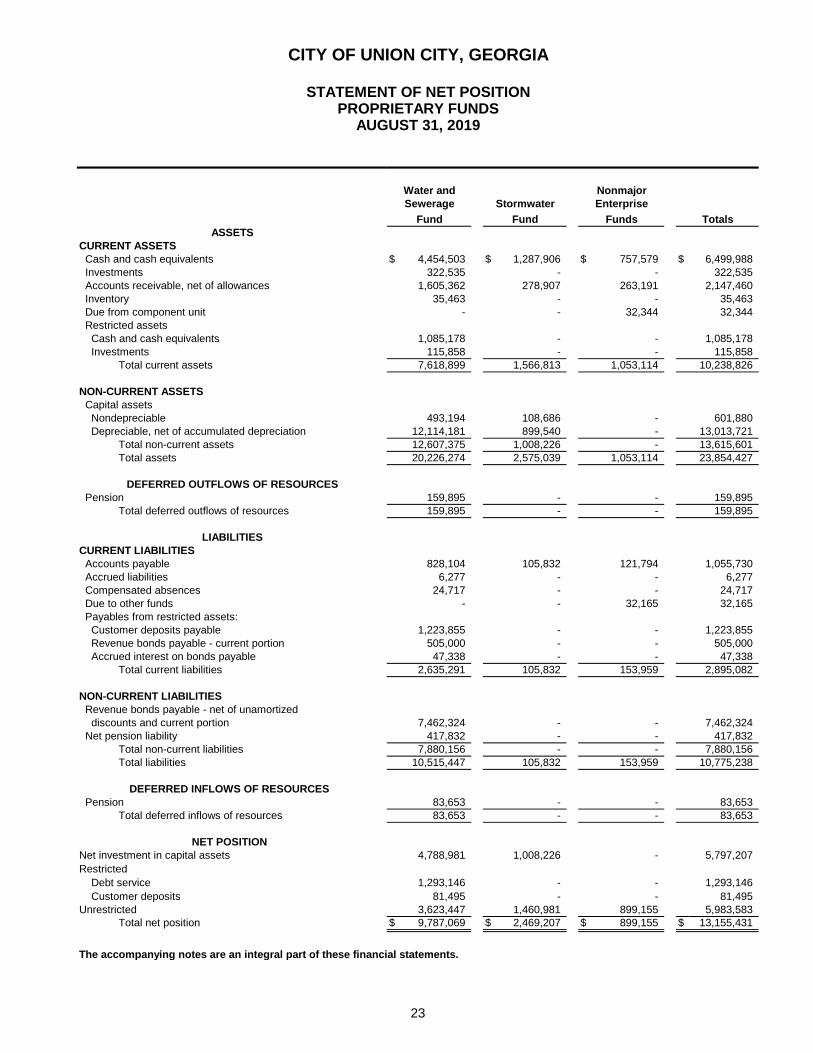
ASSETSCURRENT ASSETS Cash and cash equivalents $ 4,454,503 $ 1,287,906 $ 757,579 $ 6,499,988 Investments 322,535 - - 322,535 Accounts receivable, net of allowances 1,605,362 278,907 263,191 2,147,460 Inventory 35,463 - - 35,463 Due from component unit - - 32,344 32,344 Restricted assets Cash and cash equivalents 1,085,178 - - 1,085,178 Investments 115,858 - - 115,858 Total current assets 7,618,899 1,566,813 1,053,114 10,238,826
NON-CURRENT ASSETS Capital assets Nondepreciable 493,194 108,686 - 601,880 Depreciable, net of accumulated depreciation 12,114,181 899,540 - 13,013,721 Total non-current assets 12,607,375 1,008,226 - 13,615,601 Total assets 20,226,274 2,575,039 1,053,114 23,854,427
DEFERRED OUTFLOWS OF RESOURCES Pension 159,895 - - 159,895 Total deferred outflows of resources 159,895 - - 159,895
LIABILITIESCURRENT LIABILITIES Accounts payable 828,104 105,832 121,794 1,055,730 Accrued liabilities 6,277 - - 6,277 Compensated absences 24,717 - - 24,717 Due to other funds - - 32,165 32,165 Payables from restricted assets: Customer deposits payable 1,223,855 - - 1,223,855 Revenue bonds payable - current portion 505,000 - - 505,000 Accrued interest on bonds payable 47,338 - - 47,338 Total current liabilities 2,635,291 105,832 153,959 2,895,082
NON-CURRENT LIABILITIES Revenue bonds payable - net of unamortized discounts and current portion 7,462,324 - - 7,462,324 Net pension liability 417,832 - - 417,832 Total non-current liabilities 7,880,156 - - 7,880,156 Total liabilities 10,515,447 105,832 153,959 10,775,238
DEFERRED INFLOWS OF RESOURCES Pension 83,653 - - 83,653 Total deferred inflows of resources 83,653 - - 83,653
NET POSITION Net investment in capital assets 4,788,981 1,008,226 - 5,797,207 Restricted Debt service 1,293,146 - - 1,293,146 Customer deposits 81,495 - - 81,495 Unrestricted 3,623,447 1,460,981 899,155 5,983,583 Total net position $ 9,787,069 $ 2,469,207 $ 899,155 $ 13,155,431
The accompanying notes are an integral part of these financial statements.
CITY OF UNION CITY, GEORGIA
STATEMENT OF NET POSITIONPROPRIETARY FUNDS
AUGUST 31, 2019
EnterpriseNonmajor
Funds
Water andSewerage
FundStormwater
Fund Totals
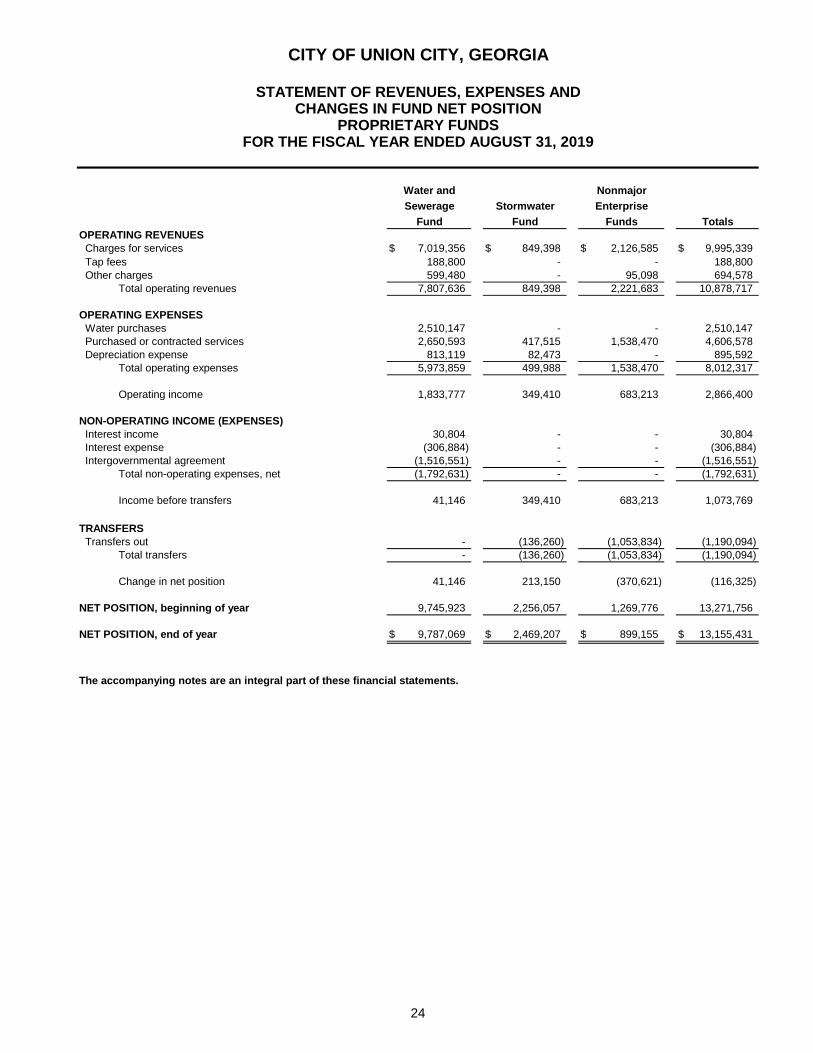
24
OPERATING REVENUES Charges for services $ 7,019,356 $ 849,398 $ 2,126,585 $ 9,995,339 Tap fees 188,800 - - 188,800 Other charges 599,480 - 95,098 694,578 Total operating revenues 7,807,636 849,398 2,221,683 10,878,717
OPERATING EXPENSES Water purchases 2,510,147 - - 2,510,147 Purchased or contracted services 2,650,593 417,515 1,538,470 4,606,578 Depreciation expense 813,119 82,473 - 895,592 Total operating expenses 5,973,859 499,988 1,538,470 8,012,317
Operating income 1,833,777 349,410 683,213 2,866,400
NON-OPERATING INCOME (EXPENSES) Interest income 30,804 - - 30,804 Interest expense (306,884) - - (306,884) Intergovernmental agreement (1,516,551) - - (1,516,551) Total non-operating expenses, net (1,792,631) - - (1,792,631)
Income before transfers 41,146 349,410 683,213 1,073,769
TRANSFERS Transfers out - (136,260) (1,053,834) (1,190,094) Total transfers - (136,260) (1,053,834) (1,190,094)
Change in net position 41,146 213,150 (370,621) (116,325)
NET POSITION, beginning of year 9,745,923 2,256,057 1,269,776 13,271,756
NET POSITION, end of year $ 9,787,069 $ 2,469,207 $ 899,155 $ 13,155,431
The accompanying notes are an integral part of these financial statements.
CITY OF UNION CITY, GEORGIA
Funds
FOR THE FISCAL YEAR ENDED AUGUST 31, 2019
Nonmajor
Fund TotalsFundEnterprise
Water andSewerage Stormwater
PROPRIETARY FUNDS
STATEMENT OF REVENUES, EXPENSES ANDCHANGES IN FUND NET POSITION

25
CASH FLOWS FROM OPERATING ACTIVITIES Receipts from customers and users $ 7,544,780 $ 848,397 $ 2,037,588 $ 10,430,765 Payments to suppliers (4,559,397) (435,127) (1,579,273) (6,573,797) Payments to employees (619,363) - - (619,363) Net cash provided by operating activities 2,366,020 413,270 458,315 3,237,605
CASH FLOWS FROM NON-CAPITAL FINANCING ACTIVITIES Payments on intergovernmental agreement (1,516,551) - - (1,516,551) Transfers - (136,260) (1,053,834) (1,190,094) Net cash used in non-capital financing activities (1,516,551) (136,260) (1,053,834) (2,706,645)
CASH FLOWS FROM CAPITAL AND RELATED FINANCING ACTIVITIES Proceeds from the sale of capital assets - 24,790 - 24,790 Purchase of capital assets - (194,135) - (194,135) Principal paid on bonds (495,000) - - (495,000) Interest paid (298,863) - - (298,863) Net cash used in capital and related financing activities (793,863) (169,345) - (963,208)
CASH FLOWS FROM INVESTING ACTIVITIES Purchase of investments (2,544) - - (2,544) Interest and dividends received 30,804 - - 30,804 Net cash provided by investing activities 28,260 - - 28,260
Change in cash and cash equivalents 83,866 107,665 (595,519) (403,988)
Cash and cash equivalents: Beginning of year 5,455,815 1,180,241 1,353,098 7,989,154
End of year $ 5,539,681 $ 1,287,906 $ 757,579 $ 7,585,166
Classified as: Cash and cash equivalents $ 4,454,503 1,287,906 $ 757,579 $ 6,499,988 Restricted assets, cash 1,085,178 - - 1,085,178
$ 5,539,681 $ 1,287,906 $ 757,579 $ 7,585,166
(Continued)
PROPRIETARY FUNDSFOR THE FISCAL YEAR ENDED AUGUST 31, 2019
Enterprise
CITY OF UNION CITY, GEORGIA
STATEMENT OF CASH FLOWS
Water andSewerage
FundStormwater
Fund Totals
Nonmajor
Funds

26
Reconciliation of operating income to net cash provided by operating activities: Operating income $ 1,833,777 $ 349,410 $ 683,213 $ 2,866,400 Adjustments to reconcile operating income to net cash provided by operating activities: Depreciation expense 813,119 82,473 - 895,592 Changes in assets and liabilities: Increase in accounts receivable (262,856) (1,001) (10,184) (274,041) Decrease in due from others - - 79,406 79,406 Decrease in due from other funds - - 32,165 32,165 Decrease in accounts payable (123,549) (17,612) (15,244) (156,405) Decrease in accrued liabilities (681) - (758) (1,439) Decrease in due to component unit - - (285,482) (285,482) Increase in customer deposits 84,340 - - 84,340 Increase (decrease) in net pension liability 21,870 - (24,801) (2,931) Net cash provided by operating activities $ 2,366,020 $ 413,270 $ 458,315 $ 3,237,605
The accompanying notes are an integral part of these financial statements.
Water and
STATEMENT OF CASH FLOWS
SewerageFund
StormwaterFund Totals
Enterprise
CITY OF UNION CITY, GEORGIA
Funds
PROPRIETARY FUNDSFOR THE FISCAL YEAR ENDED AUGUST 31, 2019
Nonmajor

27
ASSETSCash and cash equivalents $ 37,258 Total assets $ 37,258
LIABILITIESDue to others $ 37,258 Total liabilities $ 37,258
The accompanying notes are an integral part of these financial statements.
CITY OF UNION CITY, GEORGIA
STATEMENT OF FIDUCIARY ASSETS AND LIABILITIESAGENCY FUND
AUGUST 31, 2019
Municipal Court

NOTES TO THE FINANCIAL STATEMENTS

CITY OF UNION CITY, GEORGIA
NOTES TO FINANCIAL STATEMENTS FOR THE FISCAL YEAR ENDED AUGUST 31, 2019
28
NOTE 1. SUMMARY OF SIGNIFICANT ACCOUNTING POLICIES
The financial statements of the City of Union City, Georgia (the “City”) have been prepared in conformity with accounting principles generally accepted in the United States of America (“GAAP”) as applied to government units. The Governmental Accounting Standards Board (“GASB”) is the accepted standard-setting body for establishing governmental accounting and financial reporting principles. The more significant of the City's accounting policies are described below. A. The Financial Reporting Entity
The City was incorporated on August 17, 1908 and operates under an elected Mayor and Council-City Manager form of government. The City Manager is appointed by and serves at the pleasure of the City Council. As such, she is responsible for the day-to-day operations of city government. The legislative branch of the City is vested in the Mayor and four Council members. The City provides the following services and operations as authorized by its charter: public safety (police and fire); planning and engineering; code enforcement; street maintenance; traffic control; solid waste collection and disposal; water and sewerage; parks and recreation; community development; and general administrative services. As required by GAAP these financial statements present the City and its component unit, a legally-separate entity for which the City is financially accountable. Based upon criteria set forth by GASB Statement 14 and as amended by GASB Statement 39 and 61, the City was determined to have the following component unit as of August 31, 2019: South Fulton Municipal Regional Jail Authority (the “Authority”). The Authority is responsible for the operations of the South Fulton Municipal Regional Justice Center, which provides services to the City as well as other municipalities and governmental agencies in the geographical area. The Board of Directors of the Authority consists of five members, three of which are appointed by the City. The City has the ability to impose its will on the Authority and the Authority is therefore reported in a separate column as a discretely presented component unit in the City's government-wide financial statements to emphasize that it is legally separate from the City. Separate financial statements are not available. B. Government-wide and Fund Financial Statements The government-wide financial statements (i.e., the statement of net position and the statement of activities) report information on all of the non-fiduciary activities of the primary government. Governmental activities, which normally are supported by taxes and intergovernmental revenues, are reported separately from business-type activities, which rely to a significant extent on fees and charges for support.

NOTES TO FINANCIAL STATEMENTS
29
NOTE 1. SUMMARY OF SIGNIFICANT ACCOUNTING POLICIES (CONTINUED)
B. Government-wide and Fund Financial Statements (Continued) The statement of activities demonstrates the degree to which the direct expenses of a given function or segment is offset by program revenues. Direct expenses are those that are clearly identifiable with a specific function or segment. Program revenues include: 1) charges to customers or applicants who purchase, use, or directly benefit from goods, services, or privileges provided by a given function or segment, and 2) grants and contributions that are restricted to meeting the operational or capital requirements of a particular function or segment. Taxes and other items not properly included among program revenues are reported instead as general revenues. Separate financial statements are provided for governmental funds, and proprietary funds. Major individual governmental funds and major individual enterprise funds are reported as separate columns in the fund financial statements.
C. Measurement Focus, Basis of Accounting and Basis of Presentation
The government-wide financial statements are reported using the economic resources measurement focus and the accrual basis of accounting, as are the proprietary fund and the fiduciary fund financial statements, although the agency funds have no measurement focus. Revenues are recorded when earned and expenses are recorded when a liability is incurred, regardless of the timing of the related cash flows. Property taxes are recognized as revenues in the year for which they are levied. Grants and similar items are recognized as revenue as soon as all eligibility requirements imposed by the provider have been met. Governmental fund financial statements are reported using the current financial resources measurement focus and the modified accrual basis of accounting. Revenues are recognized as soon as they are both measurable and available. Revenues are considered to be available when they are collectible within the current period or soon enough thereafter to pay liabilities of the current period. For this purpose, the City considers revenues to be available if they are collected within 60 days of the end of the current fiscal period, however, grant revenues are considered to be available if they are collected within 120 days of the end of the current fiscal period. Expenditures generally are recorded when a liability is incurred, as under accrual accounting. However, debt service expenditures, as well as expenditures related to compensated absences and claims and judgments, are recorded only when payment is due. Property taxes, sales taxes, franchise taxes, licenses, and investment income associated with the current fiscal period are all considered to be susceptible to accrual and so have been recognized as revenues of the current fiscal period. All other revenue items are considered to be measurable and available only when cash is received by the City.

NOTES TO FINANCIAL STATEMENTS
30
NOTE 1. SUMMARY OF SIGNIFICANT ACCOUNTING POLICIES (CONTINUED)
C. Measurement Focus, Basis of Accounting and Basis of Presentation (Continued) The City reports the following major governmental funds:
The General Fund is the City’s primary operating fund. It accounts for all financial resources of the general government, except those required to be accounted for in another fund. The General Obligation Bonds Fund accounts for the issuance of general obligation bonds and its related acquisition and construction of capital facilities. The T-SPLOST Fund accounts for proceeds of the Transportation Special Purpose Local Option Sales Tax. Funds are used for various transportation projects within the City. The Capital Grants Fund accounts for various capital projects of the City. Funding is provided by state and federal agencies and transfers from the General Fund.
The City reports the following major proprietary funds:
The Water and Sewerage Fund accounts for the operations of the City operated water distribution system, sewerage treatment plant, sewerage pumping stations and collection systems. All activities necessary to provide such services are accounted for in this fund. The Stormwater Fund accounts for the costs associated with the management, construction, maintenance, protections, control, regulation, use, and enhancement of stormwater systems and programs.
Additionally, the City reports the following fund types:
The Special Revenue Funds account for revenue sources that are legally restricted to expenditure for specific purposes. The Capital Projects Funds account for the acquisition and construction of major capital facilities other than those financed by proprietary funds. The Debt Service Funds account for the resources accumulated and payments made for principal and interest on long-term general obligation debt of governmental funds. The Agency Fund is used to account for the collection and disbursement of monies by the City’s Municipal Court on behalf of other governments and individuals.

NOTES TO FINANCIAL STATEMENTS
31
NOTE 1. SUMMARY OF SIGNIFICANT ACCOUNTING POLICIES (CONTINUED)
C. Measurement Focus, Basis of Accounting and Basis of Presentation (Continued) As a general rule, the effect of interfund activity has been eliminated from the government-wide financial statements. Exceptions to this general rule are payments-in-lieu of taxes and other charges between the City’s water and sanitation functions and various other functions of the City. Elimination of these charges would distort the direct costs and program revenues reported for the various functions concerned. Amounts reported as program revenues include: 1) charges to customers or applicants for goods, services, or privileges provided, 2) operating grants and contributions, and 3) capital grants and contributions. Internally dedicated resources are reported as general revenues rather than as program revenues. Likewise, general revenues include all taxes.
Proprietary funds distinguish operating revenues and expenses from non-operating items. Operating revenues and expenses generally result from providing services and producing and delivering goods in connection with a proprietary fund’s principal ongoing operations. The principal operating revenues of the enterprise funds are charges to customers for sales and services provided. The City also recognizes as operating revenue the portion of tap fees intended to recover the cost of connecting new customers to the system. Operating expenses for the enterprise funds include the cost of sales and services, administrative expenses, and depreciation on capital assets. All revenues and expenses not meeting this definition are reported as non-operating revenues and expenses.
When both restricted and unrestricted resources are available for use, it is the City’s policy to use restricted resources first, then unrestricted resources as they are needed.
D. Budgets and Budgetary Accounting
The City follows these procedures in establishing the budgetary data reflected in the financial statements:
1. Budget requests are completed in April.
2. Proposed budgets are reviewed and prepared by the City Manager for submission to the Mayor and the City Council at the annual retreat.
3. Public hearings on the proposed budget are held in May and June.

NOTES TO FINANCIAL STATEMENTS
32
NOTE 1. SUMMARY OF SIGNIFICANT ACCOUNTING POLICIES (CONTINUED) D. Budgets and Budgetary Accounting (Continued)
4. The budget is legally adopted by the Mayor and City Council prior to August 31.
5. All budget revisions or changes must be approved as required by Georgia law and
administrative policy. Transfer of budgeted amounts in excess of $250,000 between departments requires the approval of the City Council. This is consistent with the legal level of budgetary control as the budget is adopted at the department level. Revisions that alter the total expenditures of any fund must be approved by the City Council. The City Council made several immaterial supplemental budget appropriations during the year.
6. Formal budgetary integration is employed as a management control device during the
year for all the governmental funds and the enterprise funds. Budgets for the enterprise funds are prepared for planning and control purposes only.
7. Budgets for the governmental funds and the enterprise funds are adopted on a basis
consistent with GAAP
A budget was not adopted for the Inmate Welfare Fund and 2010 General Obligation Bond Debt Service Fund due to the City’s anticipation that there would not be any revenues or expenditures relating to these funds during the fiscal year.
E. Cash and Cash Equivalents
Cash equivalents are defined as short-term, highly liquid investments that are both readily convertible to known amounts of cash and so near their maturity that they present insignificant risk of changes in value because of changes in interest rates. Generally, only investments with original maturities of three months or less meet this definition. F. Deposits and Investments For purposes of the statement of cash flows, the City considers all highly liquid investments (including restricted assets) with a maturity of three months or less when purchased to be cash equivalents. State statutes authorize the City to invest in obligations of the U.S. Government and agencies of corporations of the U.S. Government; obligations of any state; obligations of any political subdivision of any state; certificates of deposit or time deposits of any national state bank or savings and loan which have deposits insured by the FDIC or FSLIC; prime bankers’ acceptances; repurchase agreements; and the Local Government Investment Pool of the State of Georgia (“Georgia Fund 1”).

NOTES TO FINANCIAL STATEMENTS
33
NOTE 1. SUMMARY OF SIGNIFICANT ACCOUNTING POLICIES (CONTINUED) F. Deposits and Investments (Continued)
The investment in the Georgia Fund 1, created by the Official Code of Georgia Annotated (“O.C.G.A.”) §36-83-8, represents the City’s portion of a pooled investment account operated by the Office of the State Treasurer. The pool consists of U.S. treasury obligations, securities issued or guaranteed by the U.S. Government or any of its agencies or instrumentalities, banker’s acceptances, overnight and term repurchase agreements with highly rated counterparties, and collateralized bank accounts. The pool also adjusts the value of its investments to fair market value as of year-end and the City’s investment in the Georgia Fund 1 is reported at fair value. Investments are reported at fair value. Short-term investments are reported at cost, which approximates fair value. Securities traded on a national or international exchange are valued at the last reported sales price at current exchange rates. Mortgages are valued on the basis of future principal and interest payments, and are discounted at prevailing interest rates for similar instruments. The fair value of real estate investments is based on independent appraisals. Investments that do not have an established market are reported at estimated fair values.
G. Prepaid Items
Prepaid items are accounted for using the consumption method. A prepaid item is recognized when a cash expenditure/expense is made for goods or services that were purchased for consumption, but not consumed as of August 31.
H. Short-Term Interfund Receivables/Payables
During the course of operations, numerous transactions occur between individual funds for goods provided or services rendered. For the most part, the effect of interfund activity has been removed from the government-wide statement of net position. Any residual balances outstanding between the governmental and business-type activities are reported in the government-wide statement of net position as “internal balances”. In the fund level balance sheets, these receivables and payables are classified as “due from other funds” and “due to other funds”. Items that are more long-term in nature are reflected as advances. Advances between funds, as reported in the fund financial statements, are offset by a fund balance reserve account in applicable governmental funds to indicate that they are not available for appropriation and are not expendable available financial resources.

NOTES TO FINANCIAL STATEMENTS
34
NOTE 1. SUMMARY OF SIGNIFICANT ACCOUNTING POLICIES (CONTINUED) I. Grants from Other Governments
Federal and state governmental units represent an important source of supplementary funding used to finance housing, business development employment, construction programs, capital asset additions and other activities beneficial to the community. This funding, primarily in the form of grants, is recorded in both governmental and proprietary funds. Grant contributions in the proprietary funds, which are for the purpose of construction activities, or land easement or capital asset acquisitions, are recorded as capital contributions within the statement of revenues and expenses. For all funds, a grant receivable is recorded when the City has a right to receive the related grant amounts.
J. Capital Assets
Capital assets, which include property, plant, equipment, and infrastructure assets (e.g., roads, bridges, sidewalks, and similar items), are reported in the applicable governmental or business-type activities columns in the government-wide financial statements. Capital assets are defined by the City as assets with an initial, individual cost of $5,000 and an estimated useful life in excess of one year. Such assets are recorded at historical cost or estimated historical cost if purchased or constructed. Donated capital assets are recorded at acquisition value. The City has retroactively reported major general infrastructure assets. In this case, the City chose to include all items regardless of their acquisition date. The City was able to estimate the historical cost for the initial reporting of these assets through backtrending. The costs of normal maintenance and repairs that do not add to the value of the asset or materially extend useful lives are expensed as incurred.
Major outlays for capital assets and major improvements are capitalized as projects are constructed. Interest incurred during the construction period of capital assets of the business-type activities is included as part of the capitalized value of the assets constructed. The amount of interest capitalized is calculated by offsetting interest expense incurred (from the date of borrowing until the date of completion of the project) with interest earned on investment proceeds over the same period. During the fiscal year ended August 31, 2019, there was no capitalized interest.

NOTES TO FINANCIAL STATEMENTS
35
NOTE 1. SUMMARY OF SIGNIFICANT ACCOUNTING POLICIES (CONTINUED) J. Capital Assets (Continued)
Depreciation is provided on the straight-line method over the following estimated useful lives:
Buildings, grounds and improvements 15 – 40 yearsMachinery and equipment 3 – 10 yearsInfrastructure 15 – 50 yearsVehicles 5 – 10 yearsDistribution system 50 years
K. Long-Term Liabilities In the government-wide financial statements, and proprietary fund types in the fund financial statements, long-term debt and other long-term obligations are reported as liabilities in the applicable governmental activities, business-type activities, or proprietary fund type statement of net position. Bond premiums and discounts, as well as deferred charges, are deferred and amortized over the life of the bonds using the effective interest method. Bonds payable are reported net of the applicable bond premium or discount. Bond issuance costs are expensed in the period incurred. In the fund financial statements, governmental fund types report the face amount of debt issued as other financing sources.
L. Deferred Outflows/Inflows of Resources
In addition to assets, the statement of net position will sometimes report a separate section for deferred outflows of resources. This separate financial statement element, deferred outflows of resources, represents a consumption of net position that applies to a future period(s) and so will not be recognized as an outflow of resources (expense/expenditure) until then. In addition to the pension items discussed on the following page, the City has one additional item that qualifies for reporting in this category. The item is the deferred charge on refunding and is reported in the government-wide statement of net position. A deferred charge on refunding results from the difference in carrying value of refunded debt and its reacquisition price. This amount is deferred and amortized over the shorter of the life of the refunded debt or the refunding debt.

NOTES TO FINANCIAL STATEMENTS
36
NOTE 1. SUMMARY OF SIGNIFICANT ACCOUNTING POLICIES (CONTINUED) L. Deferred Outflows/Inflows of Resources (Continued)
In addition to liabilities, the statement of net position and the governmental funds balance sheet will sometimes report a separate section for deferred inflows of resources. This separate financial statement element, deferred inflows of resources, represents an acquisition of fund balance that applies to a future period(s) and so will not be recognized as an inflow of resources (revenue) until that time. The City has one type of item in addition to the pension items discussed below, which arises only under a modified accrual basis of accounting that qualifies for reporting in this category. Accordingly, the item, unavailable revenue, is reported only in the governmental funds balance sheet. The governmental funds report unavailable revenues from property taxes and intergovernmental revenues and these amounts are deferred and will be recognized as an inflow of resources in the period in which the amounts become available. The City also has deferred inflows and outflows related to the recording of changes in its net pension liability. Certain changes in the net pension liability are recognized as pension expense over time instead of all being recognized in the year of occurrence. Experience gains or losses result from periodic studies by the City’s actuary which adjust the net pension liability for actual experience for certain trend information that was previously assumed, for example the assumed dates of retirement of plan members. These experience gains or losses are recorded as deferred outflows of resources and deferred inflows of resources and are amortized into pension expense over the expected remaining service lives of plan members. Changes in actuarial assumptions which adjust the net pension liability are also recorded as deferred outflows of resources and are amortized over the expected remaining service lives of plan members. The difference between projected investment return on pension investments and actual return on those investments are recognized as deferred inflows of resources and amortized against pension expense over a five-year period. Additionally, any contributions made by the City to the pension plan before year-end but subsequent to the measurement date of the City’s net pension liability are reported as deferred outflows of resources.
M. Inventories
Inventories consist of expendable supplies and items acquired for infrastructure repair and maintenance or for possible future expansion. Inventories are stated at average cost. The consumption method is used to account for inventories.
N. Compensated Absences
It is the City’s policy to permit employees to accumulate earned, but unused vacation pay benefits. Vacation accrues in hours based on years of service. Maximum accrual is 120 hours on a calendar year basis. The government-wide and proprietary fund financial statements reflect an accrual for the full earned, but unused vacation pay.

NOTES TO FINANCIAL STATEMENTS
37
NOTE 1. SUMMARY OF SIGNIFICANT ACCOUNTING POLICIES (CONTINUED)
O. Encumbrances
Encumbrance accounting, under which purchase orders, contracts, and other commitments for the expenditure of monies are recorded in order to reserve the portion of the applicable appropriation, is employed as an extension of formal budgetary integration in the General Fund and Capital Project Funds. Encumbrances outstanding at year-end are reported as reservations of fund balances since they do not constitute expenditures or liabilities. Unencumbered appropriations lapse at the end of the year. Encumbrances are re-appropriated in the following year, except for encumbrances in the Capital Project Funds which are continuing. Encumbrances do not represent GAAP expenditures. At August 31, 2019, there were no encumbrances outstanding.
P. Fund Equity
Fund equity at the governmental fund financial reporting level is classified as “fund balance”. Fund equity for all other reporting is classified as “net position”. Fund Balance – Generally, fund balance represents the difference between the assets and liabilities under the current financial resources measurement focus of accounting. In the fund financial statements, governmental funds report fund balance classifications, that comprise a hierarchy based primarily on the extent to which the City is bound to honor constraints on the specific purposes for which amounts in those funds can be spent. Fund balances are classified as follows:
• Nonspendable – Fund balances are reported as nonspendable when amounts cannot be
spent because they are either”: a) not in spendable form (i.e., items that are not expected to be converted to cash), or b) legally or contractually required to be maintained intact.
• Restricted – Fund balances are reported as restricted when there are limitations imposed on
their use either through the enabling legislation adopted by the City or through external restrictions imposed by creditors, grantors or laws or regulations of other governments.
• Committed – Fund balances are reported as committed when they can be used only for
specific purposes pursuant to constraints imposed by formal action of the City Council through the adoption of a resolution. Only the City Council may modify or rescind the commitment.
• Assigned – Fund balances are reported as assigned when amounts are constrained by the
City’s intent to be used for specific purposes, but are neither restricted nor committed. Through resolution, the City Council has authorized the City Manager or Finance Director to assign fund balances.

NOTES TO FINANCIAL STATEMENTS
38
NOTE 1. SUMMARY OF SIGNIFICANT ACCOUNTING POLICIES (CONTINUED)
P. Fund Equity (Continued) Fund Balance (Continued)
• Unassigned – Fund balances are reported as unassigned as the residual amount when the
balances do not meet any of the above criterion. The City reports positive unassigned fund balance only in the General Fund. Negative unassigned fund balances may be reported in all funds.
Flow Assumptions – When both restricted and unrestricted amounts of fund balance are available for use for expenditures incurred, it is the City’s policy to use restricted amounts first and then unrestricted amounts as they are needed. For unrestricted amounts of fund balance, it is the City’s policy to use fund balance in the following order: 1) committed, 2) assigned, and 3) unassigned.
Net Position – Net position represents the difference between assets and liabilities in reporting which utilizes the economic resources measurement focus. Net investment in capital assets consists of capital assets, net of accumulated depreciation, reduced by the outstanding balances of any borrowing used (i.e., the amount that the City has spent) for the acquisition, construction or improvement of those assets. Net position is reported as restricted using the same definition as used for restricted fund balance as described in the section above. All other net position is reported as unrestricted. The City applies restricted resources first when an expense is incurred for purposes for which both restricted and unrestricted net position is available.
Q. Use of Estimates
The preparation of financial statements in conformity with GAAP requires management to make estimates and assumptions that affect the reported amounts of assets and liabilities, the disclosure of contingent assets and liabilities at the date of the financial statements and the reported amounts of revenues and expenses during the reporting period. Actual results could differ from those estimates. R. Tax Abatement Programs
Fulton County, Georgia enters into tax abatement programs with local businesses for the purpose of attracting and retaining business within their jurisdictions. The tax abatements can be granted to any business located within the County. These tax abatement programs are issued on a case by case basis for individual businesses. During the year ended August 31, 2019, the City’s ad valorem tax revenues were reduced by $932,970 under other government agreements entered into by Fulton County, Georgia.

NOTES TO FINANCIAL STATEMENTS
39
NOTE 2. RECONCILIATION OF GOVERNMENT-WIDE FINANCIAL STATEMENTS AND FUND FINANCIAL STATEMENTS
A. Explanation of certain differences between the governmental fund balance sheet and the government-wide statement of net position
The governmental fund balance sheet includes a reconciliation between fund balance – total governmental funds and net position – governmental activities as reported in the government-wide statement of net position. One element of that reconciliation explains that “certain liabilities are not due and payable in the current period and, therefore, are not reported in the funds.” The details of this difference are as follows:
Bonds payable $ (11,270,000) Plus: Premium on bond issuance (to be amortized over the life of the debt) (892,860) Capital leases (658,941) Claims payable (427,939) Compensated absences (451,332) Accrued interest (197,198) Net adjustment to reduce fund balance - total governmental funds
to arrive at net position - governmental activities $ (13,898,270)
Another element of that reconciliation explains that “the net pension liability and related deferred outflows and inflows of resources are not financial resources and, therefore, are not reported in the governmental funds”. The details of this difference are as follows:
Pension - deferred outflows of resources $ 2,392,996 Pension - deferred inflows of resources (1,251,963) Net pension liability (6,253,311) Net adjustment to reduce fund balance - total governmental funds
to arrive at net position - governmental activities $ (5,112,278)

NOTES TO FINANCIAL STATEMENTS
40
NOTE 2. RECONCILIATION OF GOVERNMENT-WIDE FINANCIAL STATEMENTS AND FUND FINANCIAL STATEMENTS (CONTINUED)
B. Explanation of certain differences between the governmental fund statement of revenues, expenditures and changes in fund balances and the government-wide statement of activities
The governmental fund statement of revenues, expenditures and changes in fund balances includes a reconciliation between net changes in fund balances – total governmental funds and changes in net position of governmental activities as reported in the government-wide statement of activities. One element of that reconciliation explains that “Governmental funds report capital outlays as expenditures. However, in the statement of activities the cost of those assets is allocated over their useful lives and reported as depreciation expense.” The details of this difference are as follows:
Capital outlay $ 6,706,131 Depreciation expense (1,183,519) Net adjustment to increase net changes in fund balances - total
governmental funds to arrive at changes in net position ofgovernmental activities $ 5,522,612
Another element of that reconciliation explains that “some expenses reported in the statement of activities do not require the use of current financial resources and, therefore, are not reported as expenditures in governmental funds.” The details of this difference are as follows:
Change in accrued interest $ 11,973 Change in compensated absences (106,598) Change in net pension liability (65,230) Amortization expense 53,857 Net adjustment to reduce net changes in fund balances - total
governmental funds to arrive at changes in net position ofgovernmental activities $ (255,998)

NOTES TO FINANCIAL STATEMENTS
41
NOTE 2. RECONCILIATION OF GOVERNMENT-WIDE FINANCIAL STATEMENTS AND FUND FINANCIAL STATEMENTS (CONTINUED)
B. Explanation of certain differences between the governmental fund statement of revenues, expenditures and changes in fund balances and the government-wide statement of activities (Continued)
Another element of that reconciliation states that “the issuance of long-term debt (e.g., bonds, leases) provides current financial resources to governmental funds, while the repay of the principal of long-term debt consumes the current financial resources of governmental funds. Neither transaction, however, has any effect on net position.” The details of this difference are as follows:
Capital lease proceeds $ (822,401) Principal payments
Capital leases 588,753 Bonds payable 825,000
Net adjustment to increase net changes in fund balances - totalgovernmental funds to arrive at changes in net position ofgovernmental activities $ 591,352
NOTE 3. DEPOSITS AND INVESTMENTS
Total deposits and investments as of August 31, 2019, are summarized as follows:
As reported in the Statement of Net Position Primary government
$ 42,738,300 429,864
Restricted Assets:1,697,746
Investments 115,858 Agency fund - Municipal Court 37,258
Component unit - cash and cash equivalents 32,344 $ 45,051,370
Cash deposited with financial institutions $ 44,505,648 Cash deposited with Georgia Fund 1 115,858
429,864 $ 45,051,370
Cash and cash equivalentsInvestments
Cash and cash equivalents
Investment in U.S. government securities
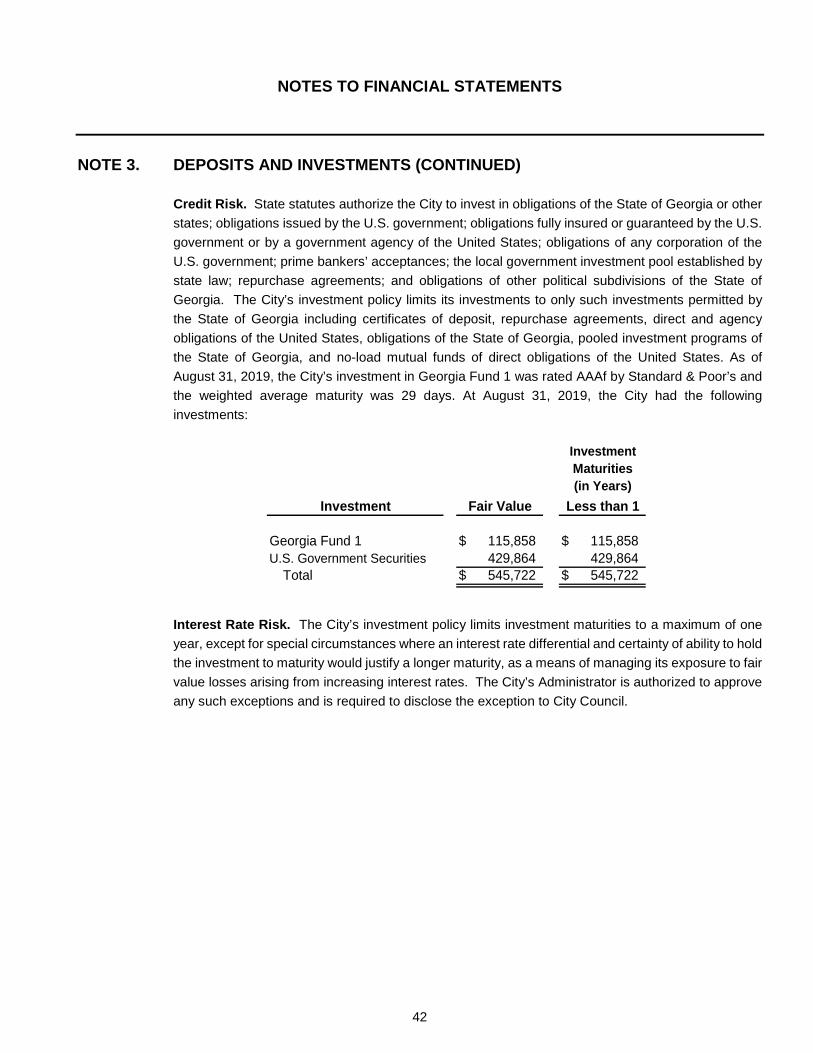
NOTES TO FINANCIAL STATEMENTS
42
NOTE 3. DEPOSITS AND INVESTMENTS (CONTINUED)
Credit Risk. State statutes authorize the City to invest in obligations of the State of Georgia or other states; obligations issued by the U.S. government; obligations fully insured or guaranteed by the U.S. government or by a government agency of the United States; obligations of any corporation of the U.S. government; prime bankers’ acceptances; the local government investment pool established by state law; repurchase agreements; and obligations of other political subdivisions of the State of Georgia. The City’s investment policy limits its investments to only such investments permitted by the State of Georgia including certificates of deposit, repurchase agreements, direct and agency obligations of the United States, obligations of the State of Georgia, pooled investment programs of the State of Georgia, and no-load mutual funds of direct obligations of the United States. As of August 31, 2019, the City’s investment in Georgia Fund 1 was rated AAAf by Standard & Poor’s and the weighted average maturity was 29 days. At August 31, 2019, the City had the following investments:
Investment
Georgia Fund 1 $ 115,858 $ 115,858 U.S. Government Securities 429,864 429,864
Total $ 545,722 $ 545,722
(in Years)Fair Value Less than 1
MaturitiesInvestment
Interest Rate Risk. The City’s investment policy limits investment maturities to a maximum of one year, except for special circumstances where an interest rate differential and certainty of ability to hold the investment to maturity would justify a longer maturity, as a means of managing its exposure to fair value losses arising from increasing interest rates. The City’s Administrator is authorized to approve any such exceptions and is required to disclose the exception to City Council.
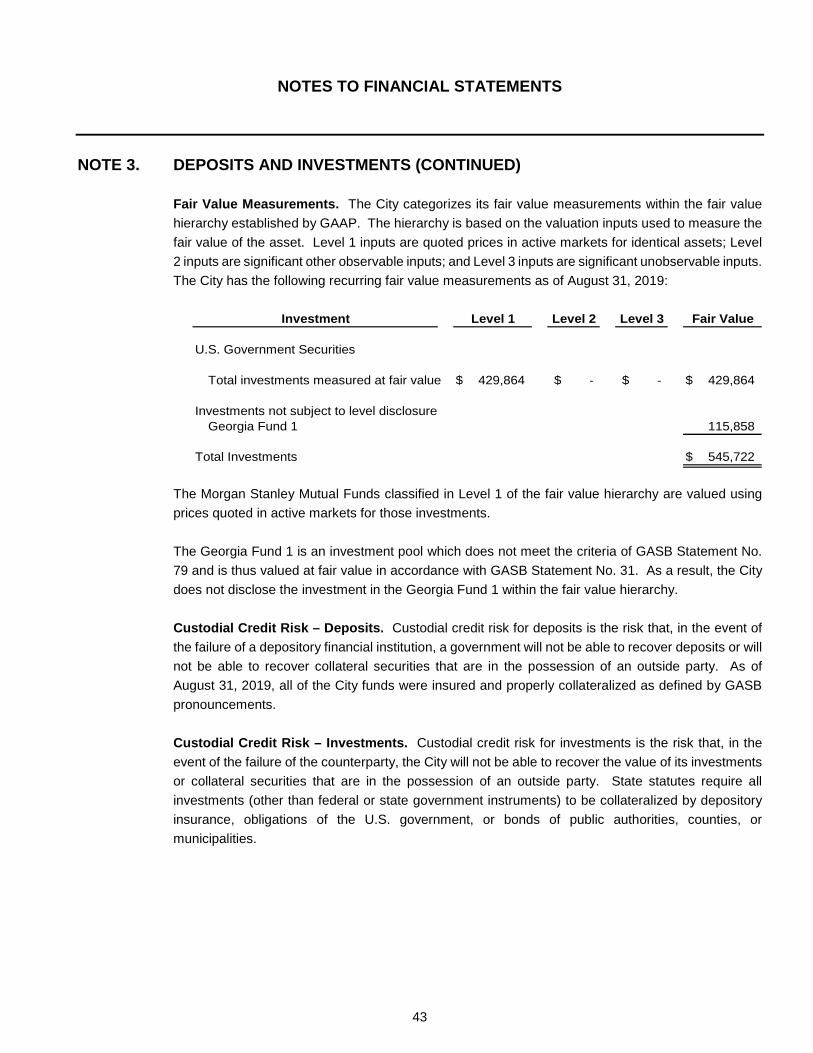
NOTES TO FINANCIAL STATEMENTS
43
NOTE 3. DEPOSITS AND INVESTMENTS (CONTINUED)
Fair Value Measurements. The City categorizes its fair value measurements within the fair value hierarchy established by GAAP. The hierarchy is based on the valuation inputs used to measure the fair value of the asset. Level 1 inputs are quoted prices in active markets for identical assets; Level 2 inputs are significant other observable inputs; and Level 3 inputs are significant unobservable inputs. The City has the following recurring fair value measurements as of August 31, 2019:
Investment
U.S. Government Securities
Total investments measured at fair value $ 429,864 $ - $ - $ 429,864
Investments not subject to level disclosureGeorgia Fund 1 115,858
Total Investments $ 545,722
Level 3 Fair ValueLevel 1 Level 2
The Morgan Stanley Mutual Funds classified in Level 1 of the fair value hierarchy are valued using prices quoted in active markets for those investments. The Georgia Fund 1 is an investment pool which does not meet the criteria of GASB Statement No. 79 and is thus valued at fair value in accordance with GASB Statement No. 31. As a result, the City does not disclose the investment in the Georgia Fund 1 within the fair value hierarchy. Custodial Credit Risk – Deposits. Custodial credit risk for deposits is the risk that, in the event of the failure of a depository financial institution, a government will not be able to recover deposits or will not be able to recover collateral securities that are in the possession of an outside party. As of August 31, 2019, all of the City funds were insured and properly collateralized as defined by GASB pronouncements. Custodial Credit Risk – Investments. Custodial credit risk for investments is the risk that, in the event of the failure of the counterparty, the City will not be able to recover the value of its investments or collateral securities that are in the possession of an outside party. State statutes require all investments (other than federal or state government instruments) to be collateralized by depository insurance, obligations of the U.S. government, or bonds of public authorities, counties, or municipalities.
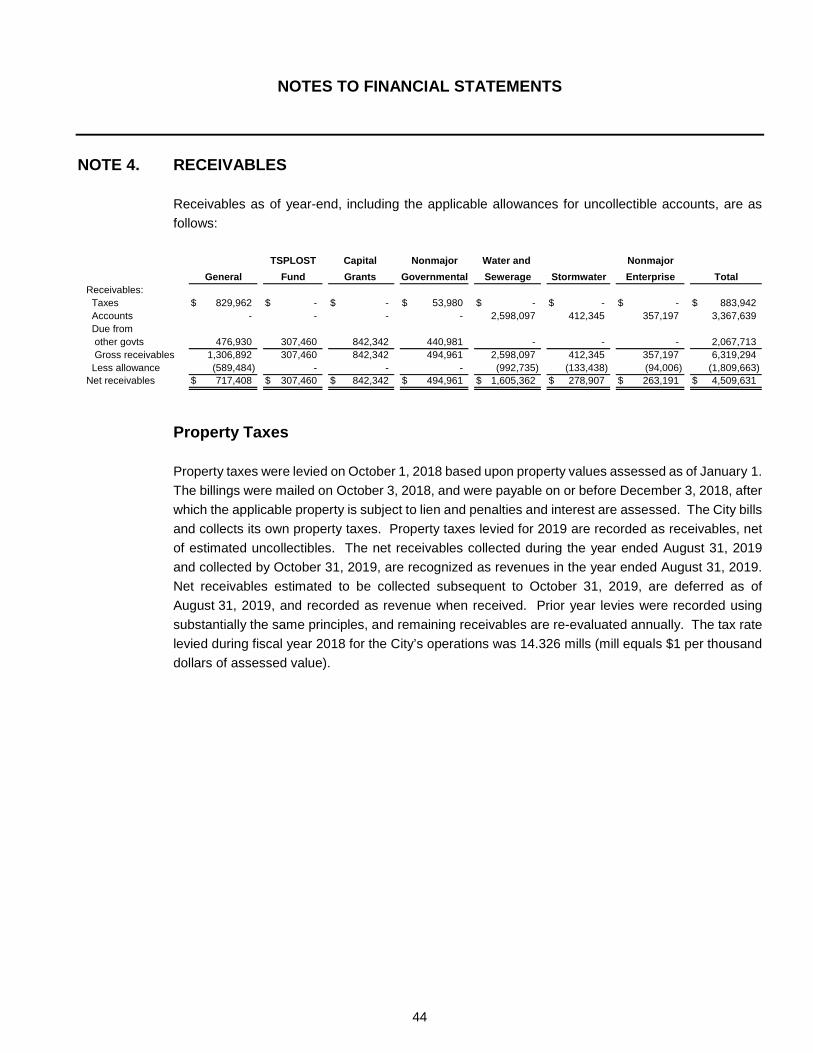
NOTES TO FINANCIAL STATEMENTS
44
NOTE 4. RECEIVABLES
Receivables as of year-end, including the applicable allowances for uncollectible accounts, are as follows:
Receivables: Taxes $ 829,962 $ - $ - $ 53,980 $ - $ - $ - $ 883,942 Accounts - - - - 2,598,097 412,345 357,197 3,367,639 Due from other govts 476,930 307,460 842,342 440,981 - - - 2,067,713 Gross receivables 1,306,892 307,460 842,342 494,961 2,598,097 412,345 357,197 6,319,294 Less allowance (589,484) - - - (992,735) (133,438) (94,006) (1,809,663) Net receivables $ 717,408 $ 307,460 $ 842,342 $ 494,961 $ 1,605,362 $ 278,907 $ 263,191 $ 4,509,631
SewerageWater and
Stormwater TotalNonmajorEnterpriseGeneral
Capital Grants Governmental
NonmajorFund
TSPLOST
Property Taxes Property taxes were levied on October 1, 2018 based upon property values assessed as of January 1. The billings were mailed on October 3, 2018, and were payable on or before December 3, 2018, after which the applicable property is subject to lien and penalties and interest are assessed. The City bills and collects its own property taxes. Property taxes levied for 2019 are recorded as receivables, net of estimated uncollectibles. The net receivables collected during the year ended August 31, 2019 and collected by October 31, 2019, are recognized as revenues in the year ended August 31, 2019. Net receivables estimated to be collected subsequent to October 31, 2019, are deferred as of August 31, 2019, and recorded as revenue when received. Prior year levies were recorded using substantially the same principles, and remaining receivables are re-evaluated annually. The tax rate levied during fiscal year 2018 for the City’s operations was 14.326 mills (mill equals $1 per thousand dollars of assessed value).

NOTES TO FINANCIAL STATEMENTS
45
NOTE 4. RECEIVABLES (CONTINUED)
Component Unit – Intergovernmental Receivable In October 2018, in conjunction with the issuance of the Series 2018 Bond, the Authority entered into an intergovernmental contract with Fulton County in which Fulton County unconditionally agreed to make debt payments on behalf of the Authority in an amount equal to the debt service requirements of the Series 2018 Bond. These payments and the intergovernmental contract are pledged to the payment of the principal and interest on the Series 2018 Bond.
The estimated annual payments to be paid by Fulton County on behalf of the Authority under this intergovernmental contract as of August 31, 2019 are as follows: Fiscal Year Ending August 31,
2020 $ 420,000 $ 377,721 $ 797,721 2021 720,000 360,146 1,080,146 2022 745,000 338,244 1,083,244 2023 765,000 315,669 1,080,669 2024 790,000 292,422 1,082,422 2025 – 2029 4,335,000 1,086,641 5,421,641 2030 – 2034 5,050,000 387,105 5,437,105
$ 12,825,000 $ 3,157,948 $ 15,982,948
Principal Interest Total

NOTES TO FINANCIAL STATEMENTS
46
NOTE 5. CAPITAL ASSETS
A. Primary Government
Capital asset activity for the year ended August 31, 2019, was as follows:
Beginning EndingBalance Increases Decreases Transfers Balance
Governmental activitiesCapital assets, not being depreciated:Land $ 691,851 $ - $ - $ - $ 691,851 Construction in progress 3,593,425 6,128,243 - (6,590,707) 3,130,961
Total capital assets, not being depreciated 4,285,276 6,128,243 - (6,590,707) 3,822,812
Capital assets, being depreciated:Buildings, grounds and improvements 11,331,300 30,300 - 6,321,030 17,682,630 Machinery and equipment 1,195,765 70,329 - - 1,266,094 Infrastructure 15,342,482 - - 269,677 15,612,159 Vehicles 5,274,529 477,259 (20,701) - 5,731,087
Total capital assets, being depreciated 33,144,076 577,888 (20,701) 6,590,707 40,291,970
Less accumulated depreciation for:Buildings, grounds and improvements (5,709,849) (355,538) - - (6,065,387) Machinery and equipment (984,317) (33,166) - - (1,017,483) Infrastructure (8,327,782) (403,361) - - (8,731,143) Vehicles (3,759,808) (391,454) 16,043 - (4,135,219) Total accumulated depreciation (18,781,756) (1,183,519) 16,043 - (19,949,232)
Total capital assets, being depreciated, net 14,362,320 (605,631) (4,658) 6,590,707 20,342,738
Governmental activities capital assets, net $ 18,647,596 $ 5,522,612 $ (4,658) $ - $ 24,165,550

NOTES TO FINANCIAL STATEMENTS
47
NOTE 5. CAPITAL ASSETS (CONTINUED)
A. Primary Government (Continued)
Beginning EndingBalance Increases Decreases Transfers Balance
Business-type activitiesCapital assets, not being depreciated:Land $ 493,194 $ - $ - $ - $ 493,194 Construction in progress - 108,686 - - 108,686
Total capital assets, not being depreciated 493,194 108,686 - - 601,880
Capital assets, being depreciated:Distribution system 18,757,841 - - - 18,757,841 Machinery and equipment 388,483 85,449 (45,559) - 428,373 Infrastructure 969,187 - - - 969,187 Wastewater treatment capacity 6,374,612 - - - 6,374,612 Vehicles 255,880 - - - 255,880
Total capital assets, being depreciated 26,746,003 85,449 (45,559) - 26,785,893
Less accumulated depreciation for:Distribution system (10,039,684) (384,356) - - (10,424,040) Machinery and equipment (215,262) (33,952) - - (249,214) Infrastructure (276,778) (39,479) - - (316,257) Wastewater treatment capacity (2,160,287) (424,975) 20,769 - (2,564,493) Vehicles (205,338) (12,830) - - (218,168) Total accumulated depreciation (12,897,349) (895,592) 20,769 - (13,772,172)
Total capital assets, being depreciated, net 13,848,654 (810,143) (24,790) - 13,013,721
Business-type activities capital assets, net $ 14,341,848 $ (701,457) $ (24,790) $ - $ 13,615,601

NOTES TO FINANCIAL STATEMENTS
48
NOTE 5. CAPITAL ASSETS (CONTINUED)
A. Primary Government (Continued) Depreciation expense was charged to functions/programs of the primary government as follows:
Governmental activities: General government $ 80,511 Judicial 85,152 Public safety 411,875 Public works 442,493 Parks and recreation 163,488 Total depreciation expense - governmental activities $ 1,183,519
Business-type activities: Water and sewerage $ 813,119 Stormwater 82,473 Total depreciation expense - business-type activities $ 895,592
B. Discretely Presented Component Unit – South Fulton Municipal Regional Jail Authority
Beginning EndingBalance Increases Decreases Transfers Balance
Capital assets, not being depreciated:Land $ 286,986 $ - $ (286,986) $ - $ -
Total capital assets, not being depreciated 286,986 - (286,986) - -
Capital assets, being depreciated:Buildings, grounds and improvements 11,282,640 - (11,282,640) - - Furniture 286,079 - (286,079) - - Machinery and equipment 126,902 - (126,902) - - Infrastructure 11,733 - (11,733) - -
Total capital assets, being depreciated 11,707,354 - (11,707,354) - -
Less accumulated depreciation for:Buildings, grounds and improvements (4,366,805) (37,120) 4,403,925 - - Furniture (258,918) (2,384) 261,302 - - Machinery and equipment (122,346) (759) 123,105 - - Infrastructure (11,728) - 11,728 - - Total accumulated depreciation (4,759,797) (40,263) 4,800,060 - -
Total capital assets, being depreciated, net 6,947,557 (40,263) (6,907,294) - -
Capital assets, net $ 7,234,543 $ (40,263) $ (7,194,280) $ - $ -

NOTES TO FINANCIAL STATEMENTS
49
NOTE 5. CAPITAL ASSETS (CONTINUED)
B. Discretely Presented Component Unit – South Fulton Municipal Regional Jail Authority (Continued)
In October 2018, in conjunction with the issuance of the Series 2018 Bond and the intergovernmental receivable with Fulton County, the Authority sold the Jail to Fulton County.
NOTE 6. GENERAL LONG-TERM DEBT
A. General Obligation Bonds
General obligation bonds outstanding at August 31, 2019, are as follows:
2014 General Obligation Bonds $ 7,095,000 2.00% – 4.00% $ 6,345,000 2017 General Obligation Bonds 5,000,000 2.00% – 5.00% 4,925,000
$ 12,095,000 $ 11,270,000
RatesInterestOriginal
Amount
BalanceAugust 31,
2019
Annual debt service requirements to maturity for general obligation bonds are as follows:
Fiscal Year Ending August 31,
2020 $ 855,000 $ 451,375 $ 1,306,375 2021 895,000 424,125 1,319,125 2022 950,000 395,675 1,345,675 2023 990,000 363,225 1,353,225 2024 1,045,000 337,225 1,382,225 2025 – 2029 2,625,000 1,105,050 3,730,050 2030 – 2034 780,000 940,750 1,720,750 2035 – 2047 3,130,000 1,289,750 4,419,750
$ 11,270,000 $ 5,307,175 $ 16,577,175
Principal Interest Total
B. Revenue Bonds The City also issues revenue bonds where the City pledges income derived from the acquired or constructed assets to pay debt service. Revenue bonds have been issued for business-like activities and are reported in the business-type column of the government-wide statements. Principal and interest are payable from enterprise fund revenue (the City's Water and Sewerage Fund).

NOTES TO FINANCIAL STATEMENTS
50
NOTE 6. GENERAL LONG-TERM DEBT (CONTINUED) B. Revenue Bonds (Continued) The City's 2012 Water and Sewerage Revenue Bonds were issued in April 2012 for the purpose of: a) making certain additions, extensions and improvements to the City's water system; b) funding a debt service reserve for the bonds; and c) paying the cost of issuing the bonds. The bonds are special limited obligations of the City secured by and payable solely from a first lien on and pledge of revenues derived by the City from the ownership and operation of the City's water system. These bonds are due on July 1, 2032. Revenue bonds outstanding at August 31, 2019, are as follows:
2012 Water and Sewerage Revenue Bonds $ 11,275,000 2.0 - 4.0% $ 8,045,000
OriginalAmount Rate
InterestBalance
August 31,2019
Annual debt service requirements to maturity for revenue bonds are as follows:
Fiscal Year Ending August 31, Principal
2020 $ 505,000 $ 284,025 $ 789,025 2021 525,000 268,875 793,875 2022 540,000 253,125 793,125 2023 555,000 236,925 791,925 2024 570,000 220,275 790,275 2025 – 2029 3,155,000 799,525 3,954,525 2030 – 2032 2,195,000 177,800 2,372,800
$ 8,045,000 $ 2,240,550 $ 10,285,550
Interest Total
C. Capital Leases
During 2017, the City entered into another capital lease agreement with a local financial institution to finance the purchase of police and staff vehicles and a fire truck. Quarterly lease payments are due including interest at 1.93% in the amount of $94,567 through March 3, 2020. During 2019, the City entered into another capital lease agreement with a local financial institution to finance the purchase of equipment and vehicles. Quarterly lease payments are due including interest at 3.15% in the amount of $64,735 through January 2021.

NOTES TO FINANCIAL STATEMENTS
51
NOTE 6. GENERAL LONG-TERM DEBT (CONTINUED)
C. Capital Leases (Continued) As of August 31, 2019, the City reflects a total cost of leased assets of $854,000 and accumulated depreciation of $597,799. Total accumulated depreciation of leased assets under capital lease includes current year depreciation expense of $56,933.
The future minimum lease obligations and the net present value of these minimum lease payments as of August 31, 2019, were as follows:
Fiscal Year Ending August 31,
2020 $ 543,917 2021 129,470 Total minimum lease payments 673,387 Less: amount representing interest (14,446) Present value of minimum lease payments $ 658,941
GovernmentalActivities
D. Changes in Long-Term Liabilities – Primary Government Long-term liability activity for the year ended August 31, 2019, was as follows:
Beginning Ending Due WithinBalance Additions Reductions Balance One Year
Governmental activities:General obligation bonds $ 12,095,000 $ - $ (825,000) $ 11,270,000 $ 855,000 Plus: Premium 990,258 - (97,398) 892,860 - Total bonds payable 13,085,258 - (922,398) 12,162,860 855,000 Capital lease 425,293 822,401 (588,753) 658,941 530,954 Net pension liability 5,366,517 3,399,840 (2,513,046) 6,253,311 - Claims payable 277,939 150,000 - 427,939 427,939 Compensated absences 344,734 611,144 (504,546) 451,332 451,332 Governmental activity Long-term liabilities $ 19,499,741 $ 4,983,385 $ (4,528,743) $ 19,954,383 $ 2,265,225
Business-type activities:Revenue bonds $ 8,540,000 $ - $ (495,000) $ 8,045,000 $ 505,000 Less: Discount (88,173) - 10,497 (77,676) - Total bonds payable 8,451,827 - (484,503) 7,967,324 505,000 Net pension liability 366,329 211,910 (160,407) 417,832 - Compensated absences 24,449 19,660 (19,392) 24,717 24,717 Business-type activity Long-term liabilities $ 8,842,605 $ 231,570 $ (664,302) $ 8,409,873 $ 529,717

NOTES TO FINANCIAL STATEMENTS
52
NOTE 6. GENERAL LONG-TERM DEBT (CONTINUED)
D. Changes in Long-Term Liabilities – Primary Government (Continued) For governmental activities, compensated absences, claims payable, and the net pension liability are generally liquidated by the General Fund. For both governmental activities and business-type activities, compensated absences are all reported as current due to historical trends of City employee use of leave annually. E. Component Unit In October 2018, the Authority issued Taxable Refunding Revenue Bonds, Series 2018 for the purposes of: 1) refunding the Authority’s previously issued Taxable Refunding Revenue Bonds, Series 2012, 2) paying the costs of issuing the 2018 Series Bonds, and 3) to assist in the sale of the jail to Fulton County, Georgia. The issue price of the 2018 Series Bond was less than the reacquisition price of the refunded Series 2012 Bond resulting in a deferred loss on refunding of $928,472. This deferred loss will be amortized over the remaining life of the refunded bonds using the effective interest method. The difference in the present value of the old debt requirements and the present value of the new debt requirements, discounted at the effective interest rate resulted in an economic loss of $250,000. The Authority’s revenue bonds outstanding at August 31, 2019, are as follows:
2018 South Fulton Municipal Jail Authority Refunding Revenue Bonds $ 12,825,000 3.65% $ 12,825,000
Amount RateInterest
BalanceAugust 31,
2019Original
Annual debt service requirements to maturity for the Authority’s bonds are as listed below. The following maturity schedule was based on the rate as of year-end.
Fiscal Year Ending August 31,
2020 $ 420,000 $ 377,721 $ 797,721 2021 720,000 360,146 1,080,146 2022 745,000 338,244 1,083,244 2023 765,000 315,669 1,080,669 2024 790,000 292,422 1,082,422 2025 – 2029 4,335,000 1,086,641 5,421,641 2030 – 2034 5,050,000 387,105 5,437,105
$ 12,825,000 $ 3,157,948 $ 15,982,948
Principal Interest Total

NOTES TO FINANCIAL STATEMENTS
53
NOTE 6. GENERAL LONG-TERM DEBT (CONTINUED) E. Component Unit (Continued) Long-term liability activity for the Authority for the year ended August 31, 2019, was as follows:
Beginning Ending Due WithinBalance Additions Reductions Balance One Year
Revenue bonds $ 11,840,000 $ 12,825,000 $ (11,840,000) $ 12,825,000 $ 420,000
NOTE 7. DEFINED BENEFIT PENSION PLAN
Plan Description The City of Union City, Georgia, has established a non-contributory defined benefit pension plan , the City of Union City Retirement Plan(the “Plan”), covering substantially all of the City’s employees. The City’s pension plan is administered through the Georgia Municipal Employee Benefit System (“GMEBS”), an agent multiple-employer pension plan administered by the Georgia Municipal Association. The Plan provides retirement and disability benefits, annual cost of living adjustments, and death benefits to plan members and beneficiaries. Benefits are provided by the Plan whereby retirees receive 2% multiplied by the average of the three highest years of regular earnings multiplied by the total credited years of service. The City Council, in its role as the Plan sponsor, has the governing authority to establish and amend from time to time, the benefits provided and the contribution rates of the City and its employees. The Georgia Municipal Association issues a publicly available financial report that includes financial statements and required supplementary information for GMEBS. That report may be obtained at www.gmanet.com or by writing to the Georgia Municipal Association, Risk Management and Employee Benefit Services, 201 Pryor Street, NW, Atlanta, Georgia 30303 or by calling (404) 688-0472. Plan Membership. As of January 1, 2019, pension plan membership consisted of the following:
Retirees and beneficiaries currently receiving benefits 78
Terminated employees entitled to benefits but not yet receiving them 117
Active plan members 158
Total membership in plan 353

NOTES TO FINANCIAL STATEMENTS
54
NOTE 7. DEFINED BENEFIT PENSION PLAN
Plan Description (Continued) Contributions. The Plan is subject to minimum funding standards of the Georgia Public Retirement Systems Standards law. The Board of Trustees of GMEBS has adopted a recommended actuarial funding policy for the Plan which meets state minimum requirements and will accumulate sufficient funds to provide the benefits under the Plan. The funding policy for the Plan, as adopted by the City Council, is to contribute an amount equal to or greater than the actuarially recommended contribution rate. This rate is based on the estimated amount necessary to finance the costs of benefits earned by plan members during the year, with an additional amount to finance any unfunded accrued liability. Employees make no contributions to the Plan. The City is required to contribute at an actuarially determined rate. For the year ended August 31, 2019, the City's contribution rate was 11.61% of annual payroll. City contributions to the Plan were $1,034,872 for the year ended August 31, 2019.
Net Pension Liability of the City The City’s net pension liability was measured as of September 30, 2018. The total pension liability used to calculate the net pension liability was determined by an actuarial valuation as of January 1, 2019 with update procedures performed by the actuary to roll forward to the total pension liability measured as of September 30, 2018.
Actuarial assumptions. The total pension liability in the January 1, 2019 actuarial valuation was determined using the following actuarial assumptions, applied to all periods included in the measurement:
Inflation 2.75% Projected salary increases 2.75% plus service based merit increases Net Investment rate of return 7.50%
Mortality rates were based on the RP-2000 Combined Healthy Mortality Table with gender-distinct rates, set forward two years for males and one year for females. The actuarial assumptions used in the January 1, 2017 valuation were based on the results of an actuarial experience study for the period January 1, 2010 – June 30, 2014. The cost of living adjustment is assumed to be 2.75%.

NOTES TO FINANCIAL STATEMENTS
55
NOTE 7. DEFINED BENEFIT PENSION PLAN (CONTINUED)
Net Pension Liability of the City (Continued) The long-term expected rate of return on pension plan investments was determined using a building-block method in which best-estimate ranges of expected future real rates of return (expected returns, net of pension plan investment expense and inflation) are developed for each major asset class. These ranges are combined to produce the long-term expected rate of return by weighting the expected future real rates of return by the target asset allocation percentage and by adding expected inflation. Best estimates of arithmetic real rates of return for each major asset class included in the pension plan's target asset allocation as of September 30, 2018, are summarized in the following table:
Long-term Target expected real
Asset class allocation rate of return*Domestic equity 45% 6.40%International equity 20% 7.40%Real estate 10% 5.10%Global fixed income 5% 3.03%Domestic fixed income 20% 1.75%Cash 0%
Total 100%
*Rates shown are net of the 2.75% assumed rate of inflation
Discount Rate. The discount rate used to measure the total pension liability was 7.50%. The projection of cash flows used to determine the discount rate assumed that City contributions will be made at rates equal to the actuarially determined contribution rates and the member rate. Based on those assumptions, the pension plan's fiduciary net position was projected to be available to make all projected future benefit payments of current plan members. Therefore, the long-term expected rate of return on pension plan investments was applied to all of the projected benefit payments to determine the total pension liability.

NOTES TO FINANCIAL STATEMENTS
56
NOTE 7. DEFINED BENEFIT PENSION PLAN (CONTINUED)
Net Pension Liability of the City (Continued) Changes in the Net Pension Liability of the City. The changes in the components of the net pension liability of the City for the year ended August 31, 2019, were as follows:
Total Pension Plan Fiduciary Net Pension Liability Net Position Liability
(a) (b) (a) - (b)Balances at August 31, 2018 $ 23,629,251 $ 17,896,405 $ 5,732,846 Changes for the year: Service cost 380,915 - 380,915 Interest cost 1,760,138 - 1,760,138 Differences between expected and actual experience 1,426,594 - 1,426,594 Contributions - employer - 900,433 (900,433) Net investment income - 1,773,020 (1,773,020) Benefit payments, including refunds of employee contributions (1,083,330) (1,083,330) - Administrative expense - (44,103) 44,103 Other - - - Net changes 2,484,317 1,546,020 938,297 Balances at August 31, 2019 $ 26,113,568 $ 19,442,425 $ 6,671,143
The required schedule of changes in the City’s net pension liability and related ratios immediately following the notes to the financial statements presents multi-year trend information about whether the value of plan assets is increasing or decreasing over time relative to the total pension liability. Sensitivity of the Net Pension Liability to Changes in the Discount Rate. The following presents the net pension liability of the City, calculated using the discount rate of 7.50%, as well as what the City’s net pension liability would be if it were calculated using a discount rate that is 1-percentage-point lower (6.50%) or 1-percentage-point higher (8.50%) than the current rate:
Current 1% Decrease Discount Rate 1% Increase
(6.50%) (7.50%) (8.50%)City of Union City's net pension liability 10,236,574$ 6,671,143$ 3,709,700$
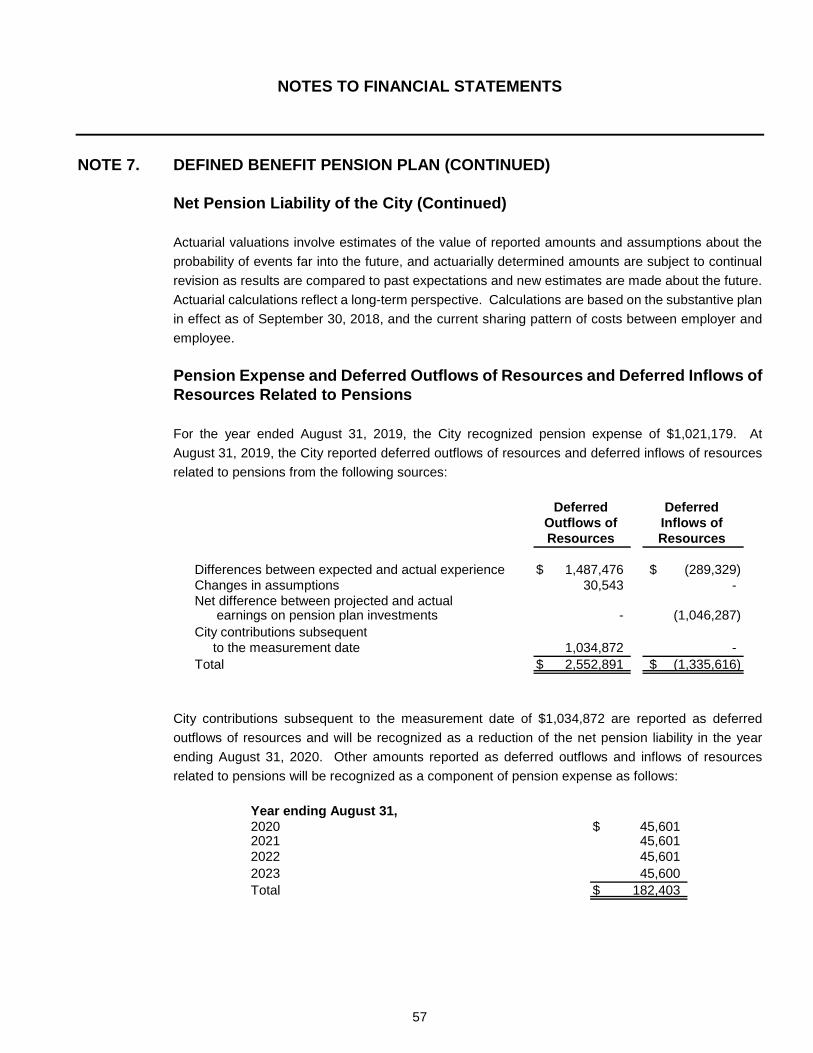
NOTES TO FINANCIAL STATEMENTS
57
NOTE 7. DEFINED BENEFIT PENSION PLAN (CONTINUED)
Net Pension Liability of the City (Continued) Actuarial valuations involve estimates of the value of reported amounts and assumptions about the probability of events far into the future, and actuarially determined amounts are subject to continual revision as results are compared to past expectations and new estimates are made about the future. Actuarial calculations reflect a long-term perspective. Calculations are based on the substantive plan in effect as of September 30, 2018, and the current sharing pattern of costs between employer and employee. Pension Expense and Deferred Outflows of Resources and Deferred Inflows of Resources Related to Pensions For the year ended August 31, 2019, the City recognized pension expense of $1,021,179. At August 31, 2019, the City reported deferred outflows of resources and deferred inflows of resources related to pensions from the following sources:
Differences between expected and actual experience $ 1,487,476 $ (289,329) Changes in assumptions 30,543 - Net difference between projected and actual earnings on pension plan investments - (1,046,287) City contributions subsequent to the measurement date 1,034,872 - Total $ 2,552,891 $ (1,335,616)
Resources Outflows of
Deferred Deferred Inflows of Resources
City contributions subsequent to the measurement date of $1,034,872 are reported as deferred outflows of resources and will be recognized as a reduction of the net pension liability in the year ending August 31, 2020. Other amounts reported as deferred outflows and inflows of resources related to pensions will be recognized as a component of pension expense as follows:
Year ending August 31,2020 $ 45,601 2021 45,601 2022 45,601 2023 45,600 Total $ 182,403

NOTES TO FINANCIAL STATEMENTS
58
NOTE 8. DEFINED CONTRIBUTION PLAN
The City offers its employees a defined contribution plan administered by Citistreet Associates created in accordance with Internal Revenue Code Section 457. The Plan, available to all City employees, permits them to defer a portion of their salary until future years. Participation in the Plan is optional and requires the City to contribute an amount equal to 100% up to the first 2% an employee defers, 75% of the next 2%, and 50% of the next 6% deferred. Employers’ contributions are fully vested after the participant completes three full years of service. The deferred compensation is not available to employees until termination, retirement, death, or unforeseeable emergency. Pursuant to GASB Statement Number 32 of the Accounting and Financial Reporting for Internal Revenue Code Section 457 Deferred Compensation Plans, the City does not have a fiduciary relationship with the 457 plan. Accordingly, the balances and transactions of the City's 457 plan are not reported in the City's financial statements. Contributions are established and may be amended by the City Council. The City’s contribution to the Plan approximated $269,337 and the employees' contributions approximated $332,520 for the year ended August 31, 2019.
NOTE 9. DEFICIT FUND BALANCES The Capital Grants Fund and the General Obligations Bond Fund reported a deficit fund balance in the amount of $299,301 and $23,211, respectively, as of August 31, 2019. These deficits will be reduced in future years by reduced expenditures and transfers in from other funds.
NOTE 10. INTERFUND BALANCES AND TRANSFERS Interfund receivable and payable balances and advances as of August 31, 2019, are as follows:
TotalDue To
General Fund $ 368,545 $ 33,841 $ 428,922 $ 32,165 $ 863,473
Total $ 368,545 $ 33,841 $ 428,922 $ 32,165 $ 863,473
EnterpriseFund GovernmentalNonmajor NonmajorCapital Grants Obligation
General Due From
Bonds Fund
Interfund receivables and payables result from timing differences related to collection of taxes in Special Revenue Funds and payroll and other year-end transactions, which normally clear within one to two months.

NOTES TO FINANCIAL STATEMENTS
59
NOTE 10. INTERFUND BALANCES AND TRANSFERS (CONTINUED) Interfund transfers for the year ended August 31, 2019, consisted of the following:
Nonmajor General Governmental
$ - $ 666,480 $ 7,758,937 $ 8,425,417 136,260 - - 136,260
1,053,834 - - 1,053,834 357,801 - - 357,801
$ 1,547,895 $ 666,480 $ 7,758,937 $ 9,973,312
Fund
Transfer to
Transfer from TotalCapital Grants
Total
Stormwater FundGeneral Fund
Nonmajor GovernmentalNonmajor Enterprise
Transfers are used to: 1) move revenues from the fund that the statute or budget requires to collect them to the fund that the statute or budget requires to expend them, and 2) use unrestricted revenues collected in the General Fund to finance various programs accounted for in other funds in accordance with budgetary authorizations.
NOTE 11. HOTEL/MOTEL LODGING TAX
The City has levied a 5% lodging tax. For the fiscal year ended August 31, 2019, $307,715 of hotel/motel tax was collected. Of the total collected in the current and prior years, $122,534 was used for the promotion of tourism within the City. The remainder of the funds collected in prior years remains unspent at year-end.
NOTE 12. EXCISE TAX ON RENTAL MOTOR VEHICLES
The City has imposed and collected an excise tax on rental motor vehicles under the provisions of the O.C.G.A §48-13-93. The code section requires the City to spend the taxes collected for the purpose of promoting tourism, conventions, trade shows, etc. and promoting the City and businesses therein. For the fiscal year ended August 31, 2019, $342,357 of excise tax was collected and $174,000 was used to pay for tourism outlays within the City.

NOTES TO FINANCIAL STATEMENTS
60
NOTE 13. JOINT VENTURE
Under Georgia law, the City, in conjunction with other cities and counties in the 10-county Metro Atlanta area, is a member of the Atlanta Regional Commission (“ARC”) and is required to pay dues thereto. During its year ending August 31, 2019, the City paid no annual dues to the ARC because currently all dues are paid on the City's behalf by Fulton County. Membership in an ARC is required by the O.C.G.A. §50-8-34, which provides for the organizational structure of the ARC in Georgia. The ARC Board membership includes the chief elected official of each county and municipality of the area. O.C.G.A. §50-8-39.1 provides that the member governments are liable for any debts or obligations of an RC. Separate financial statements may be obtained from: Atlanta Regional Commission, 40 Courtland St. NE, Atlanta, Georgia 30303.
NOTE 14. JOINTLY GOVERNED ORGANIZATION
On March 13, 2001, the City, the City of Fairburn, and the City of Palmetto created by joint resolutions pursuant to the authority of the General Assembly of the State of Georgia, the South Fulton Municipal Regional Water and Sewer Authority (the “Water and Sewer Authority”). The Water and Sewer Authority was created to provide alternative water and sewer resources for the Cities of Union, Fairburn and Palmetto. The Water and Sewer Authority is governed by a board of seven directors, three of whom are the chief elected official of each member city, three of whom are appointed one each by each of the member cities, and one director being appointed by members of the local delegation of the Georgia General Assembly who represent all, or any part of, a member city. The City does not provide financial support to the Water and Sewer Authority, but has contractually obligated itself to use its full taxing powers to guarantee the repayment of approximately 55.75% of the principal and interest on the Water and Sewer Authority’s Series 2007 Variable Rate Revenue Bonds. During the year ended August 31, 2019, the City agreed to pay the Water and Sewer Authority $1,516,551 for the City’s proportionate share of the principal and interest on the Water and Sewer Authority’s bonds from revenues of the City’s Water and Sewerage Fund. On July 1, 2014, the Authority entered into an agreement to refinance the Series 2007 Variable Rate Revenue Bonds Authority with the Series 2014 bonds. The net results of the refinancing resulted in an economic loss of $3,953,000 and a deferred outflow on the refunding of $4,087,845.

NOTES TO FINANCIAL STATEMENTS
61
NOTE 14. JOINTLY GOVERNED ORGANIZATION (CONTINUED) As of December 31, 2018, the Water and Sewer Authority’s debt service requirements on the Series 2014 Variable Rate Revenue Bonds were as follows using a variable interest rate of 3-5%:
Fiscal Year EndingDecember 31,
2019 $ 2,646,350 $ 1,335,000 $ 1,311,350 2020 2,663,325 1,400,000 1,263,325 2021 2,695,525 1,490,000 1,205,525 2022 2,719,226 1,575,000 1,144,226 2023 2,745,850 1,675,000 1,070,850 2024 – 2028 14,115,067 10,070,000 4,045,067 2029 – 2033 14,793,588 13,310,000 1,483,588
$ 42,378,931 $ 30,855,000 $ 11,523,931
Total Principal Interest
Separate financial statements for the Water and Sewer Authority can be obtained at the following address: South Fulton Municipal Regional Water and Sewer Authority, P.O. Box 855, Fairburn, Georgia 30213.
NOTE 15. RELATED ORGANIZATION
The City’s governing body is responsible for appointing a majority of the board members of the City of Union City Housing Authority. However, the City has no further accountability for this organization.
NOTE 16. COMMITMENTS AND CONTINGENCIES
The City is involved in several pending lawsuits. The nature of the lawsuits vary considerably. Management and the City’s legal counsel have determined an aggregate liability, which is reasonably possible to arise from the proceedings of up to $150,000. The entire amount is believed by management and legal counsel to be probable and was included in the claims payable on the government-wide statement of net position as of August 31, 2019. The City will continue to assert its position in a defense against these claims. Amounts received or receivable from grantor agencies are subject to audit and adjustment by grantor agencies, principally the Federal government. Any disallowed claims, including amounts already collected, may constitute a liability of the applicable funds. The amount, if any, of expenditures which may be disallowed by the grantor cannot be determined at this time although the government expects such amounts, if any, to be immaterial.

NOTES TO FINANCIAL STATEMENTS
62
NOTE 17. RISK MANAGEMENT
The City is exposed to various risks of losses related to torts; theft of, damage to and destruction of assets; errors and omissions; injuries to employees and natural disasters. The City has joined together with other municipalities in the state as part of the Georgia Interlocal Risk Management Agency Property and Liability Insurance Fund and the Georgia Municipal Association Group Self-Insurance Workers' Compensation Fund, public entity risk pools currently operating as common risk management and insurance programs for member local governments.
As part of these risk pools, the City is obligated to pay all contributions and assessments as prescribed by the pools, to cooperate with the pools' agents and attorneys, to follow loss reduction procedures established by the funds and to report as promptly as possible and in accordance with any coverage descriptions issued, all incidents which could result in the funds being required to pay any claim of loss. The City is also to allow the pools' agents and attorneys to represent the City in investigation, settlement discussions and all levels of litigation arising out of any claim made against the City within the scope of loss protection furnished by the funds.
The funds are to defend and protect the members of the funds against liability or loss as prescribed in the member government contract and in accordance with the workers' compensation law of Georgia. The funds are to pay all costs taxed against members in any legal proceeding defended by the members, all interest accruing after entry of judgment and all expenses incurred for investigation, negotiation or defense. Settled claims in the past three years have not exceeded the coverages.

REQUIRED SUPPLEMENTARY INFORMATION

63
CITY OF UNION CITY, GEORGIA
REQUIRED SUPPLEMENTARY INFORMATION SCHEDULE OF CHANGES IN THE CITY’S NET PENSION LIABILITY
AND RELATED RATIOS FOR THE FISCAL YEAR ENDED AUGUST 31,
Total pension liabilityService cost $ 380,915 $ 395,133 $ 376,569 $ 364,644 $ 445,614 Interest on total pension liability 1,760,138 1,736,122 1,622,957 1,472,322 1,380,840 Differences between expected and
actual experience 1,426,594 (482,217) 381,421 968,158 333,822 Changes on assumptions - 50,903 - - (237,288) Benefit payments, including refunds
of employee contributions (1,083,330) (944,523) (896,982) (825,925) (659,221) Net change in total pension liability 2,484,317 755,418 1,483,965 1,979,199 1,263,767 Total pension liability - beginning 23,629,251 22,873,833 21,389,868 19,410,669 18,146,902 Total pension liability - ending (a) $ 26,113,568 $ 23,629,251 $ 22,873,833 $ 21,389,868 $ 19,410,669
Plan fidicuary net position Contributions - employer $ 900,433 $ 987,884 $ 794,563 $ 1,006,474 $ 942,047 Net investment income 1,773,020 2,350,322 1,572,297 145,050 1,404,681 Benefit payments, including
refunds of employee contributions (1,083,330) (944,523) (896,982) (825,925) (659,221) Administrative expenses (44,103) (46,092) (22,234) (24,688) (20,144) Net change in plan fiduciary net position 1,546,020 2,347,591 1,447,644 300,911 1,667,363 Plan fiduciary net position - beginning 17,896,405 15,548,814 14,101,170 13,800,259 12,132,896 Plan fidicuay net position - ending (b) $ 19,442,425 $ 17,896,405 $ 15,548,814 $ 14,101,170 $ 13,800,259
City's net pension liability - ending (a) - (b) $ 6,671,143 $ 5,732,846 $ 7,325,019 $ 7,288,698 $ 5,610,410
Plan fidicuary net position as a percentage of the total pension liability 74.45% 75.74% 67.98% 65.92% 71.10%
Covered payroll $ 7,075,950 $ 7,097,123 $ 6,801,085 $ 6,490,346 $ 6,121,491
City's net pension liability as a percentage of covered payroll 94.28% 80.78% 107.70% 112.30% 91.65%
Notes to the schedule:The schedule will present 10 years of information once it is accumulated.
2019 2018 201520162017

64
CITY OF UNION CITY, GEORGIA
REQUIRED SUPPLEMENTARY INFORMATION SCHEDULE OF CITY CONTRIBUTIONS
FOR THE FISCAL YEAR ENDED AUGUST 31,
Actuarially determined contribution $ 1,313,081 $ 1,309,670 $ 1,221,351 $ 1,169,509 $ 1,241,986 Contributions in relation to the
actuarially determined contribution 1,034,872 976,424 911,893 865,396 935,461 Contribution deficiency (excess) $ 278,209 $ 333,246 $ 309,458 $ 304,113 $ 306,525
Covered payroll $ 8,912,707 $ 7,075,950 $ 7,097,123 $ 6,801,085 $ 6,490,346
Contributions as a percentage of covered payroll 11.61% 13.80% 12.85% 12.72% 14.41%
Notes to the Schedule:Valuation date January 1, 2019Cost method Projected unit costActuarial asset valuation method
Assumed rate of return on investments 7.50%
Projected salary increases 2.75% plus service based merit increasesCost-of-living adjustment 2.75%Amortization method Closed level dollar for unfunded liabilityRemaining amortization period Varies for the bases, with a net effective
amortization period of 10 years
The schedule will present 10 years of information once it is accumulated.
20152019
Sum of actuarial value at beginning of year and the cash flow during the year plus the assumed investment return, adjusted by 10% of the amounts that the value exceeds or is less than the market value at the end of the year. The actuarial value is adjusted, if necessary, to be within 20% of market value.
2018 2017 2016

COMBINING STATEMENTS AND SCHEDULES

CITY OF UNION CITY, GEORGIA
NONMAJOR GOVERNMENTAL FUNDS
SPECIAL REVENUE FUNDS
Special Revenue Funds are used to account for the proceeds of specific revenue sources that are restricted to expenditures for specified purposes. The Federal Seized Funds Fund accounts for the collection and use of funds confiscated from convicted offenders. The Vehicle Rental Excise Tax Fund accounts for the collection of rental car fees that are required to be remitted to the Economic Development Department. The Hotel/Motel Tax Fund accounts for the Hotel/Motel tax receipts and distributions of funds used to promote tourism within the City. The Emergency 911 Fund accounts for the fee collection and operations of the Emergency 911 system within the City. The Inmate Welfare Fund accounts for certain funds collected at the commissary located at the City jail. The Tax Allocation District Fund accounts for the increased property tax generated by new development to finance capital and other costs related to redevelopment. The Multiple Operating Grant Fund accounts for federal and state grant revenues to be used for City expenditures.
CAPITAL PROJECTS FUNDS
Capital Projects Funds are used to account for financial resources to be used for the acquisition or construction of major capital facilities. The Capital Projects Fund accounts for various capital projects of the City. Funding is provided by the issuance of capital leases and transfers from the General Fund. The CDBG Fund accounts for various community capital projects of the City. Funding is provided by state and federal agencies and transfers from the General Fund.

CITY OF UNION CITY, GEORGIA
NONMAJOR GOVERNMENTAL FUNDS
DEBT SERVICE FUNDS
The 2010 General Obligation Bond Debt Service Fund accounts for accumulation of resources for the payment of debt principal and interest for the 2010 General Obligation Bond Issue. The 2014 General Obligation Bond Debt Service Fund accounts for accumulation of resources for the payment of debt principal and interest for the 2014 General Obligation Bond Issue.
The 2010 Certificate of Participation Debt Service Fund accounts for accumulation of resources for the payment of debt principal and interest for the 2010 Certificate of Participation Issue. The 2017 General Obligation Bond Debt Service Fund accounts for accumulation of resources for the payment of debt principal and interest for the 2017 General Obligation Bond Issue.

65
ASSETS Cash and cash equivalents $ 97,997 $ 196,725 $ 450,983 $ 56,566 $ 268,145 $ 645,666 $ 1,050,134 Restricted cash - - - - - - - Taxes receivable - 28,271 25,709 - - - - Due from other governments - - - - - - 181,704 Prepaid expenditures - - - 155,000 - - - Total assets $ 97,997 $ 224,996 $ 476,692 $ 211,566 $ 268,145 $ 645,666 $ 1,231,838
LIABILITIES Accounts payable $ - $ - $ 90,092 $ 1,620 $ - $ - $ 102,220 Due to others 81,418 - - - 69,122 - - Due to other funds - - - 150,000 126,410 - - Total liabilities 81,418 - 90,092 151,620 195,532 - 102,220
DEFERRED INFLOWS OF RESOURCES Unavailable revenue - intergovernmental revenue - - - - - - 181,424 Total deferred inflows of resources - - - - - - 181,424
FUND BALANCES (DEFICITS) Nonspendable: Prepaid expenditures - - - 155,000 - - - Restricted for: Law enforcement 16,579 - - - 72,613 - 948,194 Economic development - 224,996 386,600 - - - - Other capital projects - - - - - 645,666 - Debt service - - - - - - - Unassigned - - - (95,054) - - - Total fund balances (deficits) 16,579 224,996 386,600 59,946 72,613 645,666 948,194 Total liabilities, deferred inflows of resources, and fund balances $ 97,997 $ 224,996 $ 476,692 $ 211,566 $ 268,145 $ 645,666 $ 1,231,838
Tax AllocationDistrictFund
MultipleOperatingInmate
WelfareEmergency
911Fund
GrantFund
RentalExcise Tax
Fund
Hotel/Motel Tax
Fund Fund
SeizedFundsFund
Vehicle
CITY OF UNION CITY, GEORGIA
COMBINING BALANCE SHEETNONMAJOR GOVERNMENTAL FUNDS
AUGUST 31, 2019
Special Revenue FundsFederal

66
$ 3,365,856 $ - $ 1,469 $ 4,747 $ - $ 3,076 $ 6,141,364 612,568 - - - - - 612,568
- - - - - - 53,980 - 259,277 - - - - 440,981
95,000 - - - - - 250,000 $ 4,073,424 $ 259,277 $ 1,469 $ 4,747 $ - $ 3,076 $ 7,498,893
$ 127,887 $ - $ - $ - $ - $ - $ 321,819 - - - - - - 150,540 - 152,512 - - - - 428,922
127,887 152,512 - - - - 901,281
- - - - - - 181,424 - - - - - - 181,424
95,000 - - - - - 250,000
- - - - - - 1,037,386 - - - - - - 611,596
3,850,537 106,765 - - - - 4,602,968 - - 1,469 4,747 - 3,076 9,292 - - - - - - (95,054)
3,945,537 106,765 1,469 4,747 - 3,076 6,416,188
$ 4,073,424 $ 259,277 $ 1,469 $ 4,747 $ - $ 3,076 $ 7,498,893
TotalsBond Participation
2017General
ObligationBond
Debt Service Funds
CDBGFund
2010General
ObligationBond
2014General
ObligationFund
Capital Projects2010
Certificate of
Capital Projects Funds

67
Revenues Property taxes $ - $ - $ - $ - $ - $ 47,628 $ - Other taxes - 342,357 307,715 - - - - Charges for services - - - 14,586 - - - Intergovernmental revenue - - - - - - 314,579 Interest revenue 383 - - - 3,391 - 449 Total revenues 383 342,357 307,715 14,586 3,391 47,628 315,028
Expenditures Current: General government - - - - - - 8,229 Public safety 15,785 - - 503,423 - - 288,480 Public works - - - - - - 329,706 Economic development - - 122,534 - - - - Capital outlay - - - - - - - Debt service: Principal - - - - - - - Interest - - - - - - - Total expenditures 15,785 - 122,534 503,423 - - 626,415
Excess (deficiency) of revenues over (under) expenditures (15,402) 342,357 185,181 (488,837) 3,391 47,628 (311,387)
Other financing sources (uses) Capital leases - - - - - - - Transfers in - - - 552,400 - - 928,560 Transfers out - (174,000) (183,801) - - - - Total other financing sources (uses) - (174,000) (183,801) 552,400 - - 928,560
Net change in fund balances (15,402) 168,357 1,380 63,563 3,391 47,628 617,173
Fund balances (deficits), beginning of year 31,981 56,639 385,220 (3,617) 69,222 598,038 331,021
Fund balances (deficits), end of year $ 16,579 $ 224,996 $ 386,600 $ 59,946 $ 72,613 $ 645,666 $ 948,194
Federal MultipleSeizedFundsFund
VehicleRental
Excise TaxFund
Special Revenue Funds
CITY OF UNION CITY, GEORGIA
COMBINING STATEMENT OF REVENUES, EXPENDITURESAND CHANGES IN FUND BALANCES
NONMAJOR GOVERNMENTAL FUNDSFOR THE FISCAL YEAR ENDED AUGUST 31, 2019
Hotel/Motel Tax
Fund
Emergency911
Fund Fund
OperatingWelfare District
Fund
Inmate Tax AllocationGrantFund

68
$ - $ - $ - $ - $ - $ - $ 47,628 - - - - - - 650,072 - - - - - - 14,586 - 59,277 - - - - 373,856
12,422 - - - - - 16,645 12,422 59,277 - - - - 1,102,787
- - - - - - 8,229 - - - - - - 807,688 - - - - - - 329,706 - - - - - - 122,534
1,680,975 22,131 - - - - 1,703,106
588,753 - - 750,000 - 75,000 1,413,753 23,250 - - 229,190 - 251,000 503,440
2,292,978 22,131 - 979,190 - 326,000 4,888,456
(2,280,556) 37,146 - (979,190) - (326,000) (3,785,669)
822,401 - - - - - 822,401 4,432,500 44,430 - 979,625 494,422 327,000 7,758,937
- - - - - - (357,801)
5,254,901 44,430 - 979,625 494,422 327,000 8,223,537
2,974,345 81,576 - 435 494,422 1,000 4,437,868
971,192 25,189 1,469 4,312 (494,422) 2,076 1,978,320
$ 3,945,537 $ 106,765 $ 1,469 $ 4,747 $ - $ 3,076 $ 6,416,188
Capital Projects Funds Debt Service Funds
CDBGFund Totals
2010Certificate ofParticipationFund
Capital Projects
2017General
ObligationBond
2010General
ObligationBond
2014General
ObligationBond

69
REVENUES Interest revenues $ - $ 3,953 $ 3,953 $ - Total revenues - 3,953 3,953 -
EXPENDITURES Capital outlay 5,414,633 5,415,033 3,397,273 2,017,760 Debt service:
Net change in fund balance (5,414,633) (5,411,080) (3,393,320) 2,017,760
FUND BALANCES, beginning of year 3,370,109 3,370,109 3,370,109 -
FUND BALANCES (DEFICIT), end of year $ (2,044,524) $ (2,040,971) $ (23,211) $ 2,017,760
CITY OF UNION CITY, GEORGIA
GENERAL OBLIGATION BONDS FUNDSCHEDULE OF REVENUES, EXPENDITURES AND CHANGES IN
FUND BALANCE - BUDGET AND ACTUALFOR THE FISCAL YEAR ENDED AUGUST 31, 2019
Original Budget Final Budget Actual Variance

70
REVENUES Sales tax $ 3,500,000 $ 3,500,000 $ 3,694,290 $ 194,290 Interest revenue - - 79,351 79,351 Total revenues 3,500,000 3,500,000 3,773,641 273,641
EXPENDITURES Capital outlay 7,618,769 7,618,769 1,107,142 6,511,627 Total expenditures 7,618,769 7,618,769 1,107,142 6,511,627
Net change in fund balance (4,118,769) (4,118,769) 2,666,499 6,785,268
FUND BALANCES, beginning of year 4,589,119 4,589,119 4,589,119 -
FUND BALANCES, end of year $ 470,350 $ 470,350 $ 7,255,618 $ 6,785,268
FUND BALANCE - BUDGET AND ACTUALFOR THE FISCAL YEAR ENDED AUGUST 31, 2019
Original Budget Final Budget Actual Variance
CITY OF UNION CITY, GEORGIA
TSPLOST FUNDSCHEDULE OF REVENUES, EXPENDITURES AND CHANGES IN

71
REVENUES Intergovernmental revenues $ 1,350,432 $ 1,350,432 $ 398,131 $ (952,301) Total revenues 1,350,432 1,350,432 398,131 (952,301)
EXPENDITURES Capital outlay 2,016,913 2,016,912 1,591,490 425,422 Total expenditures 2,016,913 2,016,912 1,591,490 425,422
Deficiency of revenues under expenditures (666,481) (666,480) (1,193,359) (526,879)
OTHER FINANCING SOURCE Transfers in 666,481 666,480 666,480 - Total other financing source 666,481 666,480 666,480 -
Net change in fund balance - - (526,879) (526,879)
FUND BALANCES, beginning of year 227,578 227,578 227,578 -
FUND BALANCES (DEFICIT), end of year $ 227,578 $ 227,578 $ (299,301) $ (526,879)
CITY OF UNION CITY, GEORGIA
CAPITAL GRANTS FUNDSCHEDULE OF REVENUES, EXPENDITURES AND CHANGES IN
FUND BALANCE - BUDGET AND ACTUALFOR THE FISCAL YEAR ENDED AUGUST 31, 2019
Original Budget Final Budget Actual Variance

72
REVENUES Interest $ - $ 383 $ 383 $ - Total revenues - 383 383 -
EXPENDITURES Public safety 42,641 15,785 15,785 - Total expenditures 42,641 15,785 15,785 -
Net change in fund balance (42,641) (15,402) (15,402) -
FUND BALANCES, beginning of year 31,981 31,981 31,981 -
FUND BALANCES, end of year $ (10,660) $ 16,579 $ 16,579 $ -
Original Budget
FOR THE FISCAL YEAR ENDED AUGUST 31, 2019
FEDERAL SEIZED FUNDS FUND
CITY OF UNION CITY, GEORGIA
Final Budget Actual Variance
SCHEDULE OF REVENUES, EXPENDITURES AND CHANGES INFUND BALANCE - BUDGET AND ACTUAL

73
REVENUES: Other taxes $ 174,000 $ 174,000 $ 342,357 $ 168,357 Total revenues 174,000 174,000 342,357 168,357
OTHER FINANCING USE: Transfers out (174,000) (174,000) (174,000) - Total other financing use (174,000) (174,000) (174,000) -
Net change in fund balance - - 168,357 168,357
FUND BALANCES, beginning of year 56,639 56,639 56,639 -
FUND BALANCES, end of year $ 56,639 $ 56,639 $ 224,996 $ 168,357
Original Budget Final Budget Actual Variance
SCHEDULE OF REVENUES, EXPENDITURES AND CHANGES INFUND BALANCE - BUDGET AND ACTUAL
FOR THE FISCAL YEAR ENDED AUGUST 31, 2019
CITY OF UNION CITY, GEORGIA
VEHICLE RENTAL EXCISE TAX FUND

74
REVENUES Other taxes $ 310,000 $ 310,000 $ 307,715 $ (2,285) Total revenues 310,000 310,000 307,715 (2,285)
EXPENDITURES Economic development 124,000 124,000 122,534 1,466 Total expenditures 124,000 124,000 122,534 1,466
Excess of revenues over expenditures 186,000 186,000 185,181 (819)
OTHER FINANCING USE: Transfers out (186,000) (186,000) (183,801) 2,199 Total other financing use (186,000) (186,000) (183,801) 2,199
Net change in fund balance - - 1,380 1,380
FUND BALANCES, beginning of year 385,220 385,220 385,220 -
FUND BALANCES, end of year $ 385,220 $ 385,220 $ 386,600 $ 1,380
CITY OF UNION CITY, GEORGIA
Final Budget ActualOriginal Budget
SCHEDULE OF REVENUES, EXPENDITURES AND CHANGES INFUND BALANCE - BUDGET AND ACTUAL
FOR THE FISCAL YEAR ENDED AUGUST 31, 2019
HOTEL/MOTEL TAX FUND
Variance

75
REVENUES Charges for services $ 14,000 $ 14,586 $ 14,586 $ - Total revenues 14,000 14,586 14,586 -
EXPENDITURES Public safety 566,400 503,423 503,423 - Total expenditures 566,400 503,423 503,423 -
Deficiency of revenues under expenditures (552,400) (488,837) (488,837) -
OTHER FINANCING SOURCE Transfers in 552,400 552,400 552,400 - Total other financing source 552,400 552,400 552,400 -
Net change in fund balance - 63,563 63,563 -
FUND BALANCES (DEFICITS), beginning of year (3,617) (3,617) (3,617) -
FUND BALANCES, end of year $ (3,617) $ 59,946 $ 59,946 $ -
CITY OF UNION CITY, GEORGIA
EMERGENCY 911 FUND
Original Budget
SCHEDULE OF REVENUES, EXPENDITURES AND CHANGES IN
Actual Variance
FUND BALANCE - BUDGET AND ACTUALFOR THE FISCAL YEAR ENDED AUGUST 31, 2019
Final Budget

76
REVENUES Property taxes $ - $ - $ 47,628 $ 47,628
Total revenues - - 47,628 47,628
EXPENDITURES Capital outlay 709,500 709,500 - 709,500 Total expenditures 709,500 709,500 - 709,500
Net change in fund balance (709,500) (709,500) 47,628 (661,872)
FUND BALANCES, beginning of year 598,038 598,038 598,038 -
FUND BALANCES, end of year $ (111,462) $ (111,462) $ 645,666 $ (661,872)
SCHEDULE OF REVENUES, EXPENDITURES AND CHANGES IN FUND BALANCE - BUDGET AND ACTUAL
FOR THE FISCAL YEAR ENDED AUGUST 31, 2019
CITY OF UNION CITY, GEORGIA
TAX ALLOCATION DISTRICT FUND
Original Budget VarianceActualFinal Budget

77
REVENUES Intergovernmental revenue $ 757,695 $ 314,579 $ 314,579 $ - Interest revenue - - 449 449 Total revenues 757,695 314,579 315,028 449
EXPENDITURES General government 43,312 8,229 8,229 - Public safety 808,614 288,480 288,480 - Public works 827,826 329,706 329,706 - Total expenditures 1,679,752 626,415 626,415 -
Deficiency of revenues under expenditures (922,057) (311,836) (311,387) 449
OTHER FINANCING SOURCE Transfers in 498,007 928,560 928,560 - Total other financing source 498,007 928,560 928,560 -
Net change in fund balance (424,050) 616,724 617,173 449
FUND BALANCES, beginning of year 331,021 331,021 331,021 -
FUND BALANCES, end of year $ (93,029) $ 947,745 $ 948,194 $ 449
FOR THE FISCAL YEAR ENDED AUGUST 31, 2019
Original Budget Final Budget Actual Variance
CITY OF UNION CITY, GEORGIA
MULTIPLE OPERATING GRANT FUNDSCHEDULE OF REVENUES, EXPENDITURES AND CHANGES IN
FUND BALANCE - BUDGET AND ACTUAL

78
REVENUES Interest revenue $ - $ - $ 12,422 $ 12,422 Total revenues - - 12,422 12,422
EXPENDITURES Current: Capital outlay 5,774,954 5,774,954 1,680,975 4,093,979 Debt service Principal 98,319 588,753 588,753 - Interest 4,218 23,250 23,250 - Total expenditures 5,877,491 6,386,957 2,292,978 4,093,979
Deficiency of revenues under expenditures (5,877,491) (6,386,957) (2,280,556) (4,081,557)
OTHER FINANCING SOURCES Capital leases 35,137 35,137 822,401 787,264 Transfers in 4,432,500 4,432,500 4,432,500 - Total other financing sources 4,467,637 4,467,637 5,254,901 787,264
Net change in fund balance (1,409,854) (1,919,320) 2,974,345 (3,294,293)
FUND BALANCES, beginning of year 971,192 971,192 971,192 -
FUND BALANCES (DEFICITS), end of year $ (438,662) $ (948,128) $ 3,945,537 $ (3,294,293)
Original Budget Final Budget Actual Variance
CITY OF UNION CITY, GEORGIA
CAPITAL PROJECTS FUNDSCHEDULE OF REVENUES, EXPENDITURES AND CHANGES IN
FUND BALANCE - BUDGET AND ACTUALFOR THE FISCAL YEAR ENDED AUGUST 31, 2019

79
REVENUES: Intergovernmental revenues $ 244,302 $ 59,277 $ 59,277 $ - Total revenues 244,302 59,277 59,277 -
EXPENDITURES: Capital outlay 268,732 22,131 22,131 - Total expenditures 268,732 22,131 22,131 -
Excess (deficiency) of revenues over (under) expenditures (24,430) 37,146 37,146 -
OTHER FINANCING SOURCE: Transfers in 24,430 44,430 44,430 - Total other financing source 24,430 44,430 44,430 -
Net change in fund balance - 81,576 81,576 -
FUND BALANCES, beginning of year 25,189 25,189 25,189 -
FUND BALANCES, end of year $ 25,189 $ 106,765 $ 106,765 $ -
CITY OF UNION CITY, GEORGIA
CDBG FUND
Original Budget Final Budget Actual Variance
SCHEDULE OF REVENUES, EXPENDITURES AND CHANGES IN
FOR THE FISCAL YEAR ENDED AUGUST 31, 2019FUND BALANCE - BUDGET AND ACTUAL

80
EXPENDITURES Debt service Principal $ 750,000 $ 750,000 $ 750,000 $ - Interest 229,625 229,625 229,190 435 Total expenditures 979,625 979,625 979,190 435
OTHER FINANCING SOURCES Transfers in 979,625 979,625 979,625 - Total other financing sources 979,625 979,625 979,625 -
Net change in fund balance - - 435 435
FUND BALANCES, beginning of year 4,312 4,312 4,312 -
FUND BALANCES, end of year $ 4,312 $ 4,312 $ 4,747 $ 435
CITY OF UNION CITY, GEORGIA
2014 GENERAL OBLIGATION BOND DEBT SERVICE FUNDSCHEDULE OF REVENUES, EXPENDITURES AND CHANGES IN
FUND BALANCE - BUDGET AND ACTUAL FOR THE FISCAL YEAR ENDED AUGUST 31, 2019
VarianceFinal Budget ActualOriginal Budget

81
OTHER FINANCING SOURCES Transfers in $ - $ - $ 494,422 $ 494,422 Total other financing sources - - 494,422 494,422
Net change in fund balance - - 494,422 494,422
FUND BALANCES (DEFICIT), beginning of year (494,422) (494,422) (494,422) -
FUND BALANCES, end of year $ (494,422) $ (494,422) $ - $ 494,422
FUND BALANCE - BUDGET AND ACTUAL FOR THE FISCAL YEAR ENDED AUGUST 31, 2019
SCHEDULE OF REVENUES, EXPENDITURES, AND CHANGES IN 2010 CERTIFICATE OF PARTICIPATION DEBT SERVICE FUND
Original Budget
CITY OF UNION CITY, GEORGIA
VarianceActualFinal Budget

82
EXPENDITURES Debt service Principal $ 75,000 $ 75,000 $ 75,000 $ - Interest 251,000 251,000 251,000 - Total expenditures 326,000 326,000 326,000 -
Deficiency of revenues under expenditures (326,000) (326,000) (326,000) -
OTHER FINANCING SOURCES Transfers in 327,000 327,000 327,000 - Total other financing sources 327,000 327,000 327,000 -
Net change in fund balance 1,000 1,000 1,000 -
FUND BALANCES, beginning of year 2,076 2,076 2,076 -
FUND BALANCES, end of year $ 3,076 $ 3,076 $ 3,076 $ -
Original Budget Final Budget Actual Variance
CITY OF UNION CITY, GEORGIA
2017 GENERAL OBLIGATION BOND DEBT SERVICE FUNDSCHEDULE OF REVENUES, EXPENDITURES AND CHANGES IN
FUND BALANCE - BUDGET AND ACTUAL FOR THE FISCAL YEAR ENDED AUGUST 31, 2019

CITY OF UNION CITY, GEORGIA
NONMAJOR ENTERPRISE FUNDS
The Criminal Justice Management Fund accounts for the operations related to the City’s management of the jail facility for the South Fulton Municipal Regional Jail Authority. All activities necessary to provide such services are accounted for in this fund.
The Sanitation Fund accounts for the operations of commercial and residential waste removal within the City. All activities necessary to provide such services are accounted for in this fund.

83
ASSETS Cash and cash equivalents $ - $ 757,579 $ 757,579 Accounts receivable, net of allowances - 263,191 263,191 Due from component unit 32,344 - 32,344 Total current assets 32,344 1,020,770 1,053,114
Total assets 32,344 1,020,770 1,053,114
LIABILITIESCURRENT LIABILITIES Accounts payable 179 121,615 121,794 Due to other funds 32,165 - 32,165 Total current liabilities 32,344 121,615 153,959
Total liabilities 32,344 121,615 153,959
NET POSITION Unrestricted - 899,155 899,155 Total net position $ - $ 899,155 $ 899,155
SanitationFund
CITY OF UNION CITY, GEORGIA
COMBINING STATEMENT OF NET POSITIONNONMAJOR ENTERPRISE FUNDS
AUGUST 31, 2019
Criminal JusticeManagement
Fund Totals

84
OPERATING REVENUES Charges for services $ 564,351 $ 1,562,234 $ 2,126,585 Other charges - 95,098 95,098 Total operating revenues 564,351 1,657,332 2,221,683
OPERATING EXPENSES Purchased or contracted services 148,168 1,390,302 1,538,470 Total operating expenses 148,168 1,390,302 1,538,470
Operating income 416,183 267,030 683,213
TRANSFERS Transfers out (920,679) (133,155) (1,053,834) Total transfers (920,679) (133,155) (1,053,834)
Change in net position (504,496) 133,875 (370,621)
NET POSITION, beginning of year 504,496 765,280 1,269,776
NET POSITION, end of year $ - $ 899,155 $ 899,155
SanitationFund
Criminal JusticeManagement
Fund Totals
FOR THE FISCAL YEAR ENDED AUGUST 31, 2019
CITY OF UNION CITY, GEORGIA
COMBINING STATEMENT OF REVENUES, EXPENDITURES ANDCHANGES IN FUND NET POSITIONNONMAJOR ENTERPRISE FUNDS

85
CASH FLOWS FROM OPERATING ACTIVITIES Receipts from customers and users $ 390,440 $ 1,647,148 $ 2,037,588 Payments to suppliers (203,895) (1,375,378) (1,579,273) Net cash provided by operating activities 186,545 271,770 458,315
CASH FLOWS FROM NONCAPITAL FINANCING ACTIVITIES Transfers (920,679) (133,155) (1,053,834) Net cash used in noncapital financing activities (920,679) (133,155) (1,053,834)
Change in cash and cash equivalents (734,134) 138,615 (595,519)
Cash and cash equivalents: Beginning of year 734,134 618,964 1,353,098
End of year $ - $ 757,579 $ 757,579
(Continued)
SanitationFund
ManagementFund Totals
FOR THE FISCAL YEAR ENDED AUGUST 31, 2019
CITY OF UNION CITY, GEORGIA
COMBINING STATEMENT OF CASH FLOWSNONMAJOR ENTERPRISE FUNDS
Criminal Justice

86
Reconciliation of operating income to net cash provided by operating activities: Operating income $ 416,183 $ 267,030 $ 683,213 Adjustments to reconcile operating income to net cash provided by operating activities: Changes in assets and liabilities: Increase in accounts receivable - (10,184) (10,184) Decrease in due from others 79,406 - 79,406 Increase (decrease) in accounts payable (30,168) 14,924 (15,244) Decrease in accrued liabilities (758) - (758) Increase in due to other funds 32,165 - 32,165 Decrease in due to component unit (285,482) - (285,482) Decrease in net pension liability (24,801) - (24,801) Net cash provided by operating activities $ 186,545 $ 271,770 $ 458,315
FundSanitation
CITY OF UNION CITY, GEORGIA
COMBINING STATEMENT OF CASH FLOWSNONMAJOR ENTERPRISE FUNDS
FOR THE FISCAL YEAR ENDED AUGUST 31, 2019
Criminal JusticeManagement
Fund Totals

CITY OF UNION CITY, GEORGIA
FIDUCIARY FUND
AGENCY FUND
The Municipal Court Fund accounts for the collections of cash appearance bonds by the Municipal Court.

87
MUNICIPAL COURT FUND
ASSETSCash and cash equivalents $ 39,502 $ 1,070,275 $ 1,072,519 $ 37,258 Total assets $ 39,502 $ 1,070,275 $ 1,072,519 $ 37,258
LIABILITIESDue to others $ 39,502 $ 1,070,275 $ 1,072,519 $ 37,258 Total liabilities $ 39,502 $ 1,070,275 $ 1,072,519 $ 37,258
CITY OF UNION CITY, GEORGIA
STATEMENT OF CHANGES IN FIDUCIARY ASSETS AND LIABILITIES AGENCY FUND
FOR THE FISCAL YEAR ENDED AUGUST 31, 2019
2018September 1,
Balance
Additions Deletions
BalanceAugust 31,
2019

COMPONENT UNIT

88
CASH FLOWS FROM OPERATING ACTIVITIES Receipts from customers and users $ 425,556 Due to primary government 32,344 Payments to suppliers (3,381,809) Net cash used in operating activities (2,923,909)
CASH FLOWS FROM CAPITAL AND RELATED FINANCING ACTIVITIES Proceeds from issuance of debt 12,825,000 Principal paid on bonds (11,840,000) Distributions paid (447,899) Interest paid (54,798) Net cash provided by capital and related financing activities 482,303
CASH FLOWS FROM INVESTING ACTIVITIES Interest and dividends received 137 Net cash provided by investing activities 137
Change in cash and cash equivalents (2,441,469)
Cash and cash equivalents: Beginning of year 2,473,813
End of year $ 32,344
Reconciliation of operating income to net cash provided by operating activities: Operating income $ 97,474 Adjustments to reconcile operating income to net cash provided by operating activities Depreciation expense 40,263 Changes in assets and liabilities: Decrease in due from primary government 285,482 Increase in deferred outflows of resources - deferred charge of refunding (928,472) Increase in accounts payable 32,344 Decrease in due to primary government (2,451,000) Net cash provided by operating activities $ (2,923,909)
Schedule of non-cash capital and related financing activities:
Sale of capital assets to Fulton County $ 12,825,000 Issuance of intergovernmental receivable to Fulton County (12,825,000)
CITY OF UNION CITY, GEORGIA
STATEMENT OF CASH FLOWSCOMPONENT UNIT
FOR THE FISCAL YEAR ENDED AUGUST 31, 2019

STATISTICAL SECTION
This part of the City of Union City's comprehensive annual financial report presents detailed information as a context for understanding what the information in the financial statements, note disclosures, required supplementary information, and supplementary information says about the City's overall financial health. Contents Page
Financial Trends ......................................................................................................................................... 89 – 95
These schedules contain trend information to help the reader understand how the City's financial performance and well-being have changed over time.
Revenue Capacity ....................................................................................................................................... 96 – 99 These schedules contain information to help the reader assess the City's most significant local revenue sources.
Debt Capacity .......................................................................................................................................... 100 – 104 These schedules present information to help the reader assess the affordability of the City's current levels of outstanding debt and the City's ability to issue additional debt in the future.
Demographic and Economic Information ........................................................................................ 105 and 106 These schedules offer demographic and economic indicators to help the reader understand the environment within which the City's financial activities take place.
Operating Information ............................................................................................................................ 107 – 109 These schedules contain service and infrastructure data to help the reader understand how the information in the City's financial report relates to the services the City provides and the activities it performs.
Sources: Unless otherwise noted, the information in these schedules is derived from the City's financial reports for the relevant year.

89
Governmental activities Net investment in capital assets $ 4,350,167 $ 2,298,610 $ 2,363,313 $ 2,046,237 $ 3,597,239 $ 3,531,201 $ 5,049,949 $ 598,455 $ 9,461,603 $ 12,268,365 Restricted 4,645,673 857,484 1,478,182 1,734,932 1,879,206 2,088,414 2,040,997 8,394,962 6,624,974 13,516,860 Unrestricted 2,692,528 3,697,905 1,603,503 (102,458) 1,903,353 2,254,399 5,350,512 9,888,086 12,973,607 14,222,021 Total governmental activities net position $ 11,688,368 $ 6,853,999 $ 5,444,998 $ 3,678,711 $ 7,379,798 $ 7,874,014 $ 12,441,458 $ 18,881,503 $ 29,060,184 $ 40,007,246 Business-type activities Net investment in capital assets $ 12,298,174 $ 11,905,504 $ 9,993,975 $ 10,385,111 $ 8,901,118 $ 7,991,837 $ 7,209,006 $ 6,757,926 $ 6,296,865 $ 5,797,207 Restricted - - - 925,910 2,059,130 1,970,454 1,834,024 1,535,293 1,449,250 1,374,641 Unrestricted 255,748 (532,061) 824,012 964,801 1,038,859 862,585 1,921,057 3,327,110 5,525,641 5,983,583 Total business-type activities net position $ 12,553,922 $ 11,373,443 $ 10,817,987 $ 12,275,822 $ 11,999,107 $ 10,824,876 $ 10,964,087 $ 11,620,329 $ 13,271,756 $ 13,155,431
Primary government Net investment in capital assets $ 16,648,341 $ 14,204,114 $ 12,357,288 $ 12,431,348 $ 12,498,357 $ 11,523,038 $ 12,258,955 $ 7,356,381 $ 15,758,468 $ 18,065,572 Restricted 4,645,673 857,484 1,478,182 2,660,842 3,938,336 4,058,868 3,875,021 9,930,255 8,074,224 14,891,501 Unrestricted 2,948,276 3,165,844 2,427,515 862,343 2,942,212 3,116,984 7,271,569 13,215,196 18,499,248 20,205,604 Total primary government net position $ 24,242,290 $ 18,227,442 $ 16,262,985 $ 15,954,533 $ 19,378,905 $ 18,698,890 $ 23,405,545 $ 30,501,832 $ 42,331,940 $ 53,162,677
2016 2017Fiscal Year
CITY OF UNION CITY, GEORGIA
NET POSITION BY ACTIVITYLAST TEN FISCAL YEARS
2010 2011 2012 2013 2014 2015 2018 2019

90
ExpensesPrimary government: Governmental activities: General government $ 2,490,131 $ 2,197,152 $ 2,211,266 $ 2,470,084 $ 2,054,613 $ 2,468,658 $ 2,424,138 $ 2,444,499 $ 3,781,555 $ 5,300,953 Judicial 426,544 467,691 468,800 452,295 436,347 383,138 444,132 454,518 426,489 490,390 Public safety 9,806,401 10,127,843 10,193,857 9,865,376 9,590,617 8,941,842 9,852,273 10,242,974 10,396,662 11,417,818 Public works 3,034,056 4,906,720 2,818,491 1,766,343 1,611,785 2,005,906 2,329,099 2,168,984 2,207,629 3,212,888 Community services - - - - - - - - - - Parks and recreation 330,248 443,054 447,059 495,841 523,992 473,370 522,901 551,401 554,589 938,851 Economic development 932,850 643,677 815,159 832,622 751,348 710,296 684,237 646,318 852,933 934,250 Interest on long-term debt 839,703 665,503 666,233 591,502 531,627 329,512 221,368 422,825 436,104 437,610 Issuance cost on long-term debt - - - - - 183,416 - 198,818 - - Total governmental activities expenses 17,859,933 19,451,640 17,620,865 16,474,063 15,500,329 15,496,138 16,478,148 17,130,337 18,655,961 22,732,760 Business-type activities: Water and sewerage 6,551,474 5,961,017 6,651,946 6,690,719 7,279,343 7,137,318 - 7,178,488 7,261,987 7,797,294 Sanitation 700,470 677,006 763,164 736,123 611,799 1,063,063 1,493,200 1,642,981 1,611,225 1,538,470 Stormwater - - - 55,470 223,238 1,685,368 734,022 271,592 231,166 499,988 Criminal justice management 3,568,864 2,889,058 3,387,775 2,372,405 365,455 - - - - - Total business-type activities expenses 10,820,808 9,527,081 10,802,885 9,854,717 8,479,835 9,885,749 2,227,222 9,093,061 9,104,378 9,835,752 Total primary government expenses 28,680,741 28,978,721 28,423,750 26,328,780 23,980,164 25,381,887 18,705,370 26,223,398 27,760,339 32,568,512
Program revenuesPrimary government: Governmental activities: Charges for services
General government 1,714,518 1,472,105 1,479,642 1,745,430 1,894,426 2,125,471 2,378,255 2,352,516 2,774,272 2,855,996 Judicial 158,576 128,438 137,908 130,030 77,926 43,564 61,063 46,479 48,654 59,523 Public safety 2,009,280 1,856,768 1,757,157 1,413,518 1,224,270 938,139 1,036,884 935,486 759,439 819,721 Public works - - - - - 19,355 19,066 13,977 17,150 15,721 Community services - - - - - - - - - - Parks and recreation 10,053 58,992 69,132 66,116 59,616 52,069 58,800 69,765 71,553 58,396 Economic development 8,917 9,585 6,425 8,790 29,430 47,051 29,773 89,294 222,512 594,332
Operating grants and contributions 533,300 495,636 778,084 501,184 237,834 113,940 29,930 40,612 55,636 - Capital grants and contributions 50,000 98,986 461,879 270,551 213,471 386,851 545,682 616,252 918,282 1,673,477 Total governmental activities program revenues $ 4,484,644 $ 4,120,510 $ 4,690,227 $ 4,135,619 $ 3,736,973 $ 3,726,440 $ 4,159,453 $ 4,164,381 $ 4,867,498 $ 6,077,166
(Continued)
CITY OF UNION CITY, GEORGIA
CHANGES IN NET POSITIONLAST TEN FISCAL YEARS
2010 2011 2012 2013 2014 2015 2018 2019Fiscal Year
2016 2017
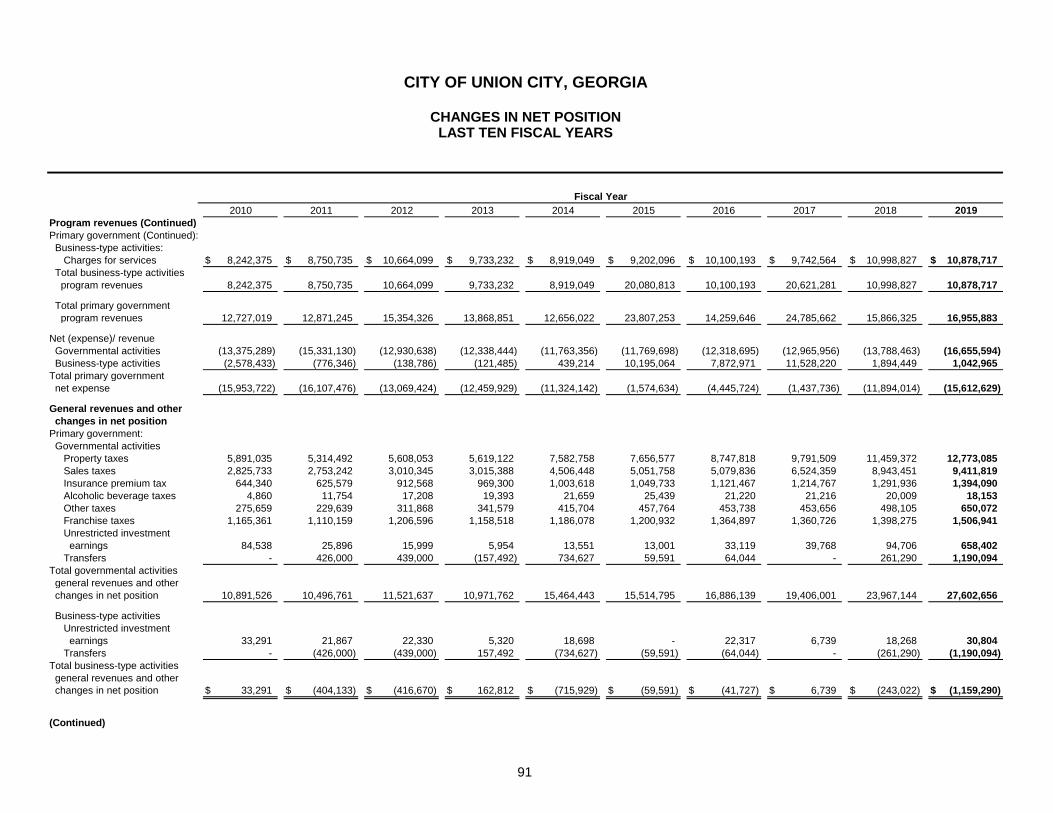
91
Program revenues (Continued)Primary government (Continued): Business-type activities: Charges for services $ 8,242,375 $ 8,750,735 $ 10,664,099 $ 9,733,232 $ 8,919,049 $ 9,202,096 $ 10,100,193 $ 9,742,564 $ 10,998,827 $ 10,878,717 Total business-type activities program revenues 8,242,375 8,750,735 10,664,099 9,733,232 8,919,049 20,080,813 10,100,193 20,621,281 10,998,827 10,878,717
Total primary government program revenues 12,727,019 12,871,245 15,354,326 13,868,851 12,656,022 23,807,253 14,259,646 24,785,662 15,866,325 16,955,883
Net (expense)/ revenue Governmental activities (13,375,289) (15,331,130) (12,930,638) (12,338,444) (11,763,356) (11,769,698) (12,318,695) (12,965,956) (13,788,463) (16,655,594) Business-type activities (2,578,433) (776,346) (138,786) (121,485) 439,214 10,195,064 7,872,971 11,528,220 1,894,449 1,042,965 Total primary government net expense (15,953,722) (16,107,476) (13,069,424) (12,459,929) (11,324,142) (1,574,634) (4,445,724) (1,437,736) (11,894,014) (15,612,629)
General revenues and other changes in net positionPrimary government: Governmental activities Property taxes 5,891,035 5,314,492 5,608,053 5,619,122 7,582,758 7,656,577 8,747,818 9,791,509 11,459,372 12,773,085 Sales taxes 2,825,733 2,753,242 3,010,345 3,015,388 4,506,448 5,051,758 5,079,836 6,524,359 8,943,451 9,411,819 Insurance premium tax 644,340 625,579 912,568 969,300 1,003,618 1,049,733 1,121,467 1,214,767 1,291,936 1,394,090 Alcoholic beverage taxes 4,860 11,754 17,208 19,393 21,659 25,439 21,220 21,216 20,009 18,153 Other taxes 275,659 229,639 311,868 341,579 415,704 457,764 453,738 453,656 498,105 650,072 Franchise taxes 1,165,361 1,110,159 1,206,596 1,158,518 1,186,078 1,200,932 1,364,897 1,360,726 1,398,275 1,506,941 Unrestricted investment earnings 84,538 25,896 15,999 5,954 13,551 13,001 33,119 39,768 94,706 658,402 Transfers - 426,000 439,000 (157,492) 734,627 59,591 64,044 - 261,290 1,190,094 Total governmental activities general revenues and other changes in net position 10,891,526 10,496,761 11,521,637 10,971,762 15,464,443 15,514,795 16,886,139 19,406,001 23,967,144 27,602,656
Business-type activities Unrestricted investment earnings 33,291 21,867 22,330 5,320 18,698 - 22,317 6,739 18,268 30,804 Transfers - (426,000) (439,000) 157,492 (734,627) (59,591) (64,044) - (261,290) (1,190,094) Total business-type activities general revenues and other changes in net position $ 33,291 $ (404,133) $ (416,670) $ 162,812 $ (715,929) $ (59,591) $ (41,727) $ 6,739 $ (243,022) $ (1,159,290)
(Continued)
CITY OF UNION CITY, GEORGIA
20192015 2018
CHANGES IN NET POSITIONLAST TEN FISCAL YEARS
2010Fiscal Year
2016 20172011 2012 2013 2014

92
Change in Net Position Governmental activities $ (2,483,763) $ (4,834,369) $ (1,409,001) $ (1,366,682) $ 3,701,087 $ 3,745,097 $ 4,567,444 $ 6,440,045 $ 10,178,681 $ 10,947,062 Business-type activities (2,545,142) (1,180,479) (555,456) 41,327 (276,715) 10,135,473 7,831,244 11,534,959 1,651,427 (116,325) Total primary government change in net position $ (5,028,905) $ (6,014,848) $ (1,964,457) $ (1,325,355) $ 3,424,372 $ 13,880,570 $ 12,398,688 $ 17,975,004 $ 11,830,108 $ 10,830,737
2010 2011 2012 2013 2014 2015 2018 2019
CITY OF UNION CITY, GEORGIA
CHANGES IN NET POSITIONLAST TEN FISCAL YEARS
Fiscal Year2016 2017

93
General Fund Reserved $ 1,753,827 $ - $ - $ - $ - $ - $ - $ - $ - $ - Unreserved 4,050,270 - - - - - - - - - Nonspendable - 3,340,966 1,069,319 294,883 299,762 374,667 371,200 452,918 275,945 278,451 Restricted - - - - - - - - - - Assigned - - - - - - - - - - Unassigned - 366,464 779,072 659,313 2,913,410 6,451,766 10,052,404 14,123,277 18,895,537 19,842,330 Total general fund $ 5,804,097 $ 3,707,430 $ 1,848,391 $ 954,196 $ 3,213,172 $ 6,826,433 $ 10,423,604 $ 14,576,195 $ 19,171,482 $ 20,120,781
All Other Governmental Funds Reserved $ 4,302,707 $ - $ - $ - $ - $ - $ - $ - $ - $ - Unreserved, reported in: Special revenue funds 996,461 - - - - - - - - - Capital projects funds 20,259 - - - - - - - - - Debt service funds 345,518 - - - - - - - - - Nonspendable, reported in: Special revenue funds - - 12,604 - - 198,204 165,170 165,170 155,000 155,000 Capital projects funds - - 6,250 - - - - 94,567 - 95,000 Restricted, reported in: Special revenue funds - 510,589 326,324 266,446 600,367 681,707 665,886 629,865 1,402,899 1,648,982 Capital projects funds - 2,350,414 1,974,957 1,148,622 957,267 1,102,894 1,047,549 5,929,135 9,183,187 11,858,586 Debt service funds - 346,559 341,615 319,864 321,572 323,813 327,562 1,835,962 7,857 9,292 Assigned, reported in: Special revenue funds - 239,065 219,307 195,904 195,904 195,858 195,745 195,651 69,222 - Unassigned, reported in: Special revenue funds - - - - (144,836) (144,836) (175,184) (158,617) (417,566) Capital projects funds - - - (37,592) (15,036) (177,870) (15,036) - (494,422) - Debt service fund - - - - - (38) - - - - Total all other governmental funds $ 5,664,945 $ 3,446,627 $ 2,881,057 $ 1,893,244 $ 1,915,238 $ 2,324,568 $ 2,242,040 $ 8,675,166 $ 10,165,126 $ 13,349,294
Notes: GASB 54 was implemented during fiscal year 2011.
2016 2017Fiscal Year
CITY OF UNION CITY, GEORGIA
FUND BALANCES, GOVERNMENTAL FUNDSLAST TEN FISCAL YEARS
2010 2011 2012 2013 2014 2015 2018 2019

94
Revenues Property taxes $ 5,543,663 $ 5,673,239 $ 5,571,360 $ 5,650,963 $ 7,315,208 $ 8,069,214 $ 8,751,035 $ 9,727,696 $ 11,438,225 $ 12,714,288 Sales taxes - - - - - - - 6,524,359 8,943,451 9,411,819 Other taxes 3,750,593 3,664,155 4,251,989 4,345,660 5,947,429 6,584,694 6,676,261 1,689,639 1,810,049 2,062,315 Charges for services 509,548 548,195 479,612 471,330 506,748 464,498 481,364 643,280 558,076 867,050 Licenses and permits 1,647,128 1,377,168 1,439,821 1,632,620 1,778,056 2,038,210 2,252,917 2,217,042 2,630,270 2,649,636 Intergovernmental 168,100 223,481 873,332 759,641 436,801 500,791 575,612 656,864 973,918 771,987 Franchise taxes 1,165,361 1,110,159 1,206,596 1,158,518 1,186,078 1,200,932 1,364,897 1,360,726 1,398,275 1,506,941 Fines and forfeitures 1,589,500 1,484,361 1,404,660 1,134,879 890,810 642,156 730,864 550,815 589,873 729,045 Interest revenue 84,538 25,896 15,999 5,954 13,551 13,001 33,119 39,768 94,707 658,402 Rental income 12,609 13,030 13,785 20,425 18,870 20,311 18,346 19,461 30,822 22,436 Other revenues 557,758 474,275 479,017 116,724 105,688 60,474 100,350 76,919 84,539 135,522 Total revenues $ 15,028,798 $ 14,593,959 $ 15,736,171 $ 15,296,714 $ 18,199,239 $ 19,594,281 $ 20,984,765 $ 23,506,569 $ 28,552,205 $ 31,529,441
Expenditures Current: General government $ 2,573,528 $ 2,174,146 $ 2,137,715 $ 2,050,824 $ 1,927,849 $ 2,152,585 $ 2,582,460 $ 2,858,582 $ 3,236,922 $ 3,926,810 Judicial 342,954 384,047 377,543 360,126 341,796 298,711 357,346 361,155 340,609 397,435 Public safety 9,625,312 9,703,075 9,673,917 9,224,427 8,825,056 8,711,449 9,155,803 9,370,391 10,107,383 10,915,831 Public works 1,713,341 1,727,828 1,574,058 1,390,823 1,423,334 1,584,853 1,799,620 1,708,825 1,783,430 2,750,999 Community services - - - - - - - - - - Parks and recreation 245,778 376,373 338,913 368,894 374,883 359,452 384,182 453,919 477,397 766,940 Economic development 932,850 643,677 796,900 817,605 751,348 710,296 684,237 646,318 852,933 934,250 Capital outlay 2,533,517 4,083,991 1,576,565 1,393,579 507,667 403,015 735,032 1,811,510 3,870,185 7,799,011 Debt service: Principal 6,180,687 1,079,492 1,623,662 1,728,241 1,772,797 1,310,580 1,458,601 1,315,988 1,966,332 1,413,753 Interest 856,817 662,315 660,550 617,203 568,294 280,212 356,885 313,757 518,758 503,440 Bond issuance costs 176,033 - - - - 183,416 - 198,818 664 - Total expenditures 25,180,817 20,834,944 18,759,823 17,951,722 16,493,024 15,994,569 17,514,166 19,039,263 23,154,613 29,408,469 Excess (deficiency) of revenues over (under) expenditures (10,152,019) (6,240,985) (3,023,652) (2,655,008) 1,706,215 3,599,712 3,470,599 4,467,306 5,397,592 2,120,972
(Continued)
Fiscal Year
CITY OF UNION CITY, GEORGIA
CHANGES IN FUND BALANCES, GOVERNMENTAL FUNDSLAST TEN FISCAL YEARS
2010 2011 2012 2013 2014 2015 2018 20192016 2017

95
Other Financing Sources (Uses)Bond issuance $ 5,065,000 $ - $ - $ - $ - $ 8,560,000 $ - $ 5,000,000 $ - $ - Premium on bonds 101,052 - - - - 525,671 - 767,177 - - Payment to escrow agent - - - - - (8,902,255) - - - - Capital lease - 1,500,000 160,043 - - - - 351,234 426,365 822,401 Transfers in 6,406,225 2,656,524 2,954,516 3,174,200 3,296,255 2,741,365 3,260,132 2,877,080 4,088,570 9,973,312 Transfers out (6,406,225) (2,230,524) (2,515,516) (2,401,200) (2,561,628) (2,681,774) (3,196,088) (2,877,080) (3,827,280) (8,783,218) Total other financing sources (uses) 5,166,052 1,926,000 599,043 773,000 734,627 243,007 64,044 6,118,411 687,655 2,012,495
Net change in fund balances $ (4,985,967) $ (4,314,985) $ (2,424,609) $ (1,882,008) $ 2,440,842 $ 3,842,719 $ 3,534,643 $ 10,585,717 $ 6,085,247 $ 4,133,467
Debt service as a percentage of noncapital expenditures 30.1% 8.9% 12.9% 13.9% 14.8% 9.9% 10.2% 9.6% 12.7% 8.4%
2015 20182010 2011 2012 2013 2014Fiscal Year
CITY OF UNION CITY, GEORGIA
CHANGES IN FUND BALANCES - GOVERNMENTAL FUNDSLAST TEN FISCAL YEARS
20192016 2017

96
AssessedTotal Value as a
Tax Direct % ofYear Tax Rate Actual Value
2010 $ 479,324,440 $ 24,496,587 $ 27,643,090 $ 5,516,443 $ 536,980,560 $ 1,342,451,400 9.50 40%2011 435,644,030 55,138,458 25,604,340 5,532,947 521,919,775 1,304,799,438 10.24 40%2012 451,574,153 50,036,827 26,687,160 6,754,886 535,053,026 1,337,632,565 10.60 40%2013 433,339,950 38,398,892 27,653,800 6,905,395 506,298,037 1,265,745,093 15.60 40%2014 428,501,870 29,682,537 21,982,160 7,116,549 487,283,116 1,218,207,790 15.69 40%2015 483,920,600 43,726,218 14,538,020 7,250,890 549,435,728 1,373,589,320 15.69 40%2016 513,015,770 93,676,001 (a) 10,305,160 6,870,151 623,867,082 1,559,667,705 15.69 40%2017 590,981,340 76,462,970 7,448,103 8,163,077 683,055,490 1,707,638,725 16.43 40%2018 632,007,980 145,918,360 5,617,774 7,572,362 791,116,476 1,977,791,190 14.95 40%2019 716,739,300 144,409,005 4,512,549 12,370,634 878,031,488 2,195,078,720 14.33 40%
Source: Fulton County Tax Assessor
(a) Increase is due to the relocation of Google, Inc. to Union City. This added $37,677,981 of additional assessed value for personal property.
Taxable ValueActual
Estimated
Property (2)
CITY OF UNION CITY, GEORGIA
ASSESSED VALUE AND ESTIMATED ACTUAL VALUE OF TAXABLE PROPERTYLAST TEN FISCAL YEARS
Real Property Vehicles (3)Motor
Personal Property
PrivatelyOwned
Public Utilities
AssessedValue
Total TaxableAssessed
Value
Total Property

97
TotalDirect and
Tax Operating Debt State of Fulton County OverlappingDigest Year Millage Service Total Georgia County School System Millage Rates
2010 7.650 1.850 9.500 0.25 10.28 18.50 38.532011 8.165 2.073 10.238 0.25 10.55 18.50 39.542012 8.331 2.268 10.599 0.20 10.55 18.50 39.852013 13.178 2.420 15.598 0.15 10.48 18.50 44.732014 13.122 2.570 15.692 0.15 12.05 18.50 46.392015 13.412 2.280 15.692 0.05 10.75 18.50 44.992016 14.572 1.120 15.692 0.00 10.70 18.48 34.182017 14.665 1.760 16.425 0.00 10.63 18.55 45.602018 13.322 1.630 14.952 0.00 10.43 17.80 43.182019 12.952 1.374 14.326 0.00 10.119 17.80 42.24
City of Union City
CITY OF UNION CITY, GEORGIA
DIRECT AND OVERLAPPING PROPERTY TAX RATESLAST TEN TAX DIGEST YEARS
(Rate per $1,000 of assessed value)
Direct Rates Overlapping Rates

98
Fiscal Year Ended Percentage Percentage
August 31, of Levy of Levy
2010 $ 5,316,893 $ 4,803,669 90.35% $ 475,152 $ 5,278,821 99.28% $ 38,072 2011 4,759,160 4,533,053 95.25% 200,364 4,733,417 99.46% 25,743 2012 5,102,178 4,797,313 94.02% 255,095 5,052,408 99.02% 49,770 2013 5,351,680 5,235,029 97.82% 82,822 5,317,851 99.37% 33,829 2014 6,989,117 6,503,551 93.05% 448,353 6,951,904 99.47% 37,213 2015 7,011,056 6,811,199 97.15% 152,220 6,963,419 99.32% 47,637 2016 8,176,456 7,983,582 97.64% 122,141 8,105,723 99.13% 70,733 2017 9,219,975 9,090,025 98.59% 56,959 9,146,984 99.21% 72,991 2018 10,768,051 10,521,699 97.71% 135,030 10,656,729 98.97% 111,322 2019 11,855,967 11,657,143 98.32% - 11,657,143 98.32% 198,823
Amount
Total Collections to Date
OutstandingTotal Taxes
CITY OF UNION CITY, GEORGIA
PROPERTY TAX LEVIES AND COLLECTIONSLAST TEN FISCAL YEARS
Fiscal Yearfor the
Taxes LeviedTotal
Amount
Fiscal Year of LevyCollected within the
Collected inSubsequent
Years

99
Percentage of Percentage of Total Taxable Total Taxable
Assessed AssessedTaxpayer Rank Value Rank Value
Development Authority of Fulton County $ 114,489,494 1 13.04% $ 18,404,360 1 3.43%Majestic South Fulton Bldg 4 21,199,040 2 2.41%Google Inc 20,538,838 3 2.34%ROC III Ga Legacy Ridge LLC 15,838,080 4 1.80%PPF Industrial 5390 Hunter ROA 11,200,000 5 1.28%Triangle Hidden Lake Inc 10,702,240 6 1.22%TBB Evergreen Commons LLC 10,408,800 7 1.19%Kellogg Sales Company 9,937,484 8 1.13%USEF I85 Distribution Center 9,121,440 9 1.04%South Fulton Parkway LLC 9,024,760 10 1.03% 7,069,400 6 1.32%Thurman Investments, LLC 9,201,680 2 1.71%Wal Mart Stores, Inc. 8,355,060 3 1.56%CM Buffington Road, LLC 7,990,000 4 1.49%Wyndsor Forest Apartments, LLC 7,720,040 5 1.44%D.L. Claborn 6,545,340 7 1.22%W D O P Sub 1 LP 6,486,820 8 1.21%Shannon Mall Investments, LLC 6,293,290 9 1.17%Summer Glen Associates 6,120,000 10 1.14%
$ 232,460,176 26.48% $ 84,185,990 15.69%
2019 2010
CITY OF UNION CITY, GEORGIA
PRINCIPAL PROPERTY TAXPAYERSCURRENT YEAR AND NINE YEARS AGO
AssessedValue
TaxableAssessed
Value
Taxable

100
Percentage Percentageof Estimated of EstimatedActual Value Actual Value
Fiscal of Taxable of TaxableYear Property Property
2010 $ 12,900,000 $ 3,310,000 $ 773,313 $ - 1.27% $ 1,001.32 $ - $ 16,983,313 1.27% 5.30% $ 1,001.32 2011 12,190,000 3,015,000 2,198,821 - 1.33% 894.52 - 17,403,821 1.33% 4.74% 894.52 2012 11,470,000 2,730,000 1,628,305 111,897 1.19% 793.87 11,275,000 27,215,202 2.03% 7.35% 1,355.41 2013 10,715,000 2,410,000 1,049,170 38,464 1.12% 693.27 10,840,000 25,052,634 1.98% 6.64% 1,222.02 2014 10,025,521 2,060,000 459,164 - 1.03% 613.19 10,400,000 22,944,685 1.88% 6.50% 1,121.55 2015 9,963,689 1,675,000 373,584 - 0.87% 592.91 9,827,833 21,840,106 1.59% 6.25% 1,077.99 2016 8,924,160 1,255,000 284,983 - 0.67% 502.96 9,379,531 19,843,674 1.27% 5.75% 953.79 2017 13,913,899 805,000 1,203,995 - 0.93% 774.46 8,920,888 24,843,782 1.45% 6.99% 1,208.36 2018 13,085,258 - 425,293 - 0.68% 632.22 8,451,827 21,962,378 1.11% 5.84% 1,027.72 2019 12,162,860 - 658,941 - 0.00% 586.19 7,967,324 20,789,125 0.95% 5.19% 950.45
Governmental Activities
CITY OF UNION CITY, GEORGIA
RATIO OF OUTSTANDING DEBT BY TYPELAST TEN FISCAL YEARS
Business-TypeActivities
GeneralObligation
BondsCertificates ofParticipation
Percentageof Personal
Income Per CapitaLeaseCapital
WaterRevenueBondsPer CapitaPayable
NotesGovernmentTotal Primary

101
FiscalYear
2010 16,961 $ 536,980,560 $ 12,900,000 $ 1,161,632 $ 11,738,368 2.19% $ 692.08 2011 19,456 521,919,775 12,190,000 792,417 11,397,583 2.18% 585.81 2012 20,079 535,053,026 11,470,000 786,676 10,683,324 2.00% 532.06 2013 20,501 506,298,037 10,715,000 350,864 10,364,136 2.05% 505.54 2014 20,458 487,283,116 10,025,521 351,615 9,673,906 1.99% 472.87 2015 20,260 549,435,728 9,963,689 323,813 9,639,876 1.75% 475.81 2016 20,805 623,867,082 8,924,160 327,720 8,596,440 1.38% 413.19 2017 20,560 683,055,490 13,913,899 435,044 13,478,855 1.97% 655.59 2018 21,370 791,116,476 13,085,258 7,857 13,077,401 1.65% 611.95 2019 21,873 878,031,488 12,162,860 9,292 12,153,568 1.38% 555.64
RATIO OF GENERAL BONDED DEBT OUTSTANDING
CITY OF UNION CITY, GEORGIA
General Bonded Debt Outstanding
Net Bonded DebtRatio of
to Assessed Value
Net Bonded Debt Per
Capita
LAST TEN FISCAL YEARS
Assessed ValueProperty
DebtNet Bonded
Population DebtGross Bonded
FundsDebt Service
Restricted

102
Debt Limit $ 53,698,056 $ 52,191,978 $ 56,858,181 $ 49,493,881 $ 48,728,312 $ 54,943,573 $ 62,386,708 $ 68,883,979 $ 79,111,648 $ 87,803,149
Total net debt applicable to limit 15,048,433 14,412,583 13,413,324 12,774,136 12,223,113 11,314,876 9,581,440 14,283,855 13,077,401 12,153,568 Legal Debt Margin $ 43,101,899 $ 37,779,395 $ 43,444,857 $ 36,719,745 $ 36,505,199 $ 43,628,697 $ 52,805,268 $ 54,600,124 66,034,247 $ 75,649,581
Total net debt applicable to the limit as a percentage of debt limit 28.52% 27.61% 23.59% 25.81% 25.08% 20.59% 15.36% 20.74% 16.53% 13.84%
Assessed Value $ 878,031,488 Debt limit (10% of assessed value) 87,803,149 Debt applicable to limit: General obligation bonds and certificates of participation 12,162,860 Less: Amount set aside for repayment of general obligation debt (9,292) Total net debt applicable to limit 12,153,568 Legal debt margin $ 75,649,581
Notes: Under state finance law, the City's outstanding general obligation debt should not exceed 10% of total assessed property value. By law, the general obligation debt subject to the limitation may be offset by amounts set aside for repaying the general obligation bonds.
2016 2019
CITY OF UNION CITY, GEORGIA
LEGAL DEBT MARGIN INFORMATIONLAST TEN FISCAL YEARS
2017Fiscal Year
20182010 2011 2012 2013 2014 2015
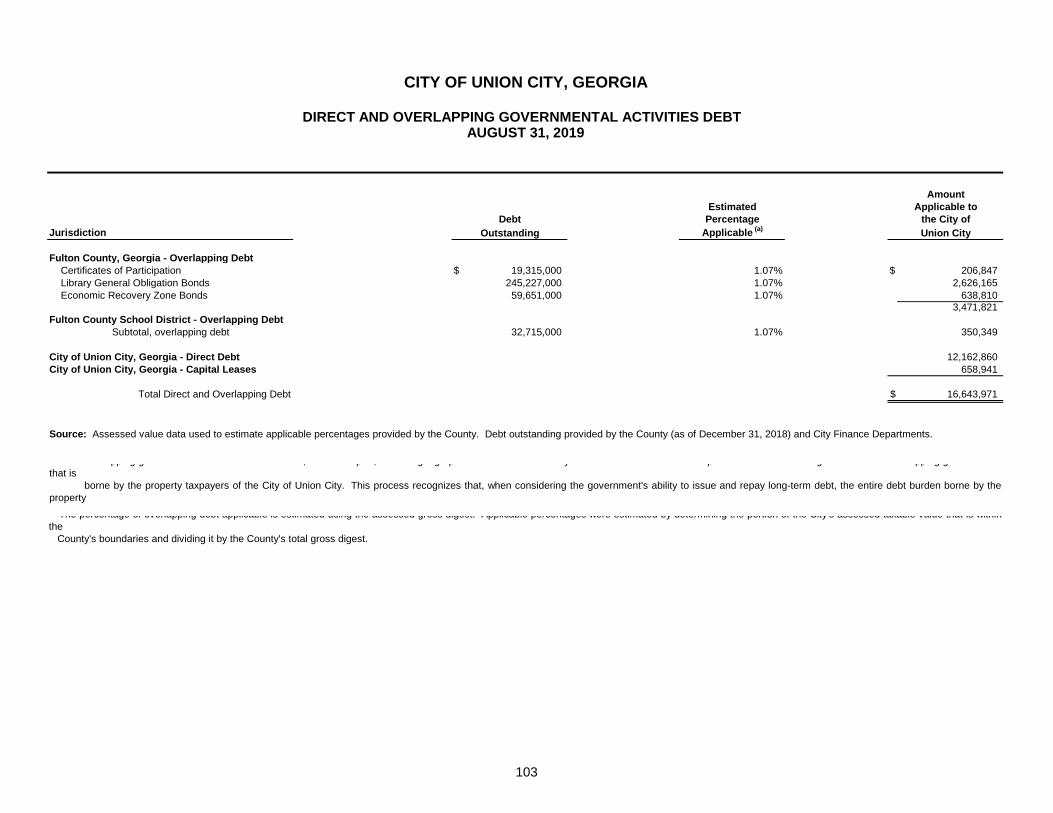
103
EstimatedPercentage
Jurisdiction Applicable (a)
Fulton County, Georgia - Overlapping Debt Certificates of Participation $ 19,315,000 1.07% $ 206,847 Library General Obligation Bonds 245,227,000 1.07% 2,626,165 Economic Recovery Zone Bonds 59,651,000 1.07% 638,810
3,471,821 Fulton County School District - Overlapping Debt
Subtotal, overlapping debt 32,715,000 1.07% 350,349
City of Union City, Georgia - Direct Debt 12,162,860 City of Union City, Georgia - Capital Leases 658,941
Total Direct and Overlapping Debt $ 16,643,971
Source: Assessed value data used to estimate applicable percentages provided by the County. Debt outstanding provided by the County (as of December 31, 2018) and City Finance Departments.
pp g g , p , g g p y p g pp g gthat is
borne by the property taxpayers of the City of Union City. This process recognizes that, when considering the government's ability to issue and repay long-term debt, the entire debt burden borne by theproperty
The percentage of overlapping debt applicable is estimated using the assessed gross digest. Applicable percentages were estimated by determining the portion of the City s assessed taxable value that is withinthe County's boundaries and dividing it by the County's total gross digest.
CITY OF UNION CITY, GEORGIA
DIRECT AND OVERLAPPING GOVERNMENTAL ACTIVITIES DEBT AUGUST 31, 2019
DebtOutstanding
AmountApplicable to
the City ofUnion City

104
FiscalYear
2010 $ 4,952,379 $ 5,026,404 $ (74,025) $ 5,040,000 (1) $ 168,114 (0.01) 2011 5,560,899 4,443,345 1,117,554 - - - 2012 6,708,111 4,532,630 2,175,481 - 77,637 (2) 28.02 2013 6,511,408 4,885,824 (3) 1,625,584 435,000 358,325 2.05 2014 6,509,855 5,375,472 1,134,383 440,000 349,626 1.44 2015 6,919,542 5,218,226 1,701,316 450,000 342,466 2.15 2016 7,445,937 5,794,179 1,651,758 460,000 341,989 2.06 2017 7,057,558 5,387,243 1,670,315 470,000 332,024 2.08 2018 8,077,227 5,335,102 2,742,125 480,000 319,814 3.43 2019 7,807,636 5,973,859 1,833,777 495,000 306,884 2.29
(1) Bonds were paid off in 2010.(2) 2012 Series Bond issued during FY 2012.
Notes:Details regarding the City's outstanding debt can be found in the notes to the financial statements.Utility service charges include tap fees, but exclude interest.Operating expenses do not include interest, depreciation, or amortization expense.
(3) Operating expenses include one time fee of $6,374,613 paid to Fulton County for additional capacity at Camp Creek Water Reclamation Facility.
Net
Principal CoverageInterestRevenueAvailable
Charges Expenses
CITY OF UNION CITY, GEORGIA
PLEDGED-REVENUE COVERAGE LAST TEN YEARS
UtilityService
Less:Operating

106
Percentage of Percentage ofTotal City Total City
Business Employees Rank Employment Employees Rank Employment
Wal Mart 2893 1 26.18% 330 2 6.00%Excel Inc 1302 2 11.78% 247 3 4.49%DIVERSE STAFFING 640 3 5.79%AURORA PARTS & ACCESSORIES, LLC 258 4 2.34%XPO LOGISTICS WORLDWIDE, INC 250 5 2.26%PRUITT HEALTH-CHRISTIAN CITY 235 6 2.13%AMERICAN BUILDING SUPPLY 227 7 2.05%DENDREON PHARMACEUTICALS, INC 221 8 2.00%AMAZON.COM SERVICES INC 210 9 1.90%UFP UNION CITY, LLC 161 10 1.46%CHRISTIAN CITY 355 1 6.45%KROGER 199 4 3.62%DSC LOGISTICS 165 5 3.00%NISSAN OF UNION CITY 120 6 2.18%SADDLE CREEK CORP 115 7 2.09%UFP EASTERN DIVISION INC 110 8 2.00%MORTENSON WOODWORKING 92 9 1.67%NEWELL RUBBERMAID 91 10 1.65%
Source: Union City Business Permit Renewals
2019 2010
CITY OF UNION CITY, GEORGIA
PRINCIPAL EMPLOYERS CURRENT YEAR AND NINE YEARS AGO

107
2010 2011 2012 2013 2014 2015 2016 2017 2018 2019Function/ProgramGeneral Government Administration 2 1 3 3 3 2 2 2 4 4 City Clerk 2 2 2 2 2 1 2 1 1 1 Finance 4 4 4 4 4 5 6 6 4 4 Finance- water and sewer 5 5 6 6 5 4 4 4 5 4 Human Resources 2 2 1 2 2 1 2 2 2 3 Information Technology 0 1 2 2 2 1 1 1 1 1
Judicial Municipal Court 4 4 4 4 4 4 4 4 5 4
Housing and Development Planning Department 3 3 2 1 2 3 3 3 4 5
Public Safety Police 62 61 61 57 54 58 65 63 64 68 Fire 52 49 51 46 46 47 50 48 50 57 Jail 44 50 42 40 1 1 1 1 1 1 E-911 Communications 10 10 9 10 8 0 - - - -
Public Works Building and Grounds 3 3 4 3 3 1 4 3 3 1 Code Enforcement 4 4 4 4 3 2 3 3 3 3 Roads and Bridges 20 17 16 12 13 13 14 14 15 22 Water and Sewer 12 10 9 10 10 9 9 9 9 9
Parks and Recreation 3 3 6 6 5 4 5 4 9 10
Operations 1 2 - 0 1 1 1 2 2 3
Total 233 231 226 212 168 157 176 170 182 200
Source: Human Resources
Notes: All full-time employees, except fire employees, are scheduled to work 2,080 hours per year (including vacation and sick). Fire Department employees are scheduled to work 2,750 hours per year (including sick and vacation).
Fiscal Year
CITY OF UNION CITY, GEORGIA
FULL-TIME EQUIVALENT CITY EMPLOYEES BY FUNCTION/PROGRAMLAST TEN FISCAL YEARS
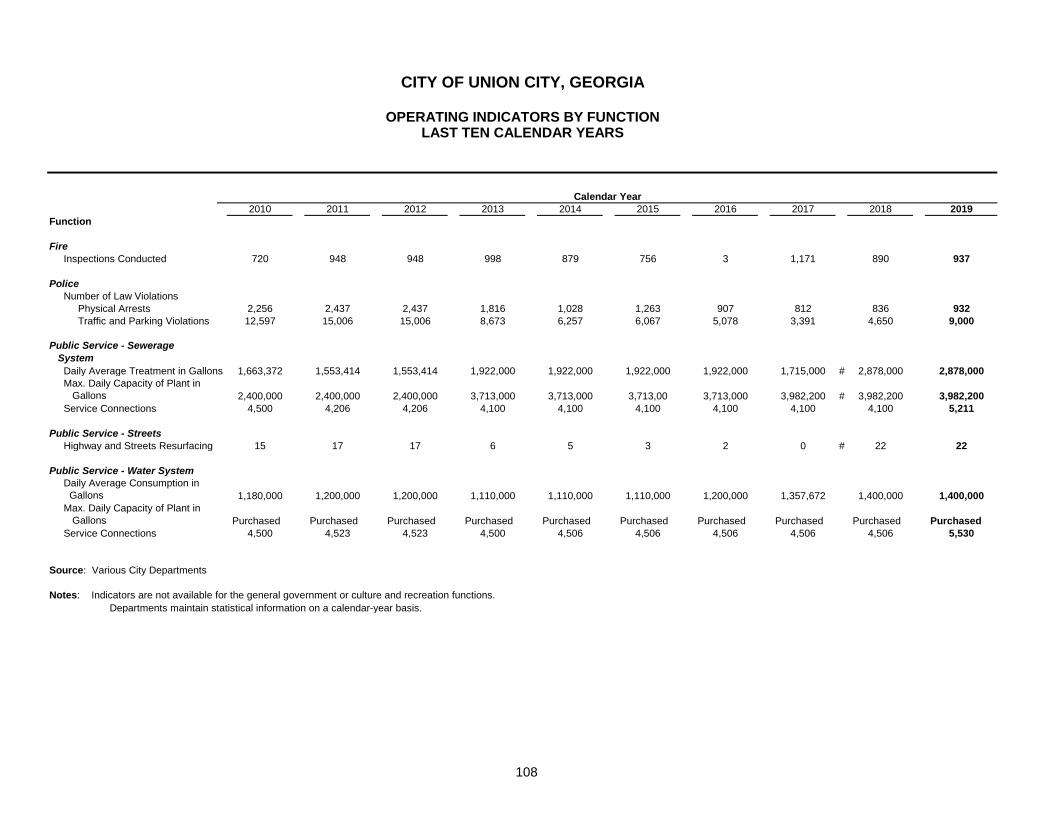
108
2010 2011 2012 2013 2014 2015 2016 2017 2018 2019Function
Fire Inspections Conducted 720 948 948 998 879 756 3 1,171 890 937
Police Number of Law Violations Physical Arrests 2,256 2,437 2,437 1,816 1,028 1,263 907 812 836 932 Traffic and Parking Violations 12,597 15,006 15,006 8,673 6,257 6,067 5,078 3,391 4,650 9,000
Public Service - Sewerage System Daily Average Treatment in Gallons 1,663,372 1,553,414 1,553,414 1,922,000 1,922,000 1,922,000 1,922,000 1,715,000 # 2,878,000 2,878,000 Max. Daily Capacity of Plant in Gallons 2,400,000 2,400,000 2,400,000 3,713,000 3,713,000 3,713,00 3,713,000 3,982,200 # 3,982,200 3,982,200 Service Connections 4,500 4,206 4,206 4,100 4,100 4,100 4,100 4,100 4,100 5,211
Public Service - Streets Highway and Streets Resurfacing 15 17 17 6 5 3 2 0 # 22 22
Public Service - Water System Daily Average Consumption in Gallons 1,180,000 1,200,000 1,200,000 1,110,000 1,110,000 1,110,000 1,200,000 1,357,672 1,400,000 1,400,000 Max. Daily Capacity of Plant in Gallons Purchased Purchased Purchased Purchased Purchased Purchased Purchased Purchased Purchased Purchased Service Connections 4,500 4,523 4,523 4,500 4,506 4,506 4,506 4,506 4,506 5,530
Source: Various City Departments
Notes: Indicators are not available for the general government or culture and recreation functions. Departments maintain statistical information on a calendar-year basis.
Calendar Year
CITY OF UNION CITY, GEORGIA
OPERATING INDICATORS BY FUNCTIONLAST TEN CALENDAR YEARS

109
2010 2011 2012 2013 2014 2015 2016 2017 2018 2019Function/Program
Culture and Recreation Park Acreage 22 22 34 34 34 34 34 34 55 55 Parks 2 2 2 2 2 2 2 2 2 2 Tennis Courts 0 0 0 0 0 0 0 0 1 1 Baseball Fields 2 2 2 5 5 5 5 5 5 5 Community Centers & Depot 2 2 2 2 2 2 2 2 2 3
Fire Fire Stations 3 3 3 3 3 3 3 3 3 3
Police Stations 1 1 1 1 1 1 1 1 1 1 Patrol Units 48 48 48 48 56 56 64 68 44 61 Patrol Zones 5 5 5 5 5 5 5 5 5 5
Public Service - Sewerage System Sanitary Sewer (Miles) 79.9 79.9 79.9 79.9 90.0 90 90 90 90 90 Treatment Plants 0 0 0 0 0 0 0 0 0 0
Public Service - Streets Streets (Miles) 115.1 115.1 115.1 115.1 115.7 115.7 115.7 115.7 115.7 115.7 Streets (Lights) 912 912 1,068 1,188 1,188 1188 1223 1205 1236 1242
Public Service - Water System Water Mains (Miles) 69 69 69 68 80 80 80 80 80 80 Number of Fire Hydrants 538 540 540 565 591 591 591 591 591 591
Source: Various City Departments
Fiscal Year
CITY OF UNION CITY, GEORGIA
CAPITAL ASSETS STATISTICS BY FUNCTIONLAST TEN FISCAL YEARS

COMPLIANCE SECTION

300 MULBERRY STREET, SUITE 300 • POST OFFICE BOX 1877 • MACON, GEORGIA 31202-1877 • 478-464-8000 • FAX 478-464-8051 • www.mjcpa.com MEMBERS OF THE AMERICAN INSTITUTE OF CERTIFIED PUBLIC ACCOUNTANTS
INDEPENDENT AUDITOR'S REPORT ON INTERNAL CONTROL OVER
FINANCIAL REPORTING AND ON COMPLIANCE AND OTHER MATTERS BASED ON AN AUDIT OF FINANCIAL STATEMENTS PERFORMED IN
ACCORDANCE WITH GOVERNMENT AUDITING STANDARDS To the Honorable Mayor and Members of the City Council Union City, Georgia We have audited, in accordance with the auditing standards generally accepted in the United States of America and the standards applicable to financial audits contained in Government Auditing Standards issued by the Comptroller General of the United States, the financial statements of the governmental activities, the business-type activities, the discretely presented component unit, each major fund, and the aggregate remaining fund information of the City of Union City, Georgia (the “City”), as of and for the year ended August 31, 2019, and the related notes to the financial statements, which collectively comprise the City’s basic financial statements and have issued our report thereon dated March 26, 2020. Internal Control Over Financial Reporting In planning and performing our audit of the financial statements, we considered the City's internal control over financial reporting (internal control) to determine the audit procedures that are appropriate in the circumstances for the purpose of expressing our opinions on the financial statements, but not for the purpose of expressing an opinion on the effectiveness of the City’s internal control. Accordingly, we do not express an opinion on the effectiveness of the City’s internal control. A deficiency in internal control exists when the design or operation of a control does not allow management or employees, in the normal course of performing their assigned functions, to prevent, or detect and correct, misstatements on a timely basis. A material weakness is a deficiency, or a combination of deficiencies, in internal control such that there is a reasonable possibility that a material misstatement of the entity’s financial statements will not be prevented, or detected and corrected on a timely basis. A significant deficiency is a deficiency, or a combination of deficiencies, in internal control that is less severe than a material weakness, yet important enough to merit attention by those charged with governance. Our consideration of internal control was for the limited purpose described in the first paragraph of this section and was not designed to identify all deficiencies in internal control that might be material weaknesses or significant deficiencies. Given these limitations, during our audit we did not identify any deficiencies in internal control that we consider to be material weaknesses. However, material weaknesses may exist that have not been identified.

111
Compliance and Other Matters As part of obtaining reasonable assurance about whether the City's financial statements are free from material misstatement, we performed tests of its compliance with certain provisions of laws, regulations, contracts, and grant agreements, noncompliance with which could have a direct and material effect on the determination of financial statement amounts. However, providing an opinion on compliance with those provisions was not an objective of our audit, and accordingly, we do not express such an opinion. The results of our tests disclosed no instances of noncompliance or other matters that are required to be reported under Government Auditing Standards. Purpose of this Report The purpose of this report is solely to describe the scope of our testing of internal control and compliance and the results of that testing, and not to provide an opinion on the effectiveness of the entity’s internal control or on compliance. This report is an integral part of an audit performed in accordance with Government Auditing Standards in considering the entity’s internal control and compliance. Accordingly, this communication is not suitable for any other purpose.
Macon, Georgia March 26, 2020

300 MULBERRY STREET, SUITE 300 • POST OFFICE BOX 1877 • MACON, GEORGIA 31202-1877 • 478-464-8000 • FAX 478-464-8051 • www.mjcpa.com MEMBERS OF THE AMERICAN INSTITUTE OF CERTIFIED PUBLIC ACCOUNTANTS
INDEPENDENT AUDITOR’S REPORT ON COMPLIANCE FOR EACH MAJOR FEDERAL PROGRAM; REPORT ON INTERNAL CONTROL
OVER COMPLIANCE; AND REPORT ON THE SCHEDULE OF EXPENDITURES OF FEDERAL AWARDS REQUIRED BY THE UNIFORM GUIDANCE
To the Honorable Mayor and Members of the City Council Union City, Georgia Report on Compliance for Each Major Federal Program We have audited the City of Union City, Georgia’s (the "City") compliance with the types of compliance requirements described in the OMB Compliance Supplement that could have a direct and material effect on each of the City’s major federal programs for the fiscal year ended August 31, 2019. The City’s major federal programs are identified in the summary of auditor’s results section of the accompanying schedule of findings and questioned costs. Management’s Responsibility Management is responsible for compliance with federal statutes, regulations, and the terms and conditions of its federal awards applicable to its federal programs. Auditor’s Responsibility Our responsibility is to express an opinion on compliance for each of the City’s major federal programs based on our audit of the types of compliance requirements referred to above. We conducted our audit of compliance in accordance with auditing standards generally accepted in the United States of America; the standards applicable to financial audits contained in Government Auditing Standards, issued by the Comptroller General of the United States; and the audit requirements of Title 2 U.S. Code of Federal Regulations Part 200, Uniform Administrative Requirements, Cost Principles, and Audit Requirements for Federal Awards (Uniform Guidance). Those standards and the Uniform Guidance require that we plan and perform the audit to obtain reasonable assurance about whether noncompliance with the types of compliance requirements referred to above that could have a direct and material effect on a major federal program occurred. An audit includes examining, on a test basis, evidence about the City’s compliance with those requirements and performing such other procedures as we considered necessary in the circumstances. We believe that our audit provides a reasonable basis for our opinion on compliance for each major federal program. However, our audit does not provide a legal determination of the City's compliance.

113
Opinion on Each Major Federal Program In our opinion, the City complied, in all material respects, with the types of compliance requirements referred to above that could have a direct and material effect on each of its major federal programs for the year ended August 31, 2019. Report on Internal Control Over Compliance Management of the City is responsible for establishing and maintaining effective internal control over compliance with the types of compliance requirements referred to above. In planning and performing our audit of compliance, we considered the City’s internal control over compliance with the types of requirements that could have a direct and material effect on each major federal program to determine the auditing procedures that are appropriate in the circumstances for the purpose of expressing our opinion on compliance for each major federal program and to test and report on internal control over compliance in accordance with Uniform Guidance, but not for the purpose of expressing an opinion on the effectiveness of internal control over compliance. Accordingly, we do not express an opinion on the effectiveness of the City’s internal control over compliance. A deficiency in internal control over compliance exists when the design or operation of a control over compliance does not allow management or employees, in the normal course of performing their assigned functions, to prevent, or detect and correct, noncompliance with a type of compliance requirement of a federal program on a timely basis. A material weakness in internal control over compliance is a deficiency, or combination of deficiencies, in internal control over compliance, such that there is a reasonable possibility that material noncompliance with a type of compliance requirement of a federal program will not be prevented, or detected and corrected, on a timely basis. A significant deficiency in internal control over compliance is a deficiency, or a combination of deficiencies, in internal control over compliance with a type of compliance requirement of a federal program that is less severe than a material weakness in internal control over compliance, yet important enough to merit attention by those charged with governance. Our consideration of the internal control over compliance was for the limited purpose described in the first paragraph of this section and was not designed to identify all deficiencies in internal control over compliance that might be material weaknesses or significant deficiencies. We did not identify any deficiencies in internal control over compliance that we consider to be material weaknesses. However, material weaknesses may exist that have not been identified.

114
The purpose of this report on internal control over compliance is solely to describe the scope of our testing of internal control over compliance and the results of that testing based on the requirements of the Uniform Guidance. Accordingly, this report is not suitable for any other purpose. Macon, Georgia March 26, 2020

115
Federal GrantCFDA Identification
Number Number
U.S. Department of Housing and Urban Development(Passed through Fulton County, Georgia)
State Administered CDBG ClusterCommunity Development Block Grant 14.218 B11UC130003 $ 46,548 $ -
Total U.S. Department of Housing and Urban Development 46,548 -
U.S Department of Homeland SecurityStaffing for Adequate Fire and Emergency Repsonse 97.083 EMW-2017-FH-00494 202,436 -
Total U.S. Department of Homeland Security 202,436 -
U.S Department of Transportation(Passed through Georgia Department of Transportation)Highway Planning and Construction Cluster
Highway Plannning and Construction 20.205 CSTEE-0006-00(644) 500,000 - Highway Plannning and Construction 20.205 CSTEE-0009-00(060) 327,796 -
Total U.S. Department of Transportation 827,796 -
U.S Department of JusticeJustice Assistance Grant 16.738 2018-DJ-BX-0396 16,914 - Justice Assistance Grant 16.738 2017-DJ-BX-0824 15,690 -
Total U.S. Department of Justice 32,604 -
Total Expenditures of Federal Awards $ 1,109,384 $ -
Federal Grantor/Pass-through
FOR THE YEAR ENDED AUGUST 31, 2019SCHEDULE OF EXPENDITURES OF FEDERAL AWARDS
CITY OF UNION CITY, GEORGIA
Grantor/Program Title Expenditures SubrecipientsProvided to
Amount

116
CITY OF UNION CITY, GEORGIA
NOTES TO SCHEDULE OF EXPENDITURES OF FEDERAL AWARDS FOR THE FISCAL YEAR ENDED AUGUST 31, 2019
NOTE 1. BASIS OF PRESENTATION
The schedule of expenditures of federal awards includes the federal grant activity of the City of Union City, Georgia (the “City”) and is presented on the accrual basis of accounting.
The information in this schedule is presented in accordance with the requirements of Uniform Administrative Requirements, Cost Principles, and Audit Requirements for Federal, Therefore, some amounts presented in this schedule may differ from amounts presented in or used in the preparation of the financial statements.
NOTE 2. DE MINIMIS INDIRECT COST RATE
The City elected not to use the 10% de minimis indirect cost rate.
NOTE 3. NON-CASH ASSISTANCE
No federal awards were expended in the form of non-cash assistance during the year ended August 31, 2019.

117
CITY OF UNION CITY, GEORGIA
SCHEDULE OF FINDINGS AND RESPONSES FOR THE FISCAL YEAR ENDED AUGUST 31, 2019
SECTION I SUMMARY OF AUDIT RESULTS
Financial Statements Type of auditor’s report issued Unmodified Internal control over financial reporting: Material weaknesses identified? Yes X No Significant deficiencies identified not considered to be material weaknesses? Yes X None Reported Noncompliance material to financial statements noted? Yes X No Federal Awards Internal Control over major programs: Material weaknesses identified? Yes X No
Significant deficiencies identified not considered to be material weaknesses? Yes X None Reported
Type of auditor’s report issued on compliance for major programs Unmodified Any audit findings disclosed that are required to be reported in accordance with the Uniform Guidance Yes X No Identification of major program: CFDA Number Name of Federal Program or Cluster 20.205 U.S. Department of Transportation Highway Planning and Construction Cluster Dollar threshold used to distinguish between Type A and Type B programs: $750,000 Auditee qualified as low-risk auditee? Yes X No
118
CITY OF UNION CITY, GEORGIA
SCHEDULE OF FINDINGS AND QUESTIONED COSTS FOR THE FISCAL YEAR ENDED AUGUST 31, 2019
SECTION II FINANCIAL STATEMENT FINDINGS AND RESPONSES
None reported.
SECTION III FEDERAL AWARDS FINDINGS AND QUESTIONED COSTS
Not applicable.
119
CITY OF UNION CITY, GEORGIA
SCHEDULE OF PRIOR YEAR FINDINGS FOR THE FISCAL YEAR ENDED AUGUST 31, 2019
STATUS OF PRIOR YEAR AUDIT FINDINGS No prior year findings.