city of sumter cafr 2015
TRANSCRIPT
CITY OF SUMTER, SUMTER, SOUTH CAROLINA
COMPREHENSIVE ANNUAL FINANCIAL REPORT For the Fiscal Year Ended June 30, 2015


i
CITY OF SUMTER, SOUTH CAROLINA TABLE OF CONTENTS Year Ended June 30, 2015
INTRODUCTORY SECTION Page
Letter of Transmittal 1 GFOA Certificate of Achievement 5 Organizational Chart 7 List of Elected and Appointed Officials 9
FINANCIAL SECTION Independent Auditor’s Report 13 Management’s Discussion and Analysis 17 Basic Financial Statements Government-wide Financial Statements Statement of Net Position 28 Statement of Activities 29 Fund Financial Statements Governmental Funds Financial Statements Balance Sheet 30 Reconciliation of Balance Sheet – Governmental Funds to Statement of Net Position 31 Statement of Revenues, Expenditures and Changes in Fund Balances 32 Reconciliation of the Statement of Revenues, Expenditures, and Changes in Fund Balances of Governmental Funds to the Statement of Activities 33 Statement of Revenues, Expenditures and Changes in Fund Balance – Budget and Actual–General Fund 34 Proprietary Funds Financial Statements
Statement of Net Position 36 Statement of Revenues, Expenses and Changes in Net Position 37 Statement of Cash Flows 38
Fiduciary Funds Financial Statements Statement of Fiduciary Net Position – Fiduciary Funds 39
Statement of Changes in Fiduciary Net Position – Fiduciary Funds 40 Notes to Financial Statements 41 Required Supplementary Information Schedule of Employer’s Proportionate Share of Net Pension Liability and Employer Contributions 68 Schedule of Funding Progress and Employer Contributions – Other Postemployment Benefits – Defined Benefit Health Care Plan 69 Other Supplementary Information Special Revenue Funds Combining Balance Sheet – Nonmajor Special Revenue Funds 72 Combining Schedule of Revenues, Expenditures, and Changes in Fund Balances – Nonmajor Special Revenue Funds 74 Schedule of Revenues, Expenditures and Changes in Fund Balance - Budget and Actual – Hospitality Tax Fund 76 Schedule of Revenues, Expenditures and Changes in Fund Balance - Budget and Actual – Accommodations Tax Fund 77 Schedule of Revenues, Expenditures and Changes in Fund Balance - Budget and Actual – Victims Assistance Fund 78 Proprietary Funds Water and Sewer Fund - Schedule of Revenues, Expenses and Changes in Net Position – Budget and Actual – Budget Basis 79 Debt Coverage Ratio – Required by Lender 80 Fiduciary Funds Private-purpose trust funds Combining Schedule of Fiduciary Net Position – Private-purpose trust funds 82 Combining Schedule of Changes in Net Position – Private-purpose trust funds 83 Agency Funds

ii
Combining Schedule of Changes in Assets and Liabilities – Agency funds 86 Schedule of Court Fines and Assessment Activity and Expenditures for Victims Services–Required by State Law 89
STATISTICAL SECTION
Financial Trends Net Position by Component 92 Changes in Net Position, Last Ten Fiscal Years 93 Fund Balances of Governmental Funds, Last Ten Fiscal Years 95 Changes in Fund Balances of Governmental Funds, Last Ten Fiscal Years 96 Revenue Capacity Assed Value and Estimated Actual Value of Taxable Property, Last Ten Fiscal Years 97 Property Tax Rates, Direct and Overlapping Governments, Last Ten Fiscal Years 98 Principal Taxpayes, Current Year and Nine Years Ago 99 Property Tax Levies and Collections, Last Ten Fiscal Years 100 Debt Capacity Ratios of Outstanding Debt by Type, Last Ten Fiscal Years 101 Ratios of General Bonded Debt Outstanding, Last Ten Fiscal Years 102 Direct and Overlapping Governmental Activities Debt 103 Legal Debt Margin Information, Last Ten Fiscal Years 104 Pledged Revenue Coverage, Water and Sewer Authority, Last Ten Fiscal Years 105 Demographic and Economic Information Demographic Statistics, Last Ten Fiscal Years 106 Principal Employers, Current Year and Nine Years Ago 107 Operating Information Full-Time Equivalent City Government Employees by Function, Last Ten Fiscal Years 108 Operating Indicators by Function/Program, Last Ten Fiscal Years 109 Capital Asset Statistics by Function/Program, Last Ten Fiscal Years 110
REGULATORY SECTION
Schedule of Expenditures of Federal Awards 113 Notes to Schedule of Expenditures of Federal Awards 115 Independent Auditor’s Report on Internal Control Over Financial Reporting and on Compliance and Other Matters Based on an Audit of Financial Statements Performed in Accordance with Government Auditing Standards 116 Independent Auditor’s Report on Compliance for Each Major Program and on Internal Control Over Compliance Required by OMB Circular A-133 118 Schedule of Findings and Questioned Costs 120 Summary Schedule of Prior Audit Findings 121


5

6
THIS PAGE INTENTIONALLY LEFT BLANK
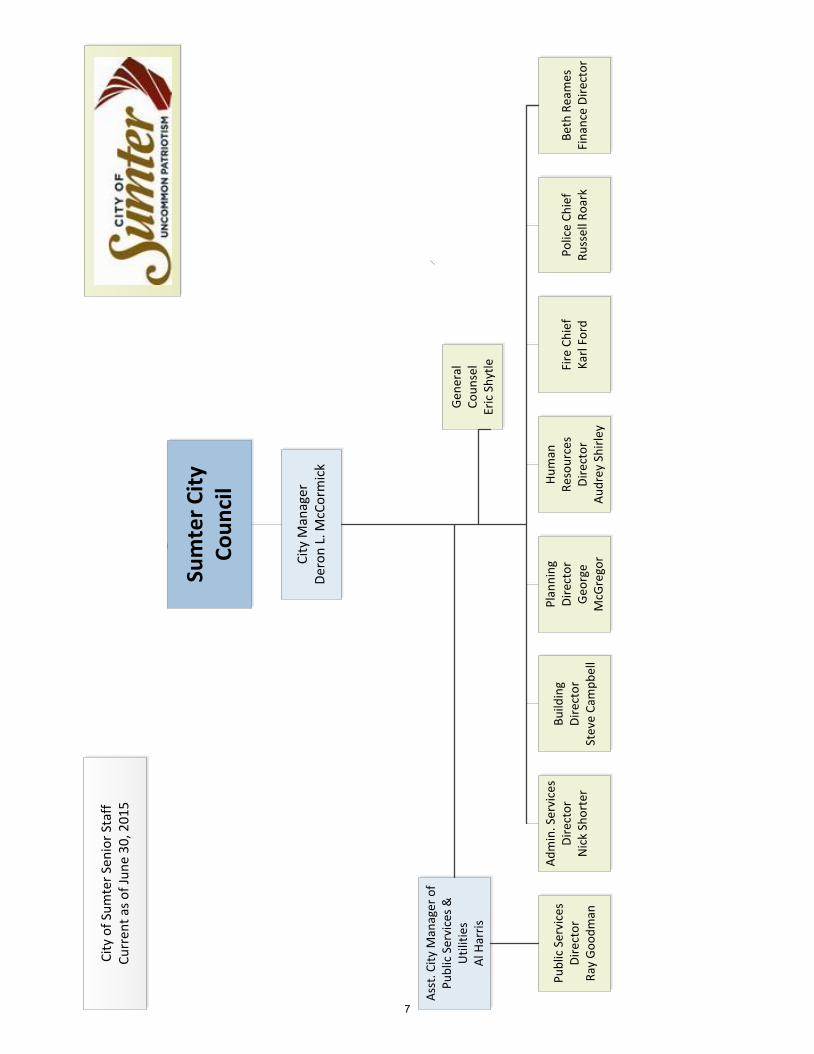
Cit
y o
f Su
mte
r Se
nio
r St
aff
Cu
rren
t as
of
Jun
e 3
0, 2
01
5
Sum
ter
Cit
y C
ou
nci
l
Cit
y M
anag
erD
ero
n L
. McC
orm
ick
Ass
t. C
ity
Man
ager
of
Pu
blic
Ser
vice
s &
U
tilit
ies
Al H
arri
s
Pu
blic
Ser
vice
sD
irec
tor
Ray
Go
od
man
Ad
min
. Ser
vice
sD
irec
tor
Nic
k Sh
ort
er
Bu
ildin
g D
irec
tor
Stev
e C
amp
bel
l
Pla
nn
ing
Dir
ecto
rG
eorg
e M
cGre
gor
Hu
man
R
eso
urc
esD
irec
tor
Au
dre
y Sh
irle
y
Fire
Ch
ief
Kar
l Fo
rdP
olic
e C
hie
fR
uss
ell R
oar
kB
eth
Rea
mes
Fin
ance
Dir
ecto
r
Gen
eral
C
ou
nse
lEr
ic S
hyt
le
7

8
THIS PAGE INTENTIONALLY LEFT BLANK
9
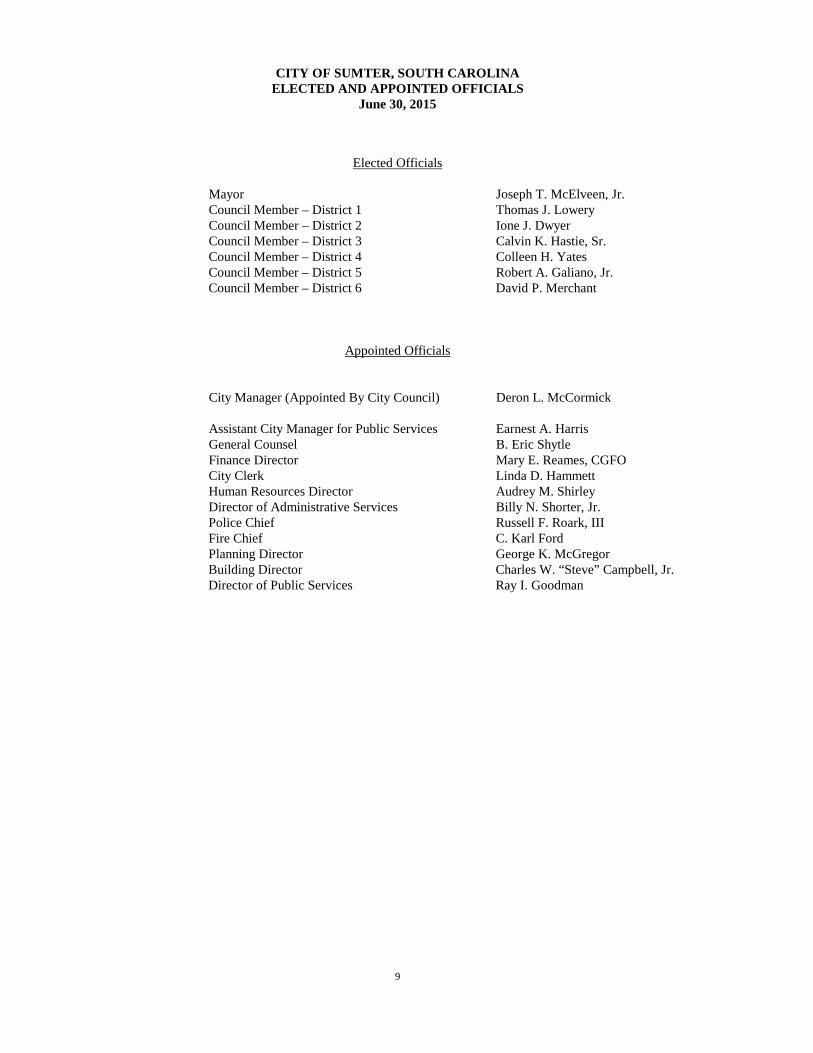
CITY OF SUMTER, SOUTH CAROLINA ELECTED AND APPOINTED OFFICIALS
June 30, 2015
Elected Officials Mayor Joseph T. McElveen, Jr. Council Member – District 1 Thomas J. Lowery Council Member – District 2 Ione J. Dwyer Council Member – District 3 Calvin K. Hastie, Sr. Council Member – District 4 Colleen H. Yates Council Member – District 5 Robert A. Galiano, Jr. Council Member – District 6 David P. Merchant
Appointed Officials
City Manager (Appointed By City Council) Deron L. McCormick Assistant City Manager for Public Services Earnest A. Harris General Counsel B. Eric Shytle Finance Director Mary E. Reames, CGFO City Clerk Linda D. Hammett Human Resources Director Audrey M. Shirley Director of Administrative Services Billy N. Shorter, Jr. Police Chief Russell F. Roark, III Fire Chief C. Karl Ford Planning Director George K. McGregor Building Director Charles W. “Steve” Campbell, Jr. Director of Public Services Ray I. Goodman

10
THIS PAGE INTENTIONALLY LEFT BLANK

11
FINANCIAL SECTION

12
THIS PAGE INTENTIONALLY LEFT BLANK


16
THIS PAGE INTENTIONALLY LEFT BLANK

17
City of Sumter, South Carolina Management’s Discussion and Analysis
Year Ended June 30, 2015 As management of the City of Sumter, we offer readers of the City of Sumter’s financial statements this narrative overview and analysis of the financial activities of the City of Sumter for the fiscal year ended June 30, 2015. We encourage readers to consider the information presented here in conjunction with additional information that we have furnished in the basic financial statements Financial Highlights
• The assets of the City of Sumter exceeded its liabilities at the close of the most recent fiscal year by $93,650,672 (net position).
• The City of Sumter’s total net position increased by $9,157,429 during the current period, as a result of an increase from governmental activities of $4,034,071 and an increase from business-type activities of $5,123,358.
• At the close of the current fiscal year, the City of Sumter’s governmental funds reported combined ending fund balances of $20,299,595, an increase of $2,469,775 in comparison with the prior year. Approximately 69% of this total amount, $13,939,785 is available for spending at the government’s discretion (unassigned fund balance).
• At the end of the current fiscal year, unassigned fund balance for the general fund was $13,939,785, or approximately 40% of total general fund expenditures.
• The City of Sumter’s total outstanding long-term debt decreased by $2,502,366 during the current fiscal year.
Overview of the Financial Statements This discussion and analysis is intended to serve as an introduction to the City of Sumter’s basic financial statements. The City of Sumter’s basic financial statements consist of three components: 1) government-wide financial statements, 2) fund financial statements, and 3) the notes to the financial statements. This report also includes supplementary information intended to furnish additional detail to support the basic financial statements themselves. Government-wide Financial Statements. The government-wide financial statements are designed to provide readers with a broad overview of the City of Sumter’s finances, in a manner similar to a private-sector business. The statement of net position presents financial information on all of the City of Sumter’s assets, liabilities and deferred inflows/outflows of resources, with the difference reported as net position. Over time, increases or decreases in net position may serve as a useful indicator of whether the financial position of the City of Sumter is improving or deteriorating. The statement of activities presents information showing how the City of Sumter’s net position changed during the most recent fiscal year. All changes in net position are reported as soon as the underlying event giving rise to the change occurs, regardless of the timing of related cash flows. Thus, revenues and expenses are reported for some items that will only result in cash flows in future fiscal periods (e.g., uncollected taxes and earned but unused vacation leave). Both of the government-wide financial statements distinguish functions of the City of Sumter that are principally supported by taxes and intergovernmental revenues (governmental activities) from other functions that are intended to recover all or a significant portion of their costs through user fees and charges (business-type activities). The governmental activities of the City of Sumter include general government administration, public safety and law enforcement, public works, parks, recreation and culture, community development, economic development and interest and other charges. The business-type activities of the City of Sumter include water and sewer services and storm water services. The government-wide financial statements can be found on pages 28-29 of this report.

18
City of Sumter, South Carolina Management’s Discussion and Analysis Year Ended June 30, 2015 (Continued)
Fund Financial Statements. A fund is a grouping of related accounts that is used to maintain control over resources that have been segregated for specific activities or objectives. The City of Sumter, like other state and local governments, uses fund accounting to ensure and demonstrate compliance with finance-related legal requirements. All of the funds of the City of Sumter can be divided into three categories: governmental funds, proprietary funds, and fiduciary funds. Governmental Funds. Governmental funds are used to account for essentially the same functions reported as governmental activities in the government-wide financial statements. However, unlike the government-wide financial statements, governmental fund financial statements focus on near-term inflows and outflows of spendable resources, as well as on balances of spendable resources available at the end of the fiscal year. Such information may be useful in evaluating a government’s near term financing requirements. Because the focus of governmental funds is narrower than that of the government-wide financial statements, it is useful to compare the information presented for governmental funds with similar information presented for governmental activities in the government-wide financial statements. By doing so, readers may better understand the long-term impact of the government’s near-term financing decisions. Both the governmental fund balance sheet and the governmental fund statement of revenues, expenditures, and changes in fund balances provide a reconciliation to facilitate this comparison between governmental funds and governmental activities. The City of Sumter maintains one major governmental fund, the general fund and non-major special revenue funds. Information is presented separately in the governmental fund balance sheet and in the governmental fund statement of revenues, expenditures, and changes in fund balances for these funds. Individual fund data for each of the non-major special revenue funds is provided in the form of combining statements in the combining and individual fund statements and schedules section of this report. The City of Sumter adopts an annual appropriated budget for its general fund. A budgetary comparison statement has been provided for the general fund to demonstrate compliance with this budget. The basic governmental fund financial statements can be found on pages 30-33 of this report. Proprietary Funds. The City of Sumter maintains one type of proprietary fund. Enterprise funds are used to report the same functions presented as business-type activities in the government-wide financial statements. The City of Sumter uses an enterprise fund to account for its water and sewer operation and a second enterprise fund is used to account for its storm water operation. Proprietary funds provide the same type of information as the government-wide financial statements, only in more detail. The proprietary fund financial statements provide separate information for the water and sewer fund which is considered to be a major fund of the City of Sumter and the non-major storm water utility fund. The basic proprietary fund financial statements can be found on pages 36-38 of this report. Fiduciary Funds. Fiduciary funds are used to account for resources held for the benefit of parties outside of the government. Fiduciary funds are not reflected in the government-wide financial statements because the resources of those funds are not available to support the City of Sumter’s own programs. The accounting used for fiduciary funds is much like that used for proprietary funds. The City of Sumter maintains two different types of fiduciary funds. The Private-purpose trust fund is used to report resources held in trust for charitable purposes. The Agency fund reports resources held by the City of Sumter in a custodial capacity for individuals, private organizations, and non-profit organizations. The fiduciary fund financial statements can be found on pages 39-40 of this report.

19
City of Sumter, South Carolina Management’s Discussion and Analysis Year Ended June 30, 2015 (Continued)
Notes to the Financial Statements. The notes provide additional information that is necessary to acquire a full understanding of the data provided in the government-wide and fund financial statements. The notes to the financial statements can be found on pages 41-65 of this report. Other Information. In addition to the basic financial statements and accompanying notes, this report also presents required supplementary information concerning the City of Sumter’s proportionate share of the net pension liability in relation to its participation in a cost-sharing multiple-employer defined benefit pension plan and its contributions to said plan. In addition this section reports on the City’s progress in funding its obligation to provide OPEB benefits to its employees. Required supplementary information can be found on pages 68-69 of this report. The combining statements referred to earlier in connection with non-major governmental funds are presented immediately following the required supplementary information. Combining and individual fund statements and schedules can be found on pages 72-75 of this report. Government-Wide Overall Financial Analysis As noted earlier, net position over time, may serve as a useful indicator of a government’s financial position. In the case of the City of Sumter, assets exceeded liabilities by $93,650,672 at the close of the most recent fiscal year. City of Sumter’s Net Position
2015 2014,as restated* 2015 2014, as restated* 2015 2014, as restated*
Current and other assets 23,948,202$ 21,404,818$ 24,169,676$ 23,852,540$ 48,117,878$ 45,257,358$
Capital assets 43,372,824 43,529,351 82,540,759 80,275,272 125,913,583 123,804,623
Total assets 67,321,026 64,934,169 106,710,435 104,127,812 174,031,461 169,061,981
Total deferred outflows of 2,724,621 - 637,344 34,613 3,361,965 34,613 resources
Noncurrent liabilities 37,882,485 10,743,275 38,088,676 33,170,239 75,971,161 43,913,514
Other liabilities 2,829,456 32,004,844 1,344,118 8,784,993 4,173,574 40,789,837
Total liabilities 40,711,941 42,748,119 39,432,794 41,955,232 80,144,735 84,703,351
Total deferred inflows of 3,013,585 334,769 584,434 - 3,598,019 334,769
resources
Net position:
Net investment in capitalassets 37,859,121 37,254,398 51,883,642 47,592,613 89,742,763 84,847,011
Restricted 3,674,181 3,321,746 2,998,574 3,171,556 6,672,755 6,493,302
Unrestricted (15,213,181) (18,290,094) 12,448,335 11,443,024 (2,764,846) (6,847,070)
Total net position 26,320,121$ 22,286,050$ 67,330,551$ 62,207,193$ 93,650,672$ 84,493,243$
Governmental Activities Business-Type Activites Total
*See note to financial statements III. A.
By far the largest portion of the City of Sumter’s net position (95.8%) reflects its investment in capital assets (e.g., land, buildings, machinery, vehicles, equipment and infrastructure) less any related debt used to acquire those assets that is still outstanding. The City of Sumter uses these capital assets to provide services to citizens. Accordingly, these assets are not available for future spending. Although the City of Sumter’s investment in capital assets is reported net of related debt, it should be noted that the resources needed to repay this debt must be provided from other sources, since the capital assets themselves cannot be used to liquidate these liabilities.
20
City of Sumter, South Carolina Management’s Discussion and Analysis Year Ended June 30, 2015 (Continued)
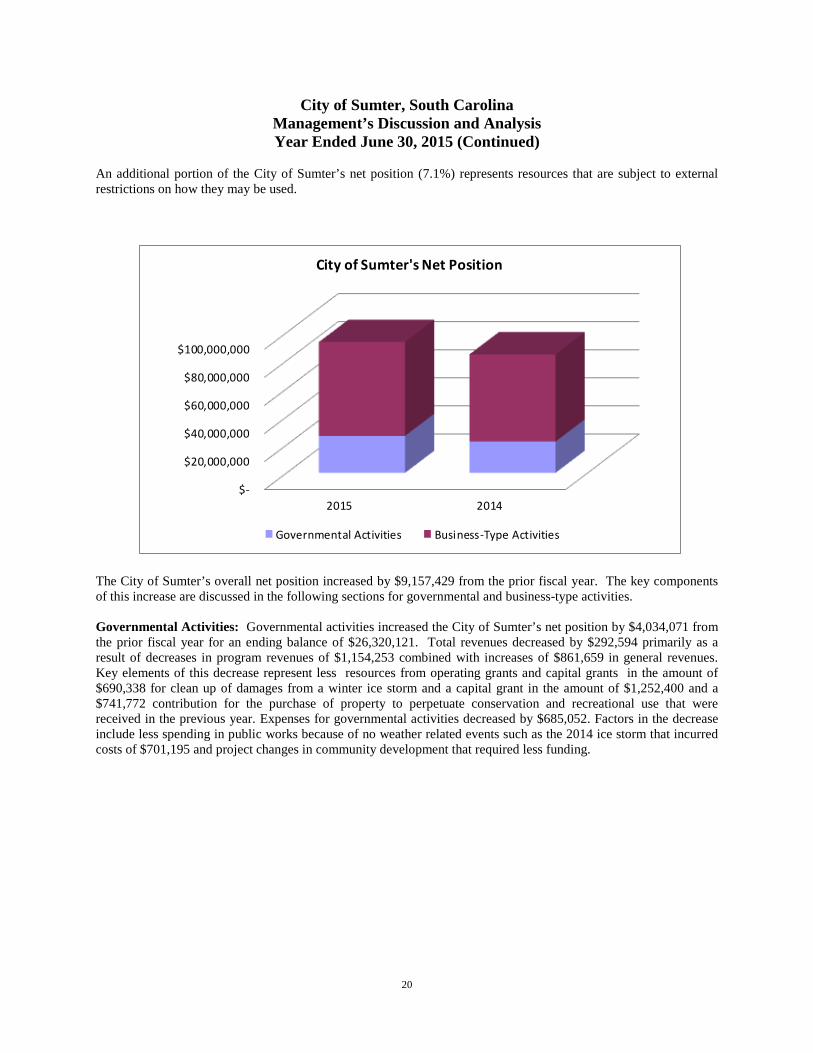
An additional portion of the City of Sumter’s net position (7.1%) represents resources that are subject to external restrictions on how they may be used.
$-
$20,000,000
$40,000,000
$60,000,000
$80,000,000
$100,000,000
2015 2014
City of Sumter's Net Position
Governmental Activities Business-Type Activities
The City of Sumter’s overall net position increased by $9,157,429 from the prior fiscal year. The key components of this increase are discussed in the following sections for governmental and business-type activities. Governmental Activities: Governmental activities increased the City of Sumter’s net position by $4,034,071 from the prior fiscal year for an ending balance of $26,320,121. Total revenues decreased by $292,594 primarily as a result of decreases in program revenues of $1,154,253 combined with increases of $861,659 in general revenues. Key elements of this decrease represent less resources from operating grants and capital grants in the amount of $690,338 for clean up of damages from a winter ice storm and a capital grant in the amount of $1,252,400 and a $741,772 contribution for the purchase of property to perpetuate conservation and recreational use that were received in the previous year. Expenses for governmental activities decreased by $685,052. Factors in the decrease include less spending in public works because of no weather related events such as the 2014 ice storm that incurred costs of $701,195 and project changes in community development that required less funding.

21
City of Sumter, South Carolina Management’s Discussion and Analysis Year Ended June 30, 2015 (Continued)
City of Sumter’s Changes in Net Position
2015 2014,as restated 2015 2014, as restated 2015 2014, as restatedRevenues: Program Revenues:
Charges for services 7,341,509$ 7,121,669$ 21,634,744$ 21,034,775$ 28,976,253$ 28,156,444$ Operating grants and
contributions 2,654,380 2,863,555 - - 2,654,380 2,863,555 Capital grants and contributions 1,207,142 2,372,060 1,985,402 1,532,724 3,192,544 3,904,784 Total program revenues 11,203,031 12,357,284 23,620,146 22,567,499 34,823,177 34,924,783
General Revenues: Property taxes 9,637,697 9,241,692 - - 9,637,697 9,241,692
Sales taxes - local option 4,019,596 4,380,262 - - 4,019,596 4,380,262 Sales taxes - local accommodations and hospitality 2,889,558 2,733,045 - - 2,889,558 2,733,045 Business and franchise fees 9,684,170 9,014,503 - - 9,684,170 9,014,503 State shared taxes 951,401 957,975 - - 951,401 957,975 Other 290,514 283,800 503,229 406,467 793,743 690,267 Total general revenues 27,472,936 26,611,277 503,229 406,467 27,976,165 27,017,744 Total revenues 38,675,967 38,968,561 24,123,375 22,973,966 62,799,342 61,942,527
Expenses:General Government 5,473,334 5,506,479 - - 5,473,334 5,506,479 Public Safety 18,447,133 18,726,272 - - 18,447,133 18,726,272 Public Works 5,478,100 6,198,843 - - 5,478,100 6,198,843 Parks, Recreation and Culture 4,128,482 3,655,740 - - 4,128,482 3,655,740 Community Development 381,600 518,788 - - 381,600 518,788 Economic Development 1,898,790 1,846,045 - - 1,898,790 1,846,045 Interest and other charges 175,056 215,380 - - 175,056 215,380 Water and sewer services 17,659,418 17,606,238 17,659,418 17,606,238
Total expenses 35,982,495 36,667,547 17,659,418 17,606,238 53,641,913 54,273,785
Increase in net positionbefore transfers 2,693,472 2,301,014 6,463,957 5,367,728 9,157,429 7,668,742
T ransfers 1,340,599 1,557,957 (1,340,599) (1,557,957) - -
Increase in net position 4,034,071 3,858,971 5,123,358 3,809,771 9,157,429 7,668,742 Net position beginning, as restated 22,286,050 18,427,079 62,207,193 58,397,422 84,493,243 76,824,501
Net position ending 26,320,121$ 22,286,050$ 67,330,551$ 62,207,193$ 93,650,672$ 84,493,243$
*See note to financial statements III. A.
Governmental Activities Business-Type Activities Total
22
City of Sumter, South Carolina Management’s Discussion and Analysis Year Ended June 30, 2015 (Continued)
$-
$5,000,000
$10,000,000
$15,000,000
$20,000,000
Generalgovernment
Publicsafety
Publicworks
Parks, recr.& culture
Communitydev.
Economicdev.
Interest &other
Expenses and Program Revenues - Governmental Activities
expenses program revenues
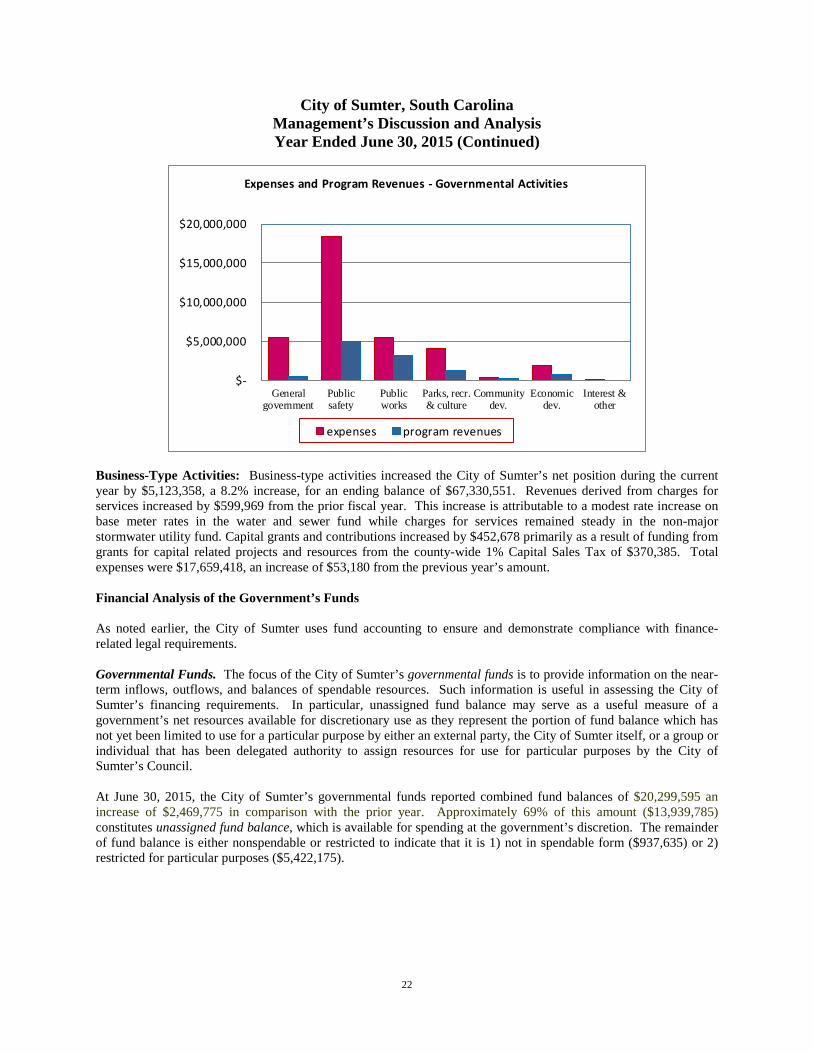
Business-Type Activities: Business-type activities increased the City of Sumter’s net position during the current year by $5,123,358, a 8.2% increase, for an ending balance of $67,330,551. Revenues derived from charges for services increased by $599,969 from the prior fiscal year. This increase is attributable to a modest rate increase on base meter rates in the water and sewer fund while charges for services remained steady in the non-major stormwater utility fund. Capital grants and contributions increased by $452,678 primarily as a result of funding from grants for capital related projects and resources from the county-wide 1% Capital Sales Tax of $370,385. Total expenses were $17,659,418, an increase of $53,180 from the previous year’s amount. Financial Analysis of the Government’s Funds As noted earlier, the City of Sumter uses fund accounting to ensure and demonstrate compliance with finance-related legal requirements. Governmental Funds. The focus of the City of Sumter’s governmental funds is to provide information on the near-term inflows, outflows, and balances of spendable resources. Such information is useful in assessing the City of Sumter’s financing requirements. In particular, unassigned fund balance may serve as a useful measure of a government’s net resources available for discretionary use as they represent the portion of fund balance which has not yet been limited to use for a particular purpose by either an external party, the City of Sumter itself, or a group or individual that has been delegated authority to assign resources for use for particular purposes by the City of Sumter’s Council. At June 30, 2015, the City of Sumter’s governmental funds reported combined fund balances of $20,299,595 an increase of $2,469,775 in comparison with the prior year. Approximately 69% of this amount ($13,939,785) constitutes unassigned fund balance, which is available for spending at the government’s discretion. The remainder of fund balance is either nonspendable or restricted to indicate that it is 1) not in spendable form ($937,635) or 2) restricted for particular purposes ($5,422,175).
23
City of Sumter, South Carolina Management’s Discussion and Analysis Year Ended June 30, 2015 (Continued)
- 5,000,000 10,000,000 15,000,000
Unassigned
Restricted
Nonspendable
General FundComponents of Fund Balance
June 30, 2014 and 2015
2014
2015
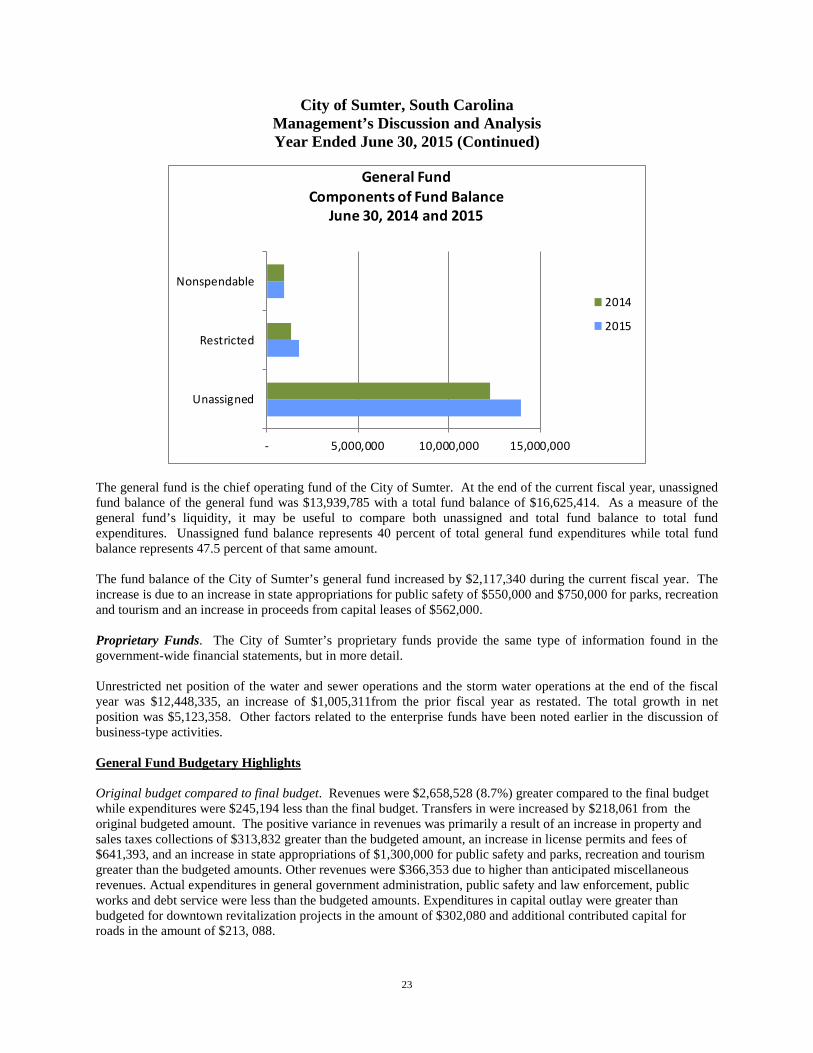
The general fund is the chief operating fund of the City of Sumter. At the end of the current fiscal year, unassigned fund balance of the general fund was $13,939,785 with a total fund balance of $16,625,414. As a measure of the general fund’s liquidity, it may be useful to compare both unassigned and total fund balance to total fund expenditures. Unassigned fund balance represents 40 percent of total general fund expenditures while total fund balance represents 47.5 percent of that same amount. The fund balance of the City of Sumter’s general fund increased by $2,117,340 during the current fiscal year. The increase is due to an increase in state appropriations for public safety of $550,000 and $750,000 for parks, recreation and tourism and an increase in proceeds from capital leases of $562,000. Proprietary Funds. The City of Sumter’s proprietary funds provide the same type of information found in the government-wide financial statements, but in more detail. Unrestricted net position of the water and sewer operations and the storm water operations at the end of the fiscal year was $12,448,335, an increase of $1,005,311from the prior fiscal year as restated. The total growth in net position was $5,123,358. Other factors related to the enterprise funds have been noted earlier in the discussion of business-type activities. General Fund Budgetary Highlights Original budget compared to final budget. Revenues were $2,658,528 (8.7%) greater compared to the final budget while expenditures were $245,194 less than the final budget. Transfers in were increased by $218,061 from the original budgeted amount. The positive variance in revenues was primarily a result of an increase in property and sales taxes collections of $313,832 greater than the budgeted amount, an increase in license permits and fees of $641,393, and an increase in state appropriations of $1,300,000 for public safety and parks, recreation and tourism greater than the budgeted amounts. Other revenues were $366,353 due to higher than anticipated miscellaneous revenues. Actual expenditures in general government administration, public safety and law enforcement, public works and debt service were less than the budgeted amounts. Expenditures in capital outlay were greater than budgeted for downtown revitalization projects in the amount of $302,080 and additional contributed capital for roads in the amount of $213, 088.

24
City of Sumter, South Carolina
Management’s Discussion and Analysis Year Ended June 30, 2015 (Continued)
Capital Assets and Debt Administration Capital assets. The City of Sumter’s investment in capital assets for its governmental and business type activities as of June 30, 2015, was $125,913,583 (net of accumulated depreciation). This investment in capital assets includes land, buildings, works of art, park facilities, roads, plants, machinery and equipment, and infrastructure. City of Sumter’s Capital Assets (net of depreciation)
2015 2014 2015 2014 2015 2014Land 12,148,287$ 12,067,279$ 546,878$ 338,412$ 12,695,165$ 12,405,691$ Works of art 396,866 396,866 - - 396,866 396,866 Buildings 11,688,099 12,510,785 160,440 172,781 11,848,539 12,683,566 Plants, machinery and equipment 6,412,788 5,705,875 38,715,171 40,271,543 45,127,959 45,977,418 Infrastructure 12,004,850 12,058,911 40,876,607 34,897,336 52,881,457 46,956,247 Construction in progress 721,934 789,635 2,241,663 4,595,000 2,963,597 5,384,635
Totals 43,372,824$ 43,529,351$ 82,540,759$ 80,275,072$ 125,913,583$ 123,804,423$
Governmental Activities Business-Type Activities Total
Major capital asset events during the current fiscal year included the following:
• Routine replacement of vehicles, lease purchases of sanitation and fire trucks and various equipment at a cost of $2,426,229
• Various projects related to streets, sidewalks, parking lots, at a cost of $877,766, including capital contributions of $357,142, were completed and placed into service.
• Parks and gardens improvements including a new spray park at Palmetto Park and Lake Alice Drive walking trail totaling $229,908
• Various water and sewer line and storm water drainage projects at a cost of $2,320,415 were completed and placed into service. This amount includes $648,030 in capital contributions.
• Various water & sewer infrastructure projects in the amount of $4,042,730 were started during the current fiscal year and will continue into next fiscal year.
• Routine replacement of equipment and vehicles for water and sewer operations at a cost of $531,221 Additional information on the City of Sumter’s capital assets can be found in Note IV. D on pages 51-52. Long-term Debt. At the end of the current fiscal year, the City of Sumter had total debt outstanding of $37,946,506. Of this amount, $2,714,307 of general obligation debt is backed by the full faith and credit of the government. The remainder of the City of Sumter’s long-term obligations comprises revenue bonds, capital leases, and notes payable. City of Sumter’s Outstanding Debt Bonds, Notes Payable and Capital Leases
2015 2014 2015 2014 2015 2014General obligation bonds 2,714,307$ 3,395,067$ -$ -$ 2,714,307$ 3,395,067$ Revenue bonds 1,020,000 1,263,000 - - 1,020,000 1,263,000 Notes payable 636,000 673,000 - - 636,000 673,000 Capital lease obligations 2,891,391 2,400,533 - - 2,891,391 2,400,533 Revenue bonds - 30,684,808 32,717,272 30,684,808 32,717,272 Total 7,261,698$ 7,731,600$ 30,684,808$ 32,717,272$ 37,946,506$ 40,448,872$
Governmental Activities Business-Type Activities Total

25
City of Sumter, South Carolina Management’s Discussion and Analysis Year Ended June 30, 2015 (Continued)
The City of Sumter’s total debt decreased by $2,502,366 (6 percent) during the current fiscal year. The City entered into a capital lease agreement in the amount of $1,295,000 to purchase certain capital equipment during the year. State statutes limit the amount of general obligation debt a governmental entity may issue to 8 percent of its total assessed valuation of property. The current debt limitation for the City is $10,784,548 which is in excess of the City of Sumter’s outstanding general obligation debt. Additional information on the City of Sumter’s long-term debt can be found in Note IV, E on pages 53-56. Economic Factors and Next Year’s Budgets and Rates The revitalization efforts in the downtown area in the Central Business District continue with streetscape improvements, building renovations and façade improvements. Continental Tire announced in September 2015 a $275 million dollar expansion with an increase in job commitment of 100. The new penny sales tax is expected to begin at the sunset of the original one, which was implemented in May 2009 and ends on May 1, 2016. Included in the twenty-eight projects approved will be public safety infrastructure to provide updated technology, a new City of Sumter police and E911 emergency services station and a new fire station.
The fiscal year 2015-2016 budget was adopted with an appropriation of $35,396,935 for the general fund. There was no increase in the City’s total millage rate for 2015-2016 which is currently 102 mills. Revenues from property taxes, business licenses, franchise fees and tax collection programs are expected to be steady. On September 15, 2015 the City of Sumter issued a $52,670,000 Waterworks and Sewer System Improvement and Refunding Revenue Bond. A portion of the proceeds will be used to refund $23,830,000 principal amount of it’s Waterworks and Sewer System Improvement Bond series 2007 and the remaining proceeds will be used for various improvements to the City of Sumter’s water and sewer systems. In connection with this revenue bond issue, the City of Sumter’s rating was increased by Moody’s Investors Service (Moody’s) to Aa3 from A1 and increased by Standard and Poor’s (S&P) to AA- from an A+. Requests for Information This financial report is designed to provide a general overview of the City of Sumter’s finances for all those with an interest in the government’s finances. Questions concerning any of the information provided in this report or requests for additional financial information should be addressed to the Office of the Finance Director, Post Office Box 1449, Sumter, South Carolina 29151.
26
THIS PAGE INTENTIONALLY LEFT BLANK
27
BASIC FINANCIAL STATEMENTS

28
CITY OF SUMTER, SOUTH CAROLINA STATEMENT OF NET POSITION
June 30, 2015 Business
Governmental TypeActivities Activities Total
AssetsCash and cash equivalents $ 16,737,051 $ 6,363,502 $ 23,100,553 Investments 968,220 10,004,760 10,972,980 Receivables, net of allowance for doubtful accounts 3,557,301 4,347,465 7,904,766 Inventories 286,018 - 286,018 Prepaid items 16,240 - 16,240 Property held for resale 635,377 - 635,377 Interest in joint venture - 100,000 100,000 Restricted cash and cash equivalents 1,747,995 2,998,574 4,746,569 Receivables, non-current portion - 355,375 355,375 Capital assets not being depreciated 13,267,087 2,788,541 16,055,628 Capital assets, depreciable, net of accumulated depreciation 30,105,737 79,752,218 109,857,955 Total assets 67,321,026 106,710,435 174,031,461
Deferred Outflows of ResourcesDeferred loss on bond refunding - 27,691 27,691 Prepaid pension costs 2,724,621 609,653 3,334,274 Total deferred outflows of resources 2,724,621 637,344 3,361,965
LiabilitiesCurrent liabilities:
Accounts payable 1,563,344 815,705 2,379,049
Accrued interest payable 58,395 110,765 169,160
Accrued salaries and payroll withholdings 985,965 99,719 1,085,684
Court bonds and confiscated funds payable 205,052 - 205,052
Customer deposits 10,300 317,929 328,229
Unearned revenue 6,400 - 6,400 Noncurrent liabilities: Due within one year 2,668,225 2,005,124 4,673,349 Due in more than one year 7,887,662 29,151,375 37,039,037 Net pension liability 27,326,598 6,932,177 34,258,775 Total liabilities 40,711,941 39,432,794 80,144,735
Deferred Inflows of ResourcesUnavailable revenue - local option sales tax 309,284 - 309,284 Unavailable revenue - grants & contributions 18,236 - 18,236 Unavailable revenue - pension 2,686,065 584,434 3,270,499 Total deferred inflows of resources 3,013,585 584,434 3,598,019
Net PositionNet investment in capital assets 37,859,121 51,883,642 89,742,763 Restricted for: Debt service - 2,998,574 2,998,574 Community development 416,767 - 416,767 Economic development 2,116,072 - 2,116,072 Public safety and law enforcement 1,141,342 - 1,141,342 Unrestricted (15,213,181) 12,448,335 (2,764,846) Total net position $ 26,320,121 $ 67,330,551 $ 93,650,672
The accompanying notes are an integral part of these statements.
29
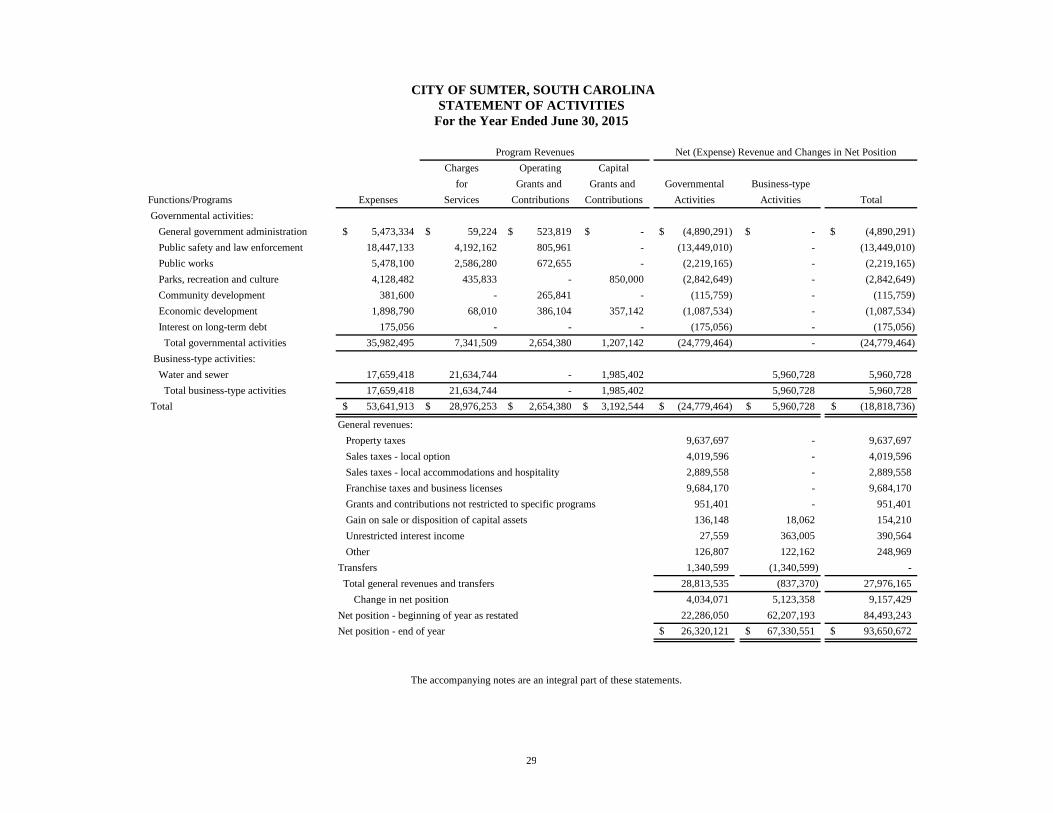
CITY OF SUMTER, SOUTH CAROLINA STATEMENT OF ACTIVITIES
For the Year Ended June 30, 2015
Charges Operating Capitalfor Grants and Grants and Governmental Business-type
Functions/Programs Expenses Services Contributions Contributions Activities Activities Total Governmental activities: General government administration 5,473,334$ 59,224$ 523,819$ -$ (4,890,291)$ -$ (4,890,291)$ Public safety and law enforcement 18,447,133 4,192,162 805,961 - (13,449,010) - (13,449,010) Public works 5,478,100 2,586,280 672,655 - (2,219,165) - (2,219,165) Parks, recreation and culture 4,128,482 435,833 - 850,000 (2,842,649) - (2,842,649) Community development 381,600 - 265,841 - (115,759) - (115,759) Economic development 1,898,790 68,010 386,104 357,142 (1,087,534) - (1,087,534) Interest on long-term debt 175,056 - - - (175,056) - (175,056) Total governmental activities 35,982,495 7,341,509 2,654,380 1,207,142 (24,779,464) - (24,779,464) Business-type activities: Water and sewer 17,659,418 21,634,744 - 1,985,402 5,960,728 5,960,728 Total business-type activities 17,659,418 21,634,744 - 1,985,402 5,960,728 5,960,728 Total 53,641,913$ 28,976,253$ 2,654,380$ 3,192,544$ (24,779,464)$ 5,960,728$ (18,818,736)$
9,637,697 - 9,637,697 4,019,596 - 4,019,596 2,889,558 - 2,889,558 9,684,170 - 9,684,170
Grants and contributions not restricted to specific programs 951,401 - 951,401 Gain on sale or disposition of capital assets 136,148 18,062 154,210
27,559 363,005 390,564 126,807 122,162 248,969
Transfers 1,340,599 (1,340,599) - 28,813,535 (837,370) 27,976,165
4,034,071 5,123,358 9,157,429 22,286,050 62,207,193 84,493,243 26,320,121$ 67,330,551$ 93,650,672$
Net position - end of year
Franchise taxes and business licenses
Unrestricted interest income Other
Total general revenues and transfers Change in net positionNet position - beginning of year as restated
Sales taxes - local accommodations and hospitality
Program Revenues Net (Expense) Revenue and Changes in Net Position
General revenues: Property taxes Sales taxes - local option
The accompanying notes are an integral part of these statements.
30
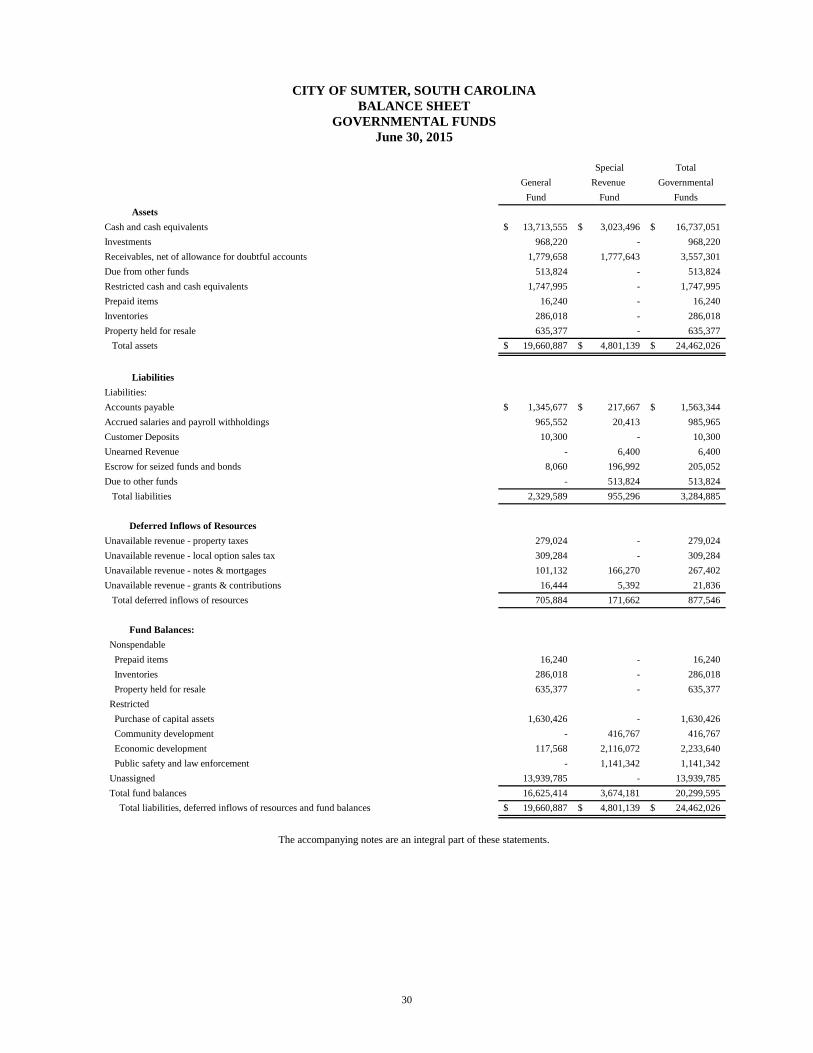
CITY OF SUMTER, SOUTH CAROLINA BALANCE SHEET
GOVERNMENTAL FUNDS June 30, 2015
Special Total
General Revenue GovernmentalFund Fund Funds
Assets Cash and cash equivalents 13,713,555$ 3,023,496$ 16,737,051$ Investments 968,220 - 968,220 Receivables, net of allowance for doubtful accounts 1,779,658 1,777,643 3,557,301 Due from other funds 513,824 - 513,824 Restricted cash and cash equivalents 1,747,995 - 1,747,995 Prepaid items 16,240 - 16,240 Inventories 286,018 - 286,018 Property held for resale 635,377 - 635,377 Total assets 19,660,887$ 4,801,139$ 24,462,026$
Liabilities Liabilities:Accounts payable 1,345,677$ 217,667$ 1,563,344$ Accrued salaries and payroll withholdings 965,552 20,413 985,965 Customer Deposits 10,300 - 10,300 Unearned Revenue - 6,400 6,400 Escrow for seized funds and bonds 8,060 196,992 205,052 Due to other funds - 513,824 513,824
2,329,589 955,296 3,284,885
Deferred Inflows of ResourcesUnavailable revenue - property taxes 279,024 - 279,024 Unavailable revenue - local option sales tax 309,284 - 309,284 Unavailable revenue - notes & mortgages 101,132 166,270 267,402 Unavailable revenue - grants & contributions 16,444 5,392 21,836 Total deferred inflows of resources 705,884 171,662 877,546
Fund Balances: Nonspendable Prepaid items 16,240 - 16,240 Inventories 286,018 - 286,018 Property held for resale 635,377 - 635,377 Restricted Purchase of capital assets 1,630,426 - 1,630,426 Community development - 416,767 416,767 Economic development 117,568 2,116,072 2,233,640 Public safety and law enforcement - 1,141,342 1,141,342 Unassigned 13,939,785 - 13,939,785 Total fund balances 16,625,414 3,674,181 20,299,595 Total liabilities, deferred inflows of resources and fund balances 19,660,887$ 4,801,139$ 24,462,026$
Total liabilities
The accompanying notes are an integral part of these statements.
31
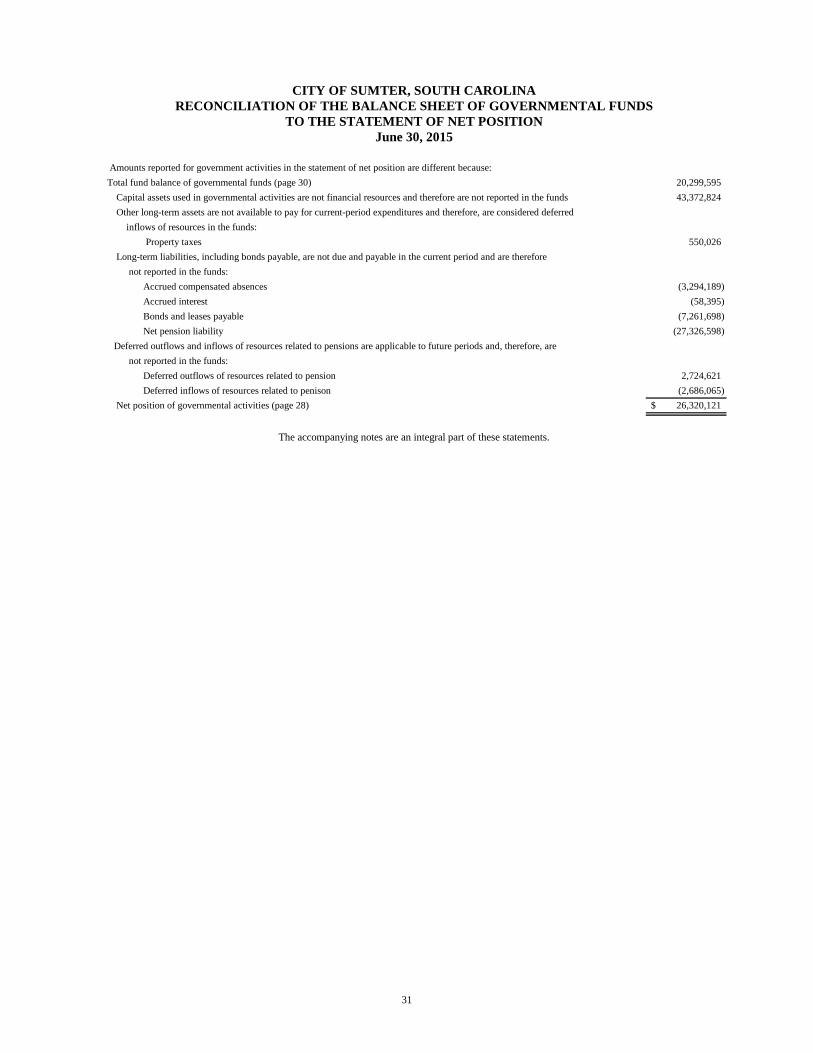
CITY OF SUMTER, SOUTH CAROLINA RECONCILIATION OF THE BALANCE SHEET OF GOVERNMENTAL FUNDS
TO THE STATEMENT OF NET POSITION June 30, 2015
Amounts reported for government activities in the statement of net position are different because: Total fund balance of governmental funds (page 30) 20,299,595
Capital assets used in governmental activities are not financial resources and therefore are not reported in the funds 43,372,824 Other long-term assets are not available to pay for current-period expenditures and therefore, are considered deferred inflows of resources in the funds:
Property taxes 550,026 Long-term liabilities, including bonds payable, are not due and payable in the current period and are therefore
Accrued compensated absences (3,294,189) Accrued interest (58,395) Bonds and leases payable (7,261,698) Net pension liability (27,326,598)
Deferred outflows and inflows of resources related to pensions are applicable to future periods and, therefore, are not reported in the funds:
Deferred outflows of resources related to pension 2,724,621 Deferred inflows of resources related to penison (2,686,065)
Net position of governmental activities (page 28) 26,320,121$
not reported in the funds:
The accompanying notes are an integral part of these statements.
32
CITY OF SUMTER, SOUTH CAROLINA
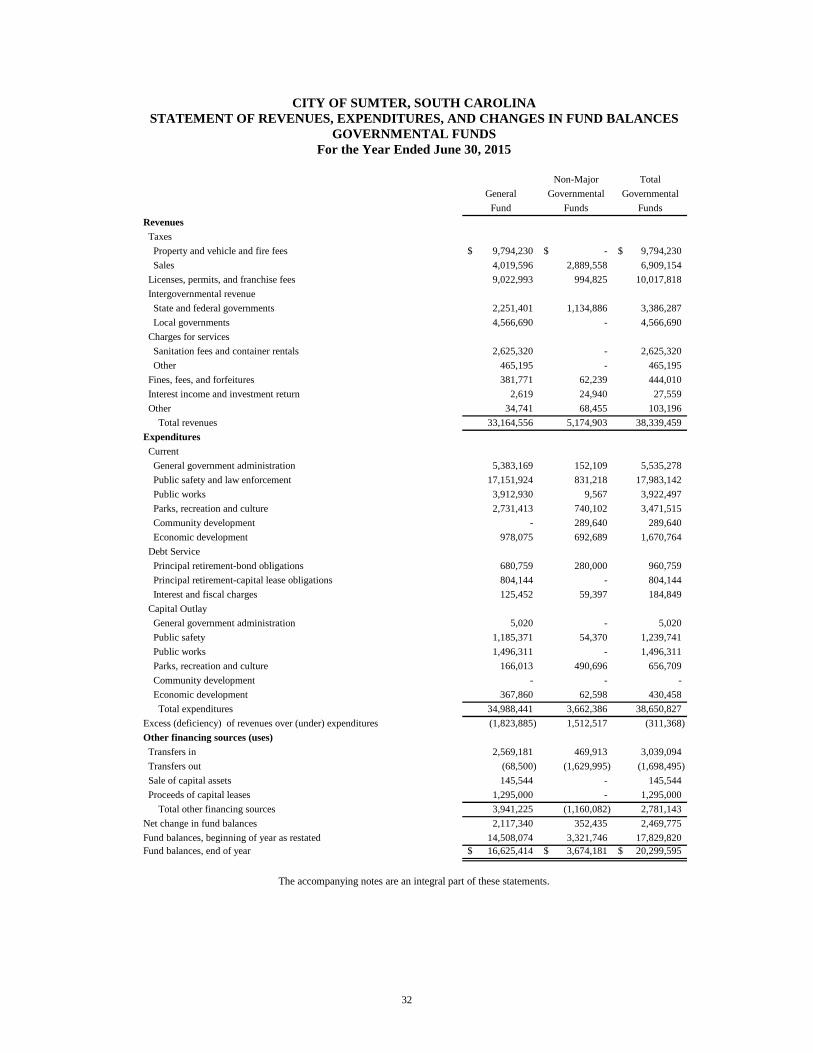
STATEMENT OF REVENUES, EXPENDITURES, AND CHANGES IN FUND BALANCES GOVERNMENTAL FUNDS
For the Year Ended June 30, 2015
Non-Major TotalGeneral Governmental Governmental
Fund Funds FundsRevenues Taxes Property and vehicle and fire fees 9,794,230$ -$ 9,794,230$ Sales 4,019,596 2,889,558 6,909,154 Licenses, permits, and franchise fees 9,022,993 994,825 10,017,818 Intergovernmental revenue State and federal governments 2,251,401 1,134,886 3,386,287 Local governments 4,566,690 - 4,566,690 Charges for services Sanitation fees and container rentals 2,625,320 - 2,625,320 Other 465,195 - 465,195 Fines, fees, and forfeitures 381,771 62,239 444,010 Interest income and investment return 2,619 24,940 27,559 Other 34,741 68,455 103,196 Total revenues 33,164,556 5,174,903 38,339,459 Expenditures Current General government administration 5,383,169 152,109 5,535,278 Public safety and law enforcement 17,151,924 831,218 17,983,142 Public works 3,912,930 9,567 3,922,497 Parks, recreation and culture 2,731,413 740,102 3,471,515 Community development - 289,640 289,640 Economic development 978,075 692,689 1,670,764 Debt Service Principal retirement-bond obligations 680,759 280,000 960,759 Principal retirement-capital lease obligations 804,144 - 804,144 Interest and fiscal charges 125,452 59,397 184,849 Capital Outlay General government administration 5,020 - 5,020 Public safety 1,185,371 54,370 1,239,741 Public works 1,496,311 - 1,496,311 Parks, recreation and culture 166,013 490,696 656,709 Community development - - - Economic development 367,860 62,598 430,458 Total expenditures 34,988,441 3,662,386 38,650,827 Excess (deficiency) of revenues over (under) expenditures (1,823,885) 1,512,517 (311,368) Other financing sources (uses) Transfers in 2,569,181 469,913 3,039,094 Transfers out (68,500) (1,629,995) (1,698,495) Sale of capital assets 145,544 - 145,544 Proceeds of capital leases 1,295,000 - 1,295,000 Total other financing sources 3,941,225 (1,160,082) 2,781,143 Net change in fund balances 2,117,340 352,435 2,469,775 Fund balances, beginning of year as restated 14,508,074 3,321,746 17,829,820 Fund balances, end of year 16,625,414$ 3,674,181$ 20,299,595$
The accompanying notes are an integral part of these statements.
33
CITY OF SUMTER, SOUTH CAROLINA
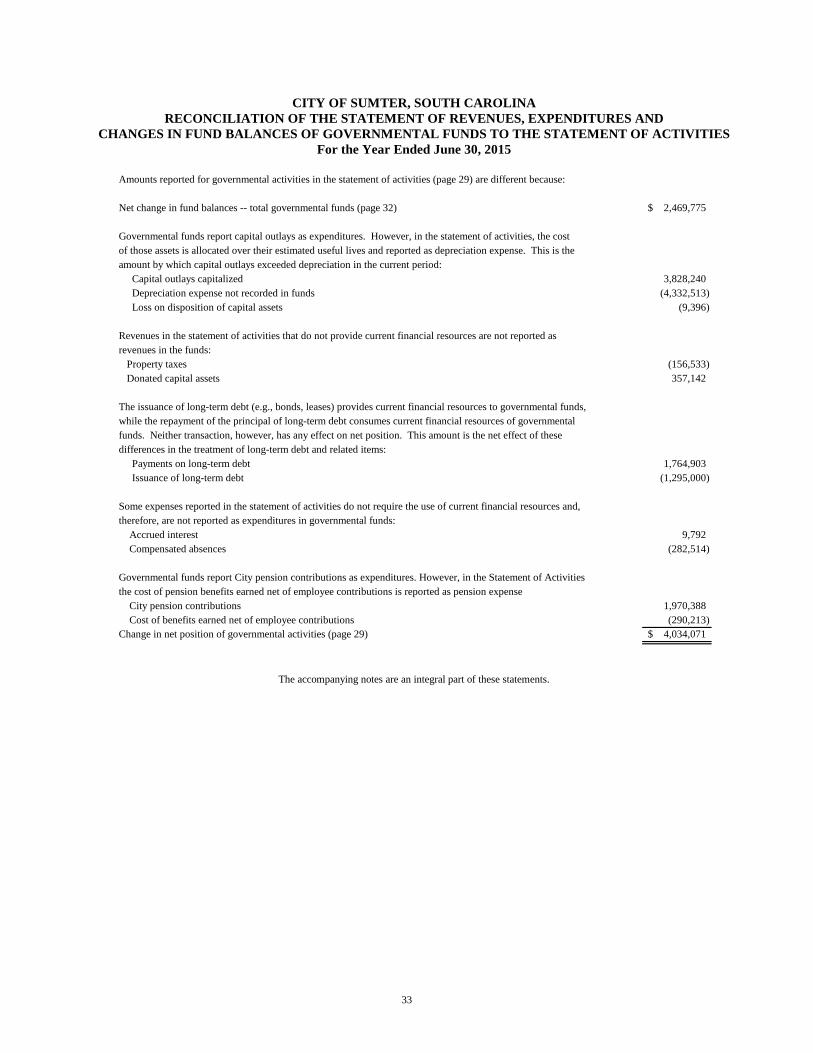
RECONCILIATION OF THE STATEMENT OF REVENUES, EXPENDITURES AND CHANGES IN FUND BALANCES OF GOVERNMENTAL FUNDS TO THE STATEMENT OF ACTIVITIES
For the Year Ended June 30, 2015
Amounts reported for governmental activities in the statement of activities (page 29) are different because:
Net change in fund balances -- total governmental funds (page 32) 2,469,775$
Governmental funds report capital outlays as expenditures. However, in the statement of activities, the costof those assets is allocated over their estimated useful lives and reported as depreciation expense. This is theamount by which capital outlays exceeded depreciation in the current period: Capital outlays capitalized 3,828,240 Depreciation expense not recorded in funds (4,332,513) Loss on disposition of capital assets (9,396)
Revenues in the statement of activities that do not provide current financial resources are not reported asrevenues in the funds: Property taxes (156,533) Donated capital assets 357,142
The issuance of long-term debt (e.g., bonds, leases) provides current financial resources to governmental funds,while the repayment of the principal of long-term debt consumes current financial resources of governmentalfunds. Neither transaction, however, has any effect on net position. This amount is the net effect of thesedifferences in the treatment of long-term debt and related items: Payments on long-term debt 1,764,903 Issuance of long-term debt (1,295,000)
Some expenses reported in the statement of activities do not require the use of current financial resources and,therefore, are not reported as expenditures in governmental funds: Accrued interest 9,792 Compensated absences (282,514)
Governmental funds report City pension contributions as expenditures. However, in the Statement of Activitiesthe cost of pension benefits earned net of employee contributions is reported as pension expense City pension contributions 1,970,388 Cost of benefits earned net of employee contributions (290,213) Change in net position of governmental activities (page 29) 4,034,071$
The accompanying notes are an integral part of these statements.

34
Page 1 of 2 CITY OF SUMTER, SOUTH CAROLINA
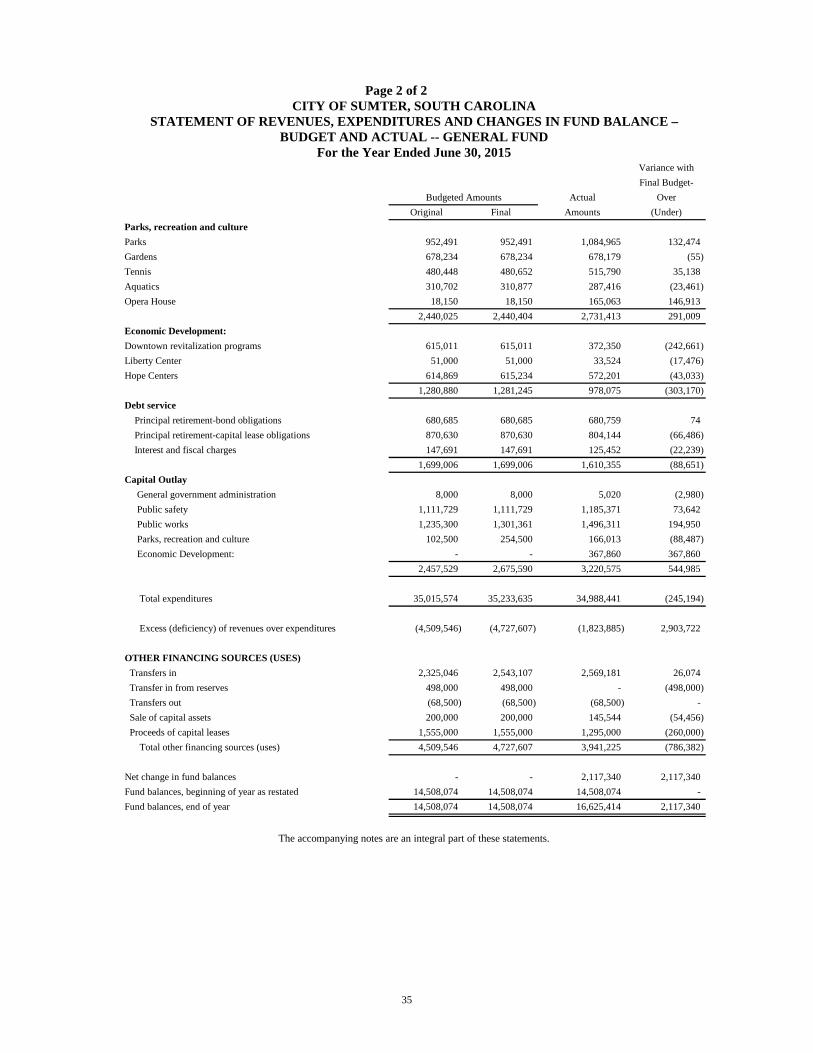
STATEMENT OF REVENUES, EXPENDITURES AND CHANGES IN FUND BALANCE – BUDGET AND ACTUAL -- GENERAL FUND
For the Year Ended June 30, 2015 Variance withFinal Budget-
Actual OverOriginal Final Amounts (Under)
REVENUESTaxes Property taxes 13,499,994$ 13,499,994$ 9,794,230$ (3,705,764)$ Sales - - 4,019,596 4,019,596 Licenses, permits and franchise fees 8,381,600 8,381,600 9,022,993 641,393 Intergovernmental revenue State government 874,277 874,277 2,251,401 1,377,124 Local governments 4,390,168 4,390,168 4,566,690 176,522 Charges for services Sanitation fees and container rentals 2,552,100 2,552,100 2,625,320 73,220 Other 98,842 98,842 465,195 366,353 Fines, fees, and forfeitures 364,347 364,347 381,771 17,424 Interest income and investment return 15,000 15,000 2,619 (12,381) Other 329,700 329,700 34,741 (294,959) Total revenues 30,506,028 30,506,028 33,164,556 2,658,528
EXPENDITURESGeneral government administration:Administration 1,527,625 1,530,000 1,737,211 207,211 City store 71,112 71,112 77,130 6,018 Planning 654,120 654,522 606,302 (48,220) Business license department 217,694 217,877 193,739 (24,138) Approriations to other agencies 258,281 258,281 256,161 (2,120) General insurance 729,500 729,500 560,500 (169,000) Retiree insurance 813,574 813,574 818,230 4,656 Maintenance contracts 774,591 832,591 810,544 (22,047) Miscellaneous 732,100 568,814 323,352 (245,462) 5,778,597 5,676,271 5,383,169 (293,102) Public Safety and Law Enforcement:Police 10,126,467 10,216,336 10,120,668 (95,668) Fire 5,828,732 5,832,694 5,834,601 1,907 Building inspection 811,589 811,996 738,987 (73,009) Codes enforcement 378,831 379,058 275,406 (103,652) Municipal court 172,767 172,767 182,262 9,495
17,318,386 17,412,851 17,151,924 (260,927) Public Works:Construction 519,264 519,264 500,388 (18,876) Public works 976,319 983,436 999,160 15,724 Buildings and grounds maintenance 30,000 30,000 16,964 (13,036) Sanitation 2,425,585 2,425,585 2,300,822 (124,763) Vehicle maintenance 89,983 89,983 95,596 5,613
4,041,151 4,048,268 3,912,930 (135,338) Continued
Budgeted Amounts
35
Page 2 of 2 CITY OF SUMTER, SOUTH CAROLINA
STATEMENT OF REVENUES, EXPENDITURES AND CHANGES IN FUND BALANCE – BUDGET AND ACTUAL -- GENERAL FUND
For the Year Ended June 30, 2015 Variance withFinal Budget-
Actual OverOriginal Final Amounts (Under)
Parks, recreation and cultureParks 952,491 952,491 1,084,965 132,474 Gardens 678,234 678,234 678,179 (55) Tennis 480,448 480,652 515,790 35,138 Aquatics 310,702 310,877 287,416 (23,461) Opera House 18,150 18,150 165,063 146,913
2,440,025 2,440,404 2,731,413 291,009 Economic Development:Downtown revitalization programs 615,011 615,011 372,350 (242,661) Liberty Center 51,000 51,000 33,524 (17,476) Hope Centers 614,869 615,234 572,201 (43,033)
1,280,880 1,281,245 978,075 (303,170) Debt service Principal retirement-bond obligations 680,685 680,685 680,759 74 Principal retirement-capital lease obligations 870,630 870,630 804,144 (66,486) Interest and fiscal charges 147,691 147,691 125,452 (22,239)
1,699,006 1,699,006 1,610,355 (88,651) Capital Outlay General government administration 8,000 8,000 5,020 (2,980) Public safety 1,111,729 1,111,729 1,185,371 73,642 Public works 1,235,300 1,301,361 1,496,311 194,950 Parks, recreation and culture 102,500 254,500 166,013 (88,487) Economic Development: - - 367,860 367,860 2,457,529 2,675,590 3,220,575 544,985
Total expenditures 35,015,574 35,233,635 34,988,441 (245,194)
Excess (deficiency) of revenues over expenditures (4,509,546) (4,727,607) (1,823,885) 2,903,722
OTHER FINANCING SOURCES (USES) Transfers in 2,325,046 2,543,107 2,569,181 26,074 Transfer in from reserves 498,000 498,000 - (498,000) Transfers out (68,500) (68,500) (68,500) - Sale of capital assets 200,000 200,000 145,544 (54,456) Proceeds of capital leases 1,555,000 1,555,000 1,295,000 (260,000) Total other financing sources (uses) 4,509,546 4,727,607 3,941,225 (786,382)
Net change in fund balances - - 2,117,340 2,117,340 Fund balances, beginning of year as restated 14,508,074 14,508,074 14,508,074 - Fund balances, end of year 14,508,074 14,508,074 16,625,414 2,117,340
Budgeted Amounts
The accompanying notes are an integral part of these statements.

36
CITY OF SUMTER, SOUTH CAROLINA STATEMENT OF NET POSITION
PROPRIETARY FUNDS June 30, 2015
Non-majorWater and Storm Water
Assets Sewer Fund Utility Fund Totals
Current assets: Cash and cash equivalents $ 5,887,792 $ 475,710 $ 6,363,502 Investments 10,004,760 - 10,004,760 Accounts receivable, net of allowance for uncollectibles 4,347,465 - 4,347,465 Total current assets 20,240,017 475,710 20,715,727 Non-current assets: Restricted cash and cash equivalents 2,998,574 - 2,998,574 Accounts receivable, net of allowance for uncollectibles 355,375 - 355,375 Interest in joint venture 100,000 - 100,000 Capital assets not being depreciated 2,788,541 - 2,788,541 Capital assets, depreciable, net of accumulated depreciation 78,606,205 1,146,013 79,752,218 Total non-current assets 84,848,695 1,146,013 85,994,708 Total assets 105,088,712 1,621,723 106,710,435
Deferred Outflows of ResourcesDeferred loss on bond refunding 27,691 - 27,691 Prepaid pension costs 601,204 8,449 609,653 Total deferred outflows of resources 628,895 8,449 637,344
LiabilitiesCurrent liabilities: Accrued interest payable 110,765 - 110,765 Accounts payable 750,032 65,673 815,705 Accrued payroll 98,472 1,247 99,719 Customer deposits 317,929 - 317,929 Compensated absences payable 141,056 453 141,509 Bonds and leases payable - current portion 1,863,615 - 1,863,615 Total current liabilities 3,281,869 67,373 3,349,242 Non-current liabilities: Compensated absences payable 329,125 1,057 330,182 Bonds and leases payable 28,821,193 - 28,821,193 Net pension liability 6,836,098 96,079 6,932,177 Total non-current liabilities 35,986,416 97,136 36,083,552 Total liabilities 39,268,285 164,509 39,432,794
Deferred Inflows of ResourcesUnavailable revenue - pension 576,333 8,101 584,434
Net PositionNet investment in capital assets 50,737,629 1,146,013 51,883,642 Restricted for debt service 2,998,574 - 2,998,574 Unrestricted 12,136,786 311,549 12,448,335 Total net position $ 65,872,989 $ 1,457,562 $ 67,330,551
Enterprise Funds
The accompanying notes are an integral part of these statements.

37
CITY OF SUMTER CITY, SOUTH CAROLINA
STATEMENT OF REVENUES, EXPENSES, AND CHANGES IN NET POSITION PROPRIETARY FUNDS
For the Year Ended June 30, 2015
Non-majorWater and Storm Water
Sewer Fund Utility Fund TotalsOperating revenue Charges for services Water 9,868,968$ -$ 9,868,968$ Sewer 9,703,231 - 9,703,231 Storm water - 557,137 557,137 Other operating revenue 1,505,408 - 1,505,408 Total operating revenues 21,077,607 557,137 21,634,744
Operating expenses Salaries and benefits 5,303,364 71,055 5,374,419 Bad debts 309,483 - 309,483 Utilties 2,018,303 - 2,018,303 Other operating expense 4,519,659 111,789 4,631,448 Depreciation 3,558,476 99,176 3,657,652 Total operating expenses 15,709,285 282,020 15,991,305
Operating income 5,368,322 275,117 5,643,439
Non-operating revenues (expenses) Interest expense (1,448,959) - (1,448,959) Miscellaneous expense (182,014) (37,140) (219,154) Interest income and investment return 363,005 - 363,005 Gain on sale of capital assets 18,062 - 18,062 Miscellaneous revenue 122,162 - 122,162 Total non-operating revenues (expenses) (1,127,744) (37,140) (1,164,884)
Income before contributions and transfers 4,240,578 237,977 4,478,555
Capital contributions 1,852,202 133,200 1,985,402 Transfers out (1,340,599) - (1,340,599) Change in net position 4,752,181 371,177 5,123,358
Total net position, beginning of year as restated 61,120,808 1,086,385 62,207,193
Total net position, end of year 65,872,989$ 1,457,562$ 67,330,551$
Enterprise Funds
The accompanying notes are an integral part of these statements.
38
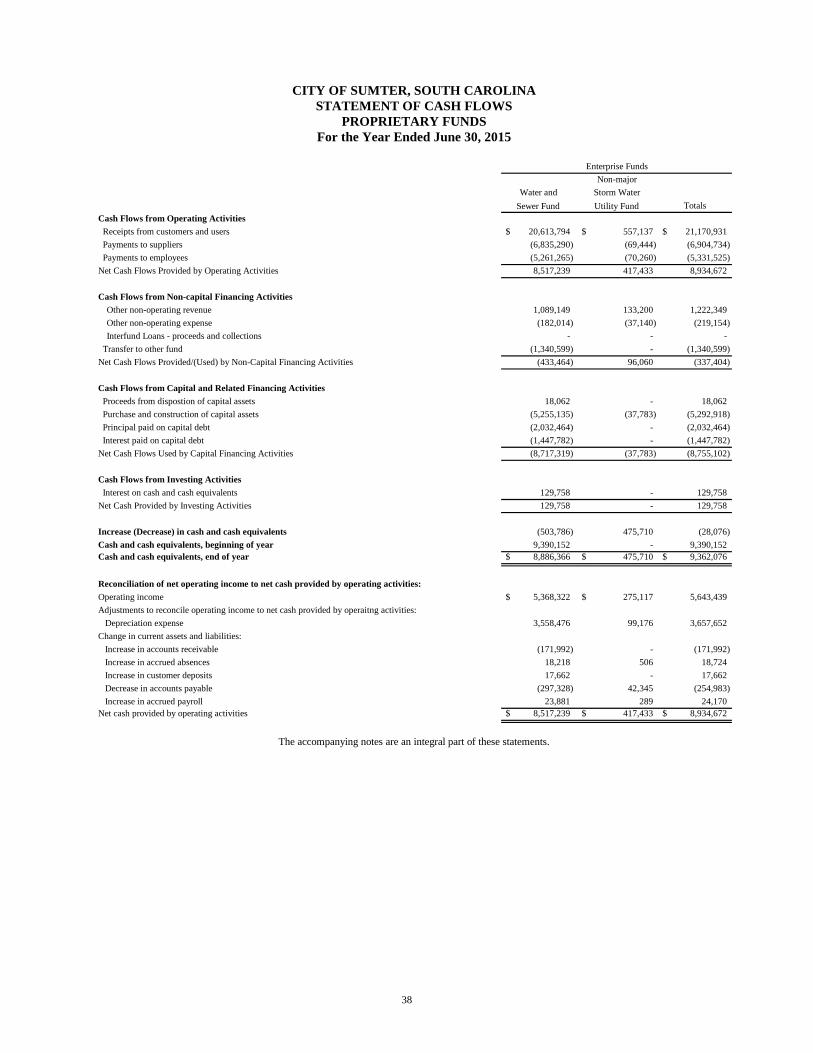
CITY OF SUMTER, SOUTH CAROLINA STATEMENT OF CASH FLOWS
PROPRIETARY FUNDS For the Year Ended June 30, 2015
Non-major Water and Storm Water
Sewer Fund Utility Fund TotalsCash Flows from Operating Activities Receipts from customers and users 20,613,794$ 557,137$ 21,170,931$ Payments to suppliers (6,835,290) (69,444) (6,904,734) Payments to employees (5,261,265) (70,260) (5,331,525) Net Cash Flows Provided by Operating Activities 8,517,239 417,433 8,934,672
Cash Flows from Non-capital Financing ActivitiesOther non-operating revenue 1,089,149 133,200 1,222,349 Other non-operating expense (182,014) (37,140) (219,154) Interfund Loans - proceeds and collections - - -
Transfer to other fund (1,340,599) - (1,340,599) Net Cash Flows Provided/(Used) by Non-Capital Financing Activities (433,464) 96,060 (337,404)
Cash Flows from Capital and Related Financing Activities Proceeds from dispostion of capital assets 18,062 - 18,062 Purchase and construction of capital assets (5,255,135) (37,783) (5,292,918) Principal paid on capital debt (2,032,464) - (2,032,464) Interest paid on capital debt (1,447,782) - (1,447,782) Net Cash Flows Used by Capital Financing Activities (8,717,319) (37,783) (8,755,102)
Cash Flows from Investing Activities Interest on cash and cash equivalents 129,758 - 129,758 Net Cash Provided by Investing Activities 129,758 - 129,758
Increase (Decrease) in cash and cash equivalents (503,786) 475,710 (28,076) Cash and cash equivalents, beginning of year 9,390,152 - 9,390,152 Cash and cash equivalents, end of year 8,886,366$ 475,710$ 9,362,076$
Reconciliation of net operating income to net cash provided by operating activities:Operating income 5,368,322$ 275,117$ 5,643,439 Adjustments to reconcile operating income to net cash provided by operaitng activities: Depreciation expense 3,558,476 99,176 3,657,652 Change in current assets and liabilities: Increase in accounts receivable (171,992) - (171,992) Increase in accrued absences 18,218 506 18,724 Increase in customer deposits 17,662 - 17,662 Decrease in accounts payable (297,328) 42,345 (254,983) Increase in accrued payroll 23,881 289 24,170 Net cash provided by operating activities 8,517,239$ 417,433$ 8,934,672$
Enterprise Funds
The accompanying notes are an integral part of these statements.

39
CITY OF SUMTER, SOUTH CAROLINA STATEMENT OF FIDUCIARY NET POSITION
FIDUCIARY FUNDS June 30, 2015
Private Purpose Agency Trusts Funds
Assets Cash and cash equivalents 8,921$ 1,544,227$ Receivables - 72,396 Total revenues 8,921$ 1,616,623$
Liabilities
Accounts payable -$ 30,786$ Unearned revenue - 4,850 Due to customers - 39,900 Due to other organization - 1,541,087 Total liabilities - 1,616,623
Net Position Held in trust for other purposes 8,921$ -$
The accompanying notes are an integral part of these statements.

40
CITY OF SUMTER, SOUTH CAROLINA STATEMENT OF CHANGES IN FIDUCIARY NET POSITION
FIDUCIARY FUNDS June 30, 2015
Additions
Interest 16$ Contributions - Total additions 16
Deductions Distributions to beneficiaries - Total additions -
Change in net postion 16 Net position, beginning of year 8,905 Net position, end of year 8,921$
The accompanying notes are an integral part of these statements.

CITY OF SUMTER, SOUTH CAROLINA NOTES TO FINANCIAL STATEMENTS
June 30, 2015
41
I. SUMMARY OF SIGNIFICANT ACCOUNTING POLICIES The City of Sumter, South Carolina was chartered in 1845 and incorporated in 1976. The City operates under a Council-Manager form of government which it adopted in 1912. Under this form of government, the City is governed by six council members elected from single-member districts and a mayor elected at large who serves as council chair. The council is the legislative body of the City and has the major responsibility for determining the policies and direction of the municipal government. The City manager reports to Council and is responsible for the City’s daily operations. The City’s financial statements have been prepared in accordance with Generally Accepted Accounting Principles (GAAP) as applied to governmental units. The Governmental Accounting Standards Board (GASB) is the accepted standard-setting body for establishing governmental accounting and financial reporting principles. In the government-wide financial statements and the fund financial statements for the proprietary funds, Financial Accounting Standards Board (FASB) pronouncements and Accounting Principles Board (APB) opinions issued on or before November 30, 1989, have been applied unless those pronouncements conflict with or contradict GASB pronouncements, in which case, GASB prevails. A. Reporting Entity As required by GAAP, basic financial statements of governmental units include not only information about the reporting, (i.e., primary) government but also about component units. Component units are organizations for which the primary government is financially accountable or organizations which are sufficiently significant to the primary government that their exclusion could cause the financial statements to be misleading or incomplete. Based on the applicable criteria, the City has determined it has no component units and that it is not a component unit of another entity. Therefore, the City reports as a primary entity. The City’s fiduciary funds are not included in the government wide-financial statements. The City’s fiduciary activities are used to report assets held by the City in a trustee or agency capacity and which, therefore, can’t be used to support the City’s own programs. In the City of Sumter these funds are primarily revenue collected for water companies other than the City of Sumter’s and funds escrowed for their respective programs. B. Basis of Presentation The City’s financial statements are presented from two perspectives, the government-wide perspective and the fund perspective. The government-wide financial statements consist of the Statement of Net Position and the Statement of Activities. The two statements report information on all of the non-fiduciary activities of the City (the “primary government”). Separate columns are used to distinguish between the City's governmental activities, which normally are supported by taxes and intergovernmental revenues, and the City’s business-type activities, which rely to a significant extent on fees and charges for support. Governmental activities generally incorporate data from governmental funds (see discussion below) while business-type activities generally incorporate data from enterprise funds. The Statement of Net Position reports all financial and capital resources of the City and reports the difference between assets and deferred outflows of resources, and liabilities and deferred inflows of resources, as net position, not as fund balance or equity. The Statement of Activities demonstrates the degree to which the direct expenses of a given function or segment, are offset by program revenues. Direct expenses are those that are clearly identifiable with a specific function or segment. Program revenues include 1) charges to customers or applicants who purchase, use, or directly benefit from goods, services or privileges provided by a given function or segment and 2) grants and contributions that are restricted to meeting the operational or capital requirements of a particular function or segment. Taxes and other items not properly included among program revenues are reported as general revenues. The

CITY OF SUMTER, SOUTH CAROLINA NOTES TO FINANCIAL STATEMENTS (CONTINUED)
June 30, 2015
42
comparison of direct expenses with program revenues identifies the extent to which each business segment or governmental function is self-financing or draws from the general revenues of the City. The use of multiple funds gives rise to interfund activity. Most, but not all, of this internal activity is eliminated from the government-wide statement of activities. Except for net residual balances which are reported as internal balances, amounts reported in the funds as interfund receivables and payables have been eliminated in the governmental and business-type activities columns of the Statement of Net Position. Amounts reported in the funds as receivable from or payable to fiduciary funds are included in the statement of net position as receivable from and payable to external parties. Fund financial statements present separate information for governmental funds, proprietary funds, and fiduciary funds, even though the latter are excluded from the government-wide financial statements. Funds are independent fiscal and accounting entities with self-balancing sets of accounts. The focus of governmental and enterprise fund financial statements is on major funds rather than reporting funds by type. Each major fund is presented in a separate column. Non-major funds, if any, are aggregated and presented in a single column. Fiduciary funds are reported by fund type. A fund is considered major if it is the primary operating fund of the City or meets the following criteria:
a. Total assets and deferred outflows of resources, liabilities and deferred inflows of resources, revenues, or expenditures/expenses of the individual governmental or enterprise fund are at least 10 percent of the corresponding total for all funds of that category of type; and
b. Total assets and deferred outflows of resources, liabilities and deferred inflows of resources, revenues, or expenditures/expenses of the individual governmental or enterprise fund are at least 5 percent of the corresponding total for all governmental and enterprise funds combined.
Governmental fund types are those through which most governmental functions of the City are financed. The City's expendable financial resources and related assets and deferred outflows of resources, and liabilities and deferred inflows of resources, (except for those accounted for in the Proprietary Fund and Fiduciary Funds) are accounted for through governmental funds. Governmental funds are accounted for using the current financial resources measurement focus and the modified accrual basis of accounting. The City reports one major governmental fund, the general fund. The General Fund is the general operating fund of the City and accounts for all revenues and expenditures of the City, except those required to be accounted for in another fund. All general tax revenues and other receipts that are not allocated by law or contractual agreement to other funds are accounted for in the General Fund. General operating expenditures, capital improvement costs, and general debt service that are not paid through other funds are paid from the General Fund. In addition, the City reports one nonmajor governmental fund type, the special revenue fund. The Special Revenue Fund, is used to account for the proceeds of designated specific revenue sources that are restricted by law or administrative actions to expenditures for specified purposes. Special revenue funds consist of the following:
USDA Rural Business Firemen's Fund Narcotics FundHUD Section 108 Empowerment Zone Victim's Assistance
Federal/State Grants Main Street Society Emergency 911Community Development Block Grants Local Hospitality Fee Hospitality Fee Revenue Bond
CDBG HOME State Accommodations Tax Sunday Alcohol PermitsDowntown Loan Local Accommodations Fee
Proprietary Funds are used to account for activities where the determination of net income is necessary or useful to provide sound financial administration. Proprietary funds distinguish operating revenues and expenses from non

CITY OF SUMTER, SOUTH CAROLINA NOTES TO FINANCIAL STATEMENTS (CONTINUED)
June 30, 2015
43
operating items. Operating revenues and expenses generally result from providing services and producing and delivering goods in connection with a proprietary fund’s principal ongoing operations. The principal operating revenues of enterprise funds are primarily charges for services and fees. Operating expenses for enterprise funds include the expense for providing goods and services, administrative expenses, maintenance, and depreciation of capital assets. All revenues and expenses not meeting this definition are reported as non-operating revenues and expenses. The City’s proprietary funds include two enterprise funds which are used to account for operations (a) that are financed and operated in a manner similar to private business enterprises — where the intent of the governing body is that the costs (expenses, including depreciation) of providing goods or services to the general public on a continuing basis be financed or recovered primarily through user charges; or (b) where the governing body has decided that periodic determination of revenues earned, expenses incurred, and/or net income is appropriate for capital maintenance, public policy, management control, accountability, or other purposes. The City reports one major enterprise fund, the Water and Sewer Fund, which is used to account for operations of the City’s water and sewer system. The City also reports one nonmajor enterprise fund, the Storm Water Utility Fund. Fiduciary Fund Types include the Private Purpose Trust Fund and the Agency Fund. These funds are used to account for assets held by the City in a trustee capacity for individuals, other governments, and/or other funds. The private purpose trust fund is used to account for resources legally held in trust. The Agency Fund is generally used to account for miscellaneous assets that the government holds on behalf of others. The Agency Fund is custodial in nature and does not present results of operations. C. Measurement Focus and Basis of Accounting The accounting and financial reporting treatment applied to a fund is determined by its measurement focus. Basis of accounting refers to when revenues and expenditures are recognized in the accounts and reported in the financial statements. The government-wide financial statements are reported using the economic resources measurement focus and the accrual basis of accounting, as are the proprietary fund and fiduciary fund financial statements. As a general rule, revenues are recognized when earned and expenses are recorded when a liability is incurred, regardless of the timing of related cash flows. Property taxes are recognized as revenues in the year for which they are levied. Grants and similar items are recognized as revenue as soon as all eligibility requirements imposed by the grantor have been met. Additionally, the effect of interfund activity has been eliminated from the government-wide financial statements, except for amounts due between the City's governmental activities and business-type activities. Governmental fund financial statements are reported using the current financial resources measurement focus and the modified accrual basis of accounting. Under the modified accrual basis of accounting, revenues are recognized when susceptible to accrual (i.e., when they become both measurable and available). Measurable means the amount of the transaction can be identified and available means collectible within the current period or soon enough thereafter (generally not to exceed 60 days) to be used to pay liabilities of the current period. Expenditures generally are recorded when a liability is incurred, as under accrual accounting. However, debt service expenditures, as well as expenditures related to compensated absences and claims and judgments, are recorded only when payment is due. Those revenues susceptible to accrual are property taxes, sales taxes, franchise fees, business licenses, charges for services, and hospitality fees. Revenues from state and federal grants are recorded when expenditures are incurred. Entitlements and shared revenues are recognized at the time of receipt or earlier if the susceptible to accrual criteria is met. Interest revenue is considered available when earned.

CITY OF SUMTER, SOUTH CAROLINA NOTES TO FINANCIAL STATEMENTS (CONTINUED)
June 30, 2015
44
Expenditures generally are recorded when a liability is incurred, as under accrual accounting. However, debt service expenditures, as well as expenditures related to compensated absences and claims and judgments, are recorded only when payments are due. General capital asset acquisitions are reported as expenditures in governmental funds. Proceeds of general long-term debt and acquisitions under capital leases are reported as other financing sources. Proprietary funds are accounted for on a flow of economic resources measurement focus. Under this method, the accrual basis of accounting is utilized, revenues are recognized when earned and expenses are recorded at the time liabilities are incurred. All assets and deferred outflows of resources, and liabilities and deferred inflows of resources associated with the operation of these funds are included on the balance sheet. Proprietary fund type operating statements present increases (i.e., revenue) and decreases (i.e., expenses) in net position by distinguishing operating revenues and expenses from non-operating items. Operating revenues and expenses generally result from providing services and producing and delivering goods in connection with a proprietary fund's principal ongoing operations. Operating expenses for enterprise funds include the cost of sales and services, administrative expenses, and depreciation on capital assets. All revenues and expenses not meeting this definition are reported as non-operating revenues and expenses. D. Budgetary Information Annual budgets are adopted for the general fund, the Local Hospitality, the Local Accommodation Tax, and the Victim’s Assistance special revenue funds, and the water and sewer enterprise fund. The general fund and the three special revenue funds budgets are prepared on a basis consistent with generally accepted accounting principles. The City’s administration prepares the budget no later than June 30. The appropriated budget is prepared by fund, function, department, activity and object and can be amended throughout the year by City Council approval. The City Manager may make transfers of appropriations within and among functions and funds. The legal level of budgetary control is total expenditures for the four budgeted funds on an individual basis. All annual appropriations lapse at fiscal year end. E. Assets, Deferred Outflows/Inflows of Resources, and Net Position/Fund Balance Cash and cash equivalents The government's cash and cash equivalents are considered to be cash on hand, demand deposits and short-term investments with original maturities of three months or less from the date of acquisition. All investments are reported at fair value. Cash equivalents, for purposes of the statement of cash flows for proprietary funds, are defined as short-term, highly liquid investments that are readily convertible to known amounts of cash and are so near their maturity that they present insignificant risk of changes in value due to changes in interest rates. Receivables and Payables Activity between funds that is representative of lending/borrowing arrangements outstanding at the end of the fiscal year is referred to as either "due to/from other funds" (i.e., the current portion of inter-fund loans) or "advances to/from other funds" (i.e., the non-current portion of inter-fund loans). Short-term advances between funds are accounted for in the appropriate inter-fund receivable and payable accounts as “due to/from” funds. All trade and property tax receivables are shown net of an allowance for uncollectibles. The property tax receivable allowance is equal to 75 percent of outstanding property taxes at June 30, 2015. Notes receivable are housing rehabilitation loans which were made under terms of expired Federal grant programs and recorded as receivables with offsetting deferred inflows of resources (explained later). Revenue is recognized only when cash is received. Inventories and Prepaid Items Inventories are valued at cost using the average cost method. The costs of governmental fund-type inventories are

CITY OF SUMTER, SOUTH CAROLINA NOTES TO FINANCIAL STATEMENTS (CONTINUED)
June 30, 2015
45
recorded as expenditures when consumed rather than when purchased. Inventories in the general fund consist of fuel, cleaning and office supplies and promotional items. Payments to vendors that reflect costs applicable to future period are recorded as prepaid items in both the government-wide and the fund financial statements. Real Estate Held for Resale Real estate held for resale is recorded at the lower of cost or its net realizable value. Restricted Assets Certain proceeds of general fund bonds and capital leases and enterprise fund revenue bonds, as well as certain resources set aside for their repayment, are classified as restricted assets on the balance sheet because their use is limited by applicable bond covenants. If both restricted and unrestricted resources are to be used for the same purpose, it is the government’s policy to first use restricted resources. At year end the City reports restricted cash in the amount of $4,746,569. Capital Assets Capital assets include all property, plant, equipment, vehicles, furniture, and infrastructure assets acquired or constructed. Capital assets are defined by the government as assets with a unit cost in excess of $5,000 and an estimated useful life in excess of one year. These assets are reported in the applicable governmental or business-type activities columns in the government-wide financial statements. Such assets are recorded at historical cost or estimated historical cost if purchased or constructed. Donated capital assets are recorded at estimated fair market value at the date of donation. The costs of normal maintenance and repairs that do not add to the value of the asset or materially extend asset lives are not capitalized. Major outlays for capital assets and improvements are capitalized as projects are constructed. Interest incurred (net of interest earned for tax exempt debt) is capitalized during the construction of qualifying assets. Construction in progress represents funds expended for construction of capital assets which have not yet been placed into service. Depreciation is computed using the straight-line method over the estimated useful lives of the assets as follows:
Asset Years Machinery and equipment 3 to 10 Vehicles 5 to 10 Buildings and improvements 15 to 40 Water and sewer systems 40 to 75 Infrastructure 10 to 20
Capitalized Interest Interest incurred during the construction phase of proprietary fund fixed assets is reflected in the capitalized value of the asset being constructed. Interest is not capitalized on assets acquired by gifts and grants that are restricted by the donor or grantor to the acquisition of those assets. The City does not capitalize interest on fixed assets used in governmental activities. During the year ended June 30, 2015, there was no capitalized interest incurred by the Water and Sewer Enterprise Fund. Deferred Outflows/Inflows of Resources In addition to assets, The City reports deferred outflows of resources in a separate section of its government-wide and proprietary funds statements. This separate financial statement element, deferred outflows of resources, represents a consumption of net position that applies to a future period. In addition to liabilities, the City reports deferred inflows of resources in a separate section of its government-wide and fund statements. This separate financial statement element, deferred inflows of resources, represents an acquisition of net position that applies to a future period. The difference between Deferred inflows of resources in the

CITY OF SUMTER, SOUTH CAROLINA NOTES TO FINANCIAL STATEMENTS (CONTINUED)
June 30, 2015
46
fund statements and the government-wide statements consists primarily of unavailable revenue related to property taxes which did not meet the ‘availability’ criteria under the modified accrual basis of accounting (collected within 60 days after fiscal year end). Compensated Absences City employees may accumulate up to 90 days of earned but unused sick leave, but the City does not pay employees separating from service for unused sick leave. In lieu of overtime compensation, the City may credit employees with compensatory time at the rate of 11/2 hours for each overtime hour worked. Employees who are scheduled to work on a holiday may receive an alternate day off to be scheduled by their supervisor or receive holiday pay. There is no cap on accrued compensatory or holiday time/pay. Exempt employees are not eligible for compensatory or holiday time/pay. All City employees are eligible for paid vacation. Fire suppression employees may carry forward a maximum of 900 unused vacation hours from one year to the next, and other employees may carry forward up to 600 such hours. Employees who terminate employment with the City prior to retirement can be paid for up to 24 days of unused vacation, provided they work a two week notice and have not been discharged for disciplinary reasons. In the year of their retirement from service with the city, employees may use up to 30 days of annual leave and be paid for up to 45 days of unused annual leave. All compensatory, holiday, and vacation pay is accrued when incurred in the government-wide and proprietary financial statements. A liability for these amounts is reported in governmental funds only when they mature because an employee resigns or retires. Long-term obligations In the government-wide financial statements and proprietary funds statements, long-term debt and other long-term obligations are reported as liabilities in the applicable statement of net position at the face amount of the debt issued. With the implementation of GASB 68, Accounting and Financial Reporting for Pension Plans, the City now reports its share of the net pension liability in relation to the two cost-sharing, multiple-employer defined benefit pension plans that it participates in, which are administered by the South Carolina Public Employee Benefit Authority (PEBA). In the past these long-term obligations were not required to be reported as liabilities of the City. This statement is effective for periods beginning after June 15, 2014. See “Restatement Adjustments” note for the cumulative effect of this statement on the City’s net position. In the fund financial statements, governmental fund types report the face amount of debt issued as other financing sources. The corresponding payments against the debt issued are reported as debt service expenditures. Property Taxes Taxes on real property are assessed as of January 1, levied the following September, due January 15, and become delinquent March 15. Liens attach to the property at the time the taxes are levied. The levy date for motor vehicle taxes is the first day of the month in which the motor vehicle license expires. These taxes are due by the last day of the same month. Net Position The components of the City’s net position are classified as follows: • Net investment in capital assets: This represents the City’s total investment in capital assets, net of any
outstanding debt obligations related to those capital assets. To the extent debt has been incurred but not yet expended for capital assets, such amounts are not included as a component of invested in capital assets.
• Restricted net position: Restricted net position includes resources in which the City is legally or contractually obligated to spend in accordance with restrictions imposed by external third parties such as state laws and lenders.

CITY OF SUMTER, SOUTH CAROLINA NOTES TO FINANCIAL STATEMENTS (CONTINUED)
June 30, 2015
47
• Unrestricted net position: Unrestricted net position represents resources which may be used to meet current expenses for any purpose.
Governmental Fund Balances Governmental fund balance is divided into five classifications based primarily on the extent to which the City is bound to observe constraints imposed upon the use of the resources in the applicable governmental fund. The classifications are as follows: • Nonspendable: The nonspendable fund balance category includes amounts that cannot be spent because they are not in spendable form (e.g., inventories and prepaid amounts), or are legally or contractually required to be maintained intact.
• Restricted: Fund balance is reported as restricted when constraints placed on the use of resources are either externally imposed by creditors (such as through debt covenants), grantors, contributors, or laws or regulations of other governments or imposed by law through constitutional provisions or enabling legislation (i.e., city ordinances). Enabling legislation authorizes the City to assess, levy, charge, or otherwise mandate payment of resources (from external resource providers) and includes a legally enforceable requirement that those resources be used only for the specific purposes stipulated in the legislation. Legal enforceability means that the City can be compelled by an external party such as citizens, public interest groups, or the judiciary to use resources created by enabling legislation only for the purposes specified by the legislation. • Committed: The committed fund balance classification includes amounts that can be used only for the specific purposes imposed by formal action (ordinance or resolution) of the City Council. Those committed amounts cannot be used for any other purpose unless City Council removes or changes the specified use by taking the same type of action (ordinance or resolution) it employed to commit those amounts previously. In contrast to fund balance that is restricted by enabling legislation, committed fund balance classification may be redeployed for other purposes with appropriate due process. Constraints imposed on the use of committed amounts are imposed by City Council, separate from the authorization to raise the underlying revenue; therefore, compliance with these constraints is not considered to be legally enforceable. Committed fund balance also incorporates contractual obligations to the extent that existing resources in the fund have been specifically committed for use in satisfying those contractual requirements. • Assigned: Amounts in the assigned fund balance classification are intended to be used by the City for specific purposes but do not meet the criteria to be classified as restricted or committed. In governmental funds other than the general fund, assigned fund balance represents the remaining amount that is not restricted or committed. In the general fund, assigned amounts represent intended uses established by City Council or by a City official or body to which Council has delegated the authority to assign amounts to be used for specific purposes. • Unassigned: Unassigned fund balance is the residual classification for the general fund and includes all spendable amounts not contained in the other classifications. In other governmental funds, the unassigned classification is used only to report a deficit fund balance resulting from overspending for specific purposes for which amounts had been restricted, committed, or assigned.
The City applies restricted resources first when expenditures are incurred for purposes for which either restricted or unrestricted (committed, assigned, and unassigned) amounts are available. Similarly, within unrestricted fund balance, committed amounts are reduced first followed by assigned, and then unassigned amounts when expenditures are incurred for purposes for which amounts in any of the unrestricted fund balance classifications could be used. Use of Estimates The preparation of financial statements in conformity with accounting principles generally accepted in the United
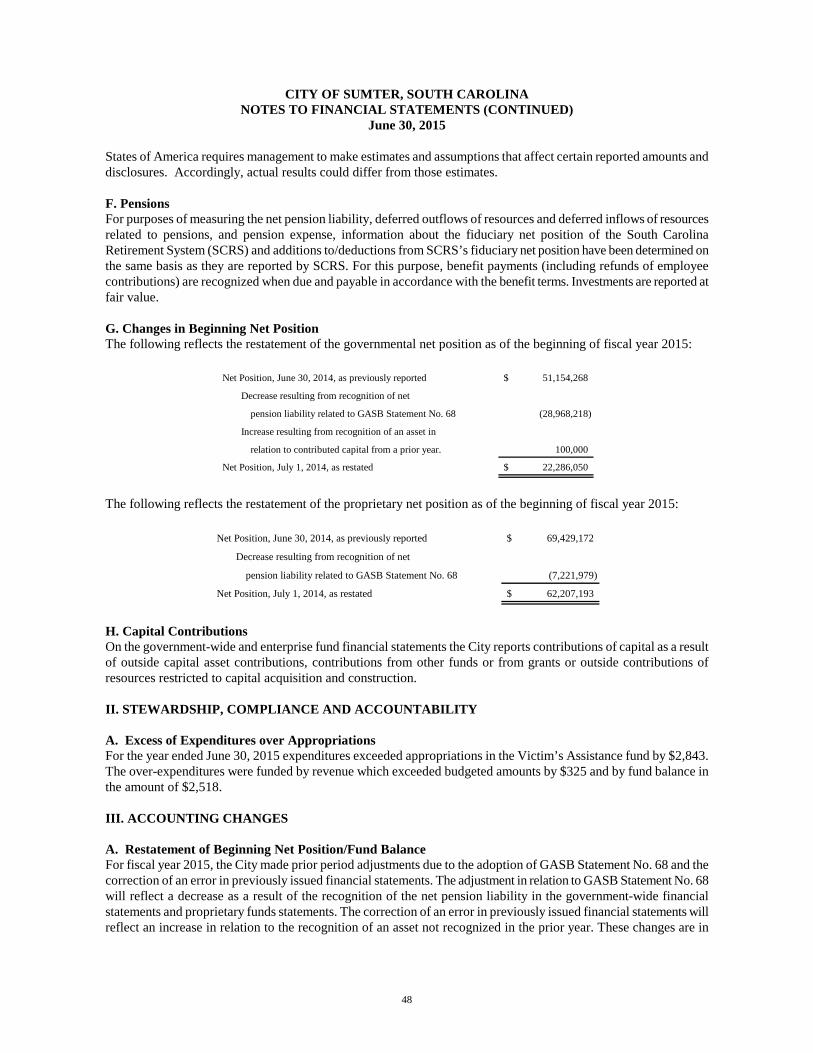
CITY OF SUMTER, SOUTH CAROLINA NOTES TO FINANCIAL STATEMENTS (CONTINUED)
June 30, 2015
48
States of America requires management to make estimates and assumptions that affect certain reported amounts and disclosures. Accordingly, actual results could differ from those estimates. F. Pensions For purposes of measuring the net pension liability, deferred outflows of resources and deferred inflows of resources related to pensions, and pension expense, information about the fiduciary net position of the South Carolina Retirement System (SCRS) and additions to/deductions from SCRS’s fiduciary net position have been determined on the same basis as they are reported by SCRS. For this purpose, benefit payments (including refunds of employee contributions) are recognized when due and payable in accordance with the benefit terms. Investments are reported at fair value. G. Changes in Beginning Net Position The following reflects the restatement of the governmental net position as of the beginning of fiscal year 2015:
Net Position, June 30, 2014, as previously reported 51,154,268$
Decrease resulting from recognition of net
pension liability related to GASB Statement No. 68 (28,968,218)
Increase resulting from recognition of an asset in
relation to contributed capital from a prior year. 100,000
Net Position, July 1, 2014, as restated 22,286,050$
The following reflects the restatement of the proprietary net position as of the beginning of fiscal year 2015:
Net Position, June 30, 2014, as previously reported 69,429,172$
Decrease resulting from recognition of net
pension liability related to GASB Statement No. 68 (7,221,979)
Net Position, July 1, 2014, as restated 62,207,193$
H. Capital Contributions On the government-wide and enterprise fund financial statements the City reports contributions of capital as a result of outside capital asset contributions, contributions from other funds or from grants or outside contributions of resources restricted to capital acquisition and construction. II. STEWARDSHIP, COMPLIANCE AND ACCOUNTABILITY A. Excess of Expenditures over Appropriations For the year ended June 30, 2015 expenditures exceeded appropriations in the Victim’s Assistance fund by $2,843. The over-expenditures were funded by revenue which exceeded budgeted amounts by $325 and by fund balance in the amount of $2,518. III. ACCOUNTING CHANGES A. Restatement of Beginning Net Position/Fund Balance For fiscal year 2015, the City made prior period adjustments due to the adoption of GASB Statement No. 68 and the correction of an error in previously issued financial statements. The adjustment in relation to GASB Statement No. 68 will reflect a decrease as a result of the recognition of the net pension liability in the government-wide financial statements and proprietary funds statements. The correction of an error in previously issued financial statements will reflect an increase in relation to the recognition of an asset not recognized in the prior year. These changes are in
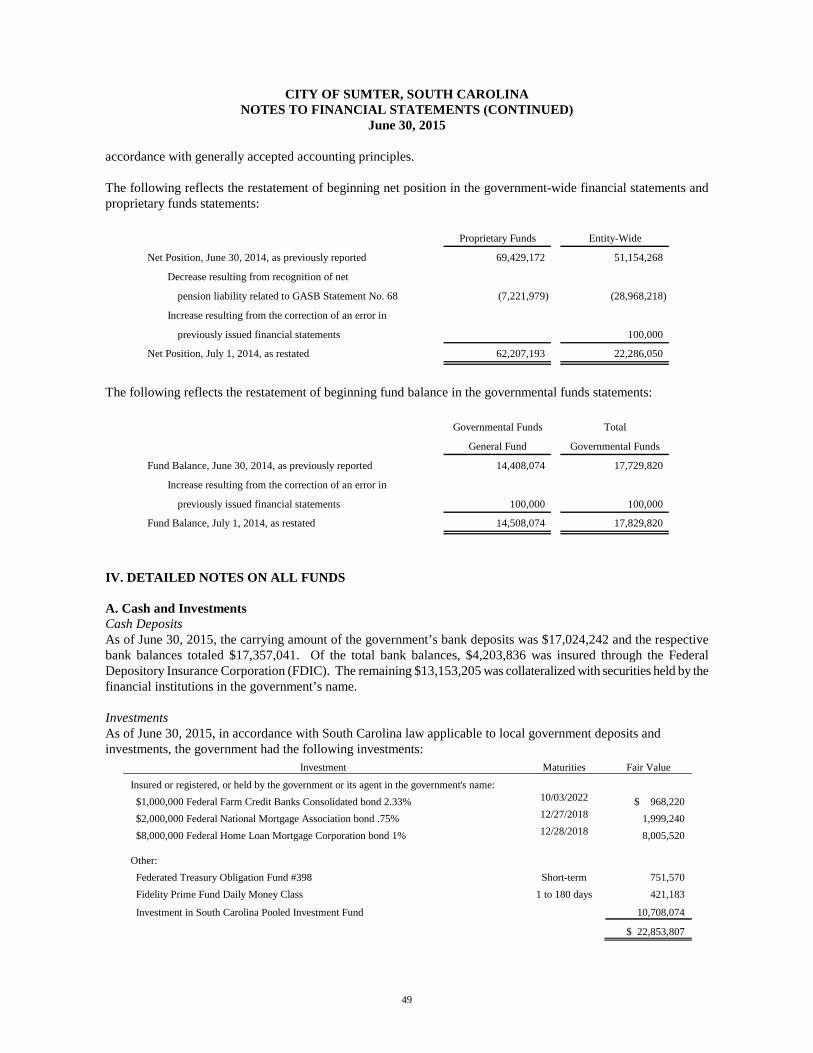
CITY OF SUMTER, SOUTH CAROLINA NOTES TO FINANCIAL STATEMENTS (CONTINUED)
June 30, 2015
49
accordance with generally accepted accounting principles. The following reflects the restatement of beginning net position in the government-wide financial statements and proprietary funds statements:
Proprietary Funds Entity-Wide
Net Position, June 30, 2014, as previously reported 69,429,172 51,154,268
Decrease resulting from recognition of net
pension liability related to GASB Statement No. 68 (7,221,979) (28,968,218)
Increase resulting from the correction of an error in
previously issued financial statements 100,000
Net Position, July 1, 2014, as restated 62,207,193 22,286,050
The following reflects the restatement of beginning fund balance in the governmental funds statements:
Governmental Funds Total
General Fund Governmental Funds
Fund Balance, June 30, 2014, as previously reported 14,408,074 17,729,820
Increase resulting from the correction of an error in
previously issued financial statements 100,000 100,000
Fund Balance, July 1, 2014, as restated 14,508,074 17,829,820
IV. DETAILED NOTES ON ALL FUNDS A. Cash and Investments Cash Deposits As of June 30, 2015, the carrying amount of the government’s bank deposits was $17,024,242 and the respective bank balances totaled $17,357,041. Of the total bank balances, $4,203,836 was insured through the Federal Depository Insurance Corporation (FDIC). The remaining $13,153,205 was collateralized with securities held by the financial institutions in the government’s name. Investments As of June 30, 2015, in accordance with South Carolina law applicable to local government deposits and investments, the government had the following investments:
Investment Maturities Fair Value
Insured or registered, or held by the government or its agent in the government's name: $1,000,000 Federal Farm Credit Banks Consolidated bond 2.33% 10/03/2022 $ 968,220 $2,000,000 Federal National Mortgage Association bond .75% 12/27/2018 1,999,240 $8,000,000 Federal Home Loan Mortgage Corporation bond 1% 12/28/2018 8,005,520 Other: Federated Treasury Obligation Fund #398 Short-term 751,570 Fidelity Prime Fund Daily Money Class 1 to 180 days 421,183
Investment in South Carolina Pooled Investment Fund 10,708,074
$ 22,853,807

CITY OF SUMTER, SOUTH CAROLINA NOTES TO FINANCIAL STATEMENTS (CONTINUED)
June 30, 2015
50
The City’s investments also include a life insurance contract on the life of an employee. At year end, this contract had no cash surrender value. South Carolina Pooled Investment Fund The South Carolina Pooled Investment Fund (the “Pool”) funds are invested with the South Carolina State Treasurer’s Office, which established the Pool pursuant to Section 6-6-10 of the South Carolina Code. The Pool is an investment trust fund, in which public monies in excess of current needs, which are under the custody of any city treasurer or any governing body of a political subdivision of the State, may be deposited. The Pool is a 2a 7-like pool which is not registered with the Securities and Exchange Commission (“SEC”) as an investment company, but has a policy that it will operate in a manner consistent with the SEC’s Rule 2a 7 of the Investment Company Act of 1940. In accordance with GASB Statement No. 31, “Accounting and Financial Reporting for Certain Investments and for External Investment Pools”, investments are carried at fair value determined annually based upon quoted market prices. The total fair value of the Pool is apportioned to the entities with funds invested on an equal basis for each share owned, which are acquired at a cost of $1. Credit Risk State law limits local government investments to (1) obligations of the United States and agencies thereof; (2) general obligations of the State of South Carolina or any of its political units; (3) savings and loan association deposits to the extent insured by the Federal Deposit Insurance Corporation (FDIC); (4) certificates of deposits and repurchase agreements collateralized by securities of the type described in (1) and (2) above held by a third party as escrow agent or custodian, at a market value not less than the amount of certificates of deposit and repurchase agreements so secured, including interest; and (5) no load open and closed-end portfolios of certain investment companies with issues of the US Government. The City has no investment policy that would further limit its investment choices. As of year end, the City’s investment in the South Carolina Pooled Investment Fund was unrated. The government’s investments in Federated Treasury Obligation Fund #398 and Fidelity Prime Fund Daily Money Class were both rated Aaa-mf by Moody’s and AAAm by Standard & Poor’s. Interest Rate Risk. Interest rate risk is the risk that changes in interest rates will adversely affect the fair value of an investment. As such, the key factor in measuring the City’s interest rate risk is the length of maturity of its debt securities. The earliest maturity date of the debt securities held by the City at year end is December 27, 2018, at which time a face value in the amount of $2,000,000 will mature. Another $8,000,000 is set to mature on December 28, 2018. In addition, debt securities with a face value of $1,000,000 will mature in the year 2022. It is also important to note that $10,000,000 in face value of the debt securities held by the City are considered ‘step up’ bonds, which are designed to minimize interest rate risk by periodically increasing the coupon payment by a predetermined amount. In addition, all of the City’s holdings in debt securities become callable at their face value within three months after year end. B. Receivables Receivables as of year end for the government’s individual major funds, including the applicable allowances for uncollectible accounts are as follows:

CITY OF SUMTER, SOUTH CAROLINA NOTES TO FINANCIAL STATEMENTS (CONTINUED)
June 30, 2015
51
Special Water andGeneral Revenue Sewer
Fund Fund Fund TotalCurrent: Taxes Property 1,164,578$ -$ -$ 1,164,578$ Sales and franchise 98,745 239,540 - 338,285 Intergovernmental 1,178,416 728,833 603,994 2,511,243 Accounts 157,499 - 2,639,210 2,796,709 Unbilled receivables - - 1,095,912 1,095,912 Loans and notes 101,132 809,270 45,000 955,402 Interest - - 20,389 20,389 Other - - 80,577 80,577 Non-current: Notes - - 355,375 355,375 Gross receivables 2,700,370 1,777,643 4,840,457 9,318,470 Less, allowance for uncollectibles (920,712) - (137,617) (1,058,329) Net total receivables 1,779,658$ 1,777,643$ 4,702,840$ 8,260,141$
C. Unearned Revenue Governmental funds report unearned revenue in connection with resources that have been received, but not yet earned. At year end, the City reports $6,400 in unearned revenue in relation to charges that were received in advance of the applicable reporting period. D. Capital Assets Capital asset activity for the City for the year ended June 30, 2015 was as follows:
Beginning EndingBalance Increases Decreases Transfers Balance
Governmental activities:Capital assets not being depreciated: Land 12,067,279$ 81,008$ -$ -$ 12,148,287$ Works of Art 396,866 - - - 396,866 Construction in progress 789,635 584,422 - (652,123) 721,934 Total capital assets not being depreciated 13,253,780 665,430 - (652,123) 13,267,087
Capital assets being depreciated: Infrastructure 29,294,743 1,050,908 - 652,123 30,997,774 Buildings and improvements 23,521,965 - - - 23,521,965 Motor vehicles and outdoor equipment 18,290,196 2,449,949 844,913 - 19,895,232 Office equipment 3,207,557 19,095 - - 3,226,652 Total capital assets being depreciated 74,314,461 3,519,952 844,913 652,123 77,641,623 Less accumulated depreciation for:
Infrastructure 17,235,832 1,757,092 - - 18,992,924 Buildings and improvements 11,011,180 822,686 - - 11,833,866 Motor vehicles and outdoor equipment 12,705,797 1,718,437 835,517 - 13,588,717 Office equipment 3,086,081 34,298 - - 3,120,379 Total accumulated depreciation 44,038,890 4,332,513 835,517 - 47,535,886 Total capital assets being depreciated, net 30,275,571 (812,561) 9,396 652,123 30,105,737
Governmental activities capital assets, net 43,529,351$ (147,131)$ 9,396$ -$ 43,372,824$

CITY OF SUMTER, SOUTH CAROLINA NOTES TO FINANCIAL STATEMENTS (CONTINUED)
June 30, 2015
52
Beginning EndingBalance Increases Decreases Transfers Balance
Business-type activities:Capital assets not being depreciated: Land 338,412$ 208,466$ -$ -$ 546,878 Construction in progress 4,595,200 4,042,720 (6,396,257) 2,241,663 Total capital assets not being depreciated 4,933,612 4,251,186 - (6,396,257) 2,788,541
Capital assets being depreciated: Buildings 493,653 - - - 493,653 Plants and improvements 71,789,659 - - - 71,789,659 Distribution and collection system 49,439,836 911,567 - 5,923,828 56,275,231 Wells and tanks 5,874,529 180,821 - 282,667 6,338,017 Machinery and equipment 10,013,881 581,865 62,794 189,762 10,722,714 Total capital assets being depreciated 137,611,558 1,674,253 62,794 6,396,257 145,619,274
Less accumulated depreciation for: Buildings 320,872 12,341 - - 333,213 Plants and improvements 33,837,276 1,613,768 - - 35,451,044 Distribution and collection system 16,666,289 1,021,059 - - 17,687,348 Wells and tanks 3,750,740 298,554 - - 4,049,294 Machinery and equipment 7,694,721 711,930 60,494 - 8,346,157 Total accumulated depreciation 62,269,898 3,657,652 60,494 - 65,867,056 Total capital assets being depreciated, net 75,341,660 (1,983,399) 2,300 6,396,257 79,752,218
Business-type activities capital assets, net 80,275,272$ 2,267,787$ 2,300$ -$ 82,540,759$
Depreciation expense was charged to functions/programs of the government as follows:
Governmental activities: General government 177,521$ Public safety 1,188,649 Public works 1,764,102 Parks, recreation and culture 813,477 Community development 141,951 Economic development 246,813
4,332,513$
Business-type activities: Water and sewer services 3,657,652$
3,657,652$
Total depreciation expense - governmental activities
Total depreciation expense - business type activities

CITY OF SUMTER, SOUTH CAROLINA NOTES TO FINANCIAL STATEMENTS (CONTINUED)
June 30, 2015
53
Construction in progress and construction commitments for governmental activities and business-type activities consisted of the following at year end:
Contract
Expenditures Total Payments
To Date Contract Remaining
Governmental Activities
Tennis Courts/Pro Shop 10,090 10,090 -
Downtown Revitalization 83,482 780,734 697,252
South Main/Bartlette Streetscape 401,402 401,402 -
Palmetto Park Phase III Fencing 42,072 50,290 8,218
Police Station 65,411 68,173 2,762
Fire Station 38,106 48,071 9,965
Parking Garage 6,430 7,130 700
Storage Building at Swan Lake 8,402 9,897 1,495
Aquatics Center Building Expansion 14,649 35,165 20,516
Liberty Center Façade 51,890 202,219 150,329
Total Governmental 721,934 1,613,171 891,237
Business-type Activities
Mayesville Sprayfields 143,648 151,551 7,903
SCADA System 198,348 727,866 529,518
Water Plant #6 881,220 8,000,000 7,118,780
Utility Billing Dept. Building 7,789 32,375 24,586
Well #3 Water Plant #4 181,755 247,773 66,018
WL @ Calhoun/Main & E. Liberty 73,318 166,645 93,327
9 & 11 S. Main St./16 E. Liberty St. 212,859 212,859 -
Wastewater Infiltration Study 11,070 58,010 46,940
Rember Water System Infrastructure 531,656 620,637 88,981
Total Business-type Activities 2,241,663 10,217,716 7,656,201
2,963,597 11,830,887 8,547,438
E. Long-Term Obligations The following is a summary of changes in long-term obligations for the year ended June 30, 2015, for both the City’s governmental activities and business-type activities. Details by type of obligation and a summary of debt service requirements follow.

CITY OF SUMTER, SOUTH CAROLINA NOTES TO FINANCIAL STATEMENTS (CONTINUED)
June 30, 2015
54
Summary of changes in long-term obligations:
Beginning Ending Due WithinBalance Additions Reductions Balance One Year
Governmental activities:General obligation bonds $ 3,395,067 $ - $ 680,760 $ 2,714,307 458,845$ Revenue bonds 1,263,000 - 243,000 1,020,000 248,000 Notes payable 673,000 - 37,000 636,000 39,000 Capital leases 2,400,533 1,295,000 804,142 2,891,391 901,179 Compensated absences 3,011,675 1,734,222 1,451,708 3,294,189 1,021,201 Governmental activity long-term liabilities 10,743,275$ 3,029,222$ 3,216,610$ 10,555,887$ 2,668,225$
Business-type activities: Revenue bonds 32,717,272$ -$ 2,032,464$ $ 30,684,808 1,863,615$ Compensated absences 452,967 225,644 206,920 471,691 141,509 Business-type activity long-term liabilities 33,170,239$ 225,644$ 2,239,384$ 31,156,499$ 2,005,124$
General Obligation Bonds The City has issued general obligation bonds to provide for construction and purchase of capital assets used in carrying out its governmental activities. General obligation bonds have been issued only for general government activities. General obligation bonds are direct obligations and pledge the City’s full faith and credit. General obligation bonds outstanding as of year end are as follows:
$2,000,000 Series 2010, payable in annual installments varying from $247,436 to $255,773 including interest at 3.63%, maturing May 2019 930,000
$1,000,000 Series 2011, payable in annual installments of $112,501 including interest at 2.31%, maturing July 2021 719,260
$1,500,000 Series 2012, payable in annual installments of $165,006 including interest at 2.07%, maturing September 2021 1,065,047 Total General Obligation Bonds 2,714,307$
Revenue Bonds The City has issued a revenue bond in order to fund construction projects which will enhance tourism as follows:
$1,734,000 Hospitality Fee Revenue Bond, Series 2011, payable in semi-annual installments varying from $2,672 to $264,672 including interest at 2.04%, maturing August 2018, collateralized by assignment of hospitality fee revenue 1,020,000$
The City has also issued revenue bonds to finance construction and expansion of the water and sewer system. These bonds are secured by liens on and pledges of water and sewer revenue net of system operating and maintenance costs. Water and sewer revenue bonds outstanding at year end were as follows:

CITY OF SUMTER, SOUTH CAROLINA NOTES TO FINANCIAL STATEMENTS (CONTINUED)
June 30, 2015
55
$815,000 Series 2000, payable in annual installments of $65,768 including interest at 5.29%, maturing June 2020 282,427$
$31,855,000 Series 2007, payable in annual installments varying from $808,882 to $2,165,000 including interest varying from 4 to 5%, maturing December 2032 26,835,000
$7,018,000 Series 2010, payable in annual installments varying from $714,820 to $931,636 including interest at 2.99% 3,567,381 Total Revenue Bonds Payable 30,684,808$
Notes The City has issued notes to finance various development projects. Notes payable at year end were as follows:
$843,000 note payable in annual installments to the US Department of Housing and Urban Development in annual installments ranging from $30,000 to $69,000 including interest at 4.5%, maturing August 2026 636,000 Total Notes Payable 636,000$
Capital Leases The City has entered into lease agreements to finance acquisition of buildings, vehicles and heavy equipment and office equipment used in governmental activities. The lease agreements qualify as capital leases for accounting purposes and, therefore, have been recorded at the present value of the future minimum lease payments as of the inception date as follows:
GovernmentalYear Ending June 30, Activities
2016 941,759$ 2017 783,927 2018 578,174 2019 427,039 2020 252,287
Thereafter - Total minimum lease payments 2,983,186 Less: amount representing interest (91,795) Present value of minimum lease payments 2,891,391$
The assets acquired through capital leases are as follows:
GovernmentalActivities
Asset: Motor vehicles and outdoor equipment 5,836,041$ Less: accumulated depreciation (2,375,810) Total 3,460,231$
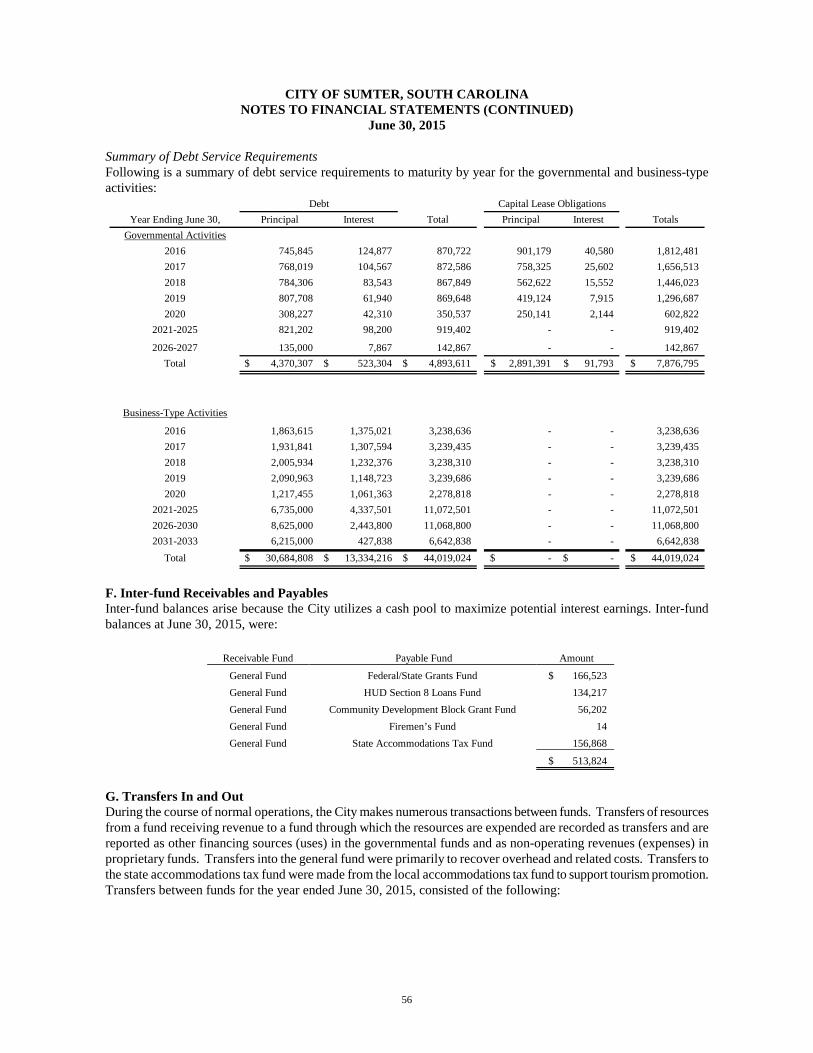
CITY OF SUMTER, SOUTH CAROLINA NOTES TO FINANCIAL STATEMENTS (CONTINUED)
June 30, 2015
56
Summary of Debt Service Requirements Following is a summary of debt service requirements to maturity by year for the governmental and business-type activities:
Year Ending June 30, Principal Interest Total Principal Interest TotalsGovernmental Activities
2016 745,845 124,877 870,722 901,179 40,580 1,812,481 2017 768,019 104,567 872,586 758,325 25,602 1,656,513 2018 784,306 83,543 867,849 562,622 15,552 1,446,023 2019 807,708 61,940 869,648 419,124 7,915 1,296,687 2020 308,227 42,310 350,537 250,141 2,144 602,822
2021-2025 821,202 98,200 919,402 - - 919,402
2026-2027 135,000 7,867 142,867 - - 142,867 Total 4,370,307$ 523,304$ 4,893,611$ 2,891,391$ 91,793$ 7,876,795$
Business-Type Activities
2016 1,863,615 1,375,021 3,238,636 - - 3,238,636 2017 1,931,841 1,307,594 3,239,435 - - 3,239,435 2018 2,005,934 1,232,376 3,238,310 - - 3,238,310 2019 2,090,963 1,148,723 3,239,686 - - 3,239,686 2020 1,217,455 1,061,363 2,278,818 - - 2,278,818
2021-2025 6,735,000 4,337,501 11,072,501 - - 11,072,501 2026-2030 8,625,000 2,443,800 11,068,800 - - 11,068,800 2031-2033 6,215,000 427,838 6,642,838 - - 6,642,838
Total 30,684,808$ 13,334,216$ 44,019,024$ -$ -$ 44,019,024$
Debt Capital Lease Obligations
F. Inter-fund Receivables and Payables Inter-fund balances arise because the City utilizes a cash pool to maximize potential interest earnings. Inter-fund balances at June 30, 2015, were:
Receivable Fund Payable Fund Amount
General Fund Federal/State Grants Fund $ 166,523 General Fund HUD Section 8 Loans Fund 134,217 General Fund Community Development Block Grant Fund 56,202 General Fund Firemen’s Fund 14 General Fund State Accommodations Tax Fund 156,868
$ 513,824
G. Transfers In and Out During the course of normal operations, the City makes numerous transactions between funds. Transfers of resources from a fund receiving revenue to a fund through which the resources are expended are recorded as transfers and are reported as other financing sources (uses) in the governmental funds and as non-operating revenues (expenses) in proprietary funds. Transfers into the general fund were primarily to recover overhead and related costs. Transfers to the state accommodations tax fund were made from the local accommodations tax fund to support tourism promotion. Transfers between funds for the year ended June 30, 2015, consisted of the following:
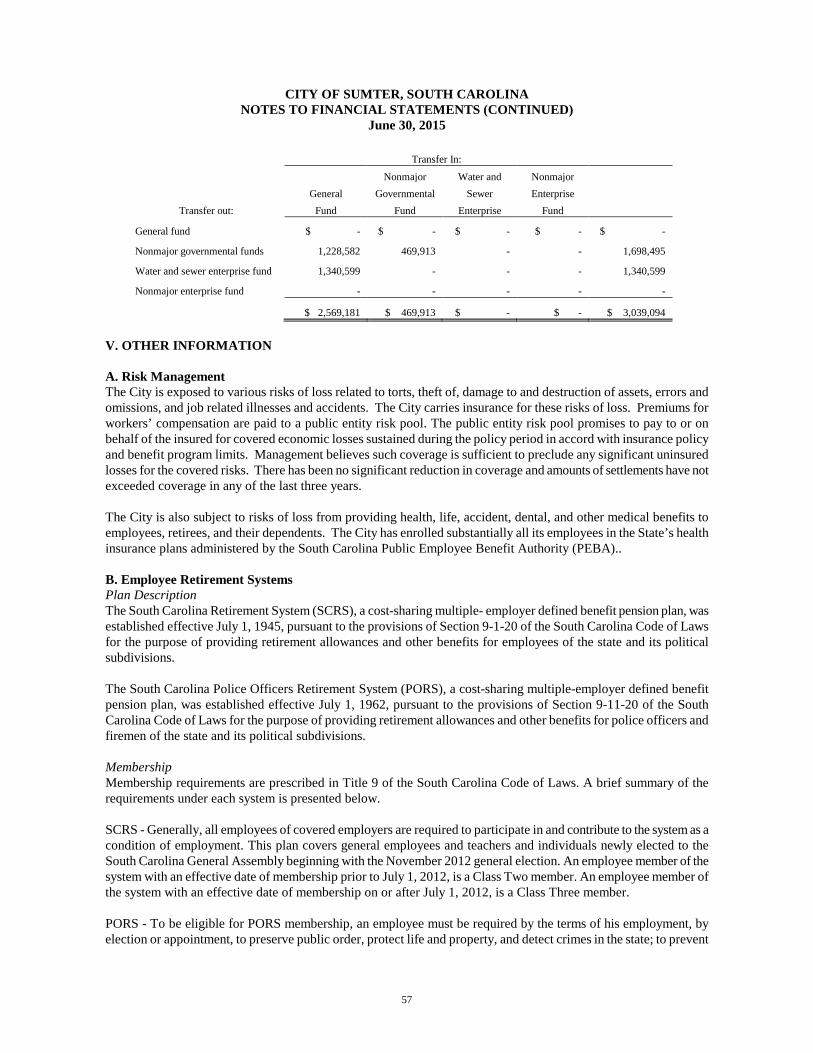
CITY OF SUMTER, SOUTH CAROLINA NOTES TO FINANCIAL STATEMENTS (CONTINUED)
June 30, 2015
57
Transfer In:
Nonmajor Water and Nonmajor
General Governmental Sewer Enterprise Transfer out: Fund Fund Enterprise Fund
General fund $ - $ - $ - $ - $ -
Nonmajor governmental funds 1,228,582 469,913 - - 1,698,495
Water and sewer enterprise fund 1,340,599 - - - 1,340,599
Nonmajor enterprise fund - - - - -
$ 2,569,181 $ 469,913 $ - $ - $ 3,039,094
V. OTHER INFORMATION A. Risk Management The City is exposed to various risks of loss related to torts, theft of, damage to and destruction of assets, errors and omissions, and job related illnesses and accidents. The City carries insurance for these risks of loss. Premiums for workers’ compensation are paid to a public entity risk pool. The public entity risk pool promises to pay to or on behalf of the insured for covered economic losses sustained during the policy period in accord with insurance policy and benefit program limits. Management believes such coverage is sufficient to preclude any significant uninsured losses for the covered risks. There has been no significant reduction in coverage and amounts of settlements have not exceeded coverage in any of the last three years. The City is also subject to risks of loss from providing health, life, accident, dental, and other medical benefits to employees, retirees, and their dependents. The City has enrolled substantially all its employees in the State’s health insurance plans administered by the South Carolina Public Employee Benefit Authority (PEBA).. B. Employee Retirement Systems Plan Description The South Carolina Retirement System (SCRS), a cost-sharing multiple- employer defined benefit pension plan, was established effective July 1, 1945, pursuant to the provisions of Section 9-1-20 of the South Carolina Code of Laws for the purpose of providing retirement allowances and other benefits for employees of the state and its political subdivisions. The South Carolina Police Officers Retirement System (PORS), a cost-sharing multiple-employer defined benefit pension plan, was established effective July 1, 1962, pursuant to the provisions of Section 9-11-20 of the South Carolina Code of Laws for the purpose of providing retirement allowances and other benefits for police officers and firemen of the state and its political subdivisions. Membership Membership requirements are prescribed in Title 9 of the South Carolina Code of Laws. A brief summary of the requirements under each system is presented below. SCRS - Generally, all employees of covered employers are required to participate in and contribute to the system as a condition of employment. This plan covers general employees and teachers and individuals newly elected to the South Carolina General Assembly beginning with the November 2012 general election. An employee member of the system with an effective date of membership prior to July 1, 2012, is a Class Two member. An employee member of the system with an effective date of membership on or after July 1, 2012, is a Class Three member. PORS - To be eligible for PORS membership, an employee must be required by the terms of his employment, by election or appointment, to preserve public order, protect life and property, and detect crimes in the state; to prevent

CITY OF SUMTER, SOUTH CAROLINA NOTES TO FINANCIAL STATEMENTS (CONTINUED)
June 30, 2015
58
and control property destruction by fire; or to serve as a peace officer employed by the Department of Corrections, the Department of Juvenile Justice, or the Department of Mental Health. Probate judges and coroners may elect membership in PORS. Magistrates are required to participate in PORS for service as a magistrate. PORS members, other than magistrates and probate judges, must also earn at least $2,000 per year and devote at least 1,600 hours per year to this work, unless exempted by statute. An employee member of the system with an effective date of membership prior to July 1, 2012, is a Class Two member. An employee member of the system with an effective date of membership on or after July 1, 2012, is a Class Three member. Benefits Benefit terms are prescribed in Title 9 of the South Carolina Code of Laws. PEBA does not have the authority to establish or amend benefit terms without legislative change in the code of laws. Key elements of the benefit calculation include the benefit multiplier, years of experience, and average final compensation. A brief summary of benefit terms for each system is presented below. SCRS - A Class Two member who has separated from service with at least five or more years of earned service is eligible for a monthly pension at age 65 or with 28 years credited service regardless of age. A member may elect early retirement with reduced pension benefits payable at age 55 with 25 years of service credit. A Class Three member who has separated from service with at least eight or more years of earned service is eligible for a monthly pension upon satisfying the Rule of 90 requirement that the total of the member’s age and the member’s creditable service equals at least 90 years. Both Class Two and Class Three members are eligible to receive a reduced deferred annuity at age 60 if they satisfy the five- or eight-year earned service requirement, respectively. An incidental death benefit is also available to beneficiaries of active and retired members of employers who participate in the death benefit program. The annual retirement allowance of eligible retirees or their surviving annuitants is increased by the lesser of one percent or five hundred dollars every July 1. Only those annuitants in receipt of a benefit on July 1 of the preceding year are eligible to receive the increase. Members who retire under the early retirement provisions at age 55 with 25 years of service are not eligible for the benefit adjustment until the second July 1 after reaching age 60 or the second July 1 after the date they would have had 28 years of service credit had they not retired. PORS - A Class Two member who has separated from service with at least five or more years of earned service is eligible for a monthly pension at age 55 or with 25 years of service regardless of age. A Class Three member who has separated from service with at least eight or more years of earned service is eligible for a monthly pension at age 55 or with 27 years of service regardless of age. Both class Two and Class Three members are eligible to receive a deferred annuity at age 55 with five or eight years of earned service, respectively. An incidental death benefit is also available to beneficiaries of active and retired members of employers who participate in the death benefit program. Accidental death benefits are also provided upon the death of an active member working for a covered employer whose death was natural and proximate result of an injury incurred while in the performance of duty. The retirement allowance of eligible retirees or their surviving annuitants is increased by the lesser of one percent or five hundred dollars every July 1. Only those annuitants in receipt of a benefit on July 1 of the preceding year are eligible to receive the increase. Contributions Contributions are prescribed in Title 9 of the South Carolina Code of Laws. The PEBA Board may increase the SCRS and PORS employer and employee contribution rates on the basis of the actuarial valuations, but any such increase may not result in a differential between the employee and employer contribution rate that exceeds 2.9 percent of earnable compensation for SCRS and 5 percent for PORS. An increase in the contribution rates adopted by the board may not provide for an increase of more than one-half of one percent in any one year. If the scheduled employee and employer contributions provided in the statute or the rates last adopted by the board are insufficient to maintain a thirty year amortization schedule of the unfunded liabilities of the plans, the board shall increase the contribution rates

CITY OF SUMTER, SOUTH CAROLINA NOTES TO FINANCIAL STATEMENTS (CONTINUED)
June 30, 2015
59
in equal percentage amounts for the employer and employee as necessary to maintain the thirty-year amortization period; and, this increase is not limited to one- half of one percent per year. Required employee contribution rates for fiscal year 2015 are as follows:
SCRS
Employee Class Two 8.00 % of earnable compensation
Employee Class Three 8.00 % of earnable compensation
PORS
Employee Class One $21 per month
Employee Class Two 8.41 % of earnable compensation
Employee Class Three 8.41 % of earnable compensation
Required employer contribution rates for fiscal year 2015 are as follows:
SCRS
Employee Class Two 10.75 % of earnable compensation
Employee Class Three 10.75 % of earnable compensation
Employer Incidental Death Benefit 0.15 % of earnable compensation
PORS
Employee Class One 7.80 % of earnable compensation
Employee Class Two 13.01 % of earnable compensation
Employee Class Three 13.01 % of earnable compensation
Employer Incidental Death Benefit 0.20 % of earnable compensation
Employer Accidental Death Program 0.20 % of earnable compensation
Pension Liabilities, Pension Expense, and Deferred Outflows of Resources and Deferred Inflows of Resources Related to Pensions At June 30, 2015, the City reported a liability of $23,009,035 for the SCRS and $13,181,162 for the PORS for a total of $34,258,775 for its proportionate share of the net pension liability. The net pension liability was measured as of June 30, 2014, and the total pension liability used to calculate the net pension liability was determined by an actuarial valuation as of that date. The City’s portion of the net pension liability was based on a projection of the City’s long-term share of contributions to the pension plan relative to the projected contributions of all participating state entities, actuarially determined. At June 30, 2014, the City’s proportion was 0.128281% for the SCRS and 0.63586% for the PORS. For the year ended June 30, 2015, the City recognized a pension benefit of $1,931,422. At June 30, 2015, the City reported deferred outflows of resources and deferred inflows of resources related to pensions from the following sources:

CITY OF SUMTER, SOUTH CAROLINA NOTES TO FINANCIAL STATEMENTS (CONTINUED)
June 30, 2015
60
Deferred Outflows Deferred Inflows
of Resources of Resources
Net difference between projected and actual earnings
on pension plan investments 950,661 3,270,499
City Contributions subsequent to measuremnent date 2,383,613 -
Total 3,334,274 3,270,499
$2,383,613 reported as deferred outflows of resources related to pensions resulting from City contributions subsequent to the measurement date will be recognized as a reduction of the net pension liability in the year ended June 30, 2016. Actuarial Assumptions and Methods Actuarial valuations involve estimates of the reported amounts and assumptions about the probability of occurrence of events far into the future. Examples include assumptions about future employment, mortality, and future salary increases. Amounts determined during the valuation process are subject to continual revision as actual results are compared with past expectations and new estimates are made about the future. South Carolina state statute requires that an actuarial experience study be completed at least once in each five-year period. The last experience study was performed on data through June 30, 2010, and the next experience study is scheduled to be conducted after the June 30, 2015 annual valuation is complete. The following table provides a summary of the actuarial assumptions and methods used in the July 1, 2013 valuations for SCRS and PORS.
SCRS PORS
Actuarial cost method Entry age Entry age
Actuarial assumptions:
Investment rate of return 7.5% 7.5%
Projected salary increases levels off at 3.5% levels off at 4.0%
Includes inflation at 2.75% 2.75%
Benefit adjustments lesser of 1% or $500 lesser of 1% or $500
The post-retiree mortality assumption is dependent upon the member’s job category and gender. This assumption includes base rates which are automatically adjusted for future improvement in mortality using published Scale AA projected from the year 2000.
Former Job Class Males Females
Educators and JudgesRP-2000 Males (with White
Collar adjustment) multiplied by 110%
RP-2000 Females (with White Collar adjustment)
multiplied by 95%
General Employees and Members of the General Assembly
RP-2000 Males multiplied by 100%
RP-2000 Females multiplied by 90%
Public Safety, Firefighters and members of the South Carolina
National Guard
RP-2000 Males (with Blue Collar adjustment) multiplied
by 110%
RP-2000 Females (with Blue Collar adjustment)
multiplied by 115% The long-term expected rate of return on pension plan investments for actuarial purposes is based upon the 30 year capital market outlook at the end of the third quarter of 2012. The actuarial long-term expected rates of return

CITY OF SUMTER, SOUTH CAROLINA NOTES TO FINANCIAL STATEMENTS (CONTINUED)
June 30, 2015
61
represent best estimates of arithmetic real rates of return for each major asset class and were developed in coordination with the investment consultant for the Retirement System Investment Commission (RSIC) using a building block approach, reflecting observable inflation and interest rate information available in the fixed income markets as well as Consensus Economic forecasts. The actuarial long-term assumptions for other asset classes are based on historical results, current market characteristics and professional judgment. The RSIC has exclusive authority to invest and manage the retirement trust funds’ assets. As co-fiduciary of the System, statutory provisions and governance policies allow the RSIC to operate in a manner consistent with a long-term investment time horizon. The expected real rates of investment return, along with expected inflation rate, form the basis for the target asset allocation adopted annually by the RSIC. For actuarial purposes, the long-term expected rate of return is calculated by weighting the expected future real rates of return by the target allocation percentage and then adding the actuarial expected inflation which is summarized on the table below. For actuarial purposes the 7.50 percent assumed annual investment rate of return used in the calculation of the total pension liability includes a 4.75 percent real rate of return and a 2.75 percent inflation component.
Asset Class Target Asset Allocation
Expected Arithmetic Real Rate of Return
Long Term Expected
Portfolio Real Rate
Short Term 5.0%
Cash 2.0% 0.3 0.01
Short Duration 3.0% 0.6 0.02
Domestic Fixed Income 13.0%
Core Fixed Income 7.0% 1.1 0.08
High Yield 2.0% 3.5 0.07
Bank Loans 4.0% 2.8 0.11
Global Fixed Income 9.0%
Global Fixed Income 3.0% 0.8 0.02
Emerging Markets Debt 6.0% 4.1 0.25
Global Public Equity 31.0% 7.8 2.42
Global Tactical Asset Allocation 10.0% 5.1 0.51
Alternatives 32.0%
Hedge Funds (Low Beta) 8.0% 4 0.32
Private Debt 7.0% 10.2 0.71
Private Equity 9.0% 10.2 0.92
Real Estate (Broad Market) 5.0% 5.9 0.29
Commodities 3.0% 5.1 0.15
Total Expected Real Return 100.0% 5.88
Inflation for Actuarial Purposes 2.75
Total Expected Nominal Return 8.63
Discount Rate The discount rate used to measure the total pension liability was 7.5 percent. The projection of cash flows used to determine the discount rate assumed that contributions from participating employers in SCRS and PORS will be made based on the actuarially determined rates based on provisions in the South Carolina State Code of Laws. Based on those assumptions, each System’s fiduciary net position was projected to be available to make all projected future benefit payments of current plan members. Therefore, the long-term expected rate of return on pension plan investments was applied to all periods of projected benefit payments to determine the total pension liability. The following table presents the sensitivity of the net position liability to changes in the discount rate.

CITY OF SUMTER, SOUTH CAROLINA NOTES TO FINANCIAL STATEMENTS (CONTINUED)
June 30, 2015
62
1.00% Decrease Current Discount Rate 1.00 % Increase
(6.50%) (7.50%) (8.50%)
System
SCRS 28,580,308$ 23,009,035$ 16,667,399$
PORS 17,011,507$ 13,181,162$ 8,169,610$ Pension Plan Fiduciary Net Position Detailed information regarding the fiduciary net position of the plans administered by PEBA is available in the separately issued CAFR containing financial statements and required supplementary information for SCRS and PORS. The CAFR of the Pension Trust Funds is publicly available on PEBA’s Retirement Benefit’s website at www.retirement.sc.gov, or a copy may be obtained by submitting a request to PEBA, PO Box 11960, Columbia, SC 29211-1960. C. Deferred Compensation Plans Certain City employees participate in one of two optional deferred compensation plans which are available to them in conjunction with the State Retirement System. The multiple-employer plans, created under Internal Revenue Code Sections 457 and 401(k) are administered for the State Retirement System by third parties. Compensation deferred under the plans is placed in trust for the contributing employee. The State has no liability for losses under the plans. Employees may withdraw the current value of their contributions when they terminate their employment with the City. Employees may also withdraw contributions prior to termination if they meet requirements specified by the applicable plan. D. Other Post-Employment Benefits Plan Description The City’s defined benefit postemployment healthcare plan (the plan) provides medical insurance to eligible retirees. Spouses and dependents are not covered. The City’s personnel policy provides lifetime benefits for retirees who retired on or before July 1, 2008, with at least 20 years of City service. Employees who retire after July 1, 2009, are eligible for benefits to age 65 depending on the amount of their service as of July 1, 2008. Those with 15 or more years of service on July 1, 2008, must have 20 years of service with the City to become eligible for benefits at retirement. Those with less than 15 years of service on July 1, 2008, must have 28 (25 for public safety) years of service with the City to become eligible for benefits at retirement. The Plan is approved each year by City Council; the contribution requirements of the City and plan members are established and amended by Council. The contributions are neither guaranteed nor mandatory. Council has retained the right to modify its payments for retiree health care benefits. As of July 1, 2013, the measurement date for the plan year, there were 638 covered participants; 105 members were retirees receiving benefits and 533 were active participants. The plan is affiliated with the South Carolina Other Retirement Benefits Employer Trust (SCORBET), an agent multiple employer irrevocable trust administered by the Municipal Association of South Carolina. Each participating employer is responsible for determining the appropriate amount of contributions to remit to the Trust. SCORBET issues a publicly available financial report that includes audited financial statements and required supplementary information for the plan. A copy of the report may be obtained by writing to the Chief Financial Officer for Risk Management Services, Municipal Association of South Carolina, P. O. Box 12109, Columbia, South Carolina 29211.
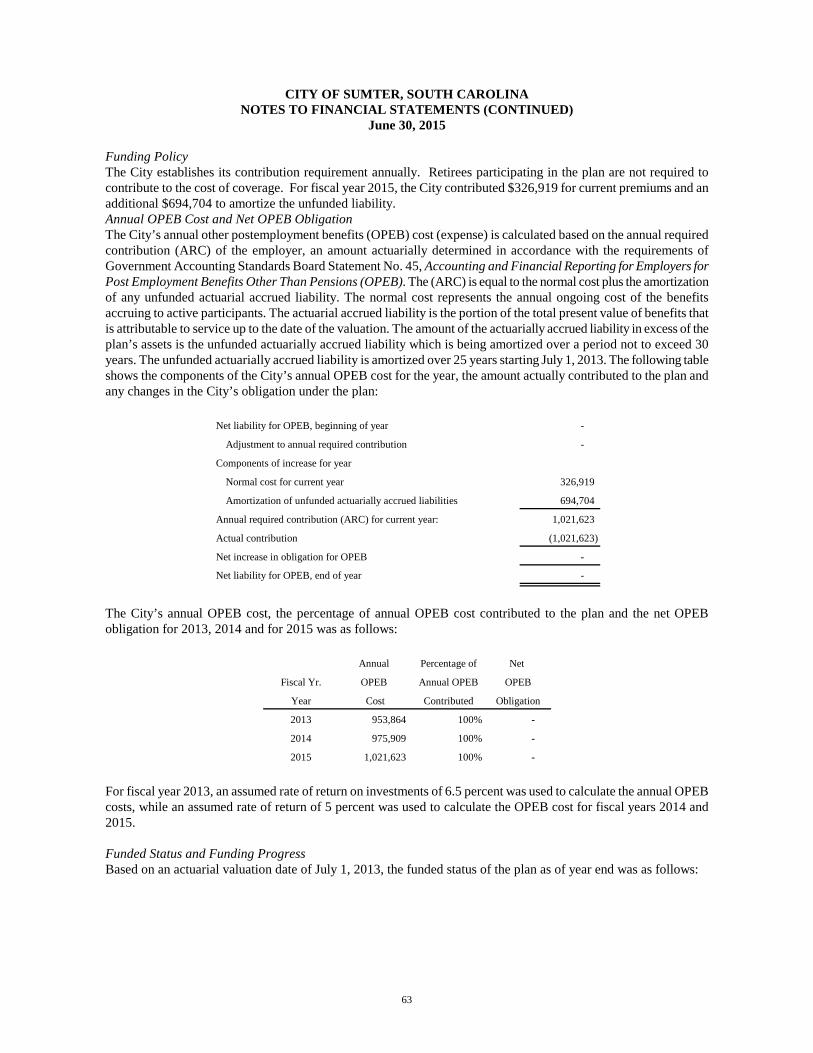
CITY OF SUMTER, SOUTH CAROLINA NOTES TO FINANCIAL STATEMENTS (CONTINUED)
June 30, 2015
63
Funding Policy The City establishes its contribution requirement annually. Retirees participating in the plan are not required to contribute to the cost of coverage. For fiscal year 2015, the City contributed $326,919 for current premiums and an additional $694,704 to amortize the unfunded liability. Annual OPEB Cost and Net OPEB Obligation The City’s annual other postemployment benefits (OPEB) cost (expense) is calculated based on the annual required contribution (ARC) of the employer, an amount actuarially determined in accordance with the requirements of Government Accounting Standards Board Statement No. 45, Accounting and Financial Reporting for Employers for Post Employment Benefits Other Than Pensions (OPEB). The (ARC) is equal to the normal cost plus the amortization of any unfunded actuarial accrued liability. The normal cost represents the annual ongoing cost of the benefits accruing to active participants. The actuarial accrued liability is the portion of the total present value of benefits that is attributable to service up to the date of the valuation. The amount of the actuarially accrued liability in excess of the plan’s assets is the unfunded actuarially accrued liability which is being amortized over a period not to exceed 30 years. The unfunded actuarially accrued liability is amortized over 25 years starting July 1, 2013. The following table shows the components of the City’s annual OPEB cost for the year, the amount actually contributed to the plan and any changes in the City’s obligation under the plan:
Net liability for OPEB, beginning of year -
Adjustment to annual required contribution -
Components of increase for year
Normal cost for current year 326,919
Amortization of unfunded actuarially accrued liabilities 694,704
Annual required contribution (ARC) for current year: 1,021,623
Actual contribution (1,021,623)
Net increase in obligation for OPEB -
Net liability for OPEB, end of year -
The City’s annual OPEB cost, the percentage of annual OPEB cost contributed to the plan and the net OPEB obligation for 2013, 2014 and for 2015 was as follows:
Annual Percentage of Net
Fiscal Yr. OPEB Annual OPEB OPEB
Year Cost Contributed Obligation
2013 953,864 100% -
2014 975,909 100% -
2015 1,021,623 100% - For fiscal year 2013, an assumed rate of return on investments of 6.5 percent was used to calculate the annual OPEB costs, while an assumed rate of return of 5 percent was used to calculate the OPEB cost for fiscal years 2014 and 2015. Funded Status and Funding Progress Based on an actuarial valuation date of July 1, 2013, the funded status of the plan as of year end was as follows:
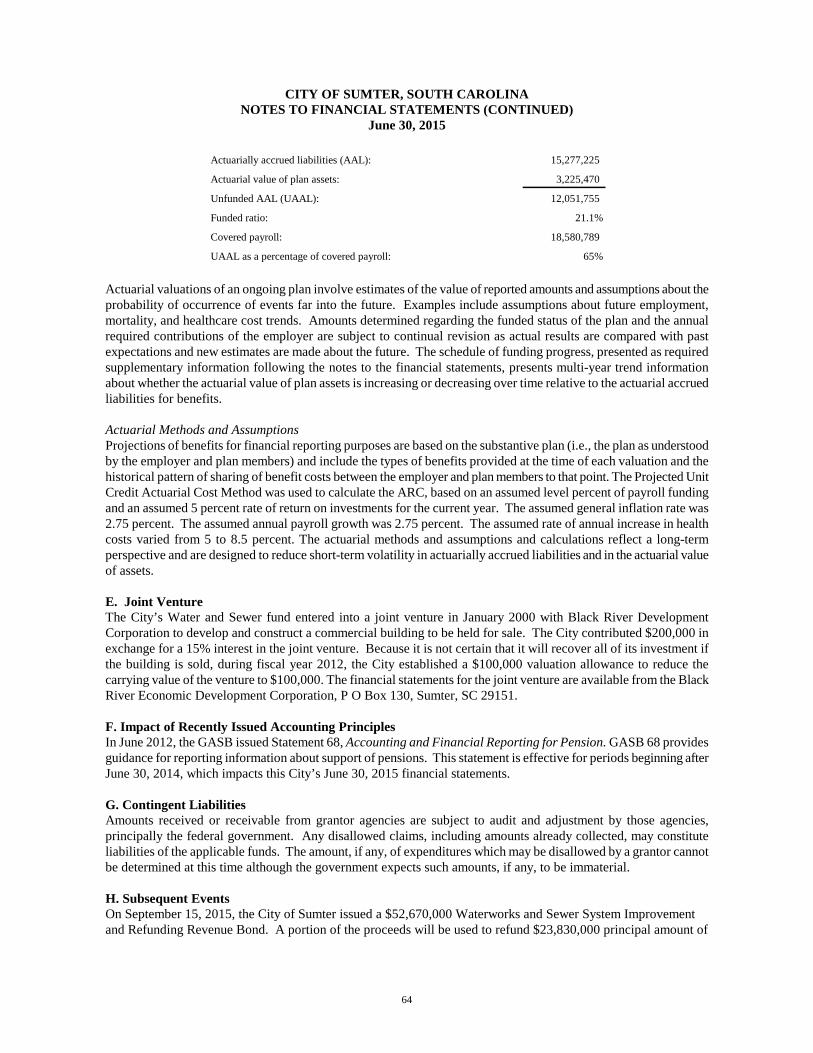
CITY OF SUMTER, SOUTH CAROLINA NOTES TO FINANCIAL STATEMENTS (CONTINUED)
June 30, 2015
64
Actuarially accrued liabilities (AAL): 15,277,225
Actuarial value of plan assets: 3,225,470
Unfunded AAL (UAAL): 12,051,755
Funded ratio: 21.1%
Covered payroll: 18,580,789
UAAL as a percentage of covered payroll: 65%
Actuarial valuations of an ongoing plan involve estimates of the value of reported amounts and assumptions about the probability of occurrence of events far into the future. Examples include assumptions about future employment, mortality, and healthcare cost trends. Amounts determined regarding the funded status of the plan and the annual required contributions of the employer are subject to continual revision as actual results are compared with past expectations and new estimates are made about the future. The schedule of funding progress, presented as required supplementary information following the notes to the financial statements, presents multi-year trend information about whether the actuarial value of plan assets is increasing or decreasing over time relative to the actuarial accrued liabilities for benefits. Actuarial Methods and Assumptions Projections of benefits for financial reporting purposes are based on the substantive plan (i.e., the plan as understood by the employer and plan members) and include the types of benefits provided at the time of each valuation and the historical pattern of sharing of benefit costs between the employer and plan members to that point. The Projected Unit Credit Actuarial Cost Method was used to calculate the ARC, based on an assumed level percent of payroll funding and an assumed 5 percent rate of return on investments for the current year. The assumed general inflation rate was 2.75 percent. The assumed annual payroll growth was 2.75 percent. The assumed rate of annual increase in health costs varied from 5 to 8.5 percent. The actuarial methods and assumptions and calculations reflect a long-term perspective and are designed to reduce short-term volatility in actuarially accrued liabilities and in the actuarial value of assets. E. Joint Venture The City’s Water and Sewer fund entered into a joint venture in January 2000 with Black River Development Corporation to develop and construct a commercial building to be held for sale. The City contributed $200,000 in exchange for a 15% interest in the joint venture. Because it is not certain that it will recover all of its investment if the building is sold, during fiscal year 2012, the City established a $100,000 valuation allowance to reduce the carrying value of the venture to $100,000. The financial statements for the joint venture are available from the Black River Economic Development Corporation, P O Box 130, Sumter, SC 29151. F. Impact of Recently Issued Accounting Principles In June 2012, the GASB issued Statement 68, Accounting and Financial Reporting for Pension. GASB 68 provides guidance for reporting information about support of pensions. This statement is effective for periods beginning after June 30, 2014, which impacts this City’s June 30, 2015 financial statements. G. Contingent Liabilities Amounts received or receivable from grantor agencies are subject to audit and adjustment by those agencies, principally the federal government. Any disallowed claims, including amounts already collected, may constitute liabilities of the applicable funds. The amount, if any, of expenditures which may be disallowed by a grantor cannot be determined at this time although the government expects such amounts, if any, to be immaterial. H. Subsequent Events On September 15, 2015, the City of Sumter issued a $52,670,000 Waterworks and Sewer System Improvement and Refunding Revenue Bond. A portion of the proceeds will be used to refund $23,830,000 principal amount of

CITY OF SUMTER, SOUTH CAROLINA NOTES TO FINANCIAL STATEMENTS (CONTINUED)
June 30, 2015
65
it’s Waterworks and Sewer System Improvement Bond series 2007 and the remaining proceeds will be used for various improvements to the City of Sumter’s water and sewer systems. In connection with this revenue bond issue, the City of Sumter’s bond rating was increased by Moody’s Investors Service (Moody’s) to Aa3 from A1 and increased by Standard and Poor’s (S&P) to AA- from an A+. Management has evaluated subsequent events through November 30, 2015, the date the financial statements were available to be issued.

66
THIS PAGE INTENTIONALLY LEFT BLANK
67
REQUIRED SUPPLEMENTARY INFORMATION
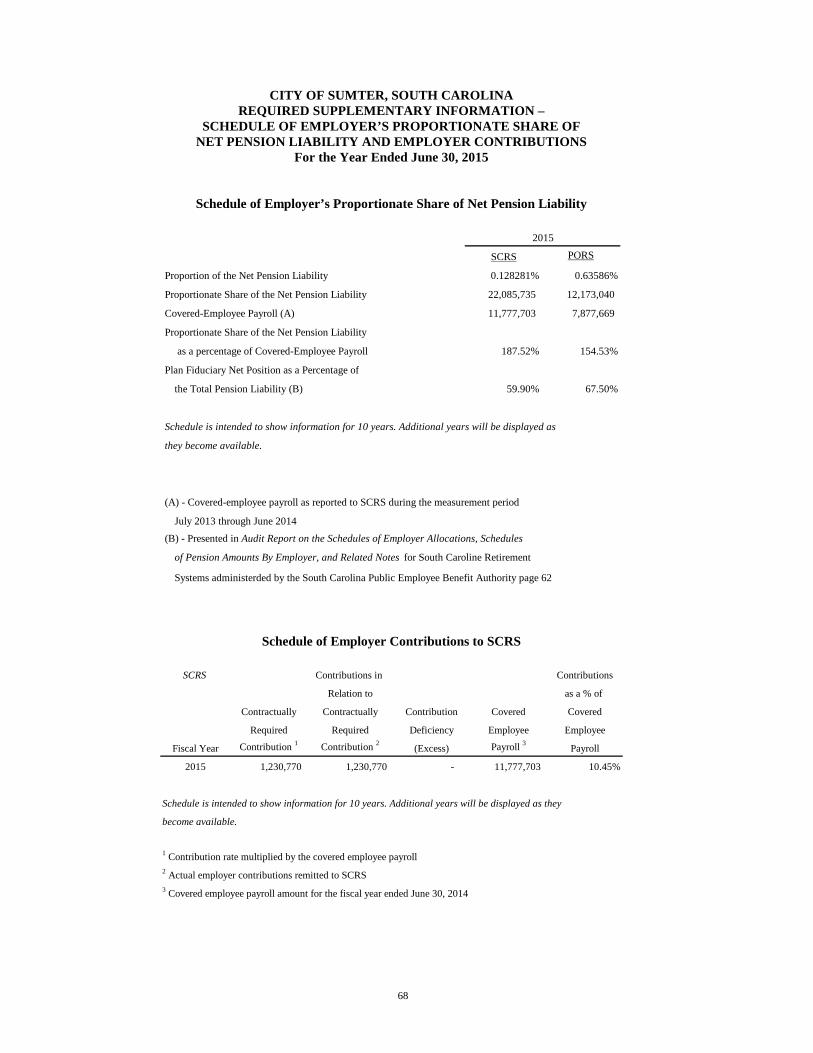
68
CITY OF SUMTER, SOUTH CAROLINA REQUIRED SUPPLEMENTARY INFORMATION –
SCHEDULE OF EMPLOYER’S PROPORTIONATE SHARE OF NET PENSION LIABILITY AND EMPLOYER CONTRIBUTIONS
For the Year Ended June 30, 2015
Schedule of Employer’s Proportionate Share of Net Pension Liability
2015
SCRS PORS
Proportion of the Net Pension Liability 0.128281% 0.63586%
Proportionate Share of the Net Pension Liability 22,085,735 12,173,040
Covered-Employee Payroll (A) 11,777,703 7,877,669
Proportionate Share of the Net Pension Liability
as a percentage of Covered-Employee Payroll 187.52% 154.53%
Plan Fiduciary Net Position as a Percentage of
the Total Pension Liability (B) 59.90% 67.50%
Schedule is intended to show information for 10 years. Additional years will be displayed as
they become available.
(A) - Covered-employee payroll as reported to SCRS during the measurement period
July 2013 through June 2014
(B) - Presented in Audit Report on the Schedules of Employer Allocations, Schedules
of Pension Amounts By Employer, and Related Notes for South Caroline Retirement
Systems administerded by the South Carolina Public Employee Benefit Authority page 62
Schedule of Employer Contributions to SCRS
SCRS Contributions in Contributions
Relation to as a % of
Contractually Contractually Contribution Covered Covered
Required Required Deficiency Employee Employee
Fiscal Year Contribution 1 Contribution 2 (Excess) Payroll 3 Payroll
2015 1,230,770 1,230,770 - 11,777,703 10.45%
Schedule is intended to show information for 10 years. Additional years will be displayed as they
become available.
1 Contribution rate multiplied by the covered employee payroll2 Actual employer contributions remitted to SCRS3 Covered employee payroll amount for the fiscal year ended June 30, 2014
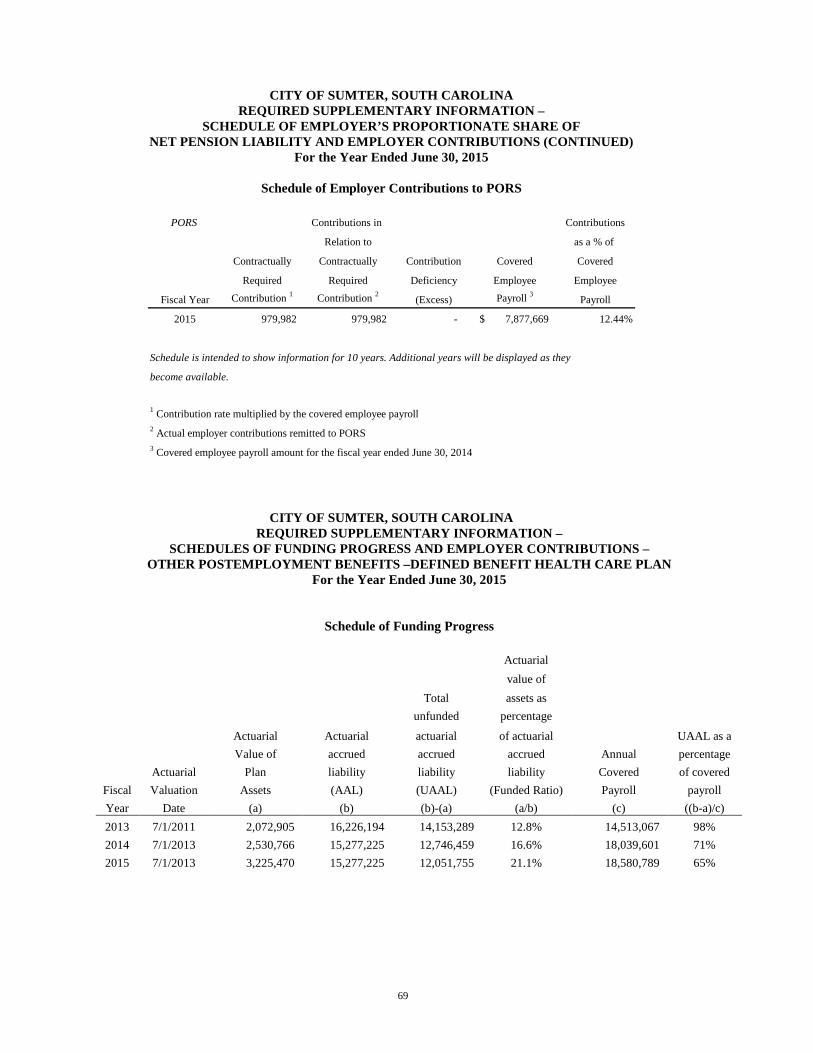
69
CITY OF SUMTER, SOUTH CAROLINA REQUIRED SUPPLEMENTARY INFORMATION –
SCHEDULE OF EMPLOYER’S PROPORTIONATE SHARE OF NET PENSION LIABILITY AND EMPLOYER CONTRIBUTIONS (CONTINUED)
For the Year Ended June 30, 2015
Schedule of Employer Contributions to PORS
PORS Contributions in Contributions
Relation to as a % of
Contractually Contractually Contribution Covered Covered
Required Required Deficiency Employee Employee
Fiscal Year Contribution 1 Contribution 2 (Excess) Payroll 3 Payroll
2015 979,982 979,982 - 7,877,669$ 12.44%
Schedule is intended to show information for 10 years. Additional years will be displayed as they
become available.
1 Contribution rate multiplied by the covered employee payroll2 Actual employer contributions remitted to PORS3 Covered employee payroll amount for the fiscal year ended June 30, 2014
CITY OF SUMTER, SOUTH CAROLINA REQUIRED SUPPLEMENTARY INFORMATION –
SCHEDULES OF FUNDING PROGRESS AND EMPLOYER CONTRIBUTIONS – OTHER POSTEMPLOYMENT BENEFITS –DEFINED BENEFIT HEALTH CARE PLAN
For the Year Ended June 30, 2015
Schedule of Funding Progress
Actuarial value of Total assets as unfunded percentage
Actuarial Actuarial actuarial of actuarial UAAL as a Value of accrued accrued accrued Annual percentage Actuarial Plan liability liability liability Covered of covered
Fiscal Valuation Assets (AAL) (UAAL) (Funded Ratio) Payroll payroll Year Date (a) (b) (b)-(a) (a/b) (c) ((b-a)/c) 2013 7/1/2011 2,072,905 16,226,194 14,153,289 12.8% 14,513,067 98% 2014 7/1/2013 2,530,766 15,277,225 12,746,459 16.6% 18,039,601 71% 2015 7/1/2013 3,225,470 15,277,225 12,051,755 21.1% 18,580,789 65%
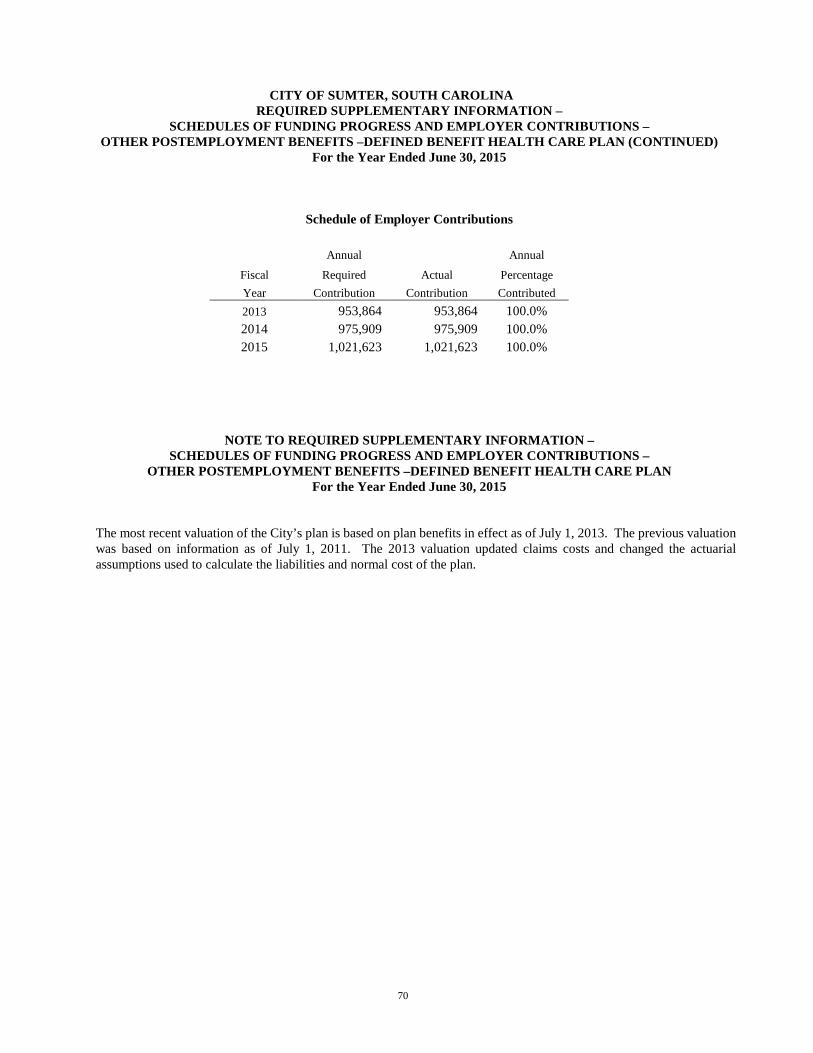
70
CITY OF SUMTER, SOUTH CAROLINA REQUIRED SUPPLEMENTARY INFORMATION –
SCHEDULES OF FUNDING PROGRESS AND EMPLOYER CONTRIBUTIONS – OTHER POSTEMPLOYMENT BENEFITS –DEFINED BENEFIT HEALTH CARE PLAN (CONTINUED)
For the Year Ended June 30, 2015
Schedule of Employer Contributions
Annual Annual
Fiscal Required Actual Percentage Year Contribution Contribution Contributed 2013 953,864 953,864 100.0% 2014 975,909 975,909 100.0% 2015 1,021,623 1,021,623 100.0%
NOTE TO REQUIRED SUPPLEMENTARY INFORMATION –
SCHEDULES OF FUNDING PROGRESS AND EMPLOYER CONTRIBUTIONS – OTHER POSTEMPLOYMENT BENEFITS –DEFINED BENEFIT HEALTH CARE PLAN
For the Year Ended June 30, 2015
The most recent valuation of the City’s plan is based on plan benefits in effect as of July 1, 2013. The previous valuation was based on information as of July 1, 2011. The 2013 valuation updated claims costs and changed the actuarial assumptions used to calculate the liabilities and normal cost of the plan.
71
OTHER SUPPLEMENTARY INFORMATION
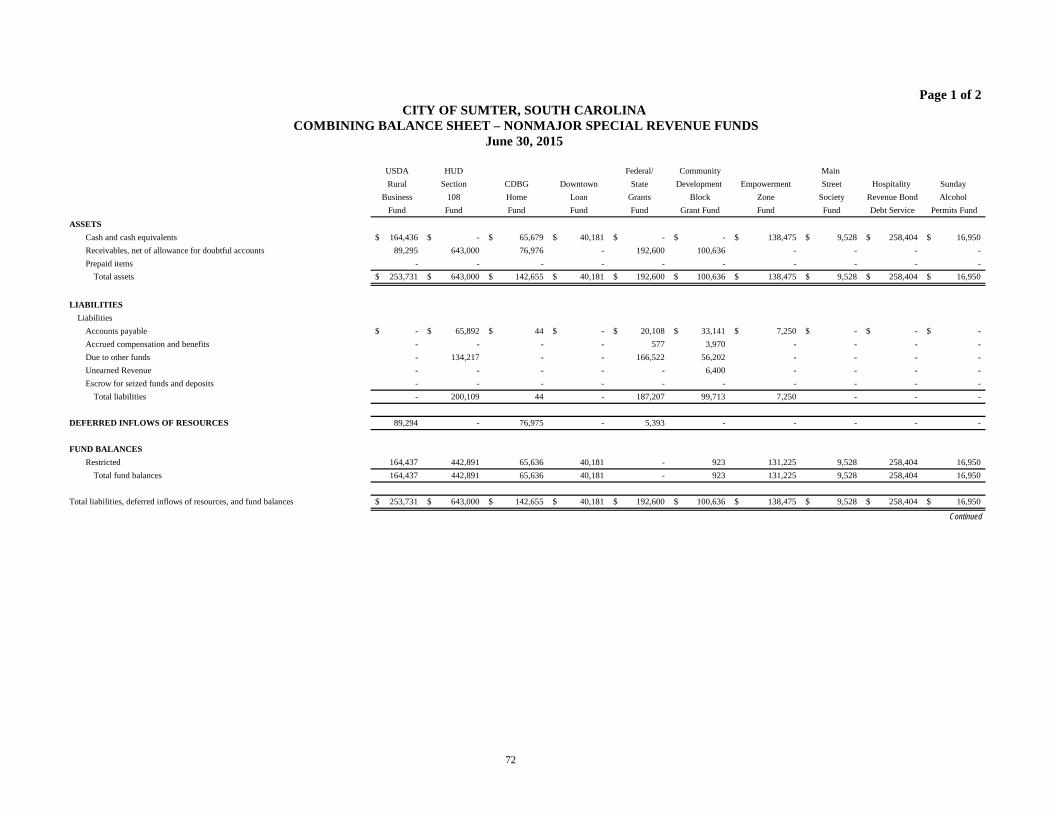
72
Page 1 of 2 CITY OF SUMTER, SOUTH CAROLINA
COMBINING BALANCE SHEET – NONMAJOR SPECIAL REVENUE FUNDS June 30, 2015
USDA HUD Federal/ Community Main Rural Section CDBG Downtown State Development Empowerment Street Hospitality Sunday
Business 108 Home Loan Grants Block Zone Society Revenue Bond Alcohol Fund Fund Fund Fund Fund Grant Fund Fund Fund Debt Service Permits Fund
ASSETSCash and cash equivalents 164,436$ -$ 65,679$ 40,181$ -$ -$ 138,475$ 9,528$ 258,404$ 16,950$ Receivables, net of allowance for doubtful accounts 89,295 643,000 76,976 - 192,600 100,636 - - - - Prepaid items - - - - - - - - - -
Total assets 253,731$ 643,000$ 142,655$ 40,181$ 192,600$ 100,636$ 138,475$ 9,528$ 258,404$ 16,950$
LIABILITIES
LiabilitiesAccounts payable -$ 65,892$ 44$ -$ 20,108$ 33,141$ 7,250$ -$ -$ -$ Accrued compensation and benefits - - - - 577 3,970 - - - - Due to other funds - 134,217 - - 166,522 56,202 - - - - Unearned Revenue - - - - - 6,400 - - - - Escrow for seized funds and deposits - - - - - - - - - -
Total liabilities - 200,109 44 - 187,207 99,713 7,250 - - -
DEFERRED INFLOWS OF RESOURCES 89,294 - 76,975 - 5,393 - - - - - FUND BALANCES
Restricted 164,437 442,891 65,636 40,181 - 923 131,225 9,528 258,404 16,950 Total fund balances 164,437 442,891 65,636 40,181 - 923 131,225 9,528 258,404 16,950
Total liabilities, deferred inflows of resources, and fund balances 253,731$ 643,000$ 142,655$ 40,181$ 192,600$ 100,636$ 138,475$ 9,528$ 258,404$ 16,950$
Continued
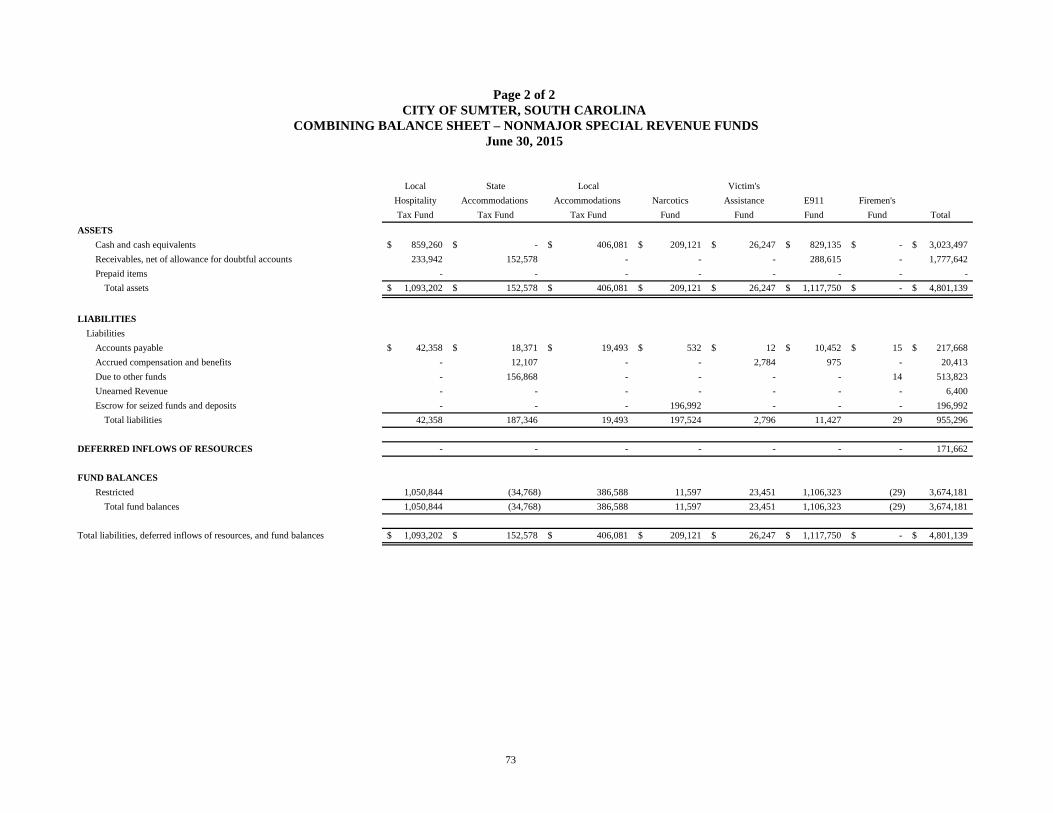
73
Page 2 of 2 CITY OF SUMTER, SOUTH CAROLINA
COMBINING BALANCE SHEET – NONMAJOR SPECIAL REVENUE FUNDS June 30, 2015
Local State Local Victim'sHospitality Accommodations Accommodations Narcotics Assistance E911 Firemen'sTax Fund Tax Fund Tax Fund Fund Fund Fund Fund Total
ASSETSCash and cash equivalents 859,260$ -$ 406,081$ 209,121$ 26,247$ 829,135$ -$ 3,023,497$ Receivables, net of allowance for doubtful accounts 233,942 152,578 - - - 288,615 - 1,777,642 Prepaid items - - - - - - - -
Total assets 1,093,202$ 152,578$ 406,081$ 209,121$ 26,247$ 1,117,750$ -$ 4,801,139$
LIABILITIES
LiabilitiesAccounts payable 42,358$ 18,371$ 19,493$ 532$ 12$ 10,452$ 15$ 217,668$ Accrued compensation and benefits - 12,107 - - 2,784 975 - 20,413 Due to other funds - 156,868 - - - - 14 513,823 Unearned Revenue - - - - - - - 6,400 Escrow for seized funds and deposits - - - 196,992 - - - 196,992
Total liabilities 42,358 187,346 19,493 197,524 2,796 11,427 29 955,296
DEFERRED INFLOWS OF RESOURCES - - - - - - - 171,662 FUND BALANCES
Restricted 1,050,844 (34,768) 386,588 11,597 23,451 1,106,323 (29) 3,674,181 Total fund balances 1,050,844 (34,768) 386,588 11,597 23,451 1,106,323 (29) 3,674,181
Total liabilities, deferred inflows of resources, and fund balances 1,093,202$ 152,578$ 406,081$ 209,121$ 26,247$ 1,117,750$ -$ 4,801,139$
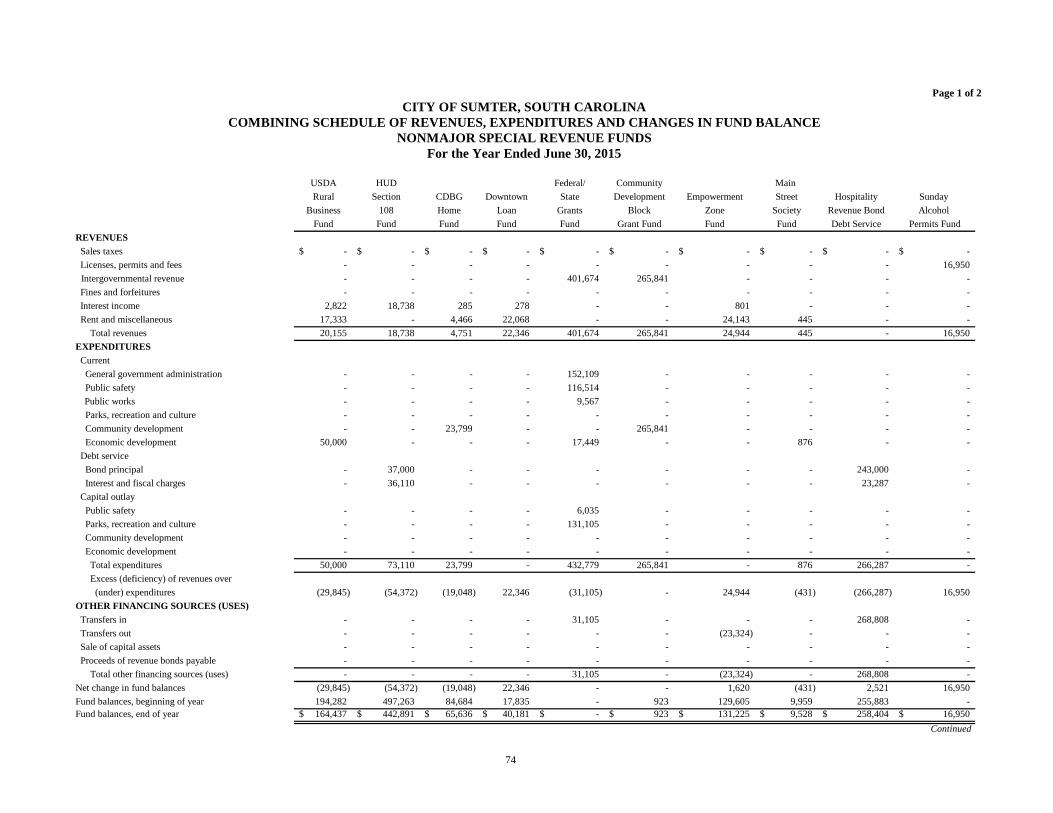
74
Page 1 of 2 CITY OF SUMTER, SOUTH CAROLINA
COMBINING SCHEDULE OF REVENUES, EXPENDITURES AND CHANGES IN FUND BALANCE NONMAJOR SPECIAL REVENUE FUNDS
For the Year Ended June 30, 2015
USDA HUD Federal/ Community Main Rural Section CDBG Downtown State Development Empowerment Street Hospitality Sunday
Business 108 Home Loan Grants Block Zone Society Revenue Bond Alcohol Fund Fund Fund Fund Fund Grant Fund Fund Fund Debt Service Permits Fund
REVENUES Sales taxes -$ -$ -$ -$ -$ -$ -$ -$ -$ -$ Licenses, permits and fees - - - - - - - - - 16,950 Intergovernmental revenue - - - - 401,674 265,841 - - - -
Fines and forfeitures - - - - - - - - - - Interest income 2,822 18,738 285 278 - - 801 - - - Rent and miscellaneous 17,333 - 4,466 22,068 - - 24,143 445 - - Total revenues 20,155 18,738 4,751 22,346 401,674 265,841 24,944 445 - 16,950 EXPENDITURES Current General government administration - - - - 152,109 - - - - - Public safety - - - - 116,514 - - - - -
Public works - - - - 9,567 - - - - - Parks, recreation and culture - - - - - - - - - - Community development - - 23,799 - - 265,841 - - - - Economic development 50,000 - - - 17,449 - - 876 - - Debt service Bond principal - 37,000 - - - - - - 243,000 - Interest and fiscal charges - 36,110 - - - - - - 23,287 - Capital outlay Public safety - - - - 6,035 - - - - - Parks, recreation and culture - - - - 131,105 - - - - - Community development - - - - - - - - - - Economic development - - - - - - - - - - Total expenditures 50,000 73,110 23,799 - 432,779 265,841 - 876 266,287 - Excess (deficiency) of revenues over (under) expenditures (29,845) (54,372) (19,048) 22,346 (31,105) - 24,944 (431) (266,287) 16,950 OTHER FINANCING SOURCES (USES) Transfers in - - - - 31,105 - - - 268,808 - Transfers out - - - - - - (23,324) - - - Sale of capital assets - - - - - - - - - - Proceeds of revenue bonds payable - - - - - - - - - - Total other financing sources (uses) - - - - 31,105 - (23,324) - 268,808 - Net change in fund balances (29,845) (54,372) (19,048) 22,346 - - 1,620 (431) 2,521 16,950 Fund balances, beginning of year 194,282 497,263 84,684 17,835 - 923 129,605 9,959 255,883 - Fund balances, end of year 164,437$ 442,891$ 65,636$ 40,181$ -$ 923$ 131,225$ 9,528$ 258,404$ 16,950$
Continued
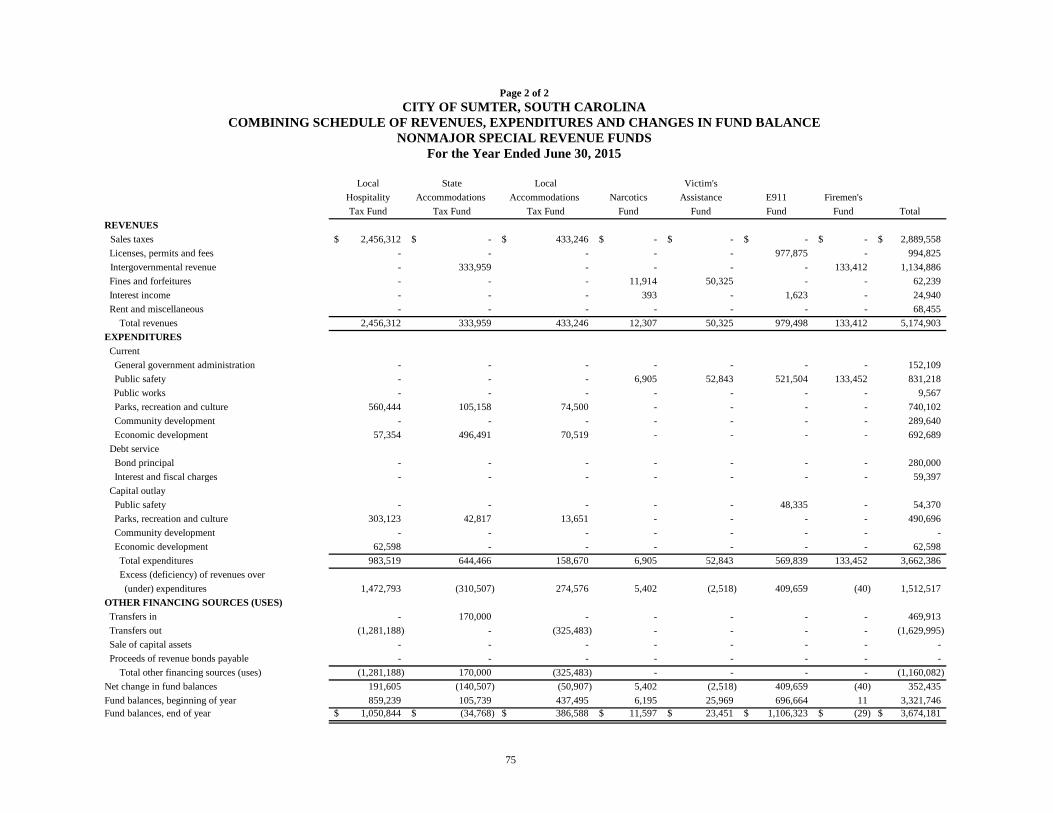
75
Page 2 of 2 CITY OF SUMTER, SOUTH CAROLINA
COMBINING SCHEDULE OF REVENUES, EXPENDITURES AND CHANGES IN FUND BALANCE NONMAJOR SPECIAL REVENUE FUNDS
For the Year Ended June 30, 2015
Local State Local Victim'sHospitality Accommodations Accommodations Narcotics Assistance E911 Firemen'sTax Fund Tax Fund Tax Fund Fund Fund Fund Fund Total
REVENUES Sales taxes 2,456,312$ -$ 433,246$ -$ -$ -$ -$ 2,889,558$
Licenses, permits and fees - - - - - 977,875 - 994,825 Intergovernmental revenue - 333,959 - - - - 133,412 1,134,886
Fines and forfeitures - - - 11,914 50,325 - - 62,239 Interest income - - - 393 - 1,623 - 24,940 Rent and miscellaneous - - - - - - - 68,455 Total revenues 2,456,312 333,959 433,246 12,307 50,325 979,498 133,412 5,174,903 EXPENDITURES Current General government administration - - - - - - - 152,109 Public safety - - - 6,905 52,843 521,504 133,452 831,218
Public works - - - - - - - 9,567 Parks, recreation and culture 560,444 105,158 74,500 - - - - 740,102 Community development - - - - - - - 289,640 Economic development 57,354 496,491 70,519 - - - - 692,689 Debt service Bond principal - - - - - - - 280,000 Interest and fiscal charges - - - - - - - 59,397 Capital outlay Public safety - - - - - 48,335 - 54,370 Parks, recreation and culture 303,123 42,817 13,651 - - - - 490,696 Community development - - - - - - - - Economic development 62,598 - - - - - - 62,598 Total expenditures 983,519 644,466 158,670 6,905 52,843 569,839 133,452 3,662,386 Excess (deficiency) of revenues over (under) expenditures 1,472,793 (310,507) 274,576 5,402 (2,518) 409,659 (40) 1,512,517 OTHER FINANCING SOURCES (USES) Transfers in - 170,000 - - - - - 469,913 Transfers out (1,281,188) - (325,483) - - - - (1,629,995) Sale of capital assets - - - - - - - - Proceeds of revenue bonds payable - - - - - - - - Total other financing sources (uses) (1,281,188) 170,000 (325,483) - - - - (1,160,082) Net change in fund balances 191,605 (140,507) (50,907) 5,402 (2,518) 409,659 (40) 352,435 Fund balances, beginning of year 859,239 105,739 437,495 6,195 25,969 696,664 11 3,321,746 Fund balances, end of year 1,050,844$ (34,768)$ 386,588$ 11,597$ 23,451$ 1,106,323$ (29)$ 3,674,181$

76
CITY OF SUMTER, SOUTH CAROLINA SCHEDULE OF REVENUES, EXPENDITURES AND CHANGES IN FUND BALANCE-
BUDGET AND ACTUAL-HOSPITALITY TAX FUND For the Year Ended June 30, 2015
Variance with
Final Budget-
Budgeted Amounts Actual Over
Original Final Amounts (Under)
REVENUES
Hospitality fees 2,100,000 2,100,000 2,456,313 356,313
Total revenues 2,100,000 2,100,000 2,456,313 356,313
EXPENDITURES
Quality of life projects 1,067,978 1,067,978 1,014,625 (53,353)
Debt Service 268,808 268,808 268,808 -
Total expenditures 1,336,786 1,336,786 1,283,433 (53,353)
Excess of revenues over expenditures 763,214 763,214 1,172,880 409,666
OTHER FINANCING SOURCES (USES)
Transfers out (763,214) (981,275) (981,275) -
Appropriation from fund balance - 218,061 - 218,061
Total other financing sources (uses) (763,214) (763,214) (981,275) 218,061
Net change in fund balance - - 191,605 191,605
Fund balance, beginning of year 859,239 859,239 859,239 -
Fund balance, end of year 859,239 859,239 1,050,844 191,605
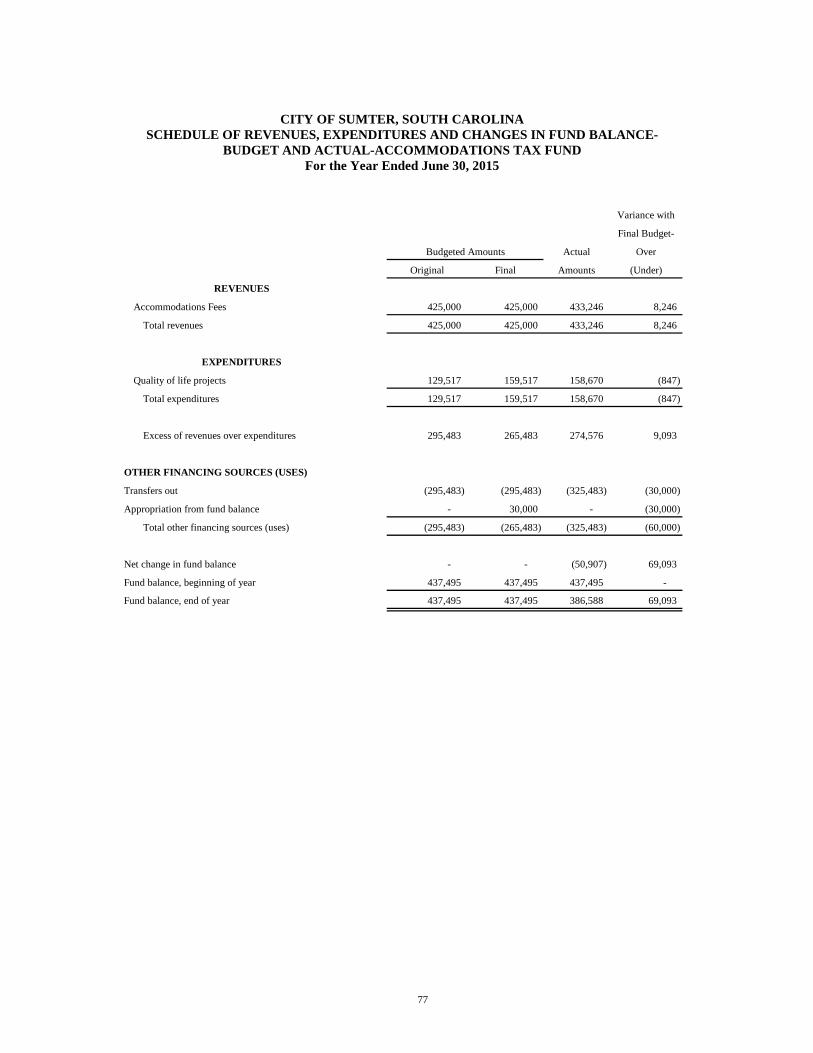
77
CITY OF SUMTER, SOUTH CAROLINA SCHEDULE OF REVENUES, EXPENDITURES AND CHANGES IN FUND BALANCE-
BUDGET AND ACTUAL-ACCOMMODATIONS TAX FUND For the Year Ended June 30, 2015
Variance with
Final Budget-
Budgeted Amounts Actual Over
Original Final Amounts (Under)
REVENUES
Accommodations Fees 425,000 425,000 433,246 8,246
Total revenues 425,000 425,000 433,246 8,246
EXPENDITURES
Quality of life projects 129,517 159,517 158,670 (847)
Total expenditures 129,517 159,517 158,670 (847)
Excess of revenues over expenditures 295,483 265,483 274,576 9,093
OTHER FINANCING SOURCES (USES)
Transfers out (295,483) (295,483) (325,483) (30,000)
Appropriation from fund balance - 30,000 - (30,000)
Total other financing sources (uses) (295,483) (265,483) (325,483) (60,000)
Net change in fund balance - - (50,907) 69,093
Fund balance, beginning of year 437,495 437,495 437,495 -
Fund balance, end of year 437,495 437,495 386,588 69,093

78
CITY OF SUMTER, SOUTH CAROLINA SCHEDULE OF REVENUES, EXPENDITURES AND CHANGES IN FUND BALANCE-
BUDGET AND ACTUAL-VICTIMS ASSISTANCE FUND For the Year Ended June 30, 2015
Variance with
Final Budget-
Budgeted Amounts Actual Over
Original Final Amounts (Under)
REVENUES
Victims Services 50,000 50,000 50,325 325
Total revenues 50,000 50,000 50,325 325
EXPENDITURES
Public Safety 50,000 50,000 52,843 2,843
Total expenditures 50,000 50,000 52,843 2,843
Excess (deficiency) of revenues over expenditures - - (2,518) (2,518)
Net change in fund balance - - (2,518) (2,518)
Fund balance, beginning of year 25,969 25,969 25,969 -
Fund balance, end of year 25,969 25,969 23,451 (2,518)

79
CITY OF SUMTER, SOUTH CAROLINA WATER AND SEWER FUND – SCHEDULE OF REVENUE, EXPENSES AND CHANGES IN NET
POSITION – BUDGET AND ACTUAL – BUDGET BASIS
For the Year Ended June 30, 2015
Variance withFinal Budget-
Actual OverOriginal Final Amounts (Under)
Revenue Water revenue 9,910,000$ 9,910,000$ 9,868,968$ (41,032)$ Sewer revenue 9,200,000 9,200,000 9,703,231 503,231 Other operating revenue 1,419,600 1,419,600 1,505,408 85,808 Grants - - - - Capital contributions - - 1,852,202 1,852,202 Interest income and investment return 15,000 15,000 363,005 348,005 Gain on sale of capital assets - - 18,062 18,062 Miscellaneous 80,000 80,000 122,162 42,162
20,624,600 20,624,600 23,433,038 2,808,438 Expenses Salaries and benefits 5,782,178$ 5,782,178$ 5,303,364$ (478,814)$ Bad debts 400,000 400,000 309,483 (90,517) Utilities 1,996,500 1,996,500 2,018,303 21,803 Other operating expense 5,319,686 5,319,686 4,519,659 (800,027) Depreciation 1,397,932 1,397,932 3,558,476 2,160,544 Interest expense 1,451,924 1,451,924 1,448,959 (2,965) Miscellaneous 164,529 164,529 182,014 17,485 Transfers 1,340,599 1,340,599 1,340,599 - Capital expenditures 2,771,252 2,771,252 4,955,985 2,184,733
20,624,600 20,624,600 23,636,842 3,012,242
Operating Income -$ -$ (203,804) (203,804)$
Reconciliation to change in net position: Capital expenditures 4,955,985 Change in net position 4,752,181$
Budgeted Amounts
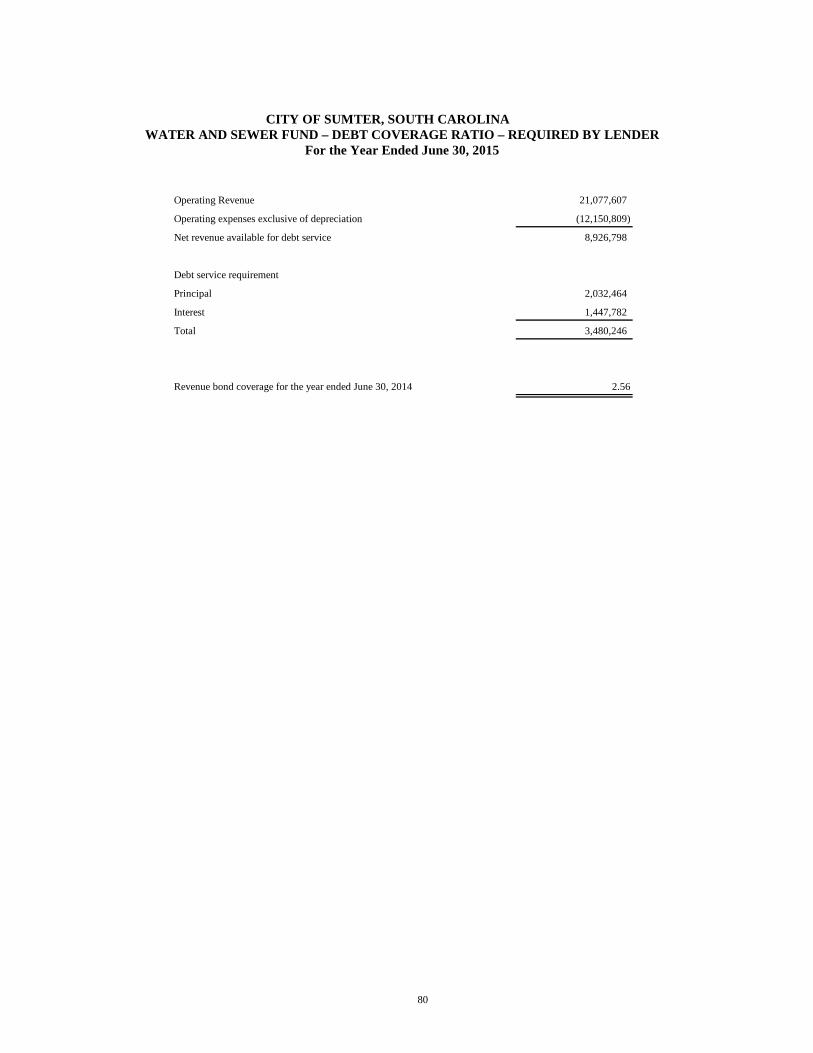
80
CITY OF SUMTER, SOUTH CAROLINA WATER AND SEWER FUND – DEBT COVERAGE RATIO – REQUIRED BY LENDER
For the Year Ended June 30, 2015
Operating Revenue 21,077,607
Operating expenses exclusive of depreciation (12,150,809)
Net revenue available for debt service 8,926,798
Debt service requirement
Principal 2,032,464
Interest 1,447,782
Total 3,480,246
Revenue bond coverage for the year ended June 30, 2014 2.56

81
FIDUCIARY FUNDS
PRIVATE-PURPOSE TRUST FUNDS
Private-purpose trust funds are used by the City to account for assets held by the City in a trustee capacity which are to be used for specific purposes established by donors. The City uses the following private-purpose trust funds: Neil O-Donnell Fund – Accounts for funds donated by Neil O’Donnell to be used for charitable purposes. George Reardon Fund – Accounts for funds donated by George Reardon to be used for charitable purposes. Ella Tuomey Fund – Accounts for funds donated by Ella Tuomey to be used for charitable purposes. Emergency Responders Trust Fund – Accounts for monies donated to the First Responders Trust Fund to be used for charitable purposes.

82
CITY OF SUMTER, SOUTH CAROLINA COMBINING SCHEDULE OF FIDUCIARY NET POSITION – PRIVATE-PURPOSE TRUST FUNDS
June 30, 2015
EmergencyNell George Ella Responders
O'Donnell Reardon Tuomey TrustFund Fund Fund Fund Total
Assets Cash and cash equivalents 3,093$ 506$ 1,458$ 3,864$ 8,921$ Total assets 3,093 506 1,458 3,864 8,921
Liabilities - - - - -
Net position held in trust for other purposes 3,093$ 506$ 1,458$ 3,864$ 8,921$
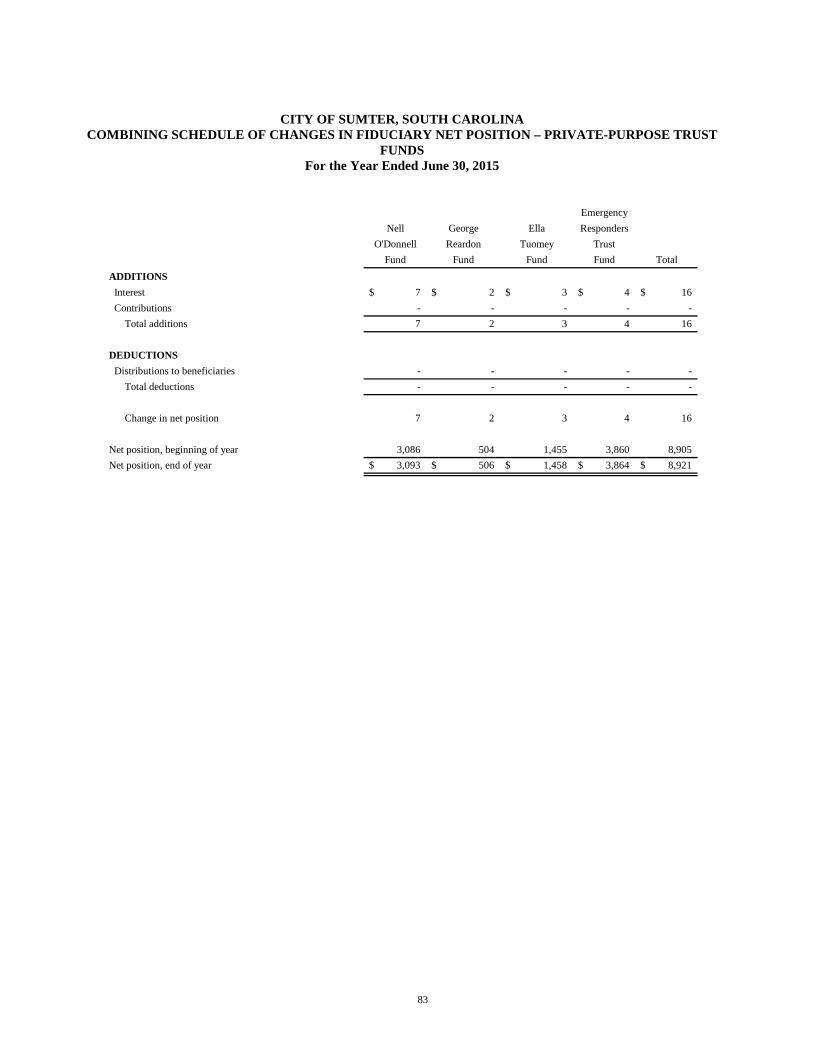
83
CITY OF SUMTER, SOUTH CAROLINA COMBINING SCHEDULE OF CHANGES IN FIDUCIARY NET POSITION – PRIVATE-PURPOSE TRUST
FUNDS For the Year Ended June 30, 2015
EmergencyNell George Ella Responders
O'Donnell Reardon Tuomey TrustFund Fund Fund Fund Total
ADDITIONS Interest 7$ 2$ 3$ 4$ 16$ Contributions - - - - - Total additions 7 2 3 4 16
DEDUCTIONS Distributions to beneficiaries - - - - - Total deductions - - - - -
Change in net position 7 2 3 4 16
Net position, beginning of year 3,086 504 1,455 3,860 8,905 Net position, end of year 3,093$ 506$ 1,458$ 3,864$ 8,921$

84
THIS PAGE INTENTIONALLY LEFT BLANK
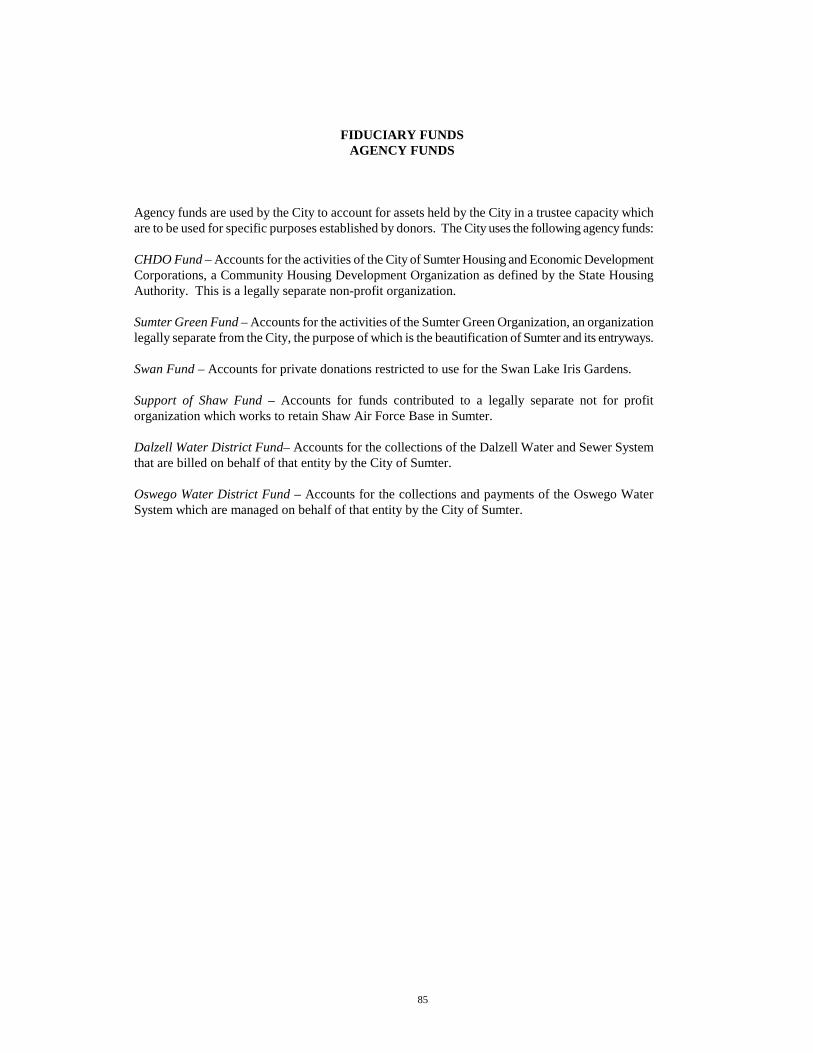
85
FIDUCIARY FUNDS
AGENCY FUNDS
Agency funds are used by the City to account for assets held by the City in a trustee capacity which are to be used for specific purposes established by donors. The City uses the following agency funds: CHDO Fund – Accounts for the activities of the City of Sumter Housing and Economic Development Corporations, a Community Housing Development Organization as defined by the State Housing Authority. This is a legally separate non-profit organization. Sumter Green Fund – Accounts for the activities of the Sumter Green Organization, an organization legally separate from the City, the purpose of which is the beautification of Sumter and its entryways. Swan Fund – Accounts for private donations restricted to use for the Swan Lake Iris Gardens. Support of Shaw Fund – Accounts for funds contributed to a legally separate not for profit organization which works to retain Shaw Air Force Base in Sumter. Dalzell Water District Fund– Accounts for the collections of the Dalzell Water and Sewer System that are billed on behalf of that entity by the City of Sumter. Oswego Water District Fund – Accounts for the collections and payments of the Oswego Water System which are managed on behalf of that entity by the City of Sumter.

86
Page 1 of 2 CITY OF SUMTER, SOUTH CAROLINA
COMBINING SCHEDULE OF CHANGES IN ASSETS AND LIABILITIES – AGENCY FUNDS For the Year Ended June 30, 2015
Balance BalanceBeginning of Year Additions Deductions End of Year
CHDO FundAssets
Cash and cash equivalents 488,841$ 123,417$ (18,703)$ 593,555$ Receivables - - - -
488,841$ 123,417$ (18,703)$ 593,555$ Liabilities
Accounts payable 12$ 25,100$ (16,012)$ 9,100$ Due to other organization 488,829 123,417 (27,791) 584,455
488,841$ 148,517$ (43,803)$ 593,555$ Sumter Green Fund
AssetsCash and cash equivalents 108,074$ 26,239$ (6,843)$ 127,470$ Accounts receivable 775 15,725 (14,500) 2,000
108,849$ 41,964$ (21,343)$ 129,470$ Liabilities
Accounts payable 442$ 2,738$ (2,633)$ 547$ Unearned revenue -$ 4,850$ -$ 4,850 Due to other organization 108,407 51,118 (35,452) 124,073
108,849$ 58,706$ (38,085)$ 129,470$ Swan Fund
AssetsCash and cash equivalents 326$ -$ -$ 326$
326$ -$ -$ 326$ Liabilities
Due to other organization 326$ -$ -$ 326$ 326$ -$ -$ 326$
Support of Shaw FundAssets
Cash and cash equivalents 200,950$ 66,000$ (16,903)$ 250,047$ 200,950$ 66,000$ (16,903)$ 250,047$
LiabilitiesDue to other organization 200,950$ 66,000$ (16,903)$ 250,047$
200,950$ 66,000$ (16,903)$ 250,047$ Dalzell Water District Fund
AssetsCash and cash equivalents 604,622$ 502,637$ (569,269)$ 537,990$ Receivables 20,437 476,483 (473,762) 23,158
625,059$ 979,120$ (1,043,031)$ 561,148$ Liabilities
Accounts payable 4,325$ 260,596$ (259,993)$ 4,928$ Due to customers 39,450 14,375 (13,875) 39,950 Due to other organization 581,284 496,114 (561,128) 516,270
625,059$ 771,085$ (834,996)$ 561,148$ Continued

87
Page 2 of 2 CITY OF SUMTER, SOUTH CAROLINA
COMBINING SCHEDULE OF CHANGES IN ASSETS AND LIABILITIES – AGENCY FUNDS For the Year Ended June 30, 2015
Balance BalanceBeginning of Year Additions Deductions End of Year
Oswego Water District FundAssets
Cash and cash equivalents 36,817$ 477,094$ (479,072)$ 34,839$ Receivables 47,196 456,735 (456,693) 47,238
84,013$ 933,829$ (935,765)$ 82,077$ Liabilities
Accounts payable 21,858$ 234,733$ (240,430)$ 16,161$ Due to other organization 62,155 414,355 (410,594) 65,916
84,013$ 649,088$ (651,024)$ 82,077$
Total Agency FundsAssets
Cash and cash equivalents 1,439,630$ 1,195,387$ (1,090,790)$ 1,544,227$ Receivables 68,408 948,943 (944,955) 72,396
1,508,038$ 2,144,330$ (2,035,745)$ 1,616,623$ Liabilities
Accounts payable 26,637$ 523,167$ (519,068)$ 30,736$ Unearned revenue - 4,850 - 4,850 Due to customers 39,450 14,375 (13,875) 39,950 Due to other organization 1,441,951 1,151,004 (1,051,868) 1,541,087
1,508,038$ 1,693,396$ (1,584,811)$ 1,616,623$

88
THIS PAGE INTENTIONALLY LEFT BLANK

89
CITY OF SUMTER, SOUTH CAROLINA SCHEDULE OF COURT FINE AND ASSESSMENT ACTIVITY AND EXPENDITURES FOR
VICTIMS SERVICES -- REQUIRED BY STATE LAW For the Year Ended June 30, 2015
2014 2015
Court fines, assessments and surcharges:Collected 699,774 796,642 Remitted to State Treasurer (382,729) (434,808) Retained by the City 317,045 361,834
Fines, assessments and surcharges retained by the City:General fund 270,569 311,509 Victims advocate services 46,476 50,325 Total assessments and surcharges retained by the City 317,045 361,834
Funds allocated to victims advocate service special revenue fundCarryover from prior year 29,271 25,969 Surcharges and assessments retianed current year 46,476 50,325 Expenditures for victims advocate services (49,778) (52,843)
Total (over) under expenditure of victims advocate service special revenue funds 25,969 23,451

90
THIS PAGE INTENTIONALLY LEFT BLANK

91
STATISTICAL SECTION
This part of the City's comprehensive annual financial report presents detailed informationas a context for understanding what the information in the financial statements, note disclosures, and required supplementary information says about the City's overallfinancial health.
Contents Page
Financial Trends 92-96These schedules contain trend information to help the reader understand how the City's financial performance and well-being have changed over time.
Revenue Capacity 97-100These schedules contain information to help the reader assess the City's most significant governmental fund revenue source, the property tax.
Debt Capacity 101-105These schedules present information to help the reader assess the affordability of the City's current level of outstanding debt and the City's ability to issue additionaldebt in the future.
Demographic and Economic Information 106-107These schedules are presented to help the reader understand the environment withinwhich the City's financial activities take place.
Operating Information 108-110These schedules contain service and infrastructure data to help the reader understandhow the information in the City's financial report relates to the services the Cityprovides and the activities it performs.

92
CITY OF SUMTER, SOUTH CAROLINA NET POSITION BY COMPONENT
LAST TEN FISCAL YEARS (Accrual Basis of Accounting)
UNAUDITED
Table 12006 2007 2008 2009 2010 2011 2012 2013 2014* 2015
Governmental activitiesNet investment in capital assets 15,086,440$ 23,843,014$ 30,105,633$ 31,086,985$ 38,855,105$ 33,172,826$ 34,953,433$ 33,243,982$ 37,254,398$ 37,859,121$ Restricted - - - 63,154 - 2,220,842 3,831,804 4,368,409 3,321,746 3,674,181 Unrestricted 4,119,402 2,270,411 2,769,241 3,882,797 6,763,381 8,982,814 6,450,276 9,682,906 (18,290,094) (15,213,181)
Total governmental activities net position 19,205,842$ 26,113,425$ 32,874,874$ 35,032,936$ 45,618,486$ 44,376,482$ 45,235,513$ 47,295,297$ 22,286,050$ 26,320,121$
Business-type activities Net investment in capital assets 35,562,785$ 38,097,635$ 46,025,099$ 33,643,937$ 41,013,302$ 37,631,521$ 40,344,630$ 44,351,489$ 47,592,613$ 51,883,642$ Restricted 226,752 517,257 - 572,027 1,188,369 2,940,523 6,891,660 1,972,234 3,171,556 2,998,574 Unrestricted 9,042,883 8,707,447 4,918,491 18,651,502 11,965,806 16,665,703 13,878,459 19,310,612 11,443,024 12,448,335
Total business-type activities net position 44,832,420$ 47,322,339$ 50,943,590$ 52,867,466$ 54,167,477$ 57,237,747$ 61,114,749$ 65,634,335$ 62,207,193$ 67,330,551$
Primary government totalsNet investment in capital assets 50,649,225$ 61,940,649$ 76,130,732$ 64,730,922$ 79,868,407$ 70,804,347$ 75,298,063$ 77,595,471$ 84,847,011$ 89,742,763$ Restricted 226,752 517,257 - 635,181 1,188,369 5,161,365 10,723,464 6,340,643 6,493,302 6,672,755 Unrestricted 13,162,285 10,977,858 7,687,732 22,534,299 18,729,187 25,648,517 20,328,735 28,993,518 (6,847,070) (2,764,846)
Total primary government net position 64,038,262$ 73,435,764$ 83,818,464$ 87,900,402$ 99,785,963$ 101,614,229$ 106,350,262$ 112,929,632$ 84,493,243$ 93,650,672$
* Net Position restated

93
CITY OF SUMTER, SOUTH CAROLINA CHANGES IN NET POSITION, LAST TEN FISCAL YEARS
(Accrual Basis of Accounting) UNAUDITED
Table 2
Page 1 of 22006 2007 2008 2009 2010 2011 2012 2013 2014 2015
ExpensesGovernmental activities:
General government 5,271,813$ 4,791,899$ 5,447,086$ 5,592,214$ 4,506,622$ 5,212,449$ 5,227,490$ 5,560,774$ 5,506,479$ 5,473,334$ Public safety 14,256,975 15,368,607 16,698,962 17,290,295 16,793,744 16,839,226 17,112,887 17,689,569 18,726,272 18,447,133 Public works 4,506,871 5,806,765 6,475,624 6,420,986 6,031,735 5,435,377 5,037,657 5,110,944 6,198,843 5,478,100 Parks, recreation and culture 2,687,048 2,555,595 2,773,731 2,637,829 2,973,471 3,135,364 3,356,330 3,268,065 3,655,740 4,128,482 Community development 692,302 510,146 560,078 584,209 626,765 625,752 503,184 449,666 518,788 381,600 Economic development 2,534,817 1,056,951 1,001,130 983,657 1,671,805 1,673,080 2,133,942 2,254,660 1,846,045 1,898,790 Interest on long-term debt 185,739 378,879 340,501 223,954 342,732 259,918 290,181 284,930 215,380 175,056 Appropriations to other agencies 573,786 813,350 904,552 838,885 - - - - - -
Total governmental activities expenses 30,709,351 31,282,192 34,201,664 34,572,029 32,946,874 33,181,166 33,661,671 34,618,608 36,667,547 35,982,495 Business-type activities:
Water and sewer services 13,989,071 13,309,016 14,266,540 15,116,230 16,062,841 16,262,505 17,238,843 16,954,386 17,606,238 17,659,418 Total business-type activities expenses 13,989,071 13,309,016 14,266,540 15,116,230 16,062,841 16,262,505 17,238,843 16,954,386 17,606,238 17,659,418 Total primary government expenses 44,698,422$ 44,591,208$ 48,468,204$ 49,688,259$ 49,009,715$ 49,443,671$ 50,900,514 51,572,994 54,273,785 53,641,913
Program RevenuesGovernmental activities:
Charges for services General government 741,742$ 669,057$ 460,843$ 481,653$ 156,606$ 428,026$ 61,124$ 61,811$ 62,235$ 59,224$ Public safety and courts 4,122,628 4,458,200 5,172,588 4,505,759 4,146,327 3,769,281 3,956,597 4,047,676 3,985,838 4,192,162 Public works 954,969 979,870 1,015,674 1,044,216 2,175,180 2,201,745 2,249,161 2,234,873 2,561,400 2,586,280 Parks, recreation and culture 132,811 118,690 106,995 159,574 235,540 356,821 383,008 388,646 418,939 435,833 Economic development 132,294 264,532 778,167 306,131 219,991 79,876 101,234 68,137 93,257 68,010
Operating grants and contributions 2,950,268 1,357,589 1,750,584 1,250,756 2,027,801 1,520,809 1,908,854 2,217,909 2,863,555 2,654,380 Capital grants and contributions 1,559,666 - 4,625,962 - 10,115,868 195,696 657,135 268,999 2,372,060 1,207,142
Total governmental activities program revenues 10,594,378 7,847,938 13,910,813 7,748,089 19,077,313 8,552,254 9,317,113 9,288,051 12,357,284 11,203,031 Business-type activities:
Charges for services - Water and sewer 14,488,093 15,758,257 17,043,844 17,694,265 18,654,564 20,256,196 20,348,381 20,815,639 21,034,775 21,634,744 Operating grants and contributions - - - - - 65,894 25,494 - - - Capital grants and contributions 50,807 - - - - - 1,694,297 2,128,816 1,532,724 1,985,402
Total business-type activities program revenues 14,538,900 15,758,257 17,043,844 17,694,265 18,654,564 20,322,090 22,068,172 22,944,455 22,567,499 23,620,146 Total primary government activities program revenues 25,133,278$ 23,606,195$ 30,954,657$ 25,442,354$ 37,731,877$ 28,874,344$ 31,385,285$ 32,232,506$ 34,924,783$ 34,823,177$
Continued
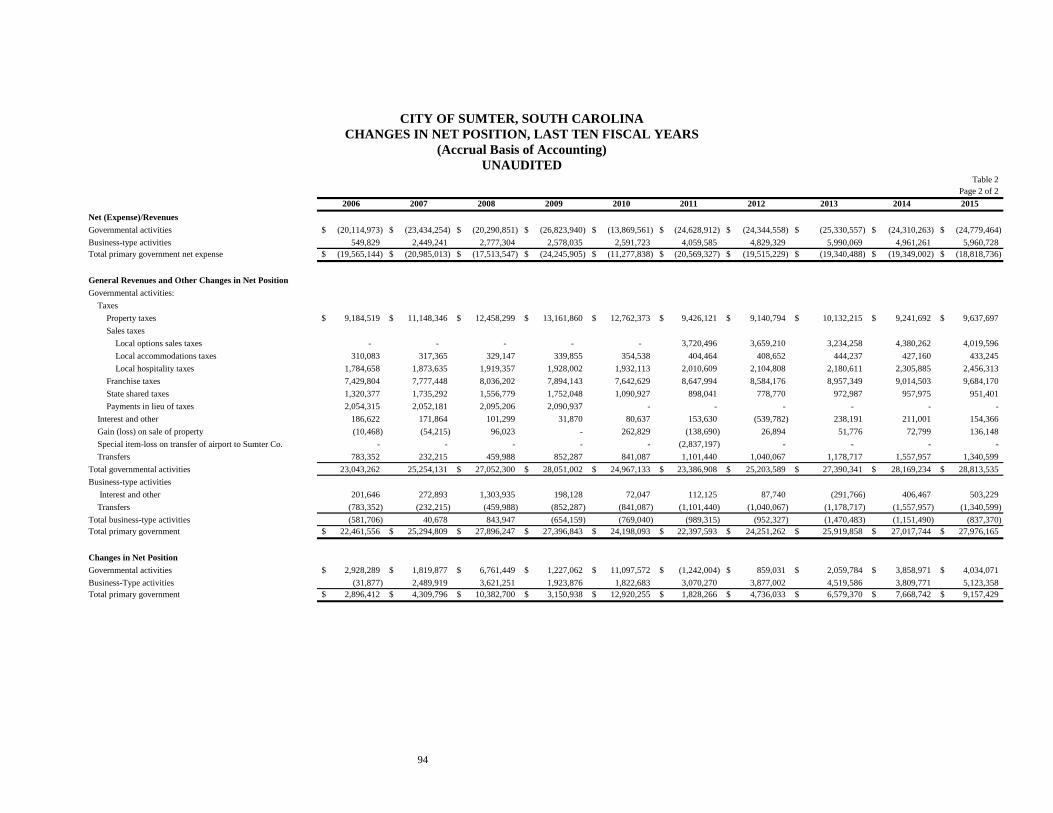
94
CITY OF SUMTER, SOUTH CAROLINA CHANGES IN NET POSITION, LAST TEN FISCAL YEARS
(Accrual Basis of Accounting) UNAUDITED
Table 2Page 2 of 2
2006 2007 2008 2009 2010 2011 2012 2013 2014 2015Net (Expense)/RevenuesGovernmental activities (20,114,973)$ (23,434,254)$ (20,290,851)$ (26,823,940)$ (13,869,561)$ (24,628,912)$ (24,344,558)$ (25,330,557)$ (24,310,263)$ (24,779,464)$ Business-type activities 549,829 2,449,241 2,777,304 2,578,035 2,591,723 4,059,585 4,829,329 5,990,069 4,961,261 5,960,728 Total primary government net expense (19,565,144)$ (20,985,013)$ (17,513,547)$ (24,245,905)$ (11,277,838)$ (20,569,327)$ (19,515,229)$ (19,340,488)$ (19,349,002)$ (18,818,736)$
General Revenues and Other Changes in Net PositionGovernmental activities:
TaxesProperty taxes 9,184,519$ 11,148,346$ 12,458,299$ 13,161,860$ 12,762,373$ 9,426,121$ 9,140,794$ 10,132,215$ 9,241,692$ 9,637,697$ Sales taxes
Local options sales taxes - - - - - 3,720,496 3,659,210 3,234,258 4,380,262 4,019,596 Local accommodations taxes 310,083 317,365 329,147 339,855 354,538 404,464 408,652 444,237 427,160 433,245 Local hospitality taxes 1,784,658 1,873,635 1,919,357 1,928,002 1,932,113 2,010,609 2,104,808 2,180,611 2,305,885 2,456,313
Franchise taxes 7,429,804 7,777,448 8,036,202 7,894,143 7,642,629 8,647,994 8,584,176 8,957,349 9,014,503 9,684,170 State shared taxes 1,320,377 1,735,292 1,556,779 1,752,048 1,090,927 898,041 778,770 972,987 957,975 951,401 Payments in lieu of taxes 2,054,315 2,052,181 2,095,206 2,090,937 - - - - - -
Interest and other 186,622 171,864 101,299 31,870 80,637 153,630 (539,782) 238,191 211,001 154,366 Gain (loss) on sale of property (10,468) (54,215) 96,023 - 262,829 (138,690) 26,894 51,776 72,799 136,148 Special item-loss on transfer of airport to Sumter Co. - - - - - (2,837,197) - - - - Transfers 783,352 232,215 459,988 852,287 841,087 1,101,440 1,040,067 1,178,717 1,557,957 1,340,599
Total governmental activities 23,043,262 25,254,131 27,052,300$ 28,051,002$ 24,967,133$ 23,386,908$ 25,203,589$ 27,390,341$ 28,169,234$ 28,813,535$ Business-type activities Interest and other 201,646 272,893 1,303,935 198,128 72,047 112,125 87,740 (291,766) 406,467 503,229 Transfers (783,352) (232,215) (459,988) (852,287) (841,087) (1,101,440) (1,040,067) (1,178,717) (1,557,957) (1,340,599) Total business-type activities (581,706) 40,678 843,947 (654,159) (769,040) (989,315) (952,327) (1,470,483) (1,151,490) (837,370) Total primary government 22,461,556$ 25,294,809$ 27,896,247$ 27,396,843$ 24,198,093$ 22,397,593$ 24,251,262$ 25,919,858$ 27,017,744$ 27,976,165$
Changes in Net PositionGovernmental activities 2,928,289$ 1,819,877$ 6,761,449$ 1,227,062$ 11,097,572$ (1,242,004)$ 859,031$ 2,059,784$ 3,858,971$ 4,034,071$ Business-Type activities (31,877) 2,489,919 3,621,251 1,923,876 1,822,683 3,070,270 3,877,002 4,519,586 3,809,771 5,123,358 Total primary government 2,896,412$ 4,309,796$ 10,382,700$ 3,150,938$ 12,920,255$ 1,828,266$ 4,736,033$ 6,579,370$ 7,668,742$ 9,157,429$
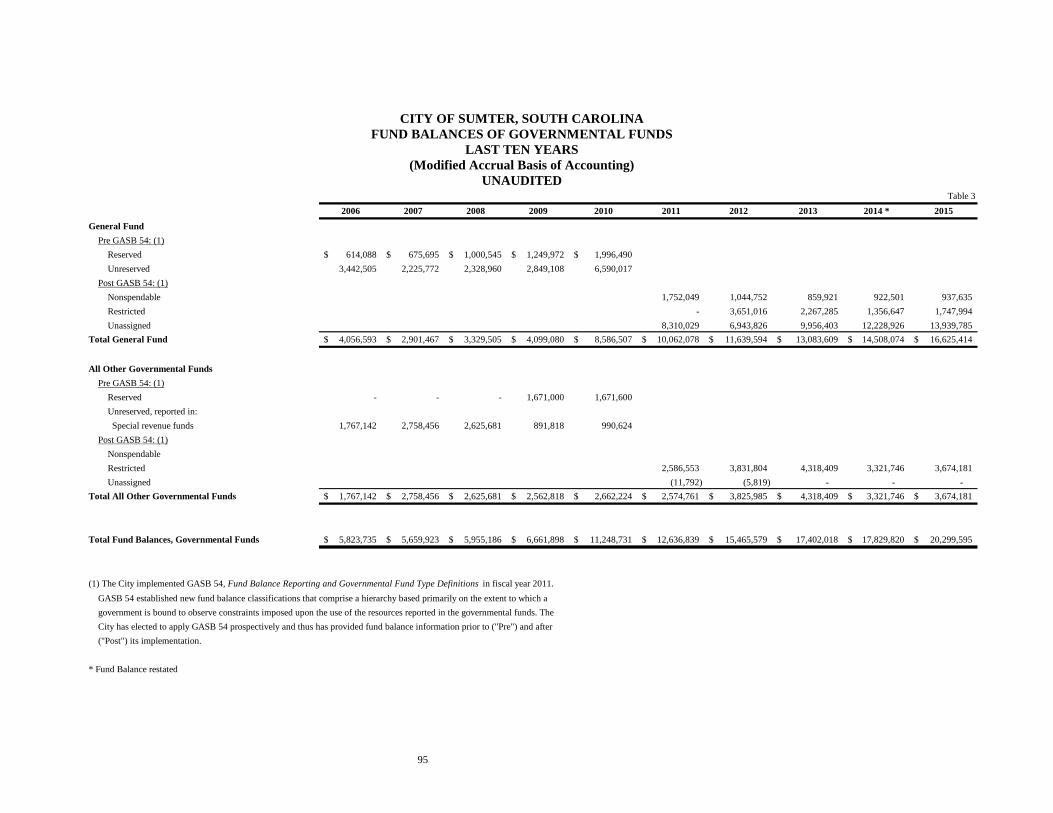
95
CITY OF SUMTER, SOUTH CAROLINA FUND BALANCES OF GOVERNMENTAL FUNDS
LAST TEN YEARS (Modified Accrual Basis of Accounting)
UNAUDITED Table 3
2006 2007 2008 2009 2010 2011 2012 2013 2014 * 2015
General FundPre GASB 54: (1)
Reserved 614,088$ 675,695$ 1,000,545$ 1,249,972$ 1,996,490$ Unreserved 3,442,505 2,225,772 2,328,960 2,849,108 6,590,017
Post GASB 54: (1)Nonspendable 1,752,049 1,044,752 859,921 922,501 937,635 Restricted - 3,651,016 2,267,285 1,356,647 1,747,994 Unassigned 8,310,029 6,943,826 9,956,403 12,228,926 13,939,785
Total General Fund 4,056,593$ 2,901,467$ 3,329,505$ 4,099,080$ 8,586,507$ 10,062,078$ 11,639,594$ 13,083,609$ 14,508,074$ 16,625,414$
All Other Governmental FundsPre GASB 54: (1)
Reserved - - - 1,671,000 1,671,600 Unreserved, reported in:
Special revenue funds 1,767,142 2,758,456 2,625,681 891,818 990,624 Post GASB 54: (1)
NonspendableRestricted 2,586,553 3,831,804 4,318,409 3,321,746 3,674,181 Unassigned (11,792) (5,819) - - -
Total All Other Governmental Funds 1,767,142$ 2,758,456$ 2,625,681$ 2,562,818$ 2,662,224$ 2,574,761$ 3,825,985$ 4,318,409$ 3,321,746$ 3,674,181$
Total Fund Balances, Governmental Funds 5,823,735$ 5,659,923$ 5,955,186$ 6,661,898$ 11,248,731$ 12,636,839$ 15,465,579$ 17,402,018$ 17,829,820$ 20,299,595$
(1) The City implemented GASB 54, Fund Balance Reporting and Governmental Fund Type Definitions in fiscal year 2011.
GASB 54 established new fund balance classifications that comprise a hierarchy based primarily on the extent to which agovernment is bound to observe constraints imposed upon the use of the resources reported in the governmental funds. TheCity has elected to apply GASB 54 prospectively and thus has provided fund balance information prior to ("Pre") and after("Post") its implementation.
* Fund Balance restated

96
CITY OF SUMTER, SOUTH CAROLINA
CHANGES IN FUND BALANCES OF GOVERNMENTAL FUNDS LAST TEN FISCAL YEARS
(Modified Accrual Basis of Accounting) UNAUDITED
Table 42006 2007 2008 2009 2010 2011 2012 2013 2014 2015
RevenuesTaxes 9,334,106$ 11,170,046$ 12,402,663$ 13,230,357$ 14,895,843$ 15,369,151$ 15,333,746 15,933,550 16,436,999 16,703,384 Licenses and Permits 7,502,612 7,777,448 11,460,871 10,757,413 8,454,695 8,928,576 8,957,579 9,301,024 9,304,157 10,017,818 Intergovernmental 11,545,583 10,020,835 7,425,986 6,918,849 14,561,393 6,034,723 6,276,527 6,570,703 9,422,466 7,952,977 Charges for Services - - - - 2,512,973 2,601,425 2,649,115 2,686,487 3,049,658 3,090,515 Fines and Forfeits 345,594 339,893 417,249 301,099 446,604 325,729 407,739 419,500 394,440 444,010 Payment in Lieu of Taxes 2,054,315 2,052,181 2,095,206 2,090,937 - - - - - - Interest Earned and Investment Return 188,857 265,725 183,421 126,860 124,468 122,145 (559,174) (21,483) 78,181 27,559 Other 1,287,263 1,330,075 1,510,791 1,479,028 188,253 124,916 160,771 106,547 141,669 103,196 Total Revenues 32,258,330 32,956,203 35,496,187 34,904,543 41,184,229 33,506,665 33,226,303 34,996,328 38,827,570 38,339,459
ExpendituresGeneral Government 2,998,117 3,025,849 3,130,201 3,191,375 4,302,085 5,068,526 5,034,237 5,350,291 5,334,675 5,535,277 Public Safety 13,226,392 14,544,336 15,127,875 15,481,952 15,402,499 15,576,986 15,761,596 16,453,860 16,677,457 17,983,142 Public Works 4,477,690 4,771,825 5,047,076 5,090,896 4,389,181 3,772,339 3,560,863 3,548,506 4,501,353 3,922,498 Parks and Gardens 1,402,568 1,910,121 2,027,503 1,856,278 1,686,536 1,906,528 1,636,336 1,586,780 1,741,499 2,051,372 Culture and Recreation 432,070 350,226 398,843 427,667 625,581 569,650 1,049,968 1,036,629 1,117,699 1,420,143 Community Development 504,660 370,620 723,150 587,682 489,124 488,111 365,543 310,025 377,225 289,640 Economic Development 1,818,656 924,959 775,636 555,469 1,273,882 1,694,256 1,953,751 2,030,994 1,617,646 1,670,764 Appropriations to Other Agenices 573,786 673,350 764,552 698,885 - - - - - - Other 1,697,603 1,579,998 2,141,421 2,239,328 - - - - - - Capital Outlay 5,039,482 4,128,798 3,921,594 4,766,454 10,667,283 2,735,228 4,607,333 2,980,566 6,920,566 3,828,240 Debt Service
Principal 1,855,258 1,545,758 3,212,907 1,749,341 1,931,933 1,881,620 2,483,333 1,675,465 2,459,785 1,764,903 Interest and Other Charges 363,237 387,090 358,330 360,598 316,947 338,156 317,180 265,934 238,459 184,848
Total Expenditures 34,389,519 34,212,930 37,629,088 37,005,925 41,085,051 34,031,400 36,770,140 35,239,050 40,986,364 38,650,827
Excess of Revenue Over (Under) Expenditures (2,131,189) (1,256,727) (2,132,901) (2,101,382) 99,178 (524,735) (3,543,837) (242,722) (2,158,794) (311,368)
Other Financing Sources (Uses)General Obligation Bonds 1,500,000 843,000 780,000 - 2,000,000 - 4,234,000 - - -
Capital Leases Issued 1,300,000 - 823,506 894,269 850,000 750,000 990,000 733,000 733,000 1,295,000 Sale of Property 167,129 17,700 364,670 130,538 262,829 61,403 43,800 267,444 204,306 145,544 Note Payable - - - - 700,000 - - - - - Transfers in 783,352 - 459,988 852,287 2,427,388 1,811,113 2,185,026 2,534,361 2,945,413 3,039,094 Transfers out - 232,215 - - (1,586,301) (709,673) (1,080,249) (1,355,644) (1,396,123) (1,698,495)
Total Other Financing Sources (Uses) 3,750,481 1,092,915 2,428,164 1,877,094 4,653,916 1,912,843 6,372,577 2,179,161 2,486,596 2,781,143
Net Change in Fund Balances 1,619,292$ (163,812)$ 295,263$ (224,288)$ 4,753,094$ 1,388,108$ 2,828,740$ 1,936,439$ 327,802$ 2,469,775$
Debt Service as a Percentage of Non-Capital Expenditures 7.56% 6.42% 10.59% 6.54% 7.39% 7.09% 8.71% 6.02% 7.92% 5.60%

97
CITY OF SUMTER, SOUTH CAROLINA ASSESSED VALUE AND ESTIMATED ACTUAL VALUE OF TAXABLE PROPERTY
LAST TEN FISCAL YEARS (Amounts Expressed in Thousands)
UNAUDITED
Table 5Personal Property Total Assessed
Less, Taxable Total Total Value as aFiscal Residential Commercial Motor Tax Exempt Assessed Direct Estimated Percentage ofYear Property Property Total Vehicles Other Total Property Value Tax Rate Actual Value Actual Value
2006 67,030 1,770 68,800 14,860 13,690 28,550 340 97,010 91.00 1,636,501 5.93%2007 80,450 1,850 82,300 14,920 13,430 28,350 430 110,220 96.00 1,995,726 5.52%2008 86,890 1,110 88,000 13,360 13,120 26,480 400 114,080 105.00 2,084,492 5.47%2009 89,930 1,090 91,020 13,370 13,450 26,820 470 117,370 105.00 2,189,562 5.36%2010 92,750 1,030 93,780 12,330 13,390 25,720 530 118,970 103.00 2,230,511 5.33%2011 92,850 1,130 93,980 13,400 13,960 27,360 420 120,920 103.00 2,300,385 5.26%2012 98,790 1,110 99,900 15,070 10,210 25,280 360 124,820 103.00 2,350,544 5.31%2013 99,490 1,180 100,670 14,280 13,950 28,230 250 128,650 102.00 2,489,160 5.17%2014 100,510 1,290 101,800 15,850 14,840 30,690 250 132,240 102.00 2,613,680 5.06%2015 102,330 1,540 103,870 15,560 15,620 31,180 250 134,800 102.00 2,763,010 4.88%
Property is reassessed approximately every five years. Reassessments took place in 2006 and 2012.The City has a tax increment district. The total millage for the City is listed.
Source: Sumter County Auditor
Real Property

98
CITY OF SUMTER, SOUTH CAROLINA PROPERTY TAX RATES
DIRECT AND OVERLAPPING GOVERNMENTS LAST TEN FISCAL YEARS
UNAUDITED
Table 6
City of Sumter(1) Sumter County (2) Sumter County School District (2)Debt Total Debt Total Debt Total
Fiscal Operating Service City Operating Service County Operating Service SchoolYear Millage Millage Millage Millage Millage Millage Millage Millage Millage Total
2006 86.80 4.20 91.00 96.20 10.00 106.20 145.10 46.00 191.10 388.30
2007 (3) 92.09 3.91 96.00 91.10 11.50 102.60 127.70 29.00 156.70 355.30
2008 100.59 4.41 105.00 94.73 14.00 108.73 135.00 40.00 175.00 388.73
2009 92.00 13.00 105.00 94.80 14.00 108.80 142.30 52.00 194.30 408.10
2010 98.00 5.00 103.00 88.80 15.00 103.80 147.70 40.00 187.70 394.50
2011 98.00 5.00 103.00 89.00 15.00 104.00 147.70 47.00 194.70 401.70
2012 98.00 5.00 103.00 90.30 15.00 105.30 151.00 57.00 208.00 416.30
2013 (3) 97.00 5.00 102.00 90.30 15.00 105.30 151.00 60.00 211.00 418.30
2014 97.00 5.00 102.00 92.00 15.00 107.00 151.00 60.00 211.00 420.00
2015 97.00 5.00 102.00 92.00 15.00 107.00 151.00 60.00 211.00 420.00
(1) Source: City of Sumter Finance Department(2) Source: Sumter County Auditor(3) Reassessment year
Overlapping Rates

99
CITY OF SUMTER, SOUTH CAROLINA PRINCIPAL TAXPAYERS
CURRENT YEAR AND NINE YEARS AGO (Amounts Expressed in Thousands)
UNAUDITED
Table 7
2014 Percentage of 2005 Percentage ofAssessed Total Assessed Assessed Total Assessed
Taxpayer Valuation Rank Valuation Valuation Rank ValuationDuke Energy Progress, Inc. 1,950$ 1 1.45%Verizon 1,659$ 1 1.70%Carolina Power & Light 1,266 2 1.30%FTC Diversified 1,180 2 0.88% 536 7 0.55%Time Warner Cable 1,105 3 1.13%SCE&G 890 3 0.66% 682 5 0.70%Sumter Mall, HSJ 830 4 0.62% 790 4 0.81%Frontier Communication 820 5 0.61%Piedmont Plantation Apt. 790 6 0.59%Garrison Sumter LLC 720 7 0.53%WalMart (Scott H Lee Trustee) 720 8 0.53%Safe Federal Credit Union 660 9 0.49%Farmers Telephone 660 10 0.49%Korn Industries 551 6 0.57%Martin Color Fi 509 8 0.52%Carolina Furniture 381 9 0.39%Osteen Publishing 361 10 0.37% Totals 9,220$ 6.84% 7,840$ 8.05%
Source: Sumter County AuditorTotal Assessed for 2014 134,806,850 Total Assessed for 2005: 97,357,000
Fiscal Year 2015 Fiscal Year 2006

100
CITY OF SUMTER, SOUTH CAROLINA PROPERTY TAX LEVIES AND COLLECTIONS
LAST TEN FISCAL YEARS (Amounts Expressed in Thousands)
UNAUDITED
Table 8Total Collections
Property in Fiscal Tax Taxes Percentage Subsequent PercentageYear Year Levied (1) Amount (1) (2) of Levy (1) Years Amount of Levy
2006 2005 5,479 5,246 95.7% 128 5,374 98.1%2007 2006 (3) 7,054 6,669 94.5% 244 6,913 98.0%2008 2007 8,401 8,154 97.1% 76 8,230 98.0%2009 2008 9,354 9,038 96.6% 460 9,498 101.5%2010 2009 9,105 8,685 95.4% 354 9,039 99.3%2011 2010 8,924 8,593 96.3% 381 8,974 100.6%2012 2011 9,014 8,635 95.8% 277 8,912 98.9%2013 2012 (3) 9,761 9,562 98.0% 339 9,901 101.4%2014 2013 9,101 8,552 94.0% 480 9,032 99.2%2015 2014 8,944 8,582 96.0% 408 8,990 100.5%
(1) Source: Sumter County Treasurer (2) Amount includes current tax collections for real and personal property as well as reimbursement for homestead exemptions. (3) Reassessment
Property taxes are collected by the Sumter County Treasurer's office.
Fiscal Year of the LevyCollected within the
Total Collections to Date
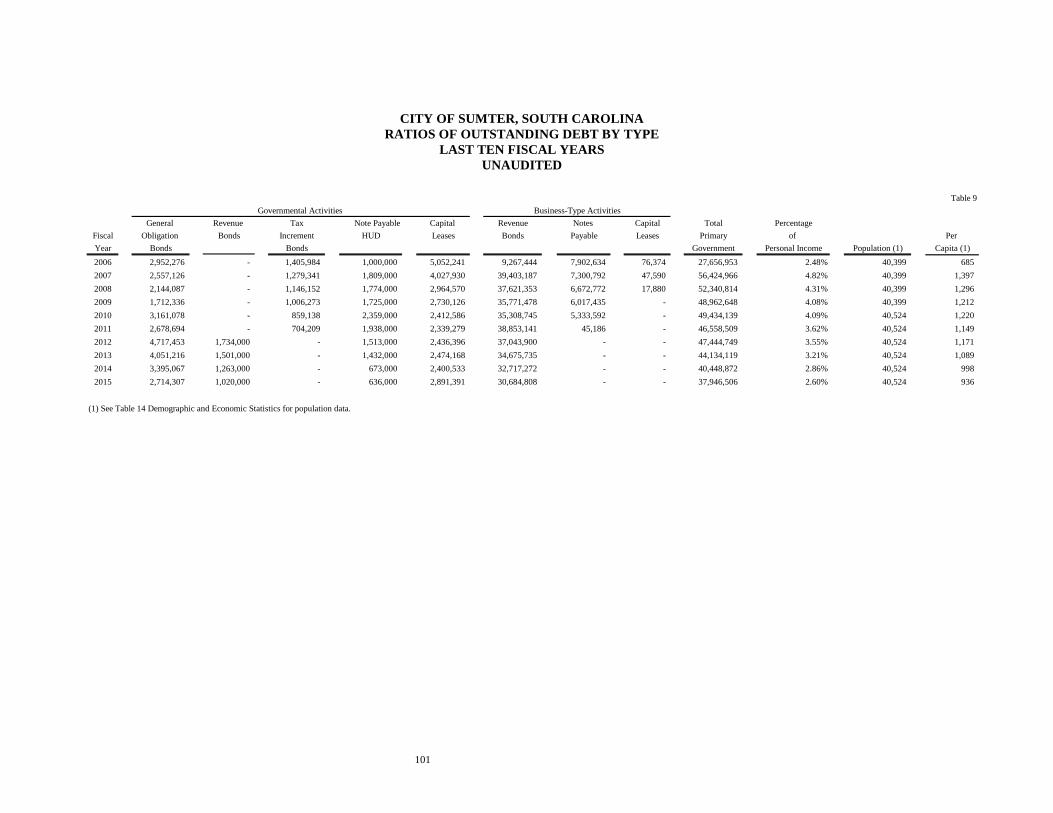
101
CITY OF SUMTER, SOUTH CAROLINA RATIOS OF OUTSTANDING DEBT BY TYPE
LAST TEN FISCAL YEARS UNAUDITED
Table 9
General Revenue Tax Note Payable Capital Revenue Notes Capital Total PercentageFiscal Obligation Bonds Increment HUD Leases Bonds Payable Leases Primary of Per Year Bonds Bonds Government Personal Income Population (1) Capita (1) 2006 2,952,276 - 1,405,984 1,000,000 5,052,241 9,267,444 7,902,634 76,374 27,656,953 2.48% 40,399 685 2007 2,557,126 - 1,279,341 1,809,000 4,027,930 39,403,187 7,300,792 47,590 56,424,966 4.82% 40,399 1,397 2008 2,144,087 - 1,146,152 1,774,000 2,964,570 37,621,353 6,672,772 17,880 52,340,814 4.31% 40,399 1,296 2009 1,712,336 - 1,006,273 1,725,000 2,730,126 35,771,478 6,017,435 - 48,962,648 4.08% 40,399 1,212 2010 3,161,078 - 859,138 2,359,000 2,412,586 35,308,745 5,333,592 - 49,434,139 4.09% 40,524 1,220 2011 2,678,694 - 704,209 1,938,000 2,339,279 38,853,141 45,186 - 46,558,509 3.62% 40,524 1,149 2012 4,717,453 1,734,000 - 1,513,000 2,436,396 37,043,900 - - 47,444,749 3.55% 40,524 1,171 2013 4,051,216 1,501,000 - 1,432,000 2,474,168 34,675,735 - - 44,134,119 3.21% 40,524 1,089 2014 3,395,067 1,263,000 - 673,000 2,400,533 32,717,272 - - 40,448,872 2.86% 40,524 998 2015 2,714,307 1,020,000 - 636,000 2,891,391 30,684,808 - - 37,946,506 2.60% 40,524 936
(1) See Table 14 Demographic and Economic Statistics for population data.
Business-Type ActivitiesGovernmental Activities
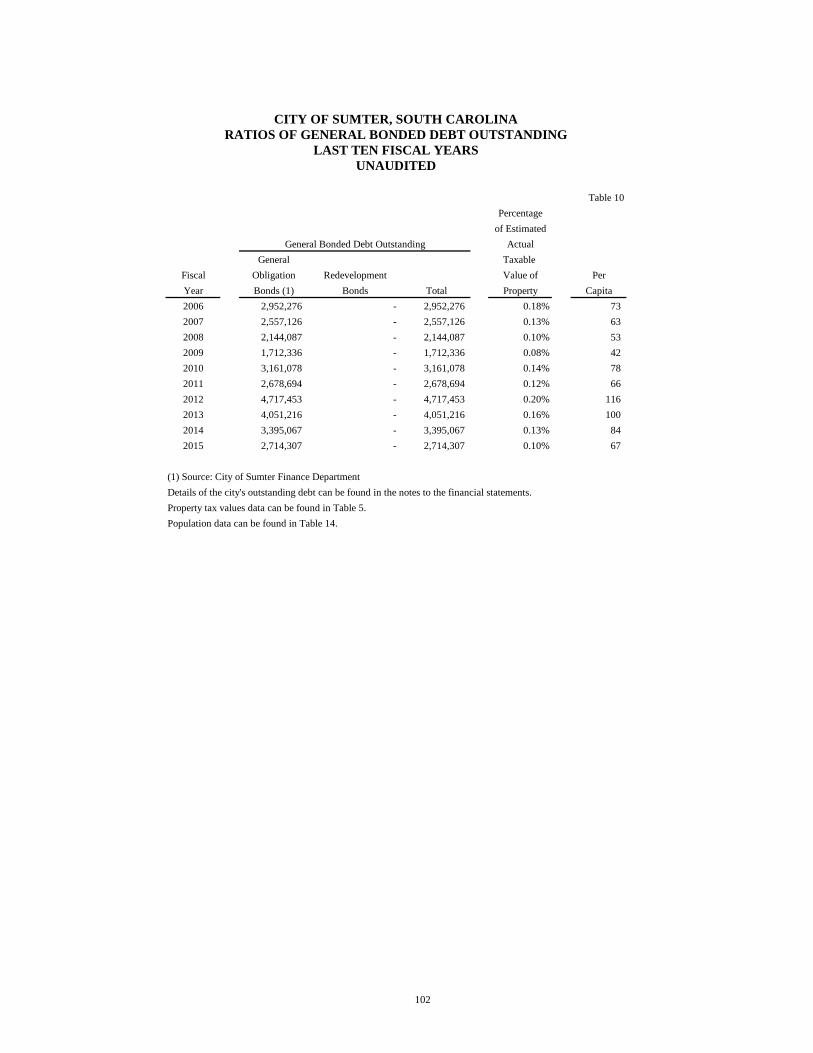
102
CITY OF SUMTER, SOUTH CAROLINA RATIOS OF GENERAL BONDED DEBT OUTSTANDING
LAST TEN FISCAL YEARS UNAUDITED
Table 10
Percentageof Estimated
ActualGeneral Taxable
Fiscal Obligation Redevelopment Value of PerYear Bonds (1) Bonds Total Property Capita2006 2,952,276 - 2,952,276 0.18% 73 2007 2,557,126 - 2,557,126 0.13% 63 2008 2,144,087 - 2,144,087 0.10% 53 2009 1,712,336 - 1,712,336 0.08% 42 2010 3,161,078 - 3,161,078 0.14% 78 2011 2,678,694 - 2,678,694 0.12% 66 2012 4,717,453 - 4,717,453 0.20% 116 2013 4,051,216 - 4,051,216 0.16% 100 2014 3,395,067 - 3,395,067 0.13% 84 2015 2,714,307 - 2,714,307 0.10% 67
(1) Source: City of Sumter Finance Department
Population data can be found in Table 14.Property tax values data can be found in Table 5.
General Bonded Debt Outstanding
Details of the city's outstanding debt can be found in the notes to the financial statements.
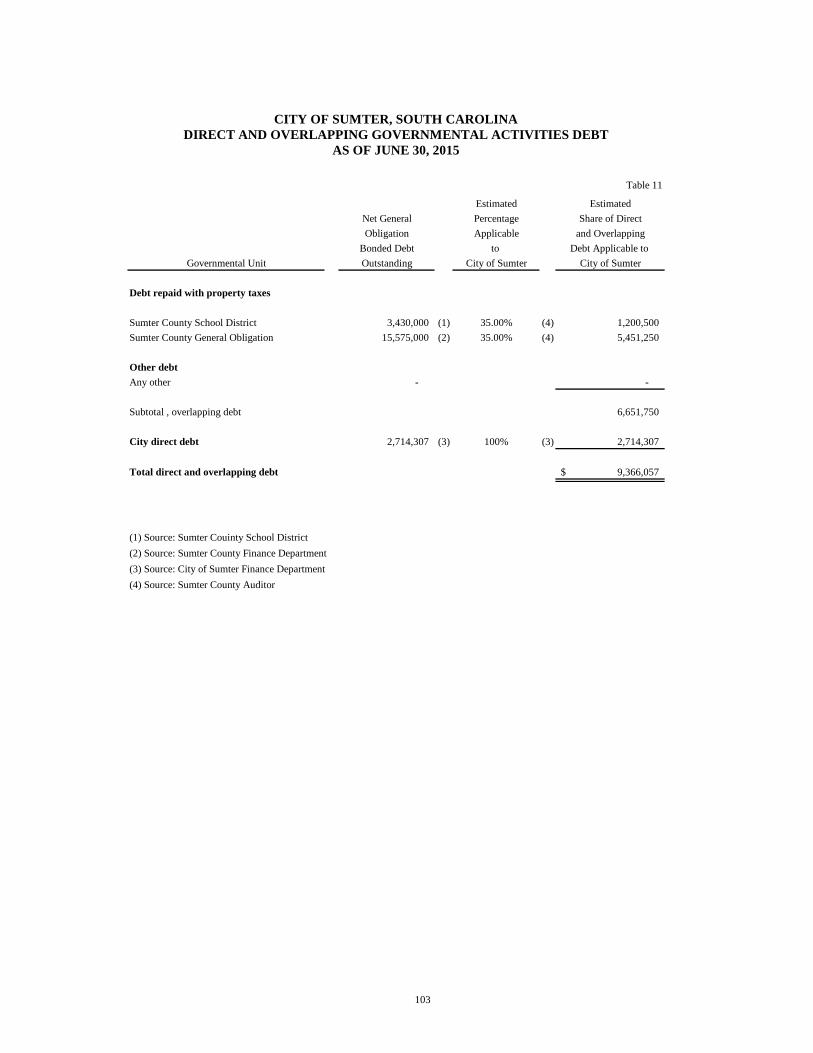
103
CITY OF SUMTER, SOUTH CAROLINA DIRECT AND OVERLAPPING GOVERNMENTAL ACTIVITIES DEBT
AS OF JUNE 30, 2015
Table 11
Estimated EstimatedNet General Percentage Share of DirectObligation Applicable and Overlapping
Bonded Debt to Debt Applicable to Governmental Unit Outstanding City of Sumter City of Sumter
Debt repaid with property taxes
Sumter County School District 3,430,000 (1) 35.00% (4) 1,200,500 Sumter County General Obligation 15,575,000 (2) 35.00% (4) 5,451,250
Other debt Any other - -
Subtotal , overlapping debt 6,651,750
City direct debt 2,714,307 (3) 100% (3) 2,714,307
Total direct and overlapping debt 9,366,057$
(1) Source: Sumter Couinty School District(2) Source: Sumter County Finance Department(3) Source: City of Sumter Finance Department(4) Source: Sumter County Auditor
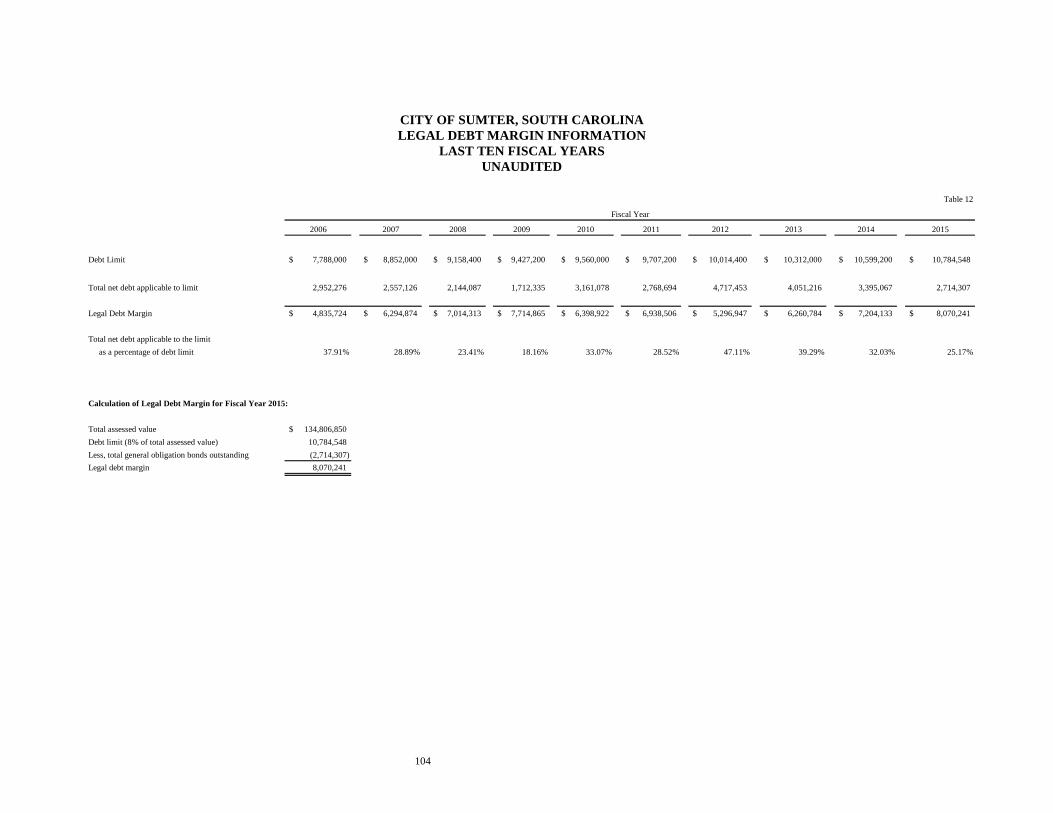
104
CITY OF SUMTER, SOUTH CAROLINA LEGAL DEBT MARGIN INFORMATION
LAST TEN FISCAL YEARS UNAUDITED
Table 12
Fiscal Year
2006 2007 2008 2009 2010 2011 2012 2013 2014 2015
Debt Limit 7,788,000$ 8,852,000$ 9,158,400$ 9,427,200$ 9,560,000$ 9,707,200$ 10,014,400$ 10,312,000$ 10,599,200$ 10,784,548$
Total net debt applicable to limit 2,952,276 2,557,126 2,144,087 1,712,335 3,161,078 2,768,694 4,717,453 4,051,216 3,395,067 2,714,307
Legal Debt Margin 4,835,724$ 6,294,874$ 7,014,313$ 7,714,865$ 6,398,922$ 6,938,506$ 5,296,947$ 6,260,784$ 7,204,133$ 8,070,241$
Total net debt applicable to the limit as a percentage of debt limit 37.91% 28.89% 23.41% 18.16% 33.07% 28.52% 47.11% 39.29% 32.03% 25.17%
Calculation of Legal Debt Margin for Fiscal Year 2015:
Total assessed value 134,806,850$ Debt limit (8% of total assessed value) 10,784,548 Less, total general obligation bonds outstanding (2,714,307) Legal debt margin 8,070,241
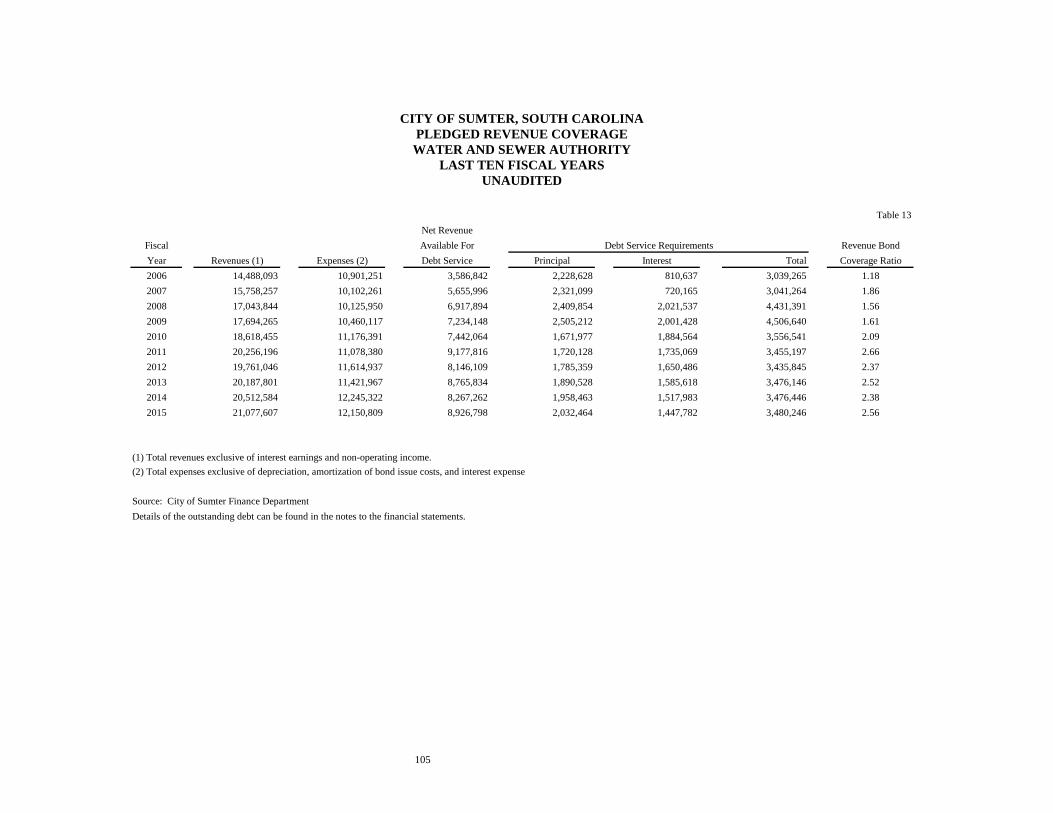
105
CITY OF SUMTER, SOUTH CAROLINA PLEDGED REVENUE COVERAGE
WATER AND SEWER AUTHORITY LAST TEN FISCAL YEARS
UNAUDITED
Table 13 Net Revenue
Fiscal Available For Revenue BondYear Revenues (1) Expenses (2) Debt Service Principal Interest Total Coverage Ratio2006 14,488,093 10,901,251 3,586,842 2,228,628 810,637 3,039,265 1.182007 15,758,257 10,102,261 5,655,996 2,321,099 720,165 3,041,264 1.862008 17,043,844 10,125,950 6,917,894 2,409,854 2,021,537 4,431,391 1.562009 17,694,265 10,460,117 7,234,148 2,505,212 2,001,428 4,506,640 1.612010 18,618,455 11,176,391 7,442,064 1,671,977 1,884,564 3,556,541 2.092011 20,256,196 11,078,380 9,177,816 1,720,128 1,735,069 3,455,197 2.662012 19,761,046 11,614,937 8,146,109 1,785,359 1,650,486 3,435,845 2.372013 20,187,801 11,421,967 8,765,834 1,890,528 1,585,618 3,476,146 2.522014 20,512,584 12,245,322 8,267,262 1,958,463 1,517,983 3,476,446 2.382015 21,077,607 12,150,809 8,926,798 2,032,464 1,447,782 3,480,246 2.56
(1) Total revenues exclusive of interest earnings and non-operating income. (2) Total expenses exclusive of depreciation, amortization of bond issue costs, and interest expense
Source: City of Sumter Finance DepartmentDetails of the outstanding debt can be found in the notes to the financial statements.
Debt Service Requirements

106
CITY OF SUMTER, SOUTH CAROLINA DEMOGRAPHIC STATISTICS
LAST TEN FISCAL YEARS UNAUDITED
Table 14
PerFiscal Capita Personal School UnemploymentYear Population Income Income Enrollment (5) Rate (3)2006 40,399 (1) 27,640 (3) 1,116,628,360 9,316 7.9%2007 40,399 (1) 28,959 (3) 1,169,914,641 8,706 6.7%2008 40,399 (1) 30,029 (3) 1,213,141,571 8,663 7.8%2009 40,399 (1) 29,713 (3) 1,200,375,487 8,369 12.8%2010 40,524 (2) 29,845 (3) 1,209,438,780 8,387 11.9%2011 * 40,524 (2) 31,725 (3) 1,285,623,900 16,855 11.7%2012 * 40,524 (2) 32,973 (3) 1,336,197,852 16,917 10.3%2013 * 40,524 (2) 33,952 (4) 1,375,870,848 16,251 8.8%2014 * 40,524 (2) 34,931 (4) 1,415,543,844 17,045 6.1%2015 * 40,524 (2) 36,077 (3) 1,461,984,348 17,237 7.4%
(1) Source: US Census Bureau, Census 2000 (2) Source: US Census Bureau, Census 2010(3) Source: US Department of Commerce, Bureau of Economic Analysis(4) Source: Estimate by City of Sumter Finance Department(5) Source: Sumter County School District* School Enrollment reflects total number of students in merged districts 2 & 17

107
CITY OF SUMTER, SOUTH CAROLINA
PRINCIPAL EMPLOYERS CURRENT YEAR AND NINE YEARS AGO
UNAUDITED
Table 15
2015 2006
Percentage of Percentage ofNumber of Total Number of Total
Employer Employees Rank Employment Employees Rank Employment
Shaw Air Force Base (1) 9,031 1 22.02% 6875 1 16.27%
Gold Kist, Inc. (acquired by Pilgrim's Pride in 2006) 2210 2 5.23%
Pilgrim's Pride (2) 2,150 3 5.24%
Tuomey Healthcare System (4) 1,843 4 4.49% 1631 3 3.86%
Sumter County School District (3) 3,019 2 7.36%
Sumter School District #17 1550 4 3.67%
Sumter School District #2 1195 5 2.83%
State of South Carolina (5) 903 6 2.20% 1132 6 2.68%
Sykes, Inc. (Data Center) (2) 950 5 2.32%
BD Preanalytical Solutions (2) 800 7 1.95% 804 7 1.90%
Eaton Electrical (Cutler-Hammer) (2) 660 10 1.61% 665 9 1.57%
Sumter County Government (2) 667 9 1.63% 518 10 1.23%
Santee Print Works (2) 725 8 1.72%
Continental Tire 700 8 1.71%
Total Employment (6) 41,018 42,252
* Table reflects data for the entire county of Sumter
(1) Source: Shaw Air Force Base Public Affairs Department(2) Source: Sumter County Development Board(3) Estimate by City of Sumter Finance Department(4) Source: Tuomey Health Care System(5) Source: State Of South Carolina Budget and Control Board(6) Source: SC Department of Employment & Workforce

108
CITY OF SUMTER, SOUTH CAROLINA FULL-TIME EQUIVALENT CITY GOVERNMENT EMPLOYEES BY FUNCTION
LAST TEN FISCAL YEARS UNAUDITED
2006 2007 2008 2009 2010 2011 2012 2013 2014 2015Function/ProgramGeneral Government
Administrative 23 28 29 32 24 27 27 28 27 25City store 1 2 2 2 2 2 2 2 2 2Planning 13 13 13 13 12 11 10 10 11 8Business License (2) - - - - 5 4 4 4 4 4Downtown 2 2 2 2 2 2 2 3 4 5
Public SafetyBuilding inspections 11 11 12 12 11 12 12 12 12 11Codes (3) - - - - 4 4 4 5 4 6Police 109 112 113 117 108 105 103 108 106 106Police clerical 12 10 17 13 10 16 17 16 14 14Police city-county 30 31 33 32 34 36 35 34 35 33Municipal court (1) - 3 2 2 2 1 2 2 2 2Fire 82 98 100 102 108 101 104 101 104 106
Public WorksConstruction 10 10 10 10 10 7 7 6 9 10Engineering 6 7 7 6 6 7 5 7 7 7Public works 9 10 11 10 10 8 10 10 8 8Vehicle maintenance 1 1 1 1 1 1 1 1 1 1Sanitation 40 40 40 40 40 38 38 39 39 38
Parks & Gardens 31 32 35 34 34 37 35 34 38 39Recreation 2 3 2 3 4 6 7 7 6 7Community Development
Hope centers - - - 10 10 11 12 11 11 12Water & Sewer
Utility billing 13 17 17 19 20 27 29 28 29 27Water & sewer distribution 31 32 33 34 32 31 29 29 32 30Mechanical maintenance 9 11 11 11 11 9 10 9 10 11Water plants 12 12 12 13 12 12 12 12 12 14Sewer plant 26 27 27 27 28 25 26 26 26 26Electrical maintenance 3 3 3 3 3 1 2 2 3 3Mayesville 2 2 2 2 2 2 2 2 1 2
TOTAL EMPLOYEES 478 517 534 550 545 543 547 548 557 557
(1) In prior years the employees for the Municipal Court were included with the Police department employees.
(2) In prior years the employees for Business License were included with Administration.(3) In prior years the employees for Codes wer included with Police.
Table 16
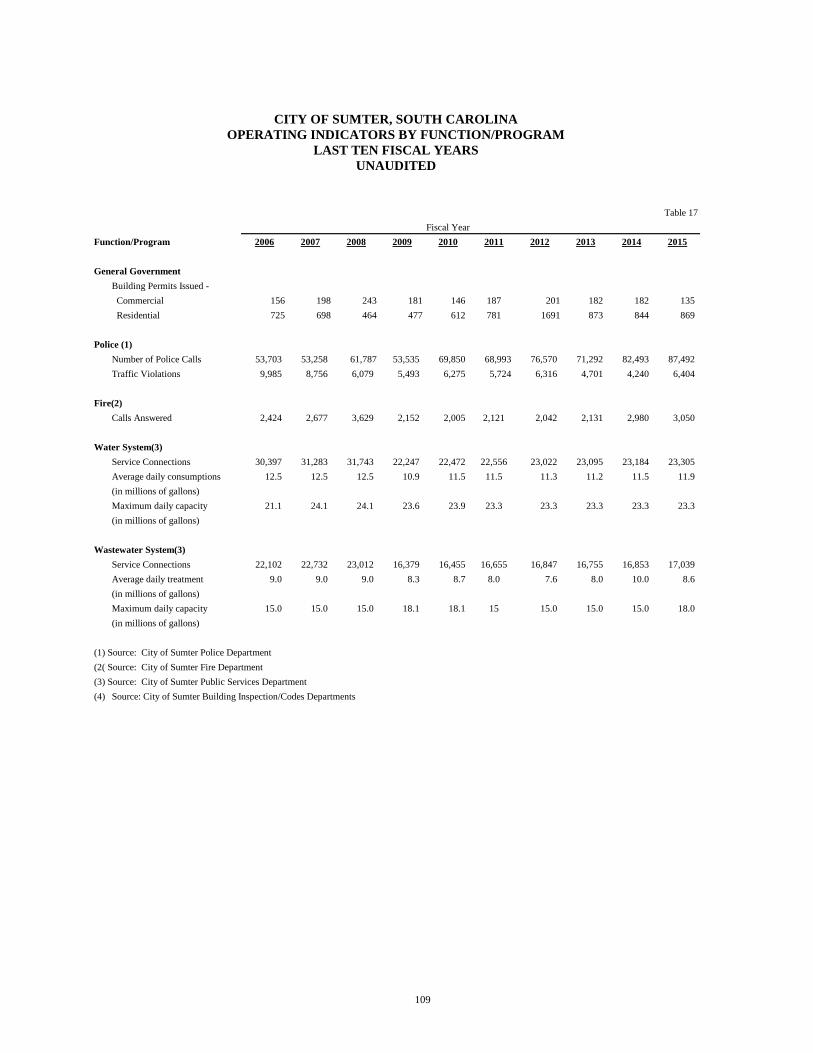
109
CITY OF SUMTER, SOUTH CAROLINA OPERATING INDICATORS BY FUNCTION/PROGRAM
LAST TEN FISCAL YEARS UNAUDITED
Table 17
2006 2007 2008 2009 2010 2011 2012 2013 2014 2015
General GovernmentBuilding Permits Issued - Commercial 156 198 243 181 146 187 201 182 182 135 Residential 725 698 464 477 612 781 1691 873 844 869
Police (1)Number of Police Calls 53,703 53,258 61,787 53,535 69,850 68,993 76,570 71,292 82,493 87,492 Traffic Violations 9,985 8,756 6,079 5,493 6,275 5,724 6,316 4,701 4,240 6,404
Fire(2)Calls Answered 2,424 2,677 3,629 2,152 2,005 2,121 2,042 2,131 2,980 3,050
Water System(3)Service Connections 30,397 31,283 31,743 22,247 22,472 22,556 23,022 23,095 23,184 23,305 Average daily consumptions 12.5 12.5 12.5 10.9 11.5 11.5 11.3 11.2 11.5 11.9 (in millions of gallons)Maximum daily capacity 21.1 24.1 24.1 23.6 23.9 23.3 23.3 23.3 23.3 23.3 (in millions of gallons)
Wastewater System(3)Service Connections 22,102 22,732 23,012 16,379 16,455 16,655 16,847 16,755 16,853 17,039 Average daily treatment 9.0 9.0 9.0 8.3 8.7 8.0 7.6 8.0 10.0 8.6 (in millions of gallons)Maximum daily capacity 15.0 15.0 15.0 18.1 18.1 15 15.0 15.0 15.0 18.0 (in millions of gallons)
(1) Source: City of Sumter Police Department(2( Source: City of Sumter Fire Department(3) Source: City of Sumter Public Services Department(4) Source: City of Sumter Building Inspection/Codes Departments
Function/ProgramFiscal Year
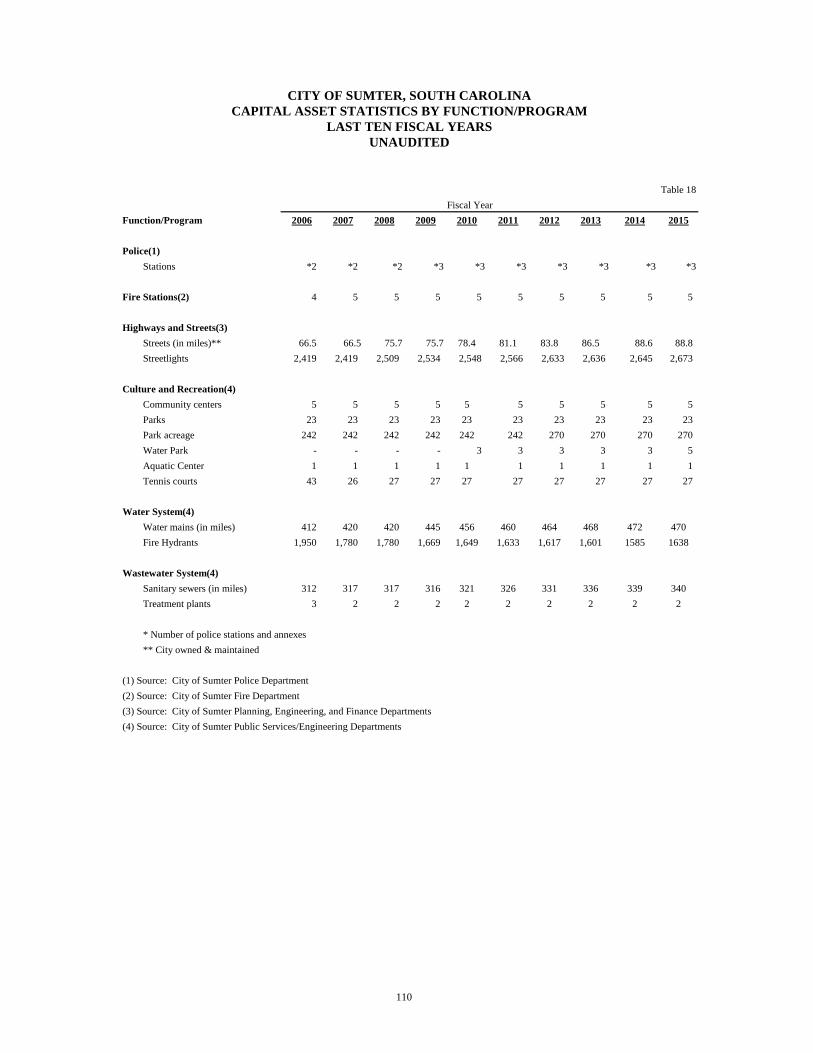
110
CITY OF SUMTER, SOUTH CAROLINA CAPITAL ASSET STATISTICS BY FUNCTION/PROGRAM
LAST TEN FISCAL YEARS UNAUDITED
Table 18
2006 2007 2008 2009 2010 2011 2012 2013 2014 2015
Police(1)Stations *2 *2 *2 *3 *3 *3 *3 *3 *3 *3
Fire Stations(2) 4 5 5 5 5 5 5 5 5 5
Highways and Streets(3)Streets (in miles)** 66.5 66.5 75.7 75.7 78.4 81.1 83.8 86.5 88.6 88.8 Streetlights 2,419 2,419 2,509 2,534 2,548 2,566 2,633 2,636 2,645 2,673
Culture and Recreation(4)Community centers 5 5 5 5 5 5 5 5 5 5 Parks 23 23 23 23 23 23 23 23 23 23 Park acreage 242 242 242 242 242 242 270 270 270 270 Water Park - - - - 3 3 3 3 3 5 Aquatic Center 1 1 1 1 1 1 1 1 1 1 Tennis courts 43 26 27 27 27 27 27 27 27 27
Water System(4)Water mains (in miles) 412 420 420 445 456 460 464 468 472 470Fire Hydrants 1,950 1,780 1,780 1,669 1,649 1,633 1,617 1,601 1585 1638
Wastewater System(4)Sanitary sewers (in miles) 312 317 317 316 321 326 331 336 339 340Treatment plants 3 2 2 2 2 2 2 2 2 2
* Number of police stations and annexes** City owned & maintained
(1) Source: City of Sumter Police Department(2) Source: City of Sumter Fire Department(3) Source: City of Sumter Planning, Engineering, and Finance Departments(4) Source: City of Sumter Public Services/Engineering Departments
Function/ProgramFiscal Year

111
REGULATORY SECTION

112
THIS PAGE INTENTIONALLY LEFT BLANK
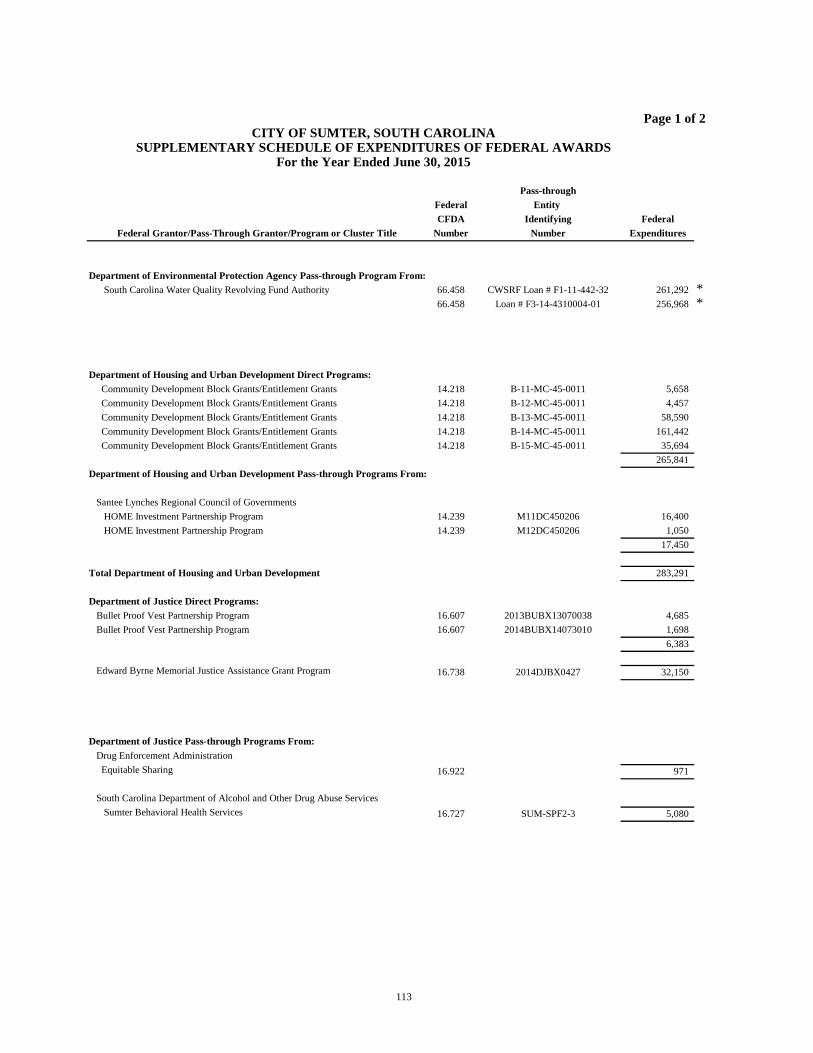
113
Page 1 of 2 CITY OF SUMTER, SOUTH CAROLINA SUPPLEMENTARY SCHEDULE OF EXPENDITURES OF FEDERAL AWARDS For the Year Ended June 30, 2015
Pass-throughFederal Entity CFDA Identifying Federal
Federal Grantor/Pass-Through Grantor/Program or Cluster Title Number Number Expenditures
South Carolina Water Quality Revolving Fund Authority 66.458 CWSRF Loan # F1-11-442-32 261,292 *66.458 Loan # F3-14-4310004-01 256,968 *
Department of Housing and Urban Development Direct Programs: Community Development Block Grants/Entitlement Grants 14.218 B-11-MC-45-0011 5,658 Community Development Block Grants/Entitlement Grants 14.218 B-12-MC-45-0011 4,457 Community Development Block Grants/Entitlement Grants 14.218 B-13-MC-45-0011 58,590 Community Development Block Grants/Entitlement Grants 14.218 B-14-MC-45-0011 161,442 Community Development Block Grants/Entitlement Grants 14.218 B-15-MC-45-0011 35,694
265,841 Department of Housing and Urban Development Pass-through Programs From:
Santee Lynches Regional Council of Governments HOME Investment Partnership Program 14.239 M11DC450206 16,400 HOME Investment Partnership Program 14.239 M12DC450206 1,050
17,450
Total Department of Housing and Urban Development 283,291
Department of Justice Direct Programs: Bullet Proof Vest Partnership Program 16.607 2013BUBX13070038 4,685 Bullet Proof Vest Partnership Program 16.607 2014BUBX14073010 1,698
6,383
Edward Byrne Memorial Justice Assistance Grant Program 16.738 2014DJBX0427 32,150
Department of Justice Pass-through Programs From: Drug Enforcement Administration Equitable Sharing 16.922 971
South Carolina Department of Alcohol and Other Drug Abuse Services Sumter Behavioral Health Services 16.727 SUM-SPF2-3 5,080
Department of Environmental Protection Agency Pass-through Program From:

114
Page 2 of 2 CITY OF SUMTER, SOUTH CAROLINA
SUPPLEMENTARY SCHEDULE OF EXPENDITURES OF FEDERAL AWARDS For the Year Ended June 30, 2015
Pass-through
Federal Entity CFDA Identifying Federal
Federal Grantor/Pass-Through Grantor/Program or Cluster Title Number Number Expenditures
South Carolina Department of Public Safety Victims of Crime 16.575 1V13166 9,312 Victims of Crime 16.575 1V14091 27,935
37,247
Violence Against Women/Jessica Gonzales Victim Advocate 16.588 1K13017 7,591 Violence Against Women/Jessica Gonzales Victim Advocate 16.588 1K13059 4,469 Violence Against Women/Jessica Gonzales Victim Advocate 16.588 1K14016 17,748 29,808
Total Department of Justice 111,639
Department of Transportation Pass-through Programs From: South Carolina Department of Transportation Federal Transit-Metropolitan Planning Grants 20.505 152,109
South Carolina Parks, Recreation and Tourism 20.219 P28051300414 100,000 Total Department of Transportation 252,109
Total Expenditures of Federal Awards 1,165,299$
* Tested as major programs
The accompanying notes are an integral part of this schedule.

115
CITY OF SUMTER, SOUTH CAROLINA NOTES TO SCHEDULE OF EXPENDITURES OF FEDERAL AWARDS
For the Year Ended June 30, 2015
Basis of Presentation The accompanying Schedule of Expenditures of Federal Awards (the “Schedule”) includes federal grant activity of the City of Sumter under programs of the federal government for the year ended June 30, 2015. The information in this schedule is presented in accordance with the requirements of the Office of Management and Budget (OMB) Circular A-133, Audits of States, Local Governments, and Non-Profit Organizations. Because the Schedule presents only a selected portion of the operations of the City of Sumter, it is not intended to and does not present the financial position, changes in net position or cash flows of the City of Sumter. Summary of Significant Accounting Policies Expenditures reported on the Schedule are reported on the accrual basis of accounting. Such expenditures are recognized following the cost principles contained in OMB Circular A-122, Cost Principles for Non-profit Organizations, wherein certain types of expenditures are not allowable or are limited as to reimbursement. Pass-through entity identifying numbers are presented where available. Subrecipients Of the federal expenditures presented in the schedule, the City of Sumter provided federal awards to subrecipients as follows: Amount provided
CFDA Number Program Name to subrecipient
14.239 HOME Investment Partnership Program $17,450


120
Financial Statements
Type of auditor's report issued: Unmodified
Internal control over financial reporting: Material weakness(es) identified? Yes X No Significant deficieny(ies) identified? Yes X None reportedNoncompliance material to financial statements noted? Yes X No
Federal Awards
Internal control over major programs: Material weakness(es) identified? Yes X No Significant deficieny(ies) identified? Yes X None reported
Type of auditor's report issued on compliance for major programs: Unmodified
Any audit findings disclosed that are required to be reported in accordance with Section 510(a) of OMB Circular A-133 Yes X No
Identification of major programs
CFDA Number Program Name66.458 SC Water Quality Revolving Fund Authority
Dollar threshold used to distinguish between type A and type B programs: 300,000$
Auditee qualified as a low risk? X Yes No
None.
None.
Section II - Financial Statements
Section III - Federal Awards Findings and Questioned Costs
CITY OF SUMTERSCHEDULE OF FINDINGS AND QUESTIONED COSTS
For the Year Ended June 30, 2015
Section I - Summary of Auditor's Results

121
CITY OF SUMTER SUMMARY SCHEDULE OF PRIOR YEAR AUDIT FINDINGS
For the Year Ended June 30, 2015
There were no prior year audit findings.