city of saint paul 2014 cafr
TRANSCRIPT

Photo and Design Credits
The cover image highlights one of St. Paul’s most anticipated events: the Red Bull Crashed Ice World Championship. In 2013, the event drew 115,000 spectators to watch the toughest, fastest ice cross downhill racers go head-to-head through a downhill course full of mind-and-body-bending jumps, turns and slides – all against the backdrop of the historic Cathedral of Saint Paul. Photo Credits: Red Bull Crashed Ice. Photo by Ben Garvin; courtesy of St. Paul Pioneer Press ©.
City of Saint Paul Minnesota
Comprehensive Annual Financial Report
For the Fiscal Year Ended December 31, 2014
Office of Financial Services Todd P. Hurley, Director

City of Saint Paul, Minnesota TABLE OF CONTENTS For the Fiscal Year Ended December 31, 2014
INTRODUCTORY SECTION Page Letter of Transmittal v Organizational Chart xvii Elected and Appointed Officials xviii Certificate of Achievement xix FINANCIAL SECTION Page Independent Auditor’s Report 1 Management’s Discussion and Analysis 5
Basic Financial Statements • Government-wide Financial Statements o Statement of Net Position Statement 1 25 o Statement of Activities Statement 2 27
• Fund Financial Statements o Balance Sheet – Governmental Funds Statement 3 28 o Reconciliation of the Governmental Fund Balance Sheet and the Government-wide Statement of Net
Position Statement 4 31
o Statement of Revenues, Expenditures and Changes in Fund Balances – Governmental Funds Statement 5 32 o Reconciliation of the Statement of Revenues, Expenditures and Changes in Fund Balances of
Governmental Funds to the Statement of Activities Statement 6 35
o Statement of Net Position – Proprietary Funds Statement 7 36 o Statement of Revenues, Expenses and Changes in Fund Net Position – Proprietary Funds Statement 8 39 o Statement of Cash Flows – Proprietary Funds Statement 9 40 o Statement of Fiduciary Net Position – Agency Funds Statement 10 43 o Statement of Net Position – All Discretely Presented Component Units Statement 11 44 o Statement of Activities – All Discretely Presented Component Units Statement 12 46
• Notes to the Financial Statements
47
Required Supplementary Information • Schedule of Revenues, Expenditures and Changes in Fund Balance – Budget and Actual – General Fund Schedule 1 137 • Combining Schedule of Revenues, Expenditures and Changes in Fund Balances – Budget and Actual –
Annually Budgeted Major Special Revenue Funds Schedule 2 139
• Schedule of Funding Progress – Other Postemployment Benefits Plan Schedule 3 142 • Schedule of Employer Contributions – Other Postemployment Benefits Plan Schedule 4 143 • Notes to Required Supplementary Information 144
ii
City of Saint Paul, Minnesota TABLE OF CONTENTS For the Fiscal Year Ended December 31, 2014 (Continued) FINANCIAL SECTION (continued) Page Supplementary Information • Combining Balance Sheet – Nonmajor Governmental Funds Statement 13 147 • Combining Statement of Revenues, Expenditures and Changes in Fund Balances – Nonmajor
Governmental Funds Statement 14 149
o Combining Balance Sheet – Nonmajor Special Revenue Funds Statement 15 150 o Combining Statement of Revenues, Expenditures and Changes in Fund Balances – Nonmajor Special
Revenue Funds Statement 16 154
o Combining Schedule of Revenues, Expenditures and Changes in Fund Balances – Budget and Actual – Annually Budgeted Nonmajor Special Revenue Funds
Statement 17 158
o Combining Balance Sheet – Nonmajor Capital Projects Funds Statement 18 163 o Combining Statement of Revenues, Expenditures and Changes in Fund Balances – Nonmajor Capital
Projects Funds Statement 19 164
o Combining Balance Sheet – Nonmajor Permanent Fund Statement 20 165 o Combining Statement of Revenues, Expenditures and Changes in Fund Balances – Nonmajor
Permanent Fund Statement 21 166
o Combining Schedule of Revenues, Expenditures and Changes in Fund Balances – Budget and Actual – Annually Budgeted Nonmajor Permanent Fund
Statement 22 167
• Combining Statement of Net Position – Nonmajor Enterprise Funds Statement 23 171 • Combining Statement of Revenues, Expenses and Changes in Fund Net Position – Nonmajor Enterprise
Funds Statement 24 173
• Combining Statement of Cash Flows – Nonmajor Enterprise Funds Statement 25 174 • Combining Statement of Net Position – Internal Service Funds Statement 26 178 • Combining Statement of Revenues, Expenses and Changes in Fund Net Position – Internal Service
Funds Statement 27 180
• Combining Statement of Cash Flows – Internal Service Funds Statement 28 182 • Combining Statement of Fiduciary Net Position – All Agency Funds Statement 29 189 • Statement of Changes in Assets and Liabilities – All Agency Funds Statement 30 190 Other Supplementary Information • Schedule of Intergovernmental Revenue – All Funds Schedule 5 194 • Schedule of Expenditures of Federal Awards – All Fund Types Schedule 6 198 • Notes to the Schedule of Expenditures of Federal Awards 201
iii
City of Saint Paul, Minnesota TABLE OF CONTENTS For the Fiscal Year Ended December 31, 2014 (Continued) STATISTICAL SECTION Page Financial Trends • Net Position by Component – Last Ten Fiscal Years Table 1 205 • Changes in Net Position – Last Ten Fiscal Years Table 2 205 • Program Revenues by Function/Program – Last Ten Fiscal Years Table 3 211 • Fund Balances, Governmental Funds – Last Ten Fiscal Years Table 4 213 • Changes in Fund Balances, Governmental Funds – Last Ten Fiscal Years Table 5 214 Revenue Capacity
• Governmental Funds Tax Revenues by Source – Last Ten Fiscal Years Table 6 216 • Estimated Market Value, Taxable Market Value, and Net Tax Capacity of Taxable Property – Last Ten
Fiscal Years Table 7 217
• Property Tax Rates and Tax Levies – Direct and Overlapping Governments – Last Ten Fiscal Years Table 8 218 • Principal Property Taxpayers – Current Year and Nine Years Ago Table 9 219 • Property Tax Levies and Collections – City and Library Agency – Last Ten Fiscal Years Table 10 220 • Property Tax Levies and Collections – Housing and Redevelopment Authority of the City of Saint Paul –
Last Ten Fiscal Years Table 11
221
Debt Capacity
• Ratios of Outstanding Debt by Type Per Capita – Last Ten Fiscal Years Table 12 222 • Ratios of Net General Bonded Debt Outstanding – Last Ten Fiscal Years Table 13 223 • Direct, Overlapping and Underlying Governmental Activities Debt Table 14 224 • Legal Debt Margin Information – Last Ten Fiscal Years Table 15 225 • Pledged-Revenue Bond Coverage – Last Ten Fiscal Years Table 16 226 Demographic and Economic Information
• Demographic and Economic Statistics – Last Ten Fiscal Years Table 17 237 • Principal Employers – Current Year and Six Years Ago Table 18 238 Operating Information
• Full-Time-Equivalent City Government Employees by Function/Program – Last Ten Fiscal Years Table 19
239
• Operating Indicators by Function/Program – Last Ten Fiscal Years Table 20 240 • Capital Asset Statistics by Function/Program – Last Ten Fiscal Years Table 21 241
iv

Office of the Mayor Office of Financial Services Todd Hurley, Director City of Saint Paul 700 City Hall Telephone: (651) 266-8800 Mayor Christopher B. Coleman 15 West Kellogg Boulevard Facsimile: (651) 266-8541 Saint Paul, Minnesota 55102-1658
November 30, 2015
To the Honorable Mayor, Members of the City Council, and Residents of Saint Paul: The City of Saint Paul’s Comprehensive Annual Financial Report (CAFR) for the fiscal year ended December 31, 2014 is hereby submitted. The purpose of this report is to provide the Mayor, City Council, City Staff, residents, bondholders and other interested parties with useful information concerning the City’s operations and financial position. Responsibility for both the accuracy of data and the completeness and fairness of the presentation, including all disclosures, rests with the City. The CAFR is presented in three main sections:
1. Introductory Section - includes this transmittal letter, the City’s organizational chart and a list of principal
officials. 2. Financial Section - includes the independent auditor’s report, Management’s Discussion and Analysis (MD&A),
the basic financial statements, notes to the financial statements and supplementary information. 3. Statistical Section - contains selected financial and demographic information presented on a multi-year basis.
Generally Accepted Accounting Principles (GAAP) requires that the City provide a narrative introduction, overview and analysis to accompany the basic financial statements in the form of Management’s Discussion and Analysis (MD&A). This letter of transmittal is designed to complement the MD&A and should be read in conjunction with it. The City of Saint Paul’s MD&A can be found immediately following the report of the independent auditors. INTERNAL CONTROL To provide a reasonable basis for making these representations, the City of Saint Paul has established a comprehensive internal control framework that is designed to protect the government’s assets from loss, theft or misuse and to compile sufficient reliable information for the preparation of the City of Saint Paul’s financial statements in conformity with Generally Accepted Accounting Principles. Because the cost of internal controls should not outweigh their benefits, the City of Saint Paul’s comprehensive framework of internal controls has been designed to provide a reasonable, rather than absolute, assurance that the financial statements will be free from material misstatement. All internal control evaluations occur within this framework. To the best of our knowledge and belief, this financial report is complete and reliable in all material respects.
v An Affirmative Action Equal Opportunity Employer

INDEPENDENT AUDIT State law requires the State Auditor to perform an annual audit of the City and other cities of the first class in Minnesota. The goal of the independent audit is to provide reasonable assurance that the financial statements of the City of Saint Paul for the fiscal year ended December 31, 2014 are free of material misstatement. The independent audit involved examining, on a test basis, evidence supporting the amounts and disclosures in the financial statements, assessing the accounting principles used and significant estimates made by the City, and evaluating the overall financial statement presentation. The independent auditor concluded, based upon the audit, that there was a reasonable basis for rendering an unmodified opinion that the City of Saint Paul’s financial statements for the fiscal year ended December 31, 2014, are fairly presented in conformity with GAAP. The State Auditor’s report is presented as the first component of the financial section of this report. As part of their examination, the State Auditor is also issuing a Management and Compliance Report covering the review of the City’s system of internal control over financial reporting and tests of compliance with certain provisions of laws, regulations, contracts, grant agreements and other matters. The Management and Compliance Report will not modify or affect, in any way, this report. The City is required to undergo an annual single audit in conformity with the provisions of the Single Audit Act Amendments of 1996 and U.S. Office of Management and Budget Circular A-133, Audits of States, Local Governments, and Non-Profit Organizations. Information related to this single audit - including the schedule of expenditures of federal awards, findings and recommendations, and auditor’s reports on internal control over financial reporting and tests of compliance with certain provisions of laws, regulations, contracts and grants - will be included in the State Auditor’s separately issued Management and Compliance Report. PROFILE OF THE GOVERNMENT The City of Saint Paul has been a municipal corporation since 1854. Saint Paul is the state capital and Minnesota’s second largest city. The City covers an area of 56 square miles and is situated wholly in Ramsey County. Saint Paul’s population, per the 2010 US Census, was 285,068. Data estimates by the Metropolitan Council indicate that the City had a population of 299,641 people and 115,304 households as of the end of 2014. The City of Saint Paul, Minnesota has a Mayor-Council form of government. The Mayor is elected by the voters of the City at large for four years on a full-time basis. The City is divided into seven wards. Voters of each ward elect a member of the City Council for four years on a part-time basis. Executive power is vested in the Mayor; legislative power is vested in the Council. The Mayor has veto power, which the Council may override with a vote of five members. City services include: police, fire, street, sewer and bridge maintenance, parks and recreation centers, libraries, licensing, building and housing code inspections, planning and economic development, zoning, public improvements and general administration. REPORTING ENTITY The City’s financial statements include all funds of the City (primary government) and its component units. The primary government represents all funds under the ultimate control of the Mayor and City Council. The Library Agency and Housing and Redevelopment Authority (HRA) are legally separate; however they both function in essence as a department of the City of Saint Paul and, therefore, have been included as an integral part of the City of Saint Paul’s financial statements. The City of Saint Paul is also financially accountable for the legally separate Saint Paul RiverCentre Convention & Visitors Authority, Saint Paul Regional Water Services and the Port Authority of the City of Saint Paul, all of which are reported separately as component units within the City of Saint Paul’s financial statements. The nature of the activities of these organizations and the specific justification and methods for inclusion as component units of the City are discussed in the notes to the financial statements. BUDGET CONTROL The annual budget serves as a foundation for the City of Saint Paul’s financial planning and control. In August of each year, the Mayor presents the budget to the City Council for the following calendar year. The budget includes proposed
vi An Affirmative Action Equal Opportunity Employer
expenditures and means of financing them. The Council then holds a public hearing to obtain taxpayer comments. The budget is legally adopted through the passage of a Council resolution. City budget amendments that authorize an increase in total fund spending require approval of the City Council. In addition, City Council approval is required for budget amendments transferring appropriations between departments within the General Fund. Budget-to-actual comparisons are provided in this report for each individual governmental fund for which an appropriated annual budget has been adopted. For the General Fund, Assessment Financing Fund, Public Library General Fund, and the HRA General Fund, this is presented as part of the required supplementary comparison information. For other governmental funds with appropriated annual budgets, this comparison is presented in the governmental fund subsection of this report. FINANCIAL POLICIES In 2005, the City enacted a fund balance policy mandating minimum thresholds for the General Fund and the General Debt Service Fund. The policy for the General Fund requires a minimum unassigned fund balance of 15% of combined General Fund and Public Library General Fund operating spending. For additional information regarding the 2014 fund balance for the General Fund, see the Management’s Discussion and Analysis (MD&A) as listed in the table of contents. ECONOMIC OUTLOOK Saint Paul is an important part of the overall strong Twin Cities metro area economy. Saint Paul is expected to add more than 45,000 jobs by 2030 (26% growth). Total employee count in Saint Paul is currently estimated to be 177,010, an increase of almost 2,000 jobs in one year.1
• Saint Paul annual unemployment rate in 2014 fell 1% to 4.1% annually.2 • Saint Paul median household income rose slightly to $47,010 in 2013.3 • The median value of owner-occupied houses in Saint Paul in 2013 was $178,700.4 • Saint Paul’s population with a bachelor’s degree in 2013 stood at a strong 38.3%.5
Saint Paul’s unemployment rate continues to improve steadily. The unemployment rate of 4.5% for the second quarter of 2014 came in lower than compared with 5.4% one year prior. Over the years, Saint Paul has consistently registered an unemployment rate equal to or lower than that of the U.S. as a whole. The City’s unemployment rate for 2014 was just above the Minnesota rate but significantly below the U.S. rate of 6.1%.6 Employment in Saint Paul is not overly reliant on slowing and cyclical sectors, like manufacturing, but rather is based on stable and growing industries such as education, health services and public administration. Saint Paul’s largest employment sector is Health Care and Social Assistance, with a 7.1% growth from 2010 to 2014. Other large super sectors include Public Administration (22,888 jobs; 2.9% growth from 2010 to 2014), and Educational Services (18,022 jobs; 6.0% growth from 2010 to 2014).7 MAJOR INITIATIVES To maintain this economic growth, the City will continue to develop and implement strategic plans to encourage private investment in housing and economic development projects in Saint Paul.
1 Minnesota Department of Employment and Economic Development’s Quarterly Census Employment and Wages (QCEW) tool, available at http://www.positivelyminnesota.com/apps/lmi/qcew/AreaSel.aspx 2 Bureau of Labor Statistics, Local Area Unemployment Statistics. Available at: http://data.bls.gov/cgi-bin/dsrv?la 3 2013 American Community Survey, through the American Fact Finder, available at: http://www.census.gov 4 2013 American Community Survey, through the American Fact Finder, available at: http://www.census.gov 5 2013 American Community Survey, through the American Fact Finder, available at: http://www.census.gov 6 Minnesota Department of Employment and Economic Development, available at: http://mn.gov/deed/data/data-tools/laus/ 7 Minnesota Department of Employment and Economic Development’s Quarterly Census of Employment and Wages (QCEW) tool, available at https://apps.deed.state.mn.us/lmi/qcew/AreaSel.aspx
vii An Affirmative Action Equal Opportunity Employer

City Strategic Plan A strategic vision for the City was developed by the Mayor’s administration in consultation with other stakeholders. To support a vision of Saint Paul as the most livable city in America, it identifies 4 strategic goals: Ready for School, Ready for Life: Education is core to the quality of life in our great City. Saint Paul will strive to eliminate the achievement gap by ensuring that learning opportunities are accessible for all and are quality-driven. We will achieve this goal by expanding early childhood learning opportunities and setting children on a course for success in school: extending learning opportunities outside of the classroom and connecting formal and informal opportunities throughout the community: and open doorways to higher education by better informing and preparing students for post-secondary educational opportunities. Safe Streets and Safe Homes: Families will feel secure on our sidewalks and in our homes as a result of our strong sense of community and confidence in our world-class public safety system. We will do this by engaging youth with quality recreational, educational, and youth organizing activities; address areas of disinvestment with revitalization; create strong community partnerships; build a world-class Police Department; invest in a 21st Century Fire Department; and elevate emergency management to leverage resources and knowledge that will prepare the City to respond to multi-faceted crises. Expanding Economic Opportunity: We will build our economic future on the foundation of the City’s strengths – a well-educated and creative workforce, sound infrastructure, and local businesses rich with growth potential. Strategies include creating the East Metro’s first light rail line and leverage $1 billion in development; restoring the Union Depot to be a vital regional transportation hub supporting high-speed rail to Chicago; through Invest Saint Paul, stimulating growth by making strategic investments in neighborhoods of greatest disinvestment while coordinating and enhancing other services to these communities; aggressively pursuing the first major developments in downtown in a decade; and leveraging resources and markets for sustainable, environmentally friendly products to build a new manufacturing economy with living-wage jobs.
Quality Way of Life: Saint Paul will set high standards for healthy urban living through civic leadership, quality assets, sound environmental stewardship, and a welcoming, diverse population. We will improve, expand, and maintain our parks, libraries, and facilities that benefit the neighborhoods they serve; implement a public art policy to integrate into our public and private infrastructure; focus development on a more natural, urban, and connected city through an expanded system of parks, green spaces, bikeways, and trails; and make downtown a music, culture, and creative arts capital that amplifies the City’s creative and ethnic voices that bring identity to Saint Paul.
MAJOR DEVELOPMENTS I. Downtown Saint Paul Custom House Kellogg Boulevard is undergoing a $125 million renovation. The Exeter Group, which bought the building in 2013, has plans for 250 units of market-rating housing, a Hyatt Place Hotel and a destination restaurant. Funding includes $5.8 million in tax increment financing, $725,000 from the Minnesota Department of Employment and Economic Development and $850,000 for environmental abatement from the Metropolitan Council. The Ordway At 345 Washington Street, the Ordway Center for the Performing Arts has replaced the 306-seat McKnight Theatre with a $42 million, 1,100-seat concert hall, which opened in March. Funding included $20 million in state bonds and a 10-year, $3 million Cultural STAR grant backed by the City's half-cent sales tax. CHS Field Saint Paul's 7,000-seat regional ballpark has already hosted games for its second major tenant, the Hamline Pipers. The St. Paul Saints play an exhibition game May 18, followed by opening day May 21. At 360 N. Broadway Street, the city-owned ballpark was funded with $13.3 million in private contributions and $51.4 million in public money and will be maintained by the Saints. Stadium Ramp Restaurants Jim Crockarell now owns the Stadium Ramp overlooking CHS Field at 255 E. Sixth Street. Plans include a 10,000-square-foot rooftop bar and grill, as well as a restaurant occupying 6,000 square feet on the ground level. The ground floor
viii An Affirmative Action Equal Opportunity Employer

restaurant opened in July 2015. Rayette Lofts Sherman and Associates opened an 88-unit market-rate apartment building and retail space in the renovated, historic Rayette Building last October. The $23 million project was funded by historic tax credits, the Metropolitan Council and private equity financing. St. Dinette, an upscale eatery from the proprietors of the Strip Club restaurant, also opened recently in the building. Lafayette Bridge, Cayuga, Kellogg After four long years, the end is in sight for the Lafayette Bridge project. The $125 million bridge replacement created two new U.S. 52 bridges over the Mississippi River, in addition to improvements to nearby roads. Work began in the fall of 2011 and wraps up in October. Sibley Square/Lofts on the Park Across Fourth Street from the Saint Paul Union Depot, Timberland Partners will convert a historic office building at 333 N. Sibley Street into "333 on the Park" -- 136 market-rate apartments with enclosed parking. The City had also applied to the Met Council for environmental cleanup grants. Total development cost: $40 million. Ramsey County West Building Hoping to entice developers to the Kellogg Boulevard river bluffs, the Ramsey County Board of Commissioners approved $11.5 million to demolish the vacant adult detention center and former West Publishing buildings, which span Wabasha to Market streets. Demolition is expected to continue through spring 2016. West Side Flats South of the Wabasha Street bridge and Raspberry Island, Sherman Associates opened the West Side Flats at 84 South Wabasha Street last summer. The $35.4 million complex has 178 apartments, with a mixture of market-rate and affordable units, and is 93 percent occupied. Funding included a $23.5 million private loan insured by the U.S. Department of Housing and Urban Development, alongside grants and loans from the City and other local sources. The developer is planning a two-building expansion, which would include 264 units, 5,000 square feet of commercial space and a patio facing the Mississippi River. The expansion would be completed in 2017. Lowry Hotel Building owner Jim Crockarell has been renovating the old Lowry Hotel building at 345 Wabasha Street N. since December 2012. The $16 million facelift has created a new home for the Ramsey County Attorney’s Office, 155 market-rate apartments and two floors of extended-stay hotel rooms. Crockarell hopes to add a ground-level restaurant and basement music venue, as well as rooftop dining. Twin Cities Public Television Twin Cities Public Television is undergoing an $18.4 million renovation and expansion of its 172 E. Fourth Street offices and studios. By summers end, it will add space for public screenings, art exhibits, concerts and lectures, as well as a street-level presence. Funding includes $9 million in state bonding and $85,000 from Saint Paul's Cultural STAR program. Pioneer Endicott Dating to the 1880s, the Pioneer-Endicott buildings at 141 E. Fourth Street have been fully converted from offices into 234 market-rate apartments, which are 95 percent leased. The three buildings, which got a $40 million restoration, are also home to the Minnesota Museum of American Art, Revival Spirits and Legacy Chocolates. Central Station A $1.77 million vertical elevator and stairway connection from the skyway to the sidewalk adjacent to the Green Line's Central Station platform opened at Fifth and Cedar streets in 2014. The city has identified the vacant land immediately to the east as a redevelopment opportunity, and is working with the Met Council on details. Former Macy’s The Saint Paul Port Authority acquired the block-long Macy's Department Store building at 411 Cedar Street for $3 million last year. Developers balked at the prospect of paying $13 million to demolish the building and start over. A retail developer bought 10 percent of the leasable space for $2.5 million. Kellogg Square Bigos Management purchased the 32-story, 450-apartment building at 111 E. Kellogg Boulevard for $51 million in 2012. In addition to a remodeled lobby, a new fitness center and a skyway cafe, renovation of 300 apartments will be complete by the end of the year.
ix An Affirmative Action Equal Opportunity Employer

Galtier Towers Bigos Management is wrapping up a $6 million remodel this year of 366 apartments and common spaces in the Galtier Towers, 172 E. Sixth Street in Lowertown, including new fitness and business workspace centers. Crowne Plaza Mille Lacs Corporate Ventures has almost completed renovation of the Crowne Plaza St. Paul Riverfront hotel at 11 Kellogg Boulevard, which will soon be known as the InterContinental. Renovations include a redone lobby, meeting spaces and hotel rooms in the east tower. Work is underway on the west tower, where rooms will get new furniture, fixtures and bathroom expansions. Park Square Theatre Located in the Historic Hamm Building at 408 St. Peter Street, the Park Square Theatre opened the Andy Boss Thrust Stage in October 2014. The 200-seat, lower-level theater has hosted four theater companies and doubled Park Square's usual roster of performances. The $3.6 million project received a $180,000 STAR grant from the city. Palace Theatre The $14 million transformation of the Palace Theatre into a concert venue is currently underway. On West Seventh Place, the 3,000-seat hall has been closed since 1977. The city will devote $5 million from the 2014 state bonding bill, $1 million from operating partners and an $8 million city loan from the Mayor's 8-80 Vitality Fund. Opening is scheduled for fall 2016. Children’s Museum Expansion/Renovation The Minnesota Children's Museum plans to begin work this October on a $28 million expansion and renovation at 10 West Seventh Street. The museum received $14 million from the state, $1 million from the City's Cultural STAR program, and more than $9 million in private contributions. The project will improve visitor amenities, increase gallery space and remake existing exhibits, with a focus on open-ended play. 7 Corners Hardware Opus Development Co. recently purchased the iconic 7 Corners Hardware store at 216 W. Seventh Street and an adjacent church with plans to redevelop the block into 191 market-rate housing units next to a five-story hotel. The residential building will include about 11,000 square feet of retail space on the first floor. Minnesota Department of Employment and Economic Development plans to provide a $200,000 cleanup grant. Construction has begun, and the project could be done by the end of 2016. Seven Corners Gateway Across the street from the Xcel Energy Center, the Opus Group and Greco Property Management received tentative developer status last October to turn a city-owned parking lot at West Fifth Street and North Smith Avenue into a gateway project. Early renderings propose two towers of hotel and residential units, retailers and a public plaza. Opus has announced that a Radisson RED hotel concept is planned for the site. Full site plan reviews and environmental and market studies are expected to be complete by April 30, 2016. Lunds and Penfield A Lunds grocery featuring Caribou Coffee, Big Bowl and other tenants opened next to the City's six-story, 254-unit Penfield apartment building at 101 E. 10th Street in May 2014. Developed by the City for $62 million, the market-rate Penfield is 94 percent leased. United Hospital/Children’s United Hospital, Allina Health and Children's Hospitals and Clinics of Minnesota began work in March on a birthing center at 345 N. Smith Avenue. The $32.5 million Mother Baby Center will be the third birth center in the metro area. The first phase will remodel Children's existing neonatal intensive-care unit and build out 30,000 square feet of new space this year, including a new entrance, a family waiting area, triage, labor, operating and post-op rooms. Children’s Hospital Children's Hospital opened a new Ronald McDonald room in July to serve families with kids in intensive care. The $2 million project at 345 N. Smith Avenue includes four family sleep suites, a full kitchen, entertainment space, a laundry and a fitness room. Regions Hospital The hospital is in the midst of renovating 61,000 square feet, at an estimated cost of $28.8 million. A $9 million pathology testing lab opened in January 2015. From June through September 2015, the hospital will open a $6.5 million hybrid
x An Affirmative Action Equal Opportunity Employer

operating and cardiology/radiology imaging room, a $2.9 million employee fitness center and wellness clinic, and a $5.4 million remodel of the 20-bed observation center. About $3.8 million in improvements to the intensive-care unit and cardiovascular, interventional imaging and radiation therapy rooms are underway. A physical therapy rehab clinic opened April 1, 2015 at 1710 Suburban Avenue. State Capitol/Minnesota Senate Building The Capitol is undergoing a $272 million facelift that will continue into January 2017. Work is also underway on a $76.1 million Senate office building and $13.5 million, 265-stall parking ramp. A $16.8 million, four-level, 532-stall parking ramp next to the Minnesota Transportation Building opened in December. II. Along the Green Line Green Line The Metro Transit $957 million Green Line is the Minnesota’s second light-rail corridor. Linking downtown Saint Paul and Minneapolis, the Green Line made its debut June 14 and quickly surpassed ridership expectations. Dorothy Day Catholic Charities plans a $100 million, two-phase reconstruction of its overcrowded Dorothy Day Center. For starters, the ReVision plan calls for converting the Labor and Professional Centre at 411 Main Street into a five-level building offering 278 shelter and pay-for-stay beds, as well as 193 units of permanent housing. Sears Since at least January 2013, Sears has been working with a broker to market its location at 425 Rice Street for redevelopment. Sears would remain the anchor tenant, but early concept plans for Capitol View called for more than 100 apartments, 18 townhomes, and multiple stories of office and retail. Redevelopment of site still under discussion after Chicago-based Seritage Growth Properties paid $5.15 million for the Rice Street property in July 2015. Western U Plaza The historic Old Home Dairy building at 370 W. University Avenue is being converted into 68 units of rental housing, including eight market-rate units. Some 6,600 square feet of commercial space will be added at 470 Western Avenue. The $20 million project was supported by state and federal historic tax credits, a $250,000 federal HOME loan, and a wide range of additional grants. Construction is expected to wrap up in late fall. Central Exchange, Brownstone Model Cities is working with the city on financing two construction projects along University Avenue, comprising 60 to 70 units of affordable housing, as well as retail. Central Exchange would be a three-story development at 773-785 W. University Avenue, and Brownstone would be a four-floor mixed-use building at 839 W. University. Brownstone includes a reading room emphasizing the history of the Pullman railroad workers. Saxon-Ford City staff are working with the Local Initiatives Support Coalition to market the site of the former Saxon-Ford dealership financing center at 253-255 W. University Avenue in Frogtown. Preliminary ideas include retail on the avenue with assisted living in back. A recent Request For Information on the development opportunity closed to submissions in early July 2015. Little Mekong Plaza The Saint Paul City Council approved $300,000 from the Mayor's 8-80 Vitality Initiative to demolish a vacant meat shop at 402 W. University Avenue and create a temporary, publicly owned plaza next to the Mai Village restaurant. Long-term plans call for a $1 million to $3 million renovation into a permanent outdoor market and gathering space. Lexington Library Saint Paul's Housing and Redevelopment Authority bought the vacant Lexington Library at 1080 W. University Avenue in 2014. Goodwill In February, Goodwill Industries opened its largest store in the metro area at 1239 W. University Avenue, by Griggs Street. The $10 million, two-level Goodwill spans 30,000 feet of retail, donation and office space and replaces a long-vacant Whitaker Buick dealership. Hamline Station Project for Pride in Living Inc. is well into redevelopment of the former Midway Chevrolet used-car lot at 1333 W.
xi An Affirmative Action Equal Opportunity Employer
University Avenue into a $28 million, two-building, block-long affordable-housing development with 108 apartments. The west building will include 13,000 square feet of commercial space. It is supported by roughly $11 million in public grants and loans. Bus Barn “SmartSite” The Met Council will issue a request for proposals this year for the sale of its former bus barn property, a 10-acre parcel at the northeast corner of Interstate 94 and Snelling Avenue. The site remains ripe for development and is uniquely positioned for Transit Oriented Development as it is located on the Green Line between both major downtowns. YMCA Demolition and groundbreaking began in April for the new St. Paul Midway YMCA. The $16.4 million redesign includes an aquatics center, a rooftop patio, a demonstration kitchen, a play maze and multiple fitness studios at 1761 W. University Avenue. Episcopal Homes Episcopal Homes hosted a grand opening on May 20 for a 168-unit building that combines three types of market-rate and affordable senior residences. The $45 million project is at 1860-1890 W. University Avenue, in the general location of what had been a Porky's Drive-In. The City helped secure $500,000 in federal HOME funds and $2 million in transit-oriented development funds from the Met Council. Prior Crossing Beacon Interfaith Housing Collaborative recently secured financing to build an $11 million, 44-unit housing development for homeless youth at 1949 W. University Avenue. Site demolition is done, and the City's Housing and Redevelopment Authority has committed $1.1 million. Silgan Can Orton Development has put at least $2 million into renovating the 8.78-acre Silgan Can factory at 755 Prior Avenue. About 10 commercial tenants have moved in, including Black Stack Brewery. Can Can Wonderland plans a mini-golf-themed entertainment center next to an interior rail spur. Pirtek Aeon, a developer of affordable housing, bought two half-vacant commercial buildings at 2147 and 2161 W. University Avenue this year with the intention of demolishing them and building residential units by Vandalia Street. The project would span four or five levels and about 100 to 140 apartments with a possible retail aspect. Vandalia Tower Beer and films are taking over a mattress factory. First and First LLC is spending $10 million to remodel eight buildings within the former King Koil factory at 550-558 Vandalia Street. Signature tenants include Lake Monster Brewing, which plans to open a taproom later this year, and the Independent Filmmaker Project, a media arts center offering classrooms and screening space. 2700 University Indianapolis-based Flaherty and Collins plans a five-level, 248-unit housing complex at 2700 W. University Avenue. The $54.7 million building includes 3,000 square feet of retail, and 20 percent of the units will be affordable housing. The City's Housing and Redevelopment Authority approved tax increment financing and HOME funds for the project in the fall. The Met Council is providing a $1.95 million transit-oriented development grant. The project broke ground in June 2015. Taprooms and Microbreweries At least a dozen taprooms and microbreweries have opened in Saint Paul, many of them near Metro Transit's Green Line corridor. Urban Growler at 2325 Endicott Street, the first microbrewery owned by a woman in Minnesota, plans to expand its kitchen. The latest arrivals include Sidhe Brewing at 990 Payne Avenue and Bad Weather Brewing at 414 W. Seventh Street, which opened on October 9, 2015. III. Neighborhoods Neuroscience Center HealthPartners plans a $75 million, four-story, 128,000-square-foot neuroscience center at 295 Phalen Boulevard. The project includes a 640-space parking ramp. Construction began this summer and wraps up in 2017. Phalen Village
xii An Affirmative Action Equal Opportunity Employer

The North East Neighborhoods Development Corp. hopes to bring a mix of housing and retail to the former site of the failed Phalen Village Shopping Center, west of the 1300 block of Phalen Boulevard. Executive Director Chuck Repke envisions 60 housing units and 25,000 square feet of retail development. Ames Lake “New Rose” Development Real Estate Equities recently acquired four dilapidated buildings housing 48 apartments, which it will rehab as part of the fifth phase of the Ames Lake development at 1144 Barclay Street, financed by $2.8 million in Community Development Block Grant loan assistance. Hamm’s Brewery The Hamm's Brewery is once again producing beer at 700 Minnehaha Avenue. Flat Earth Brewery, which began brewing on-site in March 2014, is tentatively poised to open a beer garden this fall. Next door, the 11 Wells Distillery opened a tasting room in late summer. Urban Organics has been operating an aquaponics fish-and-produce farm, and another urban grower Frank Hamel is eyeing Building No. 18. Willow Reserve Habitat for Humanity will build a dozen three- and four-bedroom homes on a three-acre lot in the North End previously owned by the Housing and Redevelopment Authority. Bordering wetlands, the Willow Reserve project at 389 and 425 Maryland Avenue is projected to break ground in spring 2016. Pipefitters Training Facility Steamfitters Pipefitters Local 455 will spend $8 million to add a story to an old contractor shop at 1301 L'Orient Avenue and convert it into a 65,000-square-foot headquarters and training facility, with space for their credit union. 234-238 Bates Euclid View Flats, a three-story apartment building at 234-238 Bates Avenue that dates to 1895, was listed in the National Register of Historic Places in February 2014. The troubled 12-unit site was acquired by the City and sold to the Sand Cos., which plans a $2.2 million renovation supported by state and federal historic tax credits. Mississippi Market and the Cambric Apartments The Mississippi Market co-op plans a September opening for its third store -- a $10 million, two-level building at 740 E. Seventh Street. Next door, Dominium plans to build the $27 million Cambric -- 113 units of affordable rental housing for seniors. Metro State Metropolitan State University is remaking its Dayton's Bluff campus with a $20 million, 760-stall parking ramp at 400 Maria Avenue, a $12 million student center off East Seventh Street, and a $39 million, three-story science center at Sixth Street and Mounds Boulevard. The ramp and student center will open this year. Schmidt Brewery The Jacob Schmidt Brewery’s renovated Bottlehouse and Brewhouse buildings are now the Schmidt Artist Lofts, thanks to a $130 million historic renovation led by Plymouth-based Dominium and a host of public funding partners. Urban Organics, a local produce supplier, has a purchase agreement to move into land owned by investor Bruce Hendry. Craig Cohen has received two grants from the Met Council for environmental cleanup of the Schmidt Keg House, which he envisions turning into an open-air marketplace anchored by a restaurant. Hazelden The Hazelden Betty Ford Foundation is devoting $25 million to doubling treatment capacity at its 680 Stewart Avenue. campus. The first phase, a 55,000-square-foot building for its existing chemical-health programs, is scheduled to open in October. Phase two, which includes renovations of the mansion, the outpatient mental health clinic, the upper parking lot and landscaping, could wrap up by April 2016. Victoria Park Apartments At 740 S. Victoria Street, Chase Real Estate completed the $30 million, three-story, 215-unit Victoria Park apartments last fall. Construction of phase two, also $30 million, begins soon and will entail 197 market-rate units in a five-story apartment building at the edge of the future Victoria Park off Shepard Road and Otto Avenue. Sibley Plaza Paster Enterprises plans a $50 million top-to-bottom remodel of its Sibley Plaza strip mall at 2481 Seventh Street W., adding 120 apartments over retail. Construction could start this year or next.
xiii An Affirmative Action Equal Opportunity Employer

Shepard Davern The Johnson Bros. had envisioned a luxury apartment or mixed-use buildings in the vicinity of 2751 Shepard Road/1475 Davern Street overlooking the river. The U.S. Bank Building has been demolished to make room. The requested height variance has been denied, and the Johnson Brothers are now reevaluating their development choice. The Waters of Highland Park Minnetonka-based Waters Senior Living started construction in October of a four-story, 84-unit senior living apartment building at 678 S. Snelling Avenue. The City's Housing and Redevelopment Authority issued $21.9 million in tax-exempt conduit revenue bonds. Construction could be complete by September 2015. Highland Village Between Highland Parkway and Pinehurst Avenue, TJL Development has proposed converting an Edina Realty office at 735 Cleveland Avenue into a four-story building featuring 53 apartments over 19,000 square feet of commercial space. Ford Site Eager to see Ford's nearly 150-acre Highland Park campus redeveloped into a model of environmental sustainability, Saint Paul Mayor Chris Coleman toured European redevelopment sites for ideas this year. The City has organized task forces geared to alternative energy, zoning, jobs and biking, transit and pedestrian infrastructure at the former Ford plant. Community input meetings and informational sessions are ongoing. Marketing to attract a master developer is likely to start in early 2016. The Vintage on Selby Call it a $65 million reinvention of Selby Avenue at Snelling. Associated Bank relocated from 1573 Selby Avenue and opened a location next door last summer, making room for the Ryan Cos. to build The Vintage on Selby -- 208 market-rate apartments and a 39,000-square-foot Whole Foods Market. Grand and Finn Developer Graham Merry and Cullen LLC completed a five-story, $3 million apartment building two years ago and now plan another. The proposed West Grand Avenue apartments at 2138 Grand Avenue would replace two homes and a duplex with a four-story, 14-unit apartment building near the University of Saint Thomas. The building would span 48 bedrooms and include nine parking spaces within the main structure and another 19 in a two-level garage off the alley that would feature the City's first car lift. Libraries The Saint Paul Public Library system has nearly completed $14.8 million in renovations outlined in its 2011 capital needs assessment, including top-to-bottom remodels of the Sun Ray and Highland branch libraries. Next up is a $1 million reorganization of the George Latimer Central Library at 90 W. Fourth Street. Village at Rivoli Bluffs Dayton's Bluff Neighborhood Housing Services will break ground this summer on the first seven of 35 detached, single-family homes off Minnehaha Avenue and Rivoli Street in the Railroad Island area. CASH AND INVESTMENT MANAGEMENT Cash balances during the year were invested in U.S. Treasuries, Agencies of the Federal Government, certificates of deposit, municipal securities, money market funds, savings deposit accounts and guaranteed investment contracts, in accordance with Minnesota State Statute 118A and the City’s Investment Policy. An investment policy was adopted by the City Council in July 2003 to improve management of the City’s investment portfolio. The investment policy’s goal is to preserve safety by minimizing credit and market risks, while ensuring liquidity and maintaining a competitive yield on the portfolio. A portion of City’s investment portfolio is managed by four external managers. As of December 31, 2014, the reported interest on investments was $5.2 million. All securities purchased by the City are held by a third party safekeeping agent in the City’s name, or in the City’s safe. DEBT MANAGEMENT The City of Saint Paul partners with Ramsey County and Independent School District #625 (Saint Paul Public Schools) as members of the Joint Property Tax Advisory Committee (JPTAC). The JPTAC, created by Minnesota law, is charged with the obligation to reduce the overall tax burden on the citizens of Saint Paul. The Joint Debt Advisory Committee (JDAC), a subcommittee of JPTAC, is charged with overseeing and reporting to the public on joint debt activities. This group evaluates compliance by the jurisdictions within the adopted target ranges for satisfactory debt management and releases its findings in the Joint Debt Book, which is usually published every two years.
xiv An Affirmative Action Equal Opportunity Employer

The most recent report was published in September of 2013. All goals and objectives of the Joint Debt Advisory Committee were met. The City maintained its AAA bond rating from Standard & Poor’s and Fitch Ratings due to the diverse economy, strong financial management and improving debt position. RISK MANAGEMENT The City has a centralized Risk Management Division within the Office of Human Resources that provides direction, management, coordination and planning services for risk, insurance and employee benefit programs. The risk management effort covers significant loss exposures, applies effective and reasonable risk controls and suggests funding arrangements for both insured and self-funded risks to ensure that the financial integrity of the City is not impaired after a loss. The Risk Management Division also provides administrative and management services in the areas of health and welfare benefits, tort liability, workers’ compensation, occupational health, loss control and safety, emergency preparedness, contract review and property insurance. Additional information on the City of Saint Paul’s risk management activities can be found in Note VIII.C of the notes to the financial statements. AWARDS AND ACKNOWLEDGMENTS The Government Finance Officers Association of the United States and Canada (GFOA) awarded a Certificate of Achievement for Excellence in Financial Reporting to the City of Saint Paul, Minnesota for its Comprehensive Annual Financial Report (CAFR) for the fiscal year ended December 31, 2013. This was the 38th consecutive year that the City has received this prestigious award. In order to be awarded a Certificate of Achievement, a government must publish an easily readable and efficiently-organized Comprehensive Annual Financial Report. This report must satisfy both generally accepted accounting principles and applicable legal requirements. A Certificate of Achievement is valid for a period of one year only. We believe our current Comprehensive Annual Financial Report continues to meet the Certificate of Achievement Program’s requirements and we are submitting it to the GFOA to determine its eligibility for another certificate. The preparation of the 2014 Comprehensive Annual Financial Report was accomplished through the combined efforts of the Office of Financial Services’ accounting staff and departmental accountants. The State Auditor’s cooperation in scheduling staff to review statements as they were prepared was very helpful and appreciated. Cordially,
Todd Hurley, Director Office of Financial Services
xv An Affirmative Action Equal Opportunity Employer

This page left blank intentionally
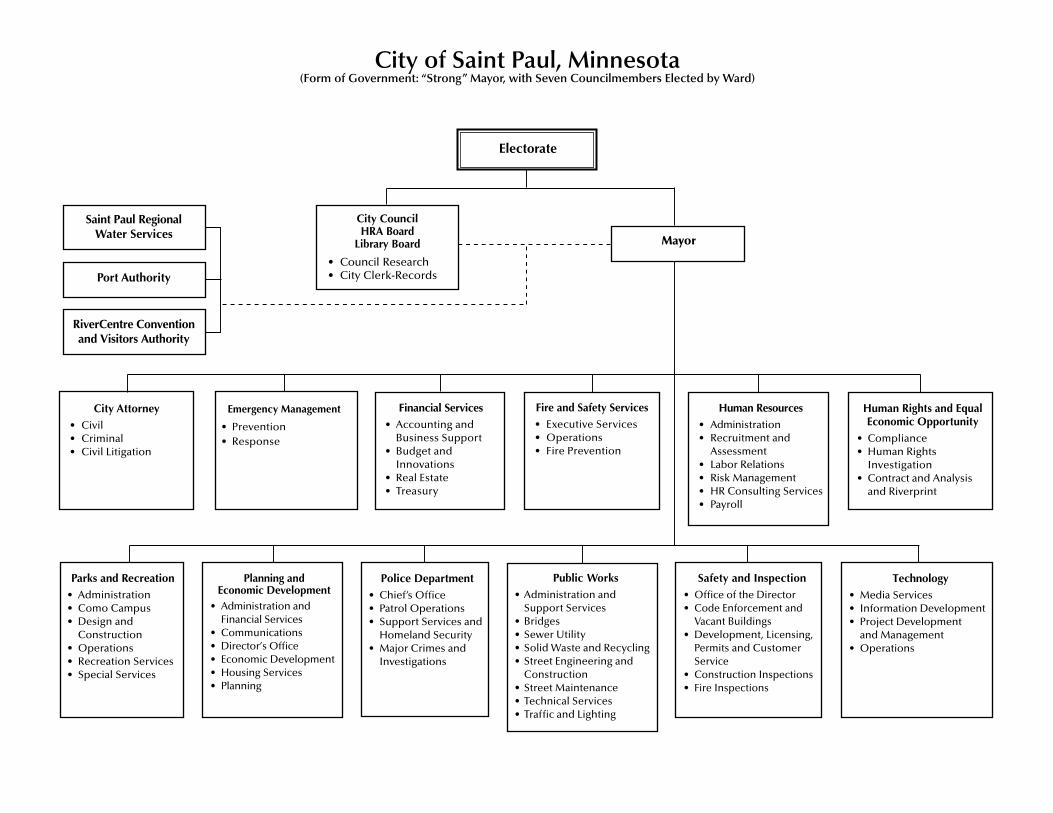
RiverCentre Convention and Visitors Authority
Port Authority
Saint Paul Regional Water Services
Electorate
City of Saint Paul, Minnesota (Form of Government: “Strong” Mayor, with Seven Councilmembers Elected by Ward)
City Council HRA Board
Library Board
• Council Research• City Clerk-Records
Planning and Economic Development
• Administration and Financial Services
• Communications• Director’s Office• Economic Development• Housing Services• Planning
Police Department• Chief’s Office• Patrol Operations• Support Services and
Homeland Security• Major Crimes and
Investigations
Public Works• Administration and
Support Services• Bridges• Sewer Utility• Solid Waste and Recycling• Street Engineering and
Construction• Street Maintenance• Technical Services• Traffic and Lighting
Technology• Media Services• Information Development• Project Development
and Management• Operations
Parks and Recreation• Administration• Como Campus• Design and
Construction• Operations• Recreation Services• Special Services
City Attorney• Civil• Criminal• Civil Litigation
Emergency Management
• Prevention• Response
Financial Services • Accounting and
Business Support• Budget and
Innovations• Real Estate• Treasury
Fire and Safety Services• Executive Services• Operations• Fire Prevention
Human Resources• Administration• Recruitment and
Assessment• Labor Relations• Risk Management• HR Consulting Services• Payroll
Human Rights and Equal Economic Opportunity
• Compliance• Human Rights
Investigation• Contract and Analysis
and Riverprint
Safety and Inspection• Office of the Director• Code Enforcement and
Vacant Buildings• Development, Licensing,
Permits and Customer Service
• Construction Inspections• Fire Inspections
Mayor

City of Saint Paul, MinnesotaELECTED AND APPOINTED OFFICIALSAs of December 31, 2014
TERMOFFICE NAME EXPIRES
Mayor Christopher B. Coleman January 1, 2018
Councilmember - Ward 1 Dai Thao January 1, 2016Councilmember - Ward 2 Dave Thune January 1, 2016Councilmember - Ward 3 Christopher Tolbert January 1, 2016Councilmember - Ward 4 Russ Stark January 1, 2016Councilmember - Ward 5 Amy Brendmoen January 1, 2016Councilmember - Ward 6 Daniel Bostrom January 1, 2016Councilmember - Ward 7 Kathy Lantry January 1, 2016
TERMDEPARTMENT/DIVISION/OFFICE DIRECTOR'S NAME EXPIRES
City Attorney Sara Grewing *City Clerk Shari Moore *Emergency Management Rick Larkin *Financial Services Todd Hurley *Fire and Safety Services Tim Butler 2019Human Rights and Equal Economic Opportunity Jessica Kingston *Human Resources Angie Nalezny *Mayor - Deputy Mayor Kristin Beckmann *Mayor - Chief of Staff Erin Dady *Parks and Recreation Michael Hahm *Planning and Economic Development Jonathan Sage-Martinson *Police Thomas Smith 2016Public Libraries Katherine Hadley *Public Works Rich Lallier *Safety and Inspection Ricardo Cervantes *Technology Angie Nalezny (Acting) *Regional Water Services Steve Schneider **
* Serves at the pleasure of the Mayor** Serves at the pleasure of the Board of Water Commissioners
ELECTED OFFICIALS
APPOINTED OFFICIALS


This page left blank intentionally

An Equal Opportunity Employer
REBECCA OTTO STATE AUDITOR
STATE OF MINNESOTA OFFICE OF THE STATE AUDITOR
SUITE 500
525 PARK STREET SAINT PAUL, MN 55103-2139
(651) 296-2551 (Voice) (651) 296-4755 (Fax)
[email protected] (E-mail) 1-800-627-3529 (Relay Service)
INDEPENDENT AUDITOR’S REPORT
The Honorable Christopher B. Coleman, Mayor and Members of the City Council City of Saint Paul, Minnesota Report on the Financial Statements We have audited the accompanying financial statements of the governmental activities, the business-type activities, the aggregate discretely presented component units, each major fund, and the aggregate remaining fund information of the City of Saint Paul, Minnesota, as of and for the year ended December 31, 2014, and the related notes to the financial statements, which collectively comprise the City’s basic financial statements, as listed in the table of contents. Management’s Responsibility for the Financial Statements Management is responsible for the preparation and fair presentation of these financial statements in accordance with accounting principles generally accepted in the United States of America; this includes the design, implementation, and maintenance of internal control relevant to the preparation and fair presentation of financial statements that are free from material misstatement, whether due to fraud or error. Auditor’s Responsibility Our responsibility is to express opinions on these financial statements based on our audit. We did not audit the financial statements of the Penfield Apartments, a major fund (HRA Penfield Enterprise Fund) and 11 percent, 6 percent, and 5 percent, respectively, of the assets, net position, and revenues of the business-type activities, the Saint Paul RiverCentre Convention and Visitors Authority, which represent 1 percent, 2 percent, and 18 percent, respectively, and the Port Authority of the City of Saint Paul, which represent 34 percent, 12 percent, and 19 percent, respectively, of the assets, net position, and revenues of the aggregate discretely presented component units. Those financial statements were audited by other auditors whose reports thereon have been furnished to us, and our opinion, insofar as it relates to the amounts included for the Penfield Apartments, the Saint Paul RiverCentre Convention and Visitors Authority, and the Port Authority of the City of Saint Paul, is based solely on the reports of the other auditors. We conducted our audit in accordance with auditing standards generally accepted in the United States of
1

America and the standards applicable to financial audits contained in Government Auditing Standards, issued by the Comptroller General of the United States. Those standards require that we plan and perform the audit to obtain reasonable assurance about whether the financial statements are free of material misstatement. The financial statements of the Saint Paul RiverCentre Convention and Visitors Authority were not audited in accordance with Government Auditing Standards. An audit involves performing procedures to obtain audit evidence about the amounts and disclosures in the financial statements. The procedures selected depend on the auditor’s judgment, including the assessment of the risks of material misstatement of the financial statements, whether due to fraud or error. In making those risk assessments, the auditor considers internal control relevant to the City’s preparation and fair presentation of the financial statements in order to design audit procedures that are appropriate in the circumstances, but not for the purpose of expressing an opinion on the effectiveness of the City’s internal control. Accordingly, we express no such opinion. An audit also includes evaluating the appropriateness of accounting policies used and the reasonableness of significant accounting estimates made by management, as well as evaluating the overall presentation of the financial statements. We believe that the audit evidence we have obtained is sufficient and appropriate to provide a basis for our audit opinions. Opinions In our opinion, based on our audit and the reports of the other auditors, the financial statements referred to above present fairly, in all material respects, the respective financial position of the governmental activities, the business-type activities, the aggregate discretely presented component units, each major fund, and the aggregate remaining fund information of the City of Saint Paul as of December 31, 2014, and the respective changes in financial position and, where applicable, cash flows thereof for the year then ended in accordance with accounting principles generally accepted in the United States of America. Other Matters Required Supplementary Information Accounting principles generally accepted in the United States of America require that the Management’s Discussion and Analysis and Required Supplementary Information as listed in the table of contents be presented to supplement the basic financial statements. Such information, although not part of the basic financial statements, is required by the Governmental Accounting Standards Board, who considers it to be an essential part of financial reporting for placing the basic financial statements in an appropriate operational, economic, or historical context. We have applied certain limited procedures to the required supplementary information in accordance with auditing standards generally accepted in the United States of America, which consisted of inquiries of management about the methods of preparing the information and comparing the information for consistency with management’s responses to our inquiries, the basic financial statements, and other knowledge we obtained during our audit of the basic financial statements. We do not express an opinion or provide any assurance on the information because the limited procedures do not provide us with sufficient evidence to express an opinion or provide any assurance.
2

Supplementary and Other Information Our audit was conducted for the purpose of forming opinions on the financial statements that collectively comprise the City of Saint Paul’s basic financial statements. The introductory section, the supplementary information, the other supplementary information, and the statistical section listed in the table of contents are presented for purposes of additional analysis and are not a required part of the basic financial statements. The supplementary information and other supplementary information are the responsibility of management and were derived from and relate directly to the underlying accounting and other records used to prepare the basic financial statements. Such information has been subjected to the auditing procedures applied in the audit of the basic financial statements and certain additional procedures, including comparing and reconciling such information directly to the underlying accounting and other records used to prepare the basic financial statements or to the basic financial statements themselves, and other additional procedures in accordance with auditing standards generally accepted in the United States of America. In our opinion, the information is fairly stated, in all material respects, in relation to the basic financial statements as a whole. The introductory and statistical sections have not been subjected to the auditing procedures applied in the audit of the basic financial statements and, accordingly, we do not express an opinion or provide any assurance on them. Other Reporting Required by Government Auditing Standards In accordance with Government Auditing Standards, we have also issued our report dated November 30, 2015, on our consideration of the City of Saint Paul’s internal control over financial reporting and on our tests of its compliance with certain provisions of laws, regulations, contracts, and grant agreements and other matters. The purpose of that report is to describe the scope of our testing of internal control over financial reporting and compliance and the results of that testing, and not to provide an opinion on the internal control over financial reporting or on compliance. That report is an integral part of an audit performed in accordance with Government Auditing Standards in considering the City of Saint Paul’s internal control over financial reporting and compliance. It does not include the Penfield Apartments, the Saint Paul RiverCentre Convention and Visitors Authority, or the Port Authority of the City of Saint Paul, which were audited by other auditors. REBECCA OTTO GREG HIERLINGER, CPA STATE AUDITOR DEPUTY STATE AUDITOR November 30, 2015
3

This page left blank intentionally
4
CITY OF SAINT PAUL, MINNESOTA
MANAGEMENT’S DISCUSSION AND ANALYSIS For Year Ended December 31, 2014
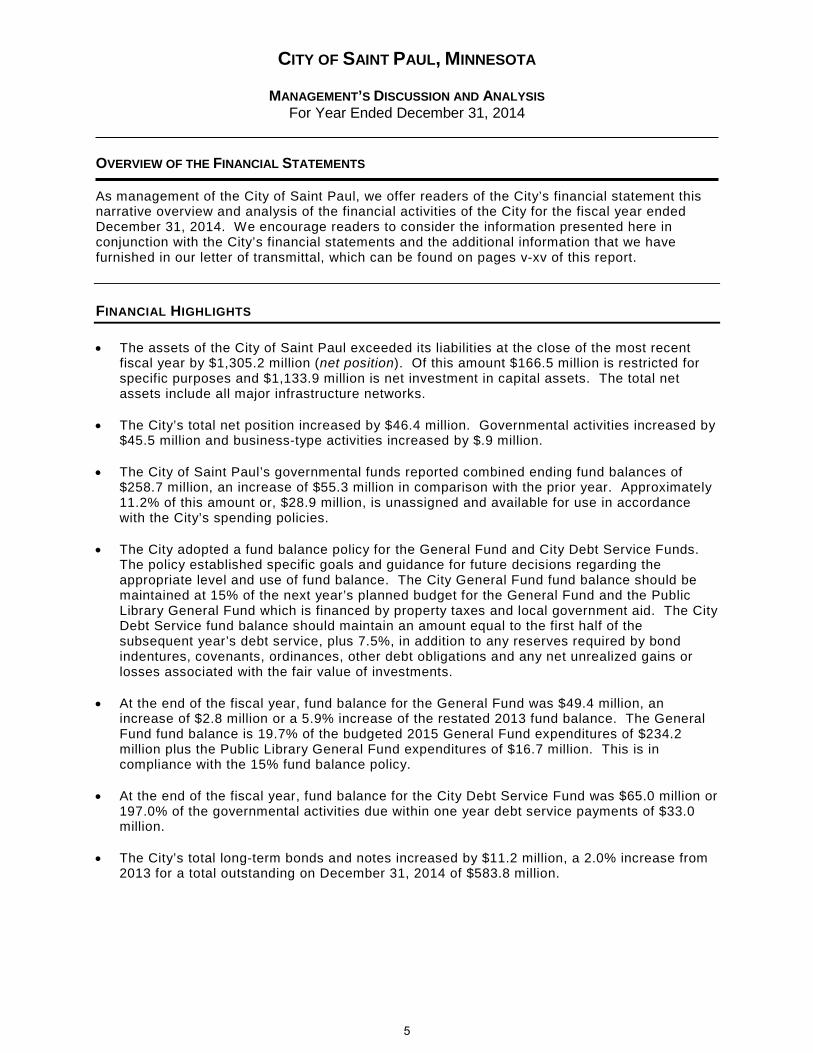
OVERVIEW OF THE FINANCIAL STATEMENTS As management of the City of Saint Paul, we offer readers of the City’s financial statement this narrative overview and analysis of the financial activities of the City for the fiscal year ended December 31, 2014. We encourage readers to consider the information presented here in conjunction with the City’s financial statements and the additional information that we have furnished in our letter of transmittal, which can be found on pages v-xv of this report. FINANCIAL HIGHLIGHTS • The assets of the City of Saint Paul exceeded its liabilities at the close of the most recent
fiscal year by $1,305.2 million (net position). Of this amount $166.5 million is restricted for specific purposes and $1,133.9 million is net investment in capital assets. The total net assets include all major infrastructure networks.
• The City’s total net position increased by $46.4 million. Governmental activities increased by
$45.5 million and business-type activities increased by $.9 million. • The City of Saint Paul’s governmental funds reported combined ending fund balances of
$258.7 million, an increase of $55.3 million in comparison with the prior year. Approximately 11.2% of this amount or, $28.9 million, is unassigned and available for use in accordance with the City’s spending policies.
• The City adopted a fund balance policy for the General Fund and City Debt Service Funds.
The policy established specific goals and guidance for future decisions regarding the appropriate level and use of fund balance. The City General Fund fund balance should be maintained at 15% of the next year’s planned budget for the General Fund and the Public Library General Fund which is financed by property taxes and local government aid. The City Debt Service fund balance should maintain an amount equal to the first half of the subsequent year’s debt service, plus 7.5%, in addition to any reserves required by bond indentures, covenants, ordinances, other debt obligations and any net unrealized gains or losses associated with the fair value of investments.
• At the end of the fiscal year, fund balance for the General Fund was $49.4 million, an
increase of $2.8 million or a 5.9% increase of the restated 2013 fund balance. The General Fund fund balance is 19.7% of the budgeted 2015 General Fund expenditures of $234.2 million plus the Public Library General Fund expenditures of $16.7 million. This is in compliance with the 15% fund balance policy.
• At the end of the fiscal year, fund balance for the City Debt Service Fund was $65.0 million or
197.0% of the governmental activities due within one year debt service payments of $33.0 million.
• The City’s total long-term bonds and notes increased by $11.2 million, a 2.0% increase from
2013 for a total outstanding on December 31, 2014 of $583.8 million.
5

CITY OF SAINT PAUL, MINNESOTA
MANAGEMENT’S DISCUSSION AND ANALYSIS For Year Ended December 31, 2014
OVERVIEW OF THE FINANCIAL STATEMENTS This discussion and analysis is intended to serve as an introduction to the City’s basic financial statements. The City’s basic financial statements are comprised of three components: 1) government-wide financial statements, 2) fund financial statements and 3) notes to the financial statements. This report also contains other supplementary information in addition to the basic financial statements themselves. Government-wide Financial Statements The government-wide financial statements are designed to provide readers with a broad overview of the City’s finances, in a manner similar to a private-sector business. The Statement of Net Position presents information on all of the City’s assets and deferred outflows of resources, and liabilities and deferred inflows of resources, with the difference between the two reported as net position. Over time, increases or decreases in net position may serve as a useful indicator of whether the financial position of the City is improving or deteriorating. To assess the overall health of the City, one needs to consider additional non-financial factors such as changes in the City’s property tax base and the condition of the City’s infrastructure. The Statement of Activities presents information showing how the City’s net position changed during the fiscal year. All changes in net position are reported when the underlying event giving rise to the change occurs, regardless of the timing of the related cash flows. Thus, revenues and expenses are reported in this statement for some items that will only result in cash flows in the future fiscal periods (e.g., uncollected taxes and earned but unused compensated absences). Both of the government-wide financial statements distinguish functions of the City that are principally supported by taxes and intergovernmental revenues (governmental activities) from functions that are intended to recover all or a significant portion of their costs through user fees and charges (business-type activities). The governmental activities of the City include general government, public safety, highways and streets, sanitation, health, culture and recreation, and housing and economic development. The business-type activities of the City of Saint Paul include sewer; development loan programs; parking; the Penfield Apartments; parks, recreation and athletics; impound lot; printing; and the Loft Apartments. The government-wide financial statements include not only the City of Saint Paul itself (known as the primary government), but also Saint Paul RiverCentre Convention & Visitors Authority (RCVA), Saint Paul Regional Water Services (SPRWS) and Port Authority of the City of Saint Paul, which are separate legal entities for which the City of Saint Paul is financially accountable. Financial information for these component units is reported separately from the financial information presented for the primary government itself. The Housing and Redevelopment Authority of the City of Saint Paul (HRA) and the Saint Paul Library Agency, although legally separate, function for all practical purposes as departments of the City of Saint Paul, and therefore, have been included as an integral part of the primary government. The government-wide financial statements can be found in the Basic Financial Statements section of this report.
6

CITY OF SAINT PAUL, MINNESOTA
MANAGEMENT’S DISCUSSION AND ANALYSIS For Year Ended December 31, 2014
OVERVIEW OF THE FINANCIAL STATEMENTS Fund Financial Statements A fund is a grouping of related accounts that is used to maintain control over resources that have been segregated for specific activities or objectives. The City, like other state and local governments, uses fund accounting to ensure and demonstrate compliance with finance-related legal requirements. All of the funds of the City can be divided into three categories: governmental funds, proprietary funds and fiduciary funds. Governmental Funds – Governmental funds are used to account for essentially the same functions reported as governmental activities in the government-wide financial statements. However, unlike the government-wide financial statements, governmental fund financial statements focus on near-term inflows and outflows of spendable resources, as well as on balances of spendable resources available at the end of the fiscal year. Such information may be useful in evaluating a government’s near-term financing requirements. Because the focus of governmental funds is narrower than that of the government-wide financial statements, it is useful to compare the information presented for governmental funds with similar information presented for governmental activities in the government-wide financial statements. By doing so, readers may better understand the long-term impact of the government’s near-term financing decisions. Both the governmental fund balance sheet and the governmental fund statement of revenues, expenditures and changes in fund balances provide a reconciliation to facilitate this comparison between governmental funds and governmental activities. The City maintains 27 individual governmental funds. Information is presented separately in the governmental fund balance sheet and in the governmental fund statement of revenues, expenditures and changes in fund balances for the General Fund, Public Library General Fund, HRA General Fund, Assessment Financing, City Debt Service, HRA General Debt, and City Capital Projects, all of which are considered to be major funds. Data from the other governmental funds are combined into a single, aggregated presentation. Individual fund data for each of these non-major governmental funds is provided in the form of combining statements elsewhere in this report. The basic governmental fund financial statements can be found in the Basic Financial Statements section of this report. Proprietary Funds – The City maintains two different types of proprietary funds. Enterprise funds are used to report the same functions presented as business-type activities in the government-wide financial statements. The City uses enterprise funds to account for its RiverPrint, Impound Lot, Sewer Utility, Parks Special Services; HRA Loan Enterprise, HRA Parking, HRA Penfield and HRA Lofts. Internal service funds are an accounting device used to accumulate and allocate costs internally among the City’s various functions. The City uses its internal service funds to account for Internal Borrowing, Central Service, Equipment Services Fire Police, Public Works Administration, Public Works Equipment Service, Public Works Engineering Services, Asphalt Plant, Traffic Warehouse, Parks Supply and Maintenance, and Planning and Economic Development Administration. The services provided by these funds predominately benefit the governmental rather than the business-type functions. They have been included within governmental activities in the government-wide financial statements.
7
CITY OF SAINT PAUL, MINNESOTA
MANAGEMENT’S DISCUSSION AND ANALYSIS For Year Ended December 31, 2014
OVERVIEW OF THE FINANCIAL STATEMENTS Proprietary funds provide the same type of information as the government-wide financial statements, only in more detail. The proprietary fund financial statements provide separate information for the Sewer Utility, HRA Parking, HRA Loan Enterprise and HRA Penfield funds, since they are considered to be major funds of the City. Data from the other enterprise funds are combined into a single aggregated presentation. All internal service funds are combined into a separate single aggregated presentation in the proprietary fund financial statements. Individual fund data for the internal service funds is provided in the form of combining statements elsewhere in this report. The basic proprietary fund financial statements can be found in the Basic Financial Statements section of this report. Fiduciary Funds – Fiduciary funds are used to account for resources held for the benefit of parties outside the government. Fiduciary funds are not reflected in the government-wide financial statements because the resources of those funds are not available to support the City’s own programs. The accounting used for fiduciary funds is much like that used for proprietary funds. The basic fiduciary fund financial statements can be found in the Basic Financial Statements section of this report. Notes to the Financial Statements The notes provide additional information that is essential to a full understanding of the data provided in the government-wide and fund financial statements. Other Supplementary Information In addition to the basic financial statements and accompanying notes, Required Supplementary Information, presents a detailed budgetary comparison schedule for the City General Fund, Assessment Financing Fund, Public Library General Fund and the HRA General Fund to demonstrate compliance with the budget. In accordance with the requirements of GASB Statement 45, it also includes other post-employment benefit plan information: a) schedule of funding progress and b) schedule of employer contributions. These schedules can be found in the Required Supplementary Information section of this report. The combining statements referred to earlier in connection with nonmajor governmental funds, proprietary funds, internal service funds and other information related to the individual funds are presented immediately following the required supplementary information. Combining and individual statements and schedules can be found in the Supplementary Information section of this report.
8

CITY OF SAINT PAUL, MINNESOTA
MANAGEMENT’S DISCUSSION AND ANALYSIS For Year Ended December 31, 2014
FINANCIAL ANALYSIS OF THE GOVERNMENT AS A WHOLE The analysis of the City’s financial position begins with a review of the Statement of Net Position and the Statement of Changes in Net Position. These two statements report the City’s net position and changes therein. It should be noted that the financial position can also be affected by non-financial factors, including economic conditions, population growth and new regulations. Net position may serve over time as a useful indicator of a government’s financial position. In the case of the City of Saint Paul, assets and deferred outflows of resources exceeded liabilities and deferred inflows of resources by $1,305.2 million as of December 31, 2014.
CONDENSED STATEMENT OF NET POSITION (in thousands of dollars)
Total
2014 2013 2014 2013 2014 2013PercentChange
Current and Other Assets 397,708$ 333,592$ 89,497$ 93,303$ 487,205$ 426,895$ 14.13%Capital Assets 1,245,365 1,192,783 429,893 426,299 1,675,258 1,619,082 3.47%
Total Assets 1,643,073$ 1,526,375$ 519,390$ 519,602$ 2,162,463$ 2,045,977$ 5.69%
Deferred Outflows of Resources 11,010 9,279 - - 11,010 9,279 18.66%
Long-Term Liabilities 596,678$ 535,514$ 190,302$ 184,209$ 786,980$ 719,723$ 9.34%Other Liabilities 61,479 53,197 8,814 16,113 70,293 69,310 1.42%
Total Liabilities 658,157$ 588,711$ 199,116$ 200,322$ 857,273$ 789,033$ 8.65%
Deferred Inflows of Resources 11,010 9,279 - - 11,010 9,279 18.66%
Net Position:Net Investments in Capital Assets 884,350$ 927,972$ 249,528$ 251,126$ 1,133,878$ 1,179,098$ (3.84)%
Restricted 149,764 126,429 16,704 14,870 166,468 141,299 17.81% Unrestricted (49,198) (116,737) 54,042 53,284 4,844 (63,453) (107.63)%
Total Net Position 984,916$ 937,664$ 320,274$ 319,280$ 1,305,190$ 1,256,944$ 3.84%
Governmental Activities Business-type Activities Total
The largest portion of the City’s net position, $1,133.9 million (approximately 86.9%), reflects its investments in capital assets (e.g., land, building, improvements, equipment, infrastructure, and construction in progress), less any debt used to acquire those assets that is still outstanding. The City uses these capital assets to provide service to citizens; consequently, these assets are not available for future spending. Although the City’s investment in its capital assets is reported net of related debt, it should be noted that the resources needed to repay this debt must be provided from other sources, since the capital assets themselves cannot be used to liquidate these liabilities.
9

CITY OF SAINT PAUL, MINNESOTA
MANAGEMENT’S DISCUSSION AND ANALYSIS For Year Ended December 31, 2014
FINANCIAL ANALYSIS OF THE GOVERNMENT AS A WHOLE Restricted net assets of $166.5 million (approximately 12.8%), represents resources that are subject to external restriction on how they may be used. The remaining balance, unrestricted net position of $4.8 million (approximately 0.4%), may be used to meet the government’s ongoing obligation to citizens and creditors. Analysis of the City’s Operations – The following table provides a summary of the City’s operations for the year ended December 31, 2014. Overall, both the governmental and business-type activities revenue and expenses remained stable. Governmental activities increased the City of Saint Paul’s net position by $45.5 million. Business-type activities increased the City’s net position by $0.9 million.
CONDENSED STATEMENT OF CHANGES IN NET POSITION (in thousands of dollars)
Total
2014 2013 2014 2013 2014 2013PercentChange
Revenues:Program Revenues
Charges for Services 175,296$ 127,304$ 74,383$ 72,623$ 249,679$ 199,927$ 24.89%Operating Grants and Contributions 60,142 65,382 - - 60,142 65,382 (8.01)%Capital Grants and Contributions 20,042 18,554 - 113 20,042 18,667 7.37%
General RevenuesProperty Taxes 124,809 120,344 1,753 1,738 126,562 122,082 3.67%City Sales Tax 18,315 17,034 - - 18,315 17,034 7.52%Franchise Fees and Other Taxes 29,816 32,533 - - 29,816 32,533 (8.35)%Local Government Aid 60,424 53,909 - - 60,424 53,909 12.09%Grants and Contributions Not Restricted 2,173 1,068 2,521 1,245 4,694 2,313 102.94%Investment Income 9,079 (3,981) 877 (362) 9,956 (4,343) (329.24)%Gain on Sale of Capital Assets 68 97 - 2 68 99 (31.31)% Noncapital Contributions 16,154 283 - - 16,154 283 5608.13%Miscellaneous 14,673 7,418 26 6 14,699 7,424 97.99%
Total Revenues 530,991$ 439,945$ 79,560$ 75,365$ 610,551$ 515,310$ 18.48%
Governmental Activities Business-type Activities Total
10

CITY OF SAINT PAUL, MINNESOTA
MANAGEMENT’S DISCUSSION AND ANALYSIS For Year Ended December 31, 2014
FINANCIAL ANALYSIS OF THE GOVERNMENT AS A WHOLE
CONDENSED STATEMENT OF CHANGES IN NET POSITION (in thousands of dollars)
Total
2014 2013 2014 2013 2014 2013PercentChange
Expenses:General Government 69,579$ 45,897$ - $ - $ 69,579$ 45,897$ 51.60%Public Safety 179,068 180,336 - - 179,068 180,336 (0.70)%Highway and Streets 95,672 73,113 - - 95,672 73,113 30.85%Sanitation 5,436 4,419 - - 5,436 4,419 23.01%Health 3,965 3,281 - - 3,965 3,281 20.85%Culture and Recreation 69,349 78,240 - - 69,349 78,240 (11.36)%
Housing and Economic Development 42,338 54,377 - - 42,338 54,377 (22.14)%Interest and Fiscal Charges 28,296 21,170 - - 28,296 21,170 33.66%Sewer - - 43,803 41,534 43,803 41,534 5.46%Development Loan Programs - - 1,051 2,112 1,051 2,112 (50.24)%Parking - - 11,904 11,640 11,904 11,640 2.27%Penfield - - 3,777 - 3,777 - Parks, Recreation and Athletics - - 4,192 4,740 4,192 4,740 (11.56)%Impound Lot - - 3,151 3,241 3,151 3,241 (2.78)%Printing - - 1,434 1,405 1,434 1,405 2.06%Lofts - - 1,122 - 1,122 -
Total Expenses 493,703$ 460,833$ 70,434$ 64,672$ 564,137$ 525,505$ 7.35%
Change in Net Assets before Transfers 37,288$ (20,889)$ 9,126$ 10,693$ 46,414$ (10,196)$ (555.22)%Transfers 8,198 10,331 (8,198) (10,331) - -
Change in Net Position 45,486$ (10,558)$ 928$ 362$ 46,414$ (10,196)$ (555.22)%
Net Position, January 1, as restated 939,430$ 948,222$ 319,346$ 318,918$ 1,258,776$ 1,267,140$ (0.66)%
Net Position, December 31 984,916$ 937,664$ 320,274$ 319,280$ 1,305,190$ 1,256,944$ 3.84%2013 Restatements 1,766 66 1,832 Net Position, December 31, Restated 939,430$ 319,346$ 1,258,776$
Business-type ActivitiesGovernmental Activities Total
11

CITY OF SAINT PAUL, MINNESOTA
MANAGEMENT’S DISCUSSION AND ANALYSIS For Year Ended December 31, 2014
FINANCIAL ANALYSIS OF THE GOVERNMENT AS A WHOLE Governmental Activities Governmental activities increased the City’s net position by $45.5 million, an increase of $56.1 million in net change in net position compared to the 2013 decrease of $12.1 million. Overall the governmental activities in 2014 were stable, with increased revenues more than the increased expenses. Revenues increased by $91.0 million while the expenses increased by $32.9 million and the net transfers decreased by $2.1 million. For 2014 the fund structure for all the funds was changed to reduce the number of funds and to facilitate better reporting. This resulted in large variances between 2014 and 2013 due to shrinking the number of funds from 82 to 39 funds in 2014. Business-type Activities Business-type activities experienced a $0.9 million increase in net position. This is a result of the revenues increasing by $4.2 million while the expenses increased by $5.8 million and transfers decreased by $2.1 million compared to 2013. Most of the increase in expenses for 2014 compared to 2013 occurred in the Sewer Utility Fund and the HRA Penfield Fund. The increase for the Sewer Utility Fund is primarily related to infrastructure project work, Metropolitan Council Environmental Services (MCES) increase, and an increase in the private sewer connection program. For 2014 a fund structure change occurred whereby the HRA Penfield Apartments became a separate fund when in 2013 the HRA Penfield Fund was included in the activities of the HRA Loan Enterprise Fund.
12

CITY OF SAINT PAUL, MINNESOTA
MANAGEMENT’S DISCUSSION AND ANALYSIS For Year Ended December 31, 2014
FINANCIAL ANALYSIS OF THE GOVERNMENT AS A WHOLE
Expenses and Program Revenues – Governmental Activities (in thousands)
- 20,000 40,000 60,000 80,000
100,000 120,000 140,000 160,000 180,000 200,000
Expenses
Program Revenues
Revenue by Source– Governmental Activities
Charges for Services, 33.01%
Operating Grants and
Contributions, 11.33%
Capital Grants and Contributions,
3.77%
Property Taxes, 23.51%
City Sales Tax, 3.45%
Franchise Fee and Other Taxes,
5.62%Local Government
Aid, 11.38%
Grants and Contributions Not
Restricted to Specific Programs,
0.41%Investment
Income, 1.72%Gain on Sale of Capital Assets,
0.01%Noncapital
Contributions, 3.04%
Miscellaneous, 2.76%
13

CITY OF SAINT PAUL, MINNESOTA
MANAGEMENT’S DISCUSSION AND ANALYSIS For Year Ended December 31, 2014
FINANCIAL ANALYSIS OF THE GOVERNMENT AS A WHOLE
Expenses and Program Revenues – Business-type Activities (in thousands)
-
10,000
20,000
30,000
40,000
50,000
60,000
Expenses
Program Revenues
Revenues by Source – Business-type Activities
Charges for Services, 93.50%
Property Taxes, 2.19%
Grants and Contributions Not Restricted
to Specific Programs,
3.17%
Investment Income, 1.10%
Miscellaneous, 0.03%
14

CITY OF SAINT PAUL, MINNESOTA
MANAGEMENT’S DISCUSSION AND ANALYSIS For Year Ended December 31, 2014
FINANCIAL ANALYSIS OF THE GOVERNMENT’S FUNDS Governmental Funds The focus of the City of Saint Paul’s governmental funds is to provide information on near-term inflows, outflows, and balances of spendable resources. Such information is useful in assessing the City’s financing requirements. In particular, unrestricted fund balances (committed, assigned and unassigned) may serve as a useful measure of the government’s net resources available for spending at the end of the fiscal year. At the end of the current fiscal year, the City of Saint Paul’s governmental funds reported combined ending fund balances of $258.7 million. The majority of the fund balance is either nonspendable or restricted which comprise 70.5% of the total. The rest at 29.5% is unrestricted. Nonspendable fund balance (1.5% of total) includes amounts that are not in spendable form, or legally or contractually required to be maintained intact. Restricted fund balance comprises 69.0% of the total fund balance. Fund balance is reported as restricted when constraints place on the use of the resources are either externally imposed by the creditors (such as through debt covenants), grantors, other governments or is imposed by law through constitutional provisions or enabling legislation. Of the total $76.3 million of unrestricted fund balance, $19.9 million is committed, $27.5 million is assigned and $28.9 million is unassigned. The total unassigned balance is net of the reported balance in the City General Fund of $49.0 million and the rest that are reported in various special revenue funds for ($4.5) million and capital project funds for ($15.6) million. Unrestricted
Purposes Nonspendable Restricted Committed Assigned Unassigned Subtotal Total
Advance to Component Units 3,924,608$ - $ - $ - $ - $ - $ $ 3,924,608 Corpus of Permanent Funds 35,000 - - - - - 35,000 General Government - 82,601,692 975,399 10,064,055 - 11,039,454 93,641,146 Public Safety - - - 356,401 - 356,401 356,401 Highways and Streets - 1,279,578 - 8,544,446 - 8,544,446 9,824,024 Sanitation - - - 1,329,605 - 1,329,605 1,329,605 Health - - - - - - - Culture and Recreation - 1,009,779 1,450,953 2,192,671 - 3,643,624 4,653,403 Housing and Economic Development - 49,518 17,514,790 4,959,422 - 22,474,212 22,523,730 Debt Service - 93,533,086 - - - - 93,533,086 Unassigned - - - - 28,887,389 28,887,389 28,887,389
Total 3,959,608$ 178,473,653$ 19,941,142$ 27,446,600$ 28,887,389$ 76,275,131$ 258,708,392$ Percent of Total 1.5% 69.0% 7.7% 10.6% 11.2% 29.5% 100.0%
15
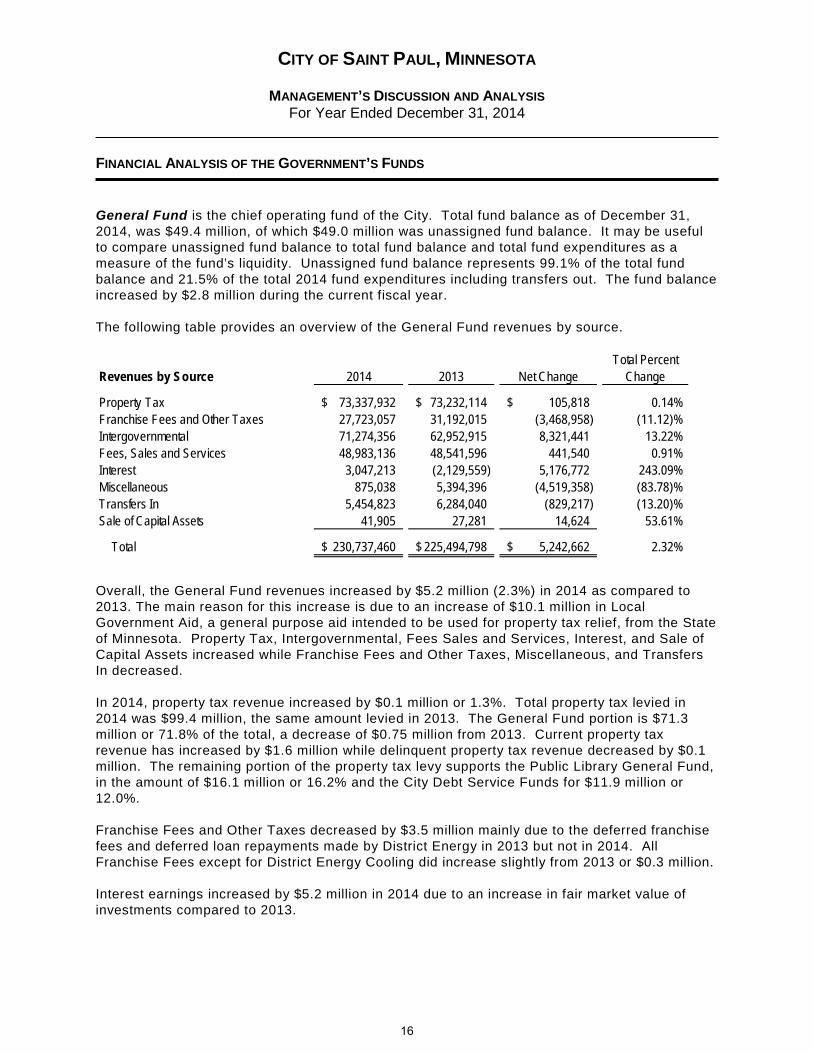
CITY OF SAINT PAUL, MINNESOTA
MANAGEMENT’S DISCUSSION AND ANALYSIS For Year Ended December 31, 2014
FINANCIAL ANALYSIS OF THE GOVERNMENT’S FUNDS General Fund is the chief operating fund of the City. Total fund balance as of December 31, 2014, was $49.4 million, of which $49.0 million was unassigned fund balance. It may be useful to compare unassigned fund balance to total fund balance and total fund expenditures as a measure of the fund’s liquidity. Unassigned fund balance represents 99.1% of the total fund balance and 21.5% of the total 2014 fund expenditures including transfers out. The fund balance increased by $2.8 million during the current fiscal year. The following table provides an overview of the General Fund revenues by source.
Total PercentRevenues by Source 2014 2013 Net Change Change
Property Tax 73,337,932$ 73,232,114$ 105,818$ 0.14%Franchise Fees and Other Taxes 27,723,057 31,192,015 (3,468,958) (11.12)%Intergovernmental 71,274,356 62,952,915 8,321,441 13.22%Fees, Sales and Services 48,983,136 48,541,596 441,540 0.91%Interest 3,047,213 (2,129,559) 5,176,772 243.09%Miscellaneous 875,038 5,394,396 (4,519,358) (83.78)%Transfers In 5,454,823 6,284,040 (829,217) (13.20)%Sale of Capital Assets 41,905 27,281 14,624 53.61%
Total 230,737,460$ 225,494,798$ 5,242,662$ 2.32%
Overall, the General Fund revenues increased by $5.2 million (2.3%) in 2014 as compared to 2013. The main reason for this increase is due to an increase of $10.1 million in Local Government Aid, a general purpose aid intended to be used for property tax relief, from the State of Minnesota. Property Tax, Intergovernmental, Fees Sales and Services, Interest, and Sale of Capital Assets increased while Franchise Fees and Other Taxes, Miscellaneous, and Transfers In decreased. In 2014, property tax revenue increased by $0.1 million or 1.3%. Total property tax levied in 2014 was $99.4 million, the same amount levied in 2013. The General Fund portion is $71.3 million or 71.8% of the total, a decrease of $0.75 million from 2013. Current property tax revenue has increased by $1.6 million while delinquent property tax revenue decreased by $0.1 million. The remaining portion of the property tax levy supports the Public Library General Fund, in the amount of $16.1 million or 16.2% and the City Debt Service Funds for $11.9 million or 12.0%. Franchise Fees and Other Taxes decreased by $3.5 million mainly due to the deferred franchise fees and deferred loan repayments made by District Energy in 2013 but not in 2014. All Franchise Fees except for District Energy Cooling did increase slightly from 2013 or $0.3 million. Interest earnings increased by $5.2 million in 2014 due to an increase in fair market value of investments compared to 2013.
16

CITY OF SAINT PAUL, MINNESOTA
MANAGEMENT’S DISCUSSION AND ANALYSIS For Year Ended December 31, 2014
FINANCIAL ANALYSIS OF THE GOVERNMENT’S FUNDS The following table provides an overview of the General Fund expenditures by function.
Total PercentExpenditures by Function 2014 2013 Net Change Change
General Government 42,172,007$ 31,691,983$ 10,480,024$ 33.07%Public Safety 155,051,635 150,081,179 4,970,456 3.31%Highways and Streets 1,996,364 3,313,132 (1,316,768) (39.74)%Culture and Recreation 26,212,091 26,596,065 (383,974) (1.44)%Miscellaneous 288,352 6,319,286 (6,030,934) (95.44)%Debt 8,450 7,426 1,024 13.79%Transfers Out 2,251,040 10,861,972 (8,610,932) (79.28)%
Total 227,979,939$ 228,871,043$ (891,104)$ (0.39)%
Total General Fund expenditures decreased by $0.9 million or 0.4% as compared to 2013. General Government expenditures increased by $10.5 million. The increase was mainly due to the following: increased staffing costs, professional services, computer equipment payments, INET fees, and settlements. Public Safety expenditures increased by $5.0 million compared to 2013. The increase was mainly due to increased employee salary and fringe benefit costs. Transfers Out decreased by $8.6 million. The decrease was mainly due to a prepayment of $7.7 million made in 2013 for District Energy deferred franchise fees and deferred loan repayments which are not called for in 2014. Assessment Financing Fund to account for monies from assessments and fees charged for the building of capital projects, Truth-In-Sale of Housing, Nuisance Housing Abatement, Code Enforcement and the Rental Registration program. The fund is reporting a fund balance of $6.5 million on December 31, 2014. The fund structure changed in 2014 whereby similar activities previously accounted for in separate funds are now accounted for in this fund. Public Library General Fund accounts for the general operations of the Saint Paul Public Library. The purpose of separating the Public Library from the City General Fund was to increase its visibility within the community. Revenues to support the agency are from property taxes, and outside grants. Revenues reported from these sources totaled $16.2 million with expenditures including transfers out of $16.0 million. The fund balance increased $0.2 million. The fund is reporting a fund balance on December 31, 2014, of $1.6 million. HRA General Fund is the chief operating fund of the HRA. Revenues include the HRA property tax levy, fees from conduit revenue bond issues, land sale proceeds, investment earnings, and other revenues. The major spending activities are for staff administration of HRA programs, maintenance of HRA properties, and professional services for HRA programs and projects. The fund balance in the HRA General Fund increased during 2014 by $0.1 million to a total of $12.0 million at December 31, 2014, due to an increase in service revenue from Conduit Revenue bonds issued.
17
CITY OF SAINT PAUL, MINNESOTA
MANAGEMENT’S DISCUSSION AND ANALYSIS For Year Ended December 31, 2014
FINANCIAL ANALYSIS OF THE GOVERNMENT’S FUNDS City Debt Service Fund accounts for the revenues and expenditures relating to the City’s general obligation debt that is supported by property tax revenues. In 2014, $11.9 million was received in taxes, $5.3 million more than in 2013. The transfers in of $61.0 million have increased by $33.3 million. The total fund revenues and transfers in were $86.9 million and the expenditures for debt payments in 2014 totaled $39.4 million. The remaining fund balance of $65.0 million at the end of the fiscal year is to be used for future debt service payments. HRA General Debt Fund accumulates resources and pays debt service for the HRA’s debt that is not financed by enterprise funds. Debt service on the bonds is financed by property tax increments, City sales taxes, lease payments from the City, and investment earnings. At December 31, 2014, the fund balance is $10.3 million, which is entirely restricted for future debt service. Total debt spending during 2014 was $45.7 million including $32.0 million to defease the series 1996 Sales Tax Revenue Bonds. City Capital Projects Fund accounts for the major capital improvement projects relating to City-owned capital assets. The fund has a total fund balance of $59.3 million. The net increase in fund balance during the current year was $27.7 million. This is mainly due to unspent bond proceeds for capital projects still in the process of completion. Proprietary Funds The City of Saint Paul’s proprietary funds provide the same type of information found in the government-wide financial statements, but in more detail. Sewer Utility Enterprise Fund performance in 2014 ended with an unrestricted net asset balance of $27.6 million at December 31, 2014. The total net position decreased in 2014 by $881,207. Operating cash is being maintained in the $30-$40 million range; total cash balance at December 31, 2014 was $36 million. Revenues are being increased with a three and a half percent (3.5%) increase in sanitary rates and a three and a half percent (3.5%) increase in storm rates, which was recommended by the Mayor and adopted by the City Council in late 2014 for implementation on January 1, 2015.
The Sewer Utility Enterprise Fund anticipates a decrease in unrestricted net position as a result of continuation of an Inflow / Infiltration program, major reconstruction of storm sewer tunnels, and other construction repair work. At this time, the restrictions placed on resources in the Sewer Utility Enterprise Fund are those related to outstanding debt ($6.98 million), and the restriction for operation and maintenance ($4.39 million). In July 2014, Standard & Poor’s Rating Group indicated their support of Sewer Utility management by maintaining their rating of the Sewer Utility’s revenue bonds as AAA. HRA Loan Enterprise Fund accounts for loans issued and services related to housing and business assistance. The Fund has unrestricted net position totaling $16.5 million at December 31, 2014. The assets of the Fund include loans receivable and accrued interest on these loans which are reported at $4.9 million (net of allowance) and in many cases have long repayment terms before there will be liquidation to cash. Cash and investments not including trust accounts are reported at $6.3 million at December 31, 2014. The Fund had an overall increase in net position of $0.8 million for 2014. HRA Parking Fund accounts for the operation of HRA owned parking facilities in Saint Paul. The Fund has unrestricted net position of $14.5 million at December 31, 2014. Assets in the Fund include capital assets for parking facilities reported at the depreciated amount of $88.3 million. Long-term debt used for financing the construction of the parking facilities is $57.5 million in principal outstanding at December 31, 2014. The Fund had operating income of $4.3 million during 2014. The fund sustained bad debt expense of $765,000 on the write-off of a parking meter loan due from Public Works. It also incurred additional expenses for payments to outside agencies for increased game day sales revenue paid to the Wild of
18
CITY OF SAINT PAUL, MINNESOTA
MANAGEMENT’S DISCUSSION AND ANALYSIS For Year Ended December 31, 2014
FINANCIAL ANALYSIS OF THE GOVERNMENT’S FUNDS about $160,000 and had increased maintenance expenses for painting parking ramps of about $96,000. The fund also had an increase in parking ramp operator expenses of about $91,000 that offset the increase in ramp operating revenues of about $187,000. The fund also transferred out approximately $642,000 toward the purchase of the Lexington Library and for certain traffic studies. HRA Penfield Fund accounts for the Penfield Apartments. The Fund has an unrestricted net position totaling $3.7 million at December 31, 2014. The assets of the Fund include capital assets which are reported at $56.0 million, net of accumulated depreciation. Cash and investments are reported at $3.8 million at December 31, 2014. The Fund had an overall net position of $19.2 million at December 31, 2014 and 2014 is the first year that the activities of the Penfield Apartments are reported as a separate fund.
19

CITY OF SAINT PAUL, MINNESOTA
MANAGEMENT’S DISCUSSION AND ANALYSIS For Year Ended December 31, 2014
GENERAL FUND BUDGETARY HIGHLIGHTS The final amended budget for the General Fund includes the original adopted budget, plus any previously appropriated funds set aside for the purpose of honoring legally-incurred obligations (prior year encumbrances and commitments), plus any additional supplemental appropriations that were legislated by City Council during the year. The total original adopted financing and spending budget including transfers was $233.3 million, which included the 2013 appropriation of $2.2 million that was carried forward to 2014. The 2014 actual spending including transfers out was $228.0 million, as compared to the final budget of $233.6 million, resulted in a $5.6 million positive variance. Actual expenditures were 97.6% of the final budgeted amount. The 2014 actual financing including transfers in was $230.7 million compared to the final budget of $231.3 million, and resulted in a negative variance of $0.6 million. Actual revenues were 100.7% of the final budgeted amount. Overall, the General Fund budget to actual results reflected a positive variance of $4.9 million, with an actual net change in fund balance of $2.8 million.
20

CITY OF SAINT PAUL, MINNESOTA
MANAGEMENT’S DISCUSSION AND ANALYSIS For Year Ended December 31, 2014
CAPITAL ASSETS At the end of 2014, the City had invested a total of $1,675.3 million in capital assets (net of accumulated depreciation). This investment in capital assets includes land, buildings, improvements, equipment, infrastructure and construction in progress of the City, including the capital assets recorded for the City’s internal service funds which have a depreciated value of $11.6 million. Major capital asset events during the current fiscal year included the following: Public Works completed its 19th year of the Residential Street Vitality Program (RSVP) by awarding the Montana/Greenbrier, Fairview/Bohland, Maiden Lane/Virginia, and 8th Street for a total of $12.3 million of Street Improvement Bonds and $2 million of Municipal State Aid. Public Works awarded Montreal Avenue Reconstruction, Western Avenue Streetscape, Cayuga Arkwright, Highland Village Streetscape, and Jefferson Griggs Bikeway for a total of $16.8 million of Municipal State Aid, Federal Grants, and local funding. Public Works continued work on Pierce Butler and continued design work on Raymond Avenue Phase II, Kellogg & Market, Kellogg & St. Peter Bridges. In addition, design work was started on Jackson Street Reconstruction. Public Works worked in cooperation with Parks and Recreation Department on the Grand Round project, and completed work on the Green Line (Central Corridor Light Rail) project in 2014. The Sewer System Rehabilitation program is now in its 17th year. The City awarded contracts for the Westside relining project, Burns/Park relining project and Juno/Watson relining project. All projects have an estimated completion date of November 30, 2015. A contract for the rehabilitation of the St. Anthony Tunnel Phase VI was awarded in the fall of 2014 so that work could take place during the winter months. The Saint Paul Parks and Recreation Department is now in its 3rd year of a major construction project for the Lowertown Ballpark. The $64.0 million project will be home to the Saint Paul Saints and host several events for the amateur sports community. The ballpark will be open for the spring 2015 baseball season.
CAPITAL ASSETS AT YEAR-END NET OF ACCUMULATED DEPRECIATION
(in thousands of dollars)
Total
2014 2013 2014 2013 2014 2013PercentChange
Land $ 153,043 $ 152,395 $ 36,047 $ 35,755 $ 189,090 $ 188,150 0.50%Buildings and Structures 343,106 346,418 124,038 73,912 467,144 420,330 11.14%
Improvements other than Buildings 89,223 93,201 - - 89,223 93,201 (4.27)%
Public Improvements - - 263,321 257,318 263,321 257,318 2.33%Equipment 43,726 27,594 2,418 2,595 46,144 30,189 52.85%Infrastructure 456,313 455,503 - - 456,313 455,503 0.18%Construction in Progress 159,955 117,672 4,069 56,718 164,024 174,390 (5.94)%
Total $ 1,245,366 $ 1,192,783 $ 429,893 $ 426,298 $ 1,675,259 $ 1,619,081 3.47%
Governmental Activities Business-type Activities Total
Additional information on the City of Saint Paul’s capital assets can be found in Note VI.E in the Notes to the Financial Statements section of this report.
21

CITY OF SAINT PAUL, MINNESOTA
MANAGEMENT’S DISCUSSION AND ANALYSIS For Year Ended December 31, 2014
LONG-TERM OBLIGATIONS During 2014, the City issued $102.1 million in bonds and retired/defeased $81.5 million in bonds, resulting in $519.3 million in bonds payable and $98.2 million in notes payable at the end of 2014. Of the bonded debt, $185.8 million is considered to be gross direct general property tax supported debt; considering the $65.0 million available in the City Debt Service Fund the net general property tax supported debt at year end was $120.8 million or $403 per capita. The City’s General Obligation bonds issued in 2014 received a Aa1 rating from Moody’s Investors Service, Inc. and continued their AAA rating from Standard & Poor’s Corporation. The Sewer Revenue bonds issued in 2014 received an AAA rating from Standard & Poor’s Corporation and a Aa1 rating from Moody’s Investors Service, Inc.
OUTSTANDING DEBT GENERAL OBLIGATION, REVENUE, LEASE REVENUE AND SALES TAX NOTES AND BONDS
(in thousands)
Total Percent
2014 2013 2014 2013 2014 2013 Change
General Obligation Bonds $225,815 $201,925 $ 21,525 $ 23,235 $247,340 $225,160 9.85%Limited Tax Bonds - - 7,755 7,855 7,755 7,855 (1.27)%Revenue Bonds - - 75,675 71,910 75,675 71,910 5.24%Sales Tax Revenue Bonds 110,830 78,160 - - 110,830 78,160 41.80%HRA Tax Increment Revenue Bonds 30,440 32,420 - - 30,440 32,420 (6.11)%HRA Parking Facilities Revenue Bonds - - 35,985 37,815 35,985 37,815 (4.84)%HRA Sales Tax Revenue Bonds - 31,430 - - - 31,430 (100.00)%HRA Lease Revenue Bonds 11,250 11,880 - - 11,250 11,880 (5.30)%General Obligation Notes 14,887 17,219 - - 14,887 17,219 (13.54)%Revenue Notes 61,470 31,250 6,366 7,563 67,836 38,813 74.78%HRA Revenue Notes 13,931 18,310 1,580 1,580 15,511 19,890 (22.02)%
Total $468,623 $422,594 $148,886 $149,958 $617,509 $572,552 7.85%
Governmental Activities Business-type Activities Total
Additional information on the City of Saint Paul’s long-term obligations can be found in Note VI.G in the Notes to the Financial Statements section of this report.
22

CITY OF SAINT PAUL, MINNESOTA
MANAGEMENT’S DISCUSSION AND ANALYSIS For Year Ended December 31, 2014
CURRENTLY KNOWN FACTS/ECONOMIC CONDITIONS Financial Outlook The City’s budget, and in particular the City General Fund, Public Library General Fund, and City Debt Service funds remain heavily influenced by state budget decisions to reduce state aid payments, called Local Government Aid (LGA). In 2008, 2009, 2010, 2011, and 2012 the State had a significant budget deficit and resolved it in part by sharply reducing aid payments to local governments. These reductions occurred each year after the City had adopted its annual budgets. The City made mid-year budget amendments using hiring and spending freezes, as well as a limited use of available fund balance in excess of its fund balance policy requirements. These actions brought the budget back in line with forecasted revenues. State aid payments are a significant source of financing for the City’s General Fund Budget. In the 2013 legislative session, the legislature increased LGA (Local Government Aid) to $60.4 million for 2014, which represents a $10.1 million from the 2013 certified amount. In 2014, the legislature again increased LGA for 2015 to $61.8 million, which represents a $1.4 million increase from the 2014 certified amount. The LGA increase approved during the 2013 and 2014 legislative sessions are a good step toward renewing a more balanced and predictable state/local fiscal relationship, which will help make local budget planning and service delivery more predictable for the citizens of Saint Paul. The Mayor is committed to working closely with the City Council to address any budgetary concerns by continued evaluation of management measures to restructure and resize service delivery systems, and the need for balanced growth in local revenues, while addressing the citizens’ concerns about both the current level of property taxation and preserving the scope and quality of municipal services.
23

CITY OF SAINT PAUL, MINNESOTA
MANAGEMENT’S DISCUSSION AND ANALYSIS For Year Ended December 31, 2014
CURRENTLY KNOWN FACTS/ECONOMIC CONDITIONS Employment Outlook The 2014 annual average unemployment rate for the City of Saint Paul was reported by the Bureau of Labor Statistics at 4.1%, compared to the state unemployment rate of 4.0% and a U.S. average rate of 6.2%. Saint Paul has a balanced, diversified employment base with no single industry sector dominating and is well-positioned to weather the current economic downturn. Employment is not overly reliant on slowing and cyclical sectors, like manufacturing, but is centered with stable and growing employment sectors. Saint Paul’s largest employment sector is education and health services (58,759 jobs in 2014, 33.2% of total). Other large sectors include public administration (22,859 jobs, 12.9%); professional and business services (21,073, 11.9%); and trade, transportation, and utilities (19,091 jobs, 10.8%) according to Minnesota Department of Employment and Economic Development. For 2014, Saint Paul employers paid an average of $55,523 annually compared to the 2013 average of $53,599, which represents an increase of 3.6%. An average wage in the Metro increased by 2.2% ($60,502 vs. $59,176) and by 2.6% statewide ($51,389 vs. $50,102) during the same period.
REQUESTS FOR INFORMATION The financial report is designed to provide our citizens, customers, investors and creditors with a general overview of the City’s finances. If you have questions about this report or need any additional information, contact the Office of Financial Services, Attn: Joy Thao, Deputy Finance Director, at 15 W. Kellogg Blvd., Room 700; Saint Paul, Minnesota 55102, call 651-266-8835, or e-mail [email protected]. General information relating to the City of Saint Paul, Minnesota, can be found at the City’s internet website, www.stpaul.gov.
24

The accompanying notes are an integral part of these financial statements.
City of Saint Paul, Minnesota Statement 1STATEMENT OF NET POSITION (Page 1 of 1)December 31, 2014
Governmental Business-TypeActivities Activities Total Component Units
ASSETSCash and Investments 270,732,555$ 43,947,251$ 314,679,806$ 18,942,624$ Investments - 6,323,160 6,323,160 19,957,430Receivables (Net of Allowance for Uncollectibles) 72,838,174 7,176,301 80,014,475 10,592,005Due from Xcel Energy 1,281,959 - 1,281,959 - Due from Component Units 191,360 2,879,056 3,070,416 - Due from Primary Government - - - 79,635Due from Other Governmental Units 33,728,862 438,200 34,167,062 972,070Advance to Component Units 185,480 - 185,480 - Internal Balances 5,024,150 (5,024,150) - - Inventories 11,920,041 7,620,821 19,540,862 2,074,513Other Assets 142,593 176,419 319,012 425,002Restricted Cash and Investments - 20,770,182 20,770,182 34,420,356Long Term Receivables 1,662,500 5,189,947 6,852,447 87,442,937Capital Assets Not Being Depreciated
Land 153,042,691 36,047,316 189,090,007 9,337,486Construction in Progress 159,954,602 4,068,620 164,023,222 19,877,596
Capital Assets Net of Accumulated DepreciationBuildings and Structures 343,106,445 124,037,693 467,144,138 60,549,268Improvements Other than Buildings 89,222,718 - 89,222,718 - Public Improvements - 263,321,385 263,321,385 207,882,267Equipment 43,726,292 2,418,231 46,144,523 25,350,220Infrastructure 456,313,060 - 456,313,060 -
Total Assets 1,643,073,482 519,390,432 2,162,463,914 497,903,409
DEFERRED OUTFLOWS OF RESOURCES Unrealized Loss on Derivatives 11,010,150 - 11,010,150 -
LIABILITIESAccounts Payable and Other Current Liabilities 27,565,030 1,638,457 29,203,487 11,832,802Accrued Salaries 11,708,051 415,957 12,124,008 801,688Due to Component Units - 79,635 79,635 - Due to Primary Government - - - 3,070,416Due to Other Governmental Units 6,656,452 239,966 6,896,418 2,186,075Advance from Primary Government - - - 185,480Liabilities Payable from Restricted Assets - 4,322,186 4,322,186 52,098,688Pollution Remediation Obligation 1,916,181 - 1,916,181 - Unearned Revenue 13,633,074 2,117,569 15,750,643 1,145,826Noncurrent Liabilities: Due Within One Year 46,726,936 7,250,325 53,977,261 - Due in More than One Year 549,951,338 183,052,275 733,003,613 129,082,469Total Liabilities 658,157,062 199,116,370 857,273,432 200,403,444
DEFERRED INFLOWS OF RESOURCES Interest Swap Derivative 11,010,150 - 11,010,150 -
NET POSITIONNet Investment in Capital Assets 884,350,146 249,527,566 1,133,877,712 226,853,137Restricted for: General Government 70,266,730 - 70,266,730 - Public Safety 4,034,133 - 4,034,133 - Highways and Streets 3,058,752 - 3,058,752 - Culture and Recreation 4,588,817 - 4,588,817 - Economic Development 2,763,992 - 2,763,992 - Debt Service 65,002,218 10,964,551 75,966,769 - Permanent Activities Expendable 14,518 - 14,518 - Nonexpendable 35,000 - 35,000 - Operations and Maintenance - 4,965,404 4,965,404 68,353,913 Grantors - 773,865 773,865 - Unrestricted (49,197,886) 54,042,676 4,844,790 2,292,915Total Net Position 984,916,420$ 320,274,062$ 1,305,190,482$ 297,499,965$
Primary Government
25

This page left blank intentionally
26
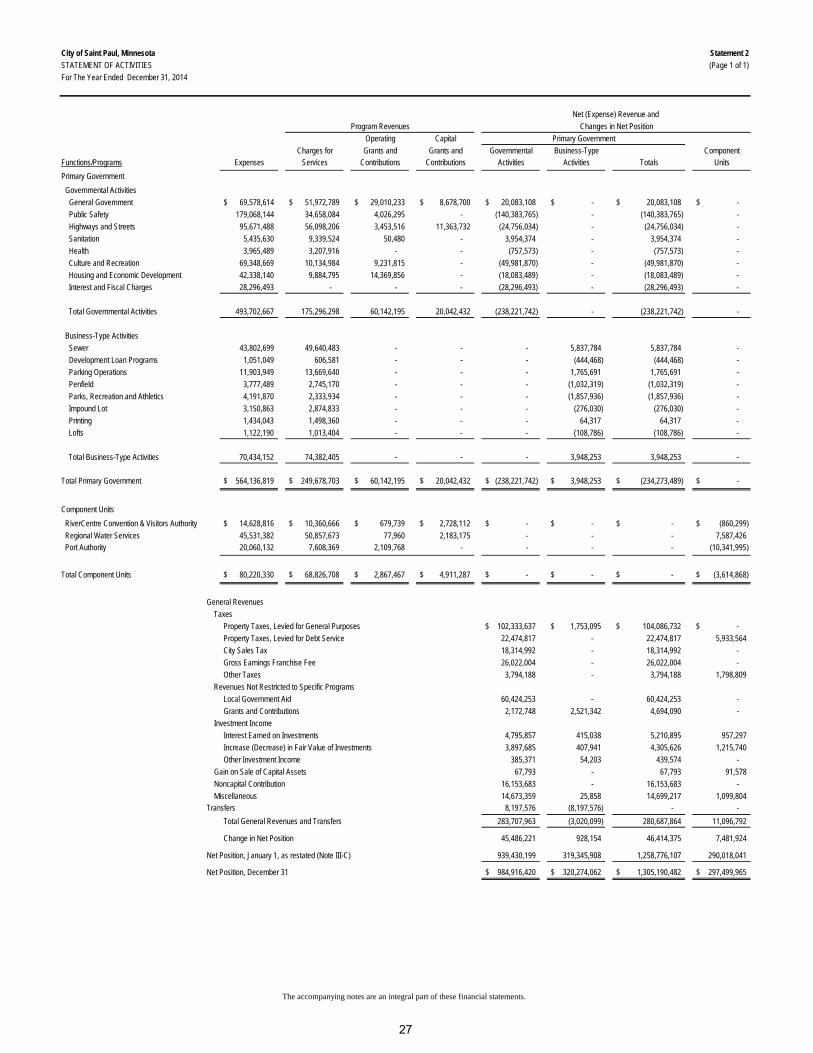
The accompanying notes are an integral part of these financial statements.
City of Saint Paul, Minnesota Statement 2STATEMENT OF ACTIVITIES (Page 1 of 1)For The Year Ended December 31, 2014
Program RevenuesOperating Capital
Charges for Grants and Grants and Governmental Business-Type ComponentFunctions/Programs Expenses Services Contributions Contributions Activities Activities Totals UnitsPrimary Government Governmental Activities General Government 69,578,614$ 51,972,789$ 29,010,233$ 8,678,700$ 20,083,108$ -$ 20,083,108$ -$ Public Safety 179,068,144 34,658,084 4,026,295 - (140,383,765) - (140,383,765) - Highways and Streets 95,671,488 56,098,206 3,453,516 11,363,732 (24,756,034) - (24,756,034) - Sanitation 5,435,630 9,339,524 50,480 - 3,954,374 - 3,954,374 - Health 3,965,489 3,207,916 - - (757,573) - (757,573) - Culture and Recreation 69,348,669 10,134,984 9,231,815 - (49,981,870) - (49,981,870) - Housing and Economic Development 42,338,140 9,884,795 14,369,856 - (18,083,489) - (18,083,489) - Interest and Fiscal Charges 28,296,493 - - - (28,296,493) - (28,296,493) -
Total Governmental Activities 493,702,667 175,296,298 60,142,195 20,042,432 (238,221,742) - (238,221,742) -
Business-Type Activities Sewer 43,802,699 49,640,483 - - - 5,837,784 5,837,784 - Development Loan Programs 1,051,049 606,581 - - - (444,468) (444,468) - Parking Operations 11,903,949 13,669,640 - - - 1,765,691 1,765,691 - Penfield 3,777,489 2,745,170 - - - (1,032,319) (1,032,319) - Parks, Recreation and Athletics 4,191,870 2,333,934 - - - (1,857,936) (1,857,936) - Impound Lot 3,150,863 2,874,833 - - - (276,030) (276,030) - Printing 1,434,043 1,498,360 - - - 64,317 64,317 - Lofts 1,122,190 1,013,404 - - - (108,786) (108,786) -
Total Business-Type Activities 70,434,152 74,382,405 - - - 3,948,253 3,948,253 -
Total Primary Government 564,136,819$ 249,678,703$ 60,142,195$ 20,042,432$ (238,221,742)$ 3,948,253$ (234,273,489)$ -$
Component Units RiverCentre Convention & Visitors Authority 14,628,816$ 10,360,666$ 679,739$ 2,728,112$ -$ -$ -$ (860,299)$ Regional Water Services 45,531,382 50,857,673 77,960 2,183,175 - - - 7,587,426 Port Authority 20,060,132 7,608,369 2,109,768 - - - - (10,341,995)
Total Component Units 80,220,330$ 68,826,708$ 2,867,467$ 4,911,287$ -$ -$ -$ (3,614,868)$
General Revenues Taxes
Property Taxes, Levied for General Purposes 102,333,637$ 1,753,095$ 104,086,732$ -$ Property Taxes, Levied for Debt Service 22,474,817 - 22,474,817 5,933,564 City Sales Tax 18,314,992 - 18,314,992 - Gross Earnings Franchise Fee 26,022,004 - 26,022,004 - Other Taxes 3,794,188 - 3,794,188 1,798,809
Revenues Not Restricted to Specific ProgramsLocal Government Aid 60,424,253 - 60,424,253 - Grants and Contributions 2,172,748 2,521,342 4,694,090 -
Investment IncomeInterest Earned on Investments 4,795,857 415,038 5,210,895 957,297 Increase (Decrease) in Fair Value of Investments 3,897,685 407,941 4,305,626 1,215,740 Other Investment Income 385,371 54,203 439,574 -
Gain on Sale of Capital Assets 67,793 - 67,793 91,578 Noncapital Contribution 16,153,683 - 16,153,683 - Miscellaneous 14,673,359 25,858 14,699,217 1,099,804
Transfers 8,197,576 (8,197,576) - - Total General Revenues and Transfers 283,707,963 (3,020,099) 280,687,864 11,096,792
Change in Net Position 45,486,221 928,154 46,414,375 7,481,924
Net Position, January 1, as restated (Note III-C) 939,430,199 319,345,908 1,258,776,107 290,018,041
Net Position, December 31 984,916,420$ 320,274,062$ 1,305,190,482$ 297,499,965$
Net (Expense) Revenue and Changes in Net Position
Primary Government
27

The accompanying notes are an integral part of these financial statements.
City of Saint Paul, Minnesota Statement 3BALANCE SHEET (Page 1 of 2)GOVERNMENTAL FUNDSDecember 31, 2014
Assessment Public Library HRA CityGeneral Financing General Fund General Fund Debt Service
ASSETS Cash and Investments with Treasurer 41,296,671$ 6,822,479$ 2,191,890$ 11,427,313$ 40,123,268$ Cash and Investments with Trustees - - - - 24,443,089 Imprest Funds 41,490 - - - - Receivables Property Taxes - Due from Ramsey County 1,105,851 - 236,726 43,223 175,354 Property Taxes - Delinquent 1,712,958 - 389,042 71,179 255,245 Accounts (net of allowance for estimated uncollectible) 2,944,494 402,434 - 168,713 - Assessments - 17,245,486 - - 14,299,958 Notes and Loans - - - - - Accrued Interest 354,914 - - 43,026 239,539 Due from Xcel Energy 1,254,008 - - - - Due from Other Funds 17,565,913 182,340 - - - Due from Component Units 191,360 - - - - Due from Other Governmental Units 1,586,585 - - - - Advance to Other Funds - - - 692,050 - Advance to Component Units 185,480 - - - - Land Held for Resale - - - 488,345 -
TOTAL ASSETS 68,239,724$ 24,652,739$ 2,817,658$ 12,933,849$ 79,536,453$
LIABILITIES, DEFERRED INFLOWS OFRESOURCES AND FUND BALANCES Liabilities Accrued Salaries Payable 8,485,110$ 2,306$ 534,398$ -$ 7,865$ Accounts Payable 5,088,016 30,189 171,384 106,894 9,250 Contracts/Retention Payable - - - 223,362 - Due to Other Funds 141,507 - - - - Due to Other Governmental Units 2,022,024 153 90,541 2,294 496 Assessments - - - - -
Advance from Other Funds 906,606 612,191 - - - Unearned Revenue - 467,214 - - -
Total Liabilities 16,643,263 1,112,053 796,323 332,550 17,611
Deferred Inflows of Resources Unavailable Revenue 2,155,610 17,040,767 407,156 579,059 14,516,624
Fund Balance Nonspendable 185,480 - - 692,050 - Restricted - - - - 65,002,218 Committed 251,841 - 1,175,969 6,370,768 - Assigned - 6,499,919 438,210 4,959,422 - Unassigned 49,003,530 - - - -
Total Fund Balances 49,440,851 6,499,919 1,614,179 12,022,240 65,002,218
TOTAL LIABILITIES, DEFERRED INFLOWS OFRESOURCES AND FUND BALANCES 68,239,724$ 24,652,739$ 2,817,658$ 12,933,849$ 79,536,453$
28

The accompanying notes are an integral part of these financial statements.
City of Saint Paul, Minnesota Statement 3BALANCE SHEET (Page 2 of 2)GOVERNMENTAL FUNDSDecember 31, 2014
Nonmajor TotalHRA City Capital Governmental Governmental
Debt Service Projects Funds Funds
ASSETS Cash and Investments with Treasurer 3,920,197$ 64,444,656$ 46,855,240$ 217,081,714$ Cash and Investments with Trustees 6,218,859 2,438,084 2,333,513 35,433,545 Imprest Funds - - 58,395 99,885 Receivables Property Taxes - Due from Ramsey County 125,103 - 103,309 1,789,566 Property Taxes - Delinquent 64,198 - 90,491 2,583,113 Accounts (net of allowance for estimated uncollectible) - 178,367 1,282,159 4,976,167 Assessments - - 21,049,539 52,594,983 Notes and Loans - - 8,856,297 8,856,297 Accrued Interest 67,656 320,678 252,881 1,278,694 Due from Xcel Energy - 27,951 - 1,281,959 Due from Other Funds - - 554,548 18,302,801 Due from Component Units - - - 191,360 Due from Other Governmental Units - 18,680,127 13,363,864 33,630,576 Advance to Other Funds - - 3,047,078 3,739,128 Advance to Component Units - - - 185,480 Land Held for Resale - - 8,394,599 8,882,944
TOTAL ASSETS 10,396,013$ 86,089,863$ 106,241,913$ 390,908,212$
LIABILITIES, DEFERRED INFLOWS OFRESOURCES AND FUND BALANCES Liabilities Accrued Salaries Payable -$ -$ 1,652,076$ 10,681,755$ Accounts Payable - 1,080,490 4,202,510 10,688,733 Contracts/Retention Payable - 11,201,331 - 11,424,693 Due to Other Funds - 1,526,056 7,190,280 8,857,843 Due to Other Governmental Units - 2,721,000 1,518,677 6,355,185 Assessments - - 599,240 599,240 Advance from Other Funds - 1,204,000 5,206,932 7,929,729 Unearned Revenue - - 12,195,078 12,662,292
Total Liabilities - 17,732,877 32,564,793 69,199,470
Deferred Inflows of Resources Unavailable Revenue 136,889 9,082,780 19,081,465 63,000,350
Fund Balance Nonspendable - - 3,082,078 3,959,608 Restricted 10,259,124 74,840,765 28,371,546 178,473,653 Committed - - 12,142,564 19,941,142 Assigned - - 15,549,049 27,446,600 Unassigned - (15,566,559) (4,549,582) 28,887,389
Total Fund Balances 10,259,124 59,274,206 54,595,655 258,708,392
TOTAL LIABILITIES, DEFERRED INFLOWS OFRESOURCES AND FUND BALANCES 10,396,013$ 86,089,863$ 106,241,913$ 390,908,212$
29

This page left blank intentionally
30
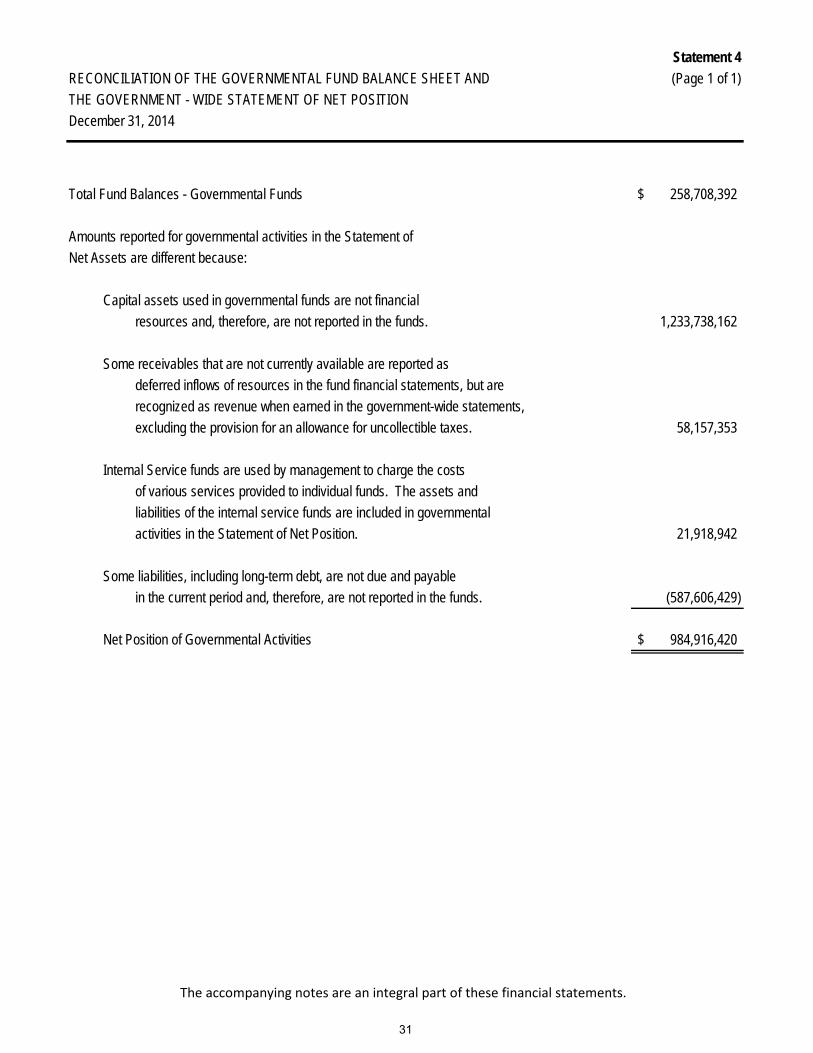
The accompanying notes are an integral part of these financial statements.
Statement 4(Page 1 of 1)
Total Fund Balances - Governmental Funds 258,708,392$
Net Assets are different because:
Capital assets used in governmental funds are not financialresources and, therefore, are not reported in the funds. 1,233,738,162
Some receivables that are not currently available are reported as deferred inflows of resources in the fund financial statements, but arerecognized as revenue when earned in the government-wide statements,excluding the provision for an allowance for uncollectible taxes. 58,157,353
Internal Service funds are used by management to charge the costsof various services provided to individual funds. The assets and liabilities of the internal service funds are included in governmental activities in the Statement of Net Position. 21,918,942
Some liabilities, including long-term debt, are not due and payable in the current period and, therefore, are not reported in the funds. (587,606,429)
984,916,420$
RECONCILIATION OF THE GOVERNMENTAL FUND BALANCE SHEET ANDTHE GOVERNMENT - WIDE STATEMENT OF NET POSITIONDecember 31, 2014
Amounts reported for governmental activities in the Statement of
Net Position of Governmental Activities
31
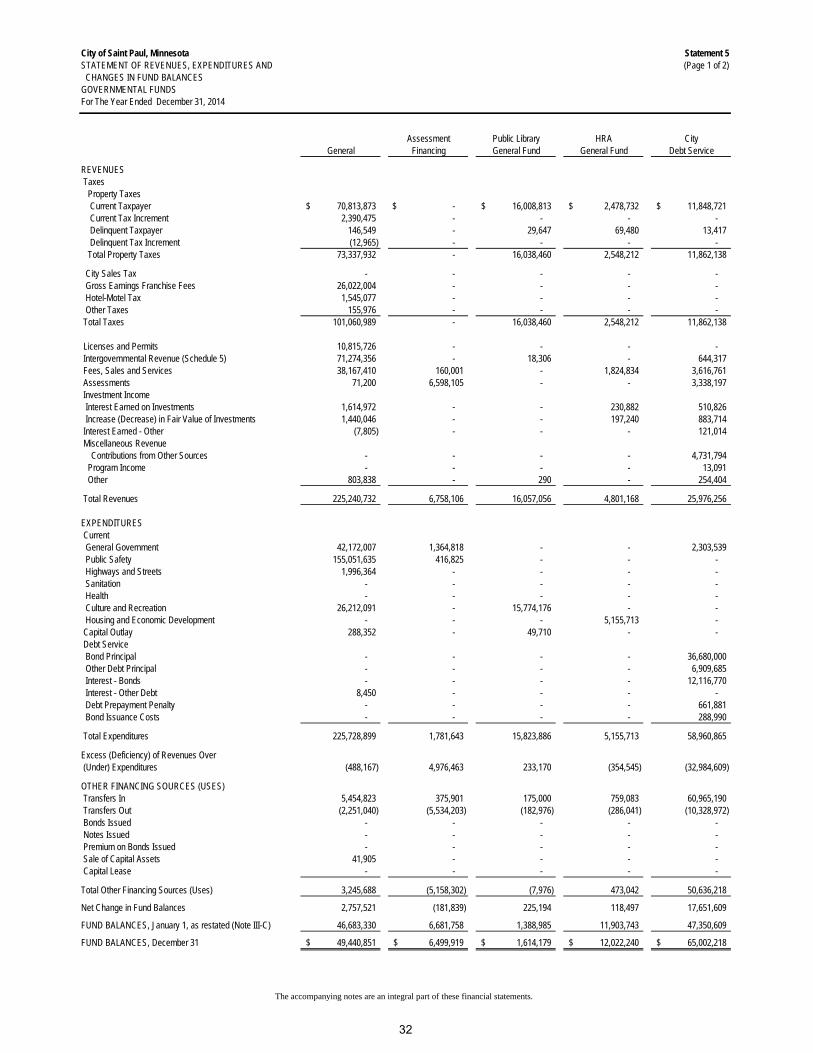
The accompanying notes are an integral part of these financial statements.
City of Saint Paul, Minnesota Statement 5STATEMENT OF REVENUES, EXPENDITURES AND (Page 1 of 2) CHANGES IN FUND BALANCESGOVERNMENTAL FUNDS
Assessment Public Library HRA CityGeneral Financing General Fund General Fund Debt Service
REVENUES Taxes Property Taxes Current Taxpayer 70,813,873$ -$ 16,008,813$ 2,478,732$ 11,848,721$ Current Tax Increment 2,390,475 - - - - Delinquent Taxpayer 146,549 - 29,647 69,480 13,417 Delinquent Tax Increment (12,965) - - - - Total Property Taxes 73,337,932 - 16,038,460 2,548,212 11,862,138
City Sales Tax - - - - - Gross Earnings Franchise Fees 26,022,004 - - - - Hotel-Motel Tax 1,545,077 - - - - Other Taxes 155,976 - - - - Total Taxes 101,060,989 - 16,038,460 2,548,212 11,862,138
Licenses and Permits 10,815,726 - - - - Intergovernmental Revenue (Schedule 5) 71,274,356 - 18,306 - 644,317 Fees, Sales and Services 38,167,410 160,001 - 1,824,834 3,616,761 Assessments 71,200 6,598,105 - - 3,338,197 Investment Income Interest Earned on Investments 1,614,972 - - 230,882 510,826 Increase (Decrease) in Fair Value of Investments 1,440,046 - - 197,240 883,714 Interest Earned - Other (7,805) - - - 121,014 Miscellaneous Revenue
Contributions from Other Sources - - - - 4,731,794 Program Income - - - - 13,091 Other 803,838 - 290 - 254,404
Total Revenues 225,240,732 6,758,106 16,057,056 4,801,168 25,976,256
EXPENDITURES Current General Government 42,172,007 1,364,818 - - 2,303,539 Public Safety 155,051,635 416,825 - - - Highways and Streets 1,996,364 - - - - Sanitation - - - - - Health - - - - - Culture and Recreation 26,212,091 - 15,774,176 - - Housing and Economic Development - - - 5,155,713 - Capital Outlay 288,352 - 49,710 - - Debt Service Bond Principal - - - - 36,680,000 Other Debt Principal - - - - 6,909,685 Interest - Bonds - - - - 12,116,770 Interest - Other Debt 8,450 - - - - Debt Prepayment Penalty - - - - 661,881 Bond Issuance Costs - - - - 288,990
Total Expenditures 225,728,899 1,781,643 15,823,886 5,155,713 58,960,865
Excess (Deficiency) of Revenues Over (Under) Expenditures (488,167) 4,976,463 233,170 (354,545) (32,984,609)
OTHER FINANCING SOURCES (USES) Transfers In 5,454,823 375,901 175,000 759,083 60,965,190 Transfers Out (2,251,040) (5,534,203) (182,976) (286,041) (10,328,972) Bonds Issued - - - - - Notes Issued - - - - - Premium on Bonds Issued - - - - - Sale of Capital Assets 41,905 - - - - Capital Lease - - - - -
Total Other Financing Sources (Uses) 3,245,688 (5,158,302) (7,976) 473,042 50,636,218
Net Change in Fund Balances 2,757,521 (181,839) 225,194 118,497 17,651,609
FUND BALANCES, January 1, as restated (Note III-C) 46,683,330 6,681,758 1,388,985 11,903,743 47,350,609
FUND BALANCES, December 31 49,440,851$ 6,499,919$ 1,614,179$ 12,022,240$ 65,002,218$
For The Year Ended December 31, 2014
32

The accompanying notes are an integral part of these financial statements.
City of Saint Paul, Minnesota Statement 5STATEMENT OF REVENUES, EXPENDITURES AND (Page 2 of 2) CHANGES IN FUND BALANCESGOVERNMENTAL FUNDSFor The Year Ended December 31, 2014
Nonmajor TotalHRA General City Capital Governmental GovernmentalDebt Service Projects Funds Funds
REVENUES Taxes Property Taxes Current Taxpayer -$ -$ -$ 101,150,139$ Current Tax Increment 9,695,870 - 10,139,471 22,225,816 Delinquent Taxpayer - - - 259,093 Delinquent Tax Increment - - - (12,965) Total Property Taxes 9,695,870 - 10,139,471 123,622,083
City Sales Tax - - 18,314,992 18,314,992 Gross Earnings Franchise Fees - - - 26,022,004 Hotel-Motel Tax - - 1,982,481 3,527,558 Other Taxes - - 145,748 301,724 Total Taxes 9,695,870 - 30,582,692 171,788,361
Licenses and Permits - - 356,172 11,171,898 Intergovernmental Revenue (Schedule 5) - 33,156,312 25,134,648 130,227,939 Fees, Sales and Services 586,204 1,680,935 28,911,571 74,947,716 Assessments - - 34,937,705 44,945,207 Investment Income Interest Earned on Investments 170,447 1,419,867 639,157 4,586,151 Increase (Decrease) in Fair Value of Investments 204,155 759,519 418,686 3,903,360 Interest Earned - Other - - 157,675 270,884 Miscellaneous Revenue - Contributions from Other Sources - 15,454,418 - 20,186,212 Program Income - 1,744,360 61,501 1,818,952 Other 521,645 611,150 6,809,994 9,001,321
Total Revenues 11,178,321 54,826,561 128,009,801 472,848,001
EXPENDITURES Current General Government - 153,248 4,674,994 50,668,606 Public Safety - 291,804 13,315,167 169,075,431 Highways and Streets - 13,363,219 37,242,832 52,602,415 Sanitation - - 5,438,602 5,438,602 Health - - 3,355,469 3,355,469 Culture and Recreation - 71,948 16,721,868 58,780,083 Housing and Economic Development 452,565 6,135 27,001,958 32,616,371 Capital Outlay - 91,506,196 2,052,406 93,896,664 Debt Service Bond Principal 36,920,000 - - 73,600,000 Other Debt Principal 597,252 - 175,589 7,682,526 Interest - Bonds 7,054,576 - - 19,171,346 Interest - Other Debt 328,346 497 3,209,265 3,546,558 Debt Prepayment Penalty 757,271 - - 1,419,152 Bond Issuance Costs 56,887 1,266,000 - 1,611,877
Total Expenditures 46,166,897 106,659,047 113,188,150 573,465,100
Excess (Deficiency) of Revenues Over (Under) Expenditures (34,988,576) (51,832,486) 14,821,651 (100,617,099)
OTHER FINANCING SOURCES (USES) Transfers In 44,702,335 4,728,658 18,469,934 135,630,924 Transfers Out (13,170,091) (63,201,682) (29,594,533) (124,549,538) Bonds Issued 1,995,000 94,125,000 - 96,120,000 Notes Issued - 33,720,000 - 33,720,000 Premium on Bonds Issued 11,611 10,099,655 - 10,111,266 Sale of Capital Assets - 65,285 340,048 447,238 Capital Lease - - 2,295,600 2,295,600
Total Other Financing Sources (Uses) 33,538,855 79,536,916 (8,488,951) 153,775,490
Net Change in Fund Balances (1,449,721) 27,704,430 6,332,700 53,158,391
FUND BALANCES, January 1, as restated (Note III-C) 11,708,845 31,569,776 48,262,955 205,550,001
FUND BALANCES, December 31 10,259,124$ 59,274,206$ 54,595,655$ 258,708,392$
33

This page left blank intentionally
34

The accompanying notes are an integral part of these financial statements.
Statement 6RECONCILIATION OF THE STATEMENT OF REVENUES, (Page 1 of 1)EXPENDITURES AND CHANGESIN FUND BALANCES OF GOVERNMENTAL FUNDSTO THE STATEMENT OF ACTIVITIESFor The Fiscal Year Ended December 31, 2014
Net Change in Fund Balances - Total Governmental Funds 53,158,391$
Amounts reported for governmental activities in the Statement of Activitiesare different because:
Governmental funds report capital outlay as expenditures. However, in the Statement of Net Position, the cost of these assets is capitalized and depreciated over their estimated useful lives with depreciation expense reported in the Statement of Activities. 52,197,944
Net effect of various miscellaneous transactions involving capital assets (i.e., sales, trade-ins, retirements and contributions ) is to increase or decrease net assets 59,072
Receivables not currently available are reported as deferred inflows of resources in the fund financial statements but are recognized as revenue when earned in the government-wide financial statements. 803,801
Debt and lease proceeds provide current financial resources to governmental funds, but issuing these obligations increases long-term liabilities in the Statement of Net Position. Repayment of principal is an expenditure in the governmental funds, but the repayment reduces long-term liabilities in the Statement of Net Position. (47,033,687) Governmental funds report the effect of premiums and discounts, and similar items when debt is first issued, whereas these amounts are deferred and amortized in the Statement of Activities. (8,865,271)
Some expenses in the Statement of Activities do not require the use of current financial resources and, therefore, are not reported as expenditures in the governmental funds. (6,499,525)
Internal Service funds are used by management to charge the costs of various services provided to individual funds. The net revenues of certain activities of internal service funds are reported with governmental activities. 1,665,496
Change in Net Position of Governmental Activities 45,486,221$
35

The accompanying notes are an integral part of these financial statements.
City of Saint Paul, Minnesota Statement 7STATEMENT OF NET POSITION (Page 1 of 2)PROPRIETARY FUNDSDecember 31, 2014
GovernmentalNonmajor Activities -Enterprise Internal Service
Sewer Utility HRA Loan HRA Parking HRA Penfield Funds Totals Funds
ASSETSCurrent Assets
Cash and Investments with Treasurer 21,256,293$ 6,250,045$ 10,831,281$ 1$ 10,268$ 38,347,888$ 16,906,461$ Cash with Fiscal Agents - - 1,041,927 3,817,270 178,367 5,037,564 - Cash and Investments with Trustees - 560,049 - - - 560,049 1,210,000 Imprest Funds 150 - - - 1,600 1,750 950 Restricted Cash and Cash Equivalents 14,809,091 - 5,225,335 - 735,756 20,770,182 - Receivables
Delinquent Taxes Receivable - - 82,646 - - 82,646 - Accounts - net 14,428 - 730,297 85,124 90,261 920,110 759,354 Assessments - net 6,058,643 17,157 - - - 6,075,800 - Accrued Interest 20,885 38,510 22,764 - 15,586 97,745 -
Due from Other Funds 4,319 - - - - 4,319 1,022,389 Due from Component Units 2,879,056 - - - - 2,879,056 - Due from Other Governmental Units - 12,399 - - 425,801 438,200 98,286 Inventories 112,630 - - - 286,170 398,800 3,037,097 Prepaid Items - - - 95,657 - 95,657 4,654,445 Land Held for Resale - 7,222,021 - - - 7,222,021 -
Total Current Assets 45,155,495 14,100,181 17,934,250 3,998,052 1,743,809 82,931,787 27,688,982
Noncurrent AssetsRestricted Assets
Investment for Revenue Bond Future Debt Service 5,656,410 - - - - 5,656,410 - Investment for Revenue Bond Construction - - - - 666,750 666,750 -
Advance to Other Funds - 2,843,700 1,329,744 - - 4,173,444 1,540,244 Other Long-Term Loans Receivable - net - 4,227,804 236,250 - - 4,464,054 1,662,500 Accrued Interest Receivable on Loans - net - 642,888 83,005 - - 725,893 - Capital Assets
Land 787,113 - 27,247,487 3,560,000 4,452,716 36,047,316 87,343 Buildings and Structures 3,347,053 - 108,224,388 53,767,436 11,922,843 177,261,720 14,448,239 Less: Accumulated Depreciation (968,195) - (48,523,084) (1,300,491) (2,432,257) (53,224,027) (9,780,568) Public Improvements 403,153,728 - - - 48,287 403,202,015 - Less: Accumulated Depreciation (139,854,728) - - - (25,902) (139,880,630) - Equipment 2,765,632 - 2,336,972 22,804 2,775,229 7,900,637 27,728,708 Less: Accumulated Depreciation (2,035,415) - (976,758) - (2,470,233) (5,482,406) (21,045,778) Construction in Progress 4,068,620 - - - - 4,068,620 189,702
Total Noncurrent Assets 276,920,218 7,714,392 89,958,004 56,049,749 14,937,433 445,579,796 14,830,390
TOTAL ASSETS 322,075,713$ 21,814,573$ 107,892,254$ 60,047,801$ 16,681,242$ 528,511,583$ 42,519,372$
Business-Type Activities - Enterprise Funds
36
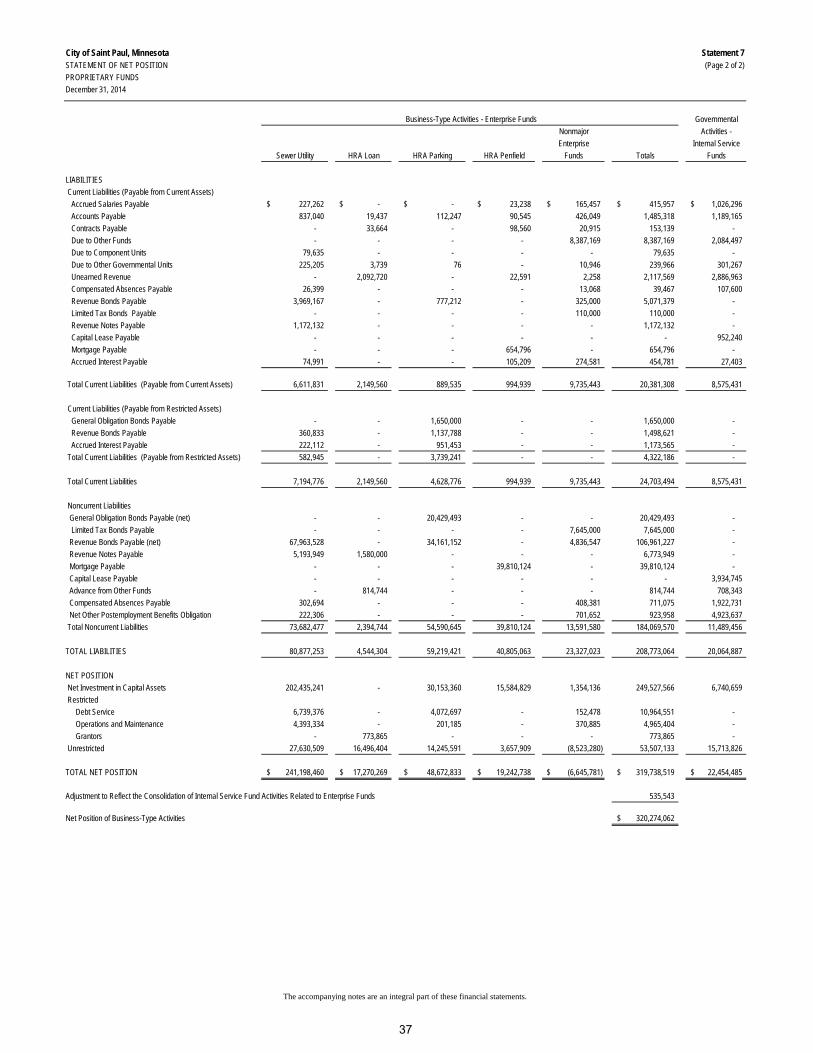
The accompanying notes are an integral part of these financial statements.
City of Saint Paul, Minnesota Statement 7STATEMENT OF NET POSITION (Page 2 of 2)PROPRIETARY FUNDSDecember 31, 2014
GovernmentalNonmajor Activities -Enterprise Internal Service
Sewer Utility HRA Loan HRA Parking HRA Penfield Funds Totals Funds
LIABILITIES Current Liabilities (Payable from Current Assets) Accrued Salaries Payable 227,262$ -$ -$ 23,238$ 165,457$ 415,957$ 1,026,296$ Accounts Payable 837,040 19,437 112,247 90,545 426,049 1,485,318 1,189,165 Contracts Payable - 33,664 - 98,560 20,915 153,139 - Due to Other Funds - - - - 8,387,169 8,387,169 2,084,497 Due to Component Units 79,635 - - - - 79,635 - Due to Other Governmental Units 225,205 3,739 76 - 10,946 239,966 301,267 Unearned Revenue - 2,092,720 - 22,591 2,258 2,117,569 2,886,963 Compensated Absences Payable 26,399 - - - 13,068 39,467 107,600 Revenue Bonds Payable 3,969,167 - 777,212 - 325,000 5,071,379 - Limited Tax Bonds Payable - - - - 110,000 110,000 - Revenue Notes Payable 1,172,132 - - - - 1,172,132 - Capital Lease Payable - - - - - - 952,240 Mortgage Payable - - - 654,796 - 654,796 - Accrued Interest Payable 74,991 - - 105,209 274,581 454,781 27,403
Total Current Liabilities (Payable from Current Assets) 6,611,831 2,149,560 889,535 994,939 9,735,443 20,381,308 8,575,431
Current Liabilities (Payable from Restricted Assets) General Obligation Bonds Payable - - 1,650,000 - - 1,650,000 - Revenue Bonds Payable 360,833 - 1,137,788 - - 1,498,621 - Accrued Interest Payable 222,112 - 951,453 - - 1,173,565 - Total Current Liabilities (Payable from Restricted Assets) 582,945 - 3,739,241 - - 4,322,186 -
Total Current Liabilities 7,194,776 2,149,560 4,628,776 994,939 9,735,443 24,703,494 8,575,431
Noncurrent Liabilities General Obligation Bonds Payable (net) - - 20,429,493 - - 20,429,493 - Limited Tax Bonds Payable - - - - 7,645,000 7,645,000 - Revenue Bonds Payable (net) 67,963,528 - 34,161,152 - 4,836,547 106,961,227 - Revenue Notes Payable 5,193,949 1,580,000 - - - 6,773,949 - Mortgage Payable - - - 39,810,124 - 39,810,124 - Capital Lease Payable - - - - - - 3,934,745 Advance from Other Funds - 814,744 - - - 814,744 708,343 Compensated Absences Payable 302,694 - - - 408,381 711,075 1,922,731 Net Other Postemployment Benefits Obligation 222,306 - - - 701,652 923,958 4,923,637 Total Noncurrent Liabilities 73,682,477 2,394,744 54,590,645 39,810,124 13,591,580 184,069,570 11,489,456
TOTAL LIABILITIES 80,877,253 4,544,304 59,219,421 40,805,063 23,327,023 208,773,064 20,064,887
NET POSITION Net Investment in Capital Assets 202,435,241 - 30,153,360 15,584,829 1,354,136 249,527,566 6,740,659 Restricted
Debt Service 6,739,376 - 4,072,697 - 152,478 10,964,551 - Operations and Maintenance 4,393,334 - 201,185 - 370,885 4,965,404 - Grantors - 773,865 - - - 773,865 -
Unrestricted 27,630,509 16,496,404 14,245,591 3,657,909 (8,523,280) 53,507,133 15,713,826
TOTAL NET POSITION 241,198,460$ 17,270,269$ 48,672,833$ 19,242,738$ (6,645,781)$ 319,738,519$ 22,454,485$
Adjustment to Reflect the Consolidation of Internal Service Fund Activities Related to Enterprise Funds 535,543
Net Position of Business-Type Activities 320,274,062$
Business-Type Activities - Enterprise Funds
37

This page left blank intentionally
38

The accompanying notes are an integral part of these financial statements.
City of Saint Paul, Minnesota Statement 8STATEMENT OF REVENUES, EXPENSES (Page 1 of 1) AND CHANGES IN FUND NET POSITIONPROPRIETARY FUNDSFor the Fiscal Year Ended December 31, 2014
GovernmentalNonmajor Activities -Enterprise Internal Service
Sewer Utility HRA Loan HRA Parking HRA Penfield Funds Totals Funds
OPERATING REVENUES Fees, Sales and Services 49,598,447$ 524,197$ 13,669,640$ 2,745,170$ 7,182,358$ 73,719,812$ 52,341,226$ Rents and Leases - - - - 529,339 529,339 1,953,151 Interest Earned on Loans - 82,384 - - - 82,384 296,843 Miscellaneous 42,036 - - - 8,834 50,870 228,155
Total Operating Revenues 49,640,483 606,581 13,669,640 2,745,170 7,720,531 74,382,405 54,819,375
OPERATING EXPENSES Cost of Merchandise Sold - - - - 183,678 183,678 293,791 Salaries 3,490,893 - - - 2,532,455 6,023,348 16,413,764 Employee Fringe Benefits 1,702,807 - - - 1,176,655 2,879,462 9,974,889 Services 30,325,189 1,040,210 6,245,457 1,038,832 3,071,936 41,721,624 9,117,433 Materials and Supplies 457,027 - - - 767,695 1,224,722 11,931,387 Depreciation 5,192,436 - 3,052,752 1,300,492 418,505 9,964,185 1,742,383 Bad Debts - - - - - - 32,041 Miscellaneous 1,538,934 - - - 23,985 1,562,919 28,534
Total Operating Expenses 42,707,286 1,040,210 9,298,209 2,339,324 8,174,909 63,559,938 49,534,222
OPERATING INCOME (LOSS) 6,933,197 (433,629) 4,371,431 405,846 (454,378) 10,822,467 5,285,153
NON-OPERATING REVENUES (EXPENSES) Property Tax Increment - - 1,102,365 - 650,730 1,753,095 - Intergovernmental Revenue (Schedule 5) 338,672 712,632 51,224 1,261,515 157,299 2,521,342 - Gain on Sale of Capital Assets - - - - - - 67,793 Loss on Retirement of Capital Assets - - (176,348) - - (176,348) - Investment Income Interest Earned on Investments 51,795 225,497 93,046 89 44,611 415,038 15 Increase (Decrease) in Fair Value of Investments 183,090 118,260 88,077 - 18,514 407,941 (5,675) Interest Earned - Other 47,069 - - - 7,134 54,203 13,270 Miscellaneous Other Revenue (Expenses) - (10,839) 25,858 (226,425) (1,836) (213,242) 3,800 Interest Expense General Obligation Bonds - - (686,090) - - (686,090) - Revenue Bonds (2,333,938) - (1,743,302) - (246,830) (4,324,070) - Limited Tax Bonds - - - - (510,105) (510,105) - Capital Lease - - - - - - (125,379) Revenue Notes (249,136) - - - - (249,136) -
Mortgage - - - (1,211,740) - (1,211,740) - Advance from Other Funds - - - - - - (15,486) Bond Issuance Costs (151,810) - - - - (151,810) -
Total Non-Operating Revenues (Expenses) (2,114,258) 1,045,550 (1,245,170) (176,561) 119,517 (2,370,922) (61,662) Income (Loss) Before Transfers 4,818,939 611,921 3,126,261 229,285 (334,861) 8,451,545 5,223,491
Transfers In - 1,903,282 - - 230,000 2,133,282 597,471 Transfers Out (5,700,140) (1,682,120) (670,079) (1,261,515) (1,017,004) (10,330,858) (3,481,281)
Change in Net Position (881,201) 833,083 2,456,182 (1,032,230) (1,121,865) 253,969 2,339,681
NET POSITION, January 1, as restated (Note III-C) 242,079,661 16,437,186 46,216,651 20,274,968 (5,523,916) 20,114,804
NET POSITION, December 31 241,198,460$ 17,270,269$ 48,672,833$ 19,242,738$ (6,645,781)$ 22,454,485$
Adjustment to Reflect the Consolidation of Internal Service Fund Activities Related to Enterprise Funds 674,185
Total change in net position of business-type activities 928,154$
Business Type Activities - Enterprise Funds
39

The accompanying notes are an integral part of these financial statements.
City of Saint Paul, Minnesota Statement 9STATEMENT OF CASH FLOWS (Page 1 of 2)PROPRIETARY FUNDSFor the Fiscal Year Ended December 31, 2014
GovernmentalNonmajor Activities - Enterprise Internal
Sewer Utility HRA Loan HRA Parking HRA Penfield Funds Total Service Funds
CASH FLOWS FROM OPERATING ACTIVITIES Receipts from Loan Recipients and Other Customers 48,867,146$ 919,780$ 13,349,706$ 2,593,342$ 6,889,690$ 72,619,664$ 14,323,302$ Receipts from Other Funds for Services Provided 707,838 - - - 934,993 1,642,831 33,009,489 Other Operating Receipts - - - 86,030 524 86,554 7,172 Payment to Suppliers (21,853,830) (1,450,298) (7,153,075) (2,414,898) (2,296,124) (35,168,225) (13,430,450) Payment to Employees (3,394,689) - - - (2,524,937) (5,919,626) (12,476,045) Payment for Fringe Benefits and Payroll Taxes (1,683,081) - - - (1,141,479) (2,824,560) (6,992,976) Payment to Other Funds for Services Used (10,298,579) - - (592,113) (10,890,692) (5,763,276) Other Operating Payments - - - - (418,987) (418,987) 947,445
NET CASH PROVIDED (USED) BY OPERATING ACTIVITIES 12,344,805 (530,518) 6,196,631 264,474 851,567 19,126,959 9,624,661
CASH FLOWS FROM NONCAPITAL FINANCING ACTIVITIES Transfers In from Other Funds - 1,912,575 82,945 - 230,000 2,225,520 597,471 Transfers Out to Other Funds (5,700,140) (1,682,120) (670,079) (1,261,515) (1,017,004) (10,330,858) (3,853,662) Property Tax Increments - - 1,114,908 - 650,730 1,765,638 - Operating Grants Received 338,672 712,632 - - 157,299 1,208,603 - Advance Received From Other Funds - - - - 103,919 103,919 1,675,108 Repayment of Advance Made to Other Funds - 78,182 295,323 - - 373,505 - Advance Made to Other Funds - - - - - - (1,543,868) Repayment of Advance Received from Other Funds - - - - (511,918) (511,918) (624,936) Interest Paid on Advance Received from Other Funds - - - - - - (3,678) Collection of an Advance to Other Funds - - - - - - 807,456
NET CASH PROVIDED (USED) BY NONCAPITAL FINANCING ACTIVITIES (5,361,468) 1,021,269 823,097 (1,261,515) (386,974) (5,165,591) (2,946,109)
CASH FLOWS FROM CAPITAL AND RELATED FINANCING ACTIVITIES Capital Grants - - - 1,261,515 - 1,261,515 - Proceeds from Issuance of Long-term Debt - - - 7,570,610 (663,296) 6,907,314 - Proceeds from Issuance of Revenue Bonds 8,313,993 - - - - 8,313,993 - Proceeds from Reserves - - 1,282,120 - 1,282,120 - Proceeds from Sale of Capital Assets - Equipment - - - - - - 10,000 Principal Paid On General Obligation Bonds - - (1,710,000) - - (1,710,000) - Revenue Bonds (3,925,000) - (1,830,000) - - (5,755,000) - Revenue Notes (1,196,688) - - - - (1,196,688) - Capital Lease - - - - - - 359,516
Long-term Debt - - - (477,800) - (477,800) - Payments for Acquisition and Construction of Capital Assets Land (298,678) - - - - (298,678) - Buildings and Structures - - (584,862) - - (584,862) (13,588) Improvements Other Than Buildings - - (75,048) - - (75,048) - Public Improvements (11,582,727) - - - - (11,582,727) - Equipment (291,308) - (59,581) (9,088,413) (11,220) (9,450,522) (2,124,168) Construction in Progress (399,649) - - - (399,649) - Interest Paid On General Obligation Bonds - - (783,616) - - (783,616) - Revenue Bonds (2,425,774) - (1,764,762) - - (4,190,536) - Capital Lease - - - - - - (122,615) Revenue Notes (262,858) - - - - (262,858) - Payments of Bond Issue Costs (151,810) - - - - (151,810) -
NET CASH PROVIDED (USED) IN CAPITAL AND RELATED FINANCING ACTIVITIES (12,220,499) - (6,807,869) 548,032 (674,516) (19,154,852) (1,890,855)
CASH FLOWS FROM INVESTING ACTIVITIESPurchase of Investment Securities (17) 21,160 - - - 21,143 - Escrow and Replacement Reserve - - - (777,005) - (777,005) - Operating Reserve and Replacement Reserve - - - (95,256) - (95,256) - Insurance and Tax Escrow Deposits (Net) - - - (289,777) - (289,777) - Security Deposits and Other Accounts - - - - 35,921 35,921 Investment Service Fee - (20,132) (5,863) - (1,836) (27,831) - Investment Securities Sold - - (79,286) - - (79,286) - Interest and Dividends Received 294,574 186,987 96,115 - 46,235 623,911 268 Increase (Decrease) in Fair Value of Investments 145,507 118,260 88,077 - 18,514 370,358 (5,675)
NET CASH PROVIDED (USED) BY INVESTING ACTIVITIES 440,064 306,275 99,043 (1,162,038) 98,834 (217,822) (5,407)
NET INCREASE (DECREASE) IN CASH AND CASH EQUIVALENTS (4,797,098) 797,026 310,902 (1,611,047) (111,089) (5,411,306) 4,782,290
CASH AND CASH EQUIVALENTS AT BEGINNING OF YEAR 40,862,632 6,013,068 16,787,641 5,428,318 1,037,080 70,128,739 13,335,121
CASH AND CASH EQUIVALENTS AT END OF YEAR 36,065,534$ 6,810,094$ 17,098,543$ 3,817,271$ 925,991$ 64,717,433$ 18,117,411$
Business-type Activities - Enterprise Funds
40

The accompanying notes are an integral part of these financial statements.
City of Saint Paul, Minnesota Statement 9STATEMENT OF CASH FLOWS (Page 2 of 2)PROPRIETARY FUNDSFor the Fiscal Year Ended December 31, 2014
GovernmentalNonmajor Activities -
HRA Loan Enterprise InternalSewer Utility Enterprise HRA Parking HRA Penfield Funds Total Service Funds
RECONCILIATION OF OPERATING INCOME (LOSS) TO NET CASH PROVIDED (USED) BY OPERATING ACTIVITIES Operating Income (Loss) 6,933,197$ (433,629)$ 4,371,431$ 405,846$ (454,378)$ 10,822,467$ 5,285,153$
Adjustments to Reconcile Operating Income to Net Cash Provided (Used) by Operating Activities Depreciation 5,192,436 - 3,052,752 1,300,492 418,505 9,964,185 1,742,383 Increase (Decrease) in Allowance for Uncollectible Accounts/Loans 44,829 (1,650,909) 71,989 - - (1,534,091) (125,992) Nonoperating Miscellaneous Other Revenue Received - - - - - 11,482 Changes in Assets and Liabilities (Increase) Decrease in Accounts Receivable (39,844) (16,223) (391,923) (84,539) (53,177) (585,706) (403,856) Assessments Receivable (122,860) - - - - (122,860) - Notes and Loans Receivable - 2,033,266 - - - 2,033,266 237,500 Accrued Interest Receivable - (158,991) - - - (158,991) - Due from Other Funds (4,319) - - - (230,262) (234,581) 1,652,273 Due from Component Units (120,929) - - - - (120,929) 25 Due from Other Governmental Units 177,767 (9,356) - - (483,582) (315,171) 241,808 Inventories (24,975) - - - 75,933 50,958 205,396 Prepaid Items - - - 7,736 - 7,736 (443,015) Land Held for Resale - 115,412 - - - 115,412 - Increase (Decrease) in Accrued Salaries Payable 96,203 - - 23,238 7,521 126,962 243,919 Accounts Payable 153,479 (28,708) (750,369) (8,584,959) (145,106) (9,355,663) 483,447
Mortgage Payable - - - 7,092,812 - 7,092,812 - Contracts and Retention Payable - 6,296 - 88,090 1,035 95,421 - Due to Other Funds (98,636) - - - 1,625,772 1,527,136 (91,185) Due to Component Units 4,471 - - - - 4,471 - Due to Other Governmental Units 187,973 (9,751) (152,353) - 8,811 34,680 274,495 Unearned Revenue - (377,925) (4,896) 15,758 - (367,063) (218,614) Compensated Absences Payable 31,066 - - - (23,402) 7,664 (97,482) Net Other Postemployment Benefits Obligation (65,053) - - - 103,897 38,844 626,924
Total Adjustments 5,411,608 (96,889) 1,825,200 (141,372) 1,305,945 8,304,492 4,339,508
NET CASH PROVIDED (USED) BY OPERATING ACTIVITIES 12,344,805$ (530,518)$ 6,196,631$ 264,474$ 851,567$ 19,126,959$ 9,624,661$
RECONCILIATION OF CASH AND CASH EQUIVALENTS TO THE STATEMENT OF NET ASSETS Cash and Investments with Treasurer 21,256,293$ 6,250,045$ 10,831,281$ 1$ 10,268$ 38,347,888$ 16,906,461$ Cash Held with Fiscal Agents - - 1,041,927 3,817,270 178,367 $5,037,564 - Cash and Investments with Trustees - 560,049 - - - $560,049 1,210,000 Imprest Funds 150 - - - 1,600 1,750 950 Restricted Cash and Investments 14,809,091 - 5,225,335 - 735,756 20,770,182 -
TOTAL CASH AND CASH EQUIVALENTS 36,065,534$ 6,810,094$ 17,098,543$ 3,817,271$ 925,991$ 64,717,433$ 18,117,411$
NONCASH INVESTING, CAPITAL AND FINANCING ACTIVITIES Capital Assets Purchased on Account Public Improvements 229,663$ -$ -$ -$ -$ 229,663$ -$ Equipment 120,000 - - - - 120,000 - Increase/(Decrease) in Fair Market Value of Investments 183,090 118,260 88,077 - 18,514 407,941 (5,675)
Business-type Activities - Enterprise Funds
41

This page left blank intentionally
42
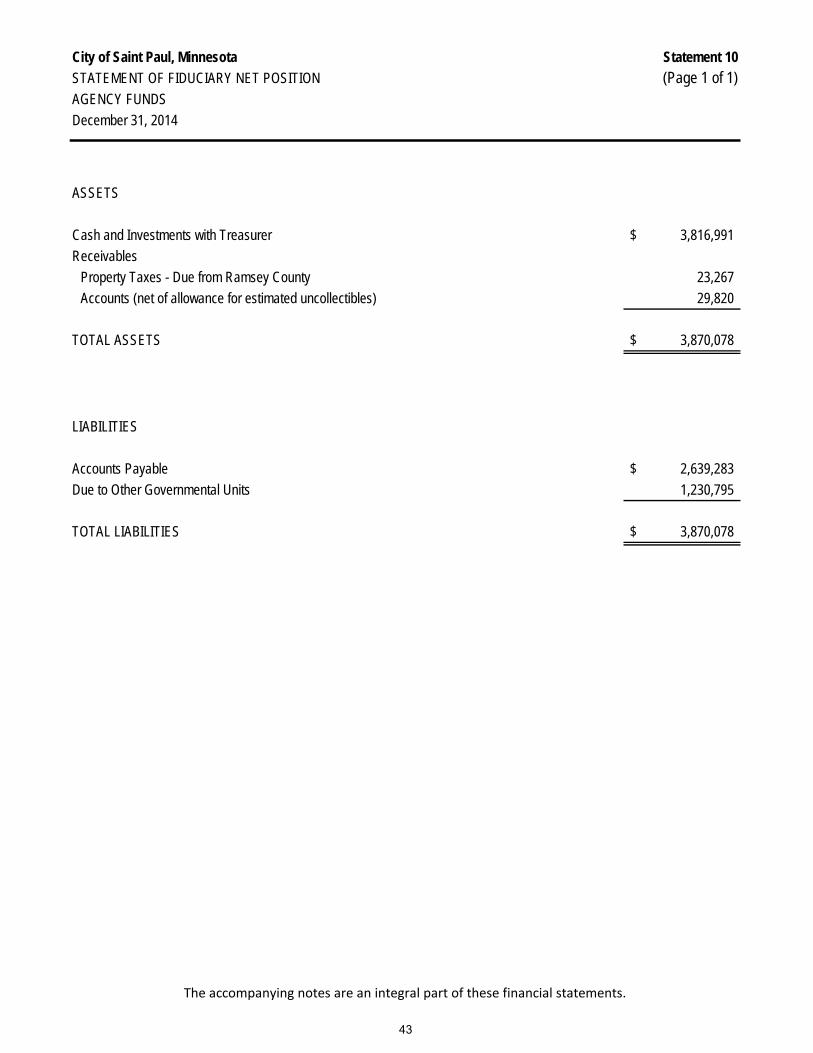
The accompanying notes are an integral part of these financial statements.
City of Saint Paul, Minnesota Statement 10STATEMENT OF FIDUCIARY NET POSITION (Page 1 of 1)AGENCY FUNDS
ASSETS
Cash and Investments with Treasurer 3,816,991$ Receivables
Property Taxes - Due from Ramsey County 23,267Accounts (net of allowance for estimated uncollectibles) 29,820
TOTAL ASSETS 3,870,078$
LIABILITIES Accounts Payable 2,639,283$ Due to Other Governmental Units 1,230,795
TOTAL LIABILITIES 3,870,078$
December 31, 2014
43

The accompanying notes are an integral part of these financial statements.
City of Saint Paul, Minnesota Statement 11STATEMENT OF NET POSITION (Page 1 of 2)ALL DISCRETELY PRESENTED COMPONENT UNITSDecember 31, 2014
RiverCentreConvention& Visitors RegionalAuthority Water Services Port Authority Total
ASSETS Current Assets Cash and Investments 3,350,857$ 10,849,135$ 4,536,971$ 18,736,963$ Investments - 6,087,013 13,870,417 19,957,430 Departmental Cash - 198,661 - 198,661 Imprest Funds - 7,000 - 7,000 Restricted Cash and Cash Equivalents Cash for Grants and Other Contributions - - 8,619,416 8,619,416 Cash for General Obligation Debt Service - - 2,030,556 2,030,556 Cash for Revenue Bond Debt Service - - 4,315,579 4,315,579 Investments for Revenue Bond Debt Service - 2,827,150 - 2,827,150 Investments for Revenue Note Debt Service - 2,088,206 - 2,088,206 Receivables Accounts (net of allowance for Estimated Uncollectibles) 1,173,984 4,909,380 883,966 6,967,330 Assessments - 3,453,032 - 3,453,032 Accrued Interest - 117,749 53,894 171,643 Due from Primary Government - 79,635 - 79,635 Due from Other Governmental Units - 972,070 - 972,070 Inventory - Materials and Supplies - 2,034,721 39,792 2,074,513 Prepaid Items 117,076 - 307,926 425,002 Total Current Assets 4,641,917 33,623,752 34,658,517 72,924,186
Noncurrent Assets Restricted Assets Cash for Operations 2,558,858 - - 2,558,858 Investments for Grants and Construction - - 3,047,041 3,047,041 Investments for Revenue Bond Future Debt Service - 4,915,357 - 4,915,357 Investments for Revenue Bond and Notes - - 1,252,884 1,252,884 Investments for Revenue Bond Operations and Maintenance - 1,731,626 1,033,683 2,765,309 Total Restricted Assets 2,558,858 6,646,983 5,333,608 14,539,449
Other Assets Other Long-Term Receivables - 96,463 27,736,922 27,833,385 Taxes Receivable - - 59,609,552 59,609,552 Total Other Assets - 96,463 87,346,474 87,442,937
Capital Assets Land - 1,307,907 8,029,579 9,337,486 Buildings and Structures - 56,160,030 59,123,919 115,283,949 Less: Accumulated Depreciation - (21,597,687) (33,136,994) (54,734,681) Public Improvements - 289,543,173 - 289,543,173 Less: Accumulated Depreciation - (81,660,906) - (81,660,906) Equipment 369,222 52,880,744 3,823,194 57,073,160 Less: Accumulated Depreciation (150,120) (29,679,811) (1,893,009) (31,722,940) Construction in Progress - 15,041,940 4,835,656 19,877,596 Total Capital Assets 219,102 281,995,390 40,782,345 322,996,837
Total Noncurrent Assets 2,777,960 288,738,836 133,462,427 424,979,223
Total Assets 7,419,877$ 322,362,588$ 168,120,944$ 497,903,409$
44

The accompanying notes are an integral part of these financial statements.
City of Saint Paul, Minnesota Statement 11STATEMENT OF NET POSITION (Page 2 of 2)ALL DISCRETELY PRESENTED COMPONENT UNITSDecember 31, 2014
RiverCentreConvention& Visitors RegionalAuthority Water Services Port Authority Total
LIABILITIES Current Liabilities (Payable from Current Assets) Accrued Salaries Payable -$ 697,354$ 32,767$ 730,121$ Compensated Absences Payable - 71,567 - 71,567 Claims and Judgments Payable - 625,000 - 625,000 Accounts Payable 1,473,421 1,788,399 7,664,286 10,926,106 Contract Retention Payable - 281,696 - 281,696 Due to Primary Government 191,360 2,879,056 - 3,070,416 Due to Other Governmental Units - 2,121,952 64,123 2,186,075 Unearned Revenue 515,930 378,106 251,790 1,145,826 Total Current Liabilities (Payable from Current Assets) 2,180,711 8,843,130 8,012,966 19,036,807
Current Liabilities (Payable from Restricted Assets) General Obligation Bonds - - 1,855,000 1,855,000 Revenue Bonds Payable - 2,345,000 21,671,047 24,016,047 Revenue Notes Payable - 1,833,754 770,470 2,604,224 Accrued Interest Payable General Obligation Bonds - - 528,177 528,177 Revenue Bonds - 40,179 22,688,499 22,728,678 Revenue Notes - 50,344 316,218 366,562 Total Current Liabilities (Payable from Restricted Assets) - 4,269,277 47,829,411 52,098,688
Total Current Liabilities 2,180,711 13,112,407 55,842,377 71,135,495
Noncurrent Liabilities General Obligation Bonds Payable - - 31,570,000 31,570,000 Add: Unamortized Premium - - 334,175 334,175 Revenue Bonds Payable - 15,805,000 33,710,000 49,515,000 Add: Unamortized Premium - 681,298 246,916 928,214 Revenue Notes Payable - 25,761,821 9,501,274 35,263,095 Less: Unamortized Discount - - (127,306) (127,306) Advance from Primary Government 185,480 - - 185,480 Compensated Absences Payable - 1,721,515 86,134 1,807,649 Net Other Postemployment Benefits Obligation - 4,133,270 77,274 4,210,544 Claims and Judgments Payable - 3,471,997 2,109,101 5,581,098 Total Noncurrent Liabilities 185,480 51,574,901 77,507,568 129,267,949
Total Liabilities 2,366,191 64,687,308 133,349,945 200,403,444
NET POSITION Net Investment in Capital Assets 219,102 235,568,517 (8,934,482) 226,853,137 Restricted - 11,471,816 56,882,097 68,353,913 Unrestricted 4,834,584 10,634,947 (13,176,616) 2,292,915 Total Net Position 5,053,686$ 257,675,280$ 34,770,999$ 297,499,965$
45

The accompanying notes are an integral part of these financial statements.
City of Saint Paul, Minnesota Statement 12STATEMENT OF ACTIVITIES (Page 1 of 1) ALL DISCRETELY PRESENTED COMPONENT UNITSFor The Fiscal Year Ended December 31, 2014
Program Revenues
Operating Capital RiverCentreCharges for Grants and Grants and Convention & Regional Water Port
Expenses Services Contributions Contributions Visitors Authority Services Authority Totals
RiverCentre Convention & Visitors Authority 14,628,816$ 10,360,666$ 679,739$ 2,728,112$ (860,299)$ -$ -$ (860,299)$
Regional Water Services 45,531,382 50,857,673 77,960 2,183,175 - 7,587,426 - 7,587,426
Port Authority 20,060,132 7,608,369 2,109,768 - - - (10,341,995) (10,341,995)
Total Component Units 80,220,330$ 68,826,708$ 2,867,467$ 4,911,287$ (860,299)$ 7,587,426$ (10,341,995)$ (3,614,868)$
General Revenues Taxes
Property Taxes, Levied for Debt Service -$ -$ 5,933,564$ 5,933,564$ Hotel/Motel Tax 1,798,809 - - 1,798,809
Investment IncomeInterest Earned on Investments 87,755 392,535 477,007 957,297 Increase (Decrease) in Fair Value of Investments 48,635 1,167,105 - 1,215,740
Gain on Sale of Capital Assets - 81,578 10,000 91,578 Miscellaneous 6,945 129,258 963,601 1,099,804
Total General Revenues 1,942,144 1,770,476 7,384,172 11,096,792
Change in Net Position 1,081,845 9,357,902 (2,957,823) 7,481,924
Net Position, January 1 3,971,841 248,317,378 37,728,822 290,018,041
Net Position, December 31 5,053,686$ 257,675,280$ 34,770,999$ 297,499,965$
Net (Expense) Revenue and Changes in Net Position
Component Units
46
City of Saint Paul, Minnesota NOTES TO THE FINANCIAL STATEMENTS For the Fiscal Year Ended December 31, 2014
Note I. Form of Government The City of Saint Paul, Minnesota has a mayor-council form of government. The mayor is elected by the voters of the City at large for four years on a full-time basis. The City is divided into seven wards. Voters of each ward elect a member of the City Council for four years on a part-time basis. Executive power is vested in the mayor; legislative power is vested in the Council. The mayor has veto power, which the Council may override with a vote of five members. Note II. Financial Reporting Entity In accordance with Governmental Accounting Standards Board (GASB) Statement No. 14 – The Financial Reporting Entity and GASB Statement No. 61 – The Financial Reporting Entity – Omnibus, the City’s financial reporting entity consists of (a) the primary government, (b) organizations for which the primary government is financially accountable, and (c) other organizations for which the nature and significance of their relationship with the primary government are such that exclusion would cause the reporting entity’s financial statements to be misleading or incomplete. Component units are legally separate organizations for which the elected officials of the primary government are financially accountable. The primary government is financially accountable for the component unit if it appoints a voting majority of the component unit’s governing body and is able to impose its will on the component unit or there is a potential for the component unit to provide specific financial benefits to, or impose specific financial burdens on, the primary government. As required by generally accepted accounting principles, the financial statements of the reporting entity include those of the City of Saint Paul (the primary government) and its component units (legally separate organizations). The component units discussed below are included in the City’s reporting entity because of the significance of their operational or financial relationship with the City. In conformity with generally accepted accounting principles, the financial statements of component units have been included in the City’s reporting entity either as blended component units or as discretely presented component units. Blended component units’ financial data is reported as part of the primary government and are reported with similar funds of the primary government. Discretely presented component units’ financial data is reported in a column separate from the financial data of the primary government to emphasize that they are legally separate from the City. Blended Component Units The following component units have been presented as blended component units because the component units’ governing bodies are the same as the governing body of the City and a financial benefit or burden relationship exists or the City has operational responsibility for the component unit. Housing and Redevelopment Authority of the City of Saint Paul (HRA) The Housing and Redevelopment Authority of the City of Saint Paul (HRA) was established to undertake urban renewal programs. These programs strive to redevelop the residential, commercial and industrial areas of the City of Saint Paul and to provide adequate jobs, a sound fiscal base and a variety of affordable housing for City residents. The City of Saint Paul’s City Councilmembers act as the HRA Board and the City has operational responsibility of the HRA. The Authority’s budget and tax levy are approved by the City Council. The City has a general obligation pledge on certain HRA debt. Separate financial statements for the HRA can be obtained from the City of Saint Paul, Department of Planning and Economic Development, 1400 City Hall Annex, 25 West Fourth Street, Saint Paul, MN 55102.
47
City of Saint Paul, Minnesota NOTES TO THE FINANCIAL STATEMENTS For the Fiscal Year Ended December 31, 2014
Note II. Financial Reporting Entity (continued) The HRA’s component unit, Penfield Apartments, LLC is presented as a blended component unit of the HRA because the component unit’s governing body is the same as the governing body of the HRA. Penfield Apartments, LLC is the developer and owner of a 253-unit market rate apartment complex, with structured parking and a grocery store located in the complex. It is a special purpose entity LLC, financed primarily by a U.S. Department of Housing and Urban Development mortgage, and is wholly owned by a single entity, the HRA. The HRA Board acts as the Penfield Apartments, LLC Board. Separate financial statements for the Penfield Apartments, LLC can be obtained from the City of Saint Paul, Department of Planning and Economic Development, 1400 City Hall Annex, 25 West Fourth Street, Saint Paul, MN 55102. Saint Paul Library Agency The Saint Paul Library Agency was established in 2003 and is responsible for operating the City’s public library system. This system provides reading materials to meet the interests of all ages, responds to the community’s need for information and facilitates lifelong learning to enrich the quality of life in the community. The City of Saint Paul’s City Councilmembers act as the Library Board and the City has operational responsibility of the agency. The agency’s budget is approved by the Board. The agency’s tax levy is approved by City Council. The City has a general obligation pledge on Library debt. The Library Agency consists of an operating fund, debt service fund and a capital improvement fund. These funds are incorporated into the City’s financial report. Discretely Presented Component Units The component unit columns in the government-wide financial statements includes the financial data of the City’s other component units. The governing bodies of these component units are not substantively the same as the governing body of the primary government and the component units do not provide services exclusively to the primary government. RiverCentre Convention & Visitors Authority The Saint Paul RiverCentre Convention & Visitors Authority (RCVA), a Minnesota non-profit corporation, was organized to equip, maintain, manage and operate the RiverCentre Convention Center, Roy Wilkins Auditorium, RiverCentre Parking Ramp and pedestrian connection and operate a convention bureau to market and promote the City as a tourist and convention destination. The Mayor appoints the President and CEO. There are nineteen individuals on the Board of Directors. Ten directors are designated by the Mayor with the approval of City Council, three directors are City Councilmembers and six directors are members of the RCVA who represent the business community. Debt obligations have been issued on behalf of the RCVA and the operational revenues have been committed to the repayment of those obligations. However, ultimately, the City of Saint Paul or the Saint Paul Housing and Redevelopment Authority would be obligated to pay those debt obligations if the RCVA’s revenues were insufficient to meet debt service. Separate financial statements for the RCVA can be obtained from the Saint Paul RiverCentre Convention & Visitors Authority; 175 West Kellogg Boulevard; Suite 502; Saint Paul, MN 55102. Saint Paul Regional Water Services The Saint Paul Regional Water Services provides safe, quality water to Saint Paul and surrounding communities at a reasonable price. The Board of Water Commissioners consists of seven members. Five board members are appointed by the Mayor with the consent of the City Council, three of whom are City Councilmembers and two are citizens. The remaining two board members are appointed by suburban city councils. The City Council approves the Regional Water Services’ water rates and the City has issued general obligation bonded debt on behalf of Regional Water Services. As part of the annual audit of the City performed by the State Auditor’s Office, the Regional Water Services’ financial statements have been included in their audit. Separate financial statements can be obtained from the Regional Water Services; Business Division; 1900 Rice Street; Saint Paul, MN 55113.
48

City of Saint Paul, Minnesota NOTES TO THE FINANCIAL STATEMENTS For the Fiscal Year Ended December 31, 2014
Note II. Financial Reporting Entity (continued) Port Authority of the City of Saint Paul The Port Authority of the City of Saint Paul was established to increase the volume of commerce in the City through the creation of development districts and the acquisition and construction of industrial, commercial and other revenue-producing projects. The Port Authority finances this development in order to expand the tax base and create job opportunities. The Mayor appoints the Port Authority’s board of commissioners with the consent of the City Council. Two of the seven board of commissioners are City Councilmembers. The Port Authority has issued general obligation debt and the Authority’s development activities are financed in part with tax increment financing. It should be noted that other debt issued by the Port Authority, including industrial development revenue bonds, are not liabilities of the City of Saint Paul. The Port Authority considers these bonds as no-commitment debt, and they are excluded from its financial statements. The Authority defines no-commitment debt as debt for which the Authority has no further financial obligation. The industrial development bonds do not constitute indebtedness of the City and are secured solely by revenues from the commercial organizations on whose behalf the bonds are issued. The City assumes no responsibility for the day-to-day operations of the Port Authority, nor is it responsible for financing deficits. Separate financial statements can be obtained from the Port Authority of the City of Saint Paul, Chief Financial Officer, 380 St. Peter Street; Suite 850; Saint Paul, MN 55102. The Port Authority’s component unit, Capital City Properties (CCP), is a Minnesota not-for-profit corporation established in 1991 for the purpose of performing the functions and carrying out the public purposes of the Port Authority. All of the members of the board of directors of CCP are either commissioners or staff of the Port Authority. CCP leases the Capital City Plaza Parking Garage St. Paul, as well as participates in various joint ventures. Subject to the authorization of the CCP board of directors, excess cash flow may be utilized to carry out the public purpose of the Port Authority. Complete financial statements can be obtained from Capital City Properties, Chief Financial Officer, 380 St. Peter Street; Suite 850; Saint Paul, MN 55102. Related Organizations The City’s officials are also responsible for appointing the members of the boards of other organizations, but the City’s accountability for these organizations do not extend beyond making the appointments. Related organizations are not included in the City’s reporting entity. The Public Housing Agency of the City of Saint Paul owns and operates housing projects for low income, elderly and handicapped families. The commissioners of the Public Housing Agency are appointed by the City Council. The City does not provide funding, has no obligation for the debt of the Agency, and cannot impose its will on the Agency. The Riverfront Redevelopment Corporation was established to affect the planning and implementation of the development and preservation of the Mississippi River Corridor within Saint Paul. The operations of the Redevelopment Corporation are managed by a board of directors consisting of not less than eight and no more than seventeen members. All members of the board of directors are appointed by the Mayor with the consent of the City Council. Four of the directors of the corporation are designated as the City representatives. These are (1) Mayor or the Mayor’s designee, (2) two members of the City Council and (3) the Director of the City of Saint Paul, Department of Planning and Economic Development. The City has no ability to impose its will to significantly influence the programs, projects or level of services performed or provided by the Riverfront Redevelopment Corporation. The City is not responsible for funding debts, operating deficiencies and/or disposing of surpluses.
49

City of Saint Paul, Minnesota NOTES TO THE FINANCIAL STATEMENTS For the Fiscal Year Ended December 31, 2014
Note II. Financial Reporting Entity (continued) Joint Venture The Minneapolis/Saint Paul Housing Finance Board (the Board) was established in accordance with a Joint Powers Agreement entered into between the Housing and Redevelopment Authority of the City of Saint Paul (HRA), and the former Minneapolis Community Development Agency (MCDA), and accepted by the cities of Minneapolis and Saint Paul under State of Minnesota laws. The governing bodies of the HRA and the City of Minneapolis each appoint three of the six members of the Board. The Board was created for the public purpose of providing decent, safe, sanitary and affordable housing to the residents of the City of Saint Paul and the City of Minneapolis. The powers exercised by the Board include the power to undertake financing programs to implement individual components of the housing plan for each city and to issue revenue bonds to finance such programs. All bonds are special limited obligations of the Board and shall be payable only out of funds specifically pledged for each issue. Total net position at December 31, 2014 was $10,951,758. The 2014 operations resulted in a decrease of $1,529,824 to net position. During 2014, distributions of $2,030,000 were made from the HRA or the City of Minneapolis to the Board. Upon dissolution of the Board, all properties acquired by the Board and any surplus monies shall be distributed to the HRA and the City of Minneapolis in the proportion and otherwise pursuant to directions provided in the related indenture of trust or other bond documents. If properties acquired by the Board and any surplus monies are not traceable to a particular bond issue or the indenture is silent as to distribution of the assets upon discharge of the issue, the assets shall be distributed on the basis of the amount of funds each entity has contributed that would affect those assets. The respective percentage shares of the HRA and the City of Minneapolis in the Board’s assets, liabilities and equity were not determined at December 31, 2014. There has been no investment made by the HRA in the joint venture. Thus, the financial statements do not reflect an equity interest in the joint venture. Complete financial statements of the Board can be obtained from the City of Minneapolis Community Planning and Economic Development Department, Suite 700, Crown Roller Mill, 105 Fifth Avenue South, Minneapolis, MN 55401. Note III. Summary of Significant Accounting Policies The financial statements of the City of Saint Paul have been prepared in conformity with generally accepted accounting principles (GAAP) as applied to government units. The Governmental Accounting Standards Board (GASB) is the accepted standard-setting body for establishing governmental accounting and financial reporting principles. The more significant of the City’s accounting policies are described below. A. Government-wide and Fund Financial Statements
Government-wide Financial Statements The statement of net position and statement of activities display information about the reporting government as a whole. They include all funds of the reporting entity except for fiduciary funds. The statements distinguish between governmental and business-type activities and are prepared on the full accrual basis. Governmental activities generally are financed through taxes, intergovernmental revenues and other nonexchange revenues. Business-type activities are financed in whole or in part by fees charged to external parties for goods or services. Likewise, the primary government is reported separately from certain legally separate component units for which the primary government is financially accountable.
50

City of Saint Paul, Minnesota NOTES TO THE FINANCIAL STATEMENTS For the Fiscal Year Ended December 31, 2014
Note III. Summary of Significant Accounting Policies (continued)
The statement of activities demonstrates the degree to which the direct expenses of a given function or segment is offset by program revenues. Direct expenses are those that are clearly identifiable with a specific function or segment. The City allocates indirect expenses to functions in the statement of activities. Program revenues include 1) charges to customers or applicants who purchase, use or directly benefit from goods, services or privileges provided by a given function or segment, and 2) grants and contributions that are restricted to meeting the operational or capital requirements of a particular function or segment. Taxes and other items not included among program revenues are reported as general revenues.
Fund Financial Statements Financial statements of the reporting entity are organized into funds, each of which is considered to be a separate accounting entity. Each fund is accounted for by providing a separate set of self-balancing accounts, which constitute its assets, liabilities, deferred inflows/outflows of resources, fund equity/net position, revenues and expenditures/expenses. The modified accrual basis of accounting continues to be the appropriate basis of accounting for governmental activity fund financial statements. Separate financial statements are provided for governmental funds, proprietary funds and fiduciary funds, even though the latter are excluded from the government-wide financial statements. Major individual governmental funds and major individual enterprise funds are reported as separate columns in the fund financial statements. Funds are organized as major funds or non-major funds within the governmental and proprietary statements. An emphasis is placed on major funds within the governmental and proprietary categories. A fund is considered major if it is the primary operating fund of the City or meets the following criteria:
1. Total assets (including deferred outflows of resources), liabilities (including deferred inflows of resources), revenues
or expenditures/expenses of that individual governmental or enterprise fund are at least 10 percent of the corresponding total for all funds of that category or type; and
2. The same element of the individual governmental fund or enterprise fund that met the 10 percent test is at least 5
percent of the corresponding total for all governmental and enterprise funds combined.
3. In addition, any other governmental or enterprise fund that the City believes is particularly important to financial statement users may be reported as a major fund.
The City reports the following major governmental funds: • General Fund – accounts for the City’s primary operating activities financed mainly from property taxes, franchise
fees and local government aid. It is used to account for all financial resources except those accounted for in another fund.
• Assessment Financing – accounts for assessments and fees charged for the building of capital projects, Truth-In-Sale of Housing, Nuisance Housing Abatement, Code Enforcement and the Rental Registration program.
• Public Library General Fund – accounts for the primary operating activities of the Library financed mainly from property taxes to provide a full range of library services.
• HRA General Fund – accounts for the HRA’s primary operating activities financed mainly from property taxes and conduit bond fees. It is used to account for all financial resources except those accounted for in another fund.
51
City of Saint Paul, Minnesota NOTES TO THE FINANCIAL STATEMENTS For the Fiscal Year Ended December 31, 2014
Note III. Summary of Significant Accounting Policies (continued)
• City Debt Service – accounts for resources accumulated, mainly from property taxes, investment earnings and payments made for principal and interest on long-term obligations other than tax increment district or enterprise fund debt.
• HRA Debt Service – accounts for HRA resources accumulated, mainly from property tax increment, investment earnings and payments made for principal and interest on long-term obligations other than enterprise fund debt.
• City Capital Projects – accounts for proceeds from long-term borrowing and other resources to be used for capital improvement projects.
The City reports the following major enterprise funds: • Sewer Utility – accounts for all fees collected from the customers connected to the City sewer system and for all
expenses of operating this system. • HRA Loan – accounts for: (1) loans issued under HRA housing and business programs and (2) the Lofts at Farmers
Market and the Penfield Apartments, market-rate rental projects. • HRA Parking – accounts for parking revenues which are used for acquisition, construction, operation and
maintenance of HRA-owned parking facilities. • HRA Penfield – accounts for the operations and debt service for the Penfield Apartments
The City reports the following non-major governmental and enterprise funds:
Non-Major Governmental Funds
Special Revenue Funds are used to account for and report the proceeds of specific revenue sources that are restricted or committed to expenditure for specific purposes other than debt service or capital projects. • City Grants • Public Health • General Government Special Projects • Parks And Recreation Special Projects • Fire Responsive Services • Como Campus • Police Special Projects • Parkland Replacement • Charitable Gambling • Public Library Special Projects • Right Of Way Maintenance • City HUD Grants • Street Lighting Districts • City Sales Tax • Recycling And Solid Waste • HRA Grants Capital Projects Funds are used to account for and report financial resources that are restricted, committed, or assigned to expenditure for capital outlays, including acquisition or construction of capital facilities and other capital assets. • Public Library Capital Projects • HRA Tax Increment Capital Projects • HRA Development Capital Projects Permanent Funds are used to account for and report resources that are restricted to the extent that only earnings, and not principal, may be used for purposes that support the reporting government’s programs; that is, for the benefit of the government or its citizenry.
• Parks Memorial
52

City of Saint Paul, Minnesota NOTES TO THE FINANCIAL STATEMENTS For the Fiscal Year Ended December 31, 2014
Note III. Summary of Significant Accounting Policies (continued) Non-Major Enterprise Funds
Enterprise Funds are used to report any activity for which a fee is charged to external users of goods or services, and must be used for activities which meet certain debt or cost-recovery criteria. • Parks Special Services • River Print • Impound Lot • HRA Lofts In addition, the City reports the following fund types:
Internal Service Funds are used to account for the financing of goods or services provided by one department or agency to other departments or agencies of the City, or to other governmental units, on a cost-reimbursement basis, including attorney, purchasing, technology, equipment, engineering and administrative services.
Agency Funds are used to account for assets held by the City in a trustee capacity or as an agent for individuals, private organizations, and/or other governmental units. These funds include employee withholding, funds payable to the State of Minnesota for sales and use tax, building permit surcharge and unclaimed property, and others.
B. Measurement Focus, Basis of Accounting and Financial Statement Presentation
Government-wide Financial Statements
The government-wide statement of net position and statement of activities are reported using the economic resources measurement focus and the accrual basis of accounting. Under the accrual basis of accounting, revenues are recognized when earned and expenses are recorded when the liability is incurred or economic asset used. Revenues, expenses, gains, losses, assets and liabilities resulting from exchange and exchange-like transactions are recognized when the exchange takes place. Property taxes are recognized as revenues in the year for which they are levied. Grants and similar items are recognized as revenue as soon as all eligibility requirements imposed by the provider are met. Special assessments are recorded as revenue when earned. Unbilled receivables are recorded as revenues when services are provided.
As a general rule, the effect of interfund activity has been eliminated from the government-wide financial statements. Exceptions to this general rule are charges between the City’s enterprise funds and various other functions of the government. Elimination of these charges would distort the direct costs and program revenues reported for the various functions concerned.
53

City of Saint Paul, Minnesota NOTES TO THE FINANCIAL STATEMENTS For the Fiscal Year Ended December 31, 2014
Note III. Summary of Significant Accounting Policies (continued) Fund Financial Statements – Governmental Funds
Governmental funds are reported using the current financial resources measurement focus and the modified accrual basis of accounting.
Revenues Governmental fund revenues are recognized in the accounting period in which they become susceptible to accrual; that is, when they become both measurable and available to finance the expenditures of the fiscal period. “Available” means collectible within the current period or soon enough thereafter to be used to pay liabilities of the current period. Revenues for nonexchange transactions are recognized based on the principal characteristics of the revenue. Exchange transactions are recognized as revenue when the exchange occurs.
Nonexchange Transactions
Derived tax revenue transactions result from assessments imposed by governments on exchange transactions. Hotel-motel tax and City sales tax are reported as revenue when the underlying exchange occurs and the receivable amount is available. Imposed nonexchange transactions result from assessments by governments on nongovernmental entities and individuals. Property taxes, franchise fees and capital improvement special assessments are imposed nonexchange transactions. Revenues from property taxes and capital improvement special assessments are recognized in the period for which they were levied, to the extent they are collected in the current period or soon enough thereafter to be used to pay liabilities of the current period.
Property taxes, franchise fees and capital improvement special assessments receivable which are not available are reported as deferred inflow of resources, and will be recognized as revenue in the fiscal year that they become available. The City considers these revenues as available if they are collected within sixty days after year end.
Government-mandated nonexchange transactions occur when a government at one level provides resources to a government at another level and requires that government to use them for a specific purpose. The provider government establishes purpose restrictions and may also establish time requirements. Federal and state grants mandating the City perform particular programs are government-mandated nonexchange transactions. Revenues are recognized when the eligibility and time requirements are met, usually when the corresponding expenditure is incurred, using the guidelines of the legal and contractual requirements of the individual programs. Voluntary nonexchange transactions result from legislative or contractual agreements, such as grants, entitlements, appropriations and donations. The provider may establish purpose restrictions and eligibility requirements. Revenues are recognized in the year to which they apply according to statute or contract. Gifts and contributions from individuals and miscellaneous revenues are also considered voluntary nonexchange transactions, and are generally recognized when received in cash because they are not measurable until received. Tax credits paid by the state (included in intergovernmental revenue) are recognized as revenue in the fiscal year that they become available. The City considers revenues from tax credits paid by the state as available if they are collected within sixty days after year end.
54

City of Saint Paul, Minnesota NOTES TO THE FINANCIAL STATEMENTS For the Fiscal Year Ended December 31, 2014
Note III. Summary of Significant Accounting Policies (continued) Exchange Transactions
Exchange transactions include revenues such as interest earned, service-type special assessments, fees, sales and services, licenses and permits. Sales and services, interest earned and service-type special assessments are reported as revenue when they become both measurable and available to finance expenditures of the fiscal period. The City considers these revenues as available if they are collected within sixty days after year end. Licenses, permits and fees are reported as revenue when received in cash, because they are usually not measurable until received.
Expenditures
Expenditures are recorded under the modified accrual method when the fund liability is incurred, except for unmatured interest on general long-term debt which is recognized when due, and certain compensated absences, claims and judgments which are recognized when the obligations are expected to be liquidated with expendable available financial resources.
Fund Financial Statements – Proprietary Funds and Fiduciary Funds
Proprietary funds, consisting of enterprise and internal service funds, are reported using the economic resources measurement focus and the accrual basis of accounting. Their revenues are recognized when they are earned, and their expenses are recognized when they are incurred. Material unbilled accounts receivables are recorded at year end. The proprietary funds distinguish operating revenues and expenses from nonoperating items. Operating revenues and expenses generally result from providing services and producing and delivering goods in connection with a proprietary fund’s principal ongoing operations. The principal operating revenues of the proprietary funds are charges to customers for sales and services. Operating expenses for proprietary funds include the cost of sales and services, administrative expenses, and depreciation on capital assets. All revenues and expenses not meeting this definition are reported as nonoperating revenues and expenses. The City’s Fiduciary Funds consist solely of Agency Funds. Agency Funds do not have a measurement focus, but are reported on an accrual basis of accounting. Fund Financial Statements – All Funds
The preparation of financial statements in conformity with generally accepted accounting principles requires management to make estimates and assumptions that affect the reported amounts of assets and liabilities and disclosure of contingent assets and liabilities at the date of the financial statements and the reported amounts of revenues and expenditures/expenses during the reporting period. Actual results could differ from those estimates.
55
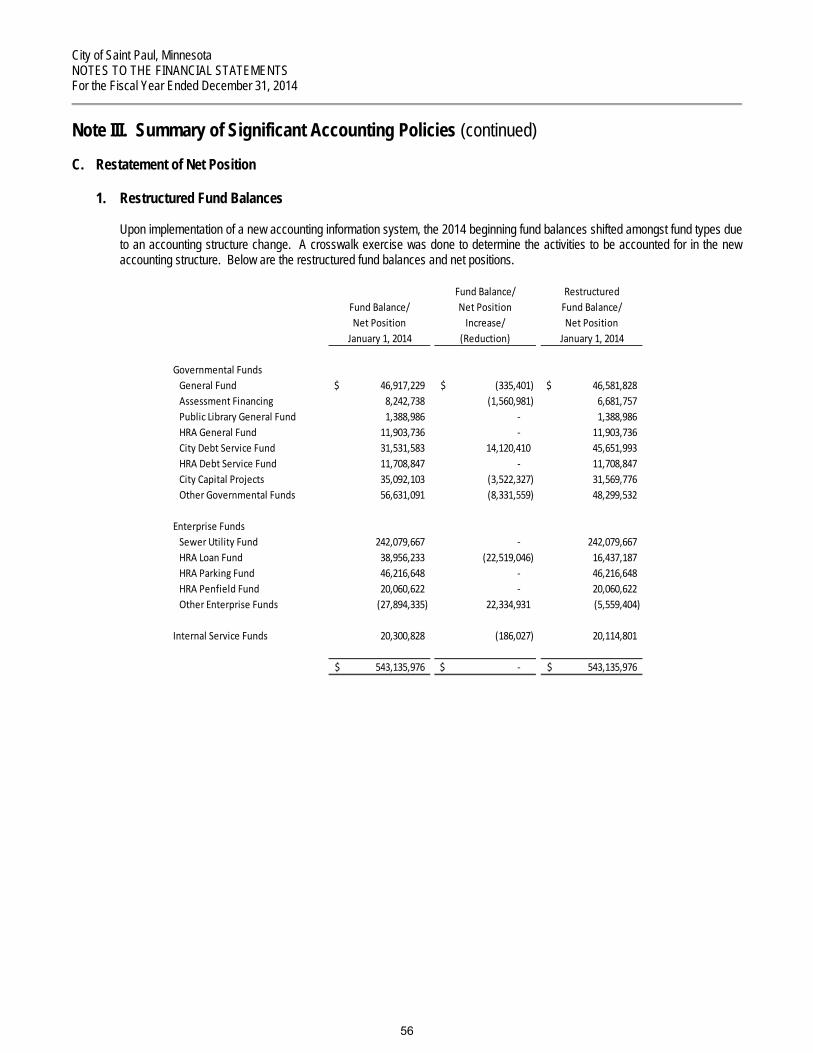
City of Saint Paul, Minnesota NOTES TO THE FINANCIAL STATEMENTS For the Fiscal Year Ended December 31, 2014
Note III. Summary of Significant Accounting Policies (continued)
C. Restatement of Net Position
1. Restructured Fund Balances
Upon implementation of a new accounting information system, the 2014 beginning fund balances shifted amongst fund types due to an accounting structure change. A crosswalk exercise was done to determine the activities to be accounted for in the new accounting structure. Below are the restructured fund balances and net positions.
Fund Balance/ Restructured
Fund Balance/ Net Position Fund Balance/Net Position Increase/ Net Position
January 1, 2014 (Reduction) January 1, 2014
Governmental FundsGeneral Fund 46,917,229$ (335,401)$ 46,581,828$ Assessment Financing 8,242,738 (1,560,981) 6,681,757 Public Library General Fund 1,388,986 - 1,388,986 HRA General Fund 11,903,736 - 11,903,736 City Debt Service Fund 31,531,583 14,120,410 45,651,993 HRA Debt Service Fund 11,708,847 - 11,708,847 City Capital Projects 35,092,103 (3,522,327) 31,569,776 Other Governmental Funds 56,631,091 (8,331,559) 48,299,532
Enterprise FundsSewer Utility Fund 242,079,667 - 242,079,667 HRA Loan Fund 38,956,233 (22,519,046) 16,437,187 HRA Parking Fund 46,216,648 - 46,216,648 HRA Penfield Fund 20,060,622 - 20,060,622 Other Enterprise Funds (27,894,335) 22,334,931 (5,559,404)
Internal Service Funds 20,300,828 (186,027) 20,114,801
543,135,976$ -$ 543,135,976$
56

City of Saint Paul, Minnesota NOTES TO THE FINANCIAL STATEMENTS For the Fiscal Year Ended December 31, 2014
Note III. Summary of Significant Accounting Policies (continued)
2. Prior Period Adjustments Related to Restructured Governmental Funds
The January 1, 2014 restructured fund balance for special revenue fund, Right of Way, included a Net Investment in Capital Assets amount of $134,716 of which was eliminated. Equipment and related accumulated depreciation were converted over from the old Public Works Traffic Signal and Light Maintenance Fund which was an Internal Service Fund. This only eliminated the recording of equipment and related accumulated depreciation on the balance sheet, the assets were not disposed.
OPEB liabilities were also reversed in the restructured General Fund, General Government Special Projects Fund and Right of Way Fund in the respective amounts of $103,685, $5,633 and $593,400.
The January 1, 2014 fund balance for the City Debt Service Fund was increased by $1,698,618 to account for the liability that carried over from the restructure. Two activities from the former Arbitrage Rebate Fund were combined into the new City Debt Service Fund.
General FundRestructured Fund Balance, January 1, 2014 46,579,645$
Prior Period Adjustment for Correction to the Following AccountsOPEB Liability Noncurrent 103,685
Fund balance, January 1, 2014, as Restated 46,683,330$
General Government Special ProjectsRestructured Fund Balance, January 1, 2014 4,101$
Prior Period Adjustment for Correction to the Following AccountsOPEB Liability Noncurrent 5,633
Fund balance, January 1, 2014, as Restated 9,734$
Right of Way Fund:Restructured Fund Balance, January 1, 2014 10,482,451$
Prior Period Adjustment for Correction to the Following AccountsEquipment (733,609) Accumulated Depreciation, Equipment 598,893 (134,716)
OPEB Liability Noncurrent 593,400
Fund balance, January 1, 2014, as Restated 10,941,135$
City Debt ServiceRestructured Fund Balance, January 1, 2014 45,651,991$
Prior Period Adjustment for Correction to the Following AccountsDue to Federal Government 1,698,618
Fund balance, January 1, 2014, as Restated 47,350,609$
57

City of Saint Paul, Minnesota NOTES TO THE FINANCIAL STATEMENTS For the Fiscal Year Ended December 31, 2014
Note III. Summary of Significant Accounting Policies (continued)
On January 1, 2014, the net position for the HRA Penfield Enterprise Fund was restated by $214,349 due to a prior period adjustment affecting construction in progress. The HRA Lofts Enterprise Fund was restated by $35,923 due to a prior period adjustment affecting accounts payable.
HRA PenfieldRestructured Fund Balance, January 1, 2014 20,060,619$
Prior Period Adjustment for Correction to the Following AccountsConstruction in Progress 214,349
Fund balance, January 1, 2014, as Restated 20,274,968$
HRA LoftsRestructured Fund Balance, January 1, 2014 2,458,423$
Prior Period Adjustment for Correction to the Following AccountsAccounts Payable 35,923
Fund balance, January 1, 2014, as Restated 2,494,346$
3. Prior Period Adjustment to Remove Receivable Accrued for 2013
The January 1, 2014 fund balance for the City HUD Grants Fund was reduced by $500,387 to remove the receivable accrued for 2013. The City has excess program income and is unsure of the draw down timeframe for these funds.
City HUD GrantsRestructured Fund Balance, January 1, 2014 459,637$
Prior Period Adjustment for Correction to the Following AccountsFederal Direct Grants (500,387)
Fund balance, January 1, 2014, as Restated (40,750)$
D. Assets, Liabilities, Deferred Outflows/Inflows of Resources, and Net Position
1. Cash and Investments
The City maintains a general portfolio, which is a pool of investments covering pooled cash and cash equivalents. The City’s Office of Financial Services, Treasury Section, also manages the deposit and investment function of the Regional Water Services and the majority of the RiverCentre Convention & Visitors Authority discretely presented component units. Each fund’s portion of this pool is displayed on the financial statements within “Cash and Investments with Treasurer.”
Cash equivalents are cash on hand, cash in bank and highly-liquid investments adjusted to fair value having original maturities (time span from purchase date to maturity date) of three months or less. Cash equivalents are identified only for the purpose of the Statement of Cash Flows. Included in the classification of cash equivalents are cash and investments with treasurer, cash and investments of imprest funds and restricted cash.
58

City of Saint Paul, Minnesota NOTES TO THE FINANCIAL STATEMENTS For the Fiscal Year Ended December 31, 2014
Note III. Summary of Significant Accounting Policies (continued)
In addition, the City invests non-pooled cash within various funds. In accordance with Governmental Accounting Standards Board Statement No. 31 Accounting and Financial Reporting for Certain Investments and for External Investment Pools (Statement 31), the City’s investments are reported at fair value with recognition of the corresponding changes in fair value of investments reported as revenue in the year in which the change occurred. Accordingly, investments are stated at fair value based upon quoted market prices at December 31, 2014. Investments in nonparticipating interest-earning contracts, such as savings accounts and nonnegotiable certificates of deposit are reported at cost. Money market investments and participating interest-earning investment contracts (negotiable certificates of deposit), are reported at amortized cost, since these investments had a remaining maturity of one year or less at the time of purchase. Money market investments are short-term, highly-liquid debt instruments, bankers’ acceptances and U.S. Treasury and agency obligations. Investments in Rule 2a7-like investment pools are measured at the net asset value per share provided by the pool. It is the City’s practice to ensure that investments can be held to maturity. The amounts of unrealized gains or losses are included in investment income as an increase (decrease) in fair value of investments. In 2014, the City recorded an “increase in fair value of investments” as investment income of $4,305,626 for governmental and proprietary funds. The calculation of realized gains and losses is independent of the calculation of the net change in the fair value of investments. Realized gains and losses on investments that have been held in more than one fiscal year and sold in the current year were included as part of the change in the fair value of investments reported in the current year. “Interest Earned on Investments” In accordance with legal provisions, investment earnings from pooled deposits and investments are recorded in the following funds:
General Fund
Special Revenue Funds: • HRA General Fund • City Grants • Police Special Projects • Charitable Gambling • Right Of Way Maintenance • Parks And Recreation Special Projects • Parkland Replacement • Public Library Special Projects • City HUD Grants • City Sales Tax
Debt Service Funds: • City Debt Service • HRA Debt Service
Capital Projects Funds: • City Capital Projects • Public Library Capital Projects • HRA Development Capital Projects • HRA Tax Increment Capital Projects
59
City of Saint Paul, Minnesota NOTES TO THE FINANCIAL STATEMENTS For the Fiscal Year Ended December 31, 2014
Note III. Summary of Significant Accounting Policies (continued)
Permanent Fund: • Parks Memorial
Enterprise Funds: • Sewer Utility • HRA Loan • HRA Parking • HRA Penfield • Parks Special Services • HRA Lofts
Internal Service Funds:
• Internal Borrowing
Investment earnings are allocated based on average monthly cash balances. See Note VI.A for further information.
2. Receivables
Property Taxes
Property tax levies are set by the City Council in October each year, and are certified to Ramsey County for collection in the following year. In Minnesota, counties act as collection agents for all property taxes. The county spreads all levies over assessable property. Such taxes become a lien on January 1 and are recorded as receivables by the City at that date. Revenues are accrued and recognized in the year collectible, net of delinquencies. Real property taxes may be paid by taxpayers in two equal installments, on May 15 and October 15. Personal property taxes on leased government-owned property may be paid in two equal installments on May 15 and October 15; property taxes on other personal property are to be paid in full on May 15. Taxes which remain unpaid at December 31 are classified as delinquent taxes receivable, and are fully offset by deferred inflows of resources, because they are not known to be available to finance current expenditures. No allowance for uncollectible taxes has been provided, because such amounts are not expected to be material.
Accounts Receivable
Accounts receivable have been shown net of an allowance for uncollectible accounts of $768,174.
60
City of Saint Paul, Minnesota NOTES TO THE FINANCIAL STATEMENTS For the Fiscal Year Ended December 31, 2014
Note III. Summary of Significant Accounting Policies (continued)
Interfund Receivables and Payables
During the course of operations, transactions occur between individual funds that may result in amounts owed between funds. Short-term interfund loans are reported as “due to and from other funds.” Long-term interfund loans (noncurrent portion) are reported as “advances from and to other funds.” Interfund receivables and payables between funds within governmental activities are eliminated in the statement of net position. Any residual balances outstanding between the governmental activities and business-type activities are reported in the government-wide financial statements as “internal balances.” Advances to other funds as reported in the fund financial statements are included in nonspendable fund balance in the General Fund to indicate the asset is not in spendable form and in restricted, committed, or assigned fund balance in the other governmental funds to indicate the level of constraint placed upon the proceeds from the repayment of the advance. Notes and Loans Receivable
Notes and loans (hereafter referred to as “loans”) have been issued to financially assist private developers in various Saint Paul development projects or to provide housing or commercial rehabilitation financing for Saint Paul property owners. All loans are secured by first or second property mortgages, with the exception of the STAR Program loans, which are not always secured. Loans receivable in governmental funds are reported as an asset in the amount of loan proceeds disbursed less collections on principal. In order to satisfy federal grant reporting requirements, deferred inflows of resources of an equal amount to the asset is also reported on the respective governmental fund balance sheet and revenues are reported when principal payments are received from the loan recipient. An allowance for uncollectible loans, which offsets the total gross loans receivables, is recognized for the amount of loans receivable for which collection is doubtful or questionable. Deferred inflows of resources are also reduced by the amount of the allowance for uncollectible loans. At the time of the disbursement of the loan, expenditures and loans receivable are debited in the amount of the loan issued, with the loans receivable being offset by a credit to deferred inflows of resources. In order to satisfy federal grant reporting requirements, unearned revenue of an equal amount to restricted grants is also reported in the balance sheet and revenues are reported when principal payments are received from the loan recipient. For enterprise funds, loans receivable are reported as an asset in the amount of loan proceeds disbursed less collections on principal. An allowance for uncollectible loans, which offsets the total gross loans receivable, is recognized for the amount of loans receivable for which collection is doubtful or questionable. The allowance for uncollectible loans is based upon an analysis of credit risk and payment delinquency.
3. Inventories and Prepaid Items
Inventories are valued at cost, which approximates market, using the first-in, first-out (FIFO) method. Proprietary fund inventories are generally used for construction, for operation and maintenance work. They are not for resale. They are valued at cost based on weighted average, and charged to construction, operation and maintenance expense when used. Certain payments to vendors which reflect costs applicable to future accounting periods are recorded as prepaid items in both government-wide and fund financial statements.
61

City of Saint Paul, Minnesota NOTES TO THE FINANCIAL STATEMENTS For the Fiscal Year Ended December 31, 2014
Note III. Summary of Significant Accounting Policies (continued)
4. Land Held for Resale
Land is acquired by the HRA for subsequent resale for redevelopment purposes and not as an investment program. In order to entice development, the land is often resold at prices substantially lower than the HRA’s cost. Land Held for Resale is reported as an asset at the net realizable value for all assets acquired before 2009 and at cost of purchase for all assets purchased after 2008 in the fund which acquired it. Deferred inflow of resources of an equal amount is also reported on the respective governmental fund balance sheet. In governmental funds, in order to satisfy federal grant reporting requirements, land acquired is reported as expenditure in the amount of the acquisition cost and as federal revenue for the same amount. When the land is subsequently sold, miscellaneous program income is recognized for the sale amount. Future drawdowns from the federal government for reimbursement of expenditures incurred are adjusted by program income available at that date.
5. Restricted Assets
Mandatory segregations of assets are presented as restricted assets. Such segregations are required by bond agreements and other external parties. Current liabilities payable from these restricted assets are so classified. The excess of restricted assets over current liabilities payable from restricted assets will be used first for retirement of related long-term debt.
6. Capital Assets
Government-wide Financial Statements Capital assets, which include land, buildings and structures, improvements, equipment and infrastructure (e.g., streets, bridges and sewers), are defined by the City as assets with an initial cost of more than $5,000 for general capital assets and $100,000 for infrastructure assets, and an estimated useful life of at least three years. Such assets are recorded at historical cost. Donated capital assets are recorded at estimated fair value on the date received. Certain assets for which actual costs are not available have been valued on the basis of a professional valuation that determined their approximate historical cost. The costs of normal maintenance and repairs that do not add to the value of the asset or materially extend asset lives are not capitalized. Additions to and replacements of capital assets of business-type activities are recorded at original cost, which includes material, labor, overhead and an allowance for the cost of funds used during construction when significant. For tax-exempt debt, the amount of interest capitalized equals the interest expense incurred during construction netted against any interest revenue from temporary investment of borrowed fund proceeds. The cost of renewals and betterments relating to retirement units is added to related capital asset accounts. The cost of property replaced, retired or otherwise disposed of, is deducted from capital asset accounts and, generally, together with removal costs less salvage, is charged to accumulated depreciation.
62

City of Saint Paul, Minnesota NOTES TO THE FINANCIAL STATEMENTS For the Fiscal Year Ended December 31, 2014
Note III. Summary of Significant Accounting Policies (continued)
Depreciation of all exhaustible capital assets is recorded as an allocated expense in the statements of activities, with accumulated depreciation reflected in the statement of net position. Depreciation is spread over the assets’ estimated useful lives using the straight line method of depreciation. The range of estimated useful lives and method of depreciation by type of asset is as follows:
Asset Method Years Buildings and Structures Straight-Line 15-100 Infrastructure Straight-Line 15-100 Public Improvements Straight-Line 15-50 Equipment Straight-Line 3-20
Fund Financial Statements
In the fund financial statements, capital assets used in governmental fund operations are accounted for as capital outlay expenditures of the governmental fund upon acquisition. Capital assets used in proprietary fund operations are accounted for the same way as in the government-wide statements.
7. Deferred Outflows/Inflows of Resources
In addition to assets, the statement of financial position will sometimes report a separate section for deferred outflows of resources. This separate financial statement element, deferred outflows of resources, represents a consumption of net position that applies to a future period(s) and so will not be recognized as an outflow of resources (expense/expenditure) until then. The City only has one item that qualifies for reporting in this category. It is the unrealized loss on derivative instruments (interest swap derivative) reported in the government-wide governmental activities statement of net position. In addition to liabilities, the statement of financial position will sometimes report a separate section for deferred inflows of resources. This separate financial statement element, deferred inflows of resources, represents an acquisition of net position that applies to future period(s) and so will not be recognized as an inflow of resources (revenue) until that time. The City has only one type of item, which arises only under a modified accrual basis of accounting that qualifies for reporting in this category. Accordingly, the item, unavailable revenue, is reported only in the governmental funds balance sheet. The governmental funds report unavailable revenue from the following sources: property taxes, accounts receivable, loans receivable, notes receivable, special assessments, and miscellaneous other. These amounts are deferred and recognized as an inflow of resources in the period that the amounts become available. In the government-wide governmental activities statement of net position the City reports only one deferred inflows of resources, the interest swap derivative.
(The remainder of this page left blank intentionally)
63
City of Saint Paul, Minnesota NOTES TO THE FINANCIAL STATEMENTS For the Fiscal Year Ended December 31, 2014
Note III. Summary of Significant Accounting Policies (continued)
8. Compensated Absences
The compensated absences liability includes earned but unpaid vacation and compensatory time, vested sick leave, an estimate of current vesting sick leave that will eventually vest, and salary-related payments (fringe benefits) associated with the payment of vacation and compensatory time balances. Employees earn vacation based on years of service and their bargaining unit. Vacation must be used in the year it is earned, except for 120 hours, which may be carried over to the following year. Employees are paid 100% of their accumulated vacation pay when they terminate their employment. All amounts are paid to a Post-Employment Health Plan (PEHP). Sick leave earning varies based on bargaining units and ranges from 13 to 15 days per year and may be accumulated indefinitely. Terminated employees receive severance pay based upon unused sick leave. All severance pay is paid to a PEHP in the year following termination. Eligibility requirements and maximum allowable amounts vary, depending upon an employee’s bargaining unit. All vested vacation is accrued when incurred in the government-wide, proprietary and fiduciary fund financial statements. A liability for these amounts is reported in governmental funds only if they have matured; for example, as a result of employee resignations and retirements, or are payable with expendable available resources.
9. Long-Term Obligations/Conduit Debt
All long-term obligations to be repaid from governmental and business-type resources are reported as liabilities in the government-wide statements. The long-term obligations consist primarily of notes and bonds payable, and accrued compensated absences. Long-term obligations for governmental funds are not reported as liabilities in the fund financial statements. The face value of the debt (plus any premiums) is reported as other financing sources and payments of principal and interest are reported as expenditures. Premiums received on debt issuances are reported as other financing sources while discounts on debt issuances are reported as other financing uses. Issuance costs, whether or not withheld from the actual debt proceeds received are reported as debt service expenditures at the time of the debt issuance. The accounting in proprietary funds is the same as it is in the government-wide statements. The HRA has issued Commercial/Industrial Development, Homeownership Mortgage and Rental Housing Revenue Bonds to assist developers, businesses and low- to moderate-income homeowners in projects which improve the economic and housing conditions of the City. The bonds are secured by the financed property and are payable solely from the revenues of the individual commercial/industrial or housing projects. The bonds do not constitute a charge, lien or encumbrance, legal or equitable, upon any property or funds of the HRA, nor is the HRA subject to any liability thereon. Accordingly, the bonds are not reported as liabilities in the accompanying financial statements. Conduit bonds issued subsequent to January 1, 1996, have an outstanding principal balance of $1.4 billion at December 31, 2014. The aggregate principal amount payable for conduit bonds issued prior to January 1, 1996, could not be determined; however, their original issue amounts totaled $2.9 billion. There were 185 conduit bonds issued prior to January 1, 1996, and 143 conduit bonds issued subsequent to January 1, 1996.
64
City of Saint Paul, Minnesota NOTES TO THE FINANCIAL STATEMENTS For the Fiscal Year Ended December 31, 2014
Note III. Summary of Significant Accounting Policies (continued)
10. Claims and Judgments Claims and judgments are recorded as liabilities if all the conditions of Governmental Accounting Standards Board pronouncements are met. Claims and judgments that would normally be liquidated with expendable available financial resources are recorded during the year as expenditures in the governmental funds. If they are not to be liquidated with expendable available financial resources, no liability is recognized in the governmental fund statements. The related expenditure is recognized when the liability is liquidated. Claims and judgments are recorded in the government-wide statements and proprietary funds as expenses when the related liabilities are incurred.
11. Equity Classifications
Government-wide Financial Statements
Equity is classified as net position and displayed in three components:
a. Net investment in capital assets – Consists of capital assets including infrastructure, net of accumulated depreciation and reduced by the outstanding balances of any bonds, mortgages, notes or other borrowings that are attributable to the acquisition, construction or improvement of those assets.
b. Restricted net position – Consists of net position with constraints placed on their use either by 1) external
groups such as creditors, grantors, contributors, or laws or regulations of other governments or 2) law through constitutional provisions or enabling legislation.
c. Unrestricted net position – All other net assets that do not meet the definition of “restricted” or “net investment in
capital assets.”
When both restricted and unrestricted resources are available for use, it is the City’s policy to use restricted resources first, then unrestricted resources as they are needed.
Fund Financial Statements Classification of Fund Balances
Governmental fund equity is classified as fund balance. Fund balance is divided into five classifications based primarily on the extent to which the City is bound to observe constraints imposed upon the use of the resources in the governmental funds. The classifications are as follows:
Nonspendable – the nonspendable fund balance category includes amounts that cannot be spent because they are either not in spendable form, or legally or contractually required to be maintained intact. The “not in spendable form” criterion includes items that are not expected to be converted to cash. Restricted – fund balance is reported as restricted when constraints placed on the use of the resources are either externally imposed by the creditors (such as through debt covenants), grantors, contributors, or laws or regulations of other governments or is imposed by law through constitutional provisions or enabling legislation.
65
City of Saint Paul, Minnesota NOTES TO THE FINANCIAL STATEMENTS For the Fiscal Year Ended December 31, 2014
Note III. Summary of Significant Accounting Policies (continued) Committed – the committed fund balance classification includes amounts that can be used only for the specific purposes imposed by formal action (resolution) of the City Council. Those committed amounts cannot be used for any other purpose unless the City Council removes or changes the specified use by taking the same type of action (resolution) it employed to previously commit those amounts. Assigned – the assigned fund balance classification includes amounts the City intends to use for specific purposes but do not meet the criteria to be classified as restricted or committed. In governmental funds, assigned fund balance represents intended uses established by the City Council or the Office of Financial Services Director who has been delegated that authority by the City Council. Unassigned – Unassigned fund balance is the residual classification for the General Fund and includes all spendable amounts not contained in the other fund balance classifications. In other governmental funds, the unassigned classification is used only to report a deficit balance resulting from overspending for specific purposes for which amounts had been restricted or committed.
The City has adopted an accounting policy that in determining the composition of its ending fund balance will consider restricted amounts to have been spent first when an expenditure is incurred for purposes for which both restricted and unrestricted amounts are available. Similarly, within unrestricted fund balance, committed amounts are reduced first followed by assigned amounts and then unassigned amounts when expenditures are incurred for purposes for which amounts of the unrestricted fund balance classifications could be used. Proprietary fund equity is classified the same as in the government-wide statements.
12. Future Change in Accounting Standards
GASB Statement No. 68, Accounting and Financial Reporting for Pensions, as amended by GASB Statement No. 71, Pension Transition for Contributions Made Subsequent to the Measurement Date, replaces Statement No. 27, Accounting for Pensions by State and Local Governmental Employers, and Statement No. 50, Pension Disclosures, as they relate to employer governments that provide pensions through pension plans administered as trusts or similar arrangement that meet certain criteria. GASB Statement 68 requires governments providing defined benefit pension plans to recognize their long-term obligation for pension benefits as a liability for the first time, and to more comprehensively and comparably measure the annual costs of pension benefits. This statement will be effective for the City of St. Paul’s calendar year 2015. The City has not yet determined the financial impact of adopting this new standard.
66

City of Saint Paul, Minnesota NOTES TO THE FINANCIAL STATEMENTS For the Fiscal Year Ended December 31, 2014
Note IV. Reconciliation of Government-wide and Fund Financial Statements A. Explanation of Certain Differences between the Governmental Fund Balance Sheet and the Statement of Net
Position
Statement 4 is a reconciliation between fund balance – total governmental funds as reported in governmental funds and net position – governmental activities as reported in the government-wide statement of net position. Details of most of the elements of that reconciliation are as follows: One element of the reconciliation states that “Capital assets used in governmental funds are not financial resources and, therefore, are not reported in the funds.” These assets, which include land, buildings and structures, improvements other than buildings, equipment, infrastructure and construction in progress are reported in the statement of net position as shown below.
Historical Cost of Capital Assets 1,926,065,933$ Accumulated Depreciation (692,327,771)
Net Adjustment to Increase Fund Balance - Total Governmental Funds to Arriveat Net Position of Governmental Activities 1,233,738,162$
Another element of the reconciliation states that “Some receivables that are not currently available are reported as deferred inflows of resources in the fund financial statements, but are recognized as revenue when earned in the government-wide statements, excluding the provision for an allowance for uncollectible taxes.” Below are details of that difference.
Unavailable Revenue
General Government Revenues 17,303,670$ Public Safety Revenues 567,847 Highways and Streets Revenues 27,449,106 Sanitation Revenues 5,668,962 Culture and Recreation Revenues 504,116 Housing and Economic Development Revenues 265,854 Property Taxes 2,468,950 Interest Earned on Investments 249,843 Miscellaneous Revenues 3,679,005
Net Adjustment to Increase Fund Balance - Total Governmental Funds to Arrive 58,157,353$ at Net Position of Governmental Activities
67
City of Saint Paul, Minnesota NOTES TO THE FINANCIAL STATEMENTS For the Fiscal Year Ended December 31, 2014
Note IV. Reconciliation of Government-wide and Fund Financial Statements (continued) Another element of the reconciliation states that “Some liabilities, including long-term debt, are not due and payable in the current period and, therefore, are not reported in the funds.” They are, however, reported in the government-wide statements. Long-term liabilities at the end of the year include the following:
Pollution Remediation Obligation 1,916,181$ Reduction in Unearned Revenue Related to the Pollution Remediation Obligation (1,916,181) Deferred Outflow - Unrealized Loss on Derivatives 11,010,150 Derivative Interest Swap (11,010,150) Bonds Payable (378,335,000) Discount and Premium (16,250,399) Revenue Notes Payable (90,287,447) Capital Lease Payable (8,398,677) Compensated Absences Payable (21,162,807) Net Other Postemployment Benefits Obligation (34,792,592) Claims and Judgments Payable (35,610,399) Accrued Interest (2,769,108)
Net Adjustment to Decrease Fund Balance - Total Governmental Funds to Arriveat Net Position of Governmental Activities (587,606,429)$
B. Explanation of Certain Differences between the Governmental Fund Statement of Revenues, Expenditures and Changes in Fund Balances and the Government-wide Statement of Activities
Statement 6 is a reconciliation between net changes in fund balances – total governmental funds and changes in net position of governmental activities as reported in the government-wide statement of activities. One element of that reconciliation explains that “Governmental funds report capital outlays as expenditures. However, in the Statement of Net Position, the cost of those assets is capitalized and depreciated over their estimated useful lives with depreciation expense reported in the Statement of Activities.” The details of this difference are as follows:
Capital outlay is reported as an expenditure in the fund financial statements 93,896,664$ Depreciation is reported in the government-wide statements (41,698,720)
Net Excess (Deficit) of Capital Outlay Over Depreciation 52,197,944$
68
City of Saint Paul, Minnesota NOTES TO THE FINANCIAL STATEMENTS For the Fiscal Year Ended December 31, 2014
Note IV. Reconciliation of Government-wide and Fund Financial Statements (continued) Another element of that reconciliation states that “Debt and lease proceeds provide current financial resources to governmental funds, but issuing these obligations increases long-term liabilities in the Statement of Net Position. Repayment of principal is an expenditure in the governmental funds, but the repayment reduces long-term liabilities in the Statement of Net Position.” Neither transaction, however, has any effect on net position. Also, governmental funds report the effect of premium, discount and similar items, when debt is first issued; whereas, these amounts are deferred and amortized in the Statement of Activities. The details of this difference are as follows:
Debt Issued or Incurred:
General Obligations Bonds (59,855,000)$ Revenue Bonds (36,265,000) Revenue Notes (33,720,000) Capital Lease (2,295,600)
Total Debt Issued (132,135,600)$
Principal PaymentsGeneral Obligations Bonds 35,965,000$ Revenue Bonds 37,635,000 Revenue Notes 6,392,574 Capital Lease 1,289,952
Total Principal Payments 81,282,526
Prior Period AdjustmentHRA Notes Payable 3,819,387$
Total Prior Period Adjustment 3,819,387
Net Adjustment to Net Changes in Fund Balances - Total Governmental Funds to Arrive at Changes in Net Position of Governmental Activities (47,033,687)$
Another element of that reconciliation states that “Some expenses in the Statement of Activities do not require the use of current financial resources and, therefore, are not reported as expenditures in the governmental funds.” The details of this difference are as follows:
Compensated Absences (4,169,545)$ Net Other Postemployment Benefits (4,382,315)Claims and Judgments 2,554,658Interest on Debt (502,323)
Net Adjustment to Net Changes in Fund Balances - Total GovernmentalFunds to Arrive at Changes in Net Position of Governmental Activities (6,499,525)$
69

City of Saint Paul, Minnesota NOTES TO THE FINANCIAL STATEMENTS For the Fiscal Year Ended December 31, 2014
Note V. Stewardship, Compliance and Accountability A. Budgets and Budgetary Accounting
Budget Control
Appropriations are controlled administratively at the activity level within multi-year budgeted funds. Governmental funds with annually adopted budgets are controlled administratively at the activity level within the following major object levels of expenditure: salaries, fringes, debt service, other spending and transfers out. Proprietary funds with annually adopted budgets are controlled administratively at the fund level within the same major object levels of expenditure as in governmental funds. The legal level of budgetary control (that is, the level at which expenditures cannot legally exceed the appropriated amount) is at the fund level, except for the General Fund, which is at the department/office level.
1. General Budget Procedure – City Funds
The City Council followed these procedures in establishing the 2014 budgets:
a. On August 14, 2013, the Mayor presented a budget to the City Council for the following calendar year. The
budget included proposed expenditures and advances and the means of financing them.
b. The City Council held a public hearing on December 4, 2013, to obtain taxpayer comments.
c. The budget was legally adopted through passage of council resolution #13-1879 during the City Council meeting on December 11, 2013.
City budget amendments that authorize an increase in total fund spending require the approval of the City Council. In addition, City Council approval is required for budget amendments transferring appropriations between departments within the General Fund.
2. General Budget Procedure – HRA Funds
The Housing and Redevelopment Authority (HRA) followed these procedures in establishing the 2014 budgets:
a. On August 28, 2013, the Executive Director presented a proposed budget to the HRA Board of
Commissioners for the fiscal year commencing the following January 1. This budget included proposed expenditures and other uses and the means of financing them.
b. Upon approval by the HRA Board, the Executive Director submitted the HRA budget to the Mayor of the City
of Saint Paul, who submitted this budget to the City Council for consideration, approval and certification.
c. The budget was approved through passage of council resolution #13-1947.
HRA budget amendments that authorize an increase in total fund spending require the approval of the HRA Board of Commissioners.
70
City of Saint Paul, Minnesota NOTES TO THE FINANCIAL STATEMENTS For the Fiscal Year Ended December 31, 2014
Note V. Stewardship, Compliance and Accountability (continued)
3. General Budget Procedure – Library Agency Funds The Library Agency followed these procedures in establishing the 2014 budgets:
a. On August 15, 2013, the Mayor presented his proposed budget for the Saint Paul Public Library Agency to the
Library Board of Commissioners for the fiscal year commencing the following January 1. The budget included proposed expenditures and other uses and the means of financing them.
b. The City Council held a public hearing on December 4, 2013 to obtain taxpayer comments. c. The budget was legally adopted through passage of Saint Paul Library Agency resolution #13-1918 during the
Library Board meeting on December 11, 2013.
Library Agency budget amendments that authorize an increase in total fund spending require the approval of the Library Board.
4. Annual and Multi-year Governmental Fund Budgets
Annual governmental fund budgets are reported in the following fund types and are adopted on a basis consistent with Generally Accepted Accounting Principles (GAAP):
General Fund
Special Revenue Funds (except: City Grants, City HUD Grants, City Sales Tax, and HRA Grants, which have multi-year budgets).
Permanent Funds
In addition, multi-year governmental fund budgets are utilized in the capital projects funds.
(The remainder of this page left blank intentionally)
71

City of Saint Paul, Minnesota NOTES TO THE FINANCIAL STATEMENTS For the Fiscal Year Ended December 31, 2014
Note V. Stewardship, Compliance and Accountability (continued)
The following provides a summary reconciliation of the actual results for annually budgeted special revenue funds and multi-year budgeted special revenue funds.
Restated Fund Balances 1/1/14 Revenues Expenditures
Net Other Financing
Sources (Uses)Fund Balances
12/31/14SPECIAL REVENUE FUNDSAssessment Financing 6,681,758$ 6,758,106$ (1,781,643)$ (5,158,302)$ 6,499,919$ Public Library General Fund 1,388,985 16,057,056 (15,823,886) (7,976) 1,614,179 HRA General Fund 11,903,743 4,801,168 (5,155,713) 473,042 12,022,240 Annually Budgeted Nonmajor Funds 16,445,288 74,736,895 (75,398,092) 1,915,819 17,699,910
Total Annually Budgeted Funds 36,419,774 102,353,225 (98,159,334) (2,777,417) 37,836,248
5. Appropriation Revisions
Budgeted amounts are as originally adopted or as amended by the City Council. During 2014, increases and decreases to annual expenditures, other financing uses and transfers out appropriations were as follows:
Original Budgeted Amounts Net Amendments
FinalBudgeted Amounts
General Fund 233,262,093$ 338,106$ 233,600,199$ Special Revenue Funds 109,817,085 5,508,528 115,325,613 Permanent Funds 2,000 - 2,000
6. Appropriation Year-end Balances
Unexpended appropriation balances lapse at the end of the fiscal year in the annual governmental fund budgets. However, upon City Council approval, the appropriations for the subsequent year are increased in the amount necessary to satisfy the outstanding encumbrances at the end of the fiscal year. Unexpended appropriation balances do not lapse at the end of the fiscal year in the multi-year governmental fund budgets.
72

City of Saint Paul, Minnesota NOTES TO THE FINANCIAL STATEMENTS For the Fiscal Year Ended December 31, 2014
Note V. Stewardship, Compliance and Accountability (continued) B. Federal Audit Requirements
The U.S. Office of Management and Budget (OMB) issued Circular A-133, which establishes uniform audit requirements for non-Federal entities that administer Federal awards and implements the Single Audit Act Amendments of 1996, which were signed into law July 5, 1996 (Public Law 104-156)
The purposes of the Single Audit Act Amendments of 1996 are to: 1. promote sound financial management, including effective internal controls, with respect to Federal awards; 2. promote the efficient and effective use of audit resources; 3. reduce burdens on state and local governments, Indian tribes and nonprofit organizations; 4. ensure that Federal departments and agencies, to the maximum extent practicable, rely upon and use audit work
done pursuant to Chapter 75 of Title 31, United States Code (the “Single Audit Act”).
For 2014, the City of Saint Paul’s audit was performed in accordance with Circular A-133. The auditor’s report on consideration of the City’s internal control over financial reporting and tests of the City’s compliance with certain provisions of laws, regulations, contracts, grant agreements and other matters will be issued at a later date.
(The remainder of this page left blank intentionally)
73

City of Saint Paul, Minnesota NOTES TO THE FINANCIAL STATEMENTS For the Fiscal Year Ended December 31, 2014
Note V. Stewardship, Compliance and Accountability (continued)
C. Deficit Balances
Generally accepted accounting principles require disclosure of individual funds that have deficit fund balances or net position at year end. The following funds had deficit fund balances or net position at December 31, 2014:
Fund Balance/ Net Position
Special Revenue Funds:City Grants (344,624)$ Public Health (94,055) Como Campus (3,240,216)
Enterprise Funds:Parks Special Services (8,559,833) Impound Lot (677,598)
Internal Service Funds:Equipment Services Fire-Police (165,770)
City Grants
The City Grants Fund’s negative fund balance is attributed to expenditures incurred during 2014’s flood. The City will recover a significant portion of flood related expenditures through a Federal Emergency Management Agency grant. The grant revenue recognized in 2015 will reduce or eliminate the negative fund balance.
Public Health
The Public Health Fund is on a reimbursable basis. Total expenses by the fund are charged to Ramsey County. Estimated 2014 expenses were charged and billed to the County. A late fringe benefit charge increased the expenses more than what was estimated. In 2015, the City will add to the 2015 billings for the expenses charged to the fund in excess of the total amount billed for 2014.
Como Campus
The Como Campus Fund continued to have a significant negative fund balance at December 31, 2014. The net loss in 2014 was primarily the result of not reaching budgeted revenues. This loss contributed further to the cumulative negative position at year end. In 2015, management will continue its measures to closely monitor the monthly spending compared to budget. Revenue is also being analyzed frequently to ensure its accuracy to the budget. With a continued focus on both revenue and spending, the goal is to achieve positive results of operations in 2015 and therefore reverse the trend of recent years.
74

City of Saint Paul, Minnesota NOTES TO THE FINANCIAL STATEMENTS For the Fiscal Year Ended December 31, 2014
Note V. Stewardship, Compliance and Accountability (continued)
Parks Special Services
The Parks Special Services Fund has developed a deeper negative overall net position balance during recent history and 2014 was no exception to this recent trend. The spending that is required to maintain the essential operations of the fund, as well as the debt service payments in the fund, have caused the overall net position balance to decrease significantly. Golf’s nonoperating expense was the main contributor to a negative balance in 2014. In addition, the lack of expected revenue has been a contributing factor. Due to the very significant negative net position, this fund has become an even greater point of emphasis. All actions are being taken to do whatever is possible to eliminate the net loss in 2015 and begin turning the overall fund balance around. Impound Lot
Due to unpredictable snow emergencies and regulation changes to revenue, along with administrative costs, this fund faces annual budget pressures. In 2014, low snow emergency revenues, accompanied by stagnation in other revenue sources created a large negative impact to net position. In addition, a negative inventory adjustment of approximately $45,660 further added to the deficit for 2014 due to the selling of low value impounded vehicles. Equipment Services Fire-Police The Equipment Services Fire-Police fund reported a deficit fund balance of $165,770 due to revenue being under budget by $359,788. It is projected that the deficit will be eliminated in 2015 by way of increased revenues or a transfer from another fund.
(The remainder of this page left blank intentionally)
75

City of Saint Paul, Minnesota NOTES TO THE FINANCIAL STATEMENTS For the Fiscal Year Ended December 31, 2014
Note V. Stewardship, Compliance and Accountability (continued)
D. Excess of Expenditures over Appropriations in Individual Funds
Total expenditures exceeded total appropriations in the following funds:
Final Budgeted Amounts Actual
Variance with Final Budgets
Special Revenue Funds:Assessment Financing 1,778,269$ 1,781,643$ (3,374)$ Charitable Gambling 128,531 163,264 (34,733) Right of Way Maintenance 42,291,387 42,336,241 (44,854)
The fund managers have been directed that in the future, funds must have been an appropriation budget to cover all obligations incurred.
The General Fund did not exceed total appropriations at the fund level; however, totalexpenditures exceeded appropriations in the following department:
Final Budgeted Variance withAmounts Actual Final Budgets
General Fund:Emergency Management 377,907$ 393,638$ (15,731)$ Interest - Other Debt 4,011 8,450 (4,439)
(The remainder of this page left blank intentionally)
76
City of Saint Paul, Minnesota NOTES TO THE FINANCIAL STATEMENTS For the Fiscal Year Ended December 31, 2014
Note VI. Detailed Notes on All Funds A. Deposits, Investments and Securities Lending
Deposits In accordance with Minn. Stat. §118A.02 and 118A.04, the City maintains deposits at financial institutions authorized by the City Council. Minn. Stat. §118A.03 further requires that all City deposits be protected by insurance, surety bond, collateral or an irrevocable letter of credit issued by Federal Home Loan Banks. The market value of collateral pledged must equal 110% of the deposits not covered by insurance or bonds.
Authorized collateral includes treasury bills, notes and bonds; issues of U.S. government agencies; general obligations rated “A” or better, revenue obligations rated “AA” or better; irrevocable standby letters of credit issued by the Federal Home Loan Bank; and certificates of deposit. Minnesota Statutes require that securities pledged as collateral be held in safekeeping in a restricted account at the Federal Reserve Bank or in an account at a trust department of a commercial bank or other financial institution that is not owned or controlled by the financial institution furnishing the collateral.
Custodial Credit Risk Custodial credit risk is the risk that, in the event of a financial institution failure, the City’s deposits may not be returned to it. The City’s policy for custodial credit risk for deposits is to maintain compliance with Minnesota Statutes that require the City’s deposits be protected by insurance, surety bond or pledged collateral. As of December 31, 2014, the City’s bank balance of checking and interest-bearing accounts and certificates of deposit totaled $122,178,213 which is also the City’s carrying amount of these balances. As of December 31, 2014, the City’s deposits were not exposed to custodial credit risk. Imprest Funds on Hand At December 31, 2014, the total imprest funds were $102,585. Of this amount, the City had $100,935 on hand. The remaining $1,500 was in various bank accounts and is included with the collateralized deposits.
Investments
General
The City’s Investment Policy Statement governs the investment portfolio of the City of Saint Paul. The goals of the City for the Portfolio are to preserve financial assets for future operating expenses, maintain reserves to fund unplanned shortfalls and generate income to support the activities of the City. The portfolio is managed in three components as follows: 1. Daily Portfolio: The daily component represents current operating funds on which draws are made
frequently, requiring daily liquidity and preservation of principal. The time horizon on the Daily Portfolio is within a 12-month period.
2. Short Term Portfolio: A short-term component serves as a cushion to provide liquidity for possible
shortfalls in the Daily Portfolio. Draws against the short-term portfolio are expected to be infrequent.
77
City of Saint Paul, Minnesota NOTES TO THE FINANCIAL STATEMENTS For the Fiscal Year Ended December 31, 2014
Note VI. Detailed Notes on All Funds (continued)
3. The time horizon on the Short Term Portfolio is between one and three years. 4. Intermediate Term Portfolio: The balance of the Portfolio represents the intermediate term component,
which serves as a reserve for unplanned shortfalls. In general, the Intermediate Term Portfolio is not expected to experience withdrawals and the time horizon on the Intermediate Portfolio is longer than three years. A portion of the Intermediate Term Portfolio is managed internally and the balance is managed by external managers.
Minnesota Statutes §§ 118A.04 and 118A.05 authorize the following types of investments for local governments:
a. securities, which are direct obligations or are guaranteed or insured issues of the United States, its
agencies, its instrumentalities, or organizations created by an act of Congress, except mortgage-backed securities defined as “high risk” by Minnesota Statutes Section 118A.04, Subd. 6;
b. in shares of an investment company registered under the Federal Investment Company Act of 1940,
provided the mutual fund receives certain ratings depending on its investments.
c. general obligations of the State of Minnesota and its municipalities and in any security which is a general obligation of any state or local government with taxing powers which is rated “A” or better by a national bond rating service.
d. in bankers acceptances of United States Banks, or in commercial paper issued by United States
corporations or their Canadian subsidiaries that is rated in the highest quality category by two nationally recognized rating agencies and matures in 270 days or less.
e. Repurchase agreements may be entered into with:
1. a bank qualified as a depository; 2. any national or state bank in the United States which is a member of the Federal Reserve System
and whose combined capital and surplus equals or exceeds $10,000,000; 3. primary reporting dealer in United States government securities to the Federal Reserve Bank of
New York; or 4. a securities broker-dealer, licensed pursuant to Chapter 80A, or an affiliate of it, regulated by the
Securities and Exchange Commission and maintaining a combined capital and surplus of $40,000,000 or more, exclusive of subordinated debt.
f. Securities lending agreements, and Guaranteed investment contracts.
(The remainder of this page left blank intentionally)
78

City of Saint Paul, Minnesota NOTES TO THE FINANCIAL STATEMENTS For the Fiscal Year Ended December 31, 2014
Note VI. Detailed Notes on All Funds (continued) Credit Risk Generally, credit risk is the risk that an issuer of an investment will not fulfill its obligation to the holder of the investment. This is measured by the assignment of a rating by a nationally recognized statistical rating organization. It is the City’s policy to invest only in securities that meet the ratings requirements set by state statute. The City’s exposure to credit risk as of December 31, 2014, is as follows:
Rating Agency Rating Fair Valueaoody's Aaa 165,523,235$ aoody's Aa1 2,096,981 aoody's Aa2 8,323,277 aoody's Aa3 253,855 aoody's A2 222,260 aoody's A3 276,262 aoody's a1G1 145,342 Fitch AAA 136,938 Fitch AA+ 964,124 S&P AAA 13,627,131 S&P AA+ 8,247,574 S&P AA 5,781,585 S&P A+ - S&P A 350,970 S&P A- 1,427,266 S&P SP-1 282,652
N/R 1,637,595 N/A 17,238,312
Total 226,535,359$
Custodial Credit Risk The custodial credit risk for investments is the risk that, in the event of the failure of the counterparty to a transaction, the City will not be able to recover the value of the investment or collateral securities that are in the possession of an outside party. According to City policy, all securities purchased are held by a third-party safekeeping agent appointed as custodian (US Bank) who is also the lending agent/counterparty. Certificates of Deposit and select securities purchased from the City of St. Paul may be kept in the City’s safe. The securities lending agreement, although the program is suspended, in place between the City and its custodian is also consistent with this policy. The City has no custodial credit risk for investments at December 31, 2014. Concentration of Credit Risk The concentration of credit risk is the risk of loss that may be caused by the City’s investment in a single issuer. It is the City’s policy that U.S. Treasury securities, U.S. Agency Securities, and obligations backed by U.S. Treasury and/or U.S. Agency securities, may be held without limit. At December 31, 2014, the City does not have investments in any one issuer that represent 5% or more of the City’s total investments portfolio and therefore, also not subject to concentration of credit risk.
79

City of Saint Paul, Minnesota NOTES TO THE FINANCIAL STATEMENTS For the Fiscal Year Ended December 31, 2014
Note VI. Detailed Notes on All Funds (continued) Interest Rate Risk
Interest rate risk is the risk that changes in the market interest rates will adversely affect the fair value of an investment. The City’s internal portfolio has a shorter overall weighted duration than the benchmarks established for each component portfolio. All else being equal, this would be expected to reduce the risk to adverse effects from rising interest rates. The External Managers, as part of their mandate, have to satisfy the parameters for liquidity and risk tolerance, a maximum duration of 125% of the benchmark duration. The performance benchmark for External Managers was 80% Barclay’s Intermediate Government Index/20% 15-year MBS Index. At December 31, 2014, the City had the following investments:
Less Than 2 - 4 5 - 10 More Than
Investment Type Fair Value 2 years Years Years 10 Years
U.S. Agencies 59,288,288$ 577,975$ 15,161,248$ 19,456,365$ 24,092,700$
State & Local Govt Securities 882,211 882,211 - - -
Munis 26,759,742 2,565,175 1,237,300 15,708,298 7,248,969
Money market funds 12,025,019 12,025,019 - - -
Guaranteed Investment Contract 2,200,000 2,200,000 - - -
Internal Investment Total 101,155,260$ 18,250,380$ 16,398,548$ 35,164,663$ 31,341,669$
U.S. Agencies - US Bancorp 20,952,291 2,890,233 4,070,491 4,970,524 9,021,043
U.S. Agencies - Galliard 24,243,738 1,734,368 2,799,621 5,339,219 14,370,530
U.S. Agencies - NorthShore 4,978,198 728,283 559,105 2,040,714 1,650,096
U.S. Agencies - RBC 22,773,248 1,904,212 7,086,150 6,990,832 6,792,054
Corporate Obligations - NorthShore 2,445,101 586,575 1,576,767 281,759 -
Munis - Galliard 5,572,259 1,155,037 1,272,083 2,647,941 497,198
Munis - NorthShore 2,480,862 357,250 763,918 1,359,694 -
Munis - RBC 9,119,371 2,756,320 2,398,771 3,964,280 -
US Treasuries - US Bancorp 4,786,331 1,485,539 926,654 2,374,138 -
US Treasuries - Galliard 10,787,686 1,332,303 2,901,170 6,554,213 -
US Treasuries - NorthShore 6,407,134 1,253,982 4,281,095 872,057 -
US Treasuries - RBC 8,702,798 1,706,375 5,458,158 1,538,265 -
Investment Pool/Mutual Funds - US Bancorp 398,492 398,492 - - -
Investment Pool/Mutual Funds - Galliard 1,078,768 1,078,768 - - -
Investment Pool/Mutual Funds - NorthShore 201,412 201,412 - - -
Investment Pool/Mutual Funds - RBC 452,410 452,410 - - -
External Managers Investment Total 125,380,099$ 20,021,559$ 34,093,983$ 38,933,636$ 32,330,921$
Total Investments 226,535,359$ 38,271,939$ 50,492,531$ 74,098,299$ 63,672,590$
Included in the total investment pool of $226,535,359 is an equity investment of the RiverCentre Convention & Visitors Authority, a component unit of the City, in the amount of $3,224,368. The remaining amount of $223,310,991 belongs to the City.
80
City of Saint Paul, Minnesota NOTES TO THE FINANCIAL STATEMENTS For the Fiscal Year Ended December 31, 2014
Note VI. Detailed Notes on All Funds (continued)
Duration Duration is a measure of a fixed income investment’s cash flows using present values, weighted for cash flows as a percentage of the investment’s full price. Effective duration makes assumptions regarding the most likely timing and amounts of variable cash flows arising from such investments as callable bonds, prepayments, and variable-rate debt. As of December 31, 2014, the City had the following investments in its external investment pools.
Fair Value Effective DurationFAF Advisors 28,582,215$ 3.29Galliard 41,682,450 3.54NorthShore 14,067,607 3.40RBC 41,047,827 3.50
Total External Investment Pool 125,380,099$
Benchmark (80% Barclay's Interm Gov't/20% 15 Year MBS) 3.34
Recap Deposits and investments as described above appear in the City’s financial statements consistent with the following analysis:
Cash Deposits 122,178,213$ Cash and Investments with Treasurer 276,153,054$ Cash With Fiscal Agents 5,037,564
Investments 223,310,991 Cash and Investments with Trustees 37,203,594 Imprest Funds on Hand 100,935 Imprest Funds 102,585
Restricted Cash 20,770,182 Restricted Investments 6,323,160
Total 345,590,139$ Total 345,590,139$
(The remainder of this page left blank intentionally)
81
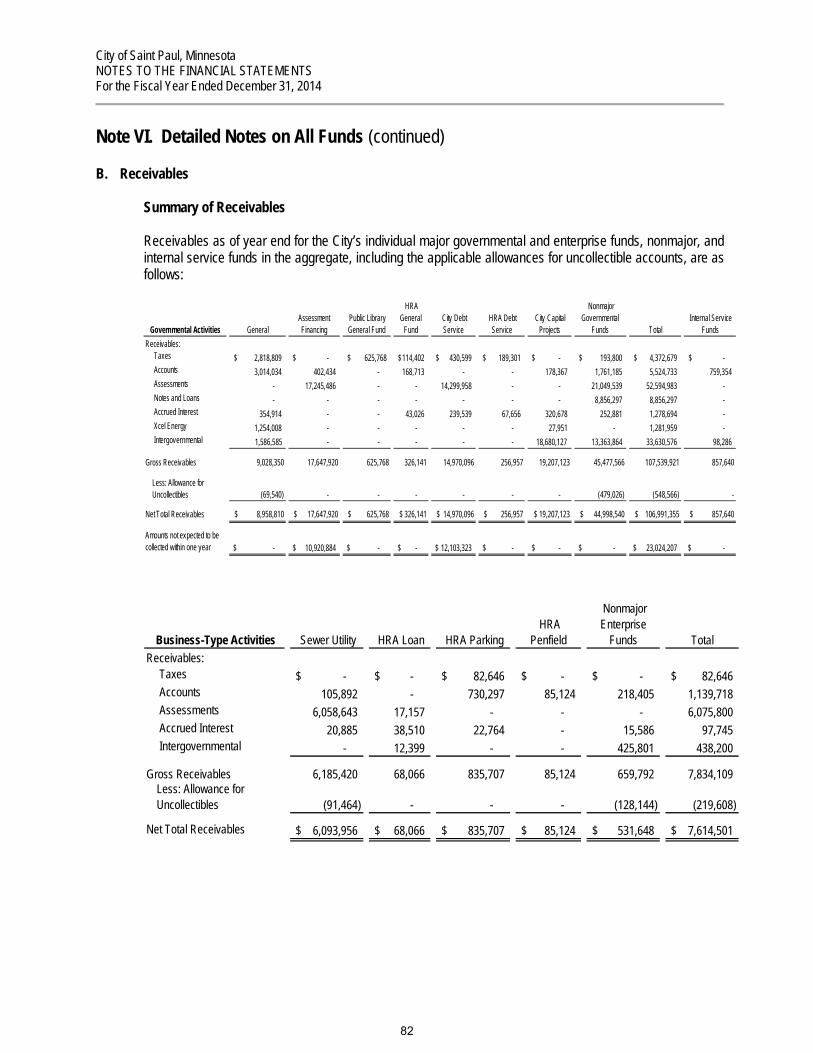
City of Saint Paul, Minnesota NOTES TO THE FINANCIAL STATEMENTS For the Fiscal Year Ended December 31, 2014
Note VI. Detailed Notes on All Funds (continued)
B. Receivables
Summary of Receivables
Receivables as of year end for the City’s individual major governmental and enterprise funds, nonmajor, and internal service funds in the aggregate, including the applicable allowances for uncollectible accounts, are as follows:
Governmental Activities GeneralAssessment Financing
Public Library General Fund
HRA General
Fund City Debt Service
HRA Debt Service
City Capital Projects
Nonmajor Governmental
Funds Total Internal Service
Funds Receivables:
Taxes 2,818,809$ -$ 625,768$ 114,402$ 430,599$ 189,301$ -$ 193,800$ 4,372,679$ -$ Accounts 3,014,034 402,434 - 168,713 - - 178,367 1,761,185 5,524,733 759,354 Assessments - 17,245,486 - - 14,299,958 - - 21,049,539 52,594,983 - Notes and Loans - - - - - - - 8,856,297 8,856,297 - Accrued Interest 354,914 - - 43,026 239,539 67,656 320,678 252,881 1,278,694 - Xcel Energy 1,254,008 - - - - - 27,951 - 1,281,959 - Intergovernmental 1,586,585 - - - - - 18,680,127 13,363,864 33,630,576 98,286
Gross Receivables 9,028,350 17,647,920 625,768 326,141 14,970,096 256,957 19,207,123 45,477,566 107,539,921 857,640
Less: Allowance for Uncollectibles (69,540) - - - - - - (479,026) (548,566) -
Net Total Receivables $ 8,958,810 $ 17,647,920 $ 625,768 $ 326,141 $ 14,970,096 $ 256,957 $ 19,207,123 $ 44,998,540 $ 106,991,355 $ 857,640
Amounts not expected to be collected within one year -$ 10,920,884$ -$ -$ 12,103,323$ -$ -$ -$ 23,024,207$ -$
Business-Type Activities Sewer Utility HRA Loan HRA Parking HRA
Penfield
Nonmajor Enterprise
Funds TotalReceivables:
Taxes -$ -$ 82,646$ -$ -$ 82,646$ Accounts 105,892 - 730,297 85,124 218,405 1,139,718 Assessments 6,058,643 17,157 - - - 6,075,800 Accrued Interest 20,885 38,510 22,764 - 15,586 97,745 Intergovernmental - 12,399 - - 425,801 438,200
Gross Receivables 6,185,420 68,066 835,707 85,124 659,792 7,834,109 Less: Allowance for Uncollectibles (91,464) - - - (128,144) (219,608)
Net Total Receivables 6,093,956$ 68,066$ 835,707$ 85,124$ 531,648$ 7,614,501$
82

City of Saint Paul, Minnesota NOTES TO THE FINANCIAL STATEMENTS For the Fiscal Year Ended December 31, 2014
Note VI. Detailed Notes on All Funds (continued) Property Taxes
For property taxes collectible in 2014, Saint Paul’s taxable net tax capacity (including Tax Increment Districts) was $218,772,524; the estimated market value was $18,425,451,200; the net tax capacity was 1.19% of the estimated market value. Estimated market values are converted to tax capacities based on a statutory rate for each class of property.
Current property tax collections for the year ended December 31, 2014, were as follows:
City HRA
Dollar Amount 98,671,524$ 3,129,461$ Percent of Levy Spread 99.27% 98.47%
Notes and Loans Receivable Notes and Loans Receivable are reported as assets in the following funds at December 31, 2014: Special Revenue Funds:
City HUD Grants 4,211,522$ City Sales Tax 3,679,006
Total Special Revenue Funds 7,890,528
Capital Projects Funds:HRA Development 209,519HRA Tax Increment 756,250
Total Capital Projects Funds 965,769
Total 8,856,297$
In addition to the above amounts reported as “Notes and Loans Receivable” on Statement 3, other long-term loans receivable are included in “Other Long-Term Receivables” in the following funds: Enterprise Fund:
HRA Loan Enterprise 4,227,804$ HRA Parking 236,250
Internal Service Funds:Internal Borrowing 1,662,500
Total 6,126,554$
The amount reported for loans receivable is net of allowances for uncollectible loans. Allowances for uncollectible loans have been established for loans for which collection is doubtful or questionable. At December 31, 2014, the allowance for uncollectible loans recorded was $127,642,410.
83

City of Saint Paul, Minnesota NOTES TO THE FINANCIAL STATEMENTS For the Fiscal Year Ended December 31, 2014
Note VI. Detailed Notes on All Funds (continued) C. Land Held for Resale
Land Held for Resale is reported in the following funds as an asset as of December 31, 2014:
Special Revenue FundsHRA General Fund 488,345$ City HUD Grants 5,393,593
Total Special Revenue Funds 5,881,938
Capital Projects FundsHRA Development Capital Projects 1,648,678 HRA Tax Increment Capital Projects 1,352,328
Total Capital Projects Funds 3,001,006
Enterprise FundHRA Loan 7,222,021
Total 16,104,965$
D. Restricted Assets
As of December 31, 2014, the following restricted assets were reported in the following enterprise funds:
Sewer Utility HRA ParkingParks Special
Services HRA Lofts
Cash for General Obligation Bond Current Debt Service -$ 2,377,846$ -$ -$ Cash for Limited Tax Bond Debt Services - - - 364,871 Cash for Limited Tax Bond Operations and Maintenance - - - 370,885 Cash for Revenue Bond Debt Service 1,888,026 2,646,304 - - Cash for Revenue Bond Operations and Maintenance 4,393,334 201,185 - - Cash for Revenue Bond Construction 3,464,962 - - - Cash for Budget and Rate Stabilization 5,062,769 - - - Investment for Revenue Bond Future Debt Service 5,656,410 - - - Investment for Revenue Bond Construction - - 666,750 -
Total 20,465,501$ 5,225,335$ 666,750$ 735,756$
84

City of Saint Paul, Minnesota NOTES TO THE FINANCIAL STATEMENTS For the Fiscal Year Ended December 31, 2014
Note VI. Detailed Notes on All Funds (continued)
E. Capital Assets Capital asset activity for the year ended December 31, 2014 was as follows: Governmental Activities
Balance Balance01/01/14 Additions Deductions 12/31/14
Capital Assets Not Being Depreciated: Land $ 152,394,933 $ 647,758 -$ $ 153,042,691 Construction in Progress 117,672,020 60,248,346 (17,965,764) 159,954,602
Total Capital Assets Not Being Depreciated 270,066,953 60,896,104 (17,965,764) 312,997,293
Capital Assets Being Depreciated: Buildings and Structures 614,117,404 11,582,105 - 625,699,509 Improvements Other than Buildings 146,140,648 1,780,305 - 147,920,953 Equipment 103,929,110 25,158,140 (1,279,646) 127,807,604 Infrastructure 739,510,371 14,584,195 - 754,094,566
Total Capital Assets Being Depreciated 1,603,697,533 53,104,745 (1,279,646) 1,655,522,632
Less: Accumulated Depreciation for: Buildings and Structures (267,699,049) (14,894,015) - (282,593,064) Improvements Other than Buildings (52,939,684) (5,758,551) - (58,698,235) Equipment (76,335,378) (9,014,781) 1,268,847 (84,081,312) Infrastructure (284,007,750) (13,773,756) - (297,781,506)
Total Accumulated Depreciation (680,981,861) (43,441,103) 1,268,847 (723,154,117)
Total Capital Assets Being Depreciated, Net 922,715,672 9,663,642 (10,799) 932,368,515
Governmental Activities Capital Assets, Net $ 1,192,782,625 $ 70,559,746 $ (17,976,563) $1,245,365,808
Depreciation expense was charged to the following governmental functions:
General Government 13,139,226$ Public Safety 5,194,121 Highways and Streets 15,384,567 Culture and Recreation 8,945,024 Housing and Economic Development 778,165
Total Governmental Activities Depreciation Expense 43,441,103$
85
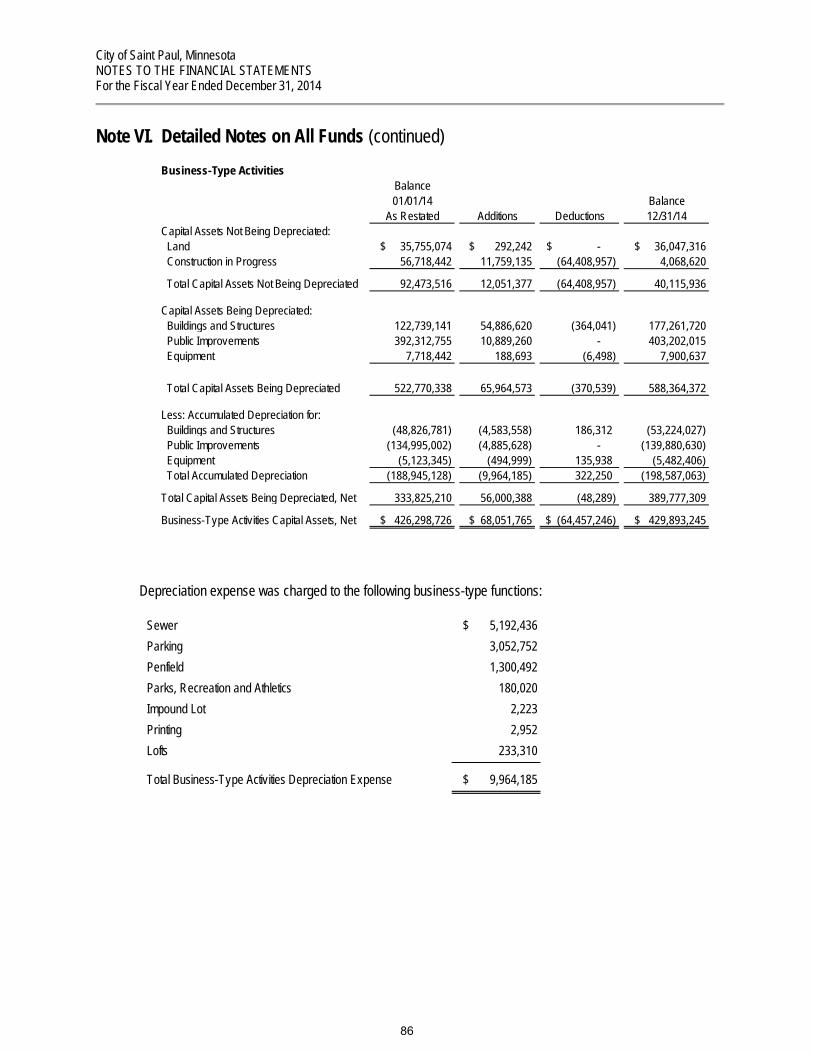
City of Saint Paul, Minnesota NOTES TO THE FINANCIAL STATEMENTS For the Fiscal Year Ended December 31, 2014
Note VI. Detailed Notes on All Funds (continued)
Business-Type ActivitiesBalance 01/01/14 Balance
As Restated Additions Deductions 12/31/14Capital Assets Not Being Depreciated: Land $ 35,755,074 $ 292,242 -$ $ 36,047,316 Construction in Progress 56,718,442 11,759,135 (64,408,957) 4,068,620
Total Capital Assets Not Being Depreciated 92,473,516 12,051,377 (64,408,957) 40,115,936
Capital Assets Being Depreciated: Buildings and Structures 122,739,141 54,886,620 (364,041) 177,261,720 Public Improvements 392,312,755 10,889,260 - 403,202,015 Equipment 7,718,442 188,693 (6,498) 7,900,637
Total Capital Assets Being Depreciated 522,770,338 65,964,573 (370,539) 588,364,372
Less: Accumulated Depreciation for: Buildings and Structures (48,826,781) (4,583,558) 186,312 (53,224,027) Public Improvements (134,995,002) (4,885,628) - (139,880,630) Equipment (5,123,345) (494,999) 135,938 (5,482,406) Total Accumulated Depreciation (188,945,128) (9,964,185) 322,250 (198,587,063)
Total Capital Assets Being Depreciated, Net 333,825,210 56,000,388 (48,289) 389,777,309
Business-Type Activities Capital Assets, Net $ 426,298,726 $ 68,051,765 $ (64,457,246) $ 429,893,245
Depreciation expense was charged to the following business-type functions:
Sewer $ 5,192,436 Parking 3,052,752 Penfield 1,300,492 Parks, Recreation and Athletics 180,020 Impound Lot 2,223 Printing 2,952 Lofts 233,310
Total Business-Type Activities Depreciation Expense $ 9,964,185
86
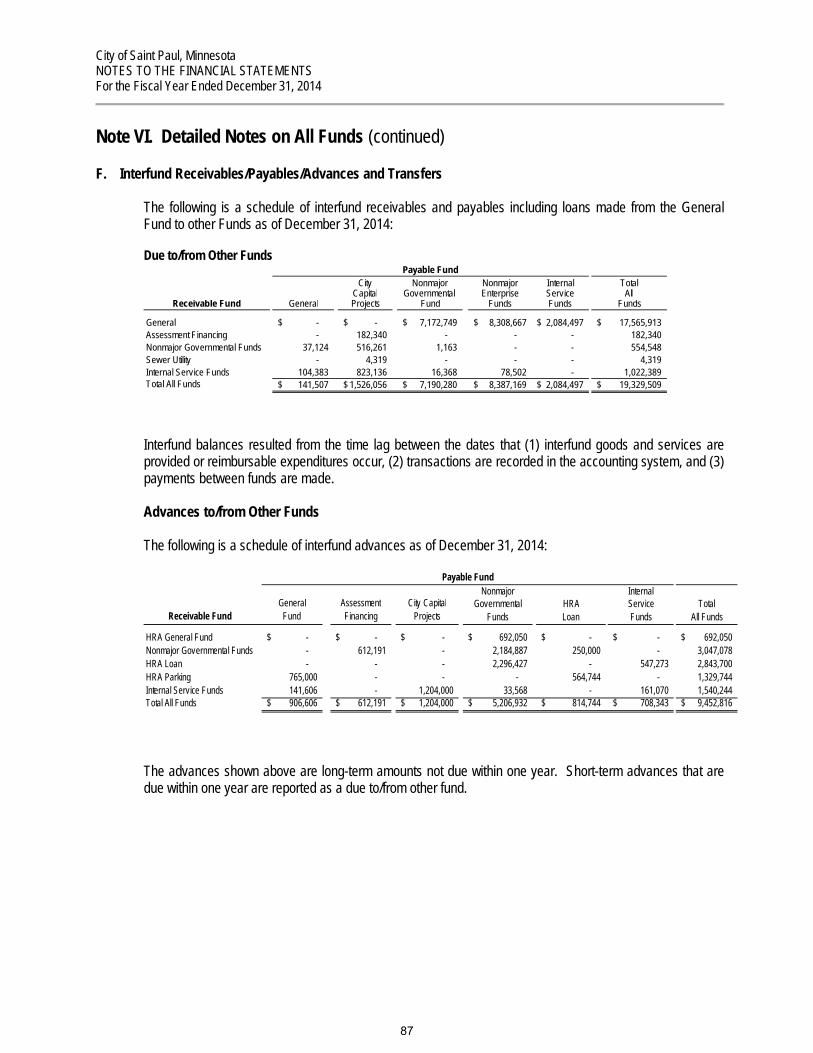
City of Saint Paul, Minnesota NOTES TO THE FINANCIAL STATEMENTS For the Fiscal Year Ended December 31, 2014
Note VI. Detailed Notes on All Funds (continued)
F. Interfund Receivables/Payables/Advances and Transfers
The following is a schedule of interfund receivables and payables including loans made from the General Fund to other Funds as of December 31, 2014: Due to/from Other Funds
City Nonmajor Nonmajor Internal TotalCapital Governmental Enterprise Service All
Receivable Fund General Projects Fund Funds Funds Funds
General -$ -$ 7,172,749$ 8,308,667$ 2,084,497$ 17,565,913$ Assessment Financing - 182,340 - - - 182,340 Nonmajor Governmental Funds 37,124 516,261 1,163 - - 554,548 Sewer Utility - 4,319 - - - 4,319 Internal Service Funds 104,383 823,136 16,368 78,502 - 1,022,389 Total All Funds 141,507$ 1,526,056$ 7,190,280$ 8,387,169$ 2,084,497$ 19,329,509$
Payable Fund
Interfund balances resulted from the time lag between the dates that (1) interfund goods and services are provided or reimbursable expenditures occur, (2) transactions are recorded in the accounting system, and (3) payments between funds are made. Advances to/from Other Funds
The following is a schedule of interfund advances as of December 31, 2014:
Nonmajor InternalGeneral Assessment City Capital Governmental HRA Service Total
Receivable Fund Fund Financing Projects Funds Loan Funds All Funds
HRA General Fund -$ -$ -$ 692,050$ -$ -$ 692,050$ Nonmajor Governmental Funds - 612,191 - 2,184,887 250,000 - 3,047,078 HRA Loan - - - 2,296,427 - 547,273 2,843,700 HRA Parking 765,000 - - - 564,744 - 1,329,744 Internal Service Funds 141,606 - 1,204,000 33,568 - 161,070 1,540,244 Total All Funds 906,606$ 612,191$ 1,204,000$ 5,206,932$ 814,744$ 708,343$ 9,452,816$
Payable Fund
The advances shown above are long-term amounts not due within one year. Short-term advances that are due within one year are reported as a due to/from other fund.
87
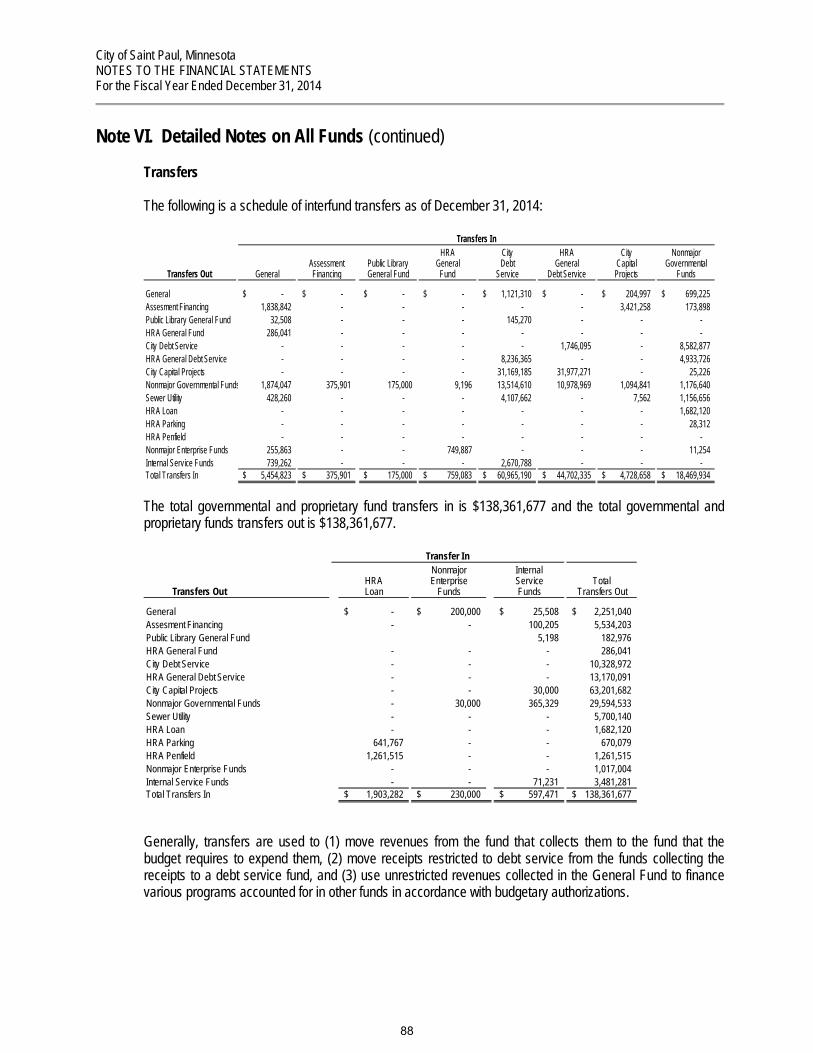
City of Saint Paul, Minnesota NOTES TO THE FINANCIAL STATEMENTS For the Fiscal Year Ended December 31, 2014
Note VI. Detailed Notes on All Funds (continued) Transfers The following is a schedule of interfund transfers as of December 31, 2014:
HRA City HRA City NonmajorAssessment Public Library General Debt General Capital Governmental
Transfers Out General Financing General Fund Fund Service Debt Service Projects Funds
General -$ -$ -$ -$ 1,121,310$ -$ 204,997$ 699,225$ Assesment Financing 1,838,842 - - - - - 3,421,258 173,898 Public Library General Fund 32,508 - - - 145,270 - - - HRA General Fund 286,041 - - - - - - - City Debt Service - - - - - 1,746,095 - 8,582,877 HRA General Debt Service - - - - 8,236,365 - - 4,933,726 City Capital Projects - - - - 31,169,185 31,977,271 - 25,226 Nonmajor Governmental Funds 1,874,047 375,901 175,000 9,196 13,514,610 10,978,969 1,094,841 1,176,640 Sewer Utility 428,260 - - - 4,107,662 - 7,562 1,156,656 HRA Loan - - - - - - - 1,682,120 HRA Parking - - - - - - - 28,312 HRA Penfield - - - - - - - - Nonmajor Enterprise Funds 255,863 - - 749,887 - - - 11,254 Internal Service Funds 739,262 - - - 2,670,788 - - - Total Transfers In 5,454,823$ 375,901$ 175,000$ 759,083$ 60,965,190$ 44,702,335$ 4,728,658$ 18,469,934$
Transfers In
The total governmental and proprietary fund transfers in is $138,361,677 and the total governmental and
proprietary funds transfers out is $138,361,677.
Nonmajor InternalHRA Enterprise Service Total
Transfers Out Loan Funds Funds Transfers Out
General -$ 200,000$ 25,508$ 2,251,040$ Assesment Financing - - 100,205 5,534,203 Public Library General Fund 5,198 182,976 HRA General Fund - - - 286,041 City Debt Service - - - 10,328,972 HRA General Debt Service - - - 13,170,091 City Capital Projects - - 30,000 63,201,682 Nonmajor Governmental Funds - 30,000 365,329 29,594,533 Sewer Utility - - - 5,700,140 HRA Loan - - - 1,682,120 HRA Parking 641,767 - - 670,079 HRA Penfield 1,261,515 - - 1,261,515 Nonmajor Enterprise Funds - - - 1,017,004 Internal Service Funds - - 71,231 3,481,281 Total Transfers In 1,903,282$ 230,000$ 597,471$ 138,361,677$
Transfer In
Generally, transfers are used to (1) move revenues from the fund that collects them to the fund that the budget requires to expend them, (2) move receipts restricted to debt service from the funds collecting the receipts to a debt service fund, and (3) use unrestricted revenues collected in the General Fund to finance various programs accounted for in other funds in accordance with budgetary authorizations.
88

City of Saint Paul, Minnesota NOTES TO THE FINANCIAL STATEMENTS For the Fiscal Year Ended December 31, 2014
Note VI. Detailed Notes on All Funds (continued) G. Long-Term Obligations
1. Changes in Long-Term Obligations
BeginningBalance Ending Due Within
As Restated Increases Decreases Balance One YearGOVERNMENTAL ACTIVITIES
Bonds Payable:General Obligation Bonds
Property Tax Supported 166,137,942$ 49,216,655$ (29,512,522)$ 185,842,075$ 13,976,831$ Special Assessment Debt with
Governmental Commitment 21,022,058 8,643,345 (3,572,478) 26,092,925 2,188,169 HRA Tax Increment 14,765,000 1,995,000 (2,880,000) 13,880,000 1,550,000
Total General Obligation Bonds 201,925,000 59,855,000 (35,965,000) 225,815,000 17,715,000
Revenue BondsSales Tax Revenue Bonds 78,160,000 36,265,000 (3,595,000) 110,830,000 4,885,000 HRA Tax Increment Revenue Bonds 32,420,000 - (1,980,000) 30,440,000 1,611,000 HRA Sales Tax Revenue Bonds 31,430,000 - (31,430,000) - - HRA Lease Revenue Bonds 11,880,000 - (630,000) 11,250,000 650,000
Total Revenue Bonds 153,890,000 36,265,000 (37,635,000) 152,520,000 7,146,000
Add/(Subtract) Unamortized Amounts for:(Discounts)/Premiums Refundings -
Gains/(Losses) 6,999,821 10,111,266 (1,203,183) 15,907,904 1,121,845
Total Bonds 362,814,821 106,231,266 (74,803,183) 394,242,904 25,982,845
Revenue Notes PayableGeneral Obligation Notes Payable 17,218,917 - (2,331,985) 14,886,932 2,386,044 Revenue Notes Payable 31,250,000 33,720,000 (3,500,000) 61,470,000 5,295,000 HRA Revenue Notes Payable 14,491,104 - (560,589) 13,930,515 435,830 Add/(Subtract) Unamortized Amounts for:
(Discounts)/Premiums Refundings -Gains/(Losses) 385,307 - (42,812) 342,495 42,812
Total Revenue Notes Payable 63,345,328 33,720,000 (6,435,386) 90,629,942 8,159,686
Other Liabilities:Compensated Absences 19,400,206 4,169,545 (376,613) 23,193,138 1,633,372 Net Other Postemployment Benefits Obligation 35,347,183 4,369,046 - 39,716,229 - Claims and Judgments Payable 38,165,057 11,728,772 (14,283,430) 35,610,399 7,929,724 Capital Leases 12,622,008 3,505,600 (2,841,946) 13,285,662 3,021,309
Total Other Liabilities 105,534,454 23,772,963 (17,501,989) 111,805,428 12,584,405
Total Governmental Activities Long-Term Liabilities 531,694,603$ 163,724,229$ (98,740,558)$ 596,678,274$ 46,726,936$
Long-term obligations activity in the year ended December 31, 2014 was as follows:
The January 1, 2014 balance of the HRA Revenue Notes Payable was restated by ($3,819,387) for reclassification of a note payable to a pay-as-you-go tax increment note.
89

City of Saint Paul, Minnesota NOTES TO THE FINANCIAL STATEMENTS For the Fiscal Year Ended December 31, 2014
Note VI. Detailed Notes on All Funds (continued)
AmountsBeginning Ending Due WithinBalance Increases Decreases Balance One Year
BUSINESS-TYPE ACTIVITIESBonds Payable:
General Obligation BondsHRA General Obligation Debt 23,235,000$ -$ (1,710,000)$ 21,525,000$ 1,650,000$
Total General Obligation Bonds 23,235,000 - (1,710,000) 21,525,000 1,650,000
Limited Tax Bonds 7,855,000 - (100,000) 7,755,000 110,000
Revenue BondsRevenue Bonds 71,910,000 8,000,000 (4,235,000) 75,675,000 4,655,000 HRA Parking Facilities Revenue Bonds 37,815,000 - (1,830,000) 35,985,000 1,915,000
Total Revenue Bonds 109,725,000 8,000,000 (6,065,000) 111,660,000 6,570,000
Add/(Subtract) Unamortized Amounts for:(Discounts)/Premiums Refundings -
Gains/(Losses) 2,314,612 313,994 (202,886) 2,425,720 202,551
Total Bonds 143,129,612 8,313,994 (8,077,886) 143,365,720 8,532,551
Mortgage Payable 33,372,108 7,570,692 (477,880) 40,464,920 654,796
Revenue Notes PayableRevenue Notes Payable 7,562,769 - (1,196,688) 6,366,081 1,172,132 HRA Revenue Notes Payable 1,580,000 - - 1,580,000 -
Total Revenue Notes Payable 9,142,769 - (1,196,688) 7,946,081 1,172,132
Other Liabilities:Compensated Absences 762,472 39,466 (51,396) 750,542 39,467 Net Other Postemployment Benefits Obligation 947,666 297,285 (320,993) 923,958 -
Total Other Liabilities 1,710,138 336,751 (372,389) 1,674,500 39,467
Total Business-Type ActivitiesLong-Term Liabilities 187,354,627$ 16,221,437$ (10,124,843)$ 193,451,221$ 10,398,946$
TOTAL LONG-TERM OBLIGATION 719,049,230$ 179,945,666$ (108,865,401)$ 790,129,495$ 57,125,882$
Internal Service funds predominantly serve the governmental funds. Accordingly, their long-term liabilities are included as part of the totals reported for governmental funds. At year end, $2,030,331 of compensated absences, $4,886,985 of capital leases and $4,923,637 of net other postemployment benefits obligation were included in the amounts reported for the governmental funds.
The government-wide statement of net position includes $3,148,621 of the long-term liabilities due within one year for business-type activities in “liabilities payable from restricted assets.” The remaining amount of $7,250,325 was displayed as “noncurrent liabilities due within one year” on the same statement.
90
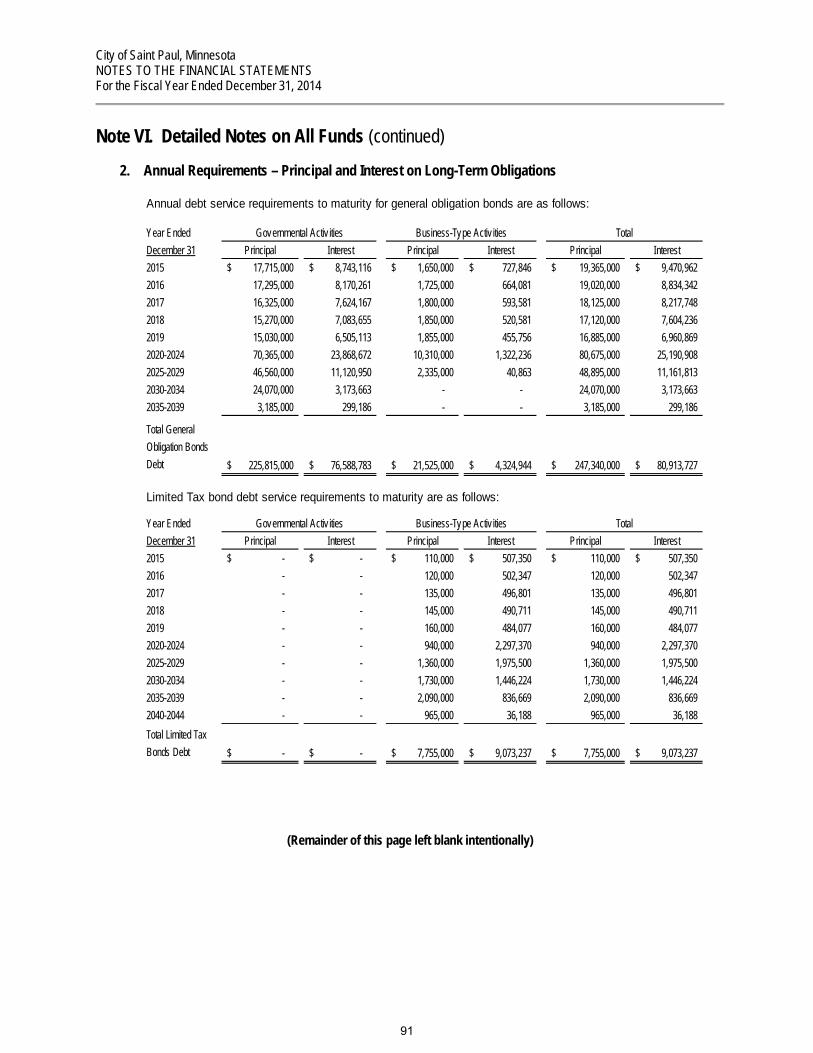
City of Saint Paul, Minnesota NOTES TO THE FINANCIAL STATEMENTS For the Fiscal Year Ended December 31, 2014
Note VI. Detailed Notes on All Funds (continued)
2. Annual Requirements – Principal and Interest on Long-Term Obligations
Year EndedDecember 31 Principal Interest Principal Interest Principal Interest2015 17,715,000$ 8,743,116$ 1,650,000$ 727,846$ 19,365,000$ 9,470,962$ 2016 17,295,000 8,170,261 1,725,000 664,081 19,020,000 8,834,342 2017 16,325,000 7,624,167 1,800,000 593,581 18,125,000 8,217,748 2018 15,270,000 7,083,655 1,850,000 520,581 17,120,000 7,604,236 2019 15,030,000 6,505,113 1,855,000 455,756 16,885,000 6,960,869 2020-2024 70,365,000 23,868,672 10,310,000 1,322,236 80,675,000 25,190,908 2025-2029 46,560,000 11,120,950 2,335,000 40,863 48,895,000 11,161,813 2030-2034 24,070,000 3,173,663 - - 24,070,000 3,173,663 2035-2039 3,185,000 299,186 - - 3,185,000 299,186
Total General Obligation Bonds Debt 225,815,000$ 76,588,783$ 21,525,000$ 4,324,944$ 247,340,000$ 80,913,727$
Year EndedDecember 31 Principal Interest Principal Interest Principal Interest2015 -$ -$ 110,000$ 507,350$ 110,000$ 507,350$ 2016 - - 120,000 502,347 120,000 502,347 2017 - - 135,000 496,801 135,000 496,801 2018 - - 145,000 490,711 145,000 490,711 2019 - - 160,000 484,077 160,000 484,077 2020-2024 - - 940,000 2,297,370 940,000 2,297,370 2025-2029 - - 1,360,000 1,975,500 1,360,000 1,975,500 2030-2034 - - 1,730,000 1,446,224 1,730,000 1,446,224 2035-2039 - - 2,090,000 836,669 2,090,000 836,669 2040-2044 - - 965,000 36,188 965,000 36,188 Total Limited Tax Bonds Debt -$ -$ 7,755,000$ 9,073,237$ 7,755,000$ 9,073,237$
Annual debt service requirements to maturity for general obligation bonds are as follows:
Governmental Activ ities Business-Type Activ ities Total
Limited Tax bond debt service requirements to maturity are as follows:
Governmental Activ ities Business-Type Activ ities Total
(Remainder of this page left blank intentionally)
91

City of Saint Paul, Minnesota NOTES TO THE FINANCIAL STATEMENTS For the Fiscal Year Ended December 31, 2014
Note VI. Detailed Notes on All Funds (continued)
Year EndedDecember 31 Principal Interest Principal Interest Principal Interest2015 7,146,000$ 7,563,385$ 6,570,000$ 4,593,421$ 13,716,000$ 12,156,806$ 2016 7,309,000 7,394,682 6,870,000 4,266,812 14,179,000 11,661,494 2017 8,058,000 7,024,893 7,105,000 4,003,061 15,163,000 11,027,954 2018 7,283,000 6,670,873 6,390,000 3,715,092 13,673,000 10,385,965 2019 7,663,000 6,315,265 6,210,000 3,473,605 13,873,000 9,788,870 2020-2024 48,675,000 25,320,383 31,565,000 13,576,857 80,240,000 38,897,240 2025-2029 49,326,000 11,474,847 28,810,000 7,290,128 78,136,000 18,764,975 2030-2034 17,060,000 1,693,000 15,735,000 2,550,260 32,795,000 4,243,260 2035-2039 - - 2,405,000 120,250 2,405,000 120,250 Total Revenue Bonds Debt 152,520,000$ 73,457,328$ 111,660,000$ 43,589,486$ 264,180,000$ 117,046,814$
Year EndedDecember 31 Principal Interest Principal Interest Principal Interest2015 -$ -$ 654,796$ 1,253,195$ 654,796$ 1,253,195$ 2016 - - 675,521 1,232,470 675,521 1,232,470 2017 - - 696,901 1,211,090 696,901 1,211,090 2018 - - 718,958 1,189,033 718,958 1,189,033 2019 741,713 1,166,278 741,713 1,166,278 2020-2024 - - 4,075,909 5,464,044 4,075,909 5,464,044 2025-2029 - - 4,763,065 4,776,888 4,763,065 4,776,888 2030-2034 - - 5,566,069 3,973,885 5,566,069 3,973,885 2035-2039 - - 6,141,975 3,039,257 6,141,975 3,039,257 2040-2054 - - 16,430,013 3,948,716 16,430,013 3,948,716 Total Mortgage Debt -$ -$ 40,464,920$ 27,254,856$ 40,464,920$ 27,254,856$
Year EndedDecember 31 Principal Interest Principal Interest Principal Interest2015 8,116,874$ 1,984,097$ 1,172,131$ 239,306$ 9,289,005$ 2,223,403$ 2016 8,981,545 1,844,346 1,167,900 198,645 10,149,445 2,042,991 2017 9,157,609 1,695,831 1,170,141 158,092 10,327,750 1,853,923 2018 9,306,823 1,537,305 2,739,600 117,017 12,046,423 1,654,322 2019 9,308,128 1,379,648 1,035,309 60,119 10,343,437 1,439,767 2020-2024 16,771,616 5,039,390 661,000 25,581 17,432,616 5,064,971 2025-2029 21,184,852 2,901,057 - - 21,184,852 2,901,057 2030-2034 7,460,000 627,688 - - 7,460,000 627,688 2034-2038 - - - - - - Total Revenue Notes Debt 90,287,447$ 17,009,362$ 7,946,081$ 798,760$ 98,233,528$ 17,808,122$
Revenue notes debt service requirements to maturity are as follows:
Governmental Activities Business-Type Activities Total
Mortgage debt service requirements to maturity are as follows:
Governmental Activities Business-Type Activities Total
Revenue bond debt service requirements to maturity are as follows:
Governmental Activities Business-Type Activities Total
92
City of Saint Paul, Minnesota NOTES TO THE FINANCIAL STATEMENTS For the Fiscal Year Ended December 31, 2014
Note VI. Detailed Notes on All Funds (continued)
Compensated Absences Included in the City’s governmental long-term obligations is $23,193,138 of accrued compensated absences relating to employees not accounted for in proprietary funds. Governmental funds that report salaries in their statement of revenues, expenditures and changes in fund balance are charged on a proportionate basis for the actual payments made by the General Fund of the severance pay portion of the compensated absences liability. Actual payments of the vacation and compensatory time portion of the compensated absences liability are made directly from the same governmental funds that incurred the salary expenditures.
Claims and Judgments Payable Claim and judgment expenditures and liabilities are reported when it is probable that a loss has occurred and the amount of the loss can be reasonably estimated. These liabilities include an estimate of claims that have been incurred but not reported (IBNR). Claim expenditures relating to tort liabilities are paid from the General Fund. Workers’ Compensation claim expenditures are recorded in the General Fund and are allocated to other City funds based upon a fringe benefit rate applied to each fund’s actual salaries. The liability for claims and judgments is reported in the government-wide financial statements. At December 31, 2014, the claims and judgments liability was $35,610,399.
Net Other Postemployment Benefits Obligation At December 31, 2014, the net other postemployment benefits liability was $39,716,229. Other postemployment benefits are generally liquidated through the General Fund. Capital Leases During December 2014, the City entered into a master tax-exempt lease/purchase agreement for the purchase of police and fire equipment for $2,295,600 at an interest rate of 1.22% Annual liquidation of this capital lease liability is reported in the City Debt Service Fund. During December 2014, the City entered into a master tax-exempt lease/purchase agreement for the purchase of public works vehicles for $1,210,000 at an interest rate of 1.94%. Annual liquidation of this capital lease liability is reported in the City Debt Service Fund. The following is a schedule by years of future minimum lease payments under these capital leases, together with the present value of the net minimum lease payments of December 31, 2014.
(The remainder of this page left blank intentionally)
93

City of Saint Paul, Minnesota NOTES TO THE FINANCIAL STATEMENTS For the Fiscal Year Ended December 31, 2014
Note VI. Detailed Notes on All Funds (continued)
Capital Leases – Governmental Activity
Year Ended December 31
2015 531,863$ 393,622$ 458,875$ 184,175$ 638,641$ 181,377$ 781,559$ 185,719$ 3,355,831$ 2016 531,862 390,545 - 184,175 319,321 181,377 781,559 185,719 2,574,558 2017 531,862 392,288 - 184,175 - 181,377 781,559 185,719 2,256,980 2018 531,863 393,672 - 184,175 - 181,377 - 185,719 1,476,806 2019 - 394,697 - 92,088 - 181,377 - 185,719 853,881 Thereafter - 4,287,256 - - - 90,688 - 371,438 4,749,382
Total Minimum Lease Payments 2,127,450 6,252,080 458,875 828,788 957,962 997,573 2,344,677 1,300,033 15,267,438 Less Amount Representing Interest (203,198) (1,555,080) (2,583) (34,585) (8,177) (39,043) (49,077) (90,033) (1,981,776)
Present Value of Future Capital Lease Payments $ 1,924,252 $4,697,000 $ 456,292 $ 794,203 $ 949,785 $ 958,530 $ 2,295,600 $1,210,000 $ 13,285,662
City Hall Annex
Improvements
RiverCentre Pedestrian
Link
2014 Public Safety
Equipment Lease
2014 Public Works
Equpment Lease Totals
2012 Public Safety
Equipment Lease
2012 Public Works Vehicle Lease
2013 Public Safety Vehicle Lease
2013 Public Works Vehicle Lease
(Remainder of this page left blank intentionally)
94

City of Saint Paul, Minnesota NOTES TO THE FINANCIAL STATEMENTS For the Fiscal Year Ended December 31, 2014
Note VI. Detailed Notes on All Funds (continued) In December 2003, a loan agreement, with a revolving line of credit, was executed between the Saint Paul Foundation (Foundation) and the HRA whereby the Foundation has made available funds in the amount of $2,500,000 to the HRA for use in its major housing initiative, the Housing 5000 Program. Any of the funds advanced under the loan agreement to the HRA by the Foundation are to be used solely for developer loans on approved housing projects. The HRA is to repay the principal amount of the advances to the Foundation as the developer loans are repaid to the HRA. Simple interest of one percent on the outstanding Foundation advances is payable on each December 31 starting with 2004. December 1, 2015, is the final maturity date under the loan agreement. Under the revolving loan agreement, there is $2,500,000 available in loan funds from the Foundation at December 31, 2014. Long term loans in the amount of $1,580,000 were obtained from the LAAND Initiative Fund of the Metropolitan Council and the Family Housing Fund to purchase two parcels of land along the Central Corridor route. This land is to be developed for affordable housing use. Sales of the land parcels will be used to retire the loans. The total principal amount of the long-term portion of the loans at December 31, 2014, was $1,580,000.
Compensated Absences Proprietary fund accrued liabilities for compensated absences are also included in the City’s long-term obligations of $750,542. Liabilities have been reported in the appropriate fund’s financial statements. Net Other Postemployment Benefits Proprietary fund accrued liabilities for net other postemployment benefits are also included in the City’s long-term obligations of $923,958. Liabilities have been reported in the appropriate fund’s financial statements. Bond Sales On April 30, 2014 the City issued General Obligation Capital Improvement Bonds, Series 2014A in the amount of $14,655,000. The proceeds were used to current refund the City’s General Obligation Capital Improvement Bonds, Series 2005A in the amount of $2,270,000 and General Obligation Capital Improvement Bonds, Series 2006A in the amount of $2,650,000 and fund various capital improvement projects identified in the City’s approved Capital Improvement Budget for the years 2014 through 2018. The net present value benefit of refunding the 2005A Bonds was $19,896 and the net present value benefit of refunding the 2006A Bonds was $88,554. The 2014A Bonds were issued with a true interest cost of 1.96%. On April 30, 2014, the City issued General Obligation Street Improvement Special Assessment Bonds, Series 2014B in the amount of $28,375,000. The savings were used to current refund the City’s General Obligation Street Improvement Special Assessment Bonds, Series 2004B in the amount of $1,085,000 and the City’s General Obligation Improvement Special Assessment Bonds, Series 2005B in the amount of $1,150,000 and advance crossover refund the City’s General Obligation Improvement Special Assessment Bonds, Series 2006B in the amount of $6,835,000 and advance crossover refund the City’s General Obligation Improvement Special Assessment Bonds, Series 2007D in the amount of $7,365,000 and fund certain improvement and rehabilitation projects for 2014. The net present value benefit of refunding the 2004B Bonds was $47,610, the net present value benefit of refunding the 2005B Bonds was $79,277, the net present value benefit of refunding the 2006B Bonds was $680,392, and the net present value benefit of refunding the 2007D Bonds was $730,562. The 2014B Bonds were issued with a true interest cost of 2.60%. On April 30, 2014, the City issued General Obligation Library Bonds, Series 2014C in the amount of $14,830,000. The proceeds were used to current refund the Library Agency’s General Obligation Library
95

City of Saint Paul, Minnesota NOTES TO THE FINANCIAL STATEMENTS For the Fiscal Year Ended December 31, 2014
Note VI. Detailed Notes on All Funds (continued) Bonds, Series 2004 in the amount of $9,180,000 and finance a portion of the cost of capital improvements to the Highland Park Library and Sun Ray Library. The net present value benefit of refunding the Series 2004 Bonds was $1,159,629. The 2014C Bonds were issued with a true interest cost of 2.46%.
On July 24, 2014, the City issued taxable General Obligation Tax Increment Bonds, Series 2014D in the amount of $1,995,000. The proceeds were used to current refund the City’s Taxable Tax Increment Revenue Refunding Bonds, Series 2005C in the amount of $1,540,000 and to fund or reimburse eligible costs for certain public redevelopment activities. The net present value benefit of refunding the 2005C Bonds was $73,873. The 2014D Bonds were issued with a true interest cost of 1.08%. On August 4, 2014, the City issued Sewer Revenue Bonds, Series 2014E in the amount of $8,000,000. The proceeds were used to finance capital improvements to the City’s sewer system. On August 15, 2014, the City issued its $33,720,000 Taxable Revenue Refunding Notes (State of Minnesota Continuing Appropriation Grant), Series 2014 (the “Series 2014 GANs”). The Series 2014 GANSs have a final maturity date of August 15, 2032. A portion of the proceeds of the Series 2014 GANs were used by the City to defease the outstanding maturities of the Housing and Redevelopment Authority of the City of Saint Paul, Minnesota’s (the “HRA”) Sales Tax Revenue Refunding Bonds (Civic Center Project), Series 1996. The Series 2014 GANs are payable solely from revenues pledged by the City under the terms of an Indenture of Trust, dated as of August 1, 2014 (the “Indenture”), between the City and U.S. Bank National Association, as trustee (the “Trustee”). Under the terms of the Indenture, the City pledged to the Trustee all amount received by the City that are necessary to pay the Series 2014 GANs under Laws of Minnesota 2012, Chapter 299, Article 1, Section 5(a), as codified in Minnesota Statutes, Section 16A.726(c) (the “Grant Act”). Under the terms of the Grant Act, $2,700,000 is annually appropriated from the General Fund of the State of Minnesota (the “State”) to the Commissioner of the Minnesota Department of Management and Budget (“MMB”) for the fiscal years 2014 through 2033 for a grant to the City for the operating or capital costs of new or existing sports facilities. Pursuant to a General Fund Grant Agreement Annual Appropriation Grant for the City of Saint Paul Sports Facilities Project between the City and MMB, MMB has agreed to make a grant of money to the City in the annual amount of up to $2,700,000 for the fiscal years 2014 through 2033 (the “Grant Revenues”) to be used by the City to reimburse itself for expenditures the City has made or will make for the capital costs of new or existing sports facilities. The Series 2014 GANs are secured solely by a pledge of the Grant Revenues to be received by the City from the State of Minnesota and amounts earned, if any, by the funds on deposit under the Indenture. The Series 2014 GANs do not constitute a debt for which the full faith and credit or taxing powers of the City are pledged. The Series 2014 GANs are payable solely from the trust estate pledged under the Indenture, which is primarily comprised of the Grant Revenues. On December 9, 2014, the City issued Taxable Sales Tax Revenue Bonds, Series 2014F in the amount of $8,070,000 and Tax-Exempt Sales Tax Revenue Bonds, Series 2014G in the amount of $28,195,000. The proceeds of the two bonds will be used by the City to finance capital projects to further residential, cultural, commercial, and economic development in both downtown St. Paul and the St. Paul neighborhoods.
(Remainder of this page left blank intentionally)
96

City of Saint Paul, Minnesota NOTES TO THE FINANCIAL STATEMENTS For the Fiscal Year Ended December 31, 2014
Note VI. Detailed Notes on All Funds (continued)
3. Bonds Payable - by Issue Bonds payable at December 31, 2014, are composed of the following individual issues:
Final Authorized OutstandingInterest Issue Maturity and as of
Interest Rates Dates Date Date Issued 12/31/2014GENERAL OBLIGATION BONDS
Property Tax SupportedCapital Improvement 3.80 to 4.00% (4/1;10/1) 4/18/07 4/1/17 6,250,000$ 1,870,000$
2.00 to 3.50% (3/1; 9/1) 3/1/08 3/1/18 6,330,000 2,580,000 2.00 to 3.25% (3/1; 9/1) 6/1/09 3/1/19 4,500,000 2,245,000 2.00 to 3.00% (3/1; 9/1) 3/11/10 3/1/20 7,350,000 1,805,000 2.00 to 3.00% (4/1;10/1) 10/1/10 10/1/17 4,400,000 1,585,000
3.224 to 5.096% (4/1;10/1) 10/1/10 10/1/30 4,675,000 4,675,000 2.583 to 5.096% (4/1;10/1) 10/1/10 10/1/30 7,765,000 7,765,000
2.00 to 3.25% (3/1; 9/1) 9/1/11 3/1/21 15,040,000 7,640,000 2.00 to 4.00% (3/1; 9/1) 4/2/12 3/1/22 5,735,000 4,645,000 2.00 to 3.00% (3/1; 9/1) 4/8/13 3/1/23 6,325,000 5,740,000
3.92% (6/1;12/1) 12/17/13 12/1/39 8,500,000 8,500,000 2.00 to 5.00% (3/1; 9/1) 4/30/14 9/1/24 14,655,000 11,780,000
91,525,000 60,830,000
Taxable Library RZEDsSeries 2010H 5.196% (4/1;10/1) 10/1/10 10/1/35 3,700,000 3,700,000
Saint Paul Public LibrarySeries 2014C 2.00 to 5.00% (3/1; 9/1) 4/30/14 3/1/33 14,830,000 14,830,000
Public SafetySeries 2008C 3.00 to 4.375% (5/1;11/1) 3/1/08 5/1/33 10,510,000 8,770,000Series 2009D 3.00 to 3.50% (6/1;12/1) 6/2/09 12/1/21 5,575,000 3,495,000Series 2009E 5.336 to 6.032% (6/1;12/1) 6/2/09 12/1/34 9,275,000 9,275,000Series 2011H 2.00 to 3.00% (6/1;12/1) 12/13/11 12/1/23 14,605,000 8,390,000
39,965,000 29,930,000
Street Improvement 4.00 to 4.375% (4/1;10/1) 4/1/06 4/1/26 9,504,750 6,090,6434.00 to 4.375% (4/1;10/1) 4/18/07 4/1/27 9,222,750 6,273,340
5.00% (5/1;11/1) 3/1/08 5/1/28 9,014,221 7,070,0533.00 to 5.00% (5/1;11/1) 6/1/09 5/1/29 7,557,911 6,079,589.80 to 5.75% (5/1;11/1) 3/3/10 5/1/30 10,023,250 8,375,428
2.00 to 4.25% (5/1;11/1) 4/4/11 11/1/31 9,624,750 8,296,533 2.00 to 4.50% (5/1;11/1) 4/2/12 5/1/32 6,971,774 6,270,094
2.00 to 3.125% (5/1;11/1) 4/8/13 5/1/33 8,932,482 8,364,740 3.00 to 5.00% (5/1;11/1) 4/30/14 11/1/34 19,731,655 19,731,655
90,583,543 76,552,075
Total General Obligation Bonds - Property Tax Supported 240,603,543$ 185,842,075$
Special Assessment Debt with Governmental Commitment
Assessed Reconstruction Work 4.00 to 4.375% (4/1;10/1) 4/1/06 4/1/26 2,995,250$ 1,919,357$ 4.00 to 4.375% (4/1;10/1) 4/18/07 4/1/27 3,277,250 2,226,660
5.00% (5/1;11/1) 3/1/08 5/1/28 2,530,779 1,984,9473.00 to 5.00% (5/1;11/1) 6/1/09 5/1/29 2,667,089 2,145,411.80 to 5.75% (5/1;11/1) 3/3/10 5/1/30 2,476,750 2,069,572
2.00 to 4.25% (5/1;11/1) 4/4/11 11/1/31 2,875,250 2,478,4672.00 to 4.50% (5/1;11/1) 4/2/12 5/1/32 2,318,226 2,084,9062.00 to 3.00% (5/1;11/1) 4/8/13 5/1/33 2,867,518 2,685,2603.00 to 5.00% (5/1;11/1) 4/30/14 11/1/34 8,643,345 8,498,345
Total General Obligation Bonds - Special Assessment Debt with Governmental Commitment 30,651,457$ 26,092,925$
97

City of Saint Paul, Minnesota NOTES TO THE FINANCIAL STATEMENTS For the Fiscal Year Ended December 31, 2014
Note VI. Detailed Notes on All Funds (continued)
Final Authorized OutstandingInterest Issue Maturity and as of
Interest Rates Dates Date Date Issued 12/31/2014HRA Tax Increment Fund
Koch Mobil Tax IncrementSeries 2010A 2.00 to 4.00% (3/1; 9/1) 2/25/10 3/1/31 2,670,000 2,225,000
US Bank Tax Increment Taxable Refunding Bonds
Series 2011F 2.00% (2/1; 8/1) 8/15/11 8/1/15 3,060,000 790,000US Bank Tax Increment Refunding Bonds
Series 2011G 2.00 to 4.00% (2/1; 8/1) 8/15/11 8/1/28 8,870,000 8,870,000 Tax Increment Taxable Refunding Bonds Series 2014D 1.00 to 1.25% (3/1; 9/1) 7/24/14 3/1/17 1,995,000 1,995,000
Total General Obligation Bonds - HRA Tax Increment Bonds 16,595,000$ 13,880,000$
HRA Parking Facilities Enterprise Fund
Block 39 Tax IncrementSeries 2009G Tax Exempt Refunding 3.125 to 4.00% (2/1; 8/1) 10/19/09 2/1/25 20,695,000$ 20,695,000$ Series 2009HTaxable Refunding 3.10% (2/1; 8/1) 10/19/09 2/1/15 8,655,000 830,000
Total General Obligation Bonds - HRA Parking Facilities Enterprise Fund Bonds 29,350,000$ 21,525,000$
TOTAL GENERAL OBLIGATION BONDS 317,200,000$ 247,340,000$
LIMITED TAX BONDSLimited Tax Build America Bonds
Series 2010A 4.35 to 7.50% (2/1; 8/1) 12/22/10 2/1/40 7,170,000$ 7,170,000$ Taxable Limited Tax Bonds
Series 2010B 4.35% (2/1; 8/1) 12/22/10 2/1/19 685,000 585,000 TOTAL LIMITED TAX BONDS 7,855,000$ 7,755,000$
(The remainder of this page left blank intentionally)
98
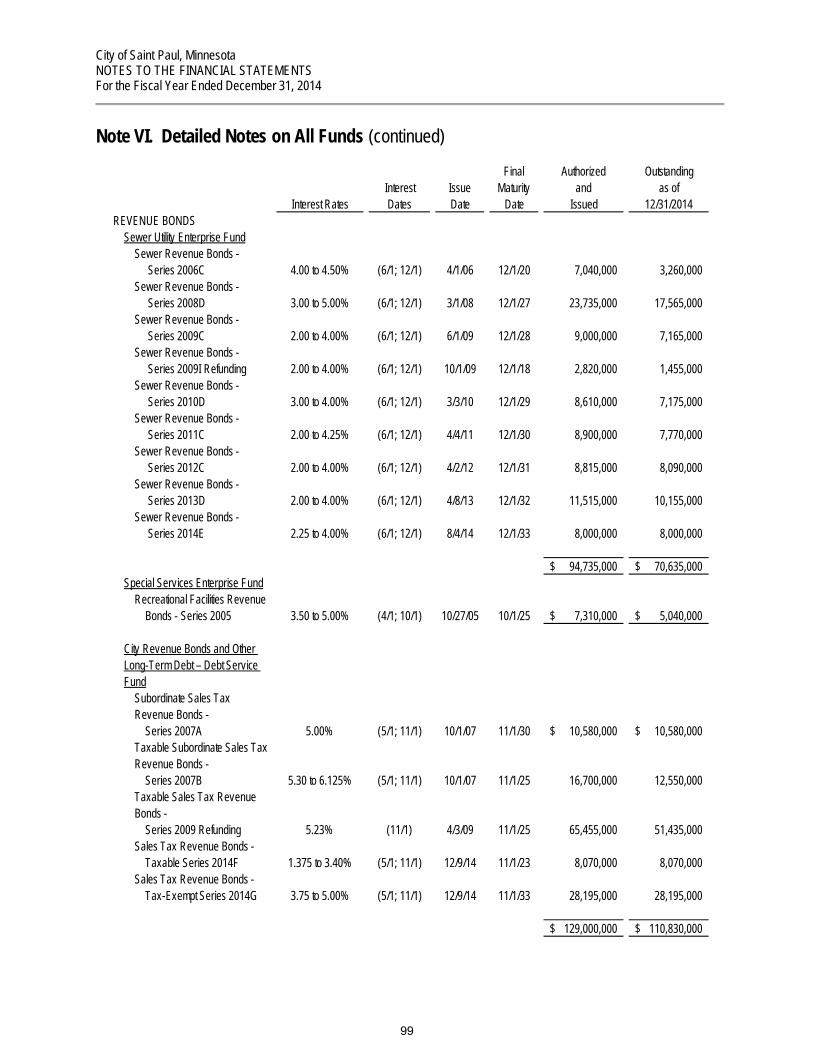
City of Saint Paul, Minnesota NOTES TO THE FINANCIAL STATEMENTS For the Fiscal Year Ended December 31, 2014
Note VI. Detailed Notes on All Funds (continued)
Final Authorized OutstandingInterest Issue Maturity and as of
Interest Rates Dates Date Date Issued 12/31/2014REVENUE BONDS
Sewer Utility Enterprise FundSewer Revenue Bonds -
Series 2006C 4.00 to 4.50% (6/1; 12/1) 4/1/06 12/1/20 7,040,000 3,260,000Sewer Revenue Bonds -
Series 2008D 3.00 to 5.00% (6/1; 12/1) 3/1/08 12/1/27 23,735,000 17,565,000Sewer Revenue Bonds -
Series 2009C 2.00 to 4.00% (6/1; 12/1) 6/1/09 12/1/28 9,000,000 7,165,000Sewer Revenue Bonds -
Series 2009I Refunding 2.00 to 4.00% (6/1; 12/1) 10/1/09 12/1/18 2,820,000 1,455,000Sewer Revenue Bonds -
Series 2010D 3.00 to 4.00% (6/1; 12/1) 3/3/10 12/1/29 8,610,000 7,175,000Sewer Revenue Bonds -
Series 2011C 2.00 to 4.25% (6/1; 12/1) 4/4/11 12/1/30 8,900,000 7,770,000Sewer Revenue Bonds -
Series 2012C 2.00 to 4.00% (6/1; 12/1) 4/2/12 12/1/31 8,815,000 8,090,000Sewer Revenue Bonds -
Series 2013D 2.00 to 4.00% (6/1; 12/1) 4/8/13 12/1/32 11,515,000 10,155,000Sewer Revenue Bonds -
Series 2014E 2.25 to 4.00% (6/1; 12/1) 8/4/14 12/1/33 8,000,000 8,000,000
94,735,000$ 70,635,000$ Special Services Enterprise Fund
Recreational Facilities RevenueBonds - Series 2005 3.50 to 5.00% (4/1; 10/1) 10/27/05 10/1/25 7,310,000$ 5,040,000$
City Revenue Bonds and Other Long-Term Debt – Debt Service Fund
Subordinate Sales Tax Revenue Bonds -
Series 2007A 5.00% (5/1; 11/1) 10/1/07 11/1/30 10,580,000$ 10,580,000$ Taxable Subordinate Sales Tax Revenue Bonds -
Series 2007B 5.30 to 6.125% (5/1; 11/1) 10/1/07 11/1/25 16,700,000 12,550,000 Taxable Sales Tax Revenue Bonds -
Series 2009 Refunding 5.23% (11/1) 4/3/09 11/1/25 65,455,000 51,435,000 Sales Tax Revenue Bonds -
Taxable Series 2014F 1.375 to 3.40% (5/1; 11/1) 12/9/14 11/1/23 8,070,000 8,070,000 Sales Tax Revenue Bonds -
Tax-Exempt Series 2014G 3.75 to 5.00% (5/1; 11/1) 12/9/14 11/1/33 28,195,000 28,195,000
129,000,000$ 110,830,000$
99
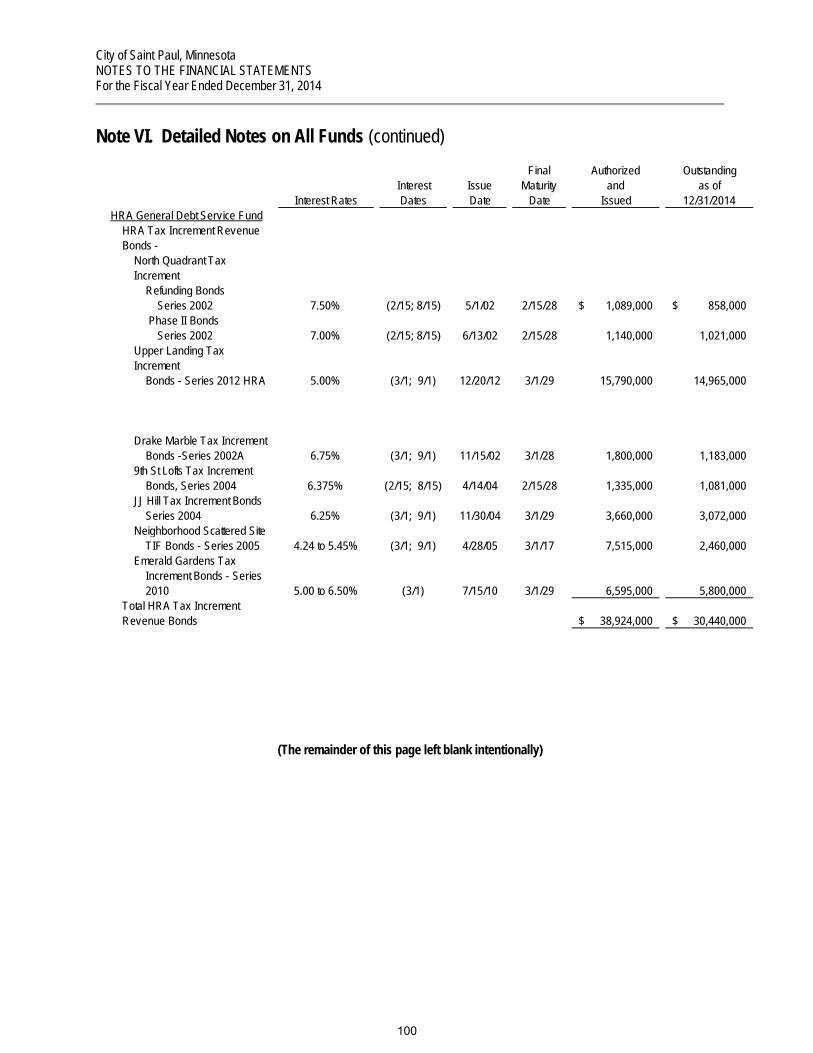
City of Saint Paul, Minnesota NOTES TO THE FINANCIAL STATEMENTS For the Fiscal Year Ended December 31, 2014
Note VI. Detailed Notes on All Funds (continued)
Final Authorized OutstandingInterest Issue Maturity and as of
Interest Rates Dates Date Date Issued 12/31/2014HRA General Debt Service Fund
HRA Tax Increment Revenue Bonds -
North Quadrant Tax Increment
Refunding BondsSeries 2002 7.50% (2/15; 8/15) 5/1/02 2/15/28 1,089,000$ 858,000$
Phase II BondsSeries 2002 7.00% (2/15; 8/15) 6/13/02 2/15/28 1,140,000 1,021,000
Upper Landing Tax Increment
Bonds - Series 2012 HRA 5.00% (3/1; 9/1) 12/20/12 3/1/29 15,790,000 14,965,000
Drake Marble Tax IncrementBonds -Series 2002A 6.75% (3/1; 9/1) 11/15/02 3/1/28 1,800,000 1,183,000
9th St Lofts Tax IncrementBonds, Series 2004 6.375% (2/15; 8/15) 4/14/04 2/15/28 1,335,000 1,081,000
JJ Hill Tax Increment BondsSeries 2004 6.25% (3/1; 9/1) 11/30/04 3/1/29 3,660,000 3,072,000
Neighborhood Scattered SiteTIF Bonds - Series 2005 4.24 to 5.45% (3/1; 9/1) 4/28/05 3/1/17 7,515,000 2,460,000
Emerald Gardens TaxIncrement Bonds - Series 2010 5.00 to 6.50% (3/1) 7/15/10 3/1/29 6,595,000 5,800,000
Total HRA Tax Increment Revenue Bonds 38,924,000$ 30,440,000$
(The remainder of this page left blank intentionally)
100

City of Saint Paul, Minnesota NOTES TO THE FINANCIAL STATEMENTS For the Fiscal Year Ended December 31, 2014
Note VI. Detailed Notes on All Funds (continued)
Final Authorized OutstandingInterest Issue Maturity and as of
Interest Rates Dates Date Date Issued 12/31/2014HRA Lease Revenue Bonds
Jimmy Lee Lease Revenue Series 2008 3.00 to 5.00% (6/1; 12/1) 7/1/08 12/1/32 7,685,000$ 6,365,000$
RiverCentre ParkingRamp Improvement 3.00 to 4.50% (5/1; 11/1) 5/5/09 5/1/24 6,790,000 4,885,000
Total HRA Lease Revenue 14,475,000$ 11,250,000$
Total HRA General Debt Service Fund 53,399,000$ 41,690,000$
HRA Parking System Revenue Bonds
World Trade Center Ramp Bonds
Series 1997A 6.75% (6/1; 12/1) 11/13/97 12/1/17 11,305,000$ 2,825,000$ Refunding Bonds
Series 2010A 3.00 to 5.00% (2/1; 8/1) 7/20/10 8/1/35 24,135,000 21,665,000 Series 2010B 3.00 to 5.00% (2/1; 8/1) 7/20/10 8/1/35 12,820,000 11,495,000
Total HRA Parking System Revenue Bonds 48,260,000$ 35,985,000$
TOTAL REVENUE BONDS 332,704,000$ 264,180,000$
TOTAL BONDS PAYABLE 657,759,000$ 519,275,000$
(The remainder of this page left blank intentionally)
101

City of Saint Paul, Minnesota NOTES TO THE FINANCIAL STATEMENTS For the Fiscal Year Ended December 31, 2014
Note VI. Detailed Notes on All Funds (continued) H. Operating Lease
From 1998 through 2014, the City entered into noncancelable operating leases for personal computers. Total payments made for the leases during 2014 were $1,153,283. The following schedule presents the future minimum rental payments for these operating leases:
Year Ending December 31 Amount2015 $1,159,7452016 909,026 2017 481,994 2018 254,631 2019 16,323
Total Minimum Payments Required $2,821,719 I. Segment Information
The City issued revenue bonds in 1996 to finance the construction of the Rice and Arlington Sports Dome. In October 2005, the City issued revenue bonds to refund the Recreational Facilities Gross Revenue bonds (Sports Dome Project) and to finance the reconstruction of the Highland National Golf Course. The 2005 bonds are accounted for in the Special Services Fund which is a nonmajor enterprise fund. Summary financial information is presented below.
Condensed Statement of Net Position
Parks Special Services
ASSETS Current Assets 38,478$ Restricted Assets 666,750 Capital Assets (net of Accumulated Depreciation) 4,735,986 Total Assets 5,441,214
LIABILITIES Current Liabilities 8,395,898 Noncurrent Liabilities 5,605,149 Total Liabilities 14,001,047
NET POSITION Net Investment in Capital Assets (425,561) Unrestricted (8,134,272) TOTAL NET POSITION (8,559,833)$
102

City of Saint Paul, Minnesota NOTES TO THE FINANCIAL STATEMENTS For the Fiscal Year Ended December 31, 2014
Note VI. Detailed Notes on All Funds (continued)
Condensed Statement of Revenues, Expenses and Changes in Net Position
Parks Special Services
Fees, Sales, Services and Rental Charges 2,333,934$ Depreciation Expense (180,020) Other Operating Expenses (2,784,244)
Operating Income (Loss) (630,330)
Nonoperating Revenues (Expenses)Investment Income 41,276 Interest Expense (246,830) Total Other Nonoperating Revenues (Expenses) (205,554)
Transfers In 230,000 Transfers Out (264,393)
Changes in Net Position (870,277)
Beginning Net Position (7,689,556)
ENDING NET POSITION (8,559,833)$
Condensed Statement of Cash Flows Parks Special
ServicesNet Cash Provided (Used) by
Operating Activities (190,206)$ Noncapital Financing Activities 730,580 Capital and Related Financing Activities (582,846) Investing Activities 42,472 Net Increase (Decrease) -
Beginning Cash and Cash Equivalents 600
ENDING CASH AND CASH EQUIVALENTS 600$
103
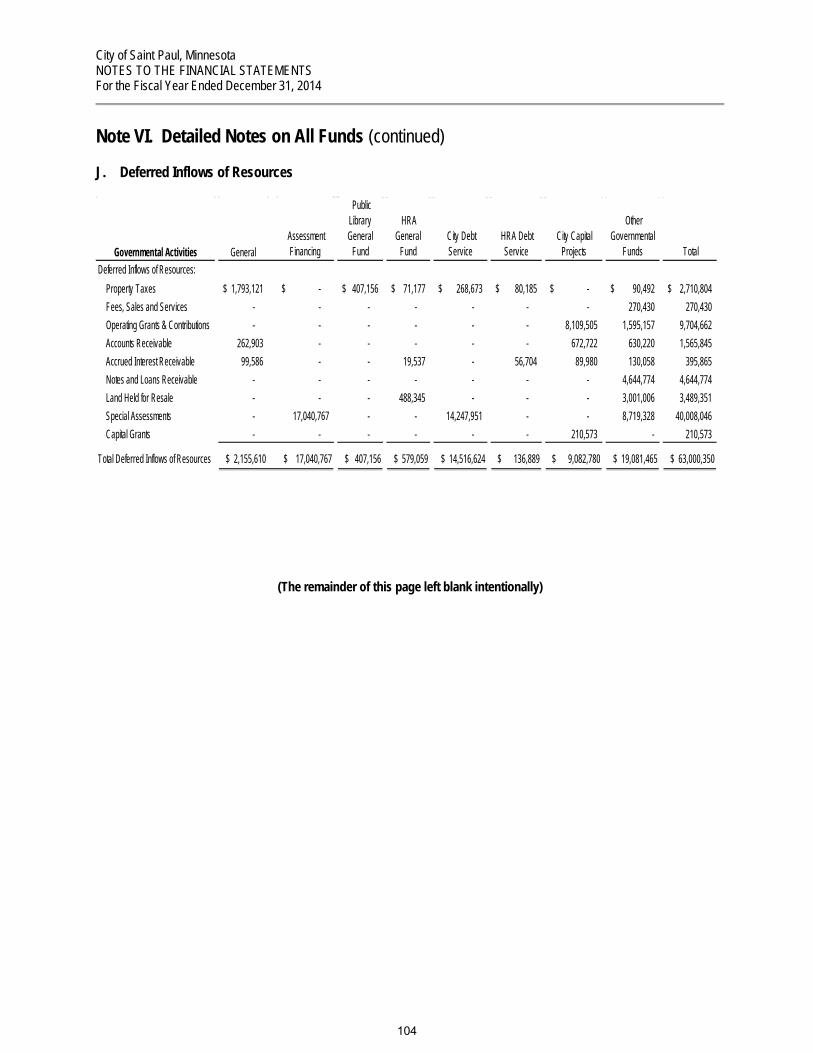
City of Saint Paul, Minnesota NOTES TO THE FINANCIAL STATEMENTS For the Fiscal Year Ended December 31, 2014
Note VI. Detailed Notes on All Funds (continued) J. Deferred Inflows of Resources
Governmental Activities General Assessment
Financing
Public Library General
Fund
HRA General
Fund City Debt Service
HRA Debt Service
City Capital Projects
Other Governmental
Funds Total Deferred Inflows of Resources: Property Taxes 1,793,121$ -$ 407,156$ 71,177$ 268,673$ 80,185$ -$ 90,492$ 2,710,804$ Fees, Sales and Services - - - - - - - 270,430 270,430 Operating Grants & Contributions - - - - - - 8,109,505 1,595,157 9,704,662 Accounts Receivable 262,903 - - - - - 672,722 630,220 1,565,845 Accrued Interest Receivable 99,586 - - 19,537 - 56,704 89,980 130,058 395,865 Notes and Loans Receivable - - - - - - - 4,644,774 4,644,774 Land Held for Resale - - - 488,345 - - - 3,001,006 3,489,351 Special Assessments - 17,040,767 - - 14,247,951 - - 8,719,328 40,008,046 Capital Grants - - - - - - 210,573 - 210,573
Total Deferred Inflows of Resources $ 2,155,610 $ 17,040,767 $ 407,156 $ 579,059 $ 14,516,624 $ 136,889 $ 9,082,780 $ 19,081,465 $ 63,000,350
(The remainder of this page left blank intentionally)
104

City of Saint Paul, Minnesota NOTES TO THE FINANCIAL STATEMENTS For the Fiscal Year Ended December 31, 2014
Note VI. Detailed Notes on All Funds (continued) K. Fund Balance Classifications
Fund balances for governmental funds are reported in classifications that comprise a hierarchy based primarily on the extent to which the government is bound to honor constraints on the specific purposes for which amounts in those funds can be spent. The December 31, 2014, fund balances are as follows:
City Assessment SPPL HRA City HRA City OtherGeneral Financing General General Debt Service Debt Service Capital Governmental
Fund Balances: Fund Fund Fund Fund Fund Fund Projects Funds Total
Nonspendable:Advance to Component Units/Other Funds 185,480$ - $ - $ 692,050$ - $ - $ - $ 3,047,078$ $ 3,924,608 Corpus of Permanent Funds - - - - - - - 35,000 35,000 Total 185,480 - - 692,050 - - - 3,082,078 3,959,608
Restricted For:Capital Improvements - - - - - - 74,840,765 - 74,840,765 Grants - - - - - - - 7,760,927 7,760,927 Right of Way Maintenance - - - - - - - 926,513 926,513 Lighting Maintenance - - - - - - - 353,065 353,065 Cultural Improvements - - - - - - - 1,009,779 1,009,779 Housing and Economic Development - - - - - - - 49,518 49,518 Debt Service - - - - 65,002,218 10,259,124 - 18,271,744 93,533,086 Total - - - - 65,002,218 10,259,124 74,840,765 28,371,546 178,473,653
Committed To: Equipment Replacement 251,841 - - - - - - 723,558 975,399 Loan Programs - - - - - - - 11,144,022 11,144,022 Library Improvements - - 1,175,969 - - - - 274,984 1,450,953 Housing and Economic Development - - - 6,370,768 - - - - 6,370,768 Total 251,841 - 1,175,969 6,370,768 - - - 12,142,564 19,941,142
Assigned:General Government - 6,499,919 - - - - - 3,564,136 10,064,055 Public Safety - - - - - - - 356,401 356,401 Highways and Streets - - - - - - - 8,544,446 8,544,446 Sanitation - - - - - - - 1,329,605 1,329,605 Culture and Recreation - - 438,210 - - - - 1,754,461 2,192,671 Housing and Economic Development - - - 4,959,422 - - - - 4,959,422 Total - 6,499,919 438,210 4,959,422 - - - 15,549,049 27,446,600
Unassigned 49,003,530 - - - - - (15,566,559) (4,549,582) 28,887,389
Total 49,440,851$ 6,499,919$ 1,614,179$ 12,022,240$ 65,002,218$ 10,259,124$ 59,274,206$ 54,595,655$ 258,708,392$
Major Special Revnue Funds
105

City of Saint Paul, Minnesota NOTES TO THE FINANCIAL STATEMENTS For the Fiscal Year Ended December 31, 2014
Note VII. Discretely Presented Component Units A. Basis of Presentation and Basis of Accounting
The RiverCentre Convention & Visitors Authority (RCVA), Saint Paul Regional Water Services (Regional Water Services) and the Port Authority of the City of Saint Paul (Port Authority) are accounted for as proprietary fund types. Proprietary fund types are reported on the accrual basis of accounting. Revenues are recorded when earned, and expenses are recorded when a liability is incurred.
Financial information is presented as a discrete column in the statement of net position and statement of activities.
B. Deposits and Investments
RiverCentre Convention & Visitors Authority: Certain balances of the RiverCentre Convention & Visitors Authority’s deposits are managed by the City’s Office of Financial Services, Treasury Section. City policies are applied to this portfolio of deposits and investments. Deposits are maintained in accordance with Minnesota §118A.02 and §118A.04. Investments are governed by the City’s Investment Policy. (See Note VI.A Deposits, Investments and Securities Lending). Deposits The RCVA places its cash with several financial institutions. As of December 31, 2014, the RiverCentre Convention & Visitors Authority’s deposits in checking and interest bearing accounts total $1,506,372. The RCVA’s policy in managing the custodial credit risk is by depositing their cash in large, stable banking institutions. Investments The RCVA reports investments at fair value, based on quoted market prices. Investment income and realized and unrealized gains and losses are reflected on the statement of activities as investment income. Certain balances are invested in the cash and investments pool managed and maintained by the City. Earnings from this pool are allocated to the RCVA based on averaged monthly cash balances. The City invests available cash in various securities in accordance with the requirements set forth in Minnesota Statutes. At December 31, 2014, RCVA’s investments include the following:
Fair ValueMarketable Certificates of Deposit 252,398$ Mutual Fund Equities 188,891 Investments with the City's Cash and Investments Pool 3,224,368
3,665,657$
106

City of Saint Paul, Minnesota NOTES TO THE FINANCIAL STATEMENTS For the Fiscal Year Ended December 31, 2014
Note VII. Discretely Presented Component Units (continued) Recap
Deposits 1,506,372$ Cash and Investments 2,909,568$ Investments 4,403,343 Investments 441,289
Restricted Cash 2,558,858
Total 5,909,715$ Total 5,909,715$
Regional Water Services: Regional Water Services deposit and investment functions are managed by the City’s Office of Financial Services, Treasury Section. City policies are applied to the Regional Water Services portfolio of deposits and investments. Deposits are maintained in accordance with Minnesota §118A.02 and §118A.04. Investments are governed by the City’s Investment Policy. (See Note VI.A Deposits, Investments and Securities Lending). Deposits As of December 31, 2014, the Regional Water Services deposits in checking and interest bearing accounts and certificates of deposits total $10,849,135. The deposits are covered with insurance or pledged collateral at 110% of deposits that is held in the City’s name at a third-party institutions, and therefore are not exposed to custodial credit risk.
Custodial Credit Risk Custodial credit risk is the risk that, in the event of a financial institution failure, the Regional Water Services deposits may not be returned to it. As of December 31, 2014, the Regional Water Services deposits were not exposed to custodial credit risk. All pledged collateral is held in the City’s name at third party institutions, pledged at 110% of deposits not covered by insurance or bonds. Investments Credit Risk Generally, credit risk is the risk that an issuer of an investment will not fulfill its obligation to the holder of the investment. This is measured by the assignment of a rating by a nationally-recognized statistical rating organization. It is the City’s policy to invest only in securities that meet the ratings requirements set by state statute. The Regional Water Services exposure to credit risk as of December 31, 2014, is as follows:
Rating Agency Rating Fair Value
Moody's Aaa 17,649,352$
107

City of Saint Paul, Minnesota NOTES TO THE FINANCIAL STATEMENTS For the Fiscal Year Ended December 31, 2014
Note VII. Discretely Presented Component Units (continued) Custodial Credit Risk The custodial risk for investments is the risk that, in the event of the failure of the counterparty to a transaction, a government will not be able to recover the value of investment or collateral securities that are in the possession of an outside party. At December 31, 2014, all investment securities were in the City’s name and were held in the custody of US Bank under the City’s name and, therefore, are not subject to custodial credit risk. Concentration of Credit Risk The concentration of credit risk is the risk of loss that may be caused by the City’s investment in a single issuer. It is the City’s policy that U.S. Treasury Securities, U.S. Agency Securities and obligations backed by U.S. Treasury and/or U.S. Agency Securities, may be held without limit. At December 31, 2014, the City does not have investments in any one issuer that represent 5% or more of the City’s total investments portfolio and, therefore, also not subject to concentration of credit risk. Interest Rate Risk Interest rate risk is the risk that changes in the market interest rates will adversely affect the fair value of an investment. The City’s internal portfolio has a shorter overall weighted duration than the benchmarks established for each component portfolio. All else being equal, this would be expected to reduce the risk to adverse effects from rising interest rates. At December 31, 2014, Regional Water Services had the following investments:
Less Than 2-4 5-10 OverInvestment Type Fair Value 2 years Years Years 10 Years
U.S. Government Agency Securities 17,649,352$ - $ 2,566,532$ - $ 15,082,820$
Recap
Deposits 10,849,135$ Cash and Investments 10,849,135$ Investments 17,649,352 Investments 6,087,013 Departmental Cash 198,661 Departmental Cash 198,661 Imprest Funds on Hand 7,000 Imprest Funds 7,000
Restricted Cash - Restricted Investments for Debt Service 11,562,339
Total 28,704,148$ 28,704,148$
108
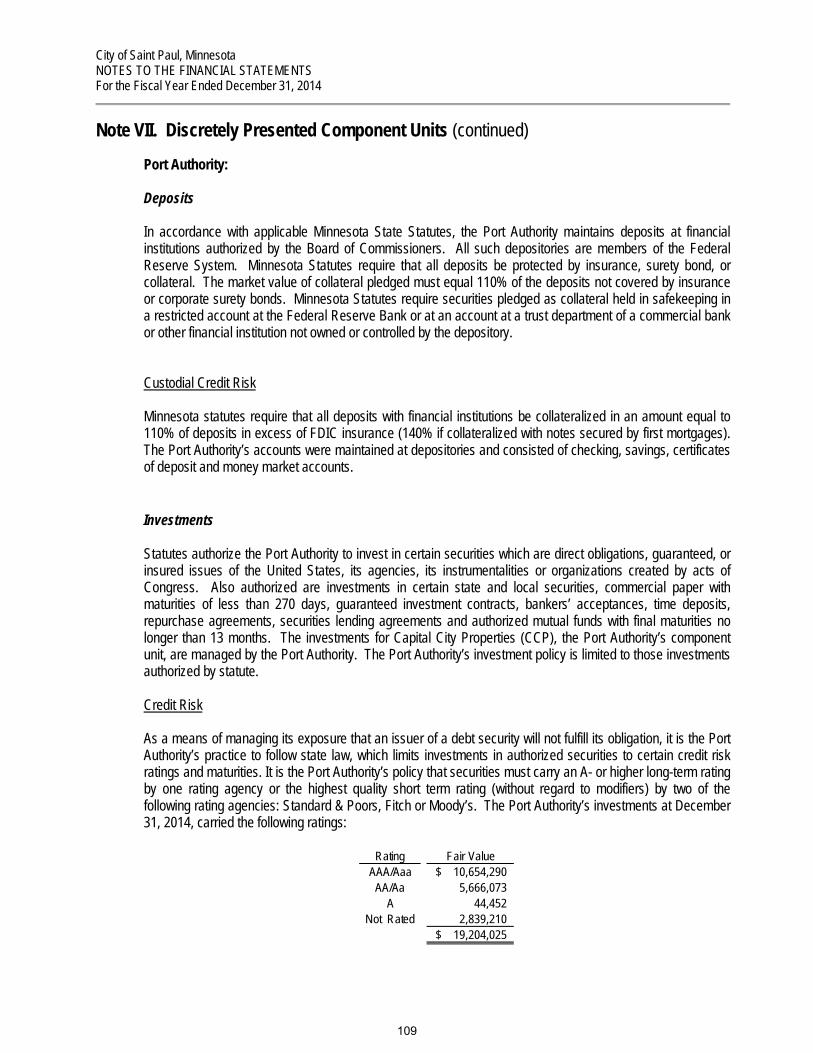
City of Saint Paul, Minnesota NOTES TO THE FINANCIAL STATEMENTS For the Fiscal Year Ended December 31, 2014
Note VII. Discretely Presented Component Units (continued) Port Authority: Deposits In accordance with applicable Minnesota State Statutes, the Port Authority maintains deposits at financial institutions authorized by the Board of Commissioners. All such depositories are members of the Federal Reserve System. Minnesota Statutes require that all deposits be protected by insurance, surety bond, or collateral. The market value of collateral pledged must equal 110% of the deposits not covered by insurance or corporate surety bonds. Minnesota Statutes require securities pledged as collateral held in safekeeping in a restricted account at the Federal Reserve Bank or at an account at a trust department of a commercial bank or other financial institution not owned or controlled by the depository.
Custodial Credit Risk Minnesota statutes require that all deposits with financial institutions be collateralized in an amount equal to 110% of deposits in excess of FDIC insurance (140% if collateralized with notes secured by first mortgages). The Port Authority’s accounts were maintained at depositories and consisted of checking, savings, certificates of deposit and money market accounts.
Investments Statutes authorize the Port Authority to invest in certain securities which are direct obligations, guaranteed, or insured issues of the United States, its agencies, its instrumentalities or organizations created by acts of Congress. Also authorized are investments in certain state and local securities, commercial paper with maturities of less than 270 days, guaranteed investment contracts, bankers’ acceptances, time deposits, repurchase agreements, securities lending agreements and authorized mutual funds with final maturities no longer than 13 months. The investments for Capital City Properties (CCP), the Port Authority’s component unit, are managed by the Port Authority. The Port Authority’s investment policy is limited to those investments authorized by statute. Credit Risk As a means of managing its exposure that an issuer of a debt security will not fulfill its obligation, it is the Port Authority’s practice to follow state law, which limits investments in authorized securities to certain credit risk ratings and maturities. It is the Port Authority’s policy that securities must carry an A- or higher long-term rating by one rating agency or the highest quality short term rating (without regard to modifiers) by two of the following rating agencies: Standard & Poors, Fitch or Moody’s. The Port Authority’s investments at December 31, 2014, carried the following ratings:
Rating Fair ValueAAA/Aaa 10,654,290$
AA/Aa 5,666,073 A 44,452
Not Rated 2,839,210 19,204,025$
109

City of Saint Paul, Minnesota NOTES TO THE FINANCIAL STATEMENTS For the Fiscal Year Ended December 31, 2014
Note VII. Discretely Presented Component Units (continued) Custodial Credit Risk For an investment, the custodial credit risk is that, in the event of the failure of the counterparty (e.g., broker-dealer) to a transaction, the Port Authority will not be able to recover the value of its investments that are in the possession of another party. The Port Authority requires all securities purchased to be made in such a manner so that the securities are registered in the Port Authority’s name or are in the possession of the Port Authority or a third-party custodian in the Port Authority’s name. Concentration of Credit Risk The Port Authority diversifies its portfolio in order to minimize the impact of losses from any one individual issuer. It is the Port Authority’s policy to limit the amount invested in any one issuer at the time of the purchase, excluding securities of the U.S. Government and government sponsored enterprise securities. There were no violations of the policy during the year. It is the Port Authority’s general practice to limit the amount the Port Authority may invest in any one issuer at the time of purchase to no more than 5% of the total investments managed by the Port Authority. At December 31, 2014, more than 5% of the Port Authority’s and Capital City Properties (CCP)’s investments are in the following issuers:
Percent ofIssuer Investments
Federal National Mortgage Association (Fannie Mae) 28.0%
Interest Rate Risk As a means of managing its exposure to fair value losses arising from increasing interest rates, it is the Port Authority’s practice to match maturities to its liquidity needs. The Port Authority establishes benchmarks that reflect its expected cash flow needs and minimize interest rates that are materially longer or shorter than those established by the benchmarks chosen. Maximum duration of the portfolio is 120% of the benchmark duration.
(Remainder of this page left blank intentionally)
110
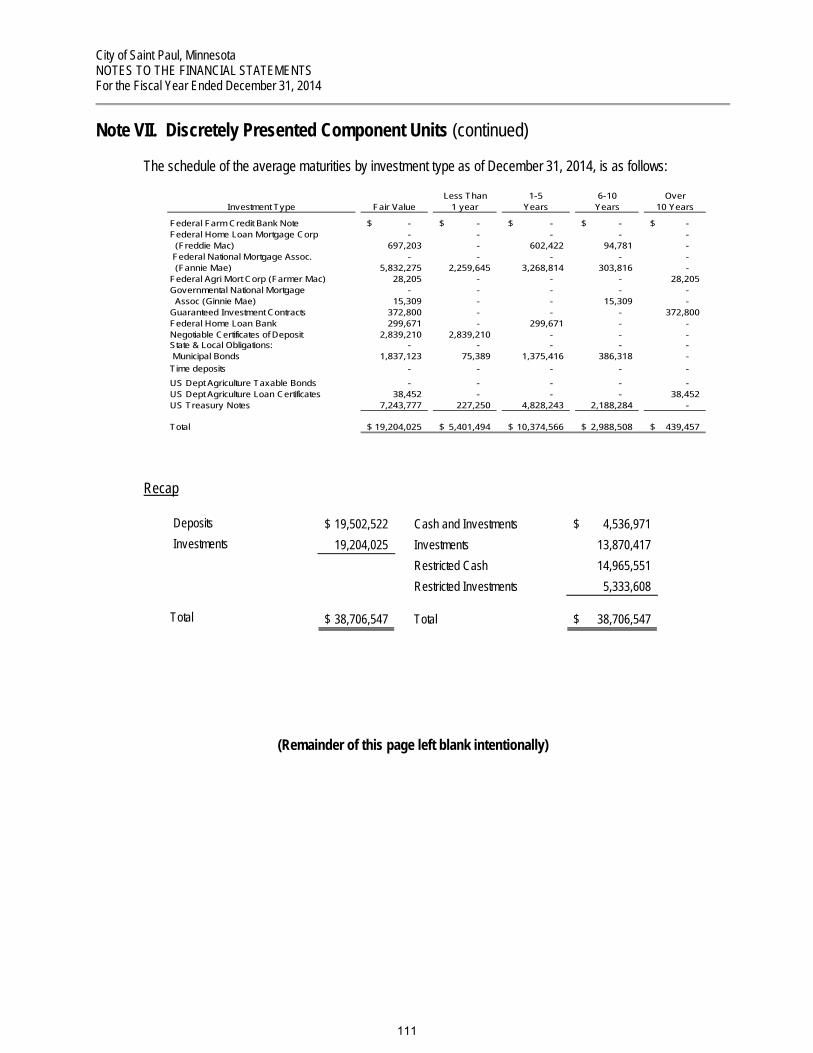
City of Saint Paul, Minnesota NOTES TO THE FINANCIAL STATEMENTS For the Fiscal Year Ended December 31, 2014
Note VII. Discretely Presented Component Units (continued)
The schedule of the average maturities by investment type as of December 31, 2014, is as follows:
Less Than 1-5 6-10 OverInvestment Type Fair Value 1 year Years Years 10 Years
Federal Farm Credit Bank Note -$ -$ -$ -$ -$ Federal Home Loan Mortgage Corp - - - - - (Freddie Mac) 697,203 - 602,422 94,781 - Federal National Mortgage Assoc. - - - - - (Fannie Mae) 5,832,275 2,259,645 3,268,814 303,816 - Federal Agri Mort Corp (Farmer Mac) 28,205 - - - 28,205 Governmental National Mortgage - - - - - Assoc (Ginnie Mae) 15,309 - - 15,309 - Guaranteed Investment Contracts 372,800 - - - 372,800 Federal Home Loan Bank 299,671 - 299,671 - - Negotiable Certificates of Deposit 2,839,210 2,839,210 - - - State & Local Obligations: - - - - - Municipal Bonds 1,837,123 75,389 1,375,416 386,318 - Time deposits - - - - - US Dept Agriculture Taxable Bonds - - - - - US Dept Agriculture Loan Certificates 38,452 - - - 38,452 US Treasury Notes 7,243,777 227,250 4,828,243 2,188,284 -
Total 19,204,025$ 5,401,494$ 10,374,566$ 2,988,508$ 439,457$
Recap
Deposits 19,502,522$ Cash and Investments 4,536,971$ Investments 19,204,025 Investments 13,870,417
Restricted Cash 14,965,551 Restricted Investments 5,333,608
Total 38,706,547$ Total 38,706,547$
(Remainder of this page left blank intentionally)
111

City of Saint Paul, Minnesota NOTES TO THE FINANCIAL STATEMENTS For the Fiscal Year Ended December 31, 2014
Note VII. Discretely Presented Component Units (continued)
C. Capital Assets Summary of Changes in Capital Assets of RiverCentre Convention & Visitors Authority:
Balance Balance01/01/14 Additions Deductions 12/31/14
Capital Assets Not Being Depreciated: Land -$ -$ -$ -$ Construction in Progress - - - -
Total Capital Assets Not Being Depreciated - - - -
Capital Assets Being Depreciated: Buildings and Structures - - - - Public Improvements - - - - Equipment 180,642 188,580 - 369,222
Total Capital Assets Being Depreciated 180,642 188,580 - 369,222
Less: Accumulated Depreciation for: Buildings and Structures - - - - Public Improvements - - - - Equipment (129,331) (20,789) - (150,120)
Total Accumulated Depreciation (129,331) (20,789) - (150,120)
Total Capital Assets Being Depreciated, Net 51,311 167,791 - 219,102
Capital Assets, Net $ 51,311 $ 167,791 $ - $ 219,102
(The remainder of this page left blank intentionally)
112
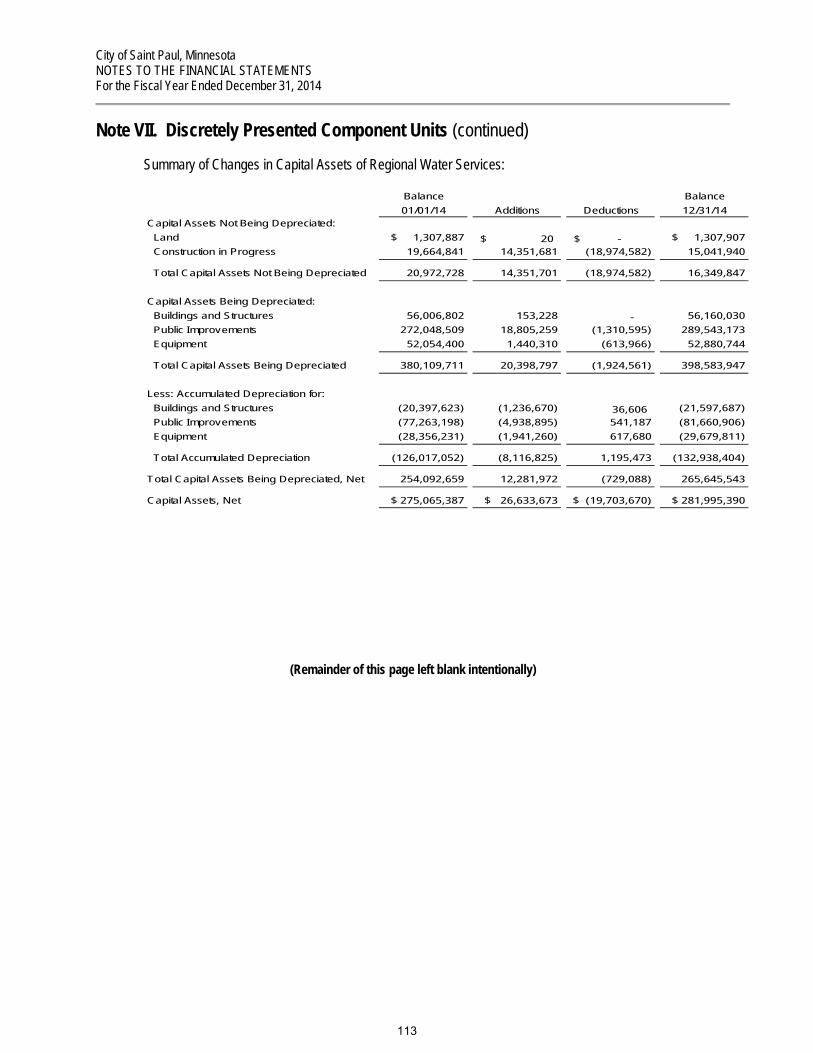
City of Saint Paul, Minnesota NOTES TO THE FINANCIAL STATEMENTS For the Fiscal Year Ended December 31, 2014
Note VII. Discretely Presented Component Units (continued) Summary of Changes in Capital Assets of Regional Water Services:
Balance Balance01/01/14 Additions Deductions 12/31/14
Capital Assets Not Being Depreciated: Land $ 1,307,887 20$ - $ $ 1,307,907 Construction in Progress 19,664,841 14,351,681 (18,974,582) 15,041,940
Total Capital Assets Not Being Depreciated 20,972,728 14,351,701 (18,974,582) 16,349,847
Capital Assets Being Depreciated: Buildings and Structures 56,006,802 153,228 - 56,160,030 Public Improvements 272,048,509 18,805,259 (1,310,595) 289,543,173 Equipment 52,054,400 1,440,310 (613,966) 52,880,744
Total Capital Assets Being Depreciated 380,109,711 20,398,797 (1,924,561) 398,583,947
Less: Accumulated Depreciation for: Buildings and Structures (20,397,623) (1,236,670) 36,606 (21,597,687) Public Improvements (77,263,198) (4,938,895) 541,187 (81,660,906) Equipment (28,356,231) (1,941,260) 617,680 (29,679,811)
Total Accumulated Depreciation (126,017,052) (8,116,825) 1,195,473 (132,938,404)
Total Capital Assets Being Depreciated, Net 254,092,659 12,281,972 (729,088) 265,645,543
Capital Assets, Net $ 275,065,387 $ 26,633,673 $ (19,703,670) $ 281,995,390
(Remainder of this page left blank intentionally)
113

City of Saint Paul, Minnesota NOTES TO THE FINANCIAL STATEMENTS For the Fiscal Year Ended December 31, 2014
Note VII. Discretely Presented Component Units (continued) Summary of Changes in Capital Assets of Port Authority:
Balance Balance01/01/14 Additions Deductions 12/31/14
Capital Assets Not Being Depreciated: Land 8,028,549$ 1,030$ -$ 8,029,579$ Construction in Progress 16,284,263 292,401 11,741,008 4,835,656
Total Capital Assets Not Being Depreciated 24,312,812 293,431 11,741,008 12,865,235
Capital Assets Being Depreciated: Buildings 48,283,358 10,840,561 - 59,123,919 Equipment 2,248,733 1,574,461 - 3,823,194
Total Capital Assets Being Depreciated 50,532,091 12,415,022 - 62,947,113
Less: Accumulated Depreciation for: Buildings (32,335,802) (801,192) - (33,136,994) Equipment (1,700,905) (192,104) - (1,893,009)
Total Accumulated Depreciation (34,036,707) (993,296) - (35,030,003)
Total Capital Assets Being Depreciated, Net 16,495,384 11,421,726 - 27,917,110
Capital Assets, Net 40,808,196$ 11,715,157$ 11,741,008$ 40,782,345$
(Remainder of this page left blank intentionally)
114

City of Saint Paul, Minnesota NOTES TO THE FINANCIAL STATEMENTS For the Fiscal Year Ended December 31, 2014
Note VII. Discretely Presented Component Units (continued) D. Long-Term Obligations RiverCentre Convention & Visitors Authority:
At December 31, 2014, long-term obligations of the RiverCentre Convention & Visitors Authority had no long-term obligations. Regional Water Services:
At December 31, 2014, long-term obligations of Regional Water Services consisted of:
AmountsBeginning Ending Due WithinBalance Increases Decreases Balance One Year
Revenue Bonds 21,025,000$ -$ 2,875,000$ 18,150,000$ 2,345,000$ Revenue Notes 27,218,645 1,614,221 1,237,291 27,595,575 1,833,754 Compensated Absences 1,794,551 206,683 208,152 1,793,082 71,567 Net Other Postemployment Benefits 3,805,727 1,006,466 678,923 4,133,270 - Claims and Judgments 4,500,256 127,778 531,037 4,096,997 625,000
Total 58,344,179$ 2,955,148$ 5,530,403$ 55,768,924$ 4,875,321$
Port Authority: At December 31, 2014, long-term obligations of Port Authority consisted of:
AmountsBeginning Ending Due WithinBalance Increases Decreases Balance One Year
General Obligation Bonds 35,345,000$ 8,460,000$ 10,380,000$ 33,425,000$ 1,855,000$ Revenue Bonds 58,194,271 - 2,813,224 55,381,047 21,671,047 Add/(Subtract) Deferred Amounts for:
(Discounts)/Premiums Refundings -Gains/(Losses) 212,681 299,719 58,615 453,785 (58,728)
Total Bonds 93,751,952 8,759,719 13,251,839 89,259,832 23,467,319
Revenue Notes 11,660,395 150,000 1,538,651 10,271,744 770,470 Net Other Postemployment Benefits Obligation 71,920 5,354 - 77,274 -
Total 105,484,267$ 8,915,073$ 14,790,490$ 99,608,850$ 24,237,789$
115

City of Saint Paul, Minnesota NOTES TO THE FINANCIAL STATEMENTS For the Fiscal Year Ended December 31, 2014
Note VII. Discretely Presented Component Units (continued) E. Principal and Interest Requirements on Long Term Obligations - Bonds and Notes
Regional Water Services:
Total principal and interest requirements relating to outstanding revenue bonds and notes at December 31, 2014, were as follows:
Principal Interest Total
Revenue Bonds 18,150,000$ 2,096,625$ 20,246,625$ Revenue Notes 27,595,575 4,592,435 32,188,010
Total 45,745,575$ 6,689,060$ 52,434,635$
Port Authority: Total principal and interest requirements relating to outstanding revenue bonds and notes at December 31, 2014, were as follows:
Principal Interest Total
General Obligation Bonds 33,425,000$ 10,301,077$ 43,726,077$ Revenue Bonds 55,381,047 11,531,068 66,912,115 Revenue Notes 10,271,744 1,057,443 11,329,187
Total 99,077,791$ 22,889,588$ 121,967,379$
The Port Authority has issued debt obligations to finance numerous development projects. The debt is secured by the related amounts to be received under leases, loan agreements and ad valorem property taxes. These obligations are not secured by the credit of the Authority, and the Authority is not obligated in any manner for repayment of the debt. Accordingly, this no-commitment debt is not reported as a liability in the Port Authority's financial statements. At December 31, 2014, outstanding no-commitment debt totaled $428.3 million.
F. Net Position – Restricted
As of December 31, 2014, net position was restricted for the following purposes:
RiverCentre Convention and Visitors Authority
Regional Water Services Port Authority Total
For Economic Development -$ -$ 48,239,629$ 48,239,629$ For Debt Service - 11,471,816 8,642,468 20,114,284
Total -$ 11,471,816$ 56,882,097$ 68,353,913$
116
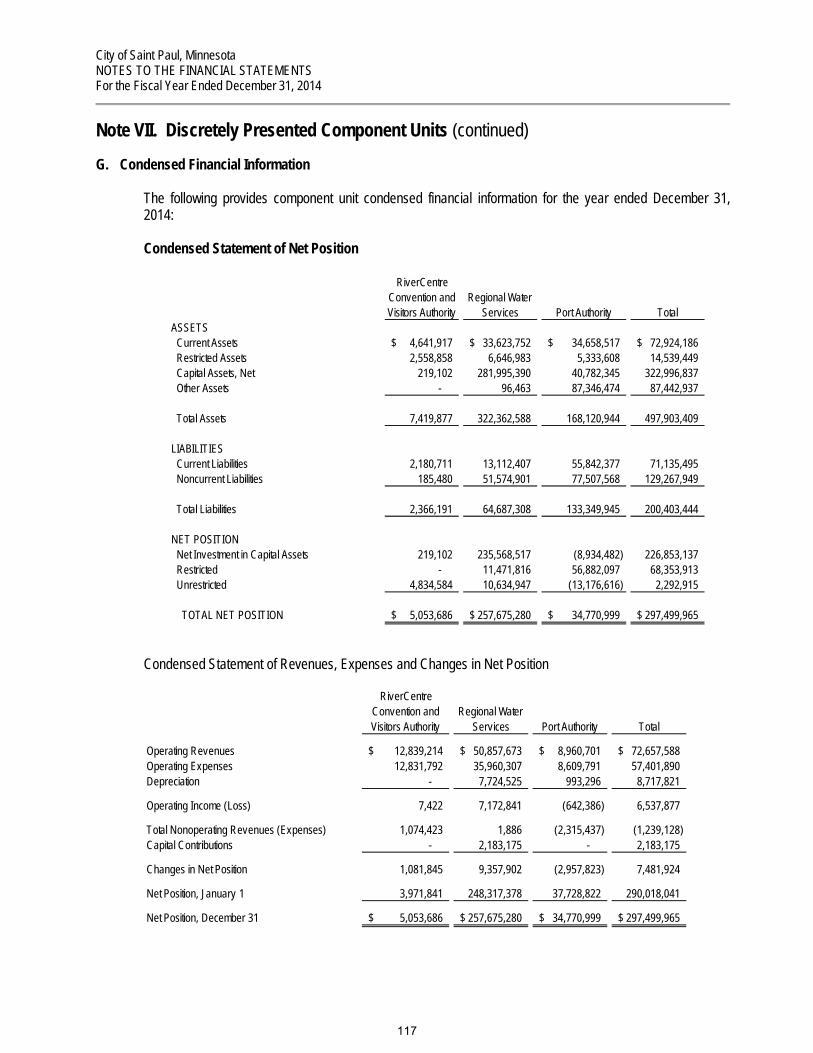
City of Saint Paul, Minnesota NOTES TO THE FINANCIAL STATEMENTS For the Fiscal Year Ended December 31, 2014
Note VII. Discretely Presented Component Units (continued)
G. Condensed Financial Information
The following provides component unit condensed financial information for the year ended December 31, 2014:
Condensed Statement of Net Position
RiverCentre Convention and Visitors Authority
Regional Water Services Port Authority Total
ASSETS Current Assets 4,641,917$ 33,623,752$ 34,658,517$ 72,924,186$ Restricted Assets 2,558,858 6,646,983 5,333,608 14,539,449 Capital Assets, Net 219,102 281,995,390 40,782,345 322,996,837 Other Assets - 96,463 87,346,474 87,442,937
Total Assets 7,419,877 322,362,588 168,120,944 497,903,409
LIABILITIES Current Liabilities 2,180,711 13,112,407 55,842,377 71,135,495 Noncurrent Liabilities 185,480 51,574,901 77,507,568 129,267,949
Total Liabilities 2,366,191 64,687,308 133,349,945 200,403,444
NET POSITION Net Investment in Capital Assets 219,102 235,568,517 (8,934,482) 226,853,137 Restricted - 11,471,816 56,882,097 68,353,913 Unrestricted 4,834,584 10,634,947 (13,176,616) 2,292,915
TOTAL NET POSITION 5,053,686$ 257,675,280$ 34,770,999$ 297,499,965$
Condensed Statement of Revenues, Expenses and Changes in Net Position
RiverCentre Convention and Visitors Authority
Regional Water Services Port Authority Total
Operating Revenues 12,839,214$ 50,857,673$ 8,960,701$ 72,657,588$ Operating Expenses 12,831,792 35,960,307 8,609,791 57,401,890 Depreciation - 7,724,525 993,296 8,717,821
Operating Income (Loss) 7,422 7,172,841 (642,386) 6,537,877
Total Nonoperating Revenues (Expenses) 1,074,423 1,886 (2,315,437) (1,239,128) Capital Contributions - 2,183,175 - 2,183,175
Changes in Net Position 1,081,845 9,357,902 (2,957,823) 7,481,924
Net Position, January 1 3,971,841 248,317,378 37,728,822 290,018,041
Net Position, December 31 5,053,686$ 257,675,280$ 34,770,999$ 297,499,965$
117

City of Saint Paul, Minnesota NOTES TO THE FINANCIAL STATEMENTS For the Fiscal Year Ended December 31, 2014
Note VII. Discretely Presented Component Units (continued)
H. Pension Plans RiverCentre Convention & Visitors Authority:
The RiverCentre Convention & Visitors Authority (RCVA) has a defined contribution 401(k) retirement plan that covers substantially all employees meeting certain eligibility requirements. The RCVA has the option to contribute discretionary amounts to the plan. The RCVA makes matching contributions of up to 5% of compensation. During 2004, an additional discretionary contribution of 2% of each participant’s salary was approved by the Board. Discretionary contributions have not been made from 2005 through 2014. Retirement expense was $29,430 and $39,990 for 2014 and 2013 respectively. Regional Water Services: Regional Water Services employees are employees of the City of Saint Paul and are covered by the Public Employees Retirement Association (PERA) pension plan. PERA does not make separate measurements of assets and pension benefit obligation for individual employers. Total contributions in 2014 were $985,114. See Note VIII.A for disclosures relating to the PERA pension plan. Port Authority: All employees hired after June 30, 2003, as well as certain other employees, are participants in the General Employees Retirement Fund (GERF), which is a cost sharing, multiple employer retirement plan. All other full-time employees are required to participate in a Port Authority- sponsored Section 414(d) employee benefit plan. The following is a description of these plans. Port Authority 414(d) Plan: The Port Authority sponsors a Section 414(d) employee benefit plan covering all full-time employees who were hired prior to June 30, 2003, and did not elect to participate in the GERF. Employee participation in the plan is mandatory, and employees are required to contribute 6.25% of their salary. The Port Authority provides a contribution of 7.25%. Total contributions were $43,000 in 2014. General Employees Retirement Fund (GERF): All full-time employees of the Port Authority who were hired after June 30, 2003, as well as certain other employees who elected to participate in GERF, are covered by defined benefit plans administered by the Public Employees Retirement Association of Minnesota (PERA). PERA administers the General Employees Retirement Fund (GERF), which is a cost-sharing, multiple-employer retirement plan. This plan is established and administered in accordance with Minnesota Statutes, Chapters 353 and 356. The Port Authority contributed $105,000 in 2014. GERF members belong to the Coordinated Plan. All participating employees of the Port Authority are Coordinated Plan members and are covered by Social Security.
I. Postemployment Benefits Other than Pension
RiverCentre Convention & Visitors Authority: The RiverCentre Convention & Visitors Authority does not provide other post employment benefits.
118

City of Saint Paul, Minnesota NOTES TO THE FINANCIAL STATEMENTS For the Fiscal Year Ended December 31, 2014
Note VII. Discretely Presented Component Units (continued) Regional Water Services:
Plan Description
In addition to providing the pension benefits described in Note VII.H, Regional Water Services, through the City of Saint Paul (City) provides other postemployment health care and life insurance benefits (OPEB) for retired employees through a single employer defined benefit plan. The authority to provide these benefits is established in Minnesota Statutes §471.61, Subd. 2a. The plan is not accounted for as a trust fund, as an irrevocable trust has not been established to account for the plan. The plan does not issue a separate report. Benefits Provided Eligibility requirements and contribution levels vary substantially between the 11 bargaining agreements. The typical eligibility requirements are 20 years of service and currently receiving a public employee pension. This coverage may also extend to the retiree’s family. The benefits, benefit levels, employee contributions and employer contributions are governed by the City and can be amended by the City through the City’s collective bargaining agreements with employee groups. Benefits include general inpatient and outpatient medical services; mental and substance abuse care; vision care; preventative dental; and prescriptions. Retirees under the age of 65 (early retirees) are included in the pool with active employees. Each year during open enrollment, active employees and early retirees select from three options with the City’s health insurance carrier. Retirees over 65 (regular retirees) have two plan options under a separate policy. Medicare becomes the primary insurer and the City’s plan becomes secondary. Life insurance in the amount of $5,000 to $20,000 is provided to some early retirees, depending upon collective bargaining agreements. The majority of employees benefit amounts have been capped. The benefit amount varies depending upon employment date and bargaining unit agreement as indicated in the following: Health Care Benefit
Under Age 65 (early retiree)
Over Age 65 (regular retiree)
Employees who retired before January 1, 1996 $250 per month 100%
Employees hired before January 1, 1996 and retiring after January 1, 1996 $350 per month $550 per month
Employees hired after January 1, 1996 $300 per month $300 per month
119

City of Saint Paul, Minnesota NOTES TO THE FINANCIAL STATEMENTS For the Fiscal Year Ended December 31, 2014
Note VII. Discretely Presented Component Units (continued) Membership As of the actuarial valuation date of September 30, 2012 the membership consisted of:
Family Coverage
Single Coverage Total
Retired Participants and BeneficiariesUnder Age 65 (Early Retirees) 2 30 32Over Age 65 (Regular Retirees) 43 109 152
Total Retired Participants 45 139 184
Active ParticipantsEligible to receive benefits 222Not eligible to receive benefits* 179
Total Active Participants 401
Total Participants 585
* Participants who have not reached retirement age and minimum service requirements
Funding Policy
Retiree health care benefits are currently funded based on the benefit disclosed above on a pay-as-you-go basis. Regional Water may change the funding policy at any time. The average monthly premium contributions for 2014 were as follows:
Age
Average Monthly Regional Water
ContributionAverage Monthly
Retiree Contribution
Health Insurance Less than 65 $335 $34865 and older $284 $11
Life Insurance Less than 65 $1 Not applicable65 and older Not applicable Not applicable
These plans are fully insured. The expenses for these post-employment benefits are recognized as premiums and are paid to the insurers. For Regional Water, the 2014 expense totaled $583,961 for approximately 168 retirees. Retirees contributed $98,737; active employees do not contribute to the plan until retirement.
120

City of Saint Paul, Minnesota NOTES TO THE FINANCIAL STATEMENTS For the Fiscal Year Ended December 31, 2014
Note VII. Discretely Presented Component Units (continued)
Annual OPEB Costs and Net OPEB Obligation
Regional Water had an actuarial valuation performed for the plan as of September 30, 2012, to determine the funded status of the plan as of that date as well as the employer’s annual required contribution (ARC) for the fiscal year ended December 31, 2014. Regional Water’s annual OPEB cost, the percentage of annual OPEB cost contributed to the plan, and the net OPEB obligation for 2014 and the two preceding years were as follows:
Fiscal Year EndedAnnual OPEB
CostEmployer
Contribution
Percentage of Annual OPEB
Cost Contributed
Net OPEB Obligation
December 31, 2012 1,345,224$ 708,472$ 52.67% 3,495,166$ December 31, 2013 1,003,004 692,443 69.04% 3,805,727 December 31, 2014 1,006,466 678,923 67.46% 4,133,270
The net OPEB obligation (NOPEBO) as of December 31, 2014, was calculated as follows:
Annual Required Contribution (ARC) 1,067,254$ Interest on Net OPEB Obligation 166,883 Adjustment to Annual Required Contribution (227,671) Annual OPEB cost 1,006,466Contributions Made Direct 583,961 Indirect Implicit Subsidy 94,962Total Contributions Made 678,923
Increase (Decrease) in Net OPEB Obligation 327,543
Net OPEB Obligation Beginning of Year 3,805,727
Net OPEB Obligation End of Year 4,133,270$
Funded Status and Funding Progress
The actuarial accrued liability for benefits, as of September 30, 2012, the most recent actuarial valuation date, was $13,455,536. This liability will be phased in over 30 years based on the requirements of the Governmental Accounting Standards Board Statement No. 45 Accounting and Financial Reporting by Employers for Postemployment Benefits Other than Pensions. As of the actuarial valuation date of September 30, 2012, the funded status of the plan was as follows:
Actuarial Accrued Liability (AAL) 13,455,536$ Actuarial Value of Plan Assets - Unfunded Actuarial Accrued Liabililty (UAAL) 13,455,536$ Funded Ratio (Actuarial Value of Plan Assets/AAL) 0.00%
Active Members Covered Payroll 12,584,670$ UAAL as a Percentage of Covered Payroll 106.9%
121

City of Saint Paul, Minnesota NOTES TO THE FINANCIAL STATEMENTS For the Fiscal Year Ended December 31, 2014
Note VII. Discretely Presented Component Units (continued)
Actuarial valuation of an ongoing plan involves estimates of the value of reported amounts and assumptions about the probability of occurrence of events far into the future. Examples include assumptions about future employment, mortality, and the healthcare cost trend. Amounts determined regarding the funded status of the plan and the annual required contributions of the employer are subject to continual revision as actual results are compared with past expectations and new estimates are made about the future.
Actuarial Methods and Assumptions
Projections of benefits for financial reporting purposes are based on the substantive plan (the plan as understood by the employer and plan members) and include the types of benefits provided at the time of each valuation and the historical pattern of sharing of benefit costs between the employer and plan members to that point. The actuarial methods and assumptions used include techniques that are designed to reduce short-term volatility in actuarial accrued liabilities and the actuarial value of assets, consistent with the long-term perspective of the calculations.
In the September 30, 2012, actuarial valuation the projected unit credit actuarial cost method was used. The actuarial assumptions included 4.5% discount rate and an annual healthcare cost trend rate of beginning at 8.5% for fiscal year 2012 and declining over 7 years by 0.5% per year to 5.0%. Both rates include a 3.0% inflation assumption. The actuarial value of assets was not determined as Regional Water has not advance-funded its obligation. The plan’s unfunded actuarial accrued liability is being amortized as a level dollar amount over a 30-year open amortization period (30-year period restarted with each valuation).
Port Authority: Plan Description The Port Authority employees retiring after 20 or more years of service are eligible for up to $300 per month toward the cost of health insurance. Employees retiring prior to 1996 are reimbursed for 100 percent of the cost of health insurance for themselves and their spouse. At December 31, 2014, there were 18 current employees that may become eligible for benefits in the future and 9 beneficiaries receiving benefits. The plan does not issue a stand-alone financial report.
Funding Policy Retiree health care benefits are currently funded based on the benefit disclosed above on a pay-as-you-go
basis. The Board of Commissioners may change the funding policy at any time. Annual OPEB Cost and Net OPEB Obligation The Port Authority’s annual other postemployment benefit (OPEB) expense is calculated based on the annual
required contribution (ARC). The Port Authority has elected to calculate the ARC and related information using the alternative measurement permitted by GASB Statement No. 45. The ARC represents a level of funding that, if paid on an ongoing basis, is projected to cover the normal cost each year and amortize any unfunded actuarial accrued liabilities (UAAL) over a 30-year period.
122

City of Saint Paul, Minnesota NOTES TO THE FINANCIAL STATEMENTS For the Fiscal Year Ended December 31, 2014
Note VII. Discretely Presented Component Units (continued) The following table shows the components of the annual OPEB cost, the amount actually contributed to the
plan, and changes in the OPEB obligation to the Retiree Healthcare Benefit Program:
Annual Required Contribution (ARC) 43,000$ Interest on Net OPEB Obligation 2,000 Adjustment to Annual Required Contribution (3,000) Annual OPEB cost 42,000
Contributions Made 36,646
Increase (Decrease) in Net OPEB Obligation 5,354
Net OPEB Obligation Beginning of Year 71,920
Net OPEB Obligation End of Year 77,274$
The Port Authority’s annual OPEB cost, the percentage of the annual OPEB cost contributed to the plan, and the net OPEB obligations for 2014:
Fiscal Year EndedAnnual OPEB
Cost
Percentage of Annual OPEB
Cost Contributed
Net OPEB Obligation
December 31, 2012 46,050$ 76.9% 61,530$ December 31, 2013 47,000 76.6% 71,920 December 31, 2014 42,000 88.1% 77,274
Funded Status and Funding Progress The actuarial accrued liability for benefits as of December 31, 2014, the most recent actuarial valuation date, was $592,023. The annual payroll for active employees covered by the plan was $1,916,000 for a ratio of UAAL to covered payroll of 31%. This liability will be phased in over 30 years based on the requirements of GASB Statement No. 45.
Actuarial Accrued Liability (AAL) 592,023$ Actuarial Value of Plan Assets - Unfunded Actuarial Accrued Liabililty (UAAL) 592,023$ Funded Ratio (Actuarial Value of Plan Assets/AAL) 0.00%
Active Members Covered Payroll 1,916,000$ UAAL as a Percentage of Covered Payroll 31.00%
Actuarial Methods and Assumptions The projection of future benefit payments for an ongoing plan involves estimates of the value of reported amounts and assumptions about the probability of occurrence of events far into the future. Examples include assumptions about future employment, mortality and the health care cost trend. Amounts determined regarding the funded status of the plan and the annual required contributions of the employer are subject to continual revision as actual results are compared with past expectations and new estimates are made about the future.
123
City of Saint Paul, Minnesota NOTES TO THE FINANCIAL STATEMENTS For the Fiscal Year Ended December 31, 2014
Note VII. Discretely Presented Component Units (continued) The Port Authority has estimated the liability associated with this benefit using an alternative valuation method which takes into account the existing age of the individuals, their years of service and life expectancy, probability of receiving a benefit, a health care cost trend factor of 6.2% and a 5% present value assumption. Alternative measurement calculations assume a level of percentage projected payroll 30-year open amortization period. The remaining amortization period at December 31, 2014, was 23 years.
Note VIII. Other Information A. Pension Plans
1. Defined Benefit Plans: Public Employees Retirement Association
a. Plan Descriptions
All full-time and certain part-time employees of the City of Saint Paul who are not participants of the Housing and Redevelopment Authority Pension Plan are covered by defined benefit pension plans administered by the Public Employees Retirement Association of Minnesota (PERA). PERA administers the General Employees Retirement Fund (GERF) and the Public Employees Police and Fire Fund (PEPFF), which are cost-sharing, multiple-employer retirement plans. These plans are established and administered in accordance with Minnesota Statutes, Chapters 353 and 356. GERF members belong to either the Coordinated Plan or the Basic Plan. Coordinated Plan members are covered by Social Security, and the Basic Plan members are not. All new members must participate in the Coordinated Plan, and benefits vest after three years of credited service (five years for those first eligible for membership after June 30, 2010). All police officers, firefighters and peace officers who qualify for membership by statute are covered by the PEPFF. For members first eligible for membership after June 30, 2010, benefits vest on a graduated schedule starting with 50 percent after five years and increasing 10 percent for each year of service until fully vested after ten years. Members eligible for membership before July 1, 2010, are fully vested after three years of service. PERA provides retirement benefits as well as disability benefits to members and benefits to survivors upon death of eligible members. Benefits are established by state statute. Defined retirement benefits are based on a member's highest average salary for any five successive years of allowable service, age and years of credit at termination of service.
(Remainder of this page left blank intentionally)
124
City of Saint Paul, Minnesota NOTES TO THE FINANCIAL STATEMENTS For the Fiscal Year Ended December 31, 2014
Note VIII. Other Information (continued) Two methods are used to compute benefits for GERF Coordinated and Basic Plan members. The retiring member receives the higher of a step-rate benefit accrual formula (Method 1) or a level accrual formula (Method 2). Under Method 1, the annuity accrual rate for a Basic Plan member is 2.2 percent of average salary for each of the first ten years of service and 2.7 percent for each year thereafter. For a Coordinated Plan member the annuity accrual rate is 1.2 percent of average salary for each of the first ten years and 1.7 percent for each successive year. Under Method 2, the annuity accrual rate is 2.7 percent of average salary for Basic Plan members and 1.7 percent for Coordinated Plan members for each year of service. For PEPFF members, the annuity accrual rate is 3.0 percent of average salary for each year of service. For all GERF members, whose annuity is calculated using Method 1, and all PEPFF members, a full annuity is available when age plus years of service equal 90. Normal retirement age is 55 for PEPFF members and either 65 or 66 (depending on date hired) for GERF members. A reduced retirement annuity is also available to eligible members seeking early retirement. The benefit provisions stated in the previous paragraphs of this section are current provisions and apply to active plan participants. Vested, terminated employees who are entitled to benefits but are not yet receiving them are bound by the provisions in effect at the time they last terminated public service.
PERA issues a publicly available financial report that includes financial statements and required supplementary information for GERF and PEPFF. That report may be obtained on the internet at www.mnpera.org; by writing to PERA at 60 Empire Drive Suite 200, Saint Paul, Minnesota, 55103-2088 or by calling 651-296-7460 or 1-800-652-9026.
(Remainder of this page left blank intentionally)
125

City of Saint Paul, Minnesota NOTES TO THE FINANCIAL STATEMENTS For the Fiscal Year Ended December 31, 2014
Note VIII. Other Information (continued) b. Funding Policy Pension benefits are funded from member and employer contributions and income from the investment of fund assets. Rates for employer and employee contributions are set by Minnesota Statutes Chapter 353. These statutes are established and amended by the State Legislature. The City makes annual contributions to the pension plans equal to the amount required by state statutes. The following table lists the required contribution rates for employees and employers under the various plans administered by GERF. Rates are applied to annual covered salary. The City is required to contribute the following percentages of annual covered payroll in 2013 and 2014:
2014 2013Retirement Plan Employee Employer Employee Employer
General Employees Retirement Fund (GERF)Basic 9.10% 11.78% 9.10% 11.78%Coordinated 6.25% 7.25% 6.25% 7.25%
Public Employees Police and Fire Fund (PEPFF) 10.20% 15.30% 9.60% 14.10%
The City’s contributions for the years ending December 31, 2014, 2013, and 2012 for GERF and PEPFF were:
2014 2013 2012
General Employees Retirement Fund (GERF)Coordinated 6,639,106$ 6,789,836$ 6,756,676$
Public Employees Police and Fire Fund (PEPFF) 11,870,386 11,679,318 11,094,757
18,509,492$ 18,469,154$ 17,851,433$
These contribution amounts are equal to the contractually required contributions for each year as set by state statute.
(Remainder of this page left blank intentionally)
126
City of Saint Paul, Minnesota NOTES TO THE FINANCIAL STATEMENTS For the Fiscal Year Ended December 31, 2014
Note VIII. Other Information (continued)
2. Defined Contribution Plan: Housing and Redevelopment Authority Pension Plan
a. Plan Description
Employees of the City of Saint Paul who were formerly employed by Housing and Redevelopment Authority (HRA) before the latter merged with the City of Saint Paul and who elected to continue to participate in this pension plan upon becoming employees of the City of Saint Paul are covered by the Housing and Redevelopment Authority Pension Plan, a defined contribution plan. The merger was authorized under the provision of Minnesota Laws of 1976, Chapter 234, as amended in 1977 Session Laws, Chapter 165. The law also provided that employees who elected to continue with the HRA pension plan shall be responsible for the difference in cost between the HRA pension plan and the City of Saint Paul pension plan. The HRA Pension Plan Trustees, in conjunction with Principal Financial Group, administers the HRA Pension Plan.
Participants in the HRA Pension Plan will be vested in their own Trust Fund Share attributable to their individual contributions, supplementary contributions and any rollover contributions. Vesting is based on applying a percentage based on the number of years of service with each full year of service to be vested at 20%. If termination of service or death occurs, each participant or participant’s beneficiary is entitled to receive interest in the Trust Fund, and it will be paid in accordance with the rules of the pension plan.
b. Funding Policy
Each active employee who participates in the HRA Pension Plan contributes 5.25% of the employee’s salary. The City of Saint Paul contributes 7.00% of each active employee’s salary who belongs in the pension plan. The City and the covered employees contributed $15,921 and $10,439, respectively, for the year ending December 31, 2014. The City also contributed $19,786 for 2013, and $20,514 for 2012. For each year, the City contribution equals the required contribution for each respective year.
(Remainder of this page left blank intentionally)
127

City of Saint Paul, Minnesota NOTES TO THE FINANCIAL STATEMENTS For the Fiscal Year Ended December 31, 2014
Note VIII. Other Information (continued) B. Postemployment Benefits Other than Pension
1. Plan Description
In addition to the pension benefits described in Note VIII.A, the City provides other postemployment health care and life insurance benefits (OPEB) for retired employees through a single employer defined benefit plan. The authority to provide these benefits is established in Minnesota Statutes Section 471.61, Subd. 2a. The benefit levels, employee contributions and employer contributions are governed by the City and can be amended by the City through the City’s collective bargaining agreements with employee groups. The plan is not accounted for as a trust fund, as an irrevocable trust has not been established to account for the plan. The plan does not issue a separate report. The activity of the plan is allocated as part of the City’s fringe benefit charge.
2. Benefits Provided The City provides postemployment health care and life insurance benefits to its retirees. To be eligible for benefits, an employee must be collecting a state retirement pension and have been employed by the City for a minimum of 20 years. This coverage may also extend to the retiree’s family. Benefits include general inpatient and outpatient medical services; mental and substance abuse care; vision care; preventative dental; and prescriptions. Life insurance in the amount of $5,000 to $20,000 is provided to some under age 65 (early retirees), depending upon collective bargaining agreements. A few over age 65 retirees have varying amounts of life insurance that had been continued due to disability. The majority of employees benefit amounts have been capped. The benefit amount varies depending upon employment date and bargaining unit agreement as indicated below: Health Care Benefit
Under Age 65 (early retiree)
Over Age 65 (regular retiree)
Employees who retired before January 1, 1996 $250 per month 100%
Employees hired before January 1, 1996 and retiring after January 1, 1996 $350 per month $550 per month
Employees hired after January 1, 1996 $300 per month $300 per month
This benefit has been discontinued for Police officers hired after July 1, 2005 and for Tri-Council employees hired after January 1, 1996. Life Insurance Benefit Retirees are eligible to continue on the City’s life insurance program until age 65 in amounts that range from $5,000 - $20,000.
128

City of Saint Paul, Minnesota NOTES TO THE FINANCIAL STATEMENTS For the Fiscal Year Ended December 31, 2014
Note VIII. Other Information (continued)
3. Membership As of December 31, 2014, the membership consisted of:
Family Coverage
Single Coverage Total
Retired Participants and BeneficiariesUnder Age 65 (Early Retirees) 83 451 534Over Age 65 (Regular Retirees) 469 990 1,459
Total Retired Participants 552 1,441 1,993
Active ParticipantsEligible to receive benefits 402Not eligible to receive benefits* 2,206
Total Active Participants 2,608
Total Participants 4,601
* Participants who have not reached retirement age and minimum service requirements
4. Funding Policy The City negotiates the contribution between the City and employees through 16 employee group agreements. The City currently finances this plan on a pay as you go basis. Early retirees (under age 65) contribute to the health care plan at the same rate as active employees. This results in the early retirees receiving an implicit rate subsidy. For the fiscal year ending December 31, 2014, retirees contributed $2,166,886 and the City contributed $7,600,783. Active employees do not contribute to the plan until retirement. The average monthly premium contributions for 2014 were as follows:
Age
Average Monthly City Contribution ¹
Average Monthly Retiree
Contribution²
Health Insurance Less than 65 231,136$ ¹ 147,101$ ²65 and older 401,967$ ¹ 33,472$ ²
Life Insurance Less than 65 284$ ³ Not applicable65 and older Not applicable Not applicable
(1) The average monthly City contribution for health insurance for retirees less than 65 is $433 and $276
for retirees 65 and older. (2) The average monthly retiree contribution for health insurance for retirees less than 65 is $275 and $23 for retirees 65 and older. (3) The average monthly City contribution for life insurance for retirees less than 65 is $1.
129
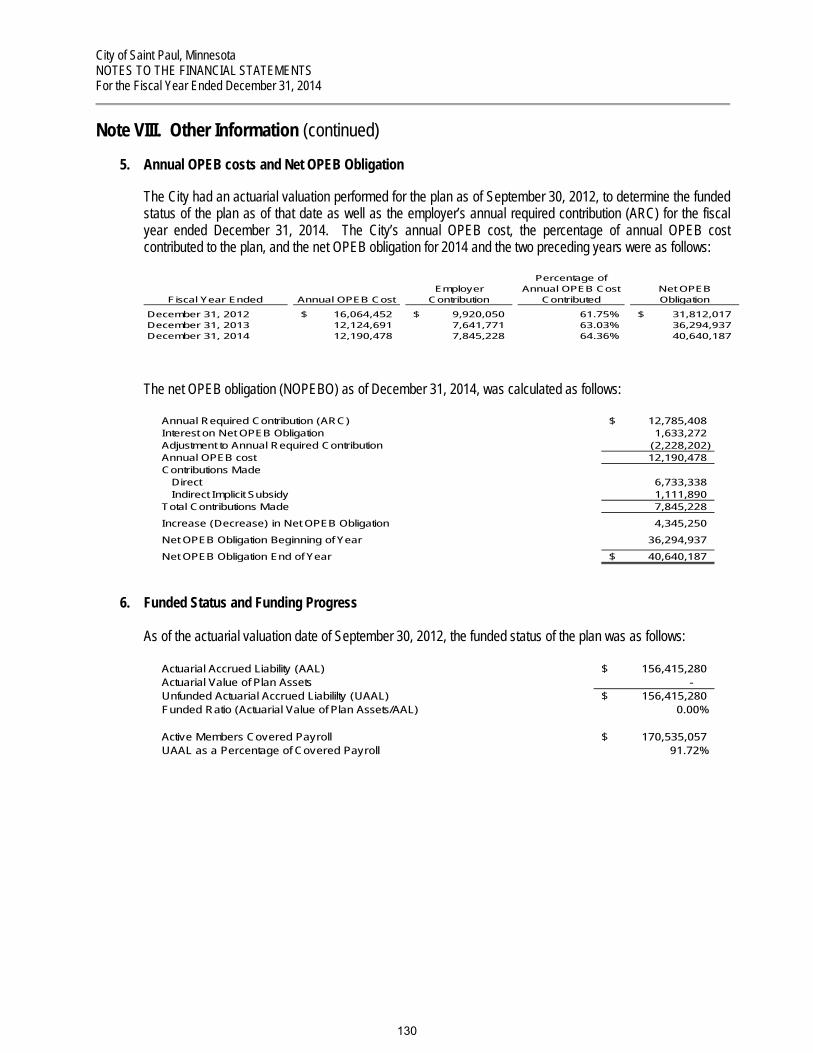
City of Saint Paul, Minnesota NOTES TO THE FINANCIAL STATEMENTS For the Fiscal Year Ended December 31, 2014
Note VIII. Other Information (continued)
5. Annual OPEB costs and Net OPEB Obligation
The City had an actuarial valuation performed for the plan as of September 30, 2012, to determine the funded status of the plan as of that date as well as the employer’s annual required contribution (ARC) for the fiscal year ended December 31, 2014. The City’s annual OPEB cost, the percentage of annual OPEB cost contributed to the plan, and the net OPEB obligation for 2014 and the two preceding years were as follows:
Fiscal Year Ended Annual OPEB CostEmployer
Contribution
Percentage of Annual OPEB Cost
ContributedNet OPEB Obligation
December 31, 2012 16,064,452$ 9,920,050$ 61.75% 31,812,017$ December 31, 2013 12,124,691 7,641,771 63.03% 36,294,937 December 31, 2014 12,190,478 7,845,228 64.36% 40,640,187
The net OPEB obligation (NOPEBO) as of December 31, 2014, was calculated as follows:
Annual Required Contribution (ARC) 12,785,408$ Interest on Net OPEB Obligation 1,633,272Adjustment to Annual Required Contribution (2,228,202)Annual OPEB cost 12,190,478Contributions Made Direct 6,733,338 Indirect Implicit Subsidy 1,111,890Total Contributions Made 7,845,228
Increase (Decrease) in Net OPEB Obligation 4,345,250
Net OPEB Obligation Beginning of Year 36,294,937
Net OPEB Obligation End of Year 40,640,187$
6. Funded Status and Funding Progress As of the actuarial valuation date of September 30, 2012, the funded status of the plan was as follows:
Actuarial Accrued Liability (AAL) 156,415,280$ Actuarial Value of Plan Assets - Unfunded Actuarial Accrued Liabililty (UAAL) 156,415,280$ Funded Ratio (Actuarial Value of Plan Assets/AAL) 0.00%
Active Members Covered Payroll 170,535,057$ UAAL as a Percentage of Covered Payroll 91.72%
130
City of Saint Paul, Minnesota NOTES TO THE FINANCIAL STATEMENTS For the Fiscal Year Ended December 31, 2014
Note VIII. Other Information (continued)
7. Actuarial Methods and Assumptions Actuarial valuations of an ongoing plan involve estimates of the value of reported amounts and assumptions about the probability of occurrence of events far into the future. Examples include assumptions about future employment, mortality, and the healthcare cost trend. Amounts determined regarding the funded status of the plan and the annual required contributions of the employer are subject to continual revision as actual results are compared with past expectations and new estimates are made about the future. The schedule of funding progress, presented as required supplementary information, following the notes to the financial statements, will present multi-year trend information as it becomes available. The schedule will show whether the actuarial value of plan assets is increasing or decreasing over time relative to the actuarial accrued liabilities for benefits. Actuarial methods and assumptions, projections of benefits for financial reporting purposes are based on the substantive plan (the plan as understood by the employer and plan members) and include the types of benefits provided at the time of each valuation and the historical pattern of sharing of benefit costs between the employer and plan members to that point. The actuarial methods and assumptions used include techniques that are designed to reduce short-term volatility in actuarial accrued liabilities and the actuarial value of assets, consistent with the long-term perspective of the calculations. In the September 30, 2012 actuarial valuation, the projected unit credit actuarial cost method was used. The actuarial assumptions included 5.00% discount rate and an annual healthcare cost trend rate of beginning at 10.0% for fiscal year 2010 and declining over 10 years by 0.5% per year to 5.0%. Both rates include a 3.0% inflation assumption. The actuarial value of assets was not determined as the City has not advance-funded its obligation. The plan’s unfunded actuarial accrued liability is being amortized as a level dollar amount over a 30-year open amortization period (30-year period restarted with each valuation).
(Remainder of this page left blank intentionally)
131

City of Saint Paul, Minnesota NOTES TO THE FINANCIAL STATEMENTS For the Fiscal Year Ended December 31, 2014
Note VIII. Other Information (continued)
C. Risk Management
The City is exposed to various risks of losses related to torts; theft of, damage to and destruction of assets; errors and omissions; injuries to employees and natural disasters. The City accounts for and finances its risk management activities in the Central Services Internal Service Fund. Claim expenditures and liabilities are reported when it is probable that a loss has occurred and the amount of that loss can be reasonably estimated. These losses include an estimate of claims that have been incurred but not reported. Claim expenditures relating to tort liabilities are paid from the General Fund and other funds responsible for losses as determined by the tort claim manager. Workers’ compensation claim expenditures are directly charged to department funds responsible for the employee at time of injury. The following discloses the change in the balance of the claims liability during fiscal years 2013 and 2014.
Year Ended December 31, 2014
Year Ended December 31, 2013
Beginning of Fiscal Year Liability 38,165,057$ 26,742,551$ Current Year Claims and Changes in Estimates 11,728,772 24,033,467Claim Payments (14,283,430) (12,610,961)
End of Fiscal Year Liability 35,610,399$ 38,165,057$
Minnesota Statutes Section 466.04 limits the City’s tort financial exposure for claims arising from general liability or vehicle liability exposures. The limits are $300,000 per individual and $750,000 per accident for any number of claims arising out of a single occurrence for claims arising on or after January 1, 1998, and before January 1, 2000. For claims arising on or after January 1, 2000, and before January 1, 2008, the limit per accident for any number of claims arising out of a single occurrence is $1,000,000 and $300,000 per individual. For claims arising on or after January 1, 2008 and before July 1, 2009, the limit per accident for any number of claims arising out of a single occurrence is $1,200,000 and $400,000 per individual. For claims arising on or after July 1, 2009, the limit per accident for any number of claims arising out of a single occurrence is $1,500,000 and $500,000 per individual. The limits double when the claim arises out of the release or threatened release of a hazardous substance. The City does not carry commercial liability and collision insurance for City-owned vehicles. The HRA acquired in 2009 a site with existing pollution which will require remediation. To address its exposure to risk of loss related to pollution liability torts, the HRA has purchased a Premises Pollution Liability Insurance policy. The limit of this coverage is $20,000,000. The City has purchased all risk property insurance coverage of $1.8 billion for its real and personal property throughout the City. The deductible for each occurrence of damage or loss of property is $250,000. Each City department participating in the risk retention program is charged a yearly amount based upon pro rata shares of the property insurance coverage, and contributions are made to a risk retention pool to address potential losses not covered by insurance. The City department is responsible for the first $10,000 of each loss. Losses that exceed $10,000 are reimbursed by the risk retention pool. There were no significant reductions in insurance from the previous year or settlements in excess of insurance coverage for any of the past three years. The City purchases coverage for employee health and life insurance benefits. These benefit plans are fully insured. The contributions required by employees to the health and life insurance programs are dependent upon an employee’s bargaining unit. There were no significant reductions in insurance from the previous year or settlements in excess of insurance coverage for any of the past three fiscal years.
132
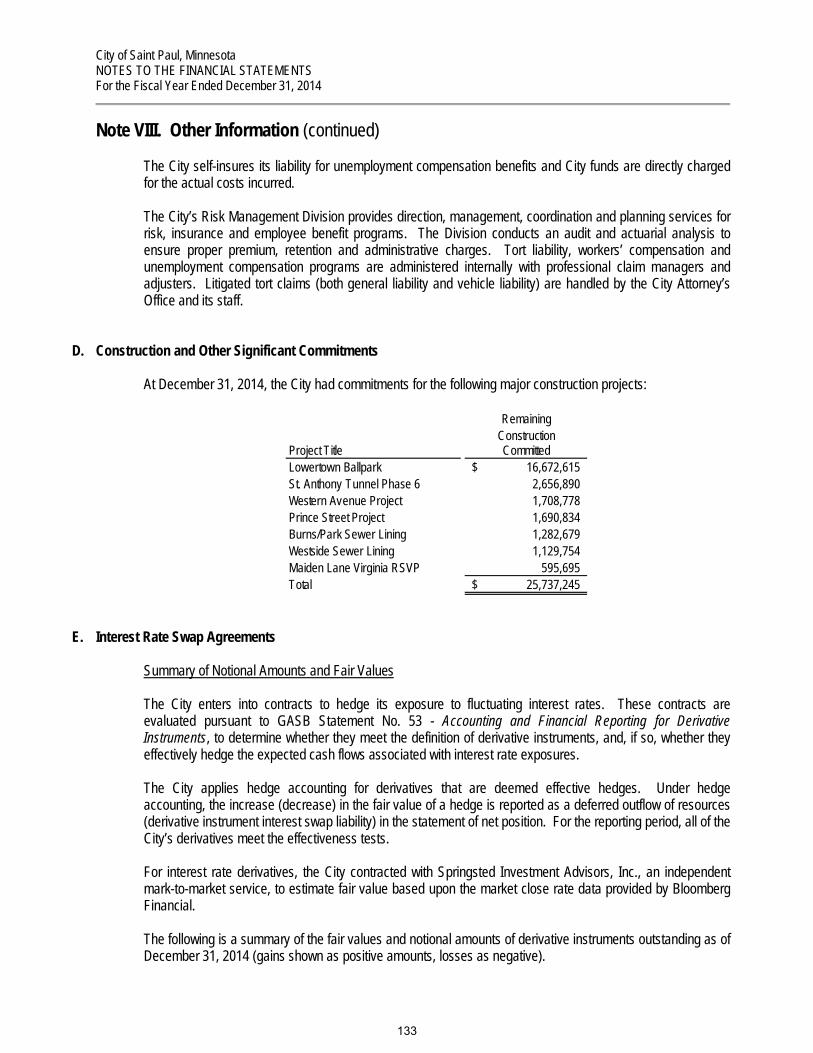
City of Saint Paul, Minnesota NOTES TO THE FINANCIAL STATEMENTS For the Fiscal Year Ended December 31, 2014
Note VIII. Other Information (continued) The City self-insures its liability for unemployment compensation benefits and City funds are directly charged for the actual costs incurred. The City’s Risk Management Division provides direction, management, coordination and planning services for risk, insurance and employee benefit programs. The Division conducts an audit and actuarial analysis to ensure proper premium, retention and administrative charges. Tort liability, workers’ compensation and unemployment compensation programs are administered internally with professional claim managers and adjusters. Litigated tort claims (both general liability and vehicle liability) are handled by the City Attorney’s Office and its staff.
D. Construction and Other Significant Commitments
At December 31, 2014, the City had commitments for the following major construction projects:
RemainingConstruction
Project Title CommittedLowertown Ballpark 16,672,615$ St. Anthony Tunnel Phase 6 2,656,890 Western Avenue Project 1,708,778 Prince Street Project 1,690,834 Burns/Park Sewer Lining 1,282,679 Westside Sewer Lining 1,129,754 Maiden Lane Virginia RSVP 595,695 Total 25,737,245$
E. Interest Rate Swap Agreements Summary of Notional Amounts and Fair Values
The City enters into contracts to hedge its exposure to fluctuating interest rates. These contracts are evaluated pursuant to GASB Statement No. 53 - Accounting and Financial Reporting for Derivative Instruments, to determine whether they meet the definition of derivative instruments, and, if so, whether they effectively hedge the expected cash flows associated with interest rate exposures. The City applies hedge accounting for derivatives that are deemed effective hedges. Under hedge accounting, the increase (decrease) in the fair value of a hedge is reported as a deferred outflow of resources (derivative instrument interest swap liability) in the statement of net position. For the reporting period, all of the City’s derivatives meet the effectiveness tests. For interest rate derivatives, the City contracted with Springsted Investment Advisors, Inc., an independent mark-to-market service, to estimate fair value based upon the market close rate data provided by Bloomberg Financial. The following is a summary of the fair values and notional amounts of derivative instruments outstanding as of December 31, 2014 (gains shown as positive amounts, losses as negative).
133

City of Saint Paul, Minnesota NOTES TO THE FINANCIAL STATEMENTS For the Fiscal Year Ended December 31, 2014
Note VIII. Other Information (continued)
Governmental ActivitiesClassification Amount Classification Amount Notional
Effective Cash Flow hedgesInterest Rate Derivatives:
Pay-fixed swaps, interest rate Deferred Outflow 1,731,320$ Derivative (11,010,150)$ 51,435,000$
Fair Value at December 31, 20142014 Change in Fair Value
Objective and Terms of Hedging Derivative Instruments In November 2007, the City entered into two interest rate swap agreements for $32,727,500 each, for a total notional amount of $65,455,000 with Piper Jaffray Financial Products, Inc., and Royal Bank of Canada relating to the 1999 Taxable Sales Tax Revenue Bonds. These interest rate swap agreements took place in November 2007 and will end on November 1, 2025. On May 1, 2009, the 1999 Taxable Sales Tax Revenue Bonds were refunded through the issuance of taxable variable rate bonds. The objective of this agreement is to be able to refund the bonds at a lower estimated total synthetic interest rate of 5.58% compared to the present interest rates of 6.44% through 7.09% on the original bonds payable from 2009 through 2025. Risks of Derivative Instruments 1. Credit Risk Credit risk is the risk of loss due to a counterparty defaulting on its obligations. The City seeks to minimize credit risk by transacting with creditworthy counterparties. Interest rate swap counterparties are evaluated at the time of transaction execution. 2. Termination Risk Termination risk is the risk that a derivative will terminate prior to its scheduled maturity due to a contractual event. Contractual events include bankruptcy, illegality, default, and mergers in which the successor entity does not meet credit criteria. One aspect of termination risk is that the City would lose the hedging benefit of a derivative that becomes subject to a termination event. Another aspect of termination risk is that, if at the time of termination the mark-to-market value of the derivative was a liability to the City, the City could be required to pay that amount to the counterparty. Termination risk is associated with the City’s derivative up to the fair value amount. 3. Hedged Debt Net cash flows for the City’s synthetic fixed-rate debt are shown below. These amounts assume that the interest rates of the bonds and the reference rates of the hedging derivative instruments remain at December 31, 2014 levels. These rates will vary and, as they do, interest payments on the variable-rate bonds and net receipts/payments on the interest rate swaps will vary. The table shows only the City’s effectively hedged synthetic fixed-rate debt, which is a subset of the City’s total debt. As of December 31, 2014, all of the City’s variable-rate debt is effectively hedged.
134

City of Saint Paul, Minnesota NOTES TO THE FINANCIAL STATEMENTS For the Fiscal Year Ended December 31, 2014
Note VIII. Other Information (continued)
NetYear Ending Payment on
December 31, Principal Interest Derivatives Total
2015 2,890,000 106,339 2,558,520 5,554,859 2016 3,045,000 100,254 2,412,107 5,557,361 2017 3,215,000 93,840 2,257,786 5,566,626 2018 3,395,000 61,096 1,469,443 4,925,539 2019-2024 20,000,000 298,694 7,187,069 27,485,763 2025-2026 18,890,000 100,242 2,411,814 21,402,056
Totals 51,435,000$ 760,465$ 18,296,739$ 70,492,204$
F. Contingent Liabilities
Litigation
The City, in connection with the normal conduct of its affairs, is involved in various disputes, claims and lawsuits; it is expected that the final resolution of these matters will not materially affect the financial statements of the City. University Enterprise Laboratory Project The City of Saint Paul entered into a $6 million guaranty of principal and interest with Wells Fargo on January 21, 2005, to help secure financing for the $24.2 million University Enterprise Laboratory (UEL) Project at 1000 Westgate Drive in St. Paul, Minnesota. In January 2012, the original 2005 debt was refinanced through various funds, including the proceeds of a loan from US Bank for $9.4 million. The effect of the refunding was to reduce the City of St. Paul’s guaranty to $4 million. Going forward, the City’s contingent liability will drop further, as the City’s guaranty automatically declines as the mortgage is paid down. The current guaranty encumbrance is against the General Fund. Cleanup of Hazardous Materials Properties owned by the HRA and City may have certain contingent liabilities associated with them due to potential contamination from hazardous materials or difficulty in securing vacant structures located on them. It is not expected that these contingencies will have a material effect on the financial statements of the City. The following HRA and City properties have been identified as possible sites of pollution or contamination: 1. Capp Road (Catholic Charities) – Possible pollution or contamination.
2. Koch/Mobil – Remediation has been completed on the Koch site. The Mobil/Exxon site remediation is underway pursuant to a purchase agreement executed in December 2009. The HRA is to remediate the pollution and restricts the future use of the land to specific uses. The land was purchased for $1 and, in addition, the seller (Exxon) donated $5,000,000 to the HRA for pollution remediation and possible park improvements.
135
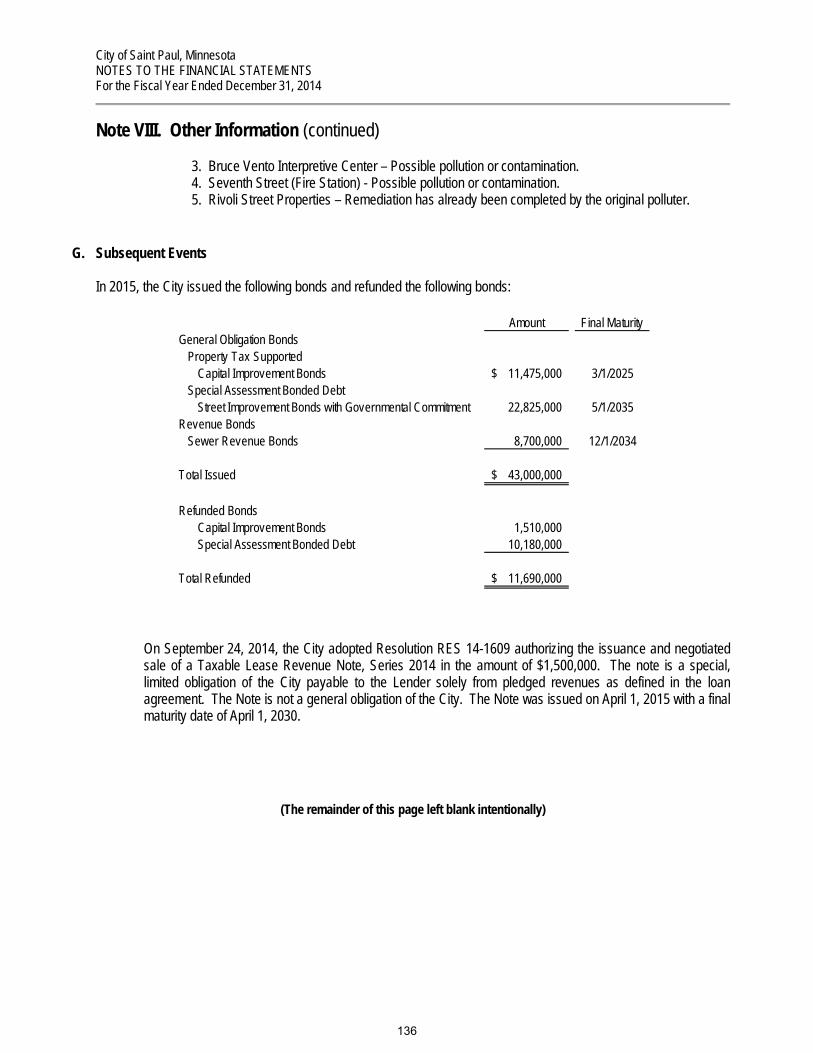
City of Saint Paul, Minnesota NOTES TO THE FINANCIAL STATEMENTS For the Fiscal Year Ended December 31, 2014
Note VIII. Other Information (continued)
3. Bruce Vento Interpretive Center – Possible pollution or contamination. 4. Seventh Street (Fire Station) - Possible pollution or contamination. 5. Rivoli Street Properties – Remediation has already been completed by the original polluter.
G. Subsequent Events In 2015, the City issued the following bonds and refunded the following bonds:
Amount Final MaturityGeneral Obligation Bonds Property Tax Supported
Capital Improvement Bonds 11,475,000$ 3/1/2025 Special Assessment Bonded Debt
Street Improvement Bonds with Governmental Commitment 22,825,000 5/1/2035Revenue Bonds Sewer Revenue Bonds 8,700,000 12/1/2034
Total Issued 43,000,000$
Refunded BondsCapital Improvement Bonds 1,510,000Special Assessment Bonded Debt 10,180,000
Total Refunded 11,690,000$
On September 24, 2014, the City adopted Resolution RES 14-1609 authorizing the issuance and negotiated sale of a Taxable Lease Revenue Note, Series 2014 in the amount of $1,500,000. The note is a special, limited obligation of the City payable to the Lender solely from pledged revenues as defined in the loan agreement. The Note is not a general obligation of the City. The Note was issued on April 1, 2015 with a final maturity date of April 1, 2030.
(The remainder of this page left blank intentionally)
136

REQUIRED SUPPLEMENTARY INFORMATION
137

This page left blank intentionally
138
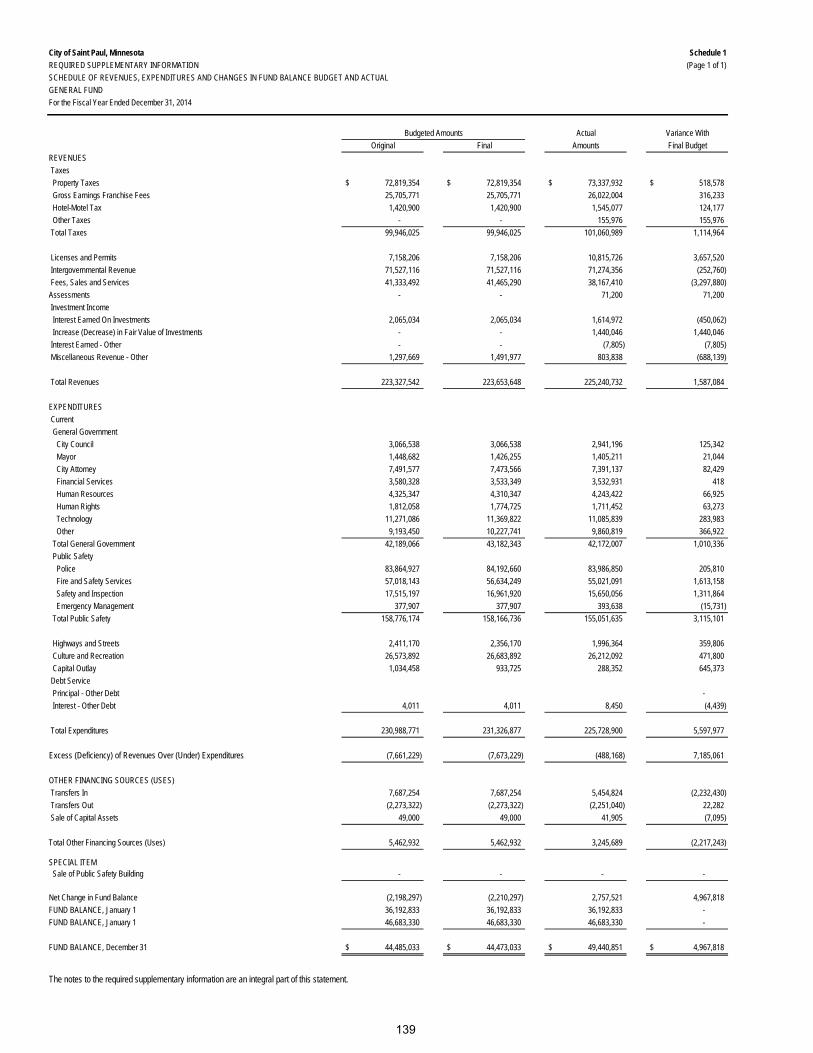
City of Saint Paul, Minnesota Schedule 1REQUIRED SUPPLEMENTARY INFORMATION (Page 1 of 1)SCHEDULE OF REVENUES, EXPENDITURES AND CHANGES IN FUND BALANCE BUDGET AND ACTUALGENERAL FUNDFor the Fiscal Year Ended December 31, 2014
Budgeted Amounts Actual Variance WithOriginal Final Amounts Final Budget
REVENUES Taxes Property Taxes 72,819,354$ 72,819,354$ 73,337,932$ 518,578$ Gross Earnings Franchise Fees 25,705,771 25,705,771 26,022,004 316,233 Hotel-Motel Tax 1,420,900 1,420,900 1,545,077 124,177 Other Taxes - - 155,976 155,976 Total Taxes 99,946,025 99,946,025 101,060,989 1,114,964
Licenses and Permits 7,158,206 7,158,206 10,815,726 3,657,520 Intergovernmental Revenue 71,527,116 71,527,116 71,274,356 (252,760) Fees, Sales and Services 41,333,492 41,465,290 38,167,410 (3,297,880) Assessments - - 71,200 71,200 Investment Income Interest Earned On Investments 2,065,034 2,065,034 1,614,972 (450,062) Increase (Decrease) in Fair Value of Investments - - 1,440,046 1,440,046 Interest Earned - Other - - (7,805) (7,805) Miscellaneous Revenue - Other 1,297,669 1,491,977 803,838 (688,139)
Total Revenues 223,327,542 223,653,648 225,240,732 1,587,084
EXPENDITURES Current General Government City Council 3,066,538 3,066,538 2,941,196 125,342 Mayor 1,448,682 1,426,255 1,405,211 21,044 City Attorney 7,491,577 7,473,566 7,391,137 82,429 Financial Services 3,580,328 3,533,349 3,532,931 418 Human Resources 4,325,347 4,310,347 4,243,422 66,925 Human Rights 1,812,058 1,774,725 1,711,452 63,273 Technology 11,271,086 11,369,822 11,085,839 283,983 Other 9,193,450 10,227,741 9,860,819 366,922 Total General Government 42,189,066 43,182,343 42,172,007 1,010,336 Public Safety Police 83,864,927 84,192,660 83,986,850 205,810 Fire and Safety Services 57,018,143 56,634,249 55,021,091 1,613,158 Safety and Inspection 17,515,197 16,961,920 15,650,056 1,311,864 Emergency Management 377,907 377,907 393,638 (15,731) Total Public Safety 158,776,174 158,166,736 155,051,635 3,115,101
Highways and Streets 2,411,170 2,356,170 1,996,364 359,806 Culture and Recreation 26,573,892 26,683,892 26,212,092 471,800 Capital Outlay 1,034,458 933,725 288,352 645,373 Debt Service Principal - Other Debt - Interest - Other Debt 4,011 4,011 8,450 (4,439)
Total Expenditures 230,988,771 231,326,877 225,728,900 5,597,977
Excess (Deficiency) of Revenues Over (Under) Expenditures (7,661,229) (7,673,229) (488,168) 7,185,061
OTHER FINANCING SOURCES (USES) Transfers In 7,687,254 7,687,254 5,454,824 (2,232,430) Transfers Out (2,273,322) (2,273,322) (2,251,040) 22,282 Sale of Capital Assets 49,000 49,000 41,905 (7,095)
Total Other Financing Sources (Uses) 5,462,932 5,462,932 3,245,689 (2,217,243)
SPECIAL ITEM Sale of Public Safety Building - - - -
Net Change in Fund Balance (2,198,297) (2,210,297) 2,757,521 4,967,818 FUND BALANCE, January 1 36,192,833 36,192,833 36,192,833 - FUND BALANCE, January 1 46,683,330 46,683,330 46,683,330 -
FUND BALANCE, December 31 44,485,033$ 44,473,033$ 49,440,851$ 4,967,818$
The notes to the required supplementary information are an integral part of this statement.
139

City of Saint Paul, Minnesota Schedule 2REQUIRED SUPPLEMENTARY INFORMATION (Page 1 of 2)COMBINING SCHEDULE OF REVENUES, EXPENDITURES AND CHANGES IN FUND BALANCE BUDGET AND ACTUALANNUALLY BUDGETED MAJOR SPECIAL REVENUE FUNDSFor the Fiscal Year Ended December 31, 2014
Budgeted Amounts Actual Variance WithOriginal Final Amounts Final Budget
REVENUES Property Taxes Current Taxpayer -$ -$ -$ -$ Delinquent Taxpayer - - - - Total Property Taxes - - - -
Intergovernmental Revenue - - - - Fees, Sales and Services - - 160,001 160,001 Assessment Financing 5,526,902 8,026,902 6,598,105 (1,428,797) Investment Income Interest Earned on Investments - - - - Increase (Decrease) in Fair Value of Investments - - - - Miscellaneous - Other (15,000) (15,000) - 15,000
Total Revenues 5,511,902 8,011,902 6,758,106 (1,253,796)
EXPENDITURES Current General Government 276,959 1,335,459 1,364,818 (29,359) Public Safety 442,810 442,810 416,825 25,985 Culture and Recreation - - - - Housing and Economic Development - - - - Intergovernmental Expenditures - - - - Capital Outlay - - - - Debt Service - - - -
Total Expenditures 719,769 1,778,269 1,781,643 (3,374)
Excess (Deficiency) of Revenues Over (Under) Expenditures 4,792,133 6,233,633 4,976,463 (1,257,170)
OTHER FINANCING SOURCES (USES) Transfers In 400,000 400,000 375,901 (24,099) Transfers Out (5,390,057) (6,831,557) (5,534,203) 1,297,354 Capital Lease - - - -
Total Other Financing Sources (Uses) (4,990,057) (6,431,557) (5,158,302) 1,273,255
Net Change in Fund Balances (197,924) (197,924) (181,839) 16,085
FUND BALANCES, January 1 6,681,758 6,681,758 6,681,758 -
FUND BALANCES, December 31 6,483,834$ 6,483,834$ 6,499,919$ 16,085$
Assessment Financing
140
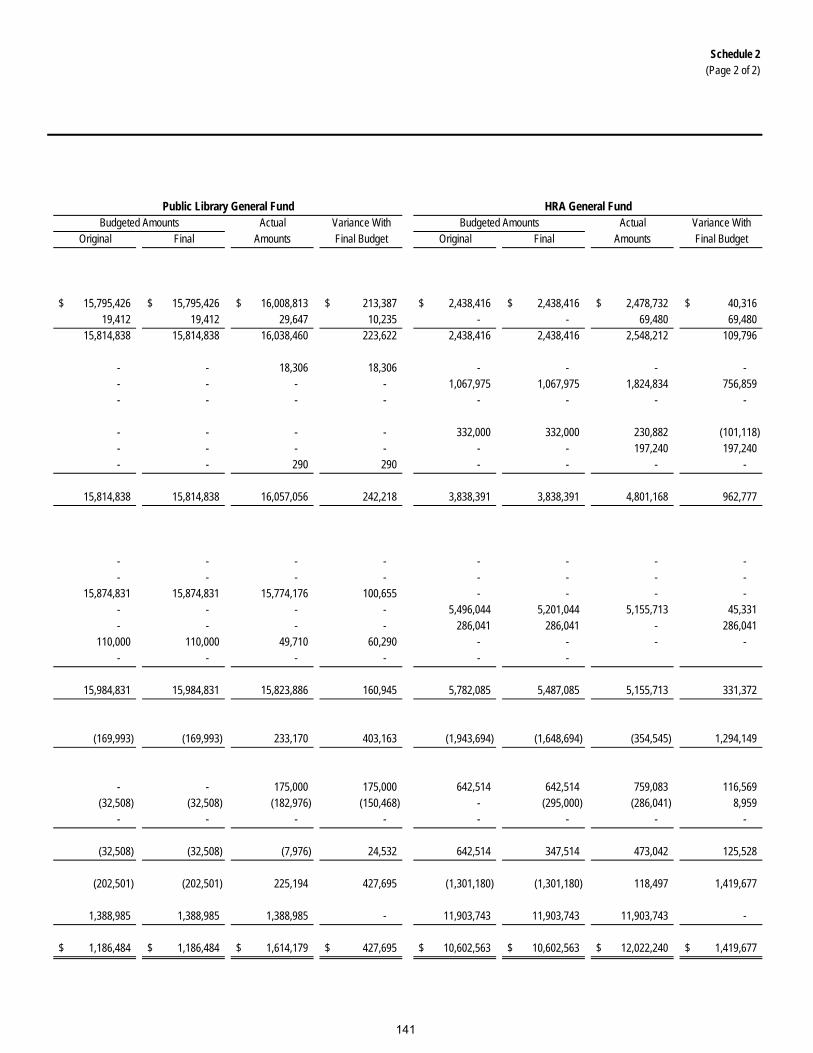
Schedule 2(Page 2 of 2)
Budgeted Amounts Actual Variance With Budgeted Amounts Actual Variance WithOriginal Final Amounts Final Budget Original Final Amounts Final Budget
15,795,426$ 15,795,426$ 16,008,813$ 213,387$ 2,438,416$ 2,438,416$ 2,478,732$ 40,316$ 19,412 19,412 29,647 10,235 - - 69,480 69,480
15,814,838 15,814,838 16,038,460 223,622 2,438,416 2,438,416 2,548,212 109,796
- - 18,306 18,306 - - - - - - - - 1,067,975 1,067,975 1,824,834 756,859 - - - - - - - -
- - - - 332,000 332,000 230,882 (101,118) - - - - - - 197,240 197,240 - - 290 290 - - - -
15,814,838 15,814,838 16,057,056 242,218 3,838,391 3,838,391 4,801,168 962,777
- - - - - - - - - - - - - - - -
15,874,831 15,874,831 15,774,176 100,655 - - - - - - - - 5,496,044 5,201,044 5,155,713 45,331 - - - - 286,041 286,041 - 286,041
110,000 110,000 49,710 60,290 - - - - - - - - - -
15,984,831 15,984,831 15,823,886 160,945 5,782,085 5,487,085 5,155,713 331,372
(169,993) (169,993) 233,170 403,163 (1,943,694) (1,648,694) (354,545) 1,294,149
- - 175,000 175,000 642,514 642,514 759,083 116,569 (32,508) (32,508) (182,976) (150,468) - (295,000) (286,041) 8,959
- - - - - - - -
(32,508) (32,508) (7,976) 24,532 642,514 347,514 473,042 125,528
(202,501) (202,501) 225,194 427,695 (1,301,180) (1,301,180) 118,497 1,419,677
1,388,985 1,388,985 1,388,985 - 11,903,743 11,903,743 11,903,743 -
1,186,484$ 1,186,484$ 1,614,179$ 427,695$ 10,602,563$ 10,602,563$ 12,022,240$ 1,419,677$
Public Library General Fund HRA General Fund
141

City of Saint Paul, Minnesota Schedule 3REQUIRED SUPPLEMENTARY INFORMATION (Page 1 of 1)SCHEDULE OF FUNDING PROGRESSOTHER POSTEMPLOYMENT BENEFITS PLANFor the Fiscal Year Ended December 31, 2014
(1) (2) (3) (4) (5) (6)
Actuarial Valuation Date
Actuarial Value of Assets
Actuarial Accrued Liability (AAL)
Funded Ratio (1) / (2)
Unfunded Actuarial Accrued Liability (UAAL)
(2) - (1)Active Members Covered Payroll
UAAL As a Percentage of
Covered Payroll (4) / (5)
September 30, 2006 -$ 165,012,188$ 0.00% 165,012,188$ 148,007,987$ 111.49%September 30, 2008 - 167,566,226 0.00% 167,566,226 145,877,064 114.87%September 30, 2010 - 188,664,971 0.00% 188,664,971 162,301,913 116.24%September 30, 2012 - 156,415,280 0.00% 156,415,280 170,535,057 91.72%
142

City of Saint Paul, Minnesota Schedule 4REQUIRED SUPPLEMENATRY INFORMATION (Page 1 of 1)SCHEDULE OF EMPLOYER CONTRIBUTIONSOTHER POSTEMPLOYMENT BENEFITS PLANFor the Fiscal Year Ended December 31, 2014
Fiscal Year Ended December 31, Employer Contributions
Annual Required Contribution (ARC) Percentage Contributed
2009 9,559,747$ 14,436,251$ 66.22%2010 8,951,951 14,749,946 60.69%2011 9,299,062 16,045,762 57.95%2012 8,807,003 16,446,256 53.55%2013 8,602,504 12,646,139 68.02%2014 7,845,228 12,785,408 61.36%
143

City of Saint Paul, Minnesota For the Fiscal Year Ended December 31, 2014
NOTES TO REQUIRED SUPPLEMENTARY INFORMATION For the Fiscal Year Ended December 31, 2014
Budgetary Information
A budgetary comparison for the City’s General Fund and the annually budgeted Assessment Financing Fund, the Public Library General Fund and the HRA General Fund are required supplementary information.
All annually budgeted funds including the General Fund, the Assessment Financing Fund, the Public Library General Fund and the HRA General Fund are adopted on a basis consistent with generally accepted accounting principles. The legal level of budgetary control for the General Fund is at the department/office level and at the fund level for the HRA General Fund.
The General Fund did not exceed total appropriations at the fund level, however total expenditures exceeded appropriations in Emergency Management ($15,731) and Interest-Other Debt ($4,439).
The Assessment Financing Fund exceeded total appropriations at the fund level by ($3,374). The Public Library General Fund and the HRA General Fund did not exceed total appropriations at the fund level.
144
City of Saint Paul, Minnesota For the Fiscal Year Ended December 31, 2014
Nonmajor Governmental Funds Special Revenue Funds Special Revenue funds account and report the proceeds of specific revenue sources that are restricted or committed to expenditure for specified purposes other than debt or capital projects. City Grants - to account for monies for energy conservation and improvement measures, city grants, contributions, and other sources received from federal, state, and other agencies to support specified general governmental functions or projects. General Government Special Projects - to account for the hosting of special events, promotion of the city as a destination, building of capacity for targeted businesses, vendor outreach for the city and other governmental agencies, and replacement of cable equipment through the charging of fees, contributions and other sources. Fire Responsive Services - to account for monies received by the Fire Department to perform various fire functions, to provide fire protection outside city limits, and to purchase fire equipment. Police Special Projects - to account for monies received from various restricted contributions, and other sources with a restricted purpose to perform various miscellaneous police functions. Charitable Gambling - to monitor, review, and administrate all lawful gambling activities and to ensure the integrity of operations as required by state law. Right of Way Maintenance - to account for revenues received from right-of-way assessments, municipal state aid, county aid, and trunk highway funds for summer street repair and maintenance, winter street activities, sidewalk maintenance, traffic signs, signals, streetlight maintenance, and boulevard tree and vegetation maintenance and trimming. Street Lighting Districts - to account for levied assessments used to operate above standard (ornamental) street lighting systems in various areas of the city, installed at the request of adjacent property owners. Recycling and Solid Waste - to account for monies received for the city’s recycling programs. The recycling programs include the coordinated efforts of the City of Saint Paul, Ramsey County, State of Minnesota, Eureka Recycling, and the citizens of Saint Paul. Public Health - to account for expenses incurred in the operation of Public Health and billed to Ramsey County. Parks and Recreation Special Projects - to account for monies received from various restricted contributions, and other sources with a restricted purpose to perform various special projects for parks and recreation centers. Como Campus - to account for proceeds from education programs, commissions and donations from outside parties, to be appropriated for volunteer recruitment and training, purchase of animals, maintenance of zoo and conservatory and other related costs.
145

City of Saint Paul, Minnesota For the Fiscal Year Ended December 31, 2014
Parkland Replacement - to account for proceeds from the sale of city property for which there is no outstanding debt and use the remaining proceeds to finance projects in the capital improvement budget. Public Library Special Projects - to account for Saint Paul Public Library Agency (SPPLA) revenues from fees, fines, grants and donations. Revenues are from various federal and state agencies as well as monies received from the Friends of the Saint Paul Public Library to support expenses for special projects such as collection development, staff training and development, and community outreach opportunities. City HUD Grants - to account for monies received from the U.S. Department of Housing and Urban Development under the Community Development Block Grant program,the ESG program, the HOME program, the NSP programs and other miscellaneous revenues derived from projects operated under these programs. City Sales Tax - to account for monies received from the one-half percent city sales tax which are used for the STAR program, major RiverCentre capital expenditures, other capital expenditures as determined by the City Council, and the transfer to the HRA Debt Service Fund for financing the debt service on the HRA Sales Tax Revenue Bonds. HRA Grants - to account for intergovernmental revenues provided to the HRA from federal, state and local governments for housing and development. Capital Projects Funds Capital Projects funds account for and report financial resources that are restricted, committed, or assigned to expenditure for capital outlays, including the acquisition or construction of capital facilities and other capital assets. Public Library Capital Projects - to account for monies received from the sale of general obligation bonds for the construction of Library projects. HRA Development Capital Projects - to account for HRA multi-year development projects that are locally funded through transfers from other funds and bonds sold for development purposes. HRA Tax Increment Capital Projects - to account for development and capital expenditures primarily in Saint Paul’s Tax Increment Districts using financing from bond proceeds, tax increment revenues, and other sources. Permanent Fund Permanent funds account for and report resources that are restricted to the extent that only earnings, not principal, may be used for purposes that support the reporting government’s programs; that is, for the benefit of the government or its citizenry. Parks Memorial Permanent - to account for donations from the Ordway Family for the construction of the Japanese Garden in Como Park and the principal of a trust fund and disbursement of interest derived from donation for perpetual maintenance of a memorial located at Como Park Conservatory.
146

City of Saint Paul, Minnesota Statement 13COMBINING BALANCE SHEET (Page 1 of 1)NONMAJOR GOVERNMENTAL FUNDSDecember 31, 2014
TotalParks Nonmajor
Special Capital Memorial GovernmentalRevenue Projects Permanent Funds
ASSETS Cash and Investments with Treasurer 21,664,796$ 25,106,166$ 84,278$ 46,855,240$ Cash and Investments with Trustees 2,333,513 - - 2,333,513 Imprest Funds 58,395 - - 58,395 Receivables Property Taxes - Due from Ramsey County - 103,309 - 103,309 Property Taxes - Delinquent - 90,491 - 90,491 Accounts (net of allowance for estimated uncollectible) 1,282,159 - - 1,282,159 Assessments 21,049,539 - - 21,049,539 Notes and Loans 7,890,528 965,769 - 8,856,297 Accrued Interest 129,511 123,037 333 252,881 Due from Other Funds 554,548 - - 554,548 Due from Other Governmental Units 13,363,864 - - 13,363,864 Advances to Other Funds - 3,047,078 - 3,047,078 Land Held for Resale 5,393,593 3,001,006 - 8,394,599
TOTAL ASSETS 73,720,446$ 32,436,856$ 84,611$ 106,241,913$
LIABILITIES, DEFERRED INFLOWS OFRESOURCES AND FUND BALANCES Liabilities Accrued Salaries Payable 1,652,076$ -$ -$ 1,652,076$ Accounts Payable 4,193,025 9,485 - 4,202,510 Due to Other Funds 7,190,280 - - 7,190,280 Due to Other Governmental Units - 1,518,677 - 1,518,677 Assessments 599,240 - - 599,240 Advance from Other Funds 1,783,568 3,423,364 - 5,206,932 Unearned Revenue 10,155,766 2,039,312 - 12,195,078
Total Liabilities 25,573,955 6,990,838 - 32,564,793
Deferred Inflows of Resources Unavailable Revenue 14,954,324 4,127,048 93 19,081,465
Fund Balance Nonspendable - 3,047,078 35,000 3,082,078 Restricted 10,050,284 18,271,744 49,518 28,371,546 Committed 12,142,564 - - 12,142,564 Assigned 15,548,901 148 - 15,549,049 Unassigned (4,549,582) - - (4,549,582)
Total Fund Balances 33,192,167 21,318,970 84,518 54,595,655
TOTAL LIABILITIES, DEFERRED INFLOWS OF RESOURCES AND FUND BALANCES 73,720,446$ 32,436,856$ 84,611$ 106,241,913$
147

This page left blank intentionally
148
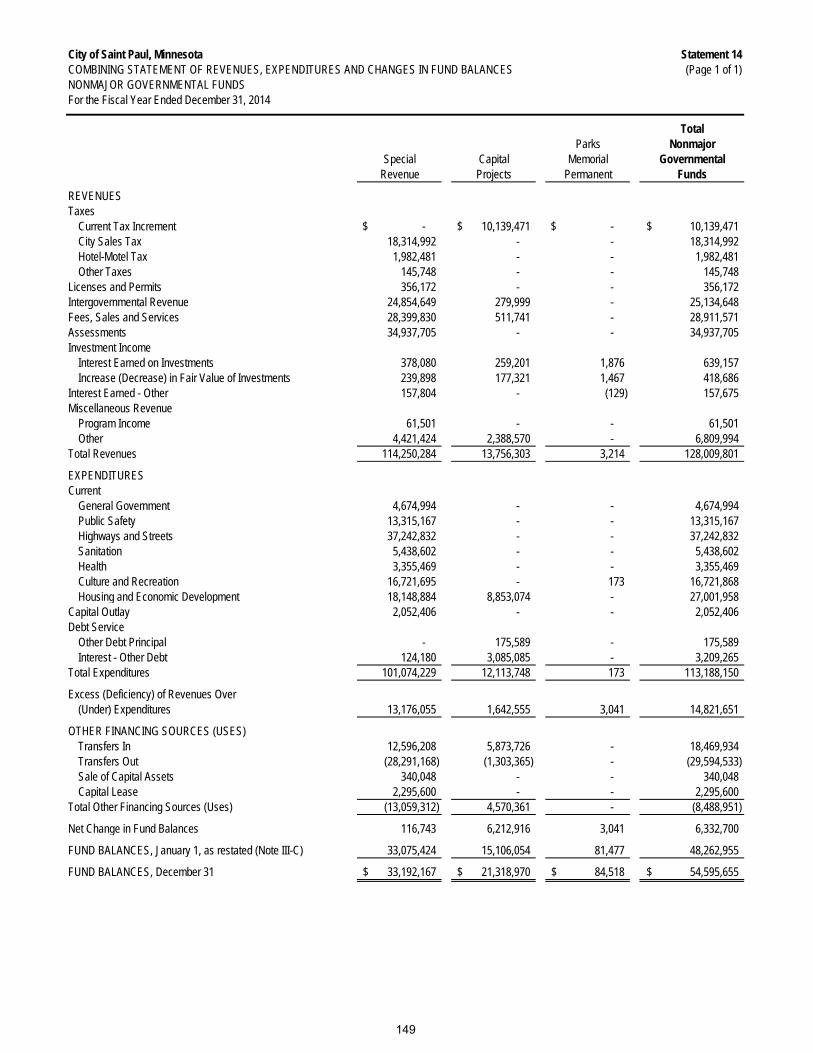
City of Saint Paul, Minnesota Statement 14COMBINING STATEMENT OF REVENUES, EXPENDITURES AND CHANGES IN FUND BALANCES (Page 1 of 1)NONMAJOR GOVERNMENTAL FUNDSFor the Fiscal Year Ended December 31, 2014
TotalParks Nonmajor
Special Capital Memorial GovernmentalRevenue Projects Permanent Funds
REVENUESTaxes
Current Tax Increment -$ 10,139,471$ -$ 10,139,471$ City Sales Tax 18,314,992 - - 18,314,992 Hotel-Motel Tax 1,982,481 - - 1,982,481 Other Taxes 145,748 - - 145,748
Licenses and Permits 356,172 - - 356,172 Intergovernmental Revenue 24,854,649 279,999 - 25,134,648 Fees, Sales and Services 28,399,830 511,741 - 28,911,571 Assessments 34,937,705 - - 34,937,705 Investment Income
Interest Earned on Investments 378,080 259,201 1,876 639,157 Increase (Decrease) in Fair Value of Investments 239,898 177,321 1,467 418,686
Interest Earned - Other 157,804 - (129) 157,675 Miscellaneous Revenue
Program Income 61,501 - - 61,501 Other 4,421,424 2,388,570 - 6,809,994
Total Revenues 114,250,284 13,756,303 3,214 128,009,801
EXPENDITURESCurrent
General Government 4,674,994 - - 4,674,994 Public Safety 13,315,167 - - 13,315,167 Highways and Streets 37,242,832 - - 37,242,832 Sanitation 5,438,602 - - 5,438,602 Health 3,355,469 - - 3,355,469 Culture and Recreation 16,721,695 - 173 16,721,868 Housing and Economic Development 18,148,884 8,853,074 - 27,001,958
Capital Outlay 2,052,406 - - 2,052,406 Debt Service
Other Debt Principal - 175,589 - 175,589 Interest - Other Debt 124,180 3,085,085 - 3,209,265
Total Expenditures 101,074,229 12,113,748 173 113,188,150
Excess (Deficiency) of Revenues Over (Under) Expenditures 13,176,055 1,642,555 3,041 14,821,651
OTHER FINANCING SOURCES (USES)Transfers In 12,596,208 5,873,726 - 18,469,934 Transfers Out (28,291,168) (1,303,365) - (29,594,533) Sale of Capital Assets 340,048 - - 340,048 Capital Lease 2,295,600 - - 2,295,600
Total Other Financing Sources (Uses) (13,059,312) 4,570,361 - (8,488,951)
Net Change in Fund Balances 116,743 6,212,916 3,041 6,332,700
FUND BALANCES, January 1, as restated (Note III-C) 33,075,424 15,106,054 81,477 48,262,955
FUND BALANCES, December 31 33,192,167$ 21,318,970$ 84,518$ 54,595,655$
149

City of Saint Paul, Minnesota Statement 15COMBINING BALANCE SHEET (Page 1 of 4)NONMAJOR SPECIAL REVENUE FUNDSDecember 31, 2014
GeneralGovernment Fire
City Special ResponsiveGrants Projects Services
ASSETS Cash and Investments with Treasurer -$ 160,986$ 664,247$ Cash and Investments with Trustees - - 995,600 Imprest Funds 26,000 50 - Receivables Accounts (net of allowance for estimated uncollectible) 101,737 406,489 11,429 Assessments - - - Notes and Loans - - - Accrued Interest 4,458 - - Due from Other Funds 1,104 - 36,020 Due from Other Governmental Units 3,206,521 223,962 2,914 Land Held for Resale - - -
TOTAL ASSETS 3,339,820$ 791,487$ 1,710,210$
LIABILITIES, DEFERRED INFLOWS OFRESOURCES AND FUND BALANCES Liabilities Accrued Salaries Payable 97,391$ 20,118$ 18,174$ Accounts Payable 734,188 552,622 6,447 Due to Other Funds 818,826 - - Due to Other Governmental Units 39,644 1,586 354,092 Advance from Other Funds - - - Unearned Revenue 397,987 31,075 -
Total Liabilities 2,088,036 605,401 378,713
Deferred Inflows of Resources
Unavailable Revenue 1,596,408 - 4,299
Fund Balance Restricted 332,835 82,104 894,226 Committed 276,106 97,730 76,571 Assigned - 6,252 356,401 Unassigned (953,565) - -
Total Fund Balances (344,624) 186,086 1,327,198
TOTAL LIABILITIES, DEFERRED INFLOWS OFRESOURCES AND FUND BALANCES 3,339,820$ 791,487$ 1,710,210$
150
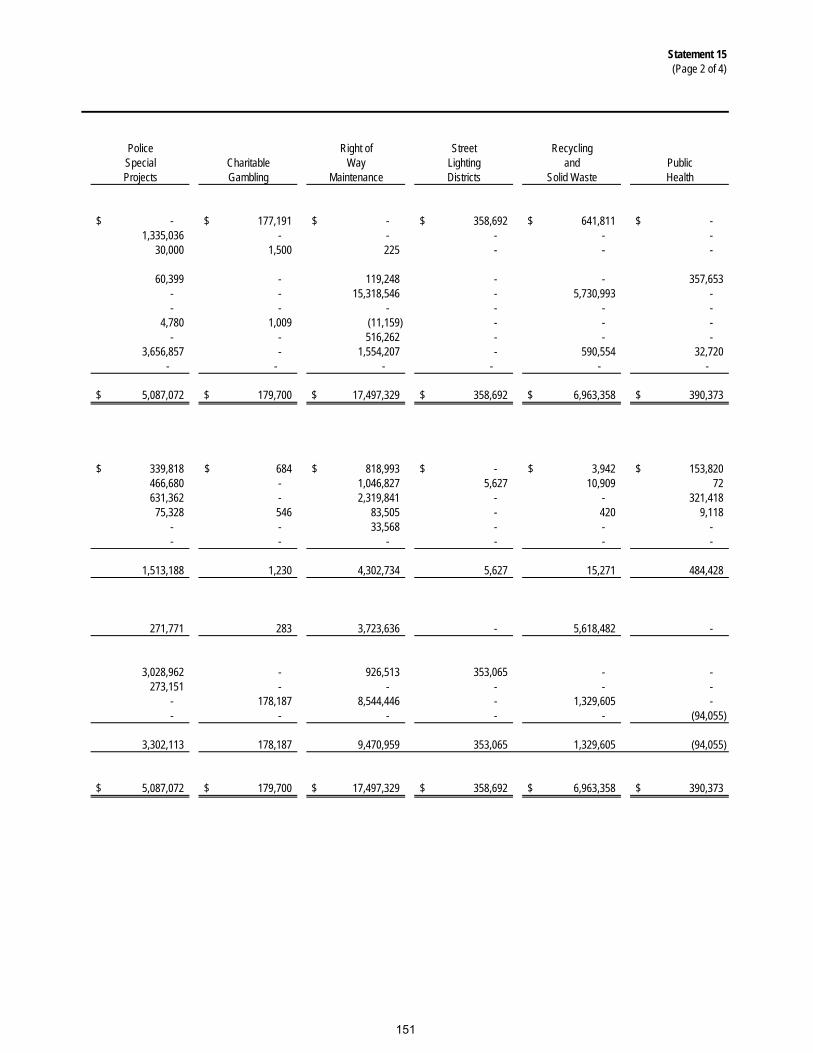
Statement 15(Page 2 of 4)
Police Right of Street RecyclingSpecial Charitable Way Lighting and PublicProjects Gambling Maintenance Districts Solid Waste Health
-$ 177,191$ -$ 358,692$ 641,811$ -$ 1,335,036 - - - - -
30,000 1,500 225 - - -
60,399 - 119,248 - - 357,653 - - 15,318,546 - 5,730,993 - - - - - - -
4,780 1,009 (11,159) - - - - - 516,262 - - -
3,656,857 - 1,554,207 - 590,554 32,720 - - - - - -
5,087,072$ 179,700$ 17,497,329$ 358,692$ 6,963,358$ 390,373$
339,818$ 684$ 818,993$ -$ 3,942$ 153,820$ 466,680 - 1,046,827 5,627 10,909 72 631,362 - 2,319,841 - - 321,418
75,328 546 83,505 - 420 9,118 - - 33,568 - - - - - - - - -
1,513,188 1,230 4,302,734 5,627 15,271 484,428
271,771 283 3,723,636 - 5,618,482 -
3,028,962 - 926,513 353,065 - - 273,151 - - - - -
- 178,187 8,544,446 - 1,329,605 - - - - - - (94,055)
3,302,113 178,187 9,470,959 353,065 1,329,605 (94,055)
5,087,072$ 179,700$ 17,497,329$ 358,692$ 6,963,358$ 390,373$
151

City of Saint Paul, Minnesota Statement 15COMBINING BALANCE SHEET (Page 3 of 4)NONMAJOR SPECIAL REVENUE FUNDSDecember 31, 2014
Parks andRecreation
Special Como ParklandProjects Campus Replacement
ASSETS Cash and Investments with Treasurer 2,211,939$ -$ 749,349$ Cash and Investments with Trustees - - - Imprest Funds 320 300 - Receivables Accounts (net of allowance for estimated uncollectible) 223,443 1,761 - Assessments - - - Notes and Loans - - - Accrued Interest 1,488 - 2,958 Due from Other Funds 1,162 - - Due from Other Governmental Units - 90 - Land Held for Resale - - -
TOTAL ASSETS 2,438,352$ 2,151$ 752,307$
LIABILITIES, DEFERRED INFLOWS OFRESOURCES AND FUND BALANCES Liabilities Accrued Salaries Payable 63,345$ 133,356$ -$ Accounts Payable 86,497 27,621 - Due to Other Funds - 3,072,637 - Due to Other Governmental Units 3,712 8,753 - Advance from Other Funds - - - Unearned Revenue - - -
Total Liabilities 153,554 3,242,367 -
Deferred Inflows of Resources
Unavailable Revenue 417 - 830
Fund Balance Restricted 1,009,779 - 751,477 Committed 1,536,348 - - Assigned - - - Unassigned (261,746) (3,240,216) -
Total Fund Balances 2,284,381 (3,240,216) 751,477
TOTAL LIABILITIES, DEFERRED INFLOWS OFRESOURCES AND FUND BALANCES 2,438,352$ 2,151$ 752,307$
152

Statement 15(Page 4 of 4)
Public TotalLibrary City City NonmajorSpecial HUD Sales HRA SpecialProjects Grants Tax Grants Revenue Funds
1,976,869$ 1,302,451$ 13,184,541$ 236,720$ 21,664,796$ 2,877 - - - 2,333,513
- - - - 58,395
- - - - 1,282,159 - - - - 21,049,539 - 4,211,522 3,679,006 - 7,890,528
1,623 35,739 88,615 - 129,511 - - - - 554,548 - 1,552,036 2,544,003 - 13,363,864 - 5,393,593 - - 5,393,593
1,981,369$ 12,495,341$ 19,496,165$ 236,720$ 73,720,446$
2,435$ -$ -$ -$ 1,652,076$ 127,163 424,365 704,007 - 4,193,025
- 26,196 - - 7,190,280 206 1,330 - 21,000 599,240 - 1,750,000 - - 1,783,568 - 9,689,609 - 37,095 10,155,766
129,804 11,891,500 704,007 58,095 25,573,955
455 - 3,737,743 - 14,954,324
- 603,841 1,888,857 178,625 10,050,284 274,984 - 9,607,674 - 12,142,564
1,576,126 - 3,557,884 - 15,548,901 - - - - (4,549,582)
1,851,110 603,841 15,054,415 178,625 33,192,167
1,981,369$ 12,495,341$ 19,496,165$ 236,720$ 73,720,446$
153
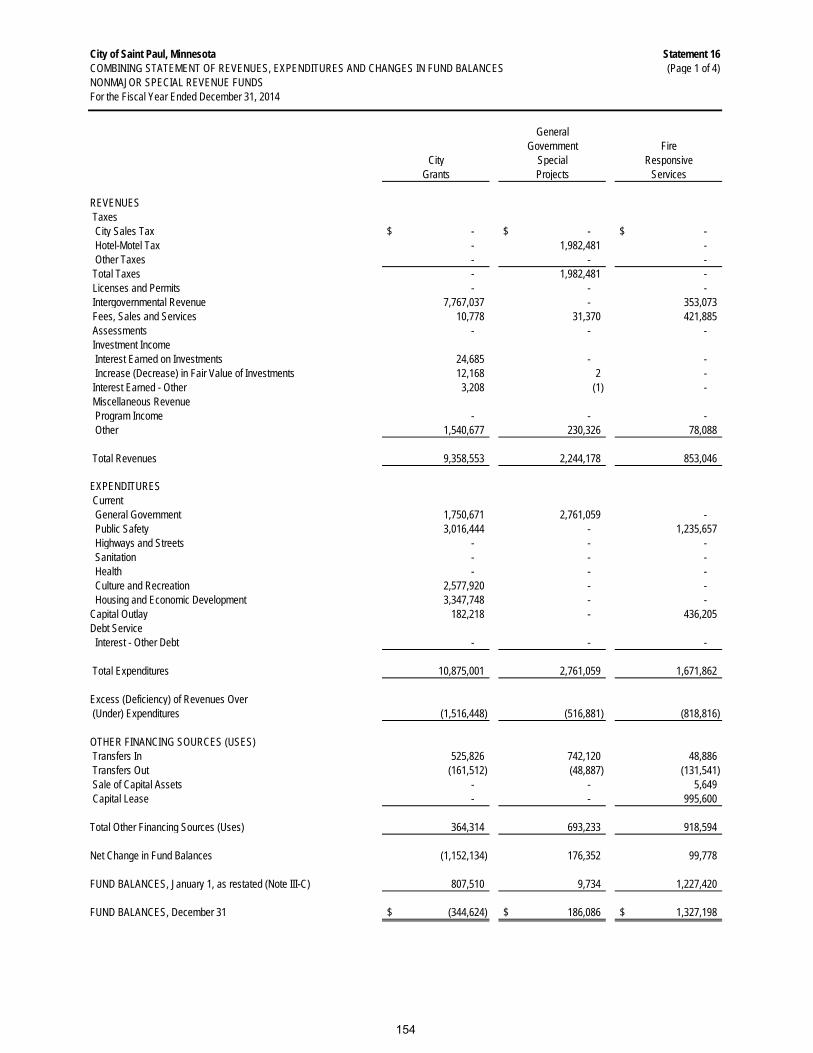
City of Saint Paul, Minnesota Statement 16COMBINING STATEMENT OF REVENUES, EXPENDITURES AND CHANGES IN FUND BALANCES (Page 1 of 4)NONMAJOR SPECIAL REVENUE FUNDS
GeneralGovernment Fire
City Special ResponsiveGrants Projects Services
REVENUES Taxes City Sales Tax -$ -$ -$ Hotel-Motel Tax - 1,982,481 - Other Taxes - - - Total Taxes - 1,982,481 - Licenses and Permits - - - Intergovernmental Revenue 7,767,037 - 353,073 Fees, Sales and Services 10,778 31,370 421,885 Assessments - - - Investment Income Interest Earned on Investments 24,685 - - Increase (Decrease) in Fair Value of Investments 12,168 2 - Interest Earned - Other 3,208 (1) - Miscellaneous Revenue Program Income - - - Other 1,540,677 230,326 78,088
Total Revenues 9,358,553 2,244,178 853,046
EXPENDITURES Current General Government 1,750,671 2,761,059 - Public Safety 3,016,444 - 1,235,657 Highways and Streets - - - Sanitation - - - Health - - - Culture and Recreation 2,577,920 - - Housing and Economic Development 3,347,748 - - Capital Outlay 182,218 - 436,205 Debt Service Interest - Other Debt - - -
Total Expenditures 10,875,001 2,761,059 1,671,862
Excess (Deficiency) of Revenues Over (Under) Expenditures (1,516,448) (516,881) (818,816)
OTHER FINANCING SOURCES (USES) Transfers In 525,826 742,120 48,886 Transfers Out (161,512) (48,887) (131,541) Sale of Capital Assets - - 5,649 Capital Lease - - 995,600
Total Other Financing Sources (Uses) 364,314 693,233 918,594
Net Change in Fund Balances (1,152,134) 176,352 99,778
FUND BALANCES, January 1, as restated (Note III-C) 807,510 9,734 1,227,420
FUND BALANCES, December 31 (344,624)$ 186,086$ 1,327,198$
For the Fiscal Year Ended December 31, 2014
154

Statement 16(Page 2 of 4)
Police Right of Street RecyclingSpecial Charitable Way Lighting and PublicProjects Gambling Maintenance Districts Solid Waste Health
-$ -$ -$ -$ -$ -$ - - - - - - - 145,748 - - - - - 145,748 - - - -
218,140 - - - - - 185,684 - 5,546,041 - 590,554 -
10,213,759 - 7,238,806 - - 3,207,917 - - 29,281,013 336,483 5,320,209 -
28,283 5,580 7,363 - - - 24,823 3,028 (16,092) - - -
3,439 - (8,028) - - -
- - - - - - - - (21,961) - - -
10,674,128 154,356 42,027,142 336,483 5,910,763 3,207,917
- 163,264 - - - - 9,063,066 - - - - -
- - 36,981,396 261,436 - - - - - - 5,438,602 - - - - - - 3,355,469 - - 4,986,330 - - - - - - - - -
1,113,698 - 244,335 - - -
- - 124,180 - - -
10,176,764 163,264 42,336,241 261,436 5,438,602 3,355,469
497,364 (8,908) (309,099) 75,047 472,161 (147,552)
658,688 - 1,156,656 - - - (320,804) (1,690) (2,317,844) - (275,000) -
- - 111 - - - 1,300,000 - - - - -
1,637,884 (1,690) (1,161,077) - (275,000) -
2,135,248 (10,598) (1,470,176) 75,047 197,161 (147,552)
1,166,865 188,785 10,941,135 278,018 1,132,444 53,497
3,302,113$ 178,187$ 9,470,959$ 353,065$ 1,329,605$ (94,055)$
155

City of Saint Paul, Minnesota Statement 16COMBINING STATEMENT OF REVENUES, EXPENDITURES AND CHANGES IN FUND BALANCES (Page 3 of 4)NONMAJOR SPECIAL REVENUE FUNDSFor the Fiscal Year Ended December 31, 2014
Parks andRecreation
Special Como ParklandProjects Campus Replacement
REVENUES Taxes City Sales Tax -$ -$ -$ Hotel-Motel Tax - - - Other Taxes - - - Total Taxes - - - Licenses and Permits - - 138,032 Intergovernmental Revenue 1,574,670 - - Fees, Sales and Services 2,967,034 1,188,002 - Assessments - - - Investment Income Interest Earned on Investments 17,170 - 14,561 Increase (Decrease) in Fair Value of Investments 10,468 - 6,674 Interest Earned - Other (1,733) - 1,228 Miscellaneous Revenue Program Income - - - Other 144,978 1,958,219 2,000
Total Revenues 4,712,587 3,146,221 162,495
EXPENDITURES Current General Government - - - Public Safety - - - Highways and Streets - - - Sanitation - - - Health - - - Culture and Recreation 3,893,847 3,649,372 1,355 Housing and Economic Development - - - Capital Outlay - 750 - Debt Service Interest - Other Debt - - -
Total Expenditures 3,893,847 3,650,122 1,355
Excess (Deficiency) of Revenues Over (Under) Expenditures 818,740 (503,901) 161,140
OTHER FINANCING SOURCES (USES) Transfers In 156,546 438,489 - Transfers Out (874,365) (106,832) - Sale of Capital Assets - - - Capital Lease - - -
Total Other Financing Sources (Uses) (717,819) 331,657 -
Net Change in Fund Balances 100,921 (172,244) 161,140
FUND BALANCES, January 1, as restated (Note III-C) 2,183,460 (3,067,972) 590,337
FUND BALANCES, December 31 2,284,381$ (3,240,216)$ 751,477$
156

Statement 16(Page 4 of 4)
Public TotalLibrary City City NonmajorSpecial HUD Sales HRA SpecialProjects Grants Tax Grants Revenue Funds
-$ -$ 18,314,992$ -$ 18,314,992$ - - - - 1,982,481 - - - - 145,748 - - 18,314,992 - 20,443,221 - - - - 356,172
457,901 8,226,257 - 153,432 24,854,649 351,200 2,491,655 277,424 - 28,399,830
- - - - 34,937,705
7,575 55,701 217,162 - 378,080 7,416 - 191,411 - 239,898 1,168 - 158,523 - 157,804
- 61,501 - - 61,501 482,319 506 6,272 - 4,421,424
1,307,579 10,835,620 19,165,784 153,432 114,250,284
- - - - 4,674,994 - - - - 13,315,167 - - - - 37,242,832 - - - - 5,438,602 - - - - 3,355,469
1,612,871 - - - 16,721,695 - 9,472,006 4,892,025 437,105 18,148,884
75,200 - - - 2,052,406
- - - - 124,180
1,688,071 9,472,006 4,892,025 437,105 101,074,229
(380,492) 1,363,614 14,273,759 (283,673) 13,176,055
155,749 102,059 8,611,189 - 12,596,208 - (821,082) (23,231,611) - (28,291,168)
334,288 - - - 340,048 - - - - 2,295,600
490,037 (719,023) (14,620,422) - (13,059,312)
109,545 644,591 (346,663) (283,673) 116,743
1,741,565 (40,750) 15,401,078 462,298 33,075,424
1,851,110$ 603,841$ 15,054,415$ 178,625$ 33,192,167$
157
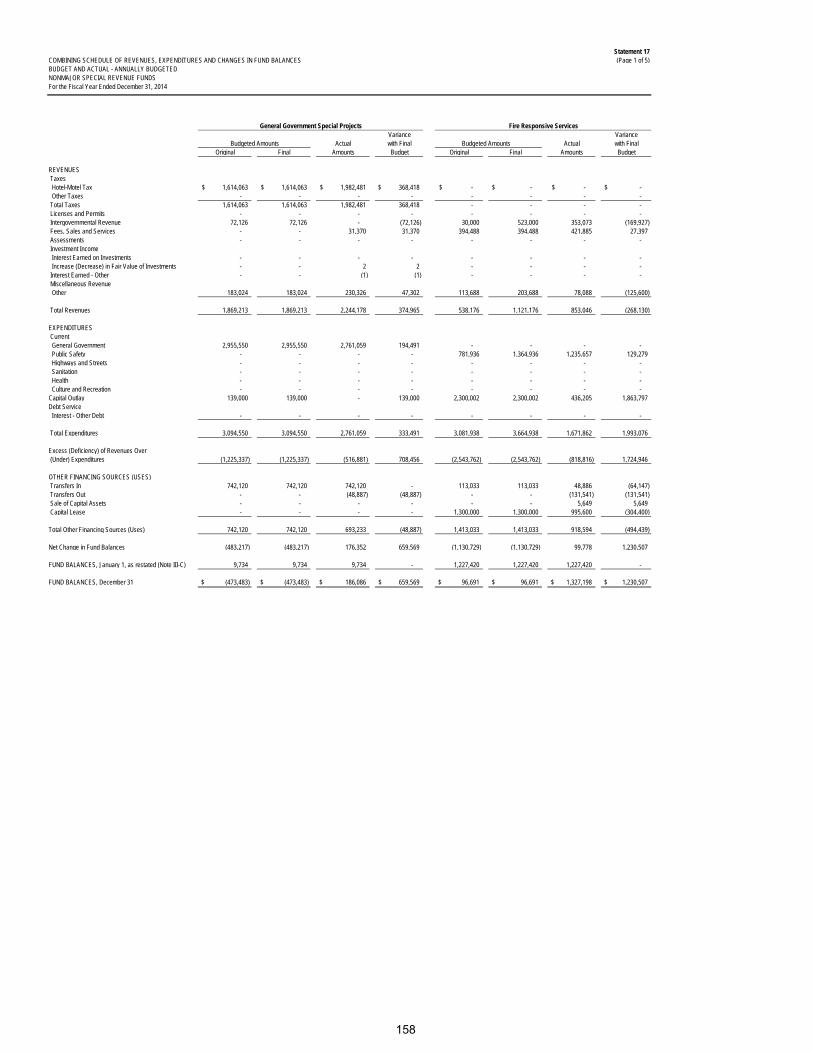
Statement 17(Page 1 of 5)
BUDGET AND ACTUAL - ANNUALLY BUDGETEDNONMAJOR SPECIAL REVENUE FUNDSFor the Fiscal Year Ended December 31, 2014
Variance VarianceBudgeted Amounts Actual with Final Budgeted Amounts Actual with Final
Original Final Amounts Budget Original Final Amounts Budget
REVENUES Taxes Hotel-Motel Tax 1,614,063$ 1,614,063$ 1,982,481$ 368,418$ -$ -$ -$ -$ Other Taxes - - - - - - - - Total Taxes 1,614,063 1,614,063 1,982,481 368,418 - - - - Licenses and Permits - - - - - - - - Intergovernmental Revenue 72,126 72,126 - (72,126) 30,000 523,000 353,073 (169,927) Fees, Sales and Services - - 31,370 31,370 394,488 394,488 421,885 27,397 Assessments - - - - - - - - Investment Income Interest Earned on Investments - - - - - - - - Increase (Decrease) in Fair Value of Investments - - 2 2 - - - - Interest Earned - Other - - (1) (1) - - - - Miscellaneous Revenue Other 183,024 183,024 230,326 47,302 113,688 203,688 78,088 (125,600)
Total Revenues 1,869,213 1,869,213 2,244,178 374,965 538,176 1,121,176 853,046 (268,130)
EXPENDITURES Current General Government 2,955,550 2,955,550 2,761,059 194,491 - - - - Public Safety - - - - 781,936 1,364,936 1,235,657 129,279 Highways and Streets - - - - - - - - Sanitation - - - - - - - - Health - - - - - - - - Culture and Recreation - - - - - - - - Capital Outlay 139,000 139,000 - 139,000 2,300,002 2,300,002 436,205 1,863,797 Debt Service Interest - Other Debt - - - - - - - -
Total Expenditures 3,094,550 3,094,550 2,761,059 333,491 3,081,938 3,664,938 1,671,862 1,993,076
Excess (Deficiency) of Revenues Over (Under) Expenditures (1,225,337) (1,225,337) (516,881) 708,456 (2,543,762) (2,543,762) (818,816) 1,724,946
OTHER FINANCING SOURCES (USES) Transfers In 742,120 742,120 742,120 - 113,033 113,033 48,886 (64,147) Transfers Out - - (48,887) (48,887) - - (131,541) (131,541) Sale of Capital Assets - - - - - - 5,649 5,649 Capital Lease - - - - 1,300,000 1,300,000 995,600 (304,400)
Total Other Financing Sources (Uses) 742,120 742,120 693,233 (48,887) 1,413,033 1,413,033 918,594 (494,439)
Net Change in Fund Balances (483,217) (483,217) 176,352 659,569 (1,130,729) (1,130,729) 99,778 1,230,507
FUND BALANCES, January 1, as restated (Note III-C) 9,734 9,734 9,734 - 1,227,420 1,227,420 1,227,420 -
FUND BALANCES, December 31 (473,483)$ (473,483)$ 186,086$ 659,569$ 96,691$ 96,691$ 1,327,198$ 1,230,507$
COMBINING SCHEDULE OF REVENUES, EXPENDITURES AND CHANGES IN FUND BALANCES
General Government Special Projects Fire Responsive Services
158

Statement 17(Page 2 of 5)
Variance Variance VarianceBudgeted Amounts Actual with Final Budgeted Amounts Actual with Final Budgeted Amounts Actual with Final
Original Final Amounts Budget Original Final Amounts Budget Original Final Amounts Budget
-$ -$ -$ -$ -$ -$ -$ -$ -$ -$ -$ -$ - - - - 135,113 135,113 145,748 10,635 - - - - - - - - 135,113 135,113 145,748 10,635 - - - -
180,000 180,000 218,140 38,140 - - - - - - - - 197,000 197,000 185,684 (11,316) - - - - 5,640,203 5,640,203 5,546,041 (94,162)
8,322,890 8,322,890 10,213,759 1,890,869 - - - - 6,471,449 6,471,449 7,238,806 767,357 - - - - - - - - 28,759,743 28,759,743 29,281,013 521,270
10,000 10,000 28,283 18,283 - - 5,580 5,580 - - 7,363 7,363 - - 24,823 24,823 - - 3,028 3,028 - - (16,092) (16,092) - - 3,439 3,439 - - - - - - (8,028) (8,028)
373,901 393,401 - (393,401) - - - - 180,000 180,000 (21,961) (201,961)
9,083,791 9,103,291 10,674,128 1,570,837 135,113 135,113 154,356 19,243 41,051,395 41,051,395 42,027,142 975,747
- - - - 128,531 128,531 163,264 (34,733) - - - - 9,793,766 9,853,266 9,063,066 790,200 - - - - - - - -
- - - - - - - - 35,205,310 37,087,484 36,981,396 106,088 - - - - - - - - - - - - - - - - - - - - - - - - - - - - - - - - 4,707,170 4,707,170 4,986,330 (279,160)
1,761,808 1,721,808 1,113,698 608,110 - - - - 415,000 414,617 244,335 170,282
- - - - - - - - 15,116 82,116 124,180 (42,064)
11,555,574 11,575,074 10,176,764 1,398,310 128,531 128,531 163,264 (34,733) 40,342,596 42,291,387 42,336,241 (44,854)
(2,471,783) (2,471,783) 497,364 2,969,147 6,582 6,582 (8,908) (15,490) 708,799 (1,239,992) (309,099) 930,893
650,208 650,208 658,688 8,480 - - - - 1,438,830 1,438,830 1,156,656 (282,174) (320,804) (320,804) (320,804) - (11,582) (11,582) (1,690) (9,892) (2,449,220) (2,449,220) (2,317,844) 131,376
- - - - - - - - - - 111 111 1,300,000 1,300,000 1,300,000 - - - - - - - - -
1,629,404 1,629,404 1,637,884 8,480 (11,582) (11,582) (1,690) (9,892) (1,010,390) (1,010,390) (1,161,077) (150,687)
(842,379) (842,379) 2,135,248 2,977,627 (5,000) (5,000) (10,598) (5,598) (301,591) (2,250,382) (1,470,176) 780,206
1,166,865 1,166,865 1,166,865 - 188,785 188,785 188,785 - 10,941,135 10,941,135 10,941,135 -
324,486$ 324,486$ 3,302,113$ 2,977,627$ 183,785$ 183,785$ 178,187$ (5,598)$ 10,639,544$ 8,690,753$ 9,470,959$ 780,206$
Police Special Projects Charitable Gambling Right of Way Maintenance
159

Statement 17(Page 3 of 5)
BUDGET AND ACTUAL - ANNUALLY BUDGETEDNONMAJOR SPECIAL REVENUE FUNDSFor the Fiscal Year Ended December 31, 2014
Variance VarianceBudgeted Amounts Actual with Final Budgeted Amounts Actual with Final
Original Final Amounts Budget Original Final Amounts Budget
REVENUES Taxes Hotel-Motel Tax -$ -$ -$ -$ -$ -$ -$ -$ Other Taxes - - - - - - - - Total Taxes - - - - - - - - Licenses and Permits - - - - - - - - Intergovernmental Revenue - - - - 589,209 589,209 590,554 1,345 Fees, Sales and Services - - - - - - - - Assessments 356,788 356,788 336,483 (20,305) 5,305,531 5,305,531 5,320,209 14,678 Investment Income Interest Earned on Investments - - - - 6,100 6,100 - (6,100) Increase (Decrease) in Fair Value of Investments - - - - - - - - Interest Earned - Other - - - - - - - - Miscellaneous Revenue Other - - - - - - - -
Total Revenues 356,788$ 356,788 336,483 (20,305) 5,900,840 5,900,840 5,910,763 9,923
EXPENDITURES Current General Government -$ - - - - - - - Public Safety - - - - - - - - Highways and Streets 356,788 356,788 261,436 95,352 - - - - Sanitation - - - 5,625,785 5,625,785 5,438,602 187,183 Health - - - - - - - - Culture and Recreation - - - - - - - - Capital Outlay - - - - - - - - Debt Service Interest - Other Debt - - - - - - - -
Total Expenditures 356,788$ 356,788 261,436 95,352 5,625,785 5,625,785 5,438,602 187,183
Excess (Deficiency) of Revenues Over (Under) Expenditures - - 75,047 75,047 275,055 275,055 472,161 197,106
OTHER FINANCING SOURCES (USES) Transfers In -$ - - - - - - - Transfers Out - - - - (275,000) (275,000) (275,000) - Sale of Capital Assets - - - - - - - - Capital Lease - - - - - - - -
Total Other Financing Sources (Uses) -$ - - - (275,000) (275,000) (275,000) -
Net Change in Fund Balances - - 75,047 75,047 55 55 197,161 197,106
FUND BALANCES, January 1-restated 278,018$ 278,018 278,018 - 1,132,444 1,132,444 1,132,444 -
FUND BALANCES, December 31 278,018$ 278,018$ 353,065$ 75,047$ 1,132,499$ 1,132,499$ 1,329,605$ 197,106$
COMBINING SCHEDULE OF REVENUES, EXPENDITURES AND CHANGES IN FUND BALANCES
Street Lighting Districts Recycling and Solid Waste
160
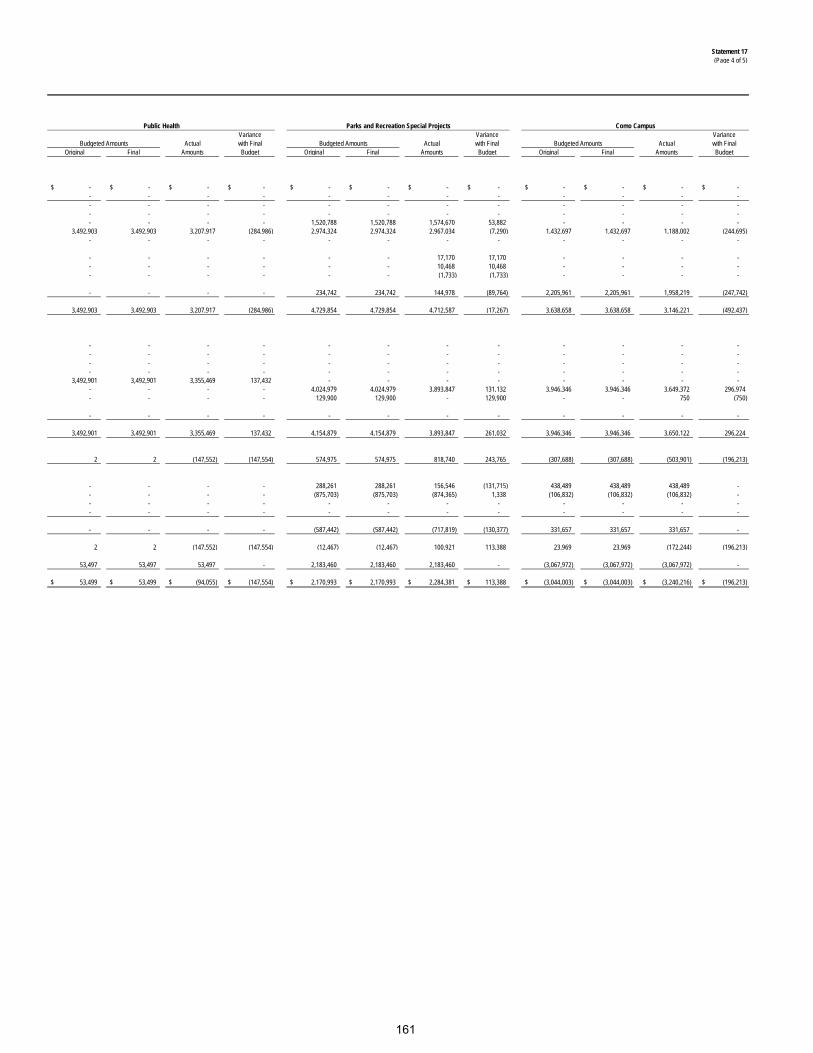
Statement 17(Page 4 of 5)
Variance Variance VarianceBudgeted Amounts Actual with Final Budgeted Amounts Actual with Final Budgeted Amounts Actual with Final
Original Final Amounts Budget Original Final Amounts Budget Original Final Amounts Budget
-$ -$ -$ -$ -$ -$ -$ -$ -$ -$ -$ -$ - - - - - - - - - - - - - - - - - - - - - - - - - - - - - - - - - - - - - - - - 1,520,788 1,520,788 1,574,670 53,882 - - - -
3,492,903 3,492,903 3,207,917 (284,986) 2,974,324 2,974,324 2,967,034 (7,290) 1,432,697 1,432,697 1,188,002 (244,695) - - - - - - - - - - - -
- - - - - - 17,170 17,170 - - - - - - - - - - 10,468 10,468 - - - - - - - - - - (1,733) (1,733) - - - -
- - - - 234,742 234,742 144,978 (89,764) 2,205,961 2,205,961 1,958,219 (247,742)
3,492,903 3,492,903 3,207,917 (284,986) 4,729,854 4,729,854 4,712,587 (17,267) 3,638,658 3,638,658 3,146,221 (492,437)
- - - - - - - - - - - - - - - - - - - - - - - - - - - - - - - - - - - - - - - - - - - - - - - -
3,492,901 3,492,901 3,355,469 137,432 - - - - - - - - - - - - 4,024,979 4,024,979 3,893,847 131,132 3,946,346 3,946,346 3,649,372 296,974 - - - - 129,900 129,900 - 129,900 - - 750 (750)
- - - - - - - - - - - -
3,492,901 3,492,901 3,355,469 137,432 4,154,879 4,154,879 3,893,847 261,032 3,946,346 3,946,346 3,650,122 296,224
2 2 (147,552) (147,554) 574,975 574,975 818,740 243,765 (307,688) (307,688) (503,901) (196,213)
- - - - 288,261 288,261 156,546 (131,715) 438,489 438,489 438,489 - - - - - (875,703) (875,703) (874,365) 1,338 (106,832) (106,832) (106,832) - - - - - - - - - - - - - - - - - - - - - - - - -
- - - - (587,442) (587,442) (717,819) (130,377) 331,657 331,657 331,657 -
2 2 (147,552) (147,554) (12,467) (12,467) 100,921 113,388 23,969 23,969 (172,244) (196,213)
53,497 53,497 53,497 - 2,183,460 2,183,460 2,183,460 - (3,067,972) (3,067,972) (3,067,972) -
53,499$ 53,499$ (94,055)$ (147,554)$ 2,170,993$ 2,170,993$ 2,284,381$ 113,388$ (3,044,003)$ (3,044,003)$ (3,240,216)$ (196,213)$
Public Health Parks and Recreation Special Projects Como Campus
161
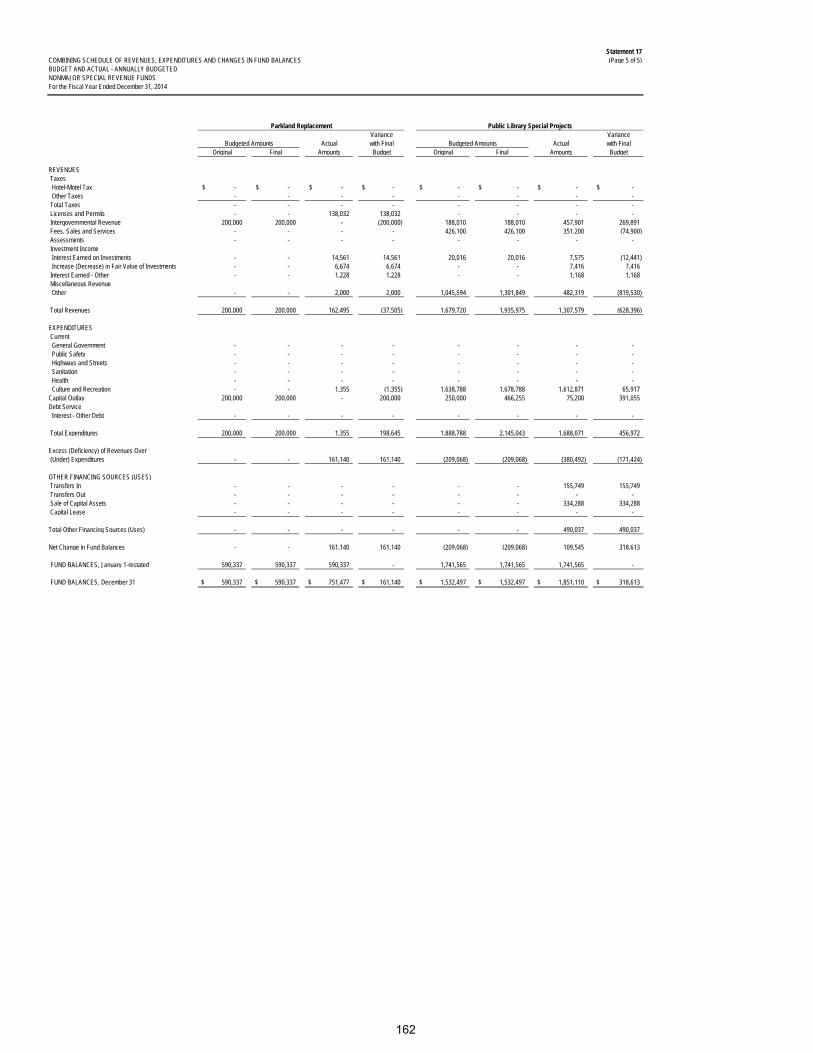
Statement 17(Page 5 of 5)
BUDGET AND ACTUAL - ANNUALLY BUDGETEDNONMAJOR SPECIAL REVENUE FUNDSFor the Fiscal Year Ended December 31, 2014
Variance VarianceBudgeted Amounts Actual with Final Budgeted Amounts Actual with Final
Original Final Amounts Budget Original Final Amounts Budget
REVENUES Taxes Hotel-Motel Tax -$ -$ -$ -$ -$ -$ -$ -$ Other Taxes - - - - - - - - Total Taxes - - - - - - - - Licenses and Permits - - 138,032 138,032 - - - - Intergovernmental Revenue 200,000 200,000 - (200,000) 188,010 188,010 457,901 269,891 Fees, Sales and Services - - - - 426,100 426,100 351,200 (74,900) Assessments - - - - - - - - Investment Income Interest Earned on Investments - - 14,561 14,561 20,016 20,016 7,575 (12,441) Increase (Decrease) in Fair Value of Investments - - 6,674 6,674 - - 7,416 7,416 Interest Earned - Other - - 1,228 1,228 - - 1,168 1,168 Miscellaneous Revenue Other - - 2,000 2,000 1,045,594 1,301,849 482,319 (819,530)
Total Revenues 200,000 200,000 162,495 (37,505) 1,679,720 1,935,975 1,307,579 (628,396)
EXPENDITURES Current General Government - - - - - - - - Public Safety - - - - - - - - Highways and Streets - - - - - - - - Sanitation - - - - - - - - Health - - - - - - - - Culture and Recreation - - 1,355 (1,355) 1,638,788 1,678,788 1,612,871 65,917 Capital Outlay 200,000 200,000 - 200,000 250,000 466,255 75,200 391,055 Debt Service Interest - Other Debt - - - - - - - -
Total Expenditures 200,000 200,000 1,355 198,645 1,888,788 2,145,043 1,688,071 456,972
Excess (Deficiency) of Revenues Over (Under) Expenditures - - 161,140 161,140 (209,068) (209,068) (380,492) (171,424)
OTHER FINANCING SOURCES (USES) Transfers In - - - - - - 155,749 155,749 Transfers Out - - - - - - - - Sale of Capital Assets - - - - - - 334,288 334,288 Capital Lease - - - - - - - -
Total Other Financing Sources (Uses) - - - - - - 490,037 490,037
Net Change in Fund Balances - - 161,140 161,140 (209,068) (209,068) 109,545 318,613
FUND BALANCES, January 1-restated 590,337 590,337 590,337 - 1,741,565 1,741,565 1,741,565 -
FUND BALANCES, December 31 590,337$ 590,337$ 751,477$ 161,140$ 1,532,497$ 1,532,497$ 1,851,110$ 318,613$
Public Library Special Projects
COMBINING SCHEDULE OF REVENUES, EXPENDITURES AND CHANGES IN FUND BALANCES
Parkland Replacement
162
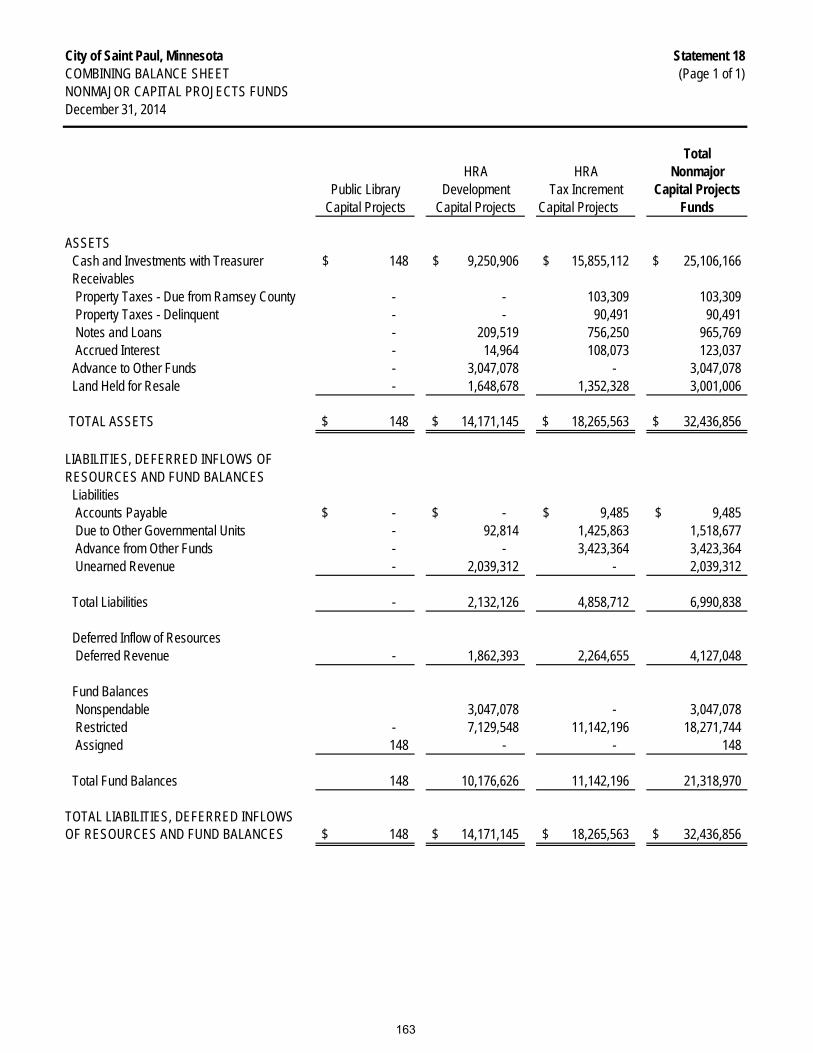
City of Saint Paul, Minnesota Statement 18COMBINING BALANCE SHEET (Page 1 of 1)NONMAJOR CAPITAL PROJECTS FUNDSDecember 31, 2014
TotalHRA HRA Nonmajor
Public Library Development Tax Increment Capital ProjectsCapital Projects Capital Projects Capital Projects Funds
ASSETS Cash and Investments with Treasurer 148$ 9,250,906$ 15,855,112$ 25,106,166$ Receivables Property Taxes - Due from Ramsey County - - 103,309 103,309 Property Taxes - Delinquent - - 90,491 90,491 Notes and Loans - 209,519 756,250 965,769 Accrued Interest - 14,964 108,073 123,037 Advance to Other Funds - 3,047,078 - 3,047,078 Land Held for Resale - 1,648,678 1,352,328 3,001,006
TOTAL ASSETS 148$ 14,171,145$ 18,265,563$ 32,436,856$
LIABILITIES, DEFERRED INFLOWS OFRESOURCES AND FUND BALANCES Liabilities Accounts Payable -$ -$ 9,485$ 9,485$ Due to Other Governmental Units - 92,814 1,425,863 1,518,677 Advance from Other Funds - - 3,423,364 3,423,364 Unearned Revenue - 2,039,312 - 2,039,312
Total Liabilities - 2,132,126 4,858,712 6,990,838
Deferred Inflow of Resources Deferred Revenue - 1,862,393 2,264,655 4,127,048
Fund Balances Nonspendable 3,047,078 - 3,047,078 Restricted - 7,129,548 11,142,196 18,271,744 Assigned 148 - - 148
Total Fund Balances 148 10,176,626 11,142,196 21,318,970
TOTAL LIABILITIES, DEFERRED INFLOWS OF RESOURCES AND FUND BALANCES 148$ 14,171,145$ 18,265,563$ 32,436,856$
163
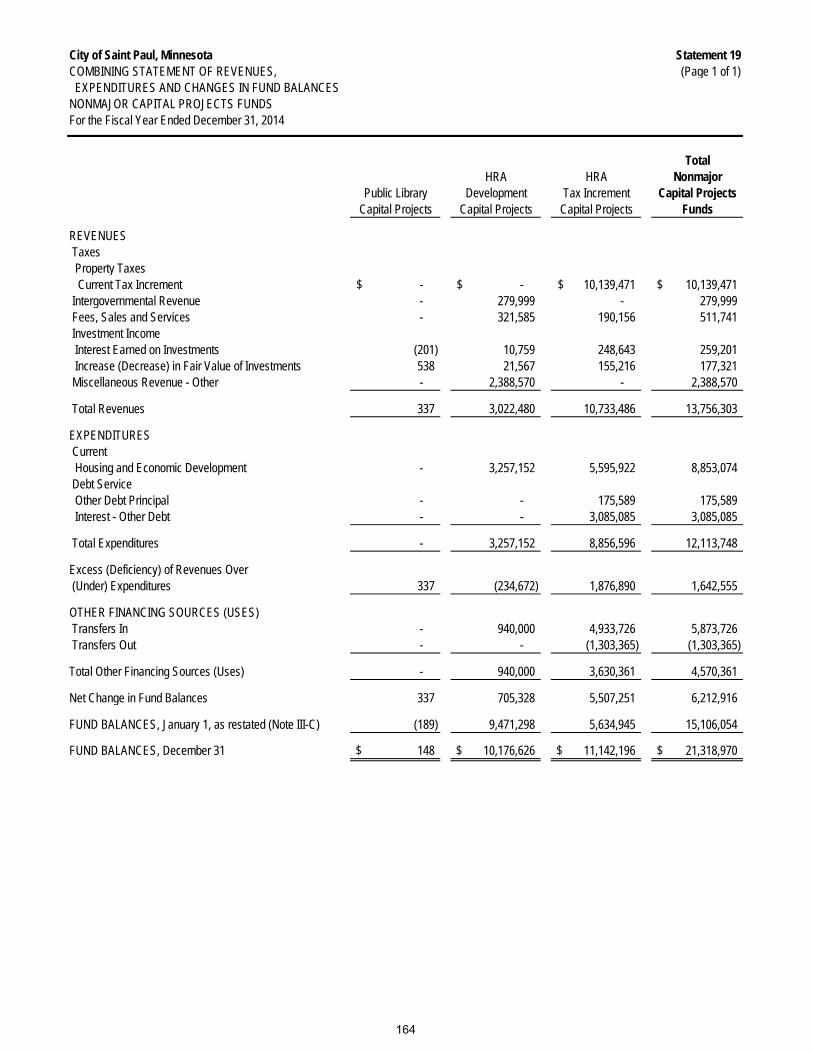
City of Saint Paul, Minnesota Statement 19COMBINING STATEMENT OF REVENUES, (Page 1 of 1) EXPENDITURES AND CHANGES IN FUND BALANCESNONMAJOR CAPITAL PROJECTS FUNDSFor the Fiscal Year Ended December 31, 2014
TotalHRA HRA Nonmajor
Public Library Development Tax Increment Capital ProjectsCapital Projects Capital Projects Capital Projects Funds
REVENUES Taxes Property Taxes Current Tax Increment -$ -$ 10,139,471$ 10,139,471$ Intergovernmental Revenue - 279,999 - 279,999 Fees, Sales and Services - 321,585 190,156 511,741 Investment Income Interest Earned on Investments (201) 10,759 248,643 259,201 Increase (Decrease) in Fair Value of Investments 538 21,567 155,216 177,321 Miscellaneous Revenue - Other - 2,388,570 - 2,388,570
Total Revenues 337 3,022,480 10,733,486 13,756,303
EXPENDITURES Current Housing and Economic Development - 3,257,152 5,595,922 8,853,074 Debt Service Other Debt Principal - - 175,589 175,589 Interest - Other Debt - - 3,085,085 3,085,085
Total Expenditures - 3,257,152 8,856,596 12,113,748
Excess (Deficiency) of Revenues Over (Under) Expenditures 337 (234,672) 1,876,890 1,642,555
OTHER FINANCING SOURCES (USES) Transfers In - 940,000 4,933,726 5,873,726 Transfers Out - - (1,303,365) (1,303,365)
Total Other Financing Sources (Uses) - 940,000 3,630,361 4,570,361
Net Change in Fund Balances 337 705,328 5,507,251 6,212,916
FUND BALANCES, January 1, as restated (Note III-C) (189) 9,471,298 5,634,945 15,106,054
FUND BALANCES, December 31 148$ 10,176,626$ 11,142,196$ 21,318,970$
164
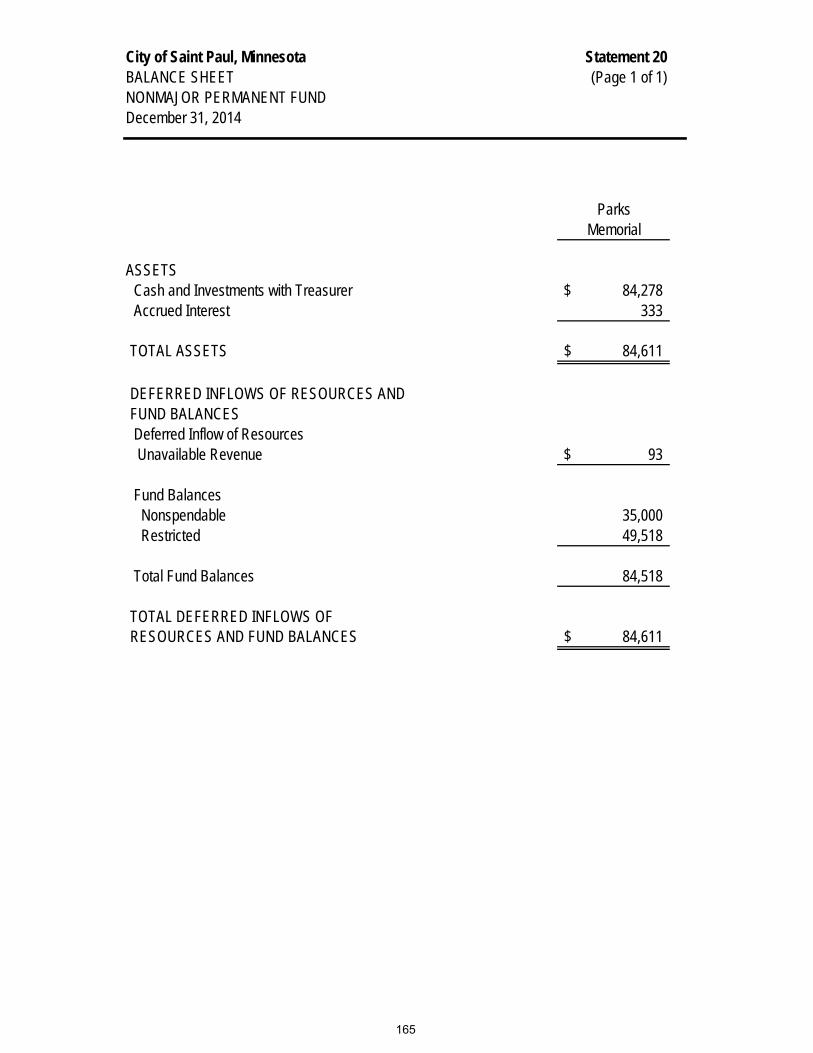
City of Saint Paul, Minnesota Statement 20BALANCE SHEET (Page 1 of 1)NONMAJOR PERMANENT FUNDDecember 31, 2014
ParksMemorial
ASSETS Cash and Investments with Treasurer 84,278$ Accrued Interest 333
TOTAL ASSETS 84,611$
DEFERRED INFLOWS OF RESOURCES ANDFUND BALANCES Deferred Inflow of Resources Unavailable Revenue 93$
Fund Balances Nonspendable 35,000 Restricted 49,518
Total Fund Balances 84,518
TOTAL DEFERRED INFLOWS OF RESOURCES AND FUND BALANCES 84,611$
165
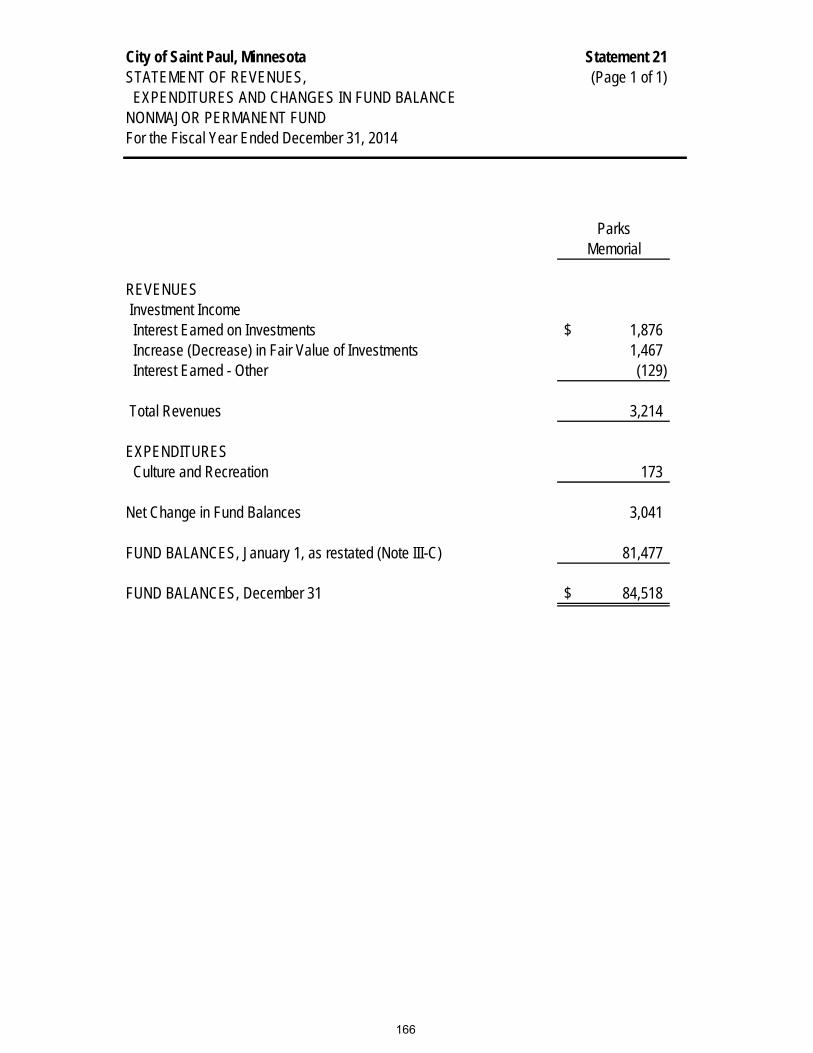
City of Saint Paul, Minnesota Statement 21STATEMENT OF REVENUES, (Page 1 of 1) EXPENDITURES AND CHANGES IN FUND BALANCENONMAJOR PERMANENT FUNDFor the Fiscal Year Ended December 31, 2014
ParksMemorial
REVENUES Investment Income Interest Earned on Investments 1,876$ Increase (Decrease) in Fair Value of Investments 1,467 Interest Earned - Other (129)
Total Revenues 3,214
EXPENDITURES Culture and Recreation 173
Net Change in Fund Balances 3,041
FUND BALANCES, January 1, as restated (Note III-C) 81,477
FUND BALANCES, December 31 84,518$
166

City of Saint Paul, Minnesota Statement 22COMBINING SCHEDULE OF REVENUES, EXPENDITURES AND CHANGES IN FUND BALANCES (Page 1 of 1)BUDGET AND ACTUAL - ANNUALLY BUDGETEDNONMAJOR PERMANANT FUNDSFor the Fiscal Year Ended December 31, 2014
VarianceBudgeted Amounts Actual with Final
Original Final Amounts Budget
REVENUES Investment Income Interest Earned on Investments 2,000$ 2,000$ 1,876$ (124)$ Increase (Decrease) in Fair Value of Investments - - 1,467 1,467 Interest Earned - Other - - (129) (129)
Total Revenues 2,000 2,000 3,214 1,214
EXPENDITURES Current Culture and Recreation 2,000 2,000 173 1,827
Net Change in Fund Balances - - 3,041 3,041
FUND BALANCES, January 1, as restated (Note III-C) 81,477 81,477 81,477 -
FUND BALANCES, December 31 81,477$ 81,477$ 84,518$ 3,041$
Parks Memorial
167

This page left blank intentionally
168

City of Saint Paul, Minnesota For the Fiscal Year Ended December 31, 2014
Nonmajor Enterprise Funds Enterprise funds account for operations (a) that are financed and operated in a manner similar to private business enterprises where the intent of the governing body is that the costs (expenses, including depreciation) of providing goods and services to the general public on a continuing basis be financed or recovered primarily through user charges; or (b) where the governing body has decided that periodic determination of revenues earned, expenses incurred and/or net income is appropriate. Parks Special Services - to account for the operations of park pavilions, refreshment stands, golf courses, canoe and boat rentals, swimming pools and beaches, tennis instructions, ski instructions, ski facilities, and the Watergate Marina. Impound Lot – to account for the city’s vehicle impounding operations. Charges are made for the towing and storage of impounded vehicles and are collected when vehicles are claimed. Unclaimed vehicles are sold at public auction and proceeds retained. Funds are also received from the salvage of vehicles junked. River Print - to account for printing services rendered to city departments, offices, and other governmental units. HRA Lofts at Farmers Market Fund – to account for the operations and debt service for the Lofts at Farmers Market.
169

This page left blank intentionally
170

City of Saint Paul, Minnesota Statement 23COMBINING STATEMENT OF NET POSITION (Page 1 of 1)NONMAJOR ENTERPRISE FUNDSDecember 31, 2014
Parks Total NonmajorSpecial Impound River HRA Enterprise
Services Lot Print Lofts Funds
ASSETSCurrent Assets
Cash and Investments with Treasurer -$ -$ -$ 10,268$ 10,268$ Cash with Fiscal Agents - - - 178,367 178,367 Imprest Funds 600 1,000 - - 1,600 Restricted Cash and Cash Equivalents - - - 735,756 735,756 Receivables
Accounts - net 8,529 - 81,732 - 90,261 Accrued Interest 8,494 - - 7,092 15,586
Due from Other Governmental Units - 170 425,631 - 425,801 Inventories 20,855 170,535 94,780 - 286,170
Total Current Assets 38,478 171,705 602,143 931,483 1,743,809
Noncurrent AssetsRestricted Assets
Investment for Revenue Bond Construction 666,750 - - - 666,750 Capital Assets
Land 3,505,372 - - 947,344 4,452,716 Buildings and Structures 2,670,040 13,395 - 9,239,408 11,922,843 Less: Accumulated Depreciation (1,745,155) (13,395) - (673,707) (2,432,257) Public Improvements 48,287 - - - 48,287 Less: Accumulated Depreciation (25,902) - - - (25,902) Equipment 2,171,477 74,097 506,410 23,245 2,775,229 Less: Accumulated Depreciation (1,888,133) (68,910) (506,410) (6,780) (2,470,233)
Total Noncurrent Assets 5,402,736 5,187 - 9,529,510 14,937,433
TOTAL ASSETS 5,441,214 176,892 602,143 10,460,993 16,681,242
LIABILITIES Current Liabilities (Payable from Current Assets)
Accrued Salaries Payable 63,440 85,602 16,415 - 165,457 Accounts Payable 125,610 213,004 87,435 - 426,049 Contracts Payable - - - 20,915 20,915 Due to Other Funds 7,807,602 293,132 286,435 - 8,387,169 Due to Other Governmental Units 4,388 5,301 1,257 - 10,946 Unearned Revenue 2,258 - - - 2,258 Compensated Absences Payable 5,412 5,862 1,794 - 13,068 Revenue Bonds Payable 325,000 - - - 325,000 Limited Tax Bonds Bonds Payable - - - 110,000 110,000 Accrued Interest Payable 62,188 - - 212,393 274,581
Total Current Liabilities 8,395,898 602,901 393,336 343,308 9,735,443
Noncurrent LiabilitiesLimited Tax Bonds Payable - - - 7,645,000 7,645,000 Revenue Bonds Payable (net of Unamortized Premium) 4,836,547 - - - 4,836,547 Compensated Absences Payable 231,193 119,070 58,118 - 408,381 Net Other Postemployment Benefits Obligation 537,409 132,519 31,724 - 701,652
Total Noncurrent Liabilities 5,605,149 251,589 89,842 7,645,000 13,591,580
TOTAL LIABILITIES 14,001,047 854,490 483,178 7,988,308 23,327,023
NET POSITIONNet Investment in Capital Assets (425,561) 5,187 - 1,774,510 1,354,136
RestrictedDebt Service - - - 152,478 152,478 Operations and Maintenance - - - 370,885 370,885
Unrestricted (8,134,272) (682,785) 118,965 174,812 (8,523,280)
TOTAL NET POSITION (8,559,833)$ (677,598)$ 118,965$ 2,472,685$ (6,645,781)$
171

This page left blank intentionally
172

City of Saint Paul, Minnesota Statement 24COMBINING STATEMENT OF REVENUES, EXPENSES (Page 1 of 1) AND CHANGES IN FUND NET POSITIONNONMAJOR ENTERPRISE FUNDSFor the Fiscal Year Ended December 31, 2014
Parks Total NonmajorSpecial Impound River HRA EnterpriseServices Lot Print Lofts Funds
OPERATING REVENUES Fees, Sales and Services 1,796,285$ 2,874,833$ 1,497,836$ 1,013,404$ 7,182,358$ Rents and Leases 529,339 - - - 529,339 Miscellaneous 8,310 - 524 - 8,834
Total Operating Revenues 2,333,934 2,874,833 1,498,360 1,013,404 7,720,531
OPERATING EXPENSES Cost of Merchandise Sold 183,678 - - - 183,678 Salaries 1,095,891 1,150,735 285,829 - 2,532,455 Employee Fringe Benefits 594,969 473,568 108,118 - 1,176,655 Services 584,496 1,487,515 622,986 376,939 3,071,936 Materials and Supplies 301,225 52,312 414,158 - 767,695 Depreciation 180,020 2,223 2,952 233,310 418,505 Miscellaneous 23,985 - - - 23,985
Total Operating Expenses 2,964,264 3,166,353 1,434,043 610,249 8,174,909
OPERATING INCOME (LOSS) (630,330) (291,520) 64,317 403,155 (454,378)
NON-OPERATING REVENUES (EXPENSES)Property Tax Increment - - - 650,730 650,730 Intergovernmental Revenue (Schedule 5) - - - 157,299 157,299 Investment Income
Interest Earned on Investments 26,953 - - 17,658 44,611 Increase (Decrease) in Fair Value of Investments 7,189 - - 11,325 18,514
Interest Earned - Other 7,134 - - - 7,134 Miscellaneous Other Revenue (Expenses) - - - (1,836) (1,836) Interest Expense on Revenue Bonds (246,830) - - - (246,830) Interest Expense on Limited Tax Bonds - - - (510,105) (510,105)
Total Non-Operating Revenues (Expenses) (205,554) - - 325,071 119,517 Income (Loss) Before Transfers (835,884) (291,520) 64,317 728,226 (334,861)
Transfers In 230,000 - - - 230,000 Transfers Out (264,393) (2,724) - (749,887) (1,017,004)
Change in Net Position (870,277) (294,244) 64,317 (21,661) (1,121,865)
NET POSITION, January 1, as restated (Note III-C) (7,689,556) (383,354) 54,648 2,494,346 (5,523,916)
NET POSITION, December 31 (8,559,833)$ (677,598)$ 118,965$ 2,472,685$ (6,645,781)$
173
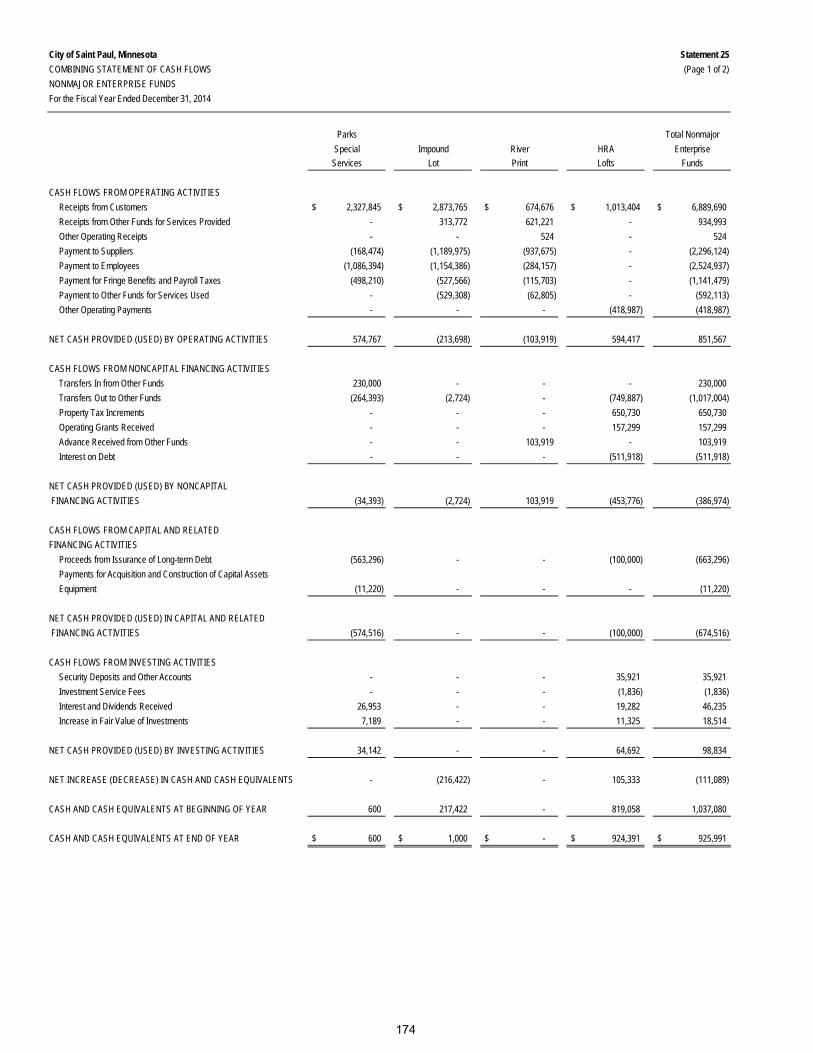
City of Saint Paul, Minnesota Statement 25COMBINING STATEMENT OF CASH FLOWS (Page 1 of 2)NONMAJOR ENTERPRISE FUNDSFor the Fiscal Year Ended December 31, 2014
Parks Total NonmajorSpecial Impound River HRA Enterprise
Services Lot Print Lofts Funds
CASH FLOWS FROM OPERATING ACTIVITIESReceipts from Customers 2,327,845$ 2,873,765$ 674,676$ 1,013,404$ 6,889,690$ Receipts from Other Funds for Services Provided - 313,772 621,221 - 934,993 Other Operating Receipts - - 524 - 524 Payment to Suppliers (168,474) (1,189,975) (937,675) - (2,296,124) Payment to Employees (1,086,394) (1,154,386) (284,157) - (2,524,937) Payment for Fringe Benefits and Payroll Taxes (498,210) (527,566) (115,703) - (1,141,479) Payment to Other Funds for Services Used - (529,308) (62,805) - (592,113) Other Operating Payments - - - (418,987) (418,987)
NET CASH PROVIDED (USED) BY OPERATING ACTIVITIES 574,767 (213,698) (103,919) 594,417 851,567
CASH FLOWS FROM NONCAPITAL FINANCING ACTIVITIESTransfers In from Other Funds 230,000 - - - 230,000 Transfers Out to Other Funds (264,393) (2,724) - (749,887) (1,017,004) Property Tax Increments - - - 650,730 650,730 Operating Grants Received - - - 157,299 157,299 Advance Received from Other Funds - - 103,919 - 103,919 Interest on Debt - - - (511,918) (511,918)
NET CASH PROVIDED (USED) BY NONCAPITAL FINANCING ACTIVITIES (34,393) (2,724) 103,919 (453,776) (386,974)
CASH FLOWS FROM CAPITAL AND RELATED FINANCING ACTIVITIES
Proceeds from Issurance of Long-term Debt (563,296) - - (100,000) (663,296) Payments for Acquisition and Construction of Capital AssetsEquipment (11,220) - - - (11,220)
NET CASH PROVIDED (USED) IN CAPITAL AND RELATED FINANCING ACTIVITIES (574,516) - - (100,000) (674,516)
CASH FLOWS FROM INVESTING ACTIVITIESSecurity Deposits and Other Accounts - - - 35,921 35,921 Investment Service Fees - - - (1,836) (1,836) Interest and Dividends Received 26,953 - - 19,282 46,235 Increase in Fair Value of Investments 7,189 - - 11,325 18,514
NET CASH PROVIDED (USED) BY INVESTING ACTIVITIES 34,142 - - 64,692 98,834
NET INCREASE (DECREASE) IN CASH AND CASH EQUIVALENTS - (216,422) - 105,333 (111,089)
CASH AND CASH EQUIVALENTS AT BEGINNING OF YEAR 600 217,422 - 819,058 1,037,080
CASH AND CASH EQUIVALENTS AT END OF YEAR 600$ 1,000$ -$ 924,391$ 925,991$
174

City of Saint Paul, Minnesota Statement 25COMBINING STATEMENT OF CASH FLOWS (Page 2 of 2)NONMAJOR ENTERPRISE FUNDSFor the Fiscal Year Ended December 31, 2014
ParksSpecial Impound River HRA
Services Lot Print Lofts TotalRECONCILIATION OF OPERATING INCOME (LOSS) TO NET CASH PROVIDED (USED) BY OPERATING ACTIVITIESOperating Income (Loss) (630,330)$ (291,520)$ 64,317$ 403,155$ (454,378)$
Adjustments to Reconcile Operating Income to Net Cash Provided (Used) by Operating Activities Depreciation 180,020 2,223 2,952 233,310 418,505 Changes in Assets and Liabilities (Increase) Decrease in Accounts Receivable (7,639) - (45,538) - (53,177) Due from Other Funds 1,550 (272,387) 40,575 - (230,262) Due from Other Governmental Units - (170) (483,412) - (483,582) Inventories 37,992 45,661 (7,720) - 75,933 Increase (Decrease) in Accrued Salaries Payable 9,497 (3,649) 1,673 - 7,521 Accounts Payable 124,335 (269,486) 43,128 (43,083) (145,106)
Contracts Payable - - - 1,035 1,035 Due to Other Funds 758,195 581,142 286,435 - 1,625,772 Due to Other Governmental Units 4,388 3,166 1,257 - 8,811 Compensated Absences Payable (8,473) (9,714) (5,215) - (23,402) Net Other Postemployment Benefits Obligation 105,232 1,036 (2,371) - 103,897
Total Adjustments 1,205,097 77,822 (168,236) 191,262 1,305,945
NET CASH PROVIDED (USED) BY OPERATING ACTIVITIES 574,767$ (213,698)$ (103,919)$ 594,417$ 851,567$
DETAILS OF CASH AND CASH EQUIVALENTSCash and Investments with Treasurer -$ -$ -$ 10,268$ 10,268$ Cash with Fiscal Agents - - - 178,367 178,367 Imprest Funds 600 1,000 - - 1,600 Restricted Cash - - - 735,756 735,756
TOTAL CASH AND CASH EQUIVALENTS 600$ 1,000$ -$ 924,391$ 925,991$
NONCASH INVESTING, CAPITAL AND FINANCING ACTIVITIESIncrease/(Decrease) in Fair Market Value of Investments 7,189$ -$ -$ 11,325$ 18,514$
175

This page left blank intentionally
176
City of Saint Paul, Minnesota For the Fiscal Year Ended December 31, 2014
Internal Service Funds Internal Service funds account for the financing of goods and services provided by one department to other departments or to other government units. Central Services - to account for various general government service activities including financial, legal, risk management, special projects, real estate, new information system and energy conservation. Equipment Services Fire-Police - to account for the operations of the Public Safety repair shop. Internal Borrowing - to account for internal borrowing from the city’s cash pool and assets secured to support repayment of loan principal with interest to the pool. Public Works Administration - to account for the costs of administrative services provided for the divisions of the Department of Public Works. Public Works Equipment Service - to account for the purchase and repair of most vehicles used by the Department of Public Works. Public Works Engineering - to account for recoverable engineering and professional services rendered by the Department of Public Works. Asphalt Plant - to account for the manufacturing of asphalt products. Traffic Warehouse - to purchase, inventory, store and supply materials for traffic maintenance and capital projects. Parks Supply and Maintenance - to account for materials purchased and design services performed by the Division of Parks and Recreation for other departments’ capital funds and outside parties. All supplies, materials, repair parts, and equipment purchased for the use in City parks, maintenance of playgrounds and the repair and recovery of the costs thereof. Planning and Economic Development Administration - to account for administrative operations within the Department of Planning and Economic Development.
177

City of Saint Paul, Minnesota Statement 26COMBINING STATEMENT OF NET POSITION (Page 1 of 2)INTERNAL SERVICE FUNDSDecember 31, 2014
PublicEquipment Public Works
Central Services Internal Works EquipmentServices Fire - Police Borrowing Administration Service
ASSETSCurrent Assets
Cash and Investments with Treasurer 6,655,490$ -$ -$ 1,140,887$ 2,257,125$ Cash and Investments with Trustee - - - - 1,210,000 Imprest Funds - 200 - 200 - Receivables
Accounts - net 64,646 9,972 20,833 - 30,852 Due from Other Funds - - 199,253 281 - Due from Other Governmental Units - - - - 3,165 Inventory - 427,206 - - 807,634 Prepaid Items 18,611 - - - 5,952
Total Current Assets 6,738,747 437,378 220,086 1,141,368 4,314,728
Non-Current AssetsAdvance to Other Funds - - 1,540,244 - - Other Long-Term Loans Receivable - - 1,662,500 - - Capital Assets
Land - - - - 25,243 Buildings and Structures 10,118,683 1,140,446 - - 2,108,781 Less: Accumulated Depreciation (6,605,543) (895,537) - - (1,502,901) Equipment 356,113 347,713 - 131,804 23,929,519 Less: Accumulated Depreciation (338,396) (297,610) - (118,064) (18,020,747) Construction in Progress - - - - 53,153
Total Noncurrent Assets 3,530,857 295,012 3,202,744 13,740 6,593,048
TOTAL ASSETS 10,269,604 732,390 3,422,830 1,155,108 10,907,776
LIABILITIESCurrent Liabilities
Accrued Salaries Payable 144,438 53,714 - 76,188 91,884 Accounts Payable 170,302 207,053 3,935 10,825 323,100 Due to Other Funds 61,435 409,066 706,242 - 17,067 Due to Other Governmental Units 215,749 4,713 - 7,286 13,715 Unearned Revenue - - 503,598 - - Compensated Absences Payable 12,225 6,069 - 9,157 8,598 Capital Lease Payable 448,946 - - - 503,294 Accrued Interest Payable 21,998 - - - 5,405
Total Current Liabilities 1,075,093 680,615 1,213,775 103,456 963,063
Noncurrent LiabilitiesCapital Lease Payable 1,475,306 - - - 2,459,439 Advance from Other Funds 125,989 - 547,273 - 35,081 Compensated Absences Payable 265,321 70,981 - 176,817 160,311 Net Other Postemployment Benefits Obligation 579,325 146,564 - 365,915 820,149
Total Noncurrent Liabilities 2,445,941 217,545 547,273 542,732 3,474,980
TOTAL LIABILITIES 3,521,034 898,160 1,761,048 646,188 4,438,043
NET POSITIONNet Investment in Capital Assets 1,606,606 295,012 - 13,741 3,630,317 Unrestricted 5,141,964 (460,782) 1,661,782 495,179 2,839,416
TOTAL NET POSITION 6,748,570$ (165,770)$ 1,661,782$ 508,920$ 6,469,733$
178
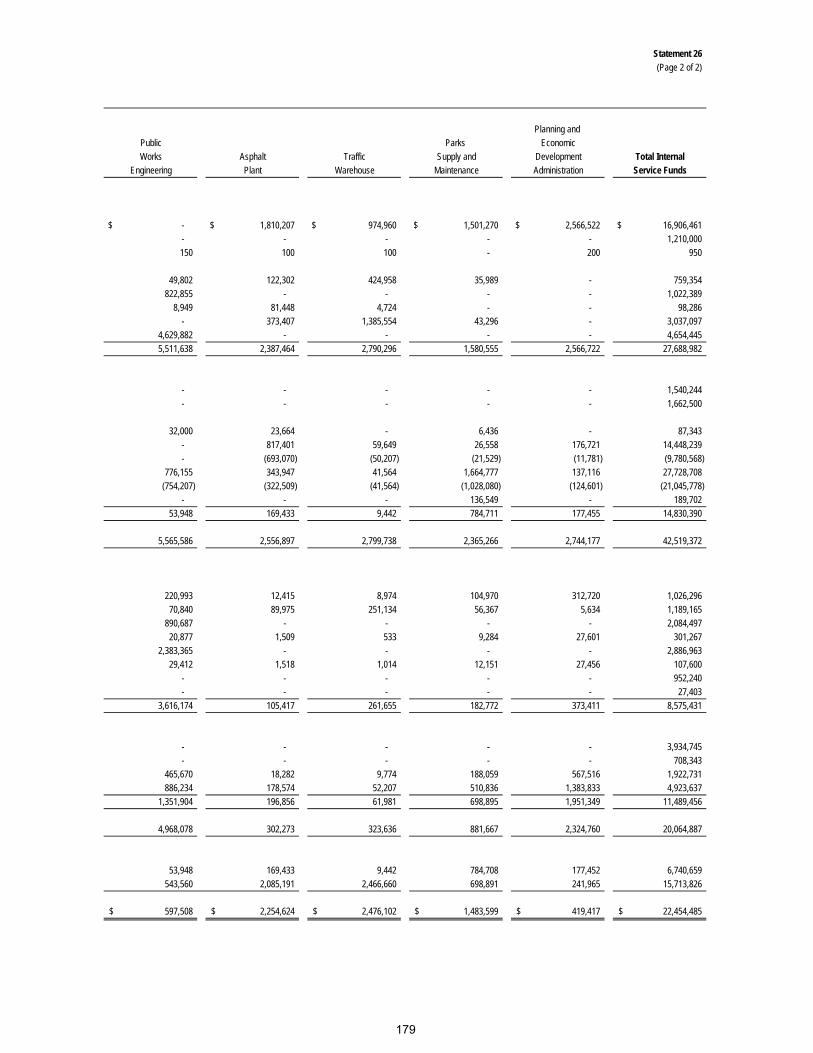
Statement 26(Page 2 of 2)
Planning and Public Parks EconomicWorks Asphalt Traffic Supply and Development Total Internal
Engineering Plant Warehouse Maintenance Administration Service Funds
-$ 1,810,207$ 974,960$ 1,501,270$ 2,566,522$ 16,906,461$ - - - - - 1,210,000 150 100 100 - 200 950
49,802 122,302 424,958 35,989 - 759,354 822,855 - - - - 1,022,389
8,949 81,448 4,724 - - 98,286 - 373,407 1,385,554 43,296 - 3,037,097
4,629,882 - - - - 4,654,445 5,511,638 2,387,464 2,790,296 1,580,555 2,566,722 27,688,982
- - - - - 1,540,244 - - - - - 1,662,500
32,000 23,664 - 6,436 - 87,343 - 817,401 59,649 26,558 176,721 14,448,239 - (693,070) (50,207) (21,529) (11,781) (9,780,568)
776,155 343,947 41,564 1,664,777 137,116 27,728,708 (754,207) (322,509) (41,564) (1,028,080) (124,601) (21,045,778)
- - - 136,549 - 189,702 53,948 169,433 9,442 784,711 177,455 14,830,390
5,565,586 2,556,897 2,799,738 2,365,266 2,744,177 42,519,372
220,993 12,415 8,974 104,970 312,720 1,026,296 70,840 89,975 251,134 56,367 5,634 1,189,165
890,687 - - - - 2,084,497 20,877 1,509 533 9,284 27,601 301,267
2,383,365 - - - - 2,886,963 29,412 1,518 1,014 12,151 27,456 107,600
- - - - - 952,240 - - - - - 27,403
3,616,174 105,417 261,655 182,772 373,411 8,575,431
- - - - - 3,934,745 - - - - - 708,343
465,670 18,282 9,774 188,059 567,516 1,922,731 886,234 178,574 52,207 510,836 1,383,833 4,923,637
1,351,904 196,856 61,981 698,895 1,951,349 11,489,456
4,968,078 302,273 323,636 881,667 2,324,760 20,064,887
53,948 169,433 9,442 784,708 177,452 6,740,659 543,560 2,085,191 2,466,660 698,891 241,965 15,713,826
597,508$ 2,254,624$ 2,476,102$ 1,483,599$ 419,417$ 22,454,485$
179

City of Saint Paul, Minnesota Statement 27COMBINING STATEMENT OF REVENUES, (Page 1 of 2) EXPENSES AND CHANGES IN FUND NET POSITIONINTERNAL SERVICE FUNDSFor the Fiscal Year Ended December 31, 2014
PublicEquipment Public Works
Central Services Internal Works EquipmentServices Fire - Police Borrowing Administration Service
OPERATING REVENUESFees, Sales and Services 11,908,597$ 3,505,252$ -$ 2,819,588$ 7,261,090$ Rents and Leases 1,953,151 - - - - Interest Earned on Loans - - 296,843 - - Miscellaneous - - - - 2,161
Total Operating Revenues 13,861,748 3,505,252 296,843 2,819,588 7,263,251
OPERATING EXPENSESCost of Merchandise Sold - - - - - Salaries 2,025,855 866,294 - 1,355,388 1,319,229 Employee Fringe Benefits 3,648,243 391,902 - 593,050 774,561 Services 2,839,899 313,063 - 394,077 1,332,510 Materials and Supplies 385,182 2,220,975 - 36,109 3,260,642 Depreciation 597,264 33,272 - 5,058 942,215 Bad Debts - - 32,041 - - Miscellaneous 6,875 - 9,590 1,692 6,079
Total Operating Expenses 9,503,318 3,825,506 41,631 2,385,374 7,635,236
OPERATING INCOME (LOSS) 4,358,430 (320,254) 255,212 434,214 (371,985)
NON-OPERATING REVENUES (EXPENSES)Gain on Sale of Capital Assets - - - - 57,793 Investment Income
Interest Earned on Investments - - 15 - - Increase (Decrease) in Fair Value of Investments - - (5,675) - -
Interest Earned - Other - - 13,017 - 253 Miscellaneous Other Revenue (Expense) - 40 - 20 (2,678) Interest Expense on Capital Lease (97,856) - - - (27,523) Interest Expense on Advance from Other Funds (3,678) - (9,293) - (2,515)
Total Non-Operating Revenues (Expenses) (101,534) 40 (1,936) 20 25,330
Income (Loss) Before Transfers 4,256,896 (320,214) 253,276 434,234 (346,655)
Transfers In 232,142 - - - 365,329 Transfers Out (2,686,839) (20,633) (300,051) (236,548) -
Change in Net Position 1,802,199 (340,847) (46,775) 197,686 18,674
NET POSITION, January 1, as restated (Note III-C) 4,946,371 175,077 1,708,557 311,234 6,451,059
NET POSITION, December 31 6,748,570$ (165,770)$ 1,661,782$ 508,920$ 6,469,733$
180

Statement 27(Page 2 of 2)
Planning and Public Parks Economic TotalWorks Asphalt Traffic Supply and Development Internal Service
Engineering Plant Warehouse Maintenance Administration Funds
6,539,165$ 3,400,163$ 4,302,894$ 4,263,529$ 8,340,948$ 52,341,226$ - - - - - 1,953,151 - - - - - 296,843 - - - 369 225,625 228,155
6,539,165 3,400,163 4,302,894 4,263,898 8,566,573 54,819,375
- - - 293,791 - 293,791 3,558,487 233,042 136,639 1,880,202 5,038,628 16,413,764 1,386,892 139,162 53,207 960,617 2,027,255 9,974,889 1,636,909 157,987 369,727 753,980 1,319,281 9,117,433
164,748 2,597,887 2,918,225 295,809 51,810 11,931,387 35,217 18,083 - 92,013 19,261 1,742,383
- - - - - 32,041 - - - - 4,298 28,534
6,782,253 3,146,161 3,477,798 4,276,412 8,460,533 49,534,222
(243,088) 254,002 825,096 (12,514) 106,040 5,285,153
- - - 10,000 - 67,793
- - - - - 15 - - - - - (5,675) - - - - - 13,270 - 59 - 6,400 (41) 3,800 - - - - - (125,379) - - - - - (15,486)
- 59 - 16,400 (41) (61,662)
(243,088) 254,061 825,096 3,886 105,999 5,223,491
- - - - - 597,471 (36,229) - - (14,099) (186,882) (3,481,281)
(279,317) 254,061 825,096 (10,213) (80,883) 2,339,681
876,825 2,000,563 1,651,006 1,493,812 500,300 20,114,804
597,508$ 2,254,624$ 2,476,102$ 1,483,599$ 419,417$ 22,454,485$
181

City of Saint Paul, Minnesota Statement 28COMBINING STATEMENT OF CASH FLOWS (Page 1 of 4)INTERNAL SERVICE FUNDSFor the Fiscal Year Ended December 31, 2014
PublicEquipment Public Works
Central Services Internal Works EquipmentServices Fire - Police Borrowing Administration Service
CASH FLOWS FROM OPERATING ACTIVITIES Receipts from Loan Recipients and Other Customers 7,111,175$ 4,012,855$ 174,849$ -$ 1,185,666$ Receipts from Other Funds for Services Provided 6,996,494 - - 2,819,309 7,089,128 Other Operating Receipts - - - 20 13,921 Payments to Suppliers (2,495,915) (1,263,926) (5,654) (84,608) (3,561,980) Payments to Employees (2,000,198) (848,515) - (1,364,647) (1,300,702) Payments for Fringe Benefits and Payroll Taxes (3,563,517) (405,965) - (540,583) (620,829) Payments to Other Funds for Services Used (157,532) (1,119,108) - (334,965) (954,349) Other Operating Payments - - - (1,692) -
NET CASH PROVIDED (USED) BY OPERATING ACTIVITIES 5,890,507 375,341 169,195 492,834 1,850,855
CASH FLOWS FROM NONCAPITAL FINANCING ACTIVITIES Transfers In from Other Funds 232,142 - - - 365,329 Transfers Out to Other Funds (2,625,404) (20,633) (300,051) (236,548) - Advance Received from Other Funds - - 784,421 - - Advance Made to Other Funds - - (1,543,868) - - Collection of an Advance to Other Funds - - 807,456 - - Repayment of Advance Received from Other Funds (121,853) (346,719) (156,364) - - Interest Paid on Advance Received from Other Funds (3,678) - - - -
NET CASH PROVIDED (USED) BY NONCAPITAL FINANCING ACTIVITIES (2,518,793) (367,352) (408,406) (236,548) 365,329
CASH FLOWS FROM CAPITAL AND RELATED FINANCING ACTIVITIES Proceeds from Sale of Capital Assets Equipment - - - - - Principal Paid on Capital Lease (429,101) - - - 788,617 Payments for Acquisition and Construction of Capital Assets Buildings and Structures - - - - - Equipment - (7,889) - (5,400) (1,701,593) Interest Paid on Capital Lease (102,761) - - - (19,854)
NET CASH PROVIDED (USED) BY CAPITAL AND RELATED FINANCING ACTIVITIES (531,862) (7,889) - (5,400) (932,830)
CASH FLOWS FROM INVESTING ACTIVITIES Interest and Dividends on Investments Received - - 15 - 253 Increase (Decrease) in Fair Value of Investments - - (5,675) - -
NET CASH USED IN INVESTING ACTIVITIES - - (5,660) - 253
NET INCREASE (DECREASE) IN CASH AND CASH EQUIVALENTS 2,839,852 100 (244,871) 250,886 1,283,607
CASH AND CASH EQUIVALENTS AT BEGINNING OF YEAR 3,815,638 100 244,871 890,201 2,183,518
CASH AND CASH EQUIVALENTS AT END OF YEAR 6,655,490$ 200$ -$ 1,141,087$ 3,467,125$
182

Statement 28(Page 2 of 4)
Planning and Public Parks EconomicWorks Asphalt Traffic Supply and Development
Engineering Plant Warehouse Maintenance Administration Total
26,701$ 1,366,874$ 219,555$ -$ 225,627$ 14,323,302$ 5,801,116 1,882,305 3,783,944 (4,263,526) 8,900,719 33,009,489
- - - (6,769) - 7,172 (846,460) (2,628,584) (2,685,515) 389,255 (247,063) (13,430,450)
(3,501,520) (229,088) (134,077) 1,855,505 (4,952,803) (12,476,045) (741,987) (101,087) (53,897) 960,617 (1,925,728) (6,992,976)
(2,343,970) (61,777) (307,996) 626,914 (1,110,493) (5,763,276) - - - 949,137 - 947,445
(1,606,120) 228,643 822,014 511,133 890,259 9,624,661
- - - - - 597,471 (36,229) - - (14,099) (620,698) (3,853,662) 890,687 - - - - 1,675,108
- - - - - (1,543,868) - - - - - 807,456 - - - - - (624,936) - - - - - (3,678)
854,458 - - (14,099) (620,698) (2,946,109)
- - - 10,000 - 10,000 - - - - - 359,516
- - - - (13,588) - (13,588) - - - (399,286) (10,000) (2,124,168) - - - - - (122,615)
- - - (402,874) (10,000) (1,890,855)
- - - - - 268 - - - - - (5,675)
- - - - - (5,407)
(751,662) 228,643 822,014 94,160 259,561 4,782,290
751,812 1,581,664 153,046 1,407,110 2,307,161 13,335,121
150$ 1,810,307$ 975,060$ 1,501,270$ 2,566,722$ 18,117,411$
183

City of Saint Paul, Minnesota Statement 28COMBINING STATEMENT OF CASH FLOWS (Page 3 of 4)INTERNAL SERVICE FUNDSFor the Fiscal Year Ended December 31, 2014
PublicEquipment Public Works
Central Services Internal Works EquipmentServices Fire Police Borrowing Administration Service
RECONCILIATION OF OPERATING INCOME (LOSS) TO NET CASH PROVIDED (USED) BY OPERATING ACTIVITIES Operating Income (Loss) 4,358,430$ (320,254)$ 255,212$ 434,214$ (371,985)$ Adjustments to Reconcile Operating Income to Net Cash Provided (Used) by Operating Activities Depreciation 597,264 33,272 - 5,058 942,215 Increase (Decrease) in Allowance for Uncollectible Accounts (7,428) - - - - Non-Operating Miscellaneous Revenue (Expense) - 40 - - - Changes in Assets and Liabilities (Increase) Decrease in Accounts Receivable (58,797) (9,972) - - (28,803) Notes and Loans Receivable - - 237,500 - - Accrued Interest Receivable - - - - - Due from Other Funds 133,609 471,656 (43,110) (282) 1,034,956 Due from Component Units - - - - - Due from Other Governmental Units 178,537 37,264 - - 25,394 Inventories - 31,776 - - 41,284 Prepaid Items 321,586 - - - - Increase (Decrease) in Accrued Salaries Payable 25,657 17,779 - 6,576 18,525 Accounts Payable 65,594 126,382 3,935 3,405 42,809 Due to Other Funds - (3,252) - (80) (20,986)
Due to Other Component Unit - - - - - Due to Other Governmental Units 191,328 4,713 - 7,285 13,715 Unearned Revenue - - (284,342) - - Compensated Absences Payable 24,938 (19,589) - (4,245) (4,782) Net Other Postemployment Benefits Obligation 59,789 5,526 - 40,903 158,513
Total Adjustments 1,532,077 695,595 (86,017) 58,620 2,222,840
NET CASH PROVIDED (USED) BY OPERATING ACTIVITIES 5,890,507$ 375,341$ 169,195$ 492,834$ 1,850,855$
RECONCILIATION OF CASH AND CASH EQUIVALENTS TO THESTATEMENT OF NET POSITION Cash and Investments with Treasurer 6,655,490$ -$ -$ 1,140,887$ 2,257,125$ Cash and Investments with Trustee - - - - 1,210,000 Imprest Funds - 200 - 200 -
TOTAL CASH AND CASH EQUIVALENTS 6,655,490$ 200$ -$ 1,141,087$ 3,467,125$
NONCASH INVESTING, CAPITAL AND FINANCING ACTIVITIESIncrease/(Decrease) in Fair Market Value of Investments -$ -$ (5,675)$ -$ -$
184

Statement 28(Page 4 of 4)
Planning and Public Parks EconomicWorks Asphalt Traffice Supply and Development
Engineering Plant Warehouse Maintenance Administration Total
(243,088)$ 254,002$ 825,096$ (12,514)$ 106,040$ 5,285,153$
35,217 18,083 - 92,013 19,261 1,742,383
- (998) (139,618) 22,052 - (125,992) - 59 - 10,369 1,014 11,482
(9,977) (90,882) (215,082) 9,657 - (403,856) - - - - - 237,500 - - - - - - (812,675) 2,272 9,283 297,805 558,759 1,652,273 - - 25 - - 25
16,051 (61,435) 45,997 - - 241,808 - (19,886) 177,757 (25,535) - 205,396(764,601) - - - - (443,015)
58,344 3,954 2,562 24,697 85,825 243,91942 85,000 118,480 43,989 (6,189) 483,447
(53,939) (1,032) (529) (9,993) (1,374) (91,185) - - - - - -
20,809 1,431 533 9,284 25,397 274,49565,728 - - - - (218,614)
(428) 1,730 (11,829) (14,944) (68,333) (97,482)82,397 36,345 9,339 64,253 169,859 626,924
(1,363,032) (25,359) (3,082) 523,647 784,219 4,339,508
(1,606,120)$ 228,643$ 822,014$ 511,133$ 890,259$ 9,624,661$
-$ 1,810,207$ 974,960$ 1,501,270$ 2,566,522$ 16,906,461$ - - - - - 1,210,000
150 100 100 - 200 950
150$ 1,810,307$ 975,060$ 1,501,270$ 2,566,722$ 18,117,411$
-$ -$ -$ -$ -$ (5,675)$
185

This page left blank intentionally
186

City of Saint Paul, Minnesota For the Fiscal Year Ended December 31, 2014
Agency Funds Agency funds account for assets held in a custodial capacity for others and/or other funds. Employee Withholding - to account for monies withheld from employees’ salaries and remitted to governmental and outside agencies. Minnesota Sales and Use Tax - to account for receipts and disbursements of sales tax as required by the Tax Reform and Relief Act. City Agency - to account for the proceeds from Comcast for distribution relating to the city's Cable Access Program; property taxes levied and collected by Ramsey County and remitted to the Port Authority of the City of Saint Paul; outstanding checks which have been written off and remitted to the State of Minnesota under the Minnesota Uniform Disposition of Unclaimed Property Act; receipts and disbursements for which proper accounting cannot be made at the time of the transaction; collection of the State of Minnesota building permit surcharge; and cash received by the Police Department that is lost, unclaimed or contraband collected during the course of Police business.
187

This page left blank intentionally
188
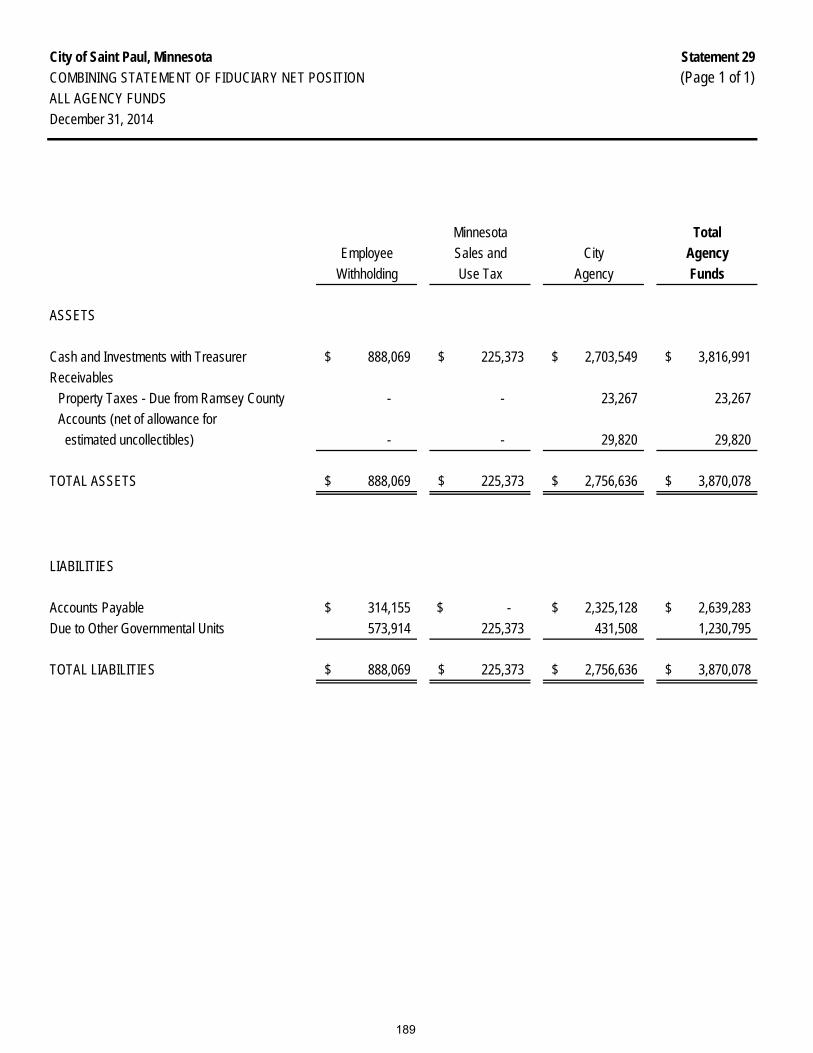
City of Saint Paul, Minnesota Statement 29COMBINING STATEMENT OF FIDUCIARY NET POSITION (Page 1 of 1)ALL AGENCY FUNDS
Minnesota TotalEmployee Sales and City Agency
Withholding Use Tax Agency Funds
ASSETS
Cash and Investments with Treasurer 888,069$ 225,373$ 2,703,549$ 3,816,991$ Receivables
Property Taxes - Due from Ramsey County - - 23,267 23,267Accounts (net of allowance for estimated uncollectibles) - - 29,820 29,820
TOTAL ASSETS 888,069$ 225,373$ 2,756,636$ 3,870,078$
LIABILITIES Accounts Payable 314,155$ -$ 2,325,128$ 2,639,283$ Due to Other Governmental Units 573,914 225,373 431,508 1,230,795
TOTAL LIABILITIES 888,069$ 225,373$ 2,756,636$ 3,870,078$
December 31, 2014
189
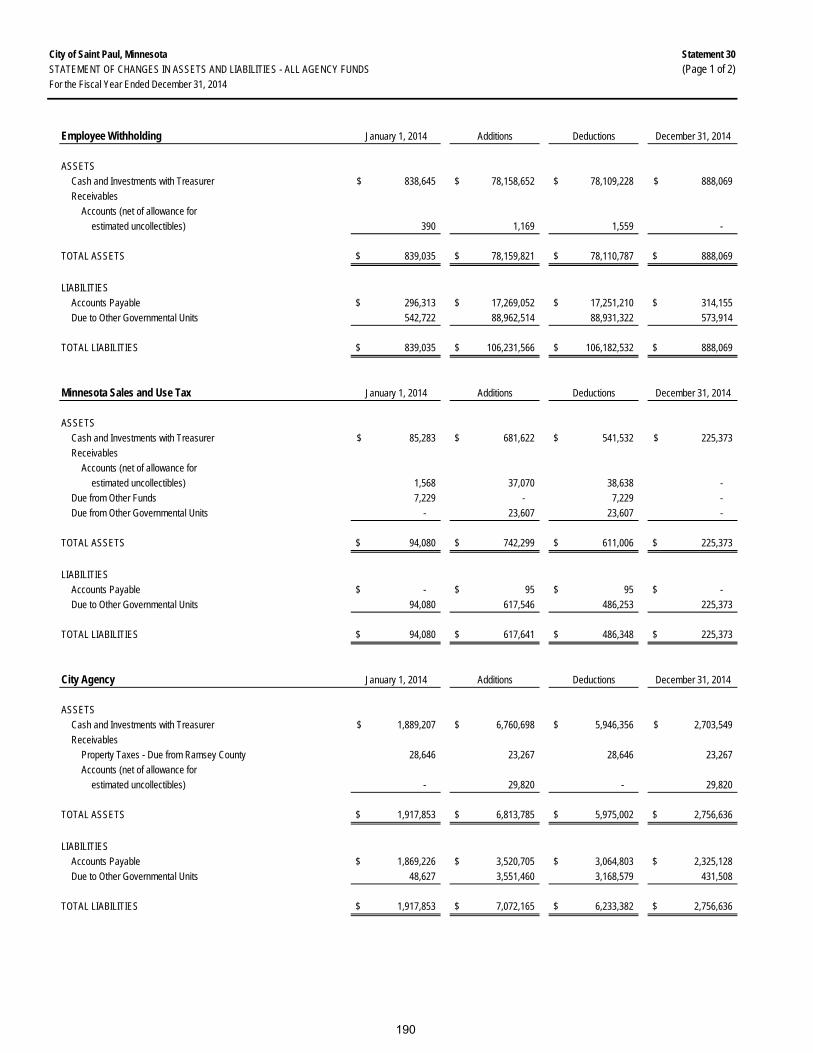
City of Saint Paul, Minnesota Statement 30STATEMENT OF CHANGES IN ASSETS AND LIABILITIES - ALL AGENCY FUNDS (Page 1 of 2)For the Fiscal Year Ended December 31, 2014
Employee Withholding January 1, 2014 Additions Deductions December 31, 2014
ASSETSCash and Investments with Treasurer 838,645$ 78,158,652$ 78,109,228$ 888,069$ Receivables
Accounts (net of allowance for estimated uncollectibles) 390 1,169 1,559 -
TOTAL ASSETS 839,035$ 78,159,821$ 78,110,787$ 888,069$
LIABILITIES Accounts Payable 296,313$ 17,269,052$ 17,251,210$ 314,155$ Due to Other Governmental Units 542,722 88,962,514 88,931,322 573,914
TOTAL LIABILITIES 839,035$ 106,231,566$ 106,182,532$ 888,069$
Minnesota Sales and Use Tax January 1, 2014 Additions Deductions December 31, 2014
ASSETSCash and Investments with Treasurer 85,283$ 681,622$ 541,532$ 225,373$ Receivables
Accounts (net of allowance for estimated uncollectibles) 1,568 37,070 38,638 -
Due from Other Funds 7,229 - 7,229 - Due from Other Governmental Units - 23,607 23,607 -
TOTAL ASSETS 94,080$ 742,299$ 611,006$ 225,373$
LIABILITIES Accounts Payable -$ 95$ 95$ -$ Due to Other Governmental Units 94,080 617,546 486,253 225,373
TOTAL LIABILITIES 94,080$ 617,641$ 486,348$ 225,373$
City Agency January 1, 2014 Additions Deductions December 31, 2014
ASSETSCash and Investments with Treasurer 1,889,207$ 6,760,698$ 5,946,356$ 2,703,549$ Receivables
Property Taxes - Due from Ramsey County 28,646 23,267 28,646 23,267 Accounts (net of allowance for
estimated uncollectibles) - 29,820 - 29,820
TOTAL ASSETS 1,917,853$ 6,813,785$ 5,975,002$ 2,756,636$
LIABILITIES Accounts Payable 1,869,226$ 3,520,705$ 3,064,803$ 2,325,128$ Due to Other Governmental Units 48,627 3,551,460 3,168,579 431,508
TOTAL LIABILITIES 1,917,853$ 7,072,165$ 6,233,382$ 2,756,636$
190

Statement 30STATEMENT OF CHANGES IN ASSETS AND LIABILITIES - ALL AGENCY FUNDS (Page 2 of 2)For the Fiscal Year Ended December 31, 2014
Agency Fund Total January 1, 2014 Additions Deductions December 31, 2014
ASSETSCash and Investments with Treasurer 2,813,135$ 85,600,972$ 84,597,116$ 3,816,991$ Receivables
Property Taxes - Due from Ramsey County 28,646 23,267 28,646 23,267 Accounts (net of allowance for
estimated uncollectibles) 1,958 68,059 40,197 29,820 Due from Other Funds 7,229 - 7,229 - Due from Other Governmental Units - 23,607 23,607 -
TOTAL ASSETS 2,850,968$ 85,715,905$ 84,696,795$ 3,870,078$
LIABILITIES Accounts Payable 2,165,539$ 20,789,852$ 20,316,108$ 2,639,283$ Due to Other Governmental Units 685,429 93,131,520 92,586,154 1,230,795
TOTAL LIABILITIES 2,850,968$ 113,921,372$ 112,902,262$ 3,870,078$
191

This page left blank intentionally
192

OTHER SUPPLEMENTARY INFORMATION
193

City of Saint Paul, Minnesota Schedule 5SCHEDULE OF INTERGOVERNMENTAL REVENUE (Page 1 of 3)ALL FUNDSFor the Fiscal Year Ended December 31, 2014
Federal State County Other Total
GOVERNMENTAL FUNDS
Major Governmental Funds
General FundCity Share County Pilot - - 7,944 - 7,944 City Share of State Court Fines - 2,790,903 - - 2,790,903 City Share of State Highway Rent - 12,821 - - 12,821 Fire Pension Amortization and Insurance Premium Aid - 2,438,403 - - 2,438,403 Local Government Aid - 60,424,253 - - 60,424,253 Market Value Homestead Credit - 115 - - 115 Paramedic Federal Subsidy - - - 353,073 353,073 Police Pension Amortization Aid - 4,426,791 - - 4,426,791 Police/Fire Disability Benefit Act - 302,541 - - 302,541 Public Employees Retirement Association - Pension Aid - 517,512 - - 517,512
Total General Fund - 70,913,339 7,944 353,073 71,274,356
Public Library General FundCity Share County Pilot - - 18,306 - 18,306
City Debt ServiceBuild America Bonds Interest Subsidy - - - 630,746 630,746 City Share of Payment in Lieu of Taxes - - 13,571 - 13,571
Total City Debt Service - - 13,571 630,746 644,317
City Capital ProjectsCapital Region Watershed District - - - 200,000 200,000 Environmental Protection Agency 375,421 - - - 375,421 Federal Highway Administration - State Administered 3,254,608 - - - 3,254,608 Macalester College/Snelling Avenue Pedestrian Median - 2009 Appropriation 924,623 - - - 924,623 Metropolitan Council - - - 3,583,878 3,583,878 Minnesota Department of Economic Development - 17,659,432 - - 17,659,432 Minnesota Department of Natural Resources - 555,989 - - 555,989 Minnesota Department of Natural Resources - Metropolitan - 183,659 - - 183,659 Minnesota Department of Transportation Bridge Bonds - 750,582 - - 750,582 Minnesota Historical Society - 66,000 - - 66,000 Minnesota Trunk Highway Funds - 91,547 - - 91,547 Municipal State Aid - Construction - 5,510,573 - - 5,510,573
Total City Capital Projects 4,554,652 24,817,782 - 3,783,878 33,156,312
Total Major Governmental Funds 4,554,652 95,731,121 39,821 4,767,697 105,093,291
Nonmajor Governmental Funds
Special Revenue Funds
City Grants2011 Assistance to Firefighters - Regional Grant 287,639 - - - 287,639 2011 Assistance to Firefighters Grant 120,211 - - - 120,211 2011 MMRS Grant 56,324 - - - 56,324 2012 Urban Area Security Initiative (UASI) Grant 145,415 - - - 145,415 2013 Assistance to Firefighters Grant 56,184 - - - 56,184 2013 Hazardous Materials Emergency Preparedness Grant 10,000 - - - 10,000 2013 State Homeland Security Grant 6,000 - - - 6,000 2013 Urban Area Security Initiative (UASI) Grant 452,278 - - - 452,278 2014 EMPG Grant 30,000 - - - 30,000 2014 MMRS - - - 405,000 405,000
194

City of Saint Paul, Minnesota Schedule 5SCHEDULE OF INTERGOVERNMENTAL REVENUE (Page 2 of 3)ALL FUNDSFor the Fiscal Year Ended December 31, 2014
Federal State County Other Total
AmeriCorps*VISTA - CNCS 168,114 - - - 168,114 Community Crime Prevention - State - 93,391 - - 93,391 COPS Hiring - Justice 49,191 - - - 49,191 Environmental Protection Agency Coalition Assessment 20,272 - - - 20,272 Federal Transit Capital Investment Grants - Metropolitan Council 220,418 - - - 220,418 Homeland Security - State Administered 47,165 - - - 47,165 Human Trafficking - Justice 293,354 - - - 293,354 Justice Assistance - Justice 339,808 - - - 339,808 Juvenile Accountability Incentive Block Grant - Justice 35,269 - - - 35,269 Metropolitan Council - Parks Projects - - - 116,381 116,381 Metropolitan Council - Planning Economic Development Projects - - - 2,621,377 2,621,377 Minimum Penalties for Repeat Offenders DWI - Justice (State Administered) 90,959 - - - 90,959 Minnesota Auto Theft Prevention Program - 190,118 - - 190,118 Minnesota Department of Administration - 529,681 - - 529,681 Minnesota Pollution Control Agency - 5,850 - - 5,850 Narcotics Control Program - Surveillance - Justice 124,920 - - - 124,920 National Infrastructure Investments - Justice (County Administered) 60,295 - - - 60,295 National Infrastructure Investment - State Administered ( Complete St Tiger II ) 45,021 - - - 45,021 National Priority Safety Programs 39,529 - - - 39,529 Non-Motorized Transportation Pilot Grant - State Administered 40,609 - - - 40,609 Police Athletic/Activities Leagues Youth Enrichment Program 6,496 - - - 6,496 Port Security - Homeland Security 301,250 - - - 301,250 Public Safety Partnership and Community Policing Grants - Justice State Administered 3,718 - - - 3,718 Real Time Officer, State and Community Highway Safety - Justice State Administered 8,107 - - - 8,107 Saint Paul Public Schools - AmeriCorps*VISTA Cost Share - - - 22,398 22,398 State of Minnesota - Special Project - 260,882 - - 260,882 Youth Job Corp Grant - State Administered - 463,413 - - 463,413
Total City Grants 3,058,546 1,543,335 - 3,165,156 7,767,037
Fire Responsive ServicesParamedic Federal Subsidy - - - 353,073 353,073
Police Special ProjectsPeace Officers Standards Board - 185,684 - - 185,684
Right Of Way MaintenanceForest Protection Reserve Grant - Minnesota Department of Agriculture - 5,000 - - 5,000 Municipal State Aid - 3,220,836 - - 3,220,836 Ramsey County Aid - - 1,848,375 - 1,848,375 State Trunk Highway - 471,830 - - 471,830
Total Right of Way Maintenance - 3,697,666 1,848,375 - 5,546,041
Recycling And Solid WasteRamsey County Recycling Program - - 590,554 - 590,554
Parks And Recreation Special ProjectsRegional Parks Maintenance - - - 1,574,670 1,574,670
Public Library Special ProjectsAdvancing at Risk Youth Toward Working Professionals 21,688 - - - 21,688 Community Connectors: Services for Underserved English Speaking Urban Populations 11,437 - - - 11,437 Expanded Learning Mini Grant 4,599 - - - 4,599 Libraries and Literacy Agencies United for Digital Literacy 36,494 - - - 36,494 Metropolitan Library Service Agency (MELSA) - 378,188 - - 378,188 National Leadership Grants 5,495 - - - 5,495
Total Public Library Special Projects 79,713 378,188 - - 457,901
195
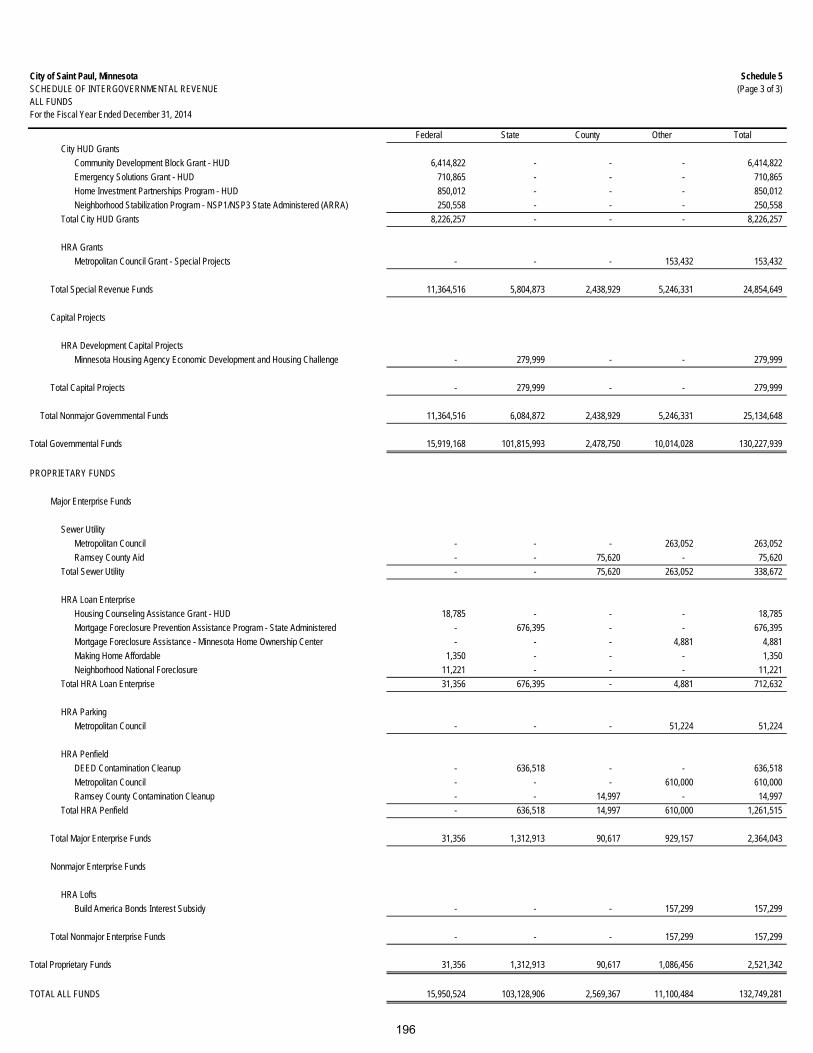
City of Saint Paul, Minnesota Schedule 5SCHEDULE OF INTERGOVERNMENTAL REVENUE (Page 3 of 3)ALL FUNDSFor the Fiscal Year Ended December 31, 2014
Federal State County Other TotalCity HUD Grants
Community Development Block Grant - HUD 6,414,822 - - - 6,414,822 Emergency Solutions Grant - HUD 710,865 - - - 710,865 Home Investment Partnerships Program - HUD 850,012 - - - 850,012 Neighborhood Stabilization Program - NSP1/NSP3 State Administered (ARRA) 250,558 - - - 250,558
Total City HUD Grants 8,226,257 - - - 8,226,257
HRA GrantsMetropolitan Council Grant - Special Projects - - - 153,432 153,432
Total Special Revenue Funds 11,364,516 5,804,873 2,438,929 5,246,331 24,854,649
Capital Projects
HRA Development Capital ProjectsMinnesota Housing Agency Economic Development and Housing Challenge - 279,999 - - 279,999
Total Capital Projects - 279,999 - - 279,999
Total Nonmajor Governmental Funds 11,364,516 6,084,872 2,438,929 5,246,331 25,134,648
Total Governmental Funds 15,919,168 101,815,993 2,478,750 10,014,028 130,227,939
PROPRIETARY FUNDS
Major Enterprise Funds
Sewer UtilityMetropolitan Council - - - 263,052 263,052 Ramsey County Aid - - 75,620 - 75,620
Total Sewer Utility - - 75,620 263,052 338,672
HRA Loan EnterpriseHousing Counseling Assistance Grant - HUD 18,785 - - - 18,785 Mortgage Foreclosure Prevention Assistance Program - State Administered - 676,395 - - 676,395 Mortgage Foreclosure Assistance - Minnesota Home Ownership Center - - - 4,881 4,881 Making Home Affordable 1,350 - - - 1,350 Neighborhood National Foreclosure 11,221 - - - 11,221
Total HRA Loan Enterprise 31,356 676,395 - 4,881 712,632
HRA ParkingMetropolitan Council - - - 51,224 51,224
HRA PenfieldDEED Contamination Cleanup - 636,518 - - 636,518 Metropolitan Council - - - 610,000 610,000 Ramsey County Contamination Cleanup - - 14,997 - 14,997
Total HRA Penfield - 636,518 14,997 610,000 1,261,515
Total Major Enterprise Funds 31,356 1,312,913 90,617 929,157 2,364,043
Nonmajor Enterprise Funds
HRA LoftsBuild America Bonds Interest Subsidy - - - 157,299 157,299
Total Nonmajor Enterprise Funds - - - 157,299 157,299
Total Proprietary Funds 31,356 1,312,913 90,617 1,086,456 2,521,342
TOTAL ALL FUNDS 15,950,524 103,128,906 2,569,367 11,100,484 132,749,281
196

This page left blank intentionally
197
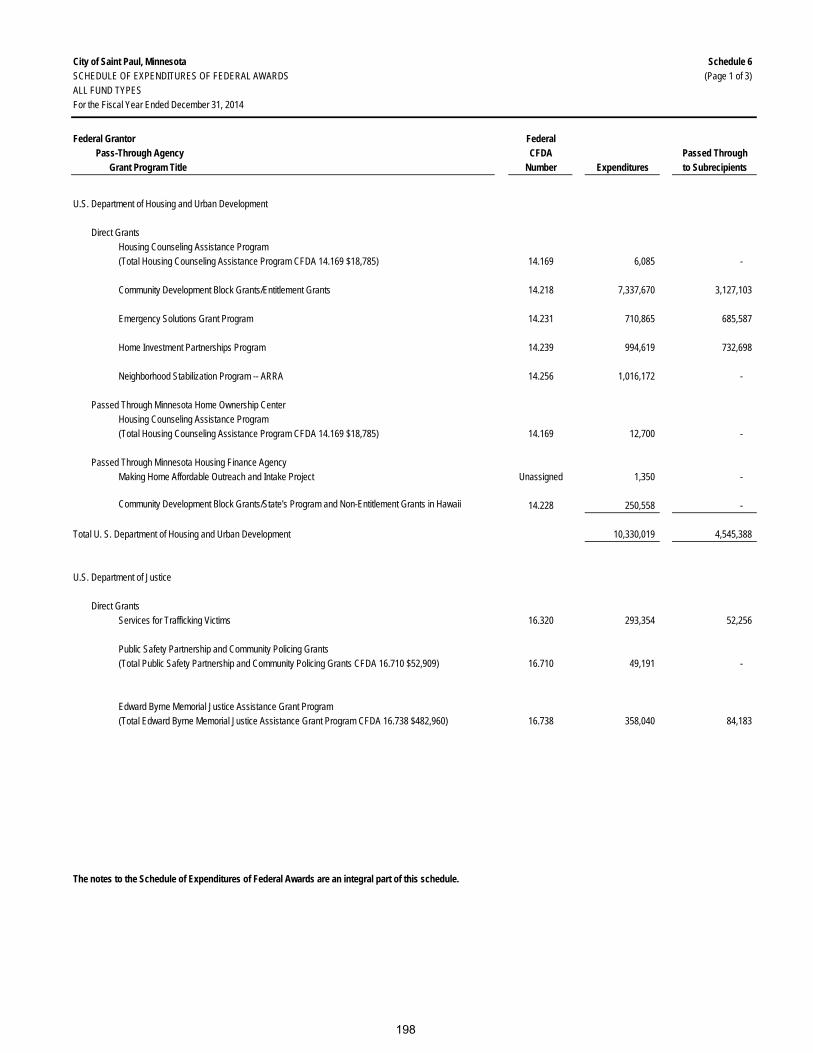
City of Saint Paul, Minnesota Schedule 6SCHEDULE OF EXPENDITURES OF FEDERAL AWARDS (Page 1 of 3)ALL FUND TYPESFor the Fiscal Year Ended December 31, 2014
Federal Grantor Federal Pass-Through Agency CFDA Passed Through
Grant Program Title Number Expenditures to Subrecipients
U.S. Department of Housing and Urban Development
Direct GrantsHousing Counseling Assistance Program(Total Housing Counseling Assistance Program CFDA 14.169 $18,785) 14.169 6,085 -
Community Development Block Grants/Entitlement Grants 14.218 7,337,670 3,127,103
Emergency Solutions Grant Program 14.231 710,865 685,587
Home Investment Partnerships Program 14.239 994,619 732,698
Neighborhood Stabilization Program -- ARRA 14.256 1,016,172 -
Passed Through Minnesota Home Ownership CenterHousing Counseling Assistance Program(Total Housing Counseling Assistance Program CFDA 14.169 $18,785) 14.169 12,700 -
Passed Through Minnesota Housing Finance AgencyMaking Home Affordable Outreach and Intake Project Unassigned 1,350 -
Community Development Block Grants/State's Program and Non-Entitlement Grants in Hawaii 14.228 250,558 - Total U. S. Department of Housing and Urban Development 10,330,019 4,545,388
U.S. Department of Justice
Direct GrantsServices for Trafficking Victims 16.320 293,354 52,256
Public Safety Partnership and Community Policing Grants(Total Public Safety Partnership and Community Policing Grants CFDA 16.710 $52,909) 16.710 49,191 -
Edward Byrne Memorial Justice Assistance Grant Program(Total Edward Byrne Memorial Justice Assistance Grant Program CFDA 16.738 $482,960) 16.738 358,040 84,183
The notes to the Schedule of Expenditures of Federal Awards are an integral part of this schedule.
198

City of Saint Paul, Minnesota Schedule 6SCHEDULE OF EXPENDITURES OF FEDERAL AWARDS (Page 2 of 3)ALL FUND TYPESFor the Fiscal Year Ended December 31, 2014
Federal Grantor Federal Pass-Through Agency CFDA Passed Through
Grant Program Title Number Expenditures to Subrecipients
Passed Through Minnesota Department of Public SafetyJuvenile Accountability Block Grants 16.523 35,269 24,058
Public Safety Partnership and Community Policing Grants(Total Public Safety Partnership and Community Policing Grants CFDA 16.710 $52,909) 16.710 3,718 -
Passed Through National Association of Police Activities / Activities LeagueJuvenile Mentoring Program 16.726 6,496 -
Passed Through Ramsey CountyEdward Byrne Memorial Justice Assistance Grant Program(Total Edward Byrne Memorial Justice Assistance Grant Program CFDA 16.738 $482,960) 16.738 124,920 -
Total U. S. Department of Justice 870,988 160,497
U.S. Department of Transportation
Passed Through Metropolitan CouncilFederal Transit Capital Investment Grants 20.500 932,285 -
New Freedom Program 20.521 212,756 -
Passed Through Minnesota Department of Public Safety
State and Community Highway Safety(Total State and Community Highway Safety CFDA 20.600 $68,402) 20.600 8,107 -
Interagency Hazardous Materials Public Sector Training and Planning Grants 20.703 10,000 -
Passed Through Minnesota Department of TransportationHighway Planning and Construction 20.205 3,295,217 -
National Infrastructure Investments 20.933 45,021 -
Passed Through Ramsey CountyState and Community Highway Safety(Total State and Community Highway Safety CFDA 20.600 $68,402) 20.600 60,295 -
Minimum Penalties for Repeat Offenders for Driving While Intoxicated 20.608 90,959 -
National Priority Safety Programs 20.616 39,529 -
Total U.S. Department of Transportation 4,694,169 -
The notes to the Schedule of Expenditures of Federal Awards are an integral part of this schedule.
199

City of Saint Paul, Minnesota Schedule 6SCHEDULE OF EXPENDITURES OF FEDERAL AWARDS (Page 3 of 3)ALL FUND TYPESFor the Fiscal Year Ended December 31, 2014
Federal Grantor Federal Pass-Through Agency CFDA Passed Through
Grant Program Title Number Expenditures to Subrecipients
U.S. Department of Treasury
Passed Through Minnesota Housing Finance AgencyNational Foreclosure Mitigation Counseling 21.000 11,221 -
Institute of Museum and Library Services
Direct GrantNational Leadership Grants 45.312 5,495 -
Passed Through Minnesota Department of EducationGrants to States 45.310 74,219 -
Total Institute of Museum and Library Services 79,714 -
U.S. Environmental Protection Agency
Direct GrantBrownfields Assessment and Cleanup Cooperative Agreements 66.818 397,322 -
Corporation for National and Community Service
Direct GrantVolunteers in Service to America 94.013 168,114 -
U.S. Department of Homeland Security
Direct GrantsAssistance to Firefighters Grant 97.044 464,034 -
Port Security Grant Program 97.056 301,250 -
Passed through Minnesota Department of Public SafetyEmergency Management Performance Grants 97.042 30,000 -
Homeland Security Grant Program 97.067 832,347 -
Total U.S. Department of Homeland Security 1,627,631 -
Total Federal Awards 18,179,178 4,705,885
The notes to the Schedule of Expenditures of Federal Awards are an integral part of this schedule.
200
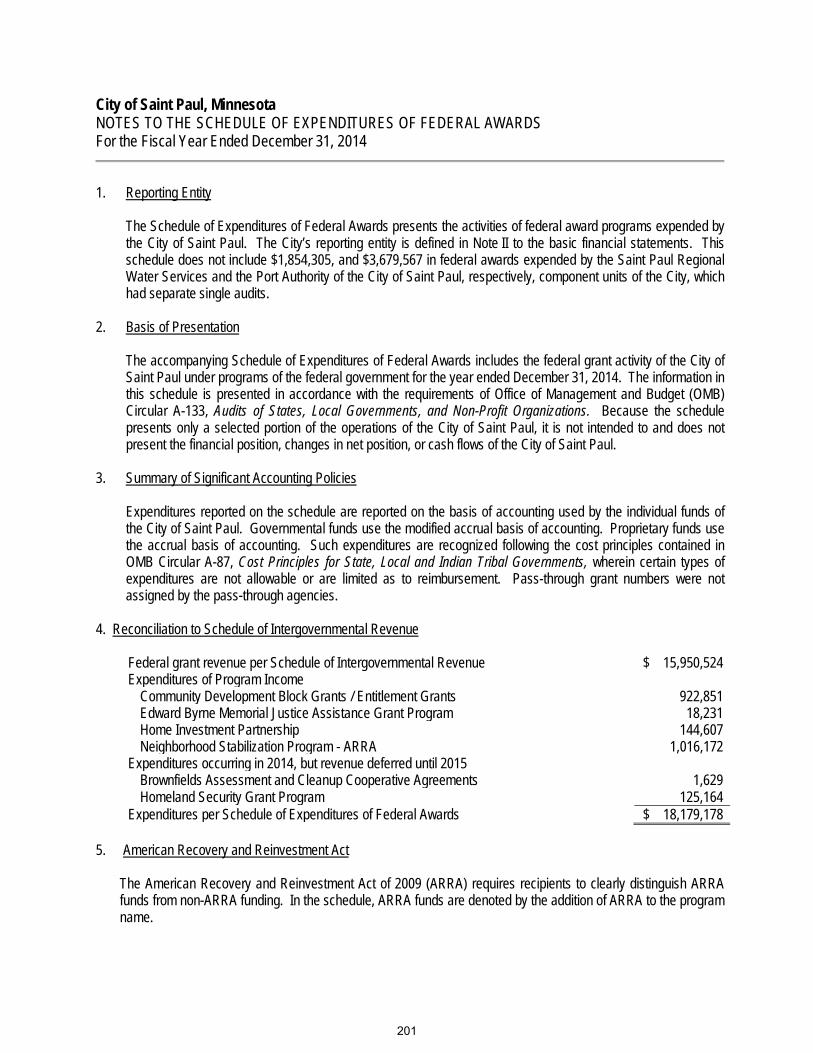
City of Saint Paul, Minnesota NOTES TO THE SCHEDULE OF EXPENDITURES OF FEDERAL AWARDS For the Fiscal Year Ended December 31, 2014
1. Reporting Entity The Schedule of Expenditures of Federal Awards presents the activities of federal award programs expended by
the City of Saint Paul. The City’s reporting entity is defined in Note II to the basic financial statements. This schedule does not include $1,854,305, and $3,679,567 in federal awards expended by the Saint Paul Regional Water Services and the Port Authority of the City of Saint Paul, respectively, component units of the City, which had separate single audits.
2. Basis of Presentation
The accompanying Schedule of Expenditures of Federal Awards includes the federal grant activity of the City of Saint Paul under programs of the federal government for the year ended December 31, 2014. The information in this schedule is presented in accordance with the requirements of Office of Management and Budget (OMB) Circular A-133, Audits of States, Local Governments, and Non-Profit Organizations. Because the schedule presents only a selected portion of the operations of the City of Saint Paul, it is not intended to and does not present the financial position, changes in net position, or cash flows of the City of Saint Paul.
3. Summary of Significant Accounting Policies
Expenditures reported on the schedule are reported on the basis of accounting used by the individual funds of the City of Saint Paul. Governmental funds use the modified accrual basis of accounting. Proprietary funds use the accrual basis of accounting. Such expenditures are recognized following the cost principles contained in OMB Circular A-87, Cost Principles for State, Local and Indian Tribal Governments, wherein certain types of expenditures are not allowable or are limited as to reimbursement. Pass-through grant numbers were not assigned by the pass-through agencies.
4. Reconciliation to Schedule of Intergovernmental Revenue
Federal grant revenue per Schedule of Intergovernmental Revenue $ 15,950,524 Expenditures of Program Income
Community Development Block Grants / Entitlement Grants 922,851 Edward Byrne Memorial Justice Assistance Grant Program 18,231 Home Investment Partnership 144,607 Neighborhood Stabilization Program - ARRA 1,016,172
Expenditures occurring in 2014, but revenue deferred until 2015 Brownfields Assessment and Cleanup Cooperative Agreements 1,629 Homeland Security Grant Program 125,164
Expenditures per Schedule of Expenditures of Federal Awards $ 18,179,178
5. American Recovery and Reinvestment Act
The American Recovery and Reinvestment Act of 2009 (ARRA) requires recipients to clearly distinguish ARRA funds from non-ARRA funding. In the schedule, ARRA funds are denoted by the addition of ARRA to the program name.
201

This page left blank intentionally
202

City of Saint Paul, Minnesota STATISTICAL SECTION December 31, 2014
STATISTICAL SECTION
This part of the City of Saint Paul’s Comprehensive Annual Financial Report presents detailed information as a context for understanding what the information in the financial statements, note disclosures, and required supplementary information says about the City’s overall financial health.
Financial Trends These tables contain trend information to help the reader understand how the City’s financial performance and well-being have changed over time.
Revenue Capacity These tables contain information to help the reader assess the factors affecting the City’s ability
to generate its property and sales taxes. Debt Capacity These tables present information to help the reader assess the affordability of the City’s current
levels of outstanding debt and the City’s ability to issue additional debt in the future. Demographic and Economic Information
These tables offer demographic and economic indicators to help the reader understand the environment within which the City’s financial activities take place and to help make comparisons over time and with other governments.
Operating Information These tables contain information about the City’s operations and resources to help the reader
understand how the City’s financial information relates to the services the City provides and the activities it performs.
Sources: Unless otherwise noted, the information in these tables is derived from the Comprehensive Annual Financial Reports for the relevant year. The City implemented GASB Statement No. 54 in 2011; beginning in 2011, information in the table’s present the new fund classifications and new fund balance classifications.
203

This page left blank intentionally
204
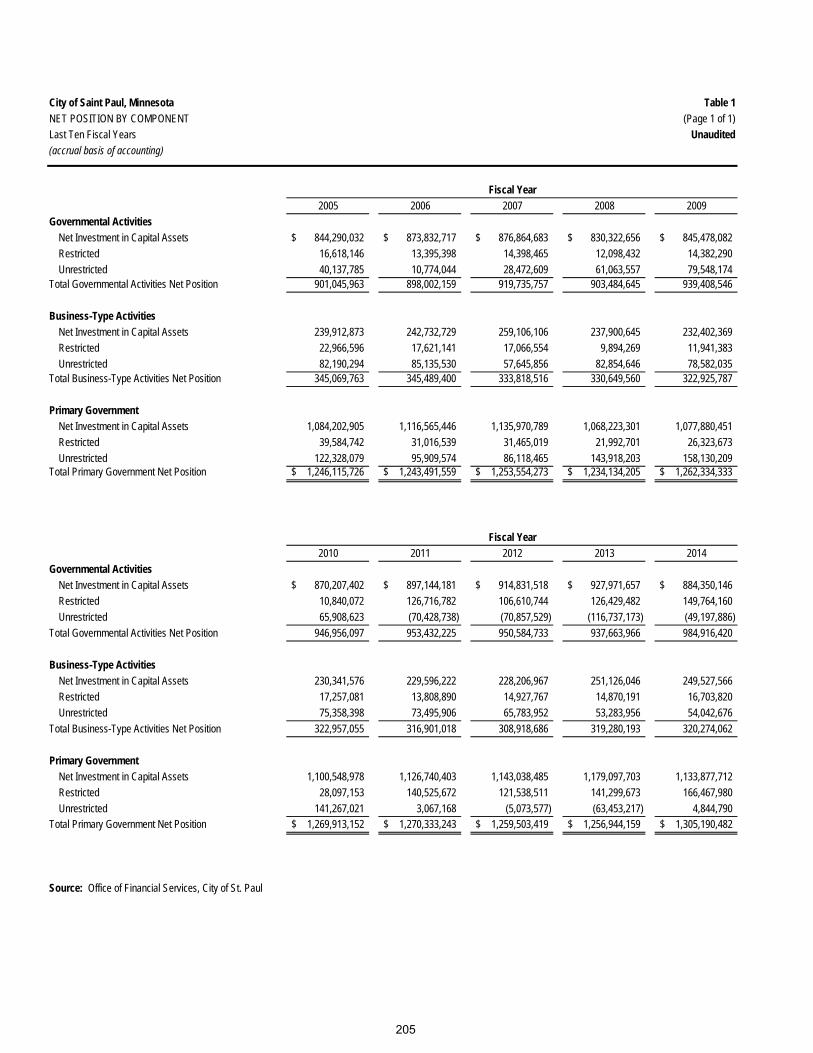
City of Saint Paul, Minnesota Table 1NET POSITION BY COMPONENT (Page 1 of 1)Last Ten Fiscal Years Unaudited(accrual basis of accounting)
2005 2006 2007 2008 2009Governmental Activities
Net Investment in Capital Assets 844,290,032$ 873,832,717$ 876,864,683$ 830,322,656$ 845,478,082$ Restricted 16,618,146 13,395,398 14,398,465 12,098,432 14,382,290 Unrestricted 40,137,785 10,774,044 28,472,609 61,063,557 79,548,174
Total Governmental Activities Net Position 901,045,963 898,002,159 919,735,757 903,484,645 939,408,546
Business-Type ActivitiesNet Investment in Capital Assets 239,912,873 242,732,729 259,106,106 237,900,645 232,402,369 Restricted 22,966,596 17,621,141 17,066,554 9,894,269 11,941,383 Unrestricted 82,190,294 85,135,530 57,645,856 82,854,646 78,582,035
Total Business-Type Activities Net Position 345,069,763 345,489,400 333,818,516 330,649,560 322,925,787
Primary GovernmentNet Investment in Capital Assets 1,084,202,905 1,116,565,446 1,135,970,789 1,068,223,301 1,077,880,451 Restricted 39,584,742 31,016,539 31,465,019 21,992,701 26,323,673 Unrestricted 122,328,079 95,909,574 86,118,465 143,918,203 158,130,209
Total Primary Government Net Position 1,246,115,726$ 1,243,491,559$ 1,253,554,273$ 1,234,134,205$ 1,262,334,333$
2010 2011 2012 2013 2014Governmental Activities
Net Investment in Capital Assets 870,207,402$ 897,144,181$ 914,831,518$ 927,971,657$ 884,350,146$ Restricted 10,840,072 126,716,782 106,610,744 126,429,482 149,764,160 Unrestricted 65,908,623 (70,428,738) (70,857,529) (116,737,173) (49,197,886)
Total Governmental Activities Net Position 946,956,097 953,432,225 950,584,733 937,663,966 984,916,420
Business-Type ActivitiesNet Investment in Capital Assets 230,341,576 229,596,222 228,206,967 251,126,046 249,527,566 Restricted 17,257,081 13,808,890 14,927,767 14,870,191 16,703,820 Unrestricted 75,358,398 73,495,906 65,783,952 53,283,956 54,042,676
Total Business-Type Activities Net Position 322,957,055 316,901,018 308,918,686 319,280,193 320,274,062
Primary GovernmentNet Investment in Capital Assets 1,100,548,978 1,126,740,403 1,143,038,485 1,179,097,703 1,133,877,712 Restricted 28,097,153 140,525,672 121,538,511 141,299,673 166,467,980 Unrestricted 141,267,021 3,067,168 (5,073,577) (63,453,217) 4,844,790
Total Primary Government Net Position 1,269,913,152$ 1,270,333,243$ 1,259,503,419$ 1,256,944,159$ 1,305,190,482$
Source: Office of Financial Services, City of St. Paul
Fiscal Year
Fiscal Year
205

City of Saint Paul, Minnesota Table 2CHANGES IN NET POSITION (Page 1 of 4)Last Ten Fiscal Years Unaudited(accrual basis of accounting)
2005 2006 2007 2008 2009ExpensesGovernmental Activities:
General Government 32,568,766$ 32,449,114$ 35,161,482$ 36,157,432$ 38,193,787$ Public Safety 126,072,685 132,378,948 146,989,216 197,450,400 158,802,550 Highways and Streets 52,527,297 50,495,027 57,723,703 50,888,724 47,107,428 Sanitation 12,443,954 11,583,096 9,996,866 13,846,539 10,864,518 Health 3,892,004 3,635,124 3,985,174 3,961,737 3,504,354 Culture and Recreation 66,028,202 65,013,514 66,125,420 70,427,419 69,515,520 Housing and Economic Development 44,280,480 42,549,059 32,448,793 32,844,847 41,293,685 Interest and Fiscal Charges 26,160,599 30,244,973 28,779,314 25,792,065 22,431,008
Total Governmental Activities Expenses 363,973,987 368,348,855 381,209,968 431,369,163 391,712,850
Business-Type Activities:HRA Penfield & Lofts - - - - - Sewer 25,292,391 26,354,648 30,542,650 31,034,846 33,419,811 Development Loan Programs 7,116,666 17,395,885 14,297,712 6,538,769 5,275,603 Parking 10,507,965 11,494,853 11,256,264 12,593,446 11,822,002 Parks, Recreation and Athletics 5,996,403 4,771,876 4,645,706 4,688,262 4,653,217 Impound Lot 2,479,721 2,402,149 2,858,214 2,562,536 2,563,378 Printing 1,230,610 1,279,068 1,380,224 1,457,730 1,462,918
Total Business-Type Activities Expenses 52,623,756 63,698,479 64,980,770 58,875,589 59,196,929 Total Primary Government Expenses 416,597,743$ 432,047,334$ 446,190,738$ 490,244,752$ 450,909,779$
Program Revenues (See Table 3)Governmental Activities:
Charges for ServicesGeneral Government 8,798,527$ 9,134,829$ 9,166,672$ 15,684,712$ 16,596,690$ Public Safety 27,769,334 26,692,642 31,359,017 35,630,084 34,535,278 Highways and Streets 32,967,651 34,352,127 33,295,801 38,104,316 43,363,311 Sanitation 2,449,595 2,324,880 2,540,827 2,949,035 3,654,476 Health 3,840,090 3,707,070 3,789,730 3,664,531 3,424,173 Culture and Recreation 4,222,197 5,512,146 5,188,558 6,234,474 5,861,240 Housing and Economic Development 8,076,376 8,196,016 7,291,601 4,287,747 5,231,153
Operating Grants and Contributions 32,975,895 29,671,811 35,593,466 73,826,231 43,760,775 Capital Grants and Contributions 26,385,391 16,943,630 15,445,884 21,441,852 19,467,064
Total Governmental Activities Program Revenues 147,485,056 136,535,151 143,671,556 201,822,982 175,894,160
Business-Type Activities:Charges for Services
HRA Penfield & Lofts - - - - - Sewer 41,108,850 40,480,344 42,180,934 43,337,781 46,480,240 Development Loan Programs 5,477,876 7,046,559 427,676 1,164,671 1,748,389 Parking 10,266,046 10,799,884 10,667,979 11,779,690 11,204,743 Parks, Recreation and Athletics 5,007,471 4,253,281 4,136,411 3,723,000 3,772,730 Impound Lot 2,837,692 2,913,522 3,212,873 2,541,781 3,062,620 Printing 1,336,638 1,142,229 1,176,609 1,312,867 1,314,185
Operating Grants and Contributions 487,960 1,316,288 299,973 3,843,369 427,828 Capital Grants and Contributions 900,000 6,239,395 11,412,775 - 74,666
Total Business-Type Activities Program Revenues 67,422,533 74,191,502 73,515,230 67,703,159 68,085,401 Total Primary Government Program Revenues 214,907,589$ 210,726,653$ 217,186,786$ 269,526,141$ 243,979,561$
Fiscal Year
206

City of Saint Paul, Minnesota Table 2CHANGES IN NET POSITION (Page 2 of 4)Last Ten Fiscal Years Unaudited(accrual basis of accounting)
2010 2011 2012 2013 2014ExpensesGovernmental Activities:
General Government 41,026,366$ 45,904,559$ 36,960,488$ 45,897,421$ 69,578,614$ Public Safety 169,630,318 167,319,484 168,819,155 180,335,655 179,068,144 Highways and Streets 53,073,852 58,368,567 72,375,018 73,112,752 95,671,488 Sanitation 10,125,974 3,831,801 4,136,543 4,418,516 5,435,630 Health 3,596,107 3,847,123 3,651,735 3,281,326 3,965,489 Culture and Recreation 65,806,514 74,479,716 76,468,821 78,240,164 69,348,669 Housing and Economic Development 63,429,009 50,411,057 55,918,173 54,376,822 42,338,140 Interest and Fiscal Charges 22,796,044 23,901,340 25,994,941 21,170,331 28,296,493
Total Governmental Activities Expenses 429,484,184 428,063,647 444,324,874 460,832,987 493,702,667
Business-Type Activities:HRA Penfield & Lofts - - - - 4,899,679 Sewer 33,125,516 38,205,270 50,450,819 41,534,100 43,802,699 Development Loan Programs 1,211,512 4,071,255 2,728,591 2,112,059 1,051,049 Parking 11,550,265 11,566,905 11,055,407 11,639,747 11,903,949 Parks, Recreation and Athletics 4,448,793 4,731,832 4,985,210 4,739,628 4,191,870 Impound Lot 3,276,206 2,716,930 2,519,161 3,241,403 3,150,863 Printing 1,347,600 1,435,476 1,394,357 1,404,767 1,434,043
Total Business-Type Activities Expenses 54,959,892 62,727,668 73,133,545 64,671,704 70,434,152 Total Primary Government Expenses 484,444,076$ 490,791,315$ 517,458,419$ 525,504,691$ 564,136,819$
Program Revenues (See Table 3)Governmental Activities:
Charges for ServicesGeneral Government 12,618,406$ 32,363,963$ 7,900,534$ 4,468,536$ 51,972,789$ Public Safety 41,807,497 36,874,281 42,997,003 48,557,047 34,658,084 Highways and Streets 37,934,352 26,740,937 40,924,292 57,350,782 56,098,206 Sanitation 1,427,354 4,590,556 5,381,382 2,030,145 9,339,524 Health 3,386,748 3,464,551 3,351,494 3,248,970 3,207,916 Culture and Recreation 6,605,978 9,152,639 10,956,097 11,095,412 10,134,984 Housing and Economic Development 9,220,024 2,786,648 9,745,681 552,943 9,884,795
Operating Grants and Contributions 76,491,106 52,035,818 51,948,542 65,382,318 60,142,195 Capital Grants and Contributions 10,580,782 20,347,127 31,947,548 18,553,919 20,042,432
Total Governmental Activities Program Revenues 200,072,247 188,356,520 205,152,573 211,240,072 255,480,925
Business-Type Activities:Charges for Services
HRA Penfield & Lofts - - - - 3,758,574 Sewer 46,972,750 45,856,581 51,185,513 48,918,611 49,640,483 Development Loan Programs 504,285 2,478,443 919,137 1,469,932 606,581 Parking 11,394,497 12,140,085 12,186,953 13,485,208 13,669,640 Parks, Recreation and Athletics 3,990,156 3,710,174 4,179,835 4,162,394 2,333,934 Impound Lot 3,305,857 2,668,342 2,456,393 3,171,264 2,874,833 Printing 1,286,696 1,392,178 1,210,644 1,415,416 1,498,360
Operating Grants and Contributions 294,329 519,025 142,559 - - Capital Grants and Contributions - 1,592,481 1,076,050 112,894 -
Total Business-Type Activities Program Revenues 67,748,570 70,357,309 73,357,084 72,735,719 74,382,405 Total Primary Government Program Revenues 267,820,817$ 258,713,829$ 278,509,657$ 283,975,791$ 329,863,330$
Fiscal Year
207
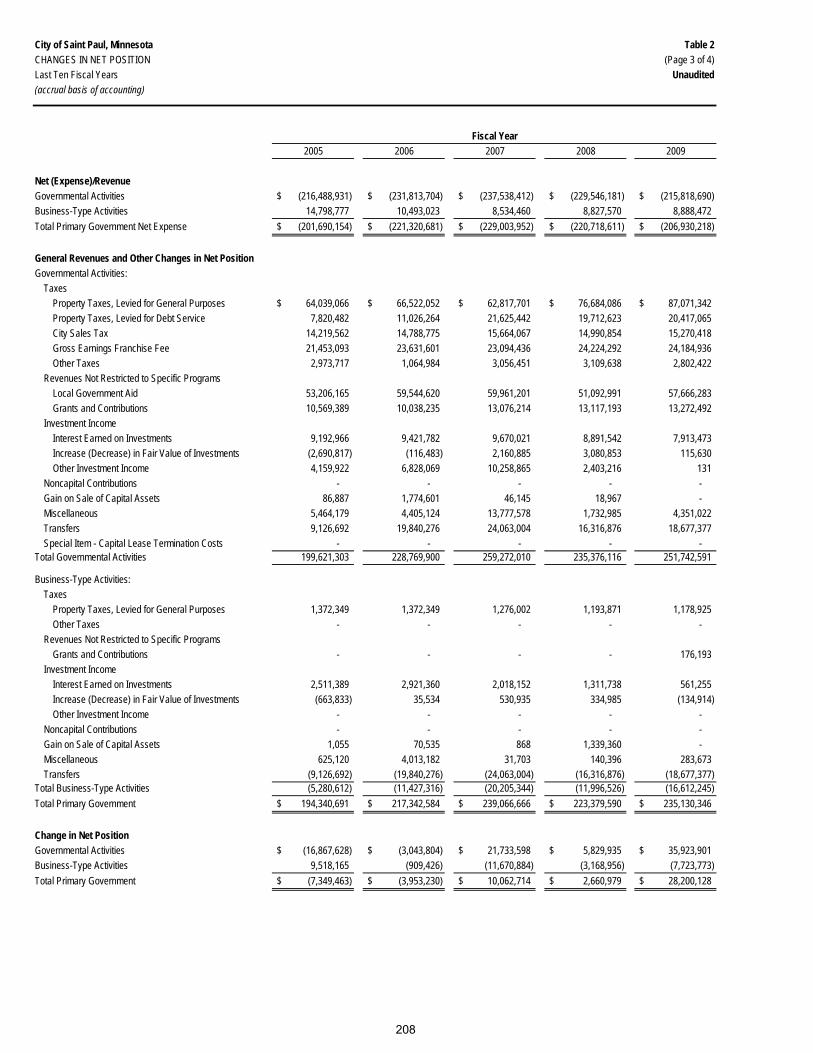
City of Saint Paul, Minnesota Table 2CHANGES IN NET POSITION (Page 3 of 4)Last Ten Fiscal Years Unaudited(accrual basis of accounting)
2005 2006 2007 2008 2009
Net (Expense)/RevenueGovernmental Activities (216,488,931)$ (231,813,704)$ (237,538,412)$ (229,546,181)$ (215,818,690)$ Business-Type Activities 14,798,777 10,493,023 8,534,460 8,827,570 8,888,472 Total Primary Government Net Expense (201,690,154)$ (221,320,681)$ (229,003,952)$ (220,718,611)$ (206,930,218)$
General Revenues and Other Changes in Net PositionGovernmental Activities:
TaxesProperty Taxes, Levied for General Purposes 64,039,066$ 66,522,052$ 62,817,701$ 76,684,086$ 87,071,342$ Property Taxes, Levied for Debt Service 7,820,482 11,026,264 21,625,442 19,712,623 20,417,065 City Sales Tax 14,219,562 14,788,775 15,664,067 14,990,854 15,270,418 Gross Earnings Franchise Fee 21,453,093 23,631,601 23,094,436 24,224,292 24,184,936 Other Taxes 2,973,717 1,064,984 3,056,451 3,109,638 2,802,422
Revenues Not Restricted to Specific ProgramsLocal Government Aid 53,206,165 59,544,620 59,961,201 51,092,991 57,666,283 Grants and Contributions 10,569,389 10,038,235 13,076,214 13,117,193 13,272,492
Investment IncomeInterest Earned on Investments 9,192,966 9,421,782 9,670,021 8,891,542 7,913,473 Increase (Decrease) in Fair Value of Investments (2,690,817) (116,483) 2,160,885 3,080,853 115,630 Other Investment Income 4,159,922 6,828,069 10,258,865 2,403,216 131
Noncapital Contributions - - - - - Gain on Sale of Capital Assets 86,887 1,774,601 46,145 18,967 - Miscellaneous 5,464,179 4,405,124 13,777,578 1,732,985 4,351,022 Transfers 9,126,692 19,840,276 24,063,004 16,316,876 18,677,377 Special Item - Capital Lease Termination Costs - - - - -
Total Governmental Activities 199,621,303 228,769,900 259,272,010 235,376,116 251,742,591
Business-Type Activities:Taxes
Property Taxes, Levied for General Purposes 1,372,349 1,372,349 1,276,002 1,193,871 1,178,925 Other Taxes - - - - -
Revenues Not Restricted to Specific ProgramsGrants and Contributions - - - - 176,193
Investment IncomeInterest Earned on Investments 2,511,389 2,921,360 2,018,152 1,311,738 561,255 Increase (Decrease) in Fair Value of Investments (663,833) 35,534 530,935 334,985 (134,914) Other Investment Income - - - - -
Noncapital Contributions - - - - - Gain on Sale of Capital Assets 1,055 70,535 868 1,339,360 - Miscellaneous 625,120 4,013,182 31,703 140,396 283,673 Transfers (9,126,692) (19,840,276) (24,063,004) (16,316,876) (18,677,377)
Total Business-Type Activities (5,280,612) (11,427,316) (20,205,344) (11,996,526) (16,612,245) Total Primary Government 194,340,691$ 217,342,584$ 239,066,666$ 223,379,590$ 235,130,346$
Change in Net PositionGovernmental Activities (16,867,628)$ (3,043,804)$ 21,733,598$ 5,829,935$ 35,923,901$ Business-Type Activities 9,518,165 (909,426) (11,670,884) (3,168,956) (7,723,773) Total Primary Government (7,349,463)$ (3,953,230)$ 10,062,714$ 2,660,979$ 28,200,128$
Fiscal Year
208

City of Saint Paul, Minnesota Table 2CHANGES IN NET POSITION (Page 4 of 4)Last Ten Fiscal Years Unaudited(accrual basis of accounting)
2010 2011 2012 2013 2014
Net (Expense)/RevenueGovernmental Activities (229,411,937)$ (239,707,127)$ (239,172,301)$ (249,592,915)$ (238,221,742)$ Business-Type Activities 12,788,678 7,629,641 223,539 8,064,015 3,948,253 Total Primary Government Net Expense (216,623,259)$ (232,077,486)$ (238,948,762)$ (241,528,900)$ (234,273,489)$
General Revenues and Other Changes in Net PositionGovernmental Activities:
TaxesProperty Taxes, Levied for General Purposes 91,851,462$ 99,580,962$ 103,894,752$ 98,981,989$ 102,333,637$ Property Taxes, Levied for Debt Service 19,960,415 11,211,822 13,938,044 21,361,771 22,474,817 City Sales Tax 15,219,497 15,620,488 15,940,712 17,034,422 18,314,992 Gross Earnings Franchise Fee 24,716,144 25,184,336 24,645,673 29,570,068 26,022,004 Other Taxes 2,774,260 2,993,560 3,389,255 2,962,513 3,794,188
Revenues Not Restricted to Specific ProgramsLocal Government Aid 50,423,110 54,474,965 53,744,220 53,909,136 60,424,253 Grants and Contributions 4,508,611 3,090,739 511,381 1,067,620 2,172,748
Investment IncomeInterest Earned on Investments 8,588,955 6,731,991 6,815,021 5,284,518 4,795,857 Increase (Decrease) in Fair Value of Investments (1,307,705) 4,957,838 (380,210) (9,426,616) 3,897,685 Other Investment Income 75,077 50,394 483,885 160,732 385,371
Noncapital Contributions - - 168,272 96,719 16,153,683 Gain on Sale of Capital Assets 41,519 120,589 90,794 283,149 67,793 Miscellaneous 4,755,056 7,358,546 9,165,237 7,417,423 14,673,359 Transfers 15,353,087 15,588,454 3,917,773 10,331,230 8,197,576 Special Item - Capital Lease Termination Costs - (781,429) - - -
Total Governmental Activities 236,959,488 246,183,255 236,324,809 239,034,674 283,707,963
Business-Type Activities:Taxes
Property Taxes, Levied for General Purposes 1,258,761 1,242,838 1,438,609 1,738,167 1,753,095 Other Taxes - - - - -
Revenues Not Restricted to Specific ProgramsGrants and Contributions 73,200 73,100 681,284 1,245,094 2,521,342
Investment IncomeInterest Earned on Investments 883,999 1,026,125 790,729 624,323 415,038 Increase (Decrease) in Fair Value of Investments (272,549) 981,947 (308,744) (986,276) 407,941 Other Investment Income - - - - 54,203
Noncapital Contributions - - 301,800 - - Gain on Sale of Capital Assets - 481 4,229 1,777 - Miscellaneous 652,266 128,762 - 6,322 25,858 Transfers (15,353,087) (15,588,454) (3,917,773) (10,331,230) (8,197,576)
Total Business-Type Activities (12,757,410) (12,135,201) (1,009,866) (7,701,823) (3,020,099) Total Primary Government 224,202,078$ 234,048,054$ 235,314,943$ 231,332,851$ 280,687,864$
Change in Net PositionGovernmental Activities 7,547,551$ 6,476,128$ (2,847,492)$ (10,558,241)$ 45,486,221$ Business-Type Activities 31,268 (4,505,560) (786,327) 362,192 928,154 Total Primary Government 7,578,819$ 1,970,568$ (3,633,819)$ (10,196,049)$ 46,414,375$
Source: Office of Financial Services, City of St. Paul
Fiscal Year
209

This page left blank intentionally
210

City of Saint Paul, Minnesota Table 3PROGRAM REVENUES BY FUNCTION/PROGRAM (Page 1 of 1)Last Ten Fiscal Years Unaudited(accrual basis of accounting)
2005 2006 2007 2008 2009Function/ProgramGovernmental Activities:
General Government 10,218,531$ 9,823,498$ 13,552,350$ 20,020,285$ 20,991,904$ Public Safety 31,898,748 32,780,568 36,888,438 80,914,434 39,316,096 Highways and Streets 53,792,724 48,747,880 45,238,729 49,945,497 51,943,438 Sanitation 3,126,471 2,864,932 3,081,003 3,536,602 6,430,358 Health 3,840,090 3,707,070 4,464,730 3,664,531 3,424,173 Culture and Recreation 17,638,863 17,326,036 16,469,733 22,100,295 26,575,821 Housing and Economic Development 26,969,629 21,285,167 23,976,573 21,641,338 27,212,370
Total Governmental Activities 147,485,056 136,535,151 143,671,556 201,822,982 175,894,160
Business-Type Activities:HRA Penfield & Lofts - - - - - Sewer 41,181,561 40,553,055 42,252,361 43,415,342 46,480,240 Development Loan Programs 5,878,284 8,290,136 656,222 4,930,479 2,176,217 Parking 11,166,046 17,035,259 22,080,754 11,779,690 11,204,743 Parks, Recreation and Athletics 5,022,312 4,253,281 4,136,411 3,723,000 3,847,396 Impound Lot 2,837,692 2,913,522 3,212,873 2,541,781 3,062,620 Printing 1,336,638 1,146,249 1,176,609 1,312,867 1,314,185
Total Business-Type Activities 67,422,533 74,191,502 73,515,230 67,703,159 68,085,401 Total Primary Government 214,907,589$ 210,726,653$ 217,186,786$ 269,526,141$ 243,979,561$
2010 2011 2012 2013 2014Function/ProgramGovernmental Activities:
General Government 20,038,070$ 40,162,225$ 8,337,985$ 5,024,416$ 89,661,722$ Public Safety 53,284,221 47,001,067 57,491,668 62,528,797 38,684,379 Highways and Streets 51,725,595 35,787,549 55,701,661 72,297,353 70,915,454 Sanitation 2,025,104 5,246,720 5,981,765 2,720,237 9,390,004 Health 3,386,748 3,464,551 3,556,637 3,248,970 3,207,916 Culture and Recreation 19,612,945 26,367,244 31,493,135 27,304,739 19,366,799 Housing and Economic Development 49,999,564 30,327,164 42,589,722 38,115,560 24,254,651
Total Governmental Activities 200,072,247 188,356,520 205,152,573 211,240,072 255,480,925
Business-Type Activities:HRA Penfield & Lofts - - - - 3,758,574 Sewer 46,972,750 45,856,581 51,328,072 48,918,611 49,640,483 Development Loan Programs 798,614 4,483,449 1,995,187 1,469,932 606,581 Parking 11,394,497 12,246,585 12,186,953 13,503,179 13,669,640 Parks, Recreation and Athletics 3,990,156 3,710,174 4,179,835 4,257,317 2,333,934 Impound Lot 3,305,857 2,668,342 2,456,393 3,171,264 2,874,833 Printing 1,286,696 1,392,178 1,210,644 1,415,416 1,498,360
Total Business-Type Activities 67,748,570 70,357,309 73,357,084 72,735,719 74,382,405 Total Primary Government 267,820,817$ 258,713,829$ 278,509,657$ 283,975,791$ 329,863,330$
Source: Office of Financial Services, City of St. Paul
Fiscal Year
Fiscal Year
211

This page left blank intentionally
212
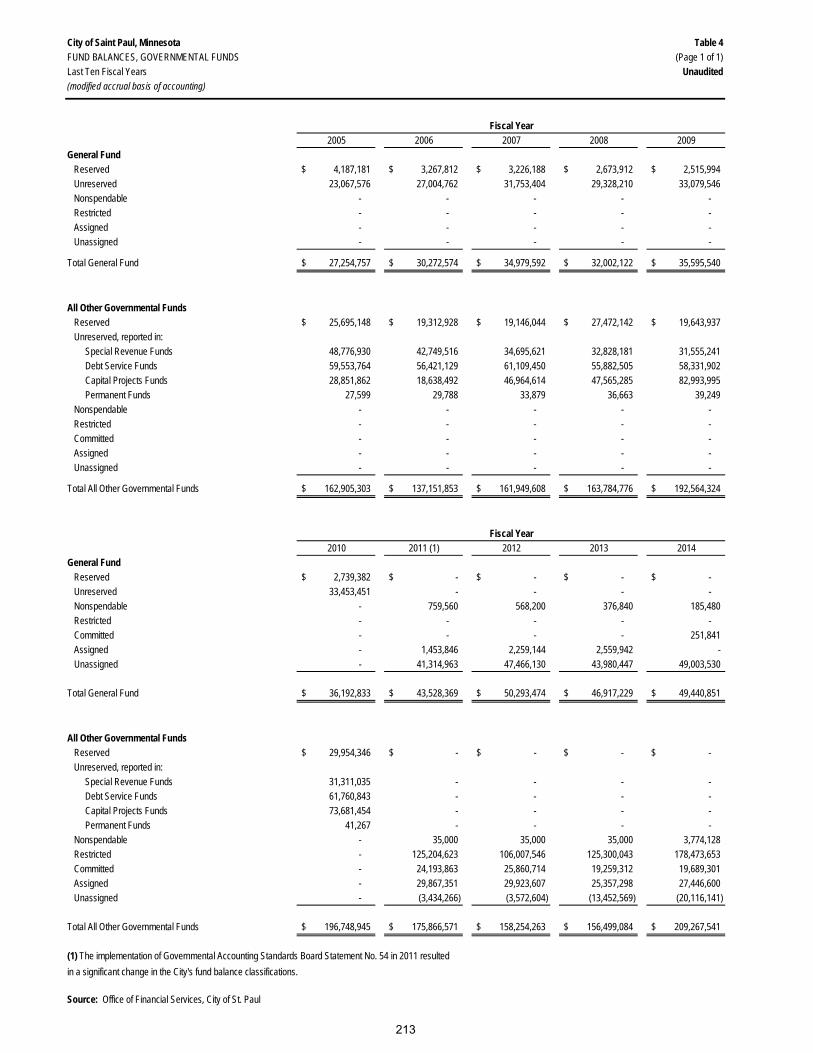
City of Saint Paul, Minnesota Table 4FUND BALANCES, GOVERNMENTAL FUNDS (Page 1 of 1)Last Ten Fiscal Years Unaudited(modified accrual basis of accounting)
2005 2006 2007 2008 2009General Fund Reserved 4,187,181$ 3,267,812$ 3,226,188$ 2,673,912$ 2,515,994$ Unreserved 23,067,576 27,004,762 31,753,404 29,328,210 33,079,546 Nonspendable - - - - - Restricted - - - - - Assigned - - - - - Unassigned - - - - -
Total General Fund 27,254,757$ 30,272,574$ 34,979,592$ 32,002,122$ 35,595,540$
All Other Governmental Funds Reserved 25,695,148$ 19,312,928$ 19,146,044$ 27,472,142$ 19,643,937$ Unreserved, reported in: Special Revenue Funds 48,776,930 42,749,516 34,695,621 32,828,181 31,555,241 Debt Service Funds 59,553,764 56,421,129 61,109,450 55,882,505 58,331,902 Capital Projects Funds 28,851,862 18,638,492 46,964,614 47,565,285 82,993,995 Permanent Funds 27,599 29,788 33,879 36,663 39,249 Nonspendable - - - - - Restricted - - - - - Committed - - - - - Assigned - - - - - Unassigned - - - - -
Total All Other Governmental Funds 162,905,303$ 137,151,853$ 161,949,608$ 163,784,776$ 192,564,324$
2010 2011 (1) 2012 2013 2014General Fund Reserved 2,739,382$ -$ -$ -$ -$ Unreserved 33,453,451 - - - - Nonspendable - 759,560 568,200 376,840 185,480 Restricted - - - - - Committed - - - - 251,841 Assigned - 1,453,846 2,259,144 2,559,942 - Unassigned - 41,314,963 47,466,130 43,980,447 49,003,530
Total General Fund 36,192,833$ 43,528,369$ 50,293,474$ 46,917,229$ 49,440,851$
All Other Governmental Funds Reserved 29,954,346$ -$ -$ -$ -$ Unreserved, reported in: Special Revenue Funds 31,311,035 - - - - Debt Service Funds 61,760,843 - - - - Capital Projects Funds 73,681,454 - - - - Permanent Funds 41,267 - - - - Nonspendable - 35,000 35,000 35,000 3,774,128 Restricted - 125,204,623 106,007,546 125,300,043 178,473,653 Committed - 24,193,863 25,860,714 19,259,312 19,689,301 Assigned - 29,867,351 29,923,607 25,357,298 27,446,600 Unassigned - (3,434,266) (3,572,604) (13,452,569) (20,116,141)
Total All Other Governmental Funds 196,748,945$ 175,866,571$ 158,254,263$ 156,499,084$ 209,267,541$
(1) The implementation of Governmental Accounting Standards Board Statement No. 54 in 2011 resulted in a significant change in the City's fund balance classifications.
Source: Office of Financial Services, City of St. Paul
Fiscal Year
Fiscal Year
213

City of Saint Paul, Minnesota Table 5CHANGES IN FUND BALANCES, GOVERNMENTAL FUNDS (Page 1 of 2)Last Ten Fiscal Years Unaudited(modified accrual basis of accounting)
2005 2006 2007 2008 2009Revenues Taxes 110,585,975$ 116,407,831$ 127,669,696$ 138,151,522$ 148,006,818$ Licenses and Permits 9,754,084 9,826,495 9,788,334 9,432,700 9,820,436 Intergovernmental Revenue 118,926,464 111,171,847 111,488,320 154,481,148 121,877,844 Fees, Sales and Services 49,352,098 43,117,742 44,043,772 51,379,607 50,370,090 Assessments 25,810,255 26,077,643 27,552,914 31,813,576 35,393,640 Investment Income 10,918,511 16,397,951 22,251,695 14,512,236 8,088,868 Interest Earned - Other 849,744 822,865 1,088,037 697,780 744,872 Miscellaneous Revenue 12,615,017 16,111,608 17,779,110 14,800,180 19,584,028 Total Revenues 338,812,148 339,933,982 361,661,878 415,268,749 393,886,596
Expenditures General Government 26,996,262 26,841,779 27,579,527 31,536,943 32,724,318 Public Safety 123,704,393 129,577,904 141,968,273 194,237,619 153,510,163 Highways and Streets 27,768,336 27,237,822 28,972,157 25,381,589 27,495,408 Sanitation 12,444,218 11,583,533 9,983,275 13,835,451 10,869,636 Health 3,840,090 3,707,070 3,789,730 3,664,531 3,424,173 Culture and Recreation 51,276,198 49,343,421 49,818,226 53,969,320 53,031,415 Housing and Economic Development 42,224,229 41,021,924 30,027,891 32,476,088 39,619,296 Miscellaneous 5,734,053 5,144,659 4,148,543 5,922,691 5,788,930 Capital Outlay 40,853,473 49,142,396 39,640,194 50,080,872 45,564,338 Debt Service Principal 37,472,711 32,331,805 34,123,495 34,301,336 31,030,720 Interest 26,282,901 30,093,539 28,610,535 26,360,048 23,150,305 Bond Issuance Costs 434,356 207,549 572,452 596,800 3,162,165 Total Expenditures 399,031,220 406,233,401 399,234,298 472,363,288 429,370,867
Excess (Deficiency) of Revenues Over (Under) Expenditures (60,219,072) (66,299,419) (37,572,420) (57,094,539) (35,484,271)
Other Financing Sources (Uses) Transfers In 97,525,767 100,077,442 120,746,515 103,169,441 114,903,508 Transfers Out (95,073,290) (81,705,358) (100,172,984) (88,802,295) (99,806,393) Bonds Issued 34,045,000 23,500,000 49,925,000 36,070,000 101,820,000 Refunded Bonds (5,005,000) (4,820,000) (3,895,000) - (68,030,000) Capital Lease Refunded - - - - - Premium on Bonds Issued 474,104 215,092 503,955 1,176,969 1,379,176 Discount on Bonds Issued (4,601) - (64,180) (68,326) - Notes Issued - 4,820,000 - - 17,307,525 Premium on Notes Issued - - - - 236,322 Capital Lease 1,000,000 - - 4,391,000 - Capital Contribution - - - - - Sale of Capital Assets 86,196 1,476,610 33,887 15,448 47,100 Total Other Financing Sources (Uses) 33,048,176 43,563,786 67,077,193 55,952,237 67,857,238
Special Items Sale of Public Safety Building - - - - - Capital Lease Termination Costs - - - - -
Net Change in Fund Balance (27,170,896)$ (22,735,633)$ 29,504,773$ (1,142,302)$ 32,372,967$
Debt Service as a percentage of noncapital expenditures: 17.8% 17.5% 17.4% 14.4% 14.1%
Notes: Investment income includes interest on investments, increase (decrease) in fair value of investments and interest earned on securities lending. Refunding Bonds Issued is reported as Bonds Issued
Source: Office of Financial Services, City of St. Paul
Fiscal Year
214

City of Saint Paul, Minnesota Table 5CHANGES IN FUND BALANCES, GOVERNMENTAL FUNDS (Page 2 of 2)Last Ten Fiscal Years Unaudited(modified accrual basis of accounting)
2010 2011 2012 2013 2014Revenues Taxes 154,749,009$ 155,904,709$ 166,679,717$ 171,761,215$ 171,788,361$ Licenses and Permits 10,690,706 11,630,697 10,945,603 11,226,879 11,171,898 Intergovernmental Revenue 126,986,093 121,972,894 128,192,020 131,773,775 130,227,939 Fees, Sales and Services 52,499,448 54,242,682 65,468,681 68,460,049 74,947,716 Assessments 36,951,903 33,955,433 34,839,487 37,148,634 44,945,207 Investment Income 7,270,592 12,763,669 6,652,759 (4,215,087) 8,489,511 Interest Earned - Other 503,822 332,235 417,351 227,468 270,884 Miscellaneous Revenue 20,859,269 15,730,330 19,361,393 25,972,217 31,006,485 Total Revenues 410,510,842 406,532,649 432,557,011 442,355,150 472,848,001
Expenditures General Government 33,322,425 35,359,739 33,829,113 40,279,958 50,668,606 Public Safety 161,774,703 159,037,189 161,201,134 165,727,089 169,075,431 Highways and Streets 29,774,560 36,912,967 43,528,634 43,456,783 52,602,415 Sanitation 10,144,564 3,728,012 4,139,070 4,369,645 5,438,602 Health 3,386,748 3,464,551 3,351,494 3,248,970 3,355,469 Culture and Recreation 52,589,177 55,670,636 58,722,984 59,597,651 58,780,083 Housing and Economic Development 65,867,835 51,503,460 54,721,178 53,487,498 32,616,371 Miscellaneous 6,250,287 6,873,589 7,059,195 6,319,286 - Capital Outlay 40,466,027 53,848,689 47,772,365 59,357,927 93,896,664 Debt Service Principal 36,220,861 35,581,153 57,322,161 33,648,646 81,282,526 Interest 22,916,286 24,350,688 22,472,959 20,837,062 22,717,904 Bond Issuance Costs 886,344 645,714 584,985 412,747 3,031,029 Total Expenditures 463,599,817 466,976,387 494,705,272 490,743,262 573,465,100
Excess (Deficiency) of Revenues Over (Under) Expenditures (53,088,975) (60,443,738) (62,148,261) (48,388,112) (100,617,099)
Other Financing Sources (Uses) Transfers In 113,868,958 108,588,719 91,419,407 113,458,962 135,630,924 Transfers Out (99,791,988) (92,808,494) (86,690,610) (99,425,956) (124,549,538) Bonds Issued 49,655,000 54,075,000 30,815,000 26,625,000 96,120,000 Refunded Bonds (8,285,000) (18,655,000) - - - Capital Lease Refunded - (7,709,500) - - - Premium on Bonds Issued 298,900 1,511,657 2,253,341 - - Discount on Bonds Issued - - - - - Notes Issued - - 7,575,000 - 33,720,000 Premium on Notes Issued - - 428,119 669,673 10,111,266 Capital Lease 2,083,500 - 3,329,543 1,604,500 2,295,600 Capital Contribution - - - 283,149 - Sale of Capital Assets 41,519 515,944 2,171,258 41,359 447,238 Total Other Financing Sources (Uses) 57,870,889 45,518,326 51,301,058 43,256,687 153,775,490
Special Items Sale of Public Safety Building - 2,160,000 - - - Capital Lease Termination Costs - (781,429) - - -
Net Change in Fund Balance 4,781,914$ (13,546,841)$ (10,847,203)$ (5,131,425)$ 53,158,391$
Debt Service as a percentage of noncapital expenditures: 14.0% 14.5% 17.9% 12.6% 21.7%
Notes: Investment income includes interest on investments, increase (decrease) in fair value of investments and interest earned on securities lending. Refunding Bonds Issued is reported as Bonds Issued
Source: Office of Financial Services, City of St. Paul
Fiscal Year
215
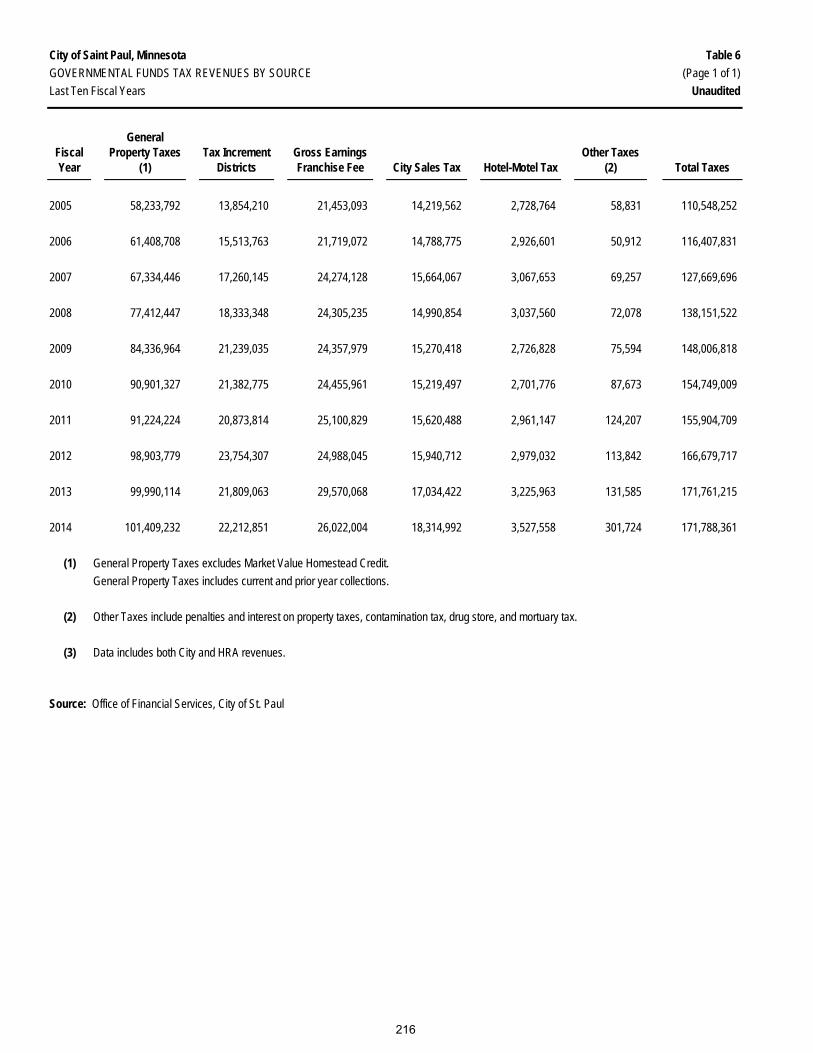
City of Saint Paul, Minnesota Table 6GOVERNMENTAL FUNDS TAX REVENUES BY SOURCE (Page 1 of 1)Last Ten Fiscal Years Unaudited
Fiscal Year
General Property Taxes
(1)Tax Increment
DistrictsGross Earnings Franchise Fee City Sales Tax Hotel-Motel Tax
Other Taxes (2) Total Taxes
2005 58,233,792 13,854,210 21,453,093 14,219,562 2,728,764 58,831 110,548,252
2006 61,408,708 15,513,763 21,719,072 14,788,775 2,926,601 50,912 116,407,831
2007 67,334,446 17,260,145 24,274,128 15,664,067 3,067,653 69,257 127,669,696
2008 77,412,447 18,333,348 24,305,235 14,990,854 3,037,560 72,078 138,151,522
2009 84,336,964 21,239,035 24,357,979 15,270,418 2,726,828 75,594 148,006,818
2010 90,901,327 21,382,775 24,455,961 15,219,497 2,701,776 87,673 154,749,009 2011 91,224,224 20,873,814 25,100,829 15,620,488 2,961,147 124,207 155,904,709 2012 98,903,779 23,754,307 24,988,045 15,940,712 2,979,032 113,842 166,679,717 2013 99,990,114 21,809,063 29,570,068 17,034,422 3,225,963 131,585 171,761,215 2014 101,409,232 22,212,851 26,022,004 18,314,992 3,527,558 301,724 171,788,361
(1) General Property Taxes excludes Market Value Homestead Credit.General Property Taxes includes current and prior year collections.
(2) Other Taxes include penalties and interest on property taxes, contamination tax, drug store, and mortuary tax.
(3) Data includes both City and HRA revenues.
Source: Office of Financial Services, City of St. Paul
216

City of Saint Paul, Minnesota Table 7ESTIMATED MARKET VALUE, TAXABLE MARKET VALUE, AND NET TAX CAPACITY OF TAXABLE PROPERTY (Page 1 of 1)Last Ten Fiscal Years Unaudited
Levy Year/Payable Year 2004/05 2005/06 2006/07 2007/08 2008/09 2009/10 2010/11 2011/12 2012/13 2013/14
Estimated Market Value
Residential $13,647,894,000 $14,894,768,200 $16,156,594,900 $16,201,368,400 $15,154,428,866 $14,009,965,414 $12,485,045,818 $11,994,675,600 $11,111,959,900 $11,036,508,500 Multiple Dwelling 2,699,138,000 2,904,292,000 3,120,269,200 3,213,988,500 3,120,576,047 2,963,483,753 3,400,646,842 3,330,026,500 3,267,040,600 3,396,142,300 Commercial & Industrial 2,969,533,500 3,204,930,500 3,712,446,900 4,174,883,400 4,349,570,287 4,303,920,433 3,950,373,208 3,803,442,800 3,659,076,500 3,635,076,700 Agricultural 1,732,000 1,777,500 3,414,200 4,036,400 1,937,700 740,000 4,028,148 5,042,500 5,333,000 4,251,400 Personal Property 310,928,500 310,928,500 292,727,800 355,157,100 347,851,300 348,817,500 354,522,183 306,810,900 345,717,700 353,472,300
Total Estimated Market Value $19,629,226,000 $21,316,696,700 $23,285,453,000 $23,949,433,800 $22,974,364,200 $21,626,927,100 $20,194,616,199 $19,439,998,300 $18,389,127,700 $18,425,451,200
Taxable Market Value
Residential $10,660,325,500 $12,374,904,400 $14,220,552,300 $15,522,080,800 $14,983,867,166 $13,892,665,114 $12,403,748,405 $10,824,636,500 $9,922,478,200 $9,866,331,000 Multiple Dwelling 2,468,144,900 2,676,404,300 2,906,107,700 3,117,013,200 3,120,576,047 2,963,483,753 3,397,551,861 3,265,355,000 3,202,891,000 3,332,922,400 Commercial & Industrial 2,963,339,300 3,187,251,500 3,682,507,800 4,131,344,300 4,349,570,287 4,303,920,433 3,909,048,736 3,763,554,800 3,621,468,300 3,608,273,700 Agricultural 964,900 1,106,400 1,334,400 1,642,400 1,937,700 740,000 727,799 1,749,000 2,047,700 765,100 Personal Property 310,928,500 310,928,500 292,727,800 354,217,700 346,961,800 348,817,500 378,983,400 306,810,900 345,717,700 353,557,800
Total Taxable Market Value $16,403,703,100 $18,550,595,100 $21,103,230,000 $23,126,298,400 $22,802,913,000 $21,509,626,800 $20,090,060,201 $18,162,106,200 $17,094,602,900 $17,161,850,000
Net Tax Capacity
Residential $106,889,252 $124,407,717 $143,116,934 $141,514,557 $151,063,704 $140,594,960 $125,429,618 $109,196,525 $89,913,342 $99,546,611 Multiple Dwelling 30,817,187 32,370,855 35,105,250 52,520,291 37,287,678 35,344,853 39,244,934 37,617,097 47,032,744 38,391,778 Commercial & Industrial 57,166,280 61,752,920 71,485,269 80,449,434 84,794,817 83,883,251 76,077,098 73,141,486 70,320,861 70,071,386 Agricultural 9,154 10,496 13,344 16,424 12,114 7,400 7,283 17,490 20,477 7,651 Personal Property 6,177,516 5,838,295 5,798,667 7,029,365 6,885,304 5,850,737 7,032,252 6,062,185 6,816,827 6,971,319
201,059,389 224,380,283 255,519,464 281,530,071 280,043,617 265,681,201 247,791,185 226,034,783 214,104,251 214,988,745Less: Tax Increment District Captured Net Tax Capacity (17,770,800) (18,233,377) (22,973,298) (27,910,887) (25,975,787) (25,429,982) (22,828,278) (22,376,701) (20,826,315) (20,796,378)
Fiscal Disparity Contribution from Saint Paul (16,383,446) (17,074,983) (19,319,145) (23,361,910) (26,324,251) (30,378,751) (29,483,436) (25,586,524) (24,033,254) (22,810,734) Distribution to Saint Paul 35,670,395 36,114,648 39,773,037 45,318,589 51,562,722 56,480,186 55,940,464 51,142,890 47,184,140 47,390,891
Total Net Tax Capacity $202,575,538 $225,186,571 $253,000,058 $275,575,863 $279,306,301 $266,352,654 $251,419,935 $229,214,448 $216,428,822 $218,772,524
Direct Tax Rate
General Revenue 22.019% 20.767% 19.286% 21.111% 21.839% 25.361% 26.201% 34.068% 34.745% 33.261% Bonded Debt 3.210% 2.924% 3.623% 3.006% 3.942% 3.762% 3.948% 4.366% 4.711% 5.439% Library Revenue 4.978% 4.667% 4.681% 5.502% 5.834% 6.522% 7.059% 6.405% 7.978% 7.367%
Total Direct Tax Rate 30.207% 28.358% 27.590% 29.619% 31.615% 35.645% 37.208% 44.839% 47.434% 46.067%
Total Net Tax Capacity as a Percentage of Total Estimated Market Value 1.03% 1.06% 1.09% 1.15% 1.22% 1.23% 1.24% 1.18% 1.18% 1.19%
Notes: Net tax capacity is the amount to which the local tax rate is applied. Tax Capacity is calculated by applying a statutory formula to the taxable market value of the property.
Source: Ramsey County Department of Property Records and Revenue
217

City of Saint Paul, Minnesota Table 8PROPERTY TAX RATES AND TAX LEVIES (Certified to County) (Page 1 of 1)DIRECT AND OVERLAPPING GOVERNMENTS UnauditedLast Ten Fiscal Years
Housing andFiscal City of School Redevelopment Port Ramsey SpecialYear Saint Paul District 625 Authority Authority County Districts Total
TAX CAPACITY RATES (PER $100 OF ADJUSTED TAX CAPACITY VALUE)2005 30.207 28.192 (1) 0.440 1.112 45.689 4.891 110.5312006 28.358 29.368 (1) 0.434 1.016 43.414 6.140 108.7302007 27.590 25.415 (1) 0.414 1.064 41.843 7.247 103.5732008 29.619 23.413 (1) 0.447 1.097 41.043 6.687 102.3062009 31.615 22.698 (1) 0.900 1.390 43.057 6.805 106.4652010 35.642 28.507 (1) 1.272 1.692 46.474 7.232 120.8192011 37.208 35.057 (1) 1.262 1.802 50.668 8.119 (2) 134.1162012 44.157 40.109 (1) 1.418 1.723 56.801 11.914 (2) 156.1222013 46.585 42.238 (1) 1.482 1.396 60.456 12.947 (2) 165.1042014 45.242 46.665 (1) 1.445 1.278 58.920 9.037 (2) 162.587
TAX LEVIES 2005 62,615,088$ 58,759,418$ (1) 898,986$ 2,317,175$ 206,554,708$ 12,155,935$ 343,301,310$ 2006 64,532,906 66,044,888 (1) 979,895 2,316,175 217,455,420 26,689,855 378,019,1392007 70,062,561 66,206,297 (1) 1,057,307 2,716,050 230,921,903 35,621,246 406,585,3642008 80,530,837 65,646,331 (1) 1,215,903 3,025,000 242,063,050 35,974,130 428,455,2512009 87,142,264 63,980,783 (1) 2,278,148 3,697,000 253,013,187 36,194,862 446,306,2442010 92,497,521 72,824,376 (1) 3,178,148 4,299,700 259,971,049 36,442,998 469,213,7922011 92,497,520 84,635,854 (1) 3,178,148 4,456,700 267,120,252 39,452,074 (2) 491,340,5482012 97,809,058 89,686,469 (1) 3,178,148 3,855,700 271,794,856 40,305,075 (2) 506,629,3062013 99,396,152 90,587,829 (1) 3,178,148 4,652,700 276,538,351 41,253,232 (2) 515,606,4122014 99,396,152 100,175,041 (1) 3,178,148 4,646,700 276,538,351 41,604,411 (2) 525,538,803
(1) Voters approved an excess operating levy for School District 625 adding a market value based levy in addition to the tax capacity levy beginning year 2004. The 2005 market based tax rate and levy were 0.06741% and $14,168,313. The 2006 market based tax rate and levy were 0.09859% and $20,618,213. The 2007 market based tax rate and levy were 0.13842% and $32,947,644. The 2008 market based tax rate and levy were 0.13505% and $37,281,068. The 2009 market based tax rate and levy were 0.15885% and $42,998,853. The 2010 market based tax rate and levy were 0.13989% and $38,867,680. The 2011 market based tax rate and levy were 0.14581% and $37,108,684. The 2012 market based tax rate and levy were 0.14951% and $36,386,107. The 2013 market based tax rate and levy were 0.19564% and $43,131,511. The 2014 market based tax rate and levey were 0.13684% and $34,881,492.
(2) Starting in 2011 the Tax Capacity and Tax Levies for the Metropolitan Watershed District has been included in Special Districts.
Note: In addition to the above, the following tax rates and tax levies were applied against portions of Saint Paul.
Tax Increment Districts Tax Rates
Fiscal Without IncludingYear METRO W/S Dist METRO W/S Dist Tax Levies
2005 110.531 112.049 19,580,532$ 2006 108.730 110.554 19,733,859 2007 103.573 105.224 23,710,560 2008 102.306 103.630 28,448,139 2009 106.465 107.822 27,268,157 2010 120.819 122.407 28,809,530 2011 134.116 136.659 27,278,203 2012 156.122 159.165 27,580,222 2013 165.104 165.104 25,932,396 2014 162.587 167.086 25,973,141
Source: Ramsey County Department of Property Records and Revenue
218

City of Saint Paul, Minnesota Table 9PRINCIPAL PROPERTY TAXPAYERS (Page 1 of 1)Current Year and Nine Years Ago Unaudited
Percentage Percentage Taxable of Total City Taxable of Total CityCapacity Capacity Capacity Capacity
Taxpayer Value Rank Value Value Rank Value
Xcel Energy $5,915,102 1 2.70% 4,501,318 1 2.22%
Minnesota Mutual Life Insurance (Corporate Headquarters) 2,008,490 2 0.92% 1,679,904 2 0.83%
St. Paul Tower LP (World Trade Center) 1,417,250 3 0.65% 749,374 8 0.37%
Traveler's Insurance (Corporate Headquarters) 1,259,926 4 0.58% - - -
U.S. Bank Corp. Property & U.S. Bancorp 1,154,250 5 0.53% 1,384,533 3 0.68%
BNSF Railway Co. 1,149,876 6 0.53% - - -
Behringer Harvard L C LLC (Lawson Software) 905,034 7 0.41% 830,500 7 0.41%
CSM Investors, Inc. 904,326 8 0.41% - - -
Ford Motor Company 1) 774,386 9 0.35% 641,100 10 0.32%
Court International LLC 685,194 10 0.31% - - -
St. Paul Companies - - - 1,006,866 4 0.50%
3M - - - 938,216 5 0.46%
Stuart Companies - - - 920,902 6 0.45%
Health East - - - 649,798 9 0.32%
$16,173,834 7.39% 13,302,511 6.56%
1) Ford Motor Company closed its Highland Park plant in December 2011. Ford Motor Company has begun the decommissioning process for the plant and the environmental cleanup of this plant site began in 2013 for possible future redevelopment.
Source: Ramsey County Department of Property Records and Revenue. (Unaudited)
2014 2005
219
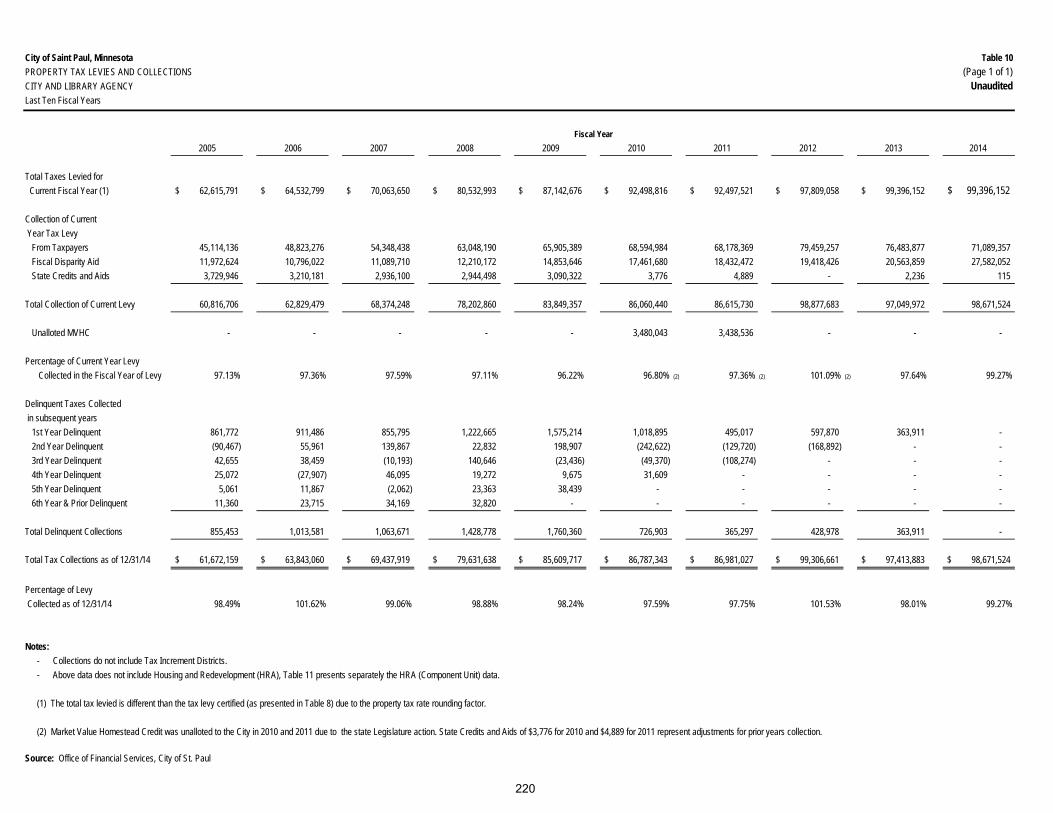
City of Saint Paul, Minnesota Table 10PROPERTY TAX LEVIES AND COLLECTIONS (Page 1 of 1)CITY AND LIBRARY AGENCY UnauditedLast Ten Fiscal Years
2005 2006 2007 2008 2009 2010 2011 2012 2013 2014
Total Taxes Levied for Current Fiscal Year (1) 62,615,791$ 64,532,799$ 70,063,650$ 80,532,993$ 87,142,676$ 92,498,816$ 92,497,521$ 97,809,058$ 99,396,152$ 99,396,152$
Collection of Current Year Tax Levy From Taxpayers 45,114,136 48,823,276 54,348,438 63,048,190 65,905,389 68,594,984 68,178,369 79,459,257 76,483,877 71,089,357 Fiscal Disparity Aid 11,972,624 10,796,022 11,089,710 12,210,172 14,853,646 17,461,680 18,432,472 19,418,426 20,563,859 27,582,052 State Credits and Aids 3,729,946 3,210,181 2,936,100 2,944,498 3,090,322 3,776 4,889 - 2,236 115
Total Collection of Current Levy 60,816,706 62,829,479 68,374,248 78,202,860 83,849,357 86,060,440 86,615,730 98,877,683 97,049,972 98,671,524
Unalloted MVHC - - - - - 3,480,043 3,438,536 - - -
Percentage of Current Year LevyCollected in the Fiscal Year of Levy 97.13% 97.36% 97.59% 97.11% 96.22% 96.80% (2) 97.36% (2) 101.09% (2) 97.64% 99.27%
Delinquent Taxes Collected in subsequent years 1st Year Delinquent 861,772 911,486 855,795 1,222,665 1,575,214 1,018,895 495,017 597,870 363,911 - 2nd Year Delinquent (90,467) 55,961 139,867 22,832 198,907 (242,622) (129,720) (168,892) - - 3rd Year Delinquent 42,655 38,459 (10,193) 140,646 (23,436) (49,370) (108,274) - - - 4th Year Delinquent 25,072 (27,907) 46,095 19,272 9,675 31,609 - - - - 5th Year Delinquent 5,061 11,867 (2,062) 23,363 38,439 - - - - - 6th Year & Prior Delinquent 11,360 23,715 34,169 32,820 - - - - - -
Total Delinquent Collections 855,453 1,013,581 1,063,671 1,428,778 1,760,360 726,903 365,297 428,978 363,911 -
Total Tax Collections as of 12/31/14 61,672,159$ 63,843,060$ 69,437,919$ 79,631,638$ 85,609,717$ 86,787,343$ 86,981,027$ 99,306,661$ 97,413,883$ 98,671,524$
Percentage of Levy Collected as of 12/31/14 98.49% 101.62% 99.06% 98.88% 98.24% 97.59% 97.75% 101.53% 98.01% 99.27%
Notes:- Collections do not include Tax Increment Districts.- Above data does not include Housing and Redevelopment (HRA), Table 11 presents separately the HRA (Component Unit) data. (1) The total tax levied is different than the tax levy certified (as presented in Table 8) due to the property tax rate rounding factor.
(2) Market Value Homestead Credit was unalloted to the City in 2010 and 2011 due to the state Legislature action. State Credits and Aids of $3,776 for 2010 and $4,889 for 2011 represent adjustments for prior years collection.
Source: Office of Financial Services, City of St. Paul
Fiscal Year
220
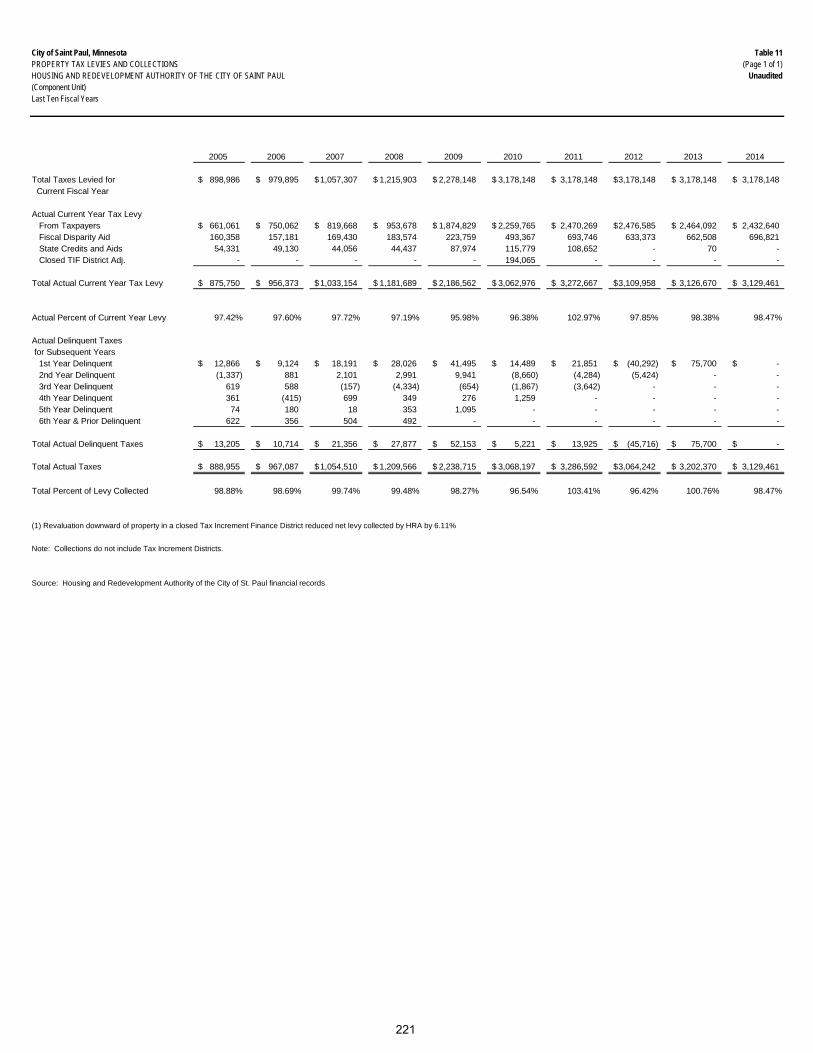
City of Saint Paul, Minnesota Table 11PROPERTY TAX LEVIES AND COLLECTIONS (Page 1 of 1)HOUSING AND REDEVELOPMENT AUTHORITY OF THE CITY OF SAINT PAUL Unaudited(Component Unit)Last Ten Fiscal Years
2005 2006 2007 2008 2009 2010 2011 2012 2013 2014
Total Taxes Levied for 898,986$ 979,895$ 1,057,307$ 1,215,903$ 2,278,148$ 3,178,148$ 3,178,148$ 3,178,148$ 3,178,148$ 3,178,148$ Current Fiscal Year
Actual Current Year Tax Levy From Taxpayers 661,061$ 750,062$ 819,668$ 953,678$ 1,874,829$ 2,259,765$ 2,470,269$ 2,476,585$ 2,464,092$ 2,432,640$ Fiscal Disparity Aid 160,358 157,181 169,430 183,574 223,759 493,367 693,746 633,373 662,508 696,821 State Credits and Aids 54,331 49,130 44,056 44,437 87,974 115,779 108,652 - 70 - Closed TIF District Adj. - - - - - 194,065 - - - -
Total Actual Current Year Tax Levy 875,750$ 956,373$ 1,033,154$ 1,181,689$ 2,186,562$ 3,062,976$ 3,272,667$ 3,109,958$ 3,126,670$ 3,129,461$
Actual Percent of Current Year Levy 97.42% 97.60% 97.72% 97.19% 95.98% 96.38% 102.97% 97.85% 98.38% 98.47%
Actual Delinquent Taxes for Subsequent Years 1st Year Delinquent 12,866$ 9,124$ 18,191$ 28,026$ 41,495$ 14,489$ 21,851$ (40,292)$ 75,700$ -$ 2nd Year Delinquent (1,337) 881 2,101 2,991 9,941 (8,660) (4,284) (5,424) - - 3rd Year Delinquent 619 588 (157) (4,334) (654) (1,867) (3,642) - - - 4th Year Delinquent 361 (415) 699 349 276 1,259 - - - - 5th Year Delinquent 74 180 18 353 1,095 - - - - - 6th Year & Prior Delinquent 622 356 504 492 - - - - - -
Total Actual Delinquent Taxes 13,205$ 10,714$ 21,356$ 27,877$ 52,153$ 5,221$ 13,925$ (45,716)$ 75,700$ -$
Total Actual Taxes 888,955$ 967,087$ 1,054,510$ 1,209,566$ 2,238,715$ 3,068,197$ 3,286,592$ 3,064,242$ 3,202,370$ 3,129,461$
Total Percent of Levy Collected 98.88% 98.69% 99.74% 99.48% 98.27% 96.54% 103.41% 96.42% 100.76% 98.47%
(1) Revaluation downward of property in a closed Tax Increment Finance District reduced net levy collected by HRA by 6.11%
Note: Collections do not include Tax Increment Districts.
Source: Housing and Redevelopment Authority of the City of St. Paul financial records
221

City of Saint Paul, Minnesota Table 12OUTSTANDING DEBT BY TYPE AND PER CAPITA (Page 1 of 1)Last Ten Fiscal Years Unaudited
2005 2006 2007 2008 2009
Governmental Activities
General Obligation Bonds 159,285,000$ 160,745,000$ 156,315,000$ 162,340,000$ 169,845,000$
Revenue Bonds 181,684,780 170,365,923 190,793,740 189,451,560 187,729,669
Revenue Notes 53,424,359 55,770,626 52,859,580 51,124,864 77,427,232
Capital Leases 23,077,102 21,553,366 20,212,728 23,239,158 22,299,122
Total - Governmental Activities 417,471,241 408,434,915 420,181,048 426,155,582 457,301,023
Business-Type Activities
General Obligation Bonds 39,485,000 37,980,000 36,320,000 34,530,000 29,350,000
Limited Tax Bonds - - - - -
Revenue Bonds 104,940,000 94,080,000 82,995,000 96,825,000 100,595,000
Revenue Notes 18,914,589 16,136,499 15,122,621 14,071,786 14,558,630
Capital Leases 621,697 350,434 71,116 - -
Total - Business-Type Activities 163,961,286 148,546,933 134,508,737 145,426,786 144,503,630
Total Primary Government 581,432,527$ 556,981,848$ 554,689,785$ 571,582,368$ 601,804,653$
Per Capita (1) 2,023.18$ 1,943.28$ 1,928.22$ 1,984.28$ 2,089.20$
Percentage of Personal Income (2) 9.44% 8.64% 8.36% 7.84% 8.25%
2010 2011 2012 2013 2014
Governmental Activities
General Obligation Bonds 182,800,000$ 206,065,000$ 194,755,000$ 201,925,000$ 234,692,349$
Revenue Bonds 187,446,305 170,311,657 161,298,862 153,890,000 159,550,555
Revenue Notes 71,896,669 67,740,670 71,130,920 67,164,715 90,629,942
Capital Leases 22,029,755 11,608,850 12,835,276 12,622,008 13,285,662
Total - Governmental Activities 464,172,729 455,726,177 440,020,059 435,601,723 498,158,508
Business-Type Activities
General Obligation Bonds 28,055,000 26,480,000 24,875,000 23,235,000 21,600,438
Limited Tax Bonds 7,855,000.00 7,855,000 7,855,000 7,855,000 7,755,000
Revenue Bonds 99,840,000 104,310,000 108,115,000 109,725,000 114,010,281
Revenue Notes 12,701,769 11,424,620 10,302,158 9,142,769 7,946,082
Capital Leases - - - - -
Total - Business-Type Activities 148,451,769 150,069,620 151,147,158 149,957,769 151,311,801
Total Primary Government 612,624,498$ 605,795,797$ 591,167,217$ 585,559,492$ 649,470,309$
Per Capita (1) 2,130.86$ 2,125.09$ 2,073.78$ 2,024.27$ 2,088.19$
Percentage of Personal Income (2) 8.82% 8.48% 8.32% 8.17% 8.00%
Notes: Details regarding the city's outstanding debt can be found in the notes to the financial statements (1) See Table 17 for population data. The ratio is calculated using population for the prior calendar year. (2) See Table 17 for personal income data. The percentage is calculated using personal income for the prior calendar year.
Source: Office of Financial Services, City of St. Paul
Fiscal Year
Fiscal Year
222

City of Saint Paul, Minnesota Table 13RATIOS OF NET GENERAL BONDED DEBT OUTSTANDING (Page 1 of 1)Last Ten Fiscal Years Unaudited
2005 2006 2007 2008 2009
Population (1) 287,385 286,620 287,669 288,055 287,501
Taxable Assessed Value/ 202,575,538$ 225,186,571$ 253,000,058$ 275,575,863$ 279,306,301$ Net Tax Capacity (2)
Governmental General Obligation Bonds and Notes 417,471,241 408,434,915 420,181,048 426,155,582 457,301,023 Business-type General Obligation Bonds and Notes 163,961,286 148,546,933 134,508,737 145,426,786 144,503,630Less General Debt Service Fund 24,150,246 19,753,773 18,960,941 17,962,901 18,021,164Less G.O. Special Assessment - Streets Debt Service Fund - property taxes portion - - - - - Net General Bonded Debt 557,282,281$ 537,228,075$ 535,728,844$ 553,619,467$ 583,783,489$
Percentage of Net General Bonded Debt to Taxable Assessed Value/Net Tax Capacity 275.10% 238.57% 211.75% 200.90% 209.01%
Net General Bonded Debt per Capita 1,939.15$ 1,874.36$ 1,862.31$ 1,921.92$ 2,030.54$
2010 2011 2012 2013 2014
Population (1) 285,068 285,068 286,367 289,270 294,873
Taxable Assessed Value/ 266,352,654$ 251,419,936 229,214,448 216,428,822 218,772,524 Net Tax Capacity (2)
Governmental General Obligation Bonds and Notes 464,172,729 455,726,177 440,020,059 435,601,723 484,872,846 Business-type General Obligation Bonds and Notes 148,451,769 150,069,620 151,147,158 149,957,769 151,311,801Less General Debt Service Fund (3) 19,216,786 17,920,364 17,193,224 31,531,582 65,002,218Less G.O. Special Assessment - Streets Debt Service Fund - property taxes portion 6,588,074 10,249,606 6,607,586 6,904,331 - Net General Bonded Debt 586,819,638$ 577,625,827$ 567,366,407$ 547,123,579$ 571,182,429$
Percentage of Net General Bonded Debt to Taxable Assessed Value/Net Tax Capacity 220.32% 229.75% 247.53% 252.80% 261.09%
Net General Bonded Debt per Capita 2,058.53$ 2,026.27$ 1,981.26$ 1,891.39$ 1,937.05$
(1) 2005 - 2009 and 2012 - 2014 data based on Metropolitan Council estimates. 2010 - 2011 data is from 2010 US Census results.
(2) Taxable Assessed Value/Net Tax Capacity is net of tax increment reductions. See Table 7 for Net Tax Capacity.
(3) Due to changes in the fund structure the Debt Service Fund balance for Property tax & Special assessment supported debt is not available. The total City Governmental Funds debt service fund balance is displayed for 2014.
Source: Office of Financial Services, City of St. Paul
Fiscal Year
Fiscal Year
223

City of Saint Paul, Minnesota Table 14DIRECT, OVERLAPPING AND UNDERLYING GOVERNMENTAL ACTIVITIES DEBT (Page 1 of 1)December 31, 2014 Unaudited
PercentageGeneral Obligation Applicable City of
Governmental to City of Saint Paul'sDebt Outstanding Saint Paul Share of Debt
Direct DebtCity of Saint Paul 498,158,508$ 100.00% 498,158,508$
Overlapping DebtCounty of Ramsey 131,605,000 48.82% 64,249,561 Metropolitan Council 220,775,000 7.29% 16,094,498 352,380,000 80,344,059
Total Direct and Overlapping Debt 850,538,508$ 578,502,567$
Underlying DebtPort Authority of Saint Paul 30,100,000$ 100.00% 30,100,000$ Independent School District #625 362,056,172 100.00% 362,056,172
392,156,172 392,156,172
Total Direct, Overlapping and Underlying Debt 1,242,694,680$ 970,658,739$
Overlapping authorities - Ramsey County and Metropolitan Council - are those that coincide with the geographic boundaries of the City. Underlying authorities - Port Authority of Saint Paul and Independent School District # 625 - are contained within the City. This schedule shows the portion of the outstanding and underlying debt burden for the City of Saint Paul.Applicable percentage for Saint Paul is Saint Paul's net tax capacity divided by net tax capacity of overlapping authority.100% of underlying debt burden is applicable to the City.
Source: Ramsey County Department of Property Records and Revenue
224

City of Saint Paul, Minnesota Table 15LEGAL DEBT MARGIN INFORMATION (Page 1 of 1)Last Ten Fiscal Years Unaudited
2005 2006 2007 2008 2009Estimated Market Values
Real Property Value 21,005,768,200$ -$ -$ -$ -$ Personal Property Value 310,928,500 - - - -
Estimated Market Values for Debt Limit Computation 21,316,696,700 - - - -
Debt limit (3 1/3% of assessed value) 710,555,846 - - - -
Taxable Market ValuesReal Property Value - 18,239,666,600 20,810,502,200 22,772,080,700 22,455,951,200 Personal Property Value - 310,928,500 292,727,800 354,217,700 346,961,800
Taxable Market Values for Debt Limit Computation - 18,550,595,100 21,103,230,000 23,126,298,400 22,802,913,000
Debt limit (3 1/3% of assessed value) - 618,353,170 703,441,000 770,876,613 760,097,100
Debt applicable to limitGeneral Obligation Bonds 198,770,000 198,725,000 192,635,000 196,870,000 199,195,000 Limited Tax Bonds - - - - - Revenue Bonds 286,624,780 264,445,923 273,788,740 286,276,560 288,324,669 Revenue Notes - - 16,299,464 16,601,903 29,221,233 Capital Leases - - 14,478,157 16,118,250 15,922,362 Less: Amount allowable under
MSA 475.53 Subd. 3 andCity Charter Section 10.14 (392,024,780) (368,678,423) (408,218,204) (425,463,603) (424,840,914)
Total net debt applicable to limit 93,370,000 94,492,500 88,983,157 90,403,110 107,822,350
Legal debt margin 617,185,846$ 523,860,670$ 614,457,843$ 680,473,503$ 652,274,750$
Total net debt applicable to the limitas a percentage of debt limit 13.14% 15.28% 12.65% 11.73% 14.19%
2010 2011 2012 2013 2014Estimated Market Values
Real Property Value -$ -$ -$ -$ -$ Personal Property Value - - - - -
Estimated Market Values for Debt Limit Computation - - - - -
Debt limit (3 1/3% of assessed value) - - - - -
Taxable Market ValuesReal Property Value 21,160,809,300 19,711,076,800 17,855,295,300 16,748,885,200 16,808,377,700 Personal Property Value 348,817,500 378,983,400 306,810,900 345,717,700 353,557,800
Taxable Market Values for Debt Limit Computation 21,509,626,800 20,090,060,200 18,162,106,200 17,094,602,900 17,161,935,500
Debt limit (3 1/3% of assessed value) 716,987,561 669,668,673 605,403,540 569,820,091 572,064,517
Debt applicable to limitGeneral Obligation Bonds 210,855,000 232,545,000 219,630,001 225,160,000 247,340,000 Limited Tax Bonds 7,855,000 7,855,000 7,855,000 7,855,000 7,755,000 Revenue Bonds 287,286,305 274,621,656 270,903,021 279,325,000 264,180,000 Revenue Notes 27,621,516 24,729,260 29,355,571 25,715,330 55,649,367 Capital Leases 16,453,228 6,427,999 12,835,276 12,622,238 13,285,662 Less: Amount allowable under
MSA 475.53 Subd. 3 andCity Charter Section 10.14 (433,866,176) (440,047,455) (426,462,033) (429,041,992) (423,705,487)
Total net debt applicable to limit 113,204,873 106,131,461 114,116,836 121,635,576 164,504,542
Legal debt margin 603,782,688$ 563,537,212$ 491,286,704$ 448,184,515$ 407,559,975$
Total net debt applicable to the limitas a percentage of debt limit 15.79% 15.85% 18.85% 21.35% 28.76%
Note: The total net debt of the city shall not exceed three and one-third percent (3 1/3%) of the market value of the taxable real and personal property comprisingthe taxable value of the city as determined by the county auditor, in accordance with law. The legal debt margin was calculated based on the estimated marketvalues for years 2002 thru 2005 and based on the taxable market values for year 2006 and thereafter.
Source: Ramsey County Department of Property Records and Revenue
Fiscal Year
Fiscal Year
225

City of Saint Paul, Minnesota Table 16PLEDGED-REVENUE BOND COVERAGE (Page 1 of 11)(All amounts in dollars except for coverage) UnauditedLast Ten Fiscal Years
Sales Payments RevenuesFiscal Tax Investment in Lieu of Bonds Available for State LoanYear Proceeds Earnings Rents Taxes Proceeds Debt Service Principal Interest Repayment Coverage
2005 14,219,562 106,928 3,500,000 2,929,669 - 20,756,159 1,150,000 4,772,768 1,250,000 2.89
2006 14,788,775 202,128 3,500,000 3,303,652 - 21,794,555 1,470,000 4,701,812 1,500,000 2.84
2007 15,664,067 195,923 3,500,000 3,328,836 27,280,000 49,968,826 1,560,000 4,609,791 1,500,000 6.52
2008 14,990,854 185,436 3,500,000 3,355,277 - 22,031,567 1,720,000 6,146,303 1,500,000 2.35
2009 15,270,418 112,686 3,500,000 3,383,040 65,455,000 87,721,144 1,910,000 5,732,583 1,500,000 9.59
2010 15,219,497 110,151 3,500,000 3,762,193 - 22,591,841 2,900,000 4,826,219 1,500,000 2.45
2011 15,620,488 116,388 3,500,000 4,142,802 - 23,379,678 3,065,000 4,502,070 2,000,000 2.44
2012 16,865,712 99,309 3,500,000 4,174,943 - 24,639,964 3,230,000 4,739,286 2,000,000 2.47
2013 17,034,422 106,832 3,500,000 4,208,690 - 24,849,944 3,410,000 4,347,401 2,000,000 2.55
2014 17,389,992 115,277 3,500,000 4,244,125 40,442,845 65,692,238 3,595,000 4,165,615 3,000,000 6.10
Non NetFiscal Operating Operating Operating AvailableYear Revenue Expenses (1) Rev/Exp Transfers (2) Revenue Principal Interest Coverage
2005 41,091,552 (17,887,444) (1,277,473) (555,695) 21,370,940 6,140,000 749,854 3.10
2006 44,464,873 (18,936,475) (1,205,103) (612,150) 23,711,145 6,690,000 818,104 3.16
2007 42,183,402 (23,259,113) (1,004,707) (549,996) 17,369,586 5,745,000 746,616 2.68
2008 43,409,971 (22,619,093) (1,041,194) (709,928) 19,039,756 4,720,000 1,309,892 3.16
2009 46,480,240 (24,674,791) (1,668,600) (976,335) 19,160,514 1,510,000 1,520,167 6.32
2010 46,972,750 (23,544,721) (1,951,833) (1,111,263) 20,364,933 2,055,000 1,943,299 5.09
2011 45,856,581 (28,517,517) (1,211,171) (1,584,524) 14,543,369 2,615,000 2,145,809 3.05
2012 51,185,513 (42,665,456) (2,702,312) (1,595,773) 4,221,972 3,060,000 2,350,655 0.78
2013 48,918,612 (33,268,739) (3,193,718) (1,728,694) 10,727,461 3,940,000 2,412,439 1.69
2014 49,634,845 (37,296,709) (2,326,768) (1,584,916) 8,426,452 3,925,000 2,425,774 1.33
(1) operating expenses do not include depreciation or bond interest expenses(2) transfers do not include capital expenditures and debt service on the outstanding general obligations bonds
Sales Tax Revenue Bonds, Series 2007A, 2007B, 2009, 2014F & 2014GDebt Service
Sewer Revenue Bonds, Series 1998E, 2003D, 2004E, 2006C, 2008D, 2009C, 2009I, 2010D, 2011C, 2012C, 2013D and 2014E
Debt Service
226
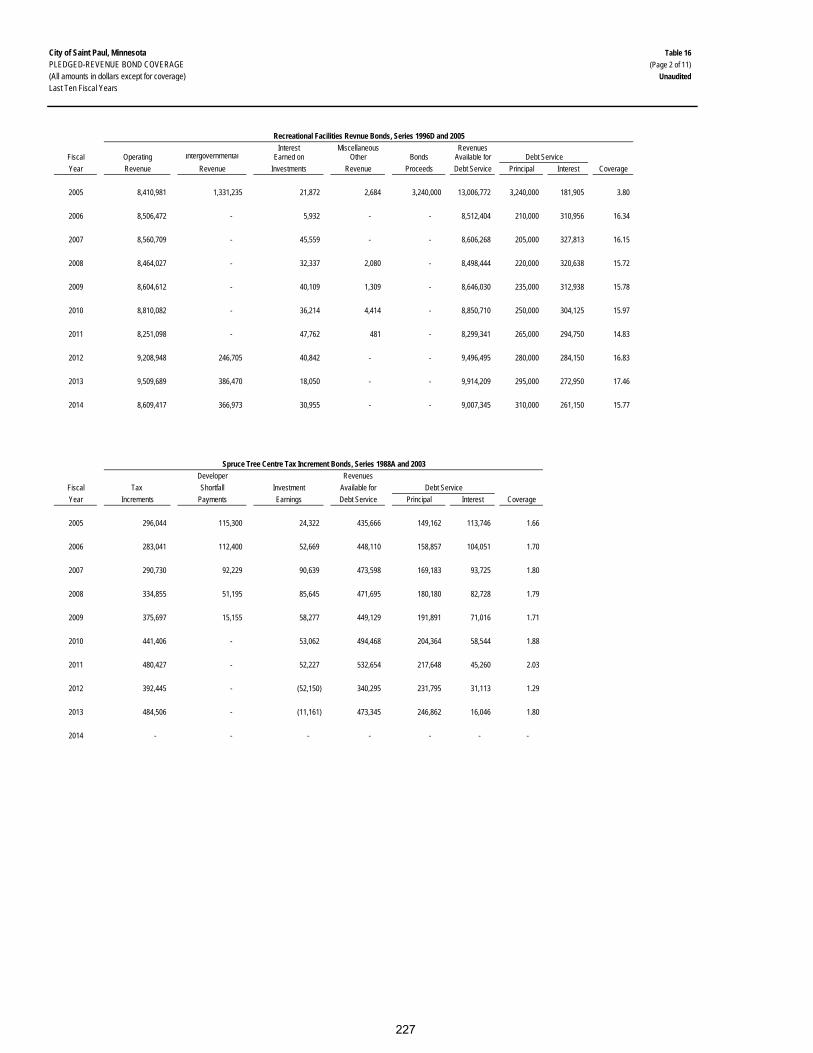
City of Saint Paul, Minnesota Table 16PLEDGED-REVENUE BOND COVERAGE (Page 2 of 11)(All amounts in dollars except for coverage) UnauditedLast Ten Fiscal Years
Interest Miscellaneous RevenuesFiscal Operating Intergovernmental Earned on Other Bonds Available forYear Revenue Revenue Investments Revenue Proceeds Debt Service Principal Interest Coverage
2005 8,410,981 1,331,235 21,872 2,684 3,240,000 13,006,772 3,240,000 181,905 3.80
2006 8,506,472 - 5,932 - - 8,512,404 210,000 310,956 16.34
2007 8,560,709 - 45,559 - - 8,606,268 205,000 327,813 16.15
2008 8,464,027 - 32,337 2,080 - 8,498,444 220,000 320,638 15.72
2009 8,604,612 - 40,109 1,309 - 8,646,030 235,000 312,938 15.78
2010 8,810,082 - 36,214 4,414 - 8,850,710 250,000 304,125 15.97
2011 8,251,098 - 47,762 481 - 8,299,341 265,000 294,750 14.83
2012 9,208,948 246,705 40,842 - - 9,496,495 280,000 284,150 16.83
2013 9,509,689 386,470 18,050 - - 9,914,209 295,000 272,950 17.46
2014 8,609,417 366,973 30,955 - - 9,007,345 310,000 261,150 15.77
Developer RevenuesFiscal Tax Shortfall Investment Available forYear Increments Payments Earnings Debt Service Principal Interest Coverage
2005 296,044 115,300 24,322 435,666 149,162 113,746 1.66
2006 283,041 112,400 52,669 448,110 158,857 104,051 1.70
2007 290,730 92,229 90,639 473,598 169,183 93,725 1.80
2008 334,855 51,195 85,645 471,695 180,180 82,728 1.79
2009 375,697 15,155 58,277 449,129 191,891 71,016 1.71
2010 441,406 - 53,062 494,468 204,364 58,544 1.88
2011 480,427 - 52,227 532,654 217,648 45,260 2.03
2012 392,445 - (52,150) 340,295 231,795 31,113 1.29
2013 484,506 - (11,161) 473,345 246,862 16,046 1.80
2014 - - - - - - -
Debt Service
Spruce Tree Centre Tax Increment Bonds, Series 1988A and 2003
Debt Service
Recreational Facilities Revnue Bonds, Series 1996D and 2005
227
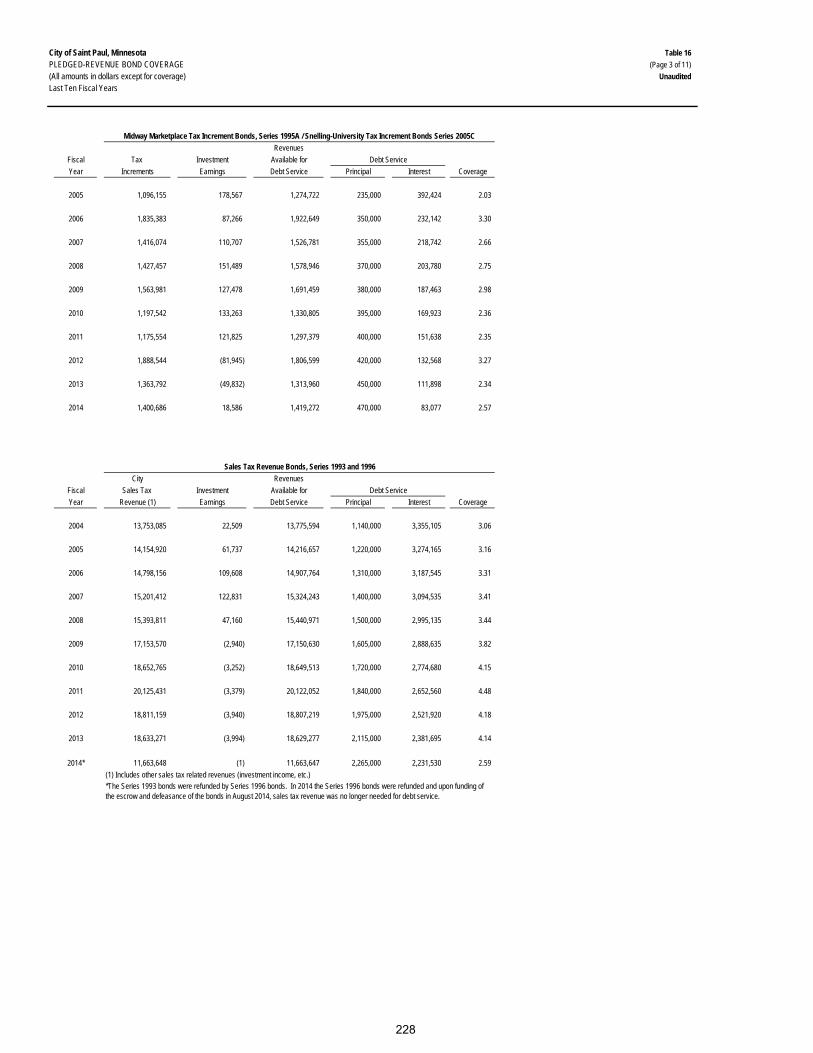
City of Saint Paul, Minnesota Table 16PLEDGED-REVENUE BOND COVERAGE (Page 3 of 11)(All amounts in dollars except for coverage) UnauditedLast Ten Fiscal Years
RevenuesFiscal Tax Investment Available forYear Increments Earnings Debt Service Principal Interest Coverage
2005 1,096,155 178,567 1,274,722 235,000 392,424 2.03
2006 1,835,383 87,266 1,922,649 350,000 232,142 3.30
2007 1,416,074 110,707 1,526,781 355,000 218,742 2.66
2008 1,427,457 151,489 1,578,946 370,000 203,780 2.75
2009 1,563,981 127,478 1,691,459 380,000 187,463 2.98
2010 1,197,542 133,263 1,330,805 395,000 169,923 2.36
2011 1,175,554 121,825 1,297,379 400,000 151,638 2.35
2012 1,888,544 (81,945) 1,806,599 420,000 132,568 3.27
2013 1,363,792 (49,832) 1,313,960 450,000 111,898 2.34
2014 1,400,686 18,586 1,419,272 470,000 83,077 2.57
City RevenuesFiscal Sales Tax Investment Available forYear Revenue (1) Earnings Debt Service Principal Interest Coverage
2004 13,753,085 22,509 13,775,594 1,140,000 3,355,105 3.06
2005 14,154,920 61,737 14,216,657 1,220,000 3,274,165 3.16
2006 14,798,156 109,608 14,907,764 1,310,000 3,187,545 3.31
2007 15,201,412 122,831 15,324,243 1,400,000 3,094,535 3.41
2008 15,393,811 47,160 15,440,971 1,500,000 2,995,135 3.44
2009 17,153,570 (2,940) 17,150,630 1,605,000 2,888,635 3.82
2010 18,652,765 (3,252) 18,649,513 1,720,000 2,774,680 4.15
2011 20,125,431 (3,379) 20,122,052 1,840,000 2,652,560 4.48
2012 18,811,159 (3,940) 18,807,219 1,975,000 2,521,920 4.18
2013 18,633,271 (3,994) 18,629,277 2,115,000 2,381,695 4.14
2014* 11,663,648 (1) 11,663,647 2,265,000 2,231,530 2.59 (1) Includes other sales tax related revenues (investment income, etc.)
Sales Tax Revenue Bonds, Series 1993 and 1996
Debt Service
*The Series 1993 bonds were refunded by Series 1996 bonds. In 2014 the Series 1996 bonds were refunded and upon funding of the escrow and defeasance of the bonds in August 2014, sales tax revenue was no longer needed for debt service.
Midway Marketplace Tax Increment Bonds, Series 1995A / Snelling-University Tax Increment Bonds Series 2005C
Debt Service
228

City of Saint Paul, Minnesota Table 16PLEDGED-REVENUE BOND COVERAGE (Page 4 of 11)(All amounts in dollars except for coverage) UnauditedLast Ten Fiscal Years
RevenuesFiscal Tax Hotel-Motel RiverCentre N.O.C. Loan Investment Available forYear Increments Taxes Revenues Sales Repayment Earnings Debt Service Principal Interest Coverage
2004 5,539,108 220,000 100,000 - - 82,602 5,941,710 2,275,000 797,635 1.93
2005 3,807,158 220,000 100,000 - 273,047 60,326 4,460,531 2,285,000 657,314 1.52
2006 4,276,947 220,000 100,000 - 2,026,344 105,094 6,728,385 2,355,000 512,803 2.35
2007 5,309,827 220,000 100,000 12,871 - 292,631 5,935,329 2,400,000 363,052 2.15
2008 3,189,751 - 200,000 - - 148,288 3,538,039 3,830,000 223,775 0.87
Lease RevenuesFiscal Payments from Investment Available forYear the City Earnings Debt Service Principal Interest Coverage
2005 415,000 40,630 455,630 50,000 406,150 1.00
2006 657,928 36,129 694,057 300,000 396,363 1.00
2007 758,559 11,728 770,287 425,000 375,956 0.96
2008 835,943 5,022 840,965 525,000 348,988 0.96
2009 1,098,963 27,744 1,126,707 650,000 290,673 1.20
2010 580,367 19,761 600,128 360,000 240,800 1.00
2011 586,422 19,596 606,018 370,000 229,850 1.01
2012 607,712 20,075 627,787 380,000 218,600 1.05
2013 604,005 20,820 624,825 390,000 207,050 1.05
2014 586,204 22,536 608,740 405,000 195,125 1.01
Debt Service
RiverCentre Parking Facility Lease Revenue Bonds, Series 2000 and 2009
Debt Service
Downtown Tax Increment Bonds, Series 1993 and 1998
229

City of Saint Paul, Minnesota Table 16PLEDGED-REVENUE BOND COVERAGE (Page 5 of 11)(All amounts in dollars except for coverage) UnauditedLast Ten Fiscal Years
Tax Increment Transfer RevenuesFiscal Tax Pooling from from Capital Investment Available forYear Increments Other Districts Projects Funds Earnings Debt Service Principal Interest Coverage
2005 768,344 571,150 2,798 161 1,342,453 865,000 395,347 1.07
2006 775,838 576,714 1,399 7,096 1,361,047 925,000 354,335 1.06
2007 794,927 520,420 - 11,242 1,326,589 970,000 309,934 1.04
2008 979,997 368,455 - 1,890 1,350,342 1,035,000 262,028 1.04
2009 1,035,466 319,165 - (4,216) 1,350,415 1,095,000 210,591 1.03
2010 1,067,737 214,049 - (368) 1,281,418 1,150,000 155,899 0.98
2011 (223,653) 702,798 - (14,128) 465,017 1,215,000 97,255 0.35
2012 986,088 296,000 - (19,360) 1,262,728 1,295,000 33,366 0.95
2013 - - - - - - - -
2014 - - - - - - - -
RevenuesFiscal Tax Investment Available forYear Increments Earnings Debt Service Principal Interest Coverage
2005 879,169 16,281 895,450 125,000 754,169 1.02
2006 1,034,905 44,179 1,079,084 335,000 742,877 1.00
2007 993,054 42,039 1,035,093 275,000 726,606 1.03
2008 1,175,602 15,594 1,191,196 285,000 712,106 1.19
2009 1,223,585 10,052 1,233,637 335,000 696,789 1.20
2010 1,388,596 16,670 1,405,266 410,000 677,692 1.29
2011 1,497,416 19,255 1,516,671 400,000 677,870 1.41
2012 1,511,315 (26,204) 1,485,111 745,000 335,182 1.37
2013 1,511,314 (3,845) 1,507,469 755,000 333,844 1.38
2014 1,511,316 13,359 1,524,675 770,000 318,744 1.40
Debt Service
Debt Service
US Bank Tax Increment Bonds, Series 2001
RiverFront Tax Increment Bonds, Series 1993C, 1993D, 2000D and 2002C
230

City of Saint Paul, Minnesota Table 16PLEDGED-REVENUE BOND COVERAGE (Page 6 of 11)(All amounts in dollars except for coverage) UnauditedLast Ten Fiscal Years
Bond RevenuesFiscal Tax Proceeds Investment Available forYear Increments Capitalized Interest Earnings Debt Service Principal Interest Coverage
2005 213,655 - 742 214,397 17,000 234,478 0.85
2006 430,148 - 1,047 431,195 42,000 294,779 1.28
2007 345,683 - 2,679 348,362 84,000 240,806 1.07
2008 204,589 - 2,989 207,578 87,000 224,558 0.67
2009 189,048 - 143 189,191 53,000 240,079 0.65
2010 190,930 - (956) 189,974 38,000 225,002 0.72
2011 197,439 - 1,590 199,029 41,000 222,939 0.75
2012 175,610 - 3,049 178,659 116,000 218,594 0.53
2013 275,240 - (2,931) 272,309 61,000 211,719 1.00
2014 260,720 - 1,222 261,942 52,000 207,646 1.01
Developer RevenuesFiscal Tax Shortfall Investment Available forYear Increments Payments Earnings Debt Service Principal Interest Coverage
2005 201,311 - 126,908 328,219 - 1,321,100 0.25
2006 600,473 498,044 200,503 1,299,020 - 1,321,100 0.98
2007 1,049,372 696,192 112,409 1,857,973 - 1,321,100 1.41
2008 1,281,447 687,476 73,086 2,042,009 267,000 1,311,999 1.29
2009 1,609,155 517,590 38,818 2,165,563 389,000 1,289,644 1.29
2010 1,769,019 261,324 21,728 2,052,071 415,000 1,262,249 1.22
2011 1,952,421 130,176 32,681 2,115,278 444,000 1,232,981 1.26
2012 1,906,253 156,464 4,950 2,067,667 474,000 1,563,948 1.01
2013 1,915,100 - (234,242) 1,680,858 - 550,457 3.05
2014 1,961,196 - 233,211 2,194,407 825,000 776,000 1.37
Debt Service
Upper Landing Tax Increment Bonds, Series 2002A, 2002B and 2002C
Debt Service
North Quadrant Tax Increment Bonds Series 2000 and 9th street Tax Incrment Bonds, Series 2004
231
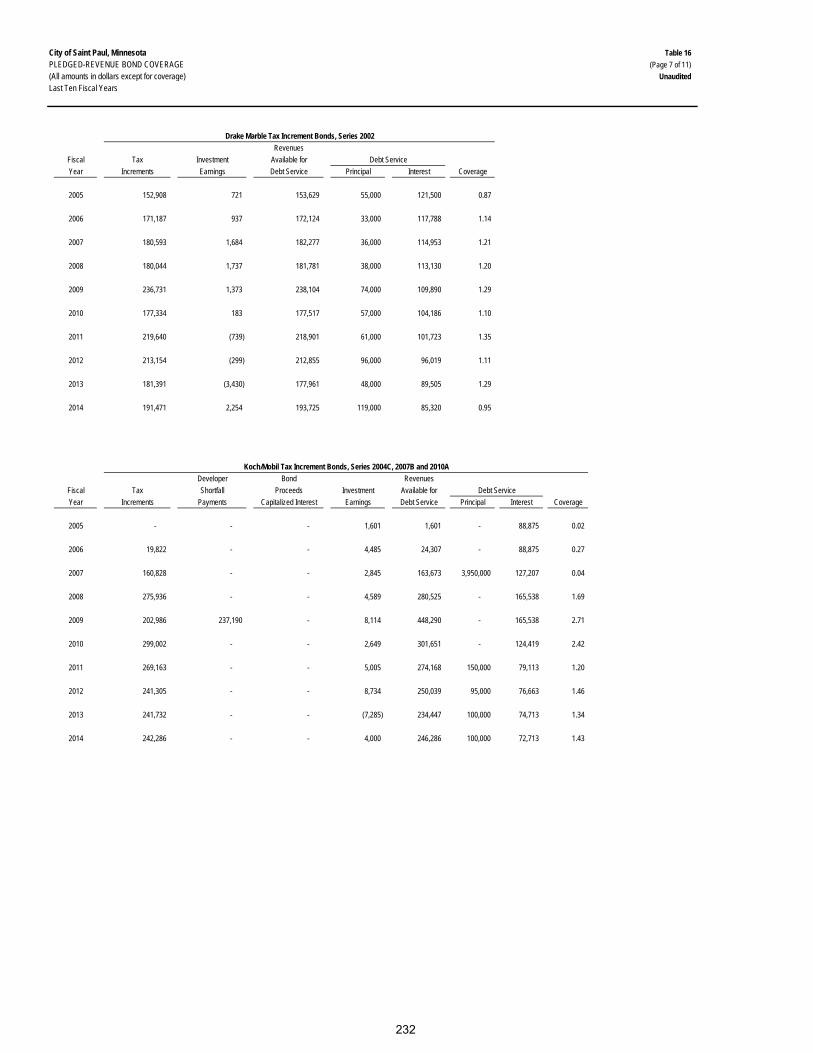
City of Saint Paul, Minnesota Table 16PLEDGED-REVENUE BOND COVERAGE (Page 7 of 11)(All amounts in dollars except for coverage) UnauditedLast Ten Fiscal Years
RevenuesFiscal Tax Investment Available forYear Increments Earnings Debt Service Principal Interest Coverage
2005 152,908 721 153,629 55,000 121,500 0.87
2006 171,187 937 172,124 33,000 117,788 1.14
2007 180,593 1,684 182,277 36,000 114,953 1.21
2008 180,044 1,737 181,781 38,000 113,130 1.20
2009 236,731 1,373 238,104 74,000 109,890 1.29
2010 177,334 183 177,517 57,000 104,186 1.10
2011 219,640 (739) 218,901 61,000 101,723 1.35
2012 213,154 (299) 212,855 96,000 96,019 1.11
2013 181,391 (3,430) 177,961 48,000 89,505 1.29
2014 191,471 2,254 193,725 119,000 85,320 0.95
Developer Bond RevenuesFiscal Tax Shortfall Proceeds Investment Available forYear Increments Payments Capitalized Interest Earnings Debt Service Principal Interest Coverage
2005 - - - 1,601 1,601 - 88,875 0.02
2006 19,822 - - 4,485 24,307 - 88,875 0.27
2007 160,828 - - 2,845 163,673 3,950,000 127,207 0.04
2008 275,936 - - 4,589 280,525 - 165,538 1.69
2009 202,986 237,190 - 8,114 448,290 - 165,538 2.71
2010 299,002 - - 2,649 301,651 - 124,419 2.42
2011 269,163 - - 5,005 274,168 150,000 79,113 1.20
2012 241,305 - - 8,734 250,039 95,000 76,663 1.46
2013 241,732 - - (7,285) 234,447 100,000 74,713 1.34
2014 242,286 - - 4,000 246,286 100,000 72,713 1.43
Koch/Mobil Tax Increment Bonds, Series 2004C, 2007B and 2010A
Debt Service
Drake Marble Tax Increment Bonds, Series 2002
Debt Service
232

City of Saint Paul, Minnesota Table 16PLEDGED-REVENUE BOND COVERAGE (Page 8 of 11)(All amounts in dollars except for coverage) UnauditedLast Ten Fiscal Years
Bond Trustee RevenuesFiscal Tax Proceeds Reserve Investment Available forYear Increments Capitalized Interest Funds Earnings Debt Service Principal Interest Coverage
2005 259,004 - - 1,278 260,282 - 172,198 1.51
2006 261,006 - - 5,375 266,381 - 228,750 1.16
2007 200,351 - - 18,680 219,031 18,000 228,750 0.89
2008 281,183 - - (11,069) 270,114 40,000 227,063 1.01
2009 290,744 - - 1,140 291,884 54,000 224,406 1.05
2010 308,946 - - 373 309,319 69,000 220,750 1.07
2011 303,555 - - 403 303,958 81,000 216,250 1.02
2012 284,913 - - 2,022 286,935 94,000 211,000 0.94
2013 277,029 - - (3,308) 273,721 108,000 204,906 0.87
2014 284,200 - 3,205 3,100 290,505 124,000 197,906 0.90
Bond RevenuesFiscal Tax Proceeds Investment Available forYear Increments Capitalized Interest Earnings Debt Service Principal Interest Coverage
2005 1,061,105 751,500 19,750 1,832,355 295,000 128,259 4.33
2006 1,554,684 - 33,180 1,587,864 495,000 357,478 1.86
2007 1,869,289 - 123,020 1,992,309 485,000 336,702 2.42
2008 2,170,482 - 139,301 2,309,783 480,000 314,761 2.91
2009 2,352,017 - 166,523 2,518,540 485,000 292,700 3.24
2010 2,252,256 - 189,872 2,442,128 510,000 269,762 3.13
2011 2,044,411 - 191,976 2,236,387 535,000 244,612 2.87
2012 1,974,102 - (152,884) 1,821,218 565,000 217,854 2.33
2013 1,811,777 - (66,738) 1,745,039 585,000 188,556 2.26
2014 1,707,814 - 21,312 1,729,126 620,000 157,858 2.22
Neighborhood Scattered Site Tax Increment Bonds, Series 2005
Debt Service
Debt Service
JJ Hill Tax Increment Bonds, Series 2004
233

City of Saint Paul, Minnesota Table 16PLEDGED-REVENUE BOND COVERAGE (Page 9 of 11)(All amounts in dollars except for coverage) UnauditedLast Ten Fiscal Years
Lease RevenuesFiscal Payments from Investment Available forYear the City Earnings Debt Service Principal Interest Coverage
2008 222,980 72,671 295,651 75,000 146,188 1.34
2009 538,560 (7,622) 530,938 190,000 348,600 0.99
2010 521,579 69,224 590,803 195,000 342,900 1.10
2011 529,575 24,500 554,075 205,000 336,075 1.02
2012 507,199 23,865 531,064 210,000 328,388 0.99
2013 513,972 (5,480) 508,492 220,000 319,988 0.94
2014 534,538 10,572 545,110 225,000 311,188 1.02
RevenuesFiscal Tax Investment Available forYear Increments Earnings Debt Service Principal Interest Coverage
2011 610,362 40,194 650,556 40,000 448,342 1.33
2012 730,938 5,571 736,509 290,000 388,431 1.09
2013 666,507 31 666,538 225,000 374,581 1.11
2014 650,750 3,684 654,434 240,000 362,469 1.09
Bond Use of RevenuesFiscal Land Proceeds Investment Bond Reserve Available forYear Sales Capitalized Interest Earnings Account Debt Service Principal Interest Coverage
2005 3,779,663 - 641,722 - 4,421,385 3,170,000 764,656 1.12
2006 2,308,000 - 874,360 3,555,284 6,737,644 9,375,000 777,522 0.66
2007 - - 741,206 - 741,206 3,320,000 569,468 0.19
2008 - - 314,168 - 314,168 2,695,000 291,500 0.11
2009 - - 5,594 - 5,594 3,930,000 50,782 0.00
2010 - - 24,642 - 24,642 2,510,000 1,681 0.01
2011 1,404,760 - 2,033 - 1,406,793 - - N/A
2012 - - (4,057) - (4,057) - - N/A
2013 - - - - - - - -
2014 - - - - - - - -
Debt Service
Jimmy Lee Recreation Facility Lease Bonds, Series 2008
Debt Service
Emerald Gardens Tax Increment Bonds, Series 2010
Debt Service
Housing 5000 Land Assembly Bonds, Series 2004
234

City of Saint Paul, Minnesota Table 16PLEDGED-REVENUE BOND COVERAGE (Page 10 of 11)(All amounts in dollars except for coverage) UnauditedLast Ten Fiscal Years
Parking Parking Meter Bond RevenuesFiscal Facility Net & Parking Fine Proceeds Available forYear Revenue Revenues Capitalized Interest Debt Service Principal Interest Coverage
2005 2,931,998 2,000,000 67,517 4,999,515 1,015,000 1,496,125 1.99
2006 3,022,153 2,000,000 - 5,022,153 1,135,000 1,467,282 1.93
2007 3,246,417 2,000,000 - 5,246,417 1,290,000 1,429,882 1.93
2008 3,124,631 2,000,000 - 5,124,631 1,590,000 1,384,918 1.72
2009 3,084,230 2,000,000 - 5,084,230 1,655,000 1,324,097 1.71
2010 3,043,611 2,000,000 - 5,043,611 1,790,000 1,307,828 1.63
2011 3,492,539 3,000,000 - 6,492,539 565,000 1,087,242 3.93
2012 3,794,576 3,000,000 - 6,794,576 615,000 1,038,056 4.11
2013 3,895,149 3,000,000 - 6,895,149 635,000 1,002,953 4.21
2014 3,326,529 2,491,647 58,694 5,876,870 655,000 1,000,556 3.55
Ramp RevenuesFiscal Lease Investment Available forYear Revenues Earnings Debt Service Principal Interest Coverage
2005 1,080,048 6,474 1,086,522 460,000 606,629 1.02
2006 1,058,040 16,412 1,074,452 490,000 582,863 1.00
2007 1,078,813 13,655 1,092,468 525,000 549,788 1.02
2008 1,078,142 (1,480) 1,076,662 560,000 514,350 1.00
2009 1,075,562 (3,993) 1,071,569 595,000 476,550 1.00
2010 1,075,591 (4,018) 1,071,573 635,000 436,388 1.00
2011 1,077,475 (4,023) 1,073,452 680,000 393,525 1.00
2012 1,076,739 (3,884) 1,072,855 725,000 347,625 1.00
2013 1,077,520 (4,024) 1,073,496 775,000 294,328 1.00
2014 1,038,283 6,457 1,044,740 825,000 241,735 0.98
Parking Revenue Bonds, Series 1992A, 1995A, 1995B, 2001A, 2002A, 2002B, 2005A and 2010A
Debt Service
Parking Revenue Bonds, Series 1997A
Debt Service
235
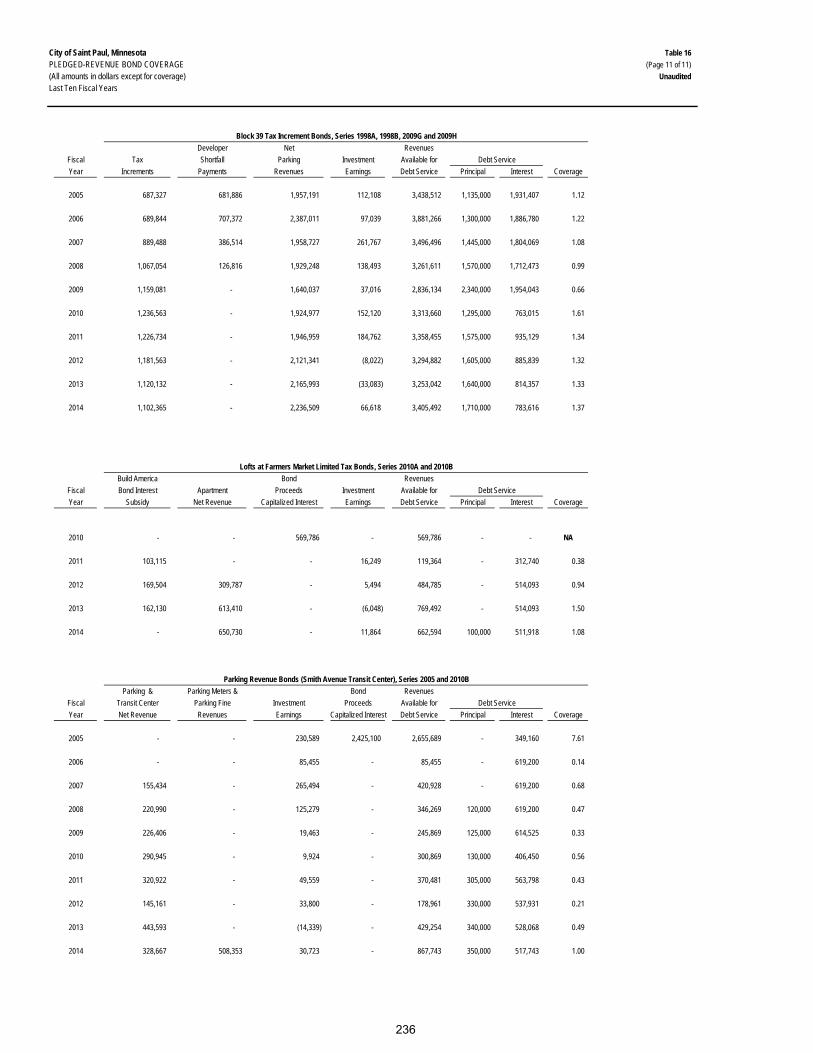
City of Saint Paul, Minnesota Table 16PLEDGED-REVENUE BOND COVERAGE (Page 11 of 11)(All amounts in dollars except for coverage) UnauditedLast Ten Fiscal Years
Developer Net RevenuesFiscal Tax Shortfall Parking Investment Available forYear Increments Payments Revenues Earnings Debt Service Principal Interest Coverage
2005 687,327 681,886 1,957,191 112,108 3,438,512 1,135,000 1,931,407 1.12
2006 689,844 707,372 2,387,011 97,039 3,881,266 1,300,000 1,886,780 1.22
2007 889,488 386,514 1,958,727 261,767 3,496,496 1,445,000 1,804,069 1.08
2008 1,067,054 126,816 1,929,248 138,493 3,261,611 1,570,000 1,712,473 0.99
2009 1,159,081 - 1,640,037 37,016 2,836,134 2,340,000 1,954,043 0.66
2010 1,236,563 - 1,924,977 152,120 3,313,660 1,295,000 763,015 1.61
2011 1,226,734 - 1,946,959 184,762 3,358,455 1,575,000 935,129 1.34
2012 1,181,563 - 2,121,341 (8,022) 3,294,882 1,605,000 885,839 1.32
2013 1,120,132 - 2,165,993 (33,083) 3,253,042 1,640,000 814,357 1.33
2014 1,102,365 - 2,236,509 66,618 3,405,492 1,710,000 783,616 1.37
Build America Bond RevenuesFiscal Bond Interest Apartment Proceeds Investment Available forYear Subsidy Net Revenue Capitalized Interest Earnings Debt Service Principal Interest Coverage
2010 - - 569,786 - 569,786 - - NA
2011 103,115 - - 16,249 119,364 - 312,740 0.38
2012 169,504 309,787 - 5,494 484,785 - 514,093 0.94
2013 162,130 613,410 - (6,048) 769,492 - 514,093 1.50
2014 - 650,730 - 11,864 662,594 100,000 511,918 1.08
Parking & Parking Meters & Bond RevenuesFiscal Transit Center Parking Fine Investment Proceeds Available forYear Net Revenue Revenues Earnings Capitalized Interest Debt Service Principal Interest Coverage
2005 - - 230,589 2,425,100 2,655,689 - 349,160 7.61
2006 - - 85,455 - 85,455 - 619,200 0.14
2007 155,434 - 265,494 - 420,928 - 619,200 0.68
2008 220,990 - 125,279 - 346,269 120,000 619,200 0.47
2009 226,406 - 19,463 - 245,869 125,000 614,525 0.33
2010 290,945 - 9,924 - 300,869 130,000 406,450 0.56
2011 320,922 - 49,559 - 370,481 305,000 563,798 0.43
2012 145,161 - 33,800 - 178,961 330,000 537,931 0.21
2013 443,593 - (14,339) - 429,254 340,000 528,068 0.49
2014 328,667 508,353 30,723 - 867,743 350,000 517,743 1.00
Debt Service
Lofts at Farmers Market Limited Tax Bonds, Series 2010A and 2010B
Debt Service
Block 39 Tax Increment Bonds, Series 1998A, 1998B, 2009G and 2009H
Debt Service
Parking Revenue Bonds (Smith Avenue Transit Center), Series 2005 and 2010B
236

City of Saint Paul, Minnesota Table 17(Page 1 of 1)
Last Ten Fiscal Years Unaudited
Per CapitaFiscal Personal Personal Labor UnemploymentYear Population (1) Income (2) Income (3) Force (4) Rate (4)
2005 287,385 23,541 6,157,265,700 149,832 4.4%2006 286,620 23,675 6,444,728,300 146,616 4.1%2007 287,669 24,934 6,639,009,400 144,446 4.6%2008 288,055 27,120 7,294,251,800 144,618 5.5%2009 287,501 24,702 6,947,235,100 145,773 8.1%2010 285,068 25,066 7,145,514,488 146,389 7.3%2011 286,367 25,576 7,106,711,800 145,003 7.1%2012 289,270 25,072 7,165,005,800 147,362 6.2%2013 294,873 25,695 7,636,250,500 147,039 5.3%2014 297,640 25,695 7,636,250,500 152,277 4.1%
Sources:(1) 2005-2009 & 2011-2013 data is based on Metropolitan Council estimates. 2010 data is based on U.S. Census Bureau results. 2014 data is based on U.S. Census Bureau.(2) 2005-2013 data provided by U.S. Census Bureau's Annual American Community Survey. 2014 data is not yet available.(3) Personal Income data for the City is no longer available, for 2010-2013 this column is now the Aggregatehousehold income Data provided by U.S. Census Bureau's Annual American Community Survey.2014 data is not yet available. (4) Annual average - not seasonally adjusted. Data provided by Minnesota Department of Employment andEconomic Development (DEED)
DEMOGRAPHIC AND ECONOMIC STATISTICS
237

City of Saint Paul, Minnesota Table 18PRINCIPAL EMPLOYERS (Page 1 of 1)Current Year and Eight Years Ago Unaudited
Percentage Percentage Number of of Total Number of of Total
Employers Employees Rank City Employment Employees Rank City Employment
University of Minnesota 1)18,000 1 10.17%
State of Minnesota 1)15,427 2 8.72% 13,671 1 7.54%
3M Company 10,500 3 5.93%
Saint Paul Public Schools 6,101 4 3.45% 6,567 2 3.62%
Ramsey County 1)4,378 5 2.47% 3,770 7 2.08%
Health East 4,317 6 2.44% 5,080 3 2.80%
Regions Hospital 3,740 7 2.11% 4,000 6 2.21%
United Hospital 2,924 8 1.65% 3,300 9 1.82%
City of Saint Paul 1)2,822 9 1.59% 3,400 8 1.88%
Securian Financial Group 2,532 10 1.43%
U.S. Bancorp 4,700 4 2.59%
Marsden Building Maintenance 4,000 5 2.21%
U.S. Postal Service 3,200 10 1.77%
Total 70,741 39.96% 51,688 28.52%
1) Includes full- and part-time employees.
Data from nine years ago is not available. The Government Finance Officers Association (GFOA) recommends presenting data from the earliest year available, 2006.Sources: MN Department of Employment and Economic Development for 2006 data; 2014 data compliled by Springsted Inc. based on telephone survey.
20062014
238

City of Saint Paul, Minnesota Table 19FULL-TIME-EQUIVALENT CITY GOVERNMENT EMPLOYEES BY FUNCTION/PROGRAM (Page 1 of 1)Last Ten Fiscal Years Unaudited
2005 2006 2007 2008 2009 2010 2011 2012 2013 2014
GENERAL GOVERNMENT Citizen Services (1) (6) 7.0 2.0 - - - - - - - - City Attorney 66.4 64.8 66.1 68.3 66.0 63.4 63.1 67.7 66.0 66.0 City Council 26.7 25.4 26.7 29.3 35.1 29.5 29.3 36.6 33.0 24.0 Financial Services (4) (5) 44.7 44.3 46.4 45.0 44.0 44.5 43.5 50.9 49.0 40.0 Human Resources 33.1 32.2 28.5 30.8 31.8 30.7 30.1 37.4 40.0 37.0 Human Rights and Equal Economic Opportunity (4) 7.5 6.9 8.9 9.4 34.0 34.3 30.5 44.0 30.0 28.0 Mayor's Administration 18.6 19.8 19.0 22.0 19.0 16.1 17.0 19.0 16.0 15.0 Office of Technology 73.7 75.6 79.6 82.4 81.8 77.3 76.8 82.0 72.0 70.0
PUBLIC SAFETY Fire Firefighters and Officers 412.0 396.0 383.0 421.0 411.0 417.6 433.0 415.0 421.0 405.0 Civilians 57.4 56.4 56.3 42.7 64.0 41.8 39.0 71.3 53.0 51.0 Police Officers 557.7 552.5 555.0 595.7 584.0 583.3 609.0 586.0 578.0 566.0 Civilians 187.9 172.7 225.6 183.7 232.4 182.9 172.0 235.0 163.0 201.0
Safety and Inspections (2) - - 160.90 163.6 148.2 136.2 127.6 146.8 131.0 128.0 License, Inspection and Environmental Protection (2) 105.7 105.8 0.0 - - - - - - - Neighborhood Housing and Property Improvement (2) 32.7 32.3 0.0 - - - - - - - Health 55.0 53.6 48.4 45.2 46.0 40.1 39.7 42.0 42.0 40.0
HIGHWAYS AND STREETS Public Works (5) 357.8 343.5 352.7 352.8 373.3 347.3 361.7 408.1 411.0 329.0
CULTURE AND RECREATION Libraries 174.5 174.0 176.6 180.5 230.6 164.1 162.8 215.0 209.0 197.0 Parks 502.8 432.0 461.2 478.8 778.9 432.2 549.2 1,771.8 481.0 380.0
HOUSING AND ECONOMIC DEVELOPMENT 81.6 79.8 75.1 81.9 84.0 69.1 67.3 82.2 73.0 65.0
TOTAL 2,802.8 2,669.6 2,770.0 2,833.1 3,264.1 2,710.4 2,851.6 4,310.8 2,868.0 2,642.0
(1) Citizen Services' Information and Complaint employees were moved to Neighborhood Housing and Property (5) Real Estate moved from Public Works to Financial Services in 2009. Improvement in 2006.
(6) In 2007 the Charter was changed moving the City Clerk to the City Council.(2) License, Inspection and Environmental Protection; Neighborhood Housing and Property Improvement; and
Fire Prevention Inspectors were merged in a new Department of Safety and Inspections in 2007.Source: Office of Financial Services Payroll Department, City of St. Paul
(3) RiverCentre was merged with the Convention and Visitor's Bureau and became a discretely presented component unit in 2005.
(4) Contract Services and Human Rights merged into new department Human Rights and Equal Economic Opportunity in 2009. Contract Services was previously reported in Financial Services.
Fiscal Year Fiscal Year
239

City of Saint Paul, Minnesota Table 20OPERATING INDICATORS BY FUNCTION/PROGRAM (Page 1 of 1)Last Ten Fiscal Years Unaudited
Function/Program 2005 2006 2007 2008 2009
PoliceNumber of Calls for Service 216,247 212,161 213,593 220,129 223,645
FireNumber of Structure Fires 708 716 681 799 886 Number of EMS Incidents 28,159 24,457 26,831 27,064 24,977
Department of Safety and Inspections (1)Number of Building Permits Issued 8,905 8,818 8,802 8,498 8,138 Valuation of Building Permits Issued $479,840,220 $555,104,063 $530,995,699 $335,663,606 $330,135,432
Public WorksMiles of Streets Reconstructed 8.1 15.2 7.7 9.4 8.2Number of Snow Emergencies 4 2 6 1 5
Parks and RecreationPicnic Permits Issued 1,612 1,656 1,800 1,900 2,000 Number of Golf Rounds Played 142,381 132,400 124,661 123,093 122,315
LibrariesCirculation 3,319,113 3,394,664 3,365,469 3,321,165 3,442,777 Number of Titles in Collection 435,395 450,137 458,389 463,876 454,032
Economic DevelopmentNew and Substantially Rehabilitated Housing Units 1,130 428 355 10 100
Function/Program 2010 2011 2012 2013 2014
PoliceNumber of Calls for Service 219,049 240,390 272,624 243,598 236,506
FireNumber of Structure Fires 799 794 826 796 819 Number of EMS Incidents 24,707 26,437 27,878 29,578 30,731
Department of Safety and Inspections (1)Number of Building Permits Issued 9,887 11,649 8,582 7,738 7,950 Valuation of Building Permits Issued $366,589,782 $521,098,690 $474,073,321 $453,448,341 $717,883,411
Public WorksMiles of Streets Reconstructed 8.2 7.4 7.1 5.8 8.6Number of Snow Emergencies 7 3 2 6 6
Parks and RecreationPicnic Permits Issued 2,060 2,093 2,167 1,502 1,490 Number of Golf Rounds Played 117,304 105,676 112,862 97,877 46,336
LibrariesCirculation 3,153,093 2,958,656 2,866,183 2,840,868 2,608,100 Number of Titles in Collection 458,800 464,750 481,175 481,086 489,078
Economic Development*New and Substantially Rehabilitated Housing Units 96 100 106 99 774
Source: Various City departments.
*The 2014 Rehabilitated housing number increased due to the large amount of multi-family housing projects
Fiscal Year
Fiscal Year
Note: License, Inspection and Environmental Protection; and Neighborhood Housing and Property Improvement were merged to form the new Department of Safety and Inspections in 2007.
240

City of Saint Paul, Minnesota Table 21CAPITAL ASSET STATISTICS BY FUNCTION/PROGRAM (Page 1 of 1)Last Ten Fiscal Years Unaudited
2005 2006 2007 2008 2009 2010 2011 2012 2013 2014Function/Program
PoliceNumber of Stations 14 14 14 13 13 13 10 10 10 10 Number of Vehicles 365 481 482 580 540 520 518 500 495 500
FireNumber of Stations 16 16 16 16 16 15 15 15 15 15 Number of Vehicles 105 110 108 105 106 98 102 102 102 105
Public WorksMiles of Sanitary Sewers 806 806 806 806 806 806 806 806 806 806 Miles of Sidewalks 1,007 1,007 1,007 1,011 1,011 1,011 1,011 1,011 1,013 1,013 Miles of Storm Sewers 450 450 450 450 450 450 450 450 450 450 Miles of Streets 847 863 863 863 863 863 863 863 871 865 Number of Alleys 2,311 2,311 2,311 2,311 2,311 2,311 2,311 2,311 2,311 2,311 Number of Bridges 60 60 61 60 60 60 57 57 56 57 Number of Street Lights 32,619 31,444 31,716 31,696 31,740 31,856 31,698 31,882 32,531 32,852
Parks and RecreationAcreage of Parks 4,274 4,285 4,287 4,288 4,288 4,306 4,306 4,306 5,580 4,722 Number of Golf Courses 4 4 4 4 4 4 4 4 4 4 Number of Municipal Stadiums 1 1 1 1 1 1 1 1 1 1 Number of Parks 168 169 171 173 173 173 173 173 179 179 Number of Recreation Centers 41 41 33 33 33 25 25 25 24 26 Number of Tennis Courts 92 92 92 92 90 83 77 77 77 79 Number of Zoos & Conservatories 1 1 1 1 1 1 1 1 1 1
LibrariesNumber of Libraries 13 13 13 13 13 13 13 13 13 13 Number of Bookmobiles 1 1 1 1 1 1 1 1 1 1
Economic DevelopmentNumber of Parking Facilities 20 20 20 17 17 17 17 17 17 18 Number of Skyways 37 37 37 37 37 37 37 37 37 37
Fiscal Year
241

This page left blank intentionally
242
City of Saint Paul 2014 Comprehensive Annual Financial Report
CAFR Production
Office of Financial Services
Joy Thao, Director of Accounting and Business Support Joy Thao, Citywide Accounting Manager (Interim) Kevin Mannetter, Senior Accountant (CAFR Lead)
Senior Accountants
Louis Biagi Chito Jovellana
Dolly Lee Eric Willems
Accountants Michelle Pham
Melissa Swennson
Special thanks to Marissa Peterson and Daley Lehmann in the Budget Department and Michael Solomon in the Treasury Department!
Citywide Accountants & Accounting Technicians
Economic Development
Rhonda Gillquist Michael Marmsoler
Mayka Yang
Fire Jill LaCasse
Brenda Ullrich
Library Susan Cantu
Parks and Recreation
Dave Meissner Calvin Wheeler
Police
Renee Manning Wendy Trebesch
Public Works
Jeff Bots Loree Brown Leah Hunt
Larry Michalitsch Jodi Schwartz Julia Sobania
Chia Vue
Safety and Inspection Vicki Plaistow
Water
Connie Garrahy Ruth O’Brien
243

This page left blank intentionally
244